
Validity of a User-Friendly Spreadsheet Designed for an In-Depth Analysis of Countermovement Bipodal Jumps

 ,
,  , , and
Abstract
1. Introduction
2. Materials and Methods
2.1. Sample
2.2. Instruments
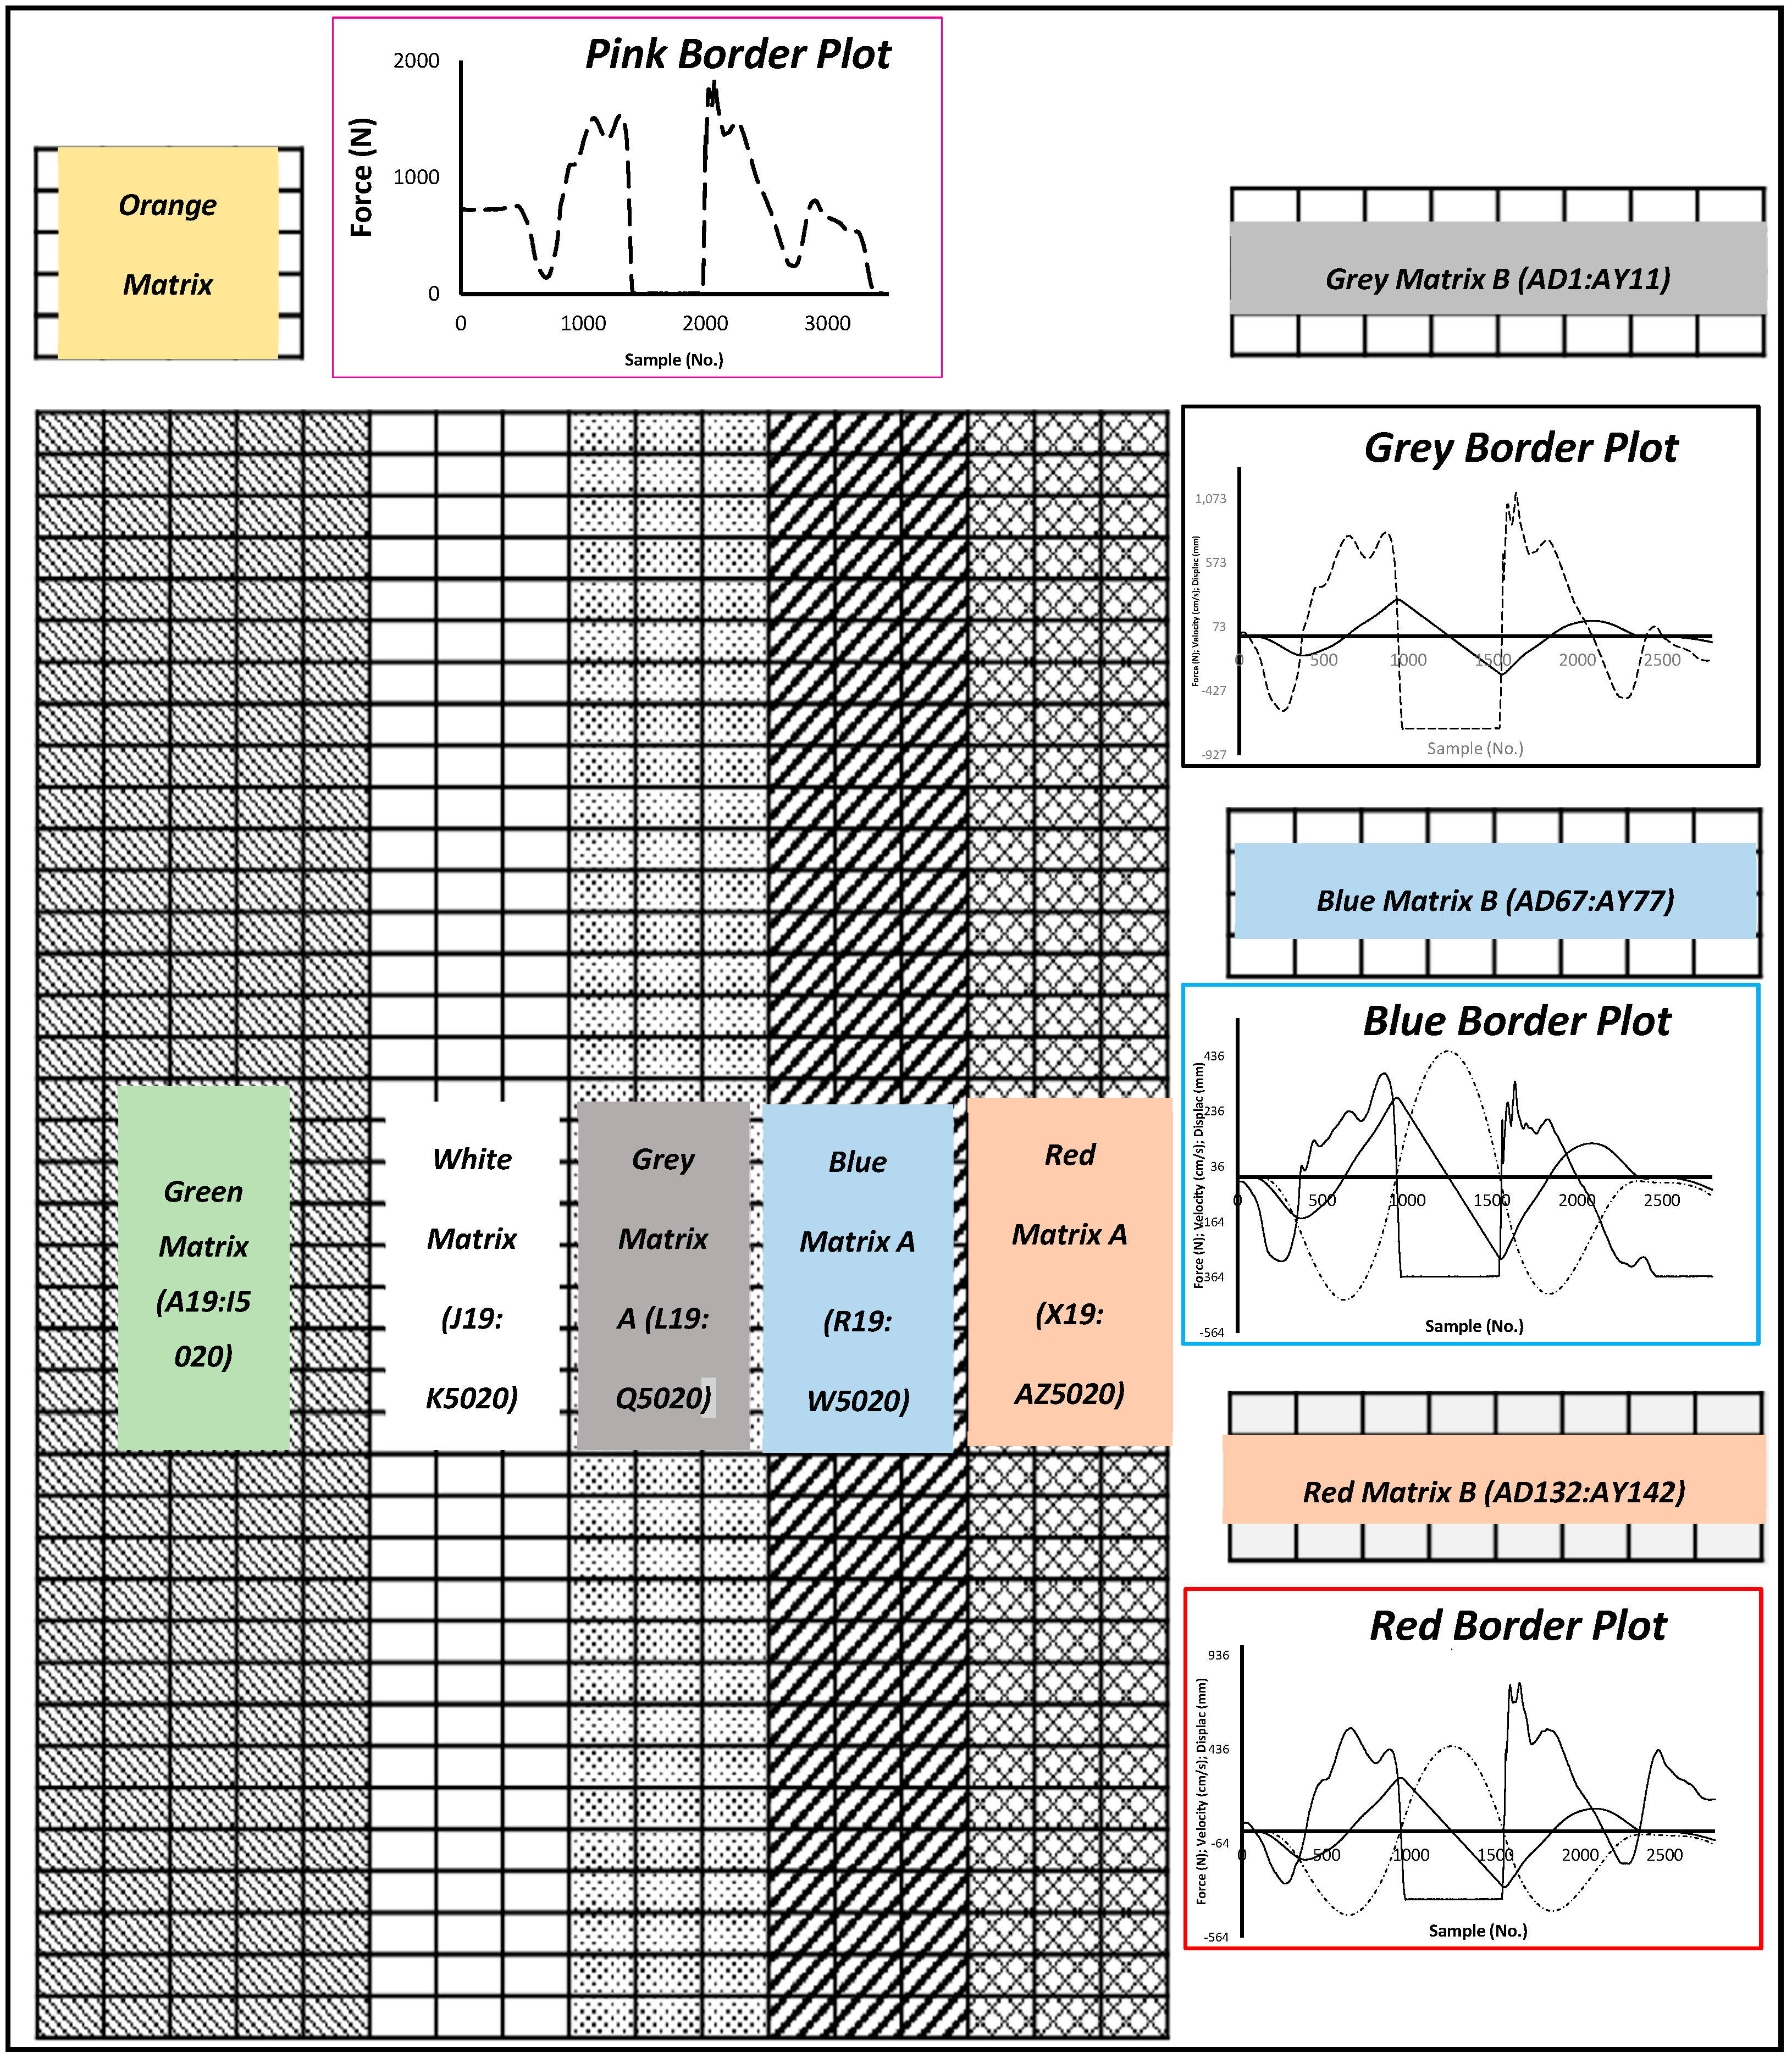
2.2.1. Structure and Use of the Excel/VBA Spreadsheet
- List of matrices: Orange Matrix (A1:C13), Green Matrix (A19:I5020), White Matrix (J19:K5020), Grey Matrix A (L19:Q5020) and Grey Matrix B (AD1:AY11), Blue Matrix A (R19:W5020) and Blue Matrix B (AD67:AY77), and Red Matrix A (X19:AZ5020) and Red Matrix B (AD132:AY142).
- List of plots: Pink Border Plot (in cells range D1:R14), Black Border Plot (in cells range AD21:AW63), Blue Border Plot (in cells range AD87:AW189), and Red Border Plot (in cell range AD151:AW194).
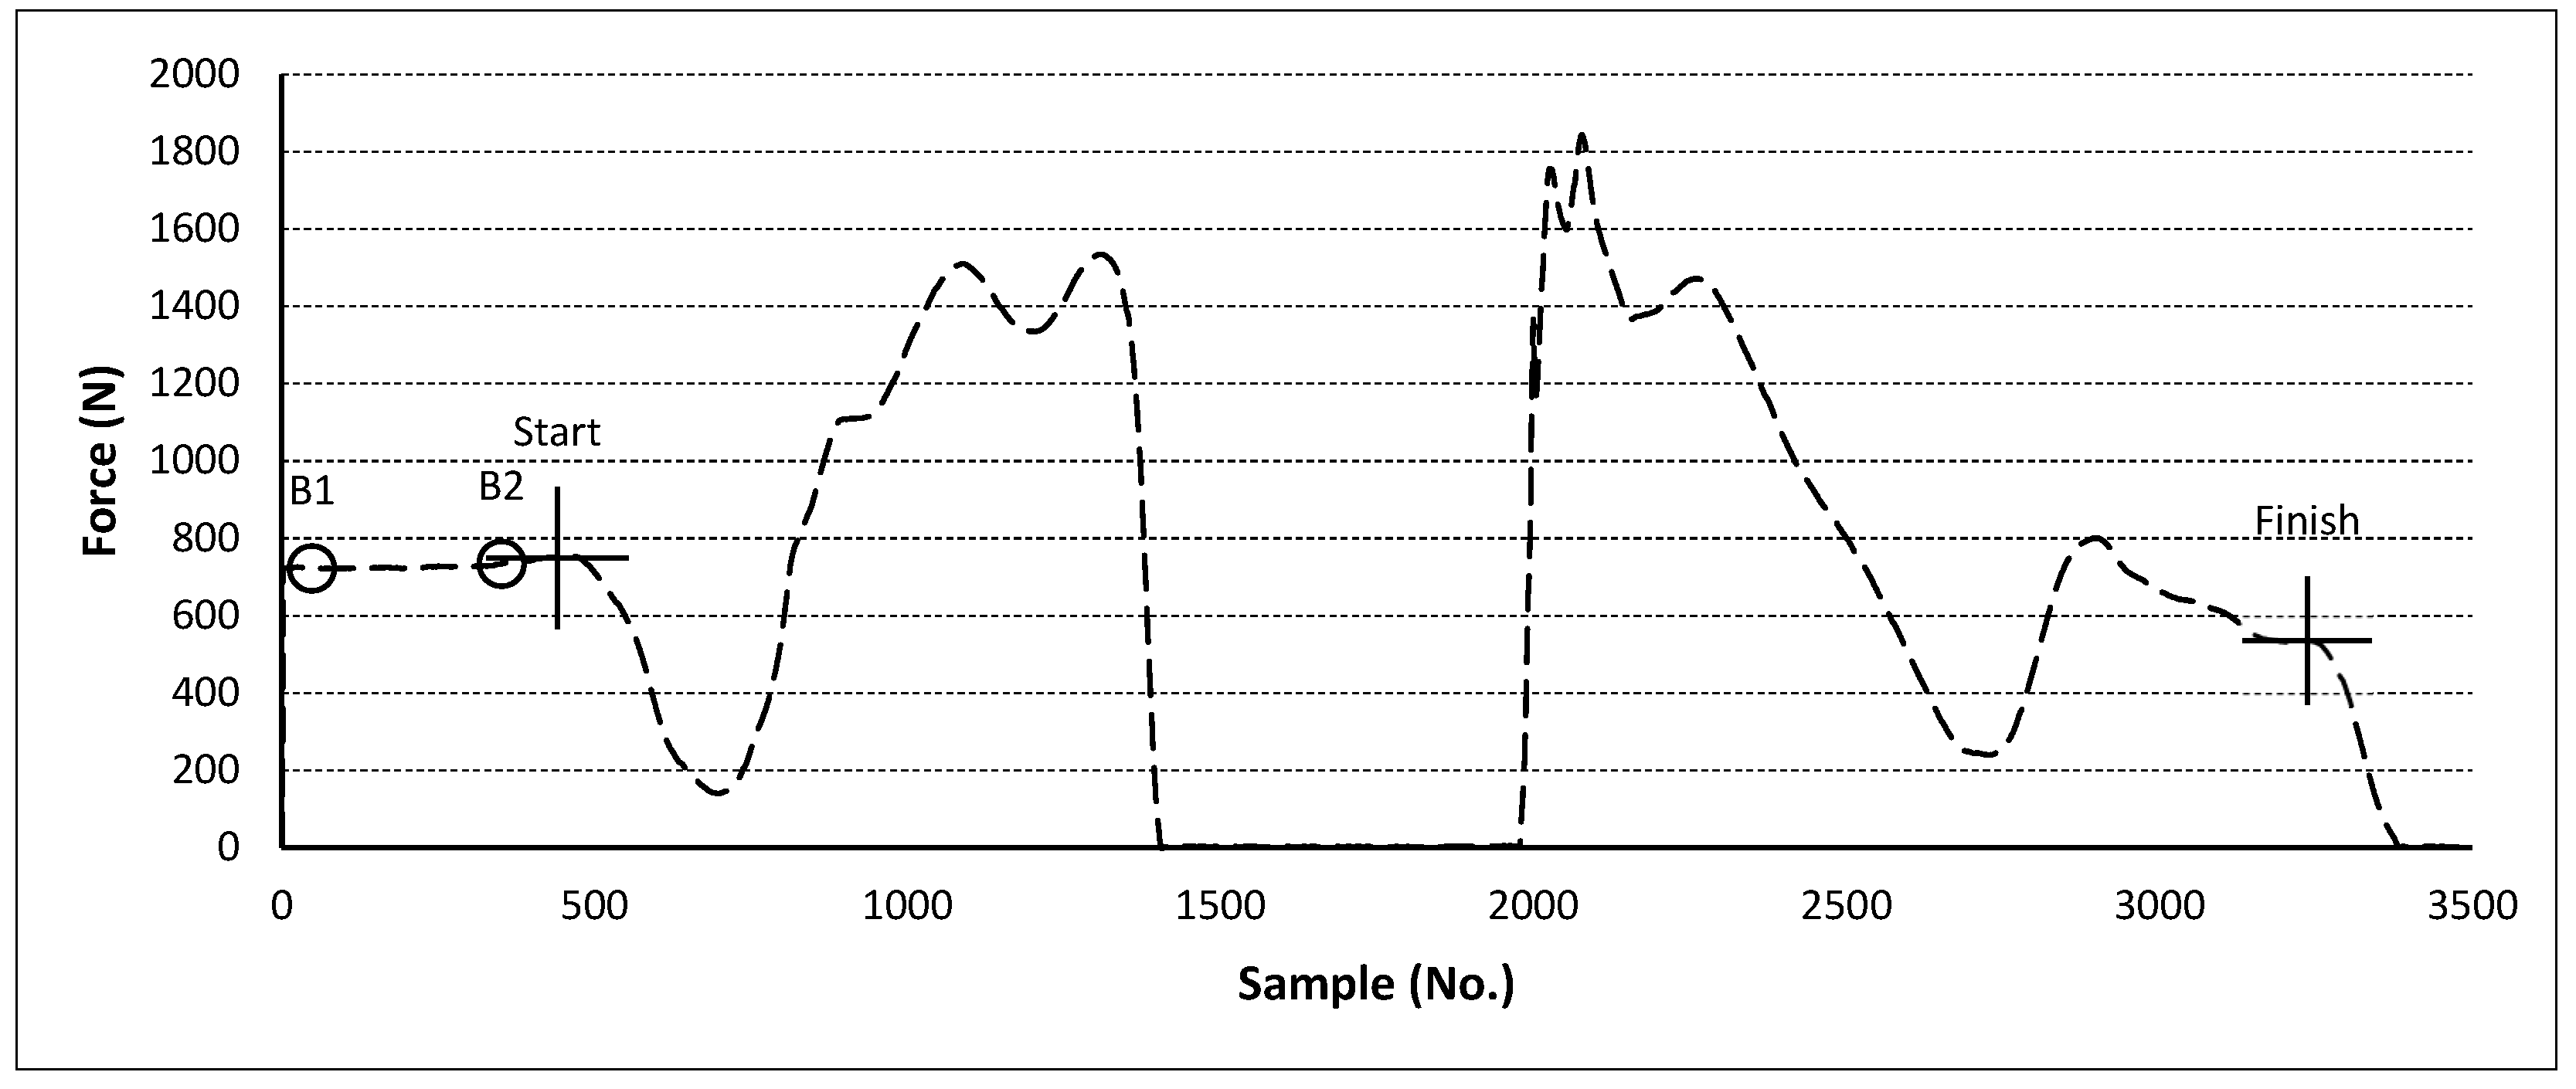
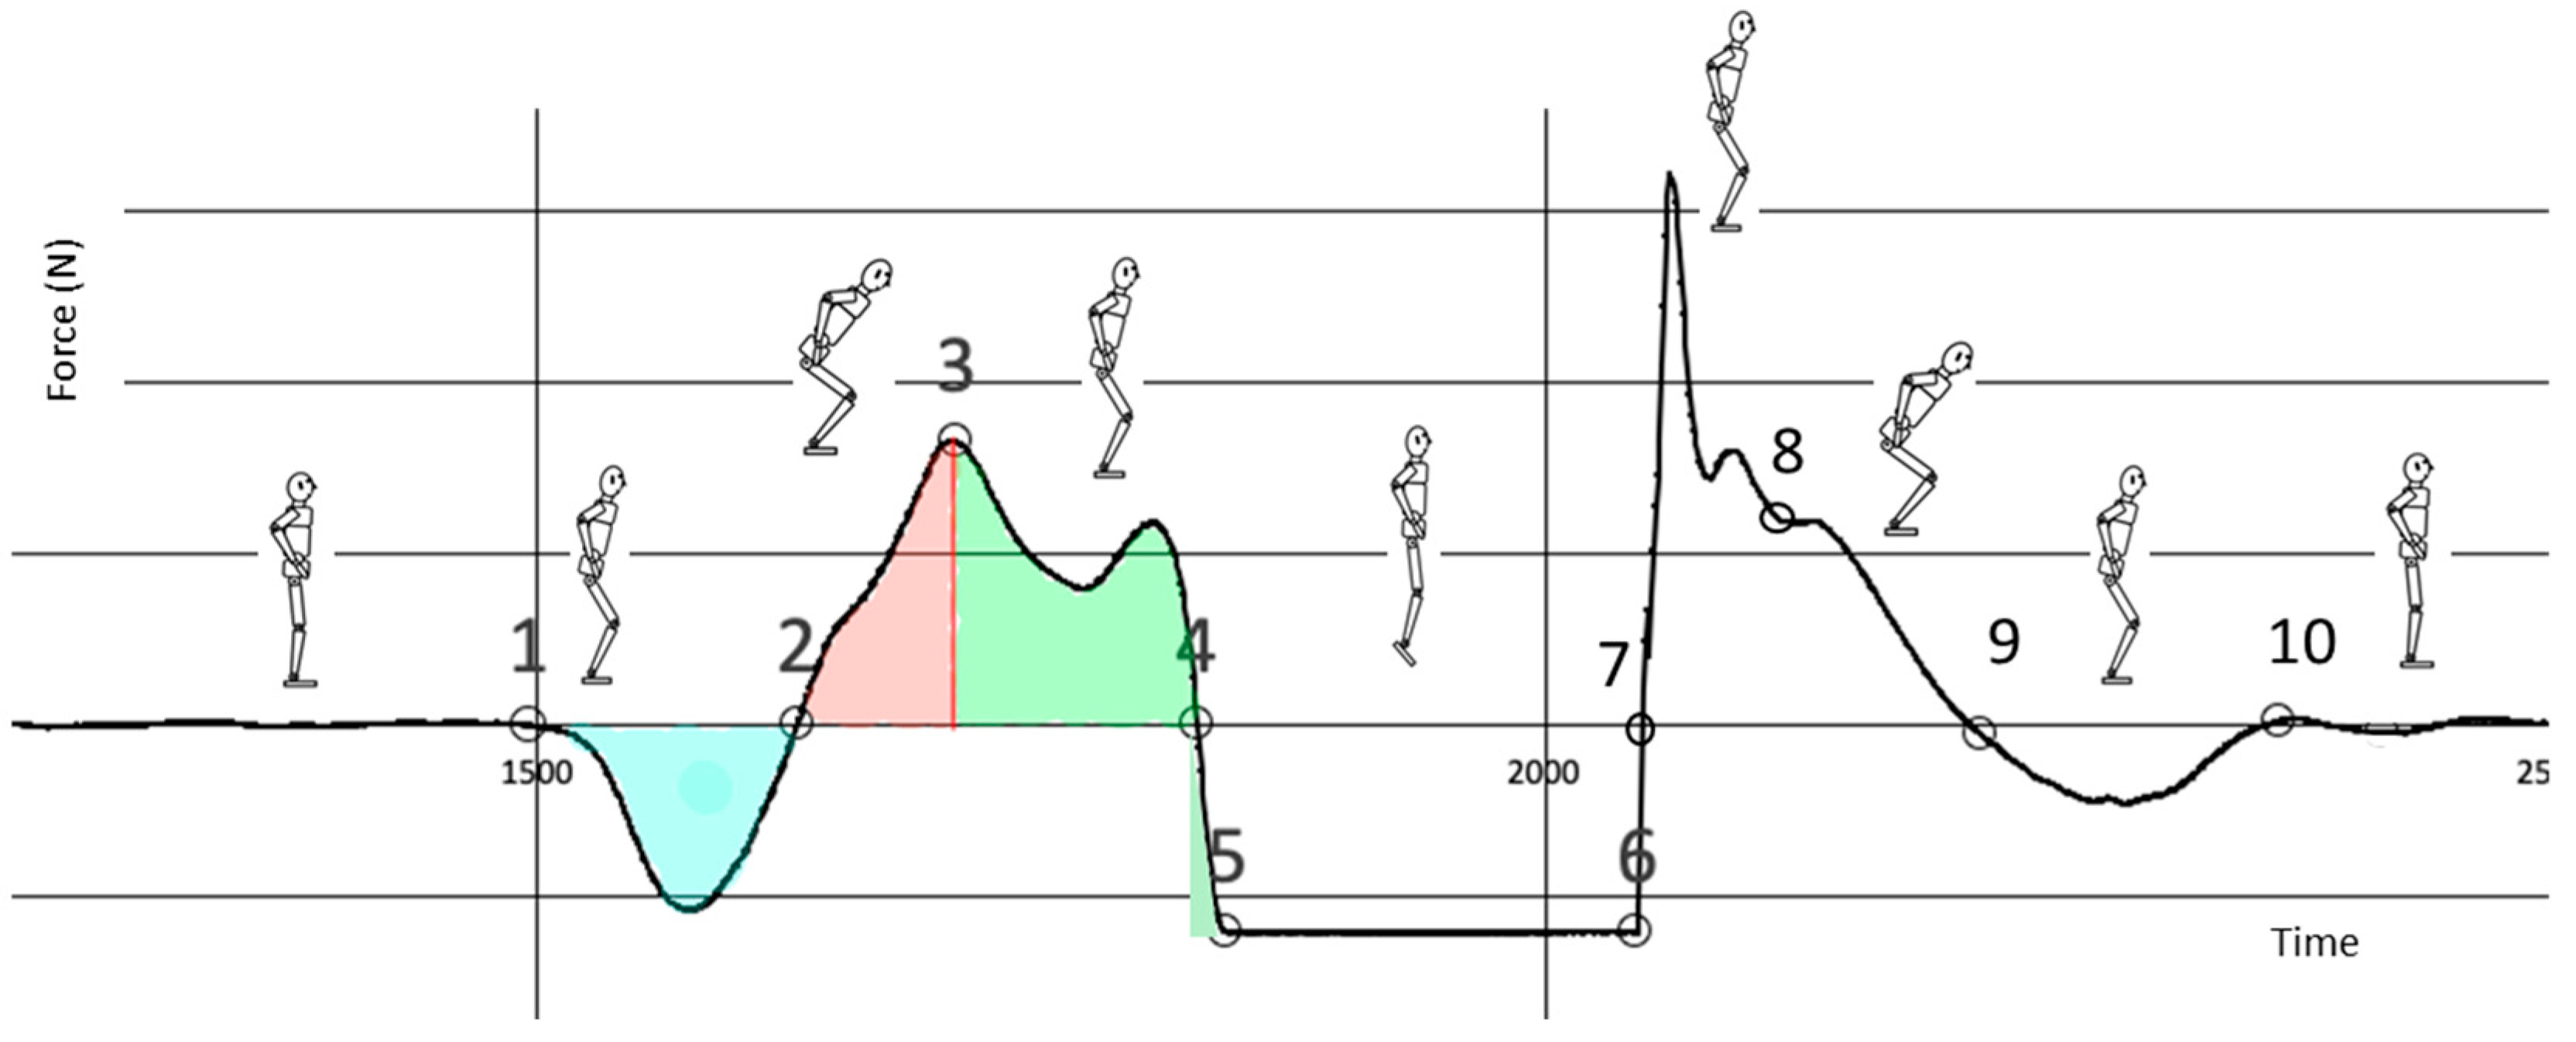
- Unweighting phase start. The beginning of the CMJ or the start of the negative impulse phase.
- Braking phase start (or positive impulse start). The end of the negative impulse phase.
- Propulsive phase start. The end of the countermovement phase, where the velocity equals zero and the negative phase impulse equals the positive phase impulse.
- Positive impulse finish (the force signal crosses the baseline).
- Flight phase start. The moment when the take-off begins and the platform does not register any force.
- Landing time start (or braking landing impulse start). When contact with the platform is re-established.
- Landing positive impulse start. The start of the positive impulse during landing.
- Braking landing impulse finish (or repositioning phase start). The end of the braking phase (the velocity equals zero).
- Landing positive impulse finish (or unweighting phase start). When the force signal crosses the baseline again.
- Landing unweighting phase end. The end of the CMJ.
2.2.2. Continuous Kinetic Variables Computation Formulas
- Cell B9. The weight in Newtons is calculated based on the values between points B1 and B2 (baseline) on the pink-bordered graph.
- Cell B10. The body mass in kg is determined from the weight (cell B9) and the acceleration of gravity (cell B4).
- Cells B11 and B12 display the weight recorded with an external scale, indicated on the Input sheet, which serves as a confirmatory measure to ensure consistency with the calculated weight value.
- Cell B13 contains half of the body weight.
2.2.3. Discrete Kinetic Variables Computation Formulas
2.2.4. Performing a Photogrammetric Analysis
2.3. Procedures to Analyze the Validity of the Spreadsheet
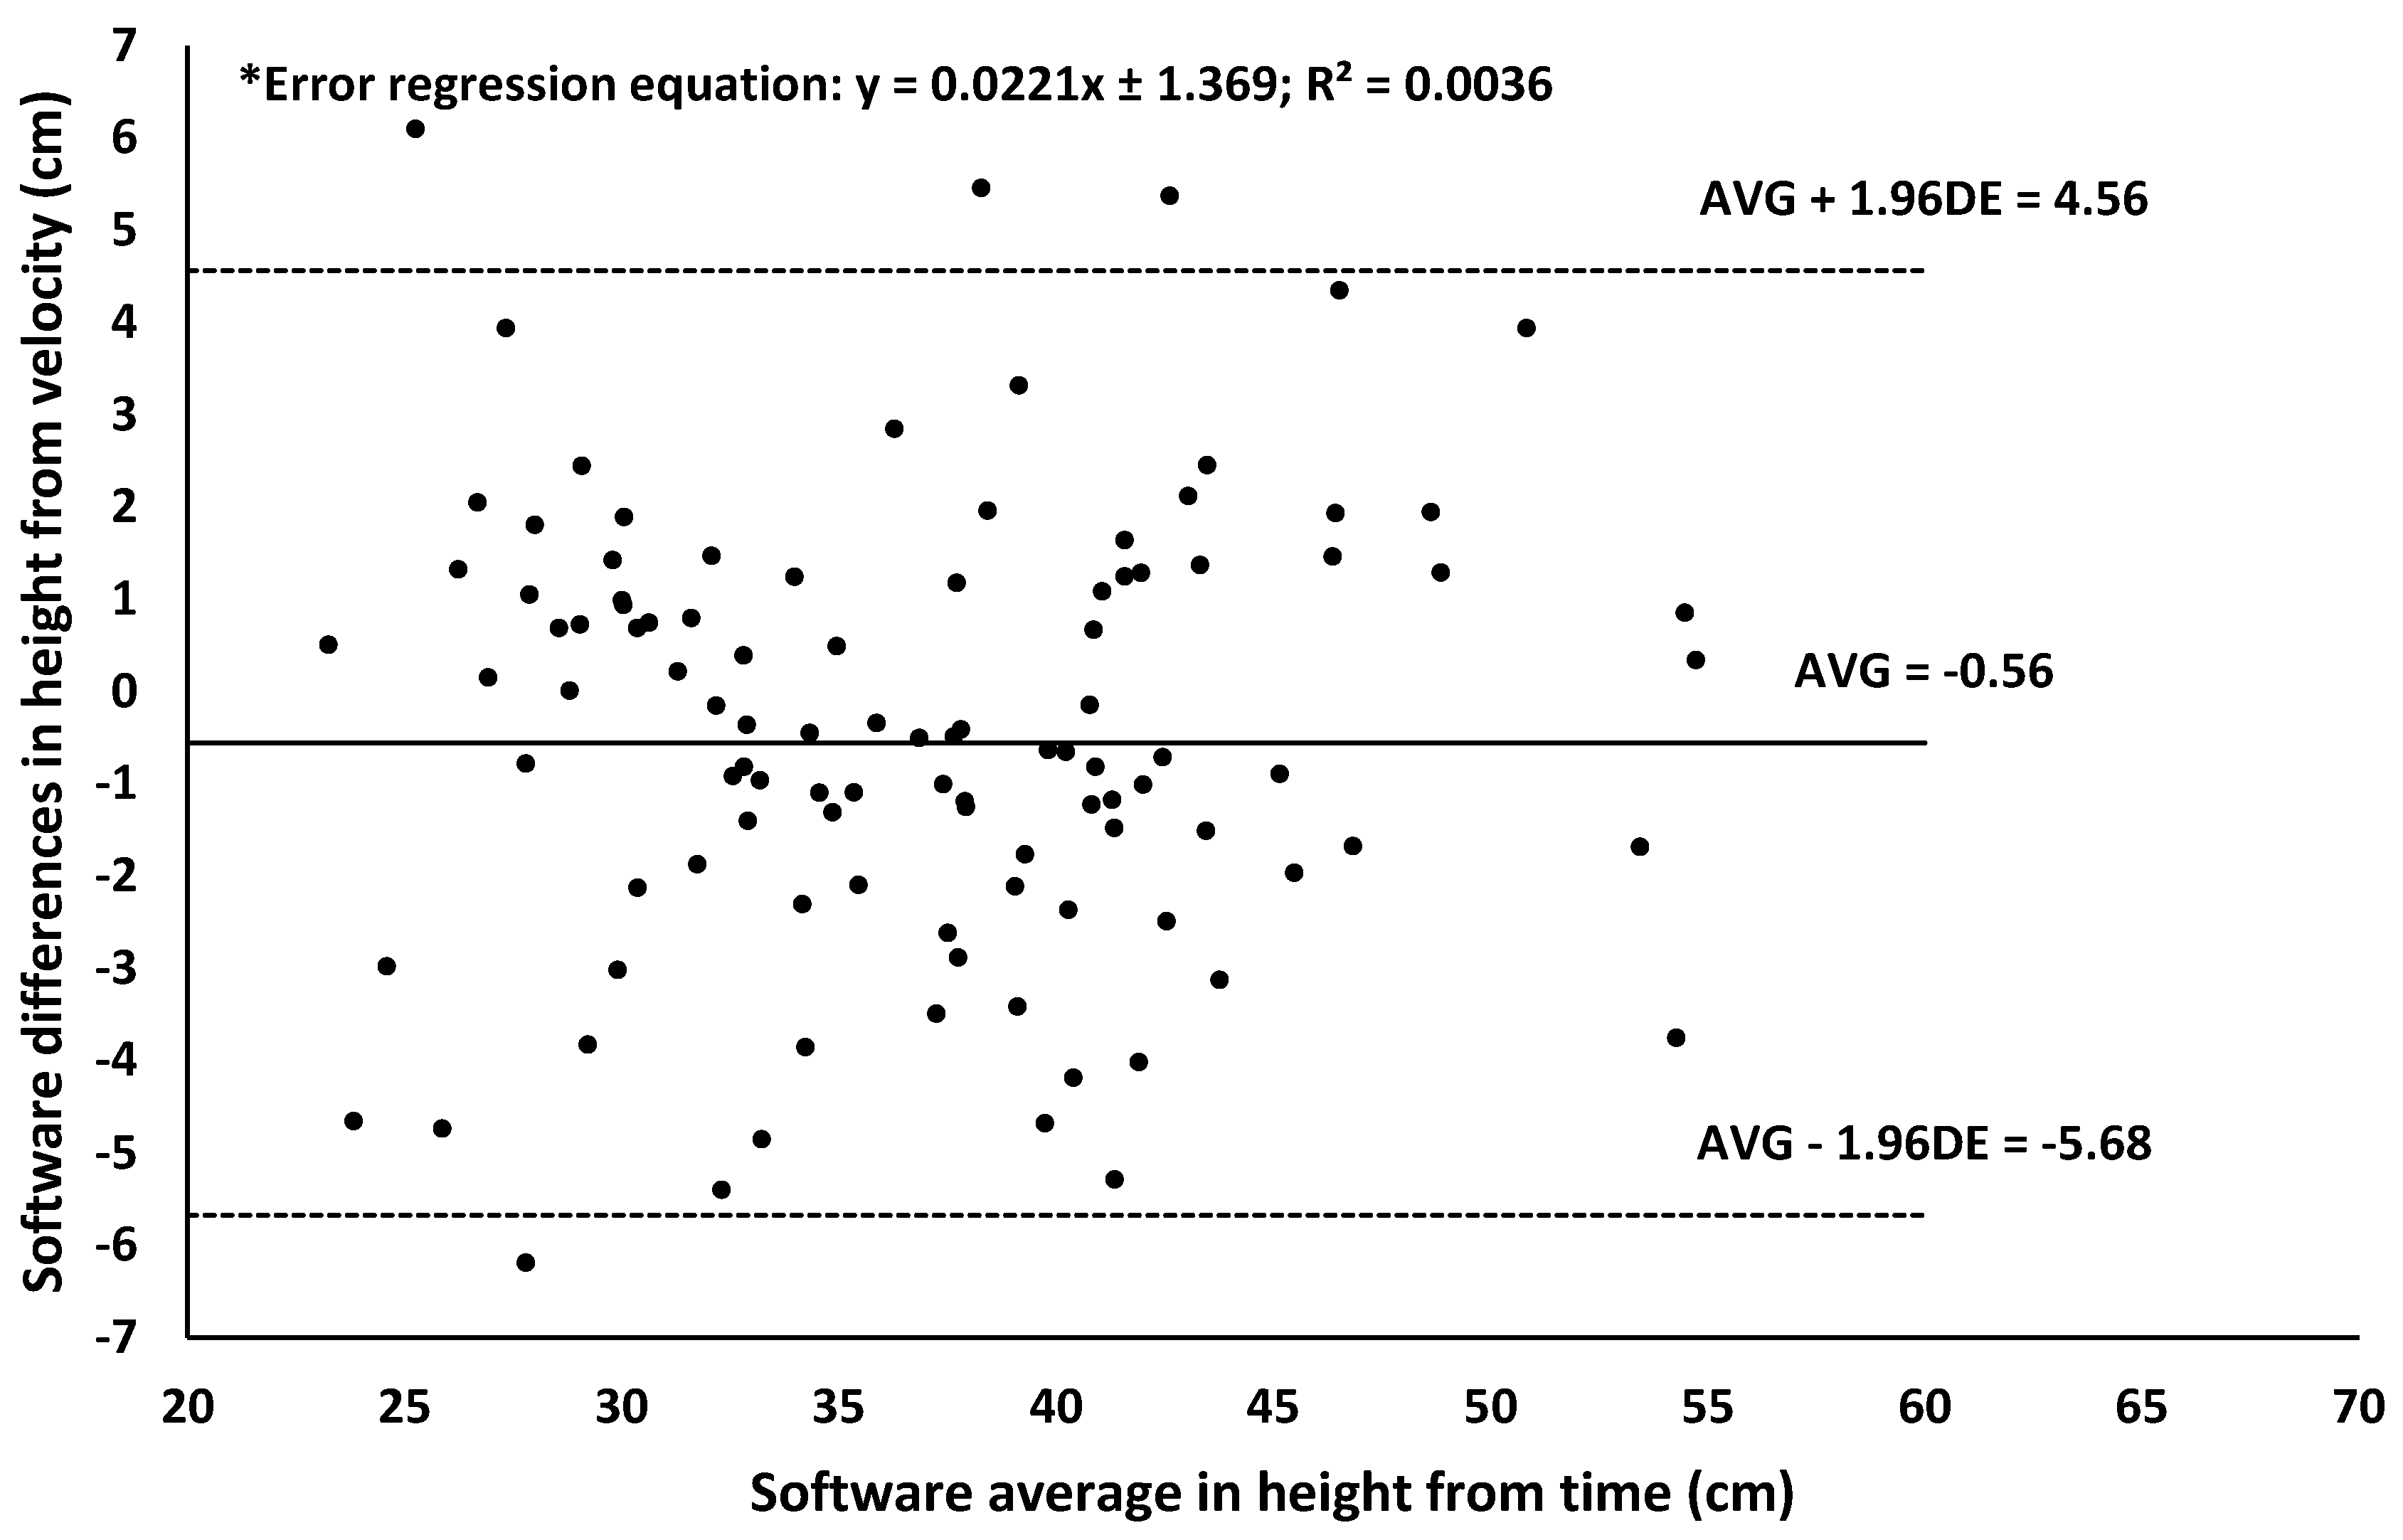
2.4. Statistical Analysis
3. Results
4. Discussion
5. Conclusions
Supplementary Materials
Author Contributions
Funding
Institutional Review Board Statement
Informed Consent Statement
Data Availability Statement
Acknowledgments
Conflicts of Interest
Abbreviations
| CMJ | Counter movement jump |
| BA | Bland–Altman |
| VBA | Visual Basic for Applications programming language |
References
- Cormie, P.; McBride, J.M.; McCaulley, G.O. Power-Time, Force-Time, and Velocity-Time Curve Analysis during the Jump Squat: Impact of Load. J. Appl. Biomech. 2008, 24, 112–120. [Google Scholar] [CrossRef] [PubMed]
- García-Pinillos, F.; Ramírez-Campillo, R.; Boullosa, D.; Jiménez-Reyes, P.; Latorre-Román, P. Vertical Jumping as a Monitoring Tool in Endurance Runners: A Brief Review. J. Hum. Kinet. 2021, 80, 297–308. [Google Scholar] [CrossRef] [PubMed]
- Ruiz, J.R.; Castro-Piñero, J.; España-Romero, V.; Artero, E.G.; Ortega, F.B.; Cuenca, M.M.; Jimenez-Pavón, D.; Chillón, P.; Girela-Rejón, M.J.; Mora, J.; et al. Field-Based Fitness Assessment in Young People: The ALPHA Health-Related Fitness Test Battery for Children and Adolescents. Br. J. Sports Med. 2010, 45, 518–524. [Google Scholar] [CrossRef] [PubMed]
- Wisløff, U.; Castagna, C.; Helgerud, J.; Jones, R.; Hoff, J. Strong Correlation of Maximal Squat Strength with Sprint Performance and Vertical Jump Height in Elite Soccer Players. Br. J. Sports Med. 2004, 38, 285–288. [Google Scholar] [CrossRef] [PubMed]
- Bishop, C.; Read, P.; Lake, J.; Chavda, S.; Turner, A. Interlimb Asymmetries: Understanding How to Calculate Differences From Bilateral and Unilateral Tests. Strength Cond. J. 2018, 40, 1–6. [Google Scholar] [CrossRef]
- Bishop, C.; Turner, A.; Read, P. Effects of Inter-Limb Asymmetries on Physical and Sports Performance: A Systematic Review. J. Sports Sci. 2017, 36, 1135–1144. [Google Scholar] [CrossRef] [PubMed]
- Šarabon, N.; Kozinc, Ž.; Marković, G. Force–Velocity Profile during Vertical Jump Cannot Be Assessed Using Only Bodyweight Jump and Isometric Maximal Voluntary Contraction Tasks. Sci. Rep. 2020, 10, 19127. [Google Scholar] [CrossRef] [PubMed]
- Attia, A.; Dhahbi, W.; Chaouachi, A.; Padulo, J.; Wong, D.; Chamari, K. Measurement Errors When Estimating the Vertical Jump Height with Flight Time Using Photocell Devices: The Example of Optojump. Biol. Sport 2017, 34, 63–70. [Google Scholar] [CrossRef] [PubMed]
- Hébert-Losier, K.; Martyn Beaven, C. The MARS for Squat, Countermovement, and Standing Long Jump Performance Analyses. J. Strength Cond. Res. 2014, 28, 1849–1857. [Google Scholar] [CrossRef]
- Measurement, Analysis and Reporting Software MARS. Available online: http://mars.s2p.si/ (accessed on 11 October 2024).
- Markström, J.L.; Olsson, C.-J. Countermovement Jump Peak Force Relative to Body Weight and Jump Height as Predictors for Sprint Running Performances. J. Strength Cond. Res. 2013, 27, 944–953. [Google Scholar] [CrossRef]
- Moir, G.; Shastri, P.; Connaboy, C. Intersession Reliability of Vertical Jump Height in Women and Men. J. Strength Cond. Res. 2008, 22, 1779–1784. [Google Scholar] [CrossRef]
- Mihalik, J.P.; Libby, J.J.; Battaglini, C.L.; McMurray, R.G. Comparing Short-Term Complex and Compound Training Programs on Vertical Jump Height and Power Output. J. Strength Cond. Res. 2008, 22, 47–53. [Google Scholar] [CrossRef]
- Stefanyshyn, D.J.; Nigg, B.M. Influence of Midsole Bending Stiffness on Joint Energy and Jump Height Performance. Med. Sci. Sports Exerc. 2000, 32, 471. [Google Scholar] [CrossRef]
- Heishman, A.D.; Daub, B.D.; Miller, R.M.; Freitas, E.D.S.; Frantz, B.A.; Bemben, M.G. Countermovement Jump Reliability Performed With and Without an Arm Swing in NCAA Division 1 Intercollegiate Basketball Players. J. Strength Cond. Res. 2020, 34, 546–558. [Google Scholar] [CrossRef] [PubMed]
- Merrigan, J.J.; Strang, A.; Eckerle, J.; Mackowski, N.; Hierholzer, K.; Ray, N.T.; Smith, R.; Hagen, J.A.; Briggs, R.A. Countermovement Jump Force-Time Curve Analyses: Reliability and Comparability Across Force Plate Systems. J. Strength Cond. Res. 2023, 38, 30–37. [Google Scholar] [CrossRef] [PubMed]
- Delgado-García, G.; Vanrenterghem, J.; Mildenberger, C.; Gallego, L.R.; Chicano-Gutiérrez, J.M.; Manuel Soto-Hermoso, V. Accuracy and Reliability of a Low-Cost Methodology to Assess 3D Body Posture Based on Commercial Cameras and Excel Templates. Measurement 2021, 173, 108638. [Google Scholar] [CrossRef]
- Chavda, S.; Bromley, T.; Jarvis, P.; Williams, S.; Bishop, C.; Turner, A.N.; Lake, J.P.; Mundy, P.D. Force-Time Characteristics of the Countermovement Jump: Analyzing the Curve in Excel. Strength Cond. J. 2018, 40, 67–77. [Google Scholar] [CrossRef]
- McMahon, J.J.; Suchomel, T.J.; Lake, J.P.; Comfort, P. Understanding the Key Phases of the Countermovement Jump Force-Time Curve. Strength Cond. J. 2018, 40, 96–106. [Google Scholar] [CrossRef]
- Cohen, D.; Burton, A.; Wells, C.; Taberner, M.; Diaz, M.A.; Graham-Smith, P. Single vs. Double Leg Countermovement Tests: Not Half an Apple! Aspetar Sport. Med. J. 2020, 9, 34–41. [Google Scholar]
- Pérez-Castilla, A.; García-Ramos, A.; Janicijevic, D.; Delgado-García, G.; De la Cruz, J.C.; Rojas, F.J.; Cepero, M. Between-Session Reliability of Performance and Asymmetry Variables Obtained during Unilateral and Bilateral Countermovement Jumps in Basketball Players. PLoS ONE 2021, 16, e0255458. [Google Scholar] [CrossRef]
- Koltermann, J.; Gerber, M.; Beck, H.; Beck, M. Validation of the HUMAC Balance System in Comparison with Conventional Force Plates. Technologies 2017, 5, 44. [Google Scholar] [CrossRef]
- Van Wassenbergh, S. VBA Excel Add-In Utilities and Worksheet Templates. Available online: https://www.uantwerpen.be/en/staff/sam-vanwassenbergh/my-website/excel-vba-tools/ (accessed on 11 October 2024).
- Winter, D.A. Biomechanics and Motor Control of Human Movement; John Wiley & Sons: Hoboken, NJ, USA, 2009; ISBN 9780470398180. [Google Scholar]
- Pérez-Castilla, A.; Fernandes, J.F.T.; Rojas, F.J.; García-Ramos, A. Reliability and Magnitude of Countermovement Jump Performance Variables: Influence of the Take-off Threshold. Meas. Phys. Educ. Exerc. Sci. 2021, 25, 227–235. [Google Scholar] [CrossRef]
- Pérez-Castilla, A.; Rojas, F.J.; García-Ramos, A. Reliability and Magnitude of Loaded Countermovement Jump Performance Variables: A Technical Examination of the Jump Threshold Initiation. Sports Biomech. 2019, 21, 622–636. [Google Scholar] [CrossRef]
- Bishop, C.; Jordan, M.; Torres-Ronda, L.; Loturco, I.; Harry, J.; Virgile, A.; Mundy, P.; Turner, A.; Comfort, P. Selecting Metrics That Matter: Comparing the Use of the Countermovement Jump for Performance Profiling, Neuromuscular Fatigue Monitoring, and Injury Rehabilitation Testing. Strength Cond. J. 2023, 45, 545–553. [Google Scholar] [CrossRef]
- Ferro, A.; Floría, P.; Villacieros, J.; Muñoz-López, A. Maximum Velocity during Loaded Countermovement Jumps Obtained with an Accelerometer, Linear Encoder and Force Platform: A Comparison of Technologies. J. Biomech. 2019, 95, 109281. [Google Scholar] [CrossRef] [PubMed]
- Campbell, M.J.; Jacques, R.M. Statistics at Square Two; John Wiley & Sons: Hoboken, NJ, USA, 2023; ISBN 9781119401391. [Google Scholar]
- Salamh, P.A.; Kolber, M. The Reliability, Minimal Detectable Change and Concurrent Validity of a Gravity-Based Bubble Inclinometer and Iphone Application for Measuring Standing Lumbar Lordosis. Physiother. Theory Pract. 2013, 30, 62–67. [Google Scholar] [CrossRef]
- Conceição, F.; Lewis, M.; Lopes, H.; Fonseca, E.M.M. An Evaluation of the Accuracy and Precision of Jump Height Measurements Using Different Technologies and Analytical Methods. Appl. Sci. 2022, 12, 511. [Google Scholar] [CrossRef]
- Kibele, A. Possibilities and Limitations in the Biomechanical Analysis of Countermovement Jumps: A Methodological Study. J. Appl. Biomech. 1998, 14, 105–117. [Google Scholar] [CrossRef]
- Markovic, G. Does Plyometric Training Improve Vertical Jump Height? A Meta-Analytical Review. Br. J. Sports Med. 2007, 41, 349–355. [Google Scholar] [CrossRef]
- Nuzzo, J.L.; Anning, J.H.; Scharfenberg, J.M. The Reliability of Three Devices Used for Measuring Vertical Jump Height. J. Strength Cond. Res. 2011, 25, 2580–2590. [Google Scholar] [CrossRef]
- Chavda, S.; Lake, J.P.; Comfort, P.; Bishop, C.; Joffe, S.A.; Turner, A.N. Relationship Between Kinetic and Kinematic Measures of the Countermovement Jump and National Weightlifting Performance. J. Sci. Sport Exerc. 2023, 1–13. [Google Scholar] [CrossRef]
- Janicijevic, D.; Sarabon, N.; Pérez-Castilla, A.; Smajla, D.; Fernández-Revelles, A.; García-Ramos, A. Single-Leg Mechanical Performance and Inter-Leg Asymmetries during Bilateral Countermovement Jumps: A Comparison of Different Calculation Methods. Gait Posture 2022, 96, 47–52. [Google Scholar] [CrossRef] [PubMed]
- Cao, J.; Xun, S.; Zhang, R.; Zhang, Z. Effects of Unilateral, Bilateral and Combined Plyometric Jump Training on Asymmetry of Muscular Strength and Power, and Change-of-Direction in Youth Male Basketball Players. J. Sports Sci. Med. 2024, 23, 754–766. [Google Scholar] [CrossRef]
- Cortis, C.; Tessitore, A.; Lupo, C.; Pesce, C.; Fossile, E.; Figura, F.; Capranica, L. Inter-Limb Coordination, Strength, Jump, and Sprint Performances Following a Youth Men’s Basketball Game. J. Strength Cond. Res. 2011, 25, 135–142. [Google Scholar] [CrossRef] [PubMed]
- Ding, L.; Lyu, M.; Chen, Z.; Wu, J.; Wang, Y.; Bishop, C.; Li, Y. Associations Between Inter-Limb Asymmetry in Lower Limb Strength and Jump Performance in 14–15-Year-Old Basketball Players. Symmetry 2024, 16, 1421. [Google Scholar] [CrossRef]


| Matrix | Variable | Excel Col. | Computation | ||
|---|---|---|---|---|---|
| Grey | Net resultant force | D, L | Subtracting the participant’s weight to the resultant force at each instant | ||
| Acceleration of the GC | M | By dividing the net resultant force at each instant by the weight of the participant | |||
| Velocity of the GC | N | Adding to the instantaneous velocity at previous record, the instantaneous acceleration multiplied by the time of one record | |||
| Displacement of the CG | O | Adding to the instantaneous displacement at previous record, the instantaneous velocity multiplied by the time of one record | |||
| Instantaneous power of the CG | P | Multiplying the net resultant force at each instant by the velocity of the CG at each instant | |||
| Instantaneous impulse of the CG | Q | Multiplying the net resultant force at each instant by the time of one record | |||
| Blue A and Red A | Net resultant force of the left/right body side | F, H, R, X | Subtracting half of the body weight to the left or right force at each instant | ||
| Left or right body side acceleration | S, Y | By dividing the net left/right force at each instant by half of the body weight | |||
| Instantaneous velocity of the left or right body side | T, Z | Adding to the instantaneous velocity of the left or right body side in the previous record, the instantaneous acceleration of the left or right body side multiplied by the time of one record | |||
| Displacement of the left or right body side | U, AA | Adding to the instantaneous displacement in the previous record, the instantaneous velocity of the left or right body side multiplied by the time of one record | |||
| Instantaneous power of the left or right body side | V, AB | Multiplying the net resultant force of the left or right body side at each instant by the velocity of the left or right body side at each instant | |||
| Instantaneous impulse of the left or right body side | W, AC | Multiplying the net resultant force of the left or right body side at each instant by the time of one record |
| Matrix | Variable | Excel Column | Computation | ||
|---|---|---|---|---|---|
| Grey B, Blue B, and Red B | Partial impulses | AJ | Sum of the instantaneous impulses between the two selected events | ||
| Propulsive average velocity and braking average velocity | AL | Averaging the velocity values between the start of the propulsive phase and the start of the flight phase and between the start of landing and the end of the braking phase | |||
| Average Force | AN | Dividing the impulse of each phase by the phase duration | |||
| Average Power | AO | Multiplying the average force in each phase by the average velocity in each phase |
| General Measures | Phase Delays (ms) | ||
|---|---|---|---|
| Excentric impulse (N · s) | 113.5 | Unweighting phase start | −51 |
| Propulsive impulse (N · s) | 194.0 | Braking phase start delay | 35 |
| Impulse ratio | 0.585 | Positive impulse finish | −5 |
| Take-off speed (m/s) | 2.62 | Flight phase start | −5 |
| Jump height with initial velocity (cm) | 35.14 | Landing time start delay | −5 |
| Flight time (Sec) | 0.57 | Landing positive impulse start delay | 0 |
| Jump height with flight time (m) | 39.94 | Braking landing impulse finish delay | −289 |
| Propulsive relative power (W/kg) | 14.8 | Landing positive impulse finish delay | −282 |
| Landing positive impulse (N · s) | 308.6 | Landing unweighting phase end delay | −15 |
| Landing peak force (N) | 1117.9 | Phase duration differences (ms) | |
| Left-leg negative impulse (N · s) | −61.6 | Unweighting phase start | 86 |
| Right-leg negative impulse (N · s) | −47.2 | Braking phase start delay | −30 |
| Inter-leg negative impulse asymmetry (R-L) (%) | 26.5 | Positive impulse finish | 0 |
| Left-leg positive impulse (N · s) | 106.6 | Flight phase start | 0 |
| Right-leg positive impulse (N · s) | 200.2 | Landing time start delay | 5 |
| Inter-leg positive impulse asymmetry (R-L) (%) | −61.0 | Landing positive impulse start delay | −289 |
| Left-leg landing positive impulse (N · s) | 58.76 | Braking landing impulse finish delay | 7 |
| Right-leg landing positive impulse (N · s) | 230.7 | Landing positive impulse finish delay | 267 |
| Inter-leg landing PI asymmetry (R-L) (%) | −118.8 | Landing unweighting phase end delay | 0 |
| Landing force peak Left leg (R-L) (N) | 343.6 | ||
| Landing force peak Right leg (R-L) (N) | 791.0 | ||
| Landing force peak asymmetry (R-L) (%) | −78.9 | ||
| Variable | Statistical Parameter | |||||||
|---|---|---|---|---|---|---|---|---|
| Reliability | Error (cm) | * MCD (cm) | ||||||
| Lin CCC (95% CI) | MAE | SEM | MDC90 | MDC95 | ||||
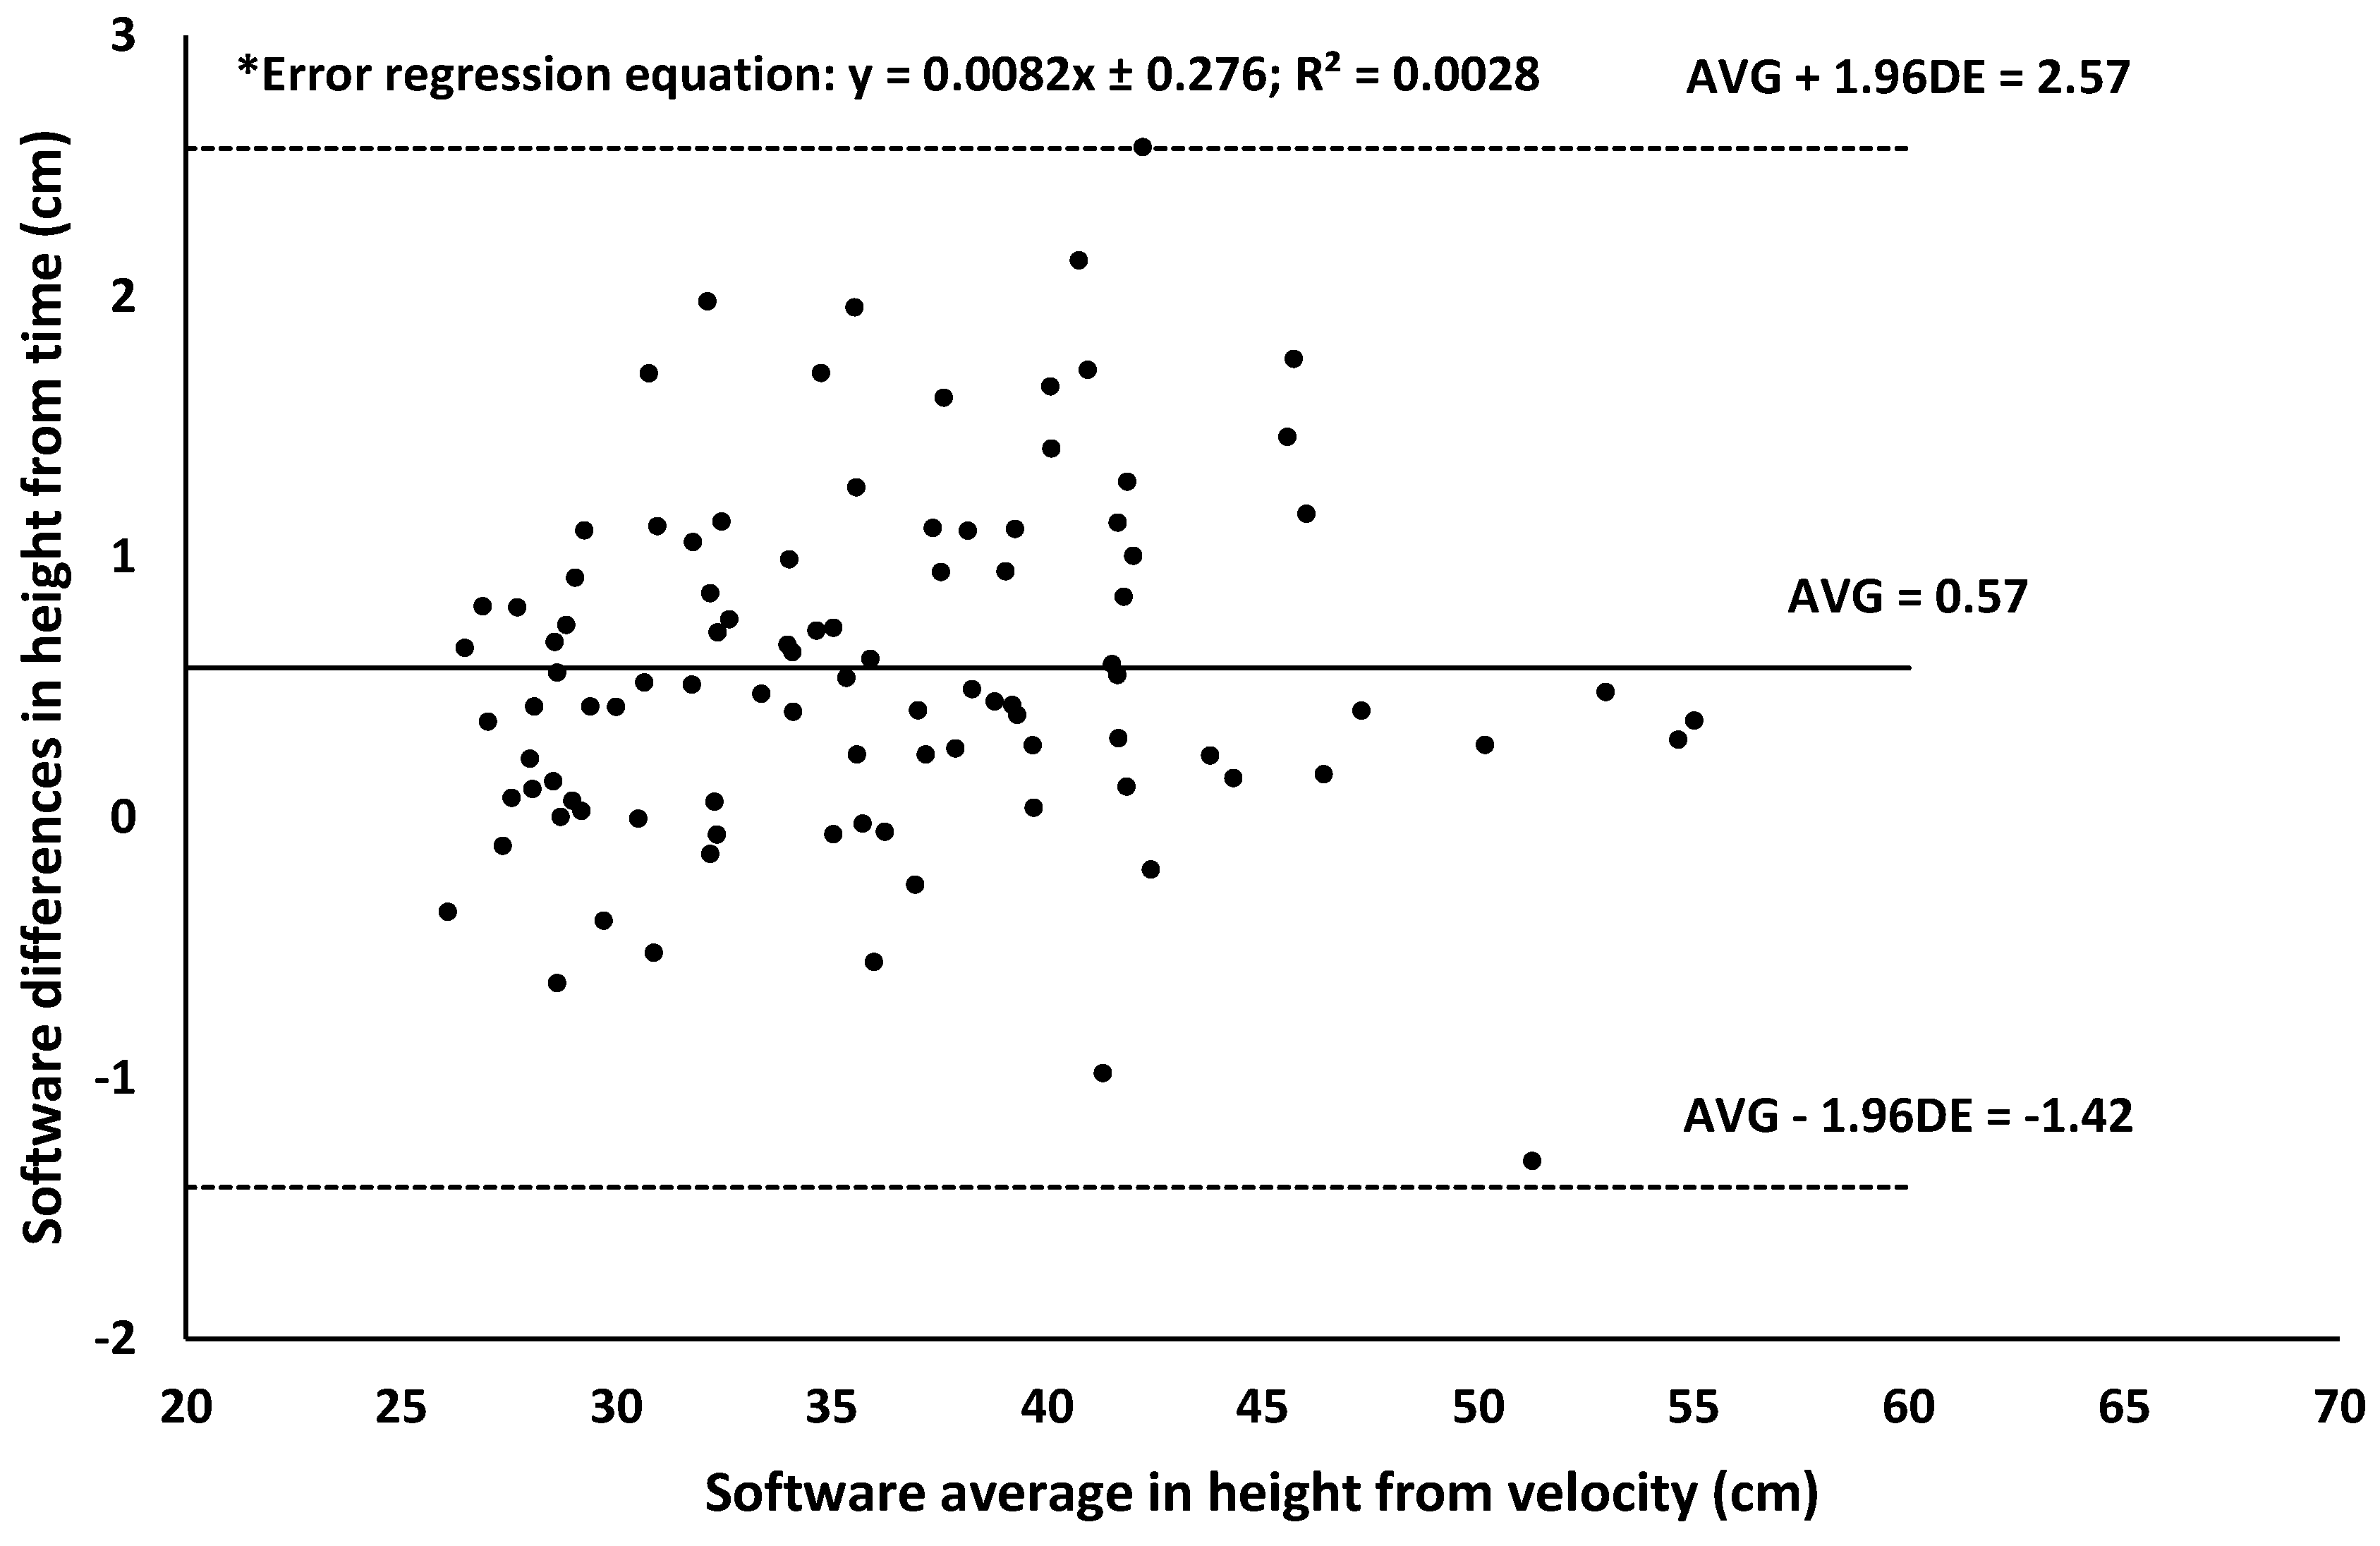
| Jump height from take-off velocity | 0.932 (0.902–0.953) | 1.79 | 0.55 | 1.28 | 1.52 | |||
| Jump height from flight time | 0.984 (0.977–0.989) | 0.69 | 0.07 | 0.16 | 0.19 | |||
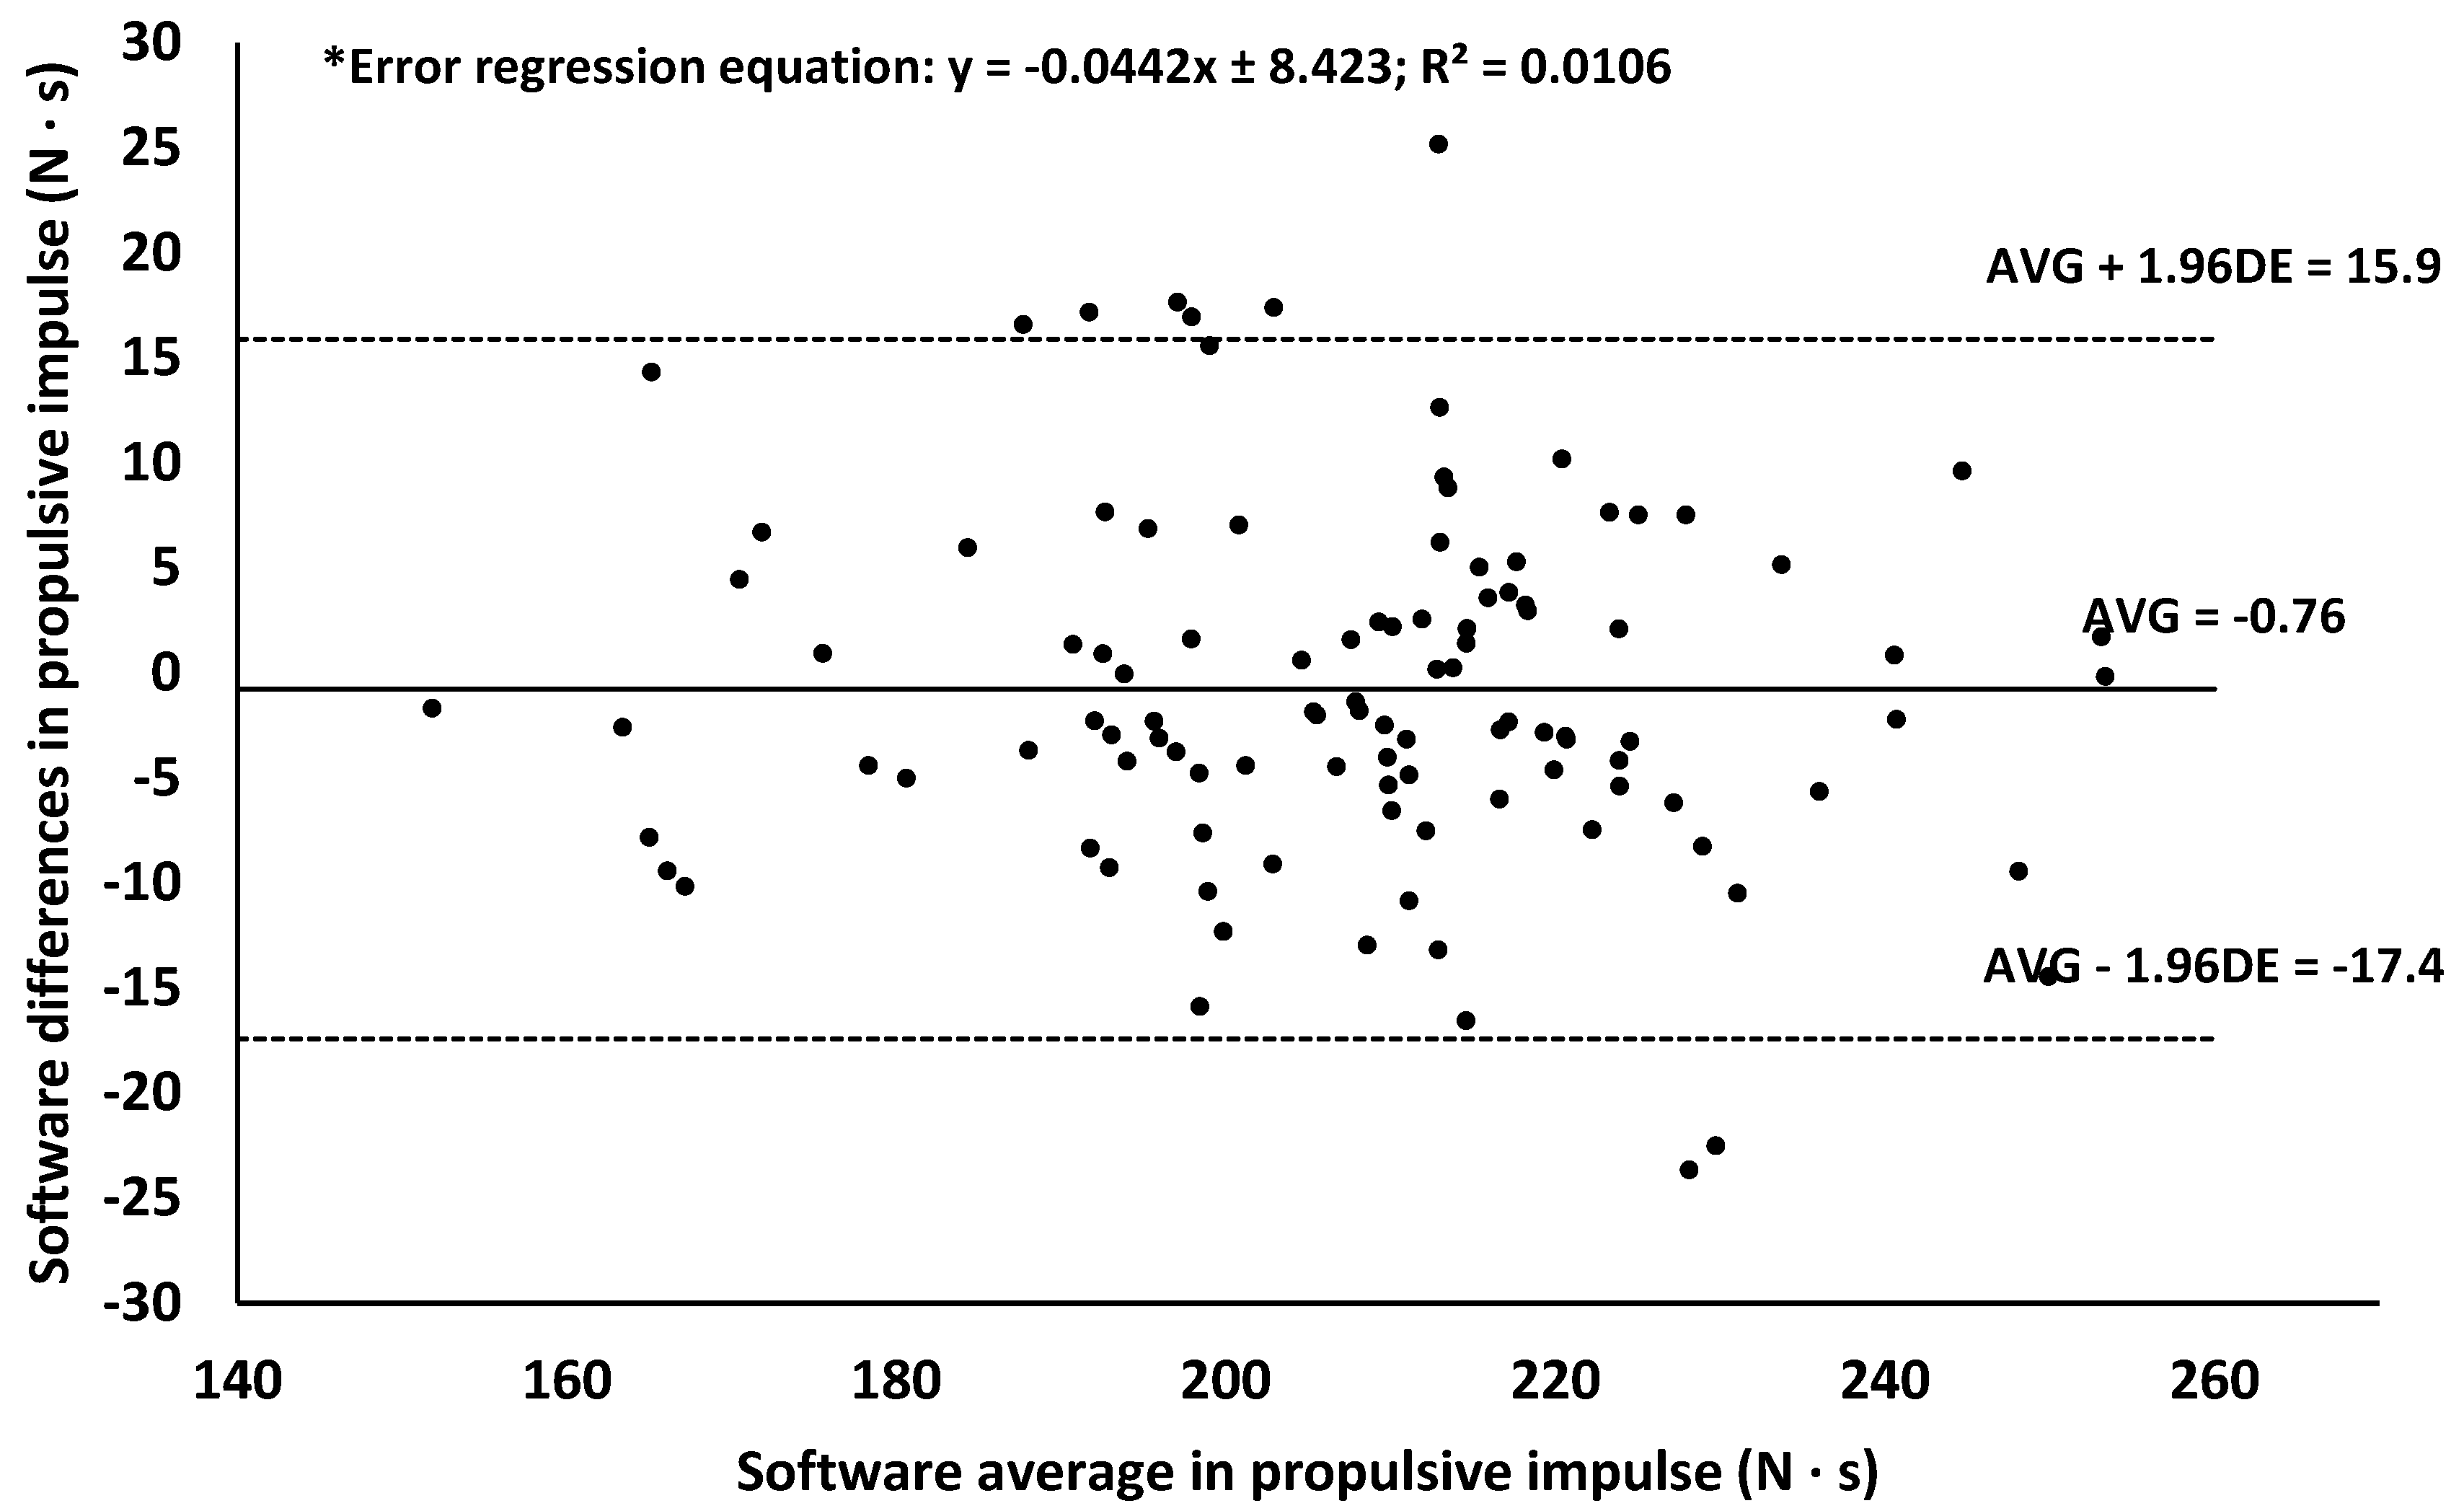
| Propulsive impulse | 0.940 (0.914–0.959) | 5.5 | 1.95 | 4.55 | 5.41 | |||
Disclaimer/Publisher’s Note: The statements, opinions and data contained in all publications are solely those of the individual author(s) and contributor(s) and not of MDPI and/or the editor(s). MDPI and/or the editor(s) disclaim responsibility for any injury to people or property resulting from any ideas, methods, instructions or products referred to in the content. |
© 2025 by the authors. Licensee MDPI, Basel, Switzerland. This article is an open access article distributed under the terms and conditions of the Creative Commons Attribution (CC BY) license (https://creativecommons.org/licenses/by/4.0/).
Share and Cite
Delgado-García, G.; Pérez-Castilla, A.; Rojas-Ruiz, F.J.; Navarro-Marchal, I.; Caballero-Villalta, A. Validity of a User-Friendly Spreadsheet Designed for an In-Depth Analysis of Countermovement Bipodal Jumps. Appl. Sci. 2025, 15, 1519. https://doi.org/10.3390/app15031519
Delgado-García G, Pérez-Castilla A, Rojas-Ruiz FJ, Navarro-Marchal I, Caballero-Villalta A. Validity of a User-Friendly Spreadsheet Designed for an In-Depth Analysis of Countermovement Bipodal Jumps. Applied Sciences. 2025; 15(3):1519. https://doi.org/10.3390/app15031519
Chicago/Turabian StyleDelgado-García, Gabriel, Alejandro Pérez-Castilla, Francisco Javier Rojas-Ruiz, Ismael Navarro-Marchal, and Anabel Caballero-Villalta. 2025. "Validity of a User-Friendly Spreadsheet Designed for an In-Depth Analysis of Countermovement Bipodal Jumps" Applied Sciences 15, no. 3: 1519. https://doi.org/10.3390/app15031519
APA StyleDelgado-García, G., Pérez-Castilla, A., Rojas-Ruiz, F. J., Navarro-Marchal, I., & Caballero-Villalta, A. (2025). Validity of a User-Friendly Spreadsheet Designed for an In-Depth Analysis of Countermovement Bipodal Jumps. Applied Sciences, 15(3), 1519. https://doi.org/10.3390/app15031519