Article

Intelligent Optimization Pathway and Impact Mechanism of Age-Friendly Neighborhood Spatial Environment Driven by NSGA-II and XGBoost

School of Architecture and Art, North China University of Technology, Beijing 100144, China
*
Authors to whom correspondence should be addressed.
These authors contributed equally to this work.
Appl. Sci. 2025, 15(3), 1449; https://doi.org/10.3390/app15031449
Submission received: 5 December 2024 / Revised: 20 January 2025 / Accepted: 28 January 2025 / Published: 31 January 2025
(This article belongs to the Section Applied Physics General)

Abstract

:
A comfortable outdoor environment, like its indoor counterpart, can significantly enhance the quality of life and improve the physical and mental health of elderly populations. Urban spatial morphology is one of the key factors influencing outdoor environmental performance. To explore the interactions between urban spatial morphology and the outdoor environment for the elderly, this study utilized parametric tools to establish a performance-driven workflow based on a “morphology generation–performance evaluation–morphology optimization” framework. Using survey data from 340 elderly neighborhoods in Beijing, a parametric urban morphology generation model was constructed. The following three optimization objectives were set: maximizing the winter pedestrian Universal Thermal Climate Index (UTCI), minimizing the summer pedestrian UTCI, and maximizing sunlight hours. Multi-objective optimization was conducted using a genetic algorithm, generating a “morphology–performance” dataset. Subsequently, the XGBoost (eXtreme Gradient Boosting) and SHAP (Shapley Additive Explanations) explainable machine learning algorithms were applied to uncover the nonlinear relationships among variables. The results indicate that optimizing spatial morphology significantly enhances environmental performance. For the summer elderly UTCI, the contributing morphological indicators include the Shape Coefficient (SC), Standard Deviation of Building Area (SA), and Deviation of Building Volume (SV), while the inhibitory indicators include the average building height (AH), Average Building Volume (AV), Mean Building Area (MA), and floor–area ratio (FAR). For the winter elderly UTCI, the contributing indicators include the AH, Volume–Area Ratio (VAR), and FAR, while the inhibitory indicators include the SC and porosity (PO). The morphological indicators contributing to sunlight hours are not clearly identified in the model, but the inhibitory indicators for sunlight hours include the AH, MA, and FAR. This study identifies the morphological indicators influencing environmental performance and provides early-stage design strategies for age-friendly neighborhood layouts, reducing the cost of later-stage environmental performance optimization.

1. Introduction

The proportion of the global population aged 60 and above is steadily increasing and is projected to rise from 12% to 22% by 2050 [1]. This trend is particularly pronounced in China, where the proportion is expected to reach 33.0% by 2050 [2]. In this context, the importance of improving the health and well-being of the elderly is becoming increasingly apparent. The Chinese government has proposed relevant strategies and goals, emphasizing the urgency of improving the quality of life for older adults [3].
With the continuous increase in the number of facilities such as nursing homes, senior communities, and day-care centers [4], significant progress has been made in research on the indoor environments of senior care buildings. These studies cover various aspects, including barrier-free design [5], improvements in indoor thermal comfort [6], enhancements in indoor air quality [7], and the optimization of lighting environments [8], all aimed at improving the living experience and quality of life for the elderly. However, while improvements to indoor environments are important, focusing solely on them is insufficient to fully enhance the overall quality of life for the elderly. The outdoor environment also has a profound impact on their quality of life [9].
A comfortable outdoor environment helps increase the frequency and duration of outdoor activities for the elderly, promoting social interaction and recreational activities [10], thereby improving mental health, alleviating loneliness [11,12], and reducing the incidence of cognitive impairments and Alzheimer’s disease [13,14]. However, with aging, the elderly experience significant declines in physical function, immune capacity, cognitive abilities, and adaptability to environmental changes [15,16,17,18]. Their activity range gradually shrinks, yet their environmental demands continue to rise [19,20,21].
At the same time, psychological changes occur, making the elderly more prone to feelings of loneliness [22], isolation, and fear of abandonment by society [23]. Therefore, they are more eager to engage in social interactions [24] and participate in community activities [25] to contribute their value. In this process, outdoor spaces in residential areas become important venues for elderly individuals to engage in social activities, participate in events, and exercise [19,20].
Therefore, optimizing the comfort of outdoor environments in residential areas is not only key to improving the quality of life for the elderly but also an effective measure to address the challenges of population aging. Through scientific planning and design, creating pleasant outdoor environments for the elderly can significantly enhance their life satisfaction and well-being, while also contributing to social progress and development.
Based on the above context, this study employs a multi-objective optimization approach to explore optimal block morphology layouts. The study aims to reveal the nonlinear relationships between block morphology and environmental performance, identify key morphological indicators, and optimize early-stage block layout decisions to reduce the cost of later-stage retrofitting. The research findings will provide strategic support for designing elderly-friendly blocks and offer guidance for both the theory and practice of block morphology optimization through the integration of parametric modeling, performance simulation, and machine learning.

2. Literature Review

2.1. Impacts of Outdoor Environmental Performance on the Physical and Mental Health of the Elderly

A comfortable outdoor environment enhances the frequency and duration of outdoor activities among the elderly, which not only improves their physical functionality but also promotes social and recreational activities. This, in turn, improves mental health, alleviates loneliness, and reduces the incidence of diseases such as cognitive impairments and Alzheimer’s [26]. Previous studies have shown that the human perception of outdoor environments is influenced by factors such as sound, light, and thermal conditions, which collectively affect outdoor experiences and comfort [27]. Compared to other age groups, elderly individuals have lower metabolic rates, weaker sensitivity to temperature changes, and poorer adaptability to environmental changes. Suitable outdoor thermal conditions and adequate sunlight are crucial for encouraging outdoor activities among the elderly [28].
Unsuitable thermal environments can cause physiological illnesses and negatively impact the mental health of older adults. While such effects may not be immediately apparent, prolonged exposure to extreme temperatures can trigger cardiovascular diseases, respiratory issues, and other health risks, as well as increase the prevalence of psychological disorders among the elderly. A study in Australia found that elderly residents in care centers exposed to unsuitable thermal environments experienced significant adverse impacts on their mental health due to the loss of environmental control [29]. Additionally, research from South Korea indicated that, with every 1 °C rise in average daily temperature, suicide rates increased by 1.4%, with the elderly being particularly vulnerable to this trend [30].
Adequate sunlight duration is also critical for the elderly. Sufficient sunlight not only aids in the synthesis of vitamin D, which helps maintain bone health [31], but also improves mental health and reduces the incidence of depression [32]. A study demonstrated that morning sunlight exposure enhances sleep quality among the elderly. Conversely, insufficient sunlight increases the risk of falls and fractures [33]. Another study highlighted that, compared to low-latitude regions, high-latitude regions have significantly lower rates of depression and suicide, further underscoring the positive influence of sufficient sunlight on the mental health of older adults [34].

2.2. Urban Spatial Morphology and Outdoor Environmental Performance

Urban spatial morphology has been proven to be a critical factor influencing outdoor environmental performance. Research on the interaction between urban morphology and environmental performance dates back to the 1970s, when L. Martin from Cambridge University studied the relationship between aggregate urban spatial attributes and environmental performance [35]. Since then, the adoption of computational analysis techniques and numerical simulation software has significantly improved research efficiency and reduced costs in this field of study [35,36,37,38,39,40,41]. The quantitative study of environmental performance has seen an increasing diversification of influencing factors, multi-dimensional research scales, and diverse methodologies. The refined influence of spatial elements such as building form factors, density, floor–area ratio (FAR), sky view factor (SVF) [36], and building orientation on urban environmental performance has become a focal area of contemporary research [37,38,39].
B. Blocken’s team at the Eindhoven University of Technology proposed a universal computational fluid dynamics (CFD) framework for evaluating wind safety and wind comfort in urban and campus environments and exploring how building density and street width impact urban ventilation [37,38]. Edward Ng’s team at the Chinese University of Hong Kong investigated the effects of urban morphology factors, such as street network orientation, open spaces, building height, and podium height, on urban potential. They emphasized the importance of planning urban ventilation corridors and led the development of Hong Kong’s Air Ventilation Assessment (AVA) technical guidelines [39]. Jianlei Niu’s team at The Hong Kong Polytechnic University conducted field measurements to study factors influencing outdoor thermal comfort and quantified the effects of direct sunlight, shade, and wind turbulence on thermal sensation [40,41].
Hang Jian’s team at Sun Yat-sen University used CFD simulations of idealized urban building arrays to summarize how building layouts and height variations influence the efficiency of pollutant dispersion in urban areas [42]. Chao Yuan’s team at the Chinese University of Hong Kong applied ArcGIS to propose that maintaining land-use efficiency while controlling building density and height can improve SVF, thereby mitigating the urban heat island effect in high-density cities [43]. Yang Liu’s team at Xi’an University of Architecture and Technology demonstrated using field data that SVF has a decisive impact on solar radiation intensity in urban blocks, with its effect largely determined by the combined influence of street orientation and width [44]. Hong Jin’s team at the Harbin Institute of Technology examined the differential impacts of urban block morphology factors on outdoor temperatures, identifying building coverage, vegetation greening rate, surface material percentage, SVF, and building wall area as the main factors influencing temperature variations [45].
These studies fully demonstrate that urban spatial morphology has a significant impact on urban environmental performance, providing a wealth of theoretical and practical foundations for exploring the relationship between urban spatial morphology and environmental performance. However, certain limitations remain. Firstly, the research objects in these studies are primarily all-age or mixed-age neighborhoods, with optimization goals generally focused on improving overall urban environmental performance, such as enhancing wind environments, mitigating urban heat islands, or increasing air pollutant dispersion efficiency. These studies often fail to adequately address the specific needs of particular demographic groups. Secondly, while existing research focuses on various environmental factors, it lacks a systematic exploration of the unique needs of the elderly.
As emphasized in Section 2.1, older adults are more sensitive to outdoor environmental performance. Factors such as excessively high or low temperatures and uneven sunlight distribution significantly affect their willingness to go outdoors and engage in social interactions. Therefore, this study focuses on optimizing elderly neighborhoods, with a particular emphasis on the impact of urban morphology on sunlight conditions and thermal comfort. This research aims to provide theoretical support and practical guidance for creating more age-friendly neighborhoods. By addressing gaps in the existing literature regarding specific demographic needs, this study also deepens the understanding of morphology–environment interaction mechanisms.

2.3. Research Progress on the Relationship Between Urban Morphology and Environmental Performance

In recent years, studies have shown that urban morphology significantly impacts outdoor environmental performance, including solar potential [46,47], sunlight hours [46,47,48,49], outdoor thermal comfort [34,39,49,50,51], wind performance [52,53], and urban heat island (UHI) effects [54]. These studies have extensively explored the relationship between urban morphology and environmental performance, providing substantial empirical and theoretical support.
For instance, a study from Hong Kong conducted field experiments to analyze outdoor thermal comfort factors among 48 students on campus, quantifying the effects of direct sunlight, shading, and wind turbulence on thermal perception [49]. Another study incorporated residential morphology data (e.g., building orientation, height, and density) with meteorological data to simulate the impact of urban morphology on sunlight hours and solar potential, demonstrating that optimized slab-type buildings can significantly improve environmental performance [47]. Additionally, a comparative study between Barcelona, Spain, and Tianjin, China, revealed that, when the floor–area ratio (FAR) exceeds 3.1, both cities meet the daylighting standards [48].
These studies highlight the close relationship between urban morphology and environmental performance, particularly thermal comfort and sunlight hours. Notably, many studies have employed various analytical methods to explore the linear correlations between the two. For example, research in Iran used simulated Physiological Equivalent Temperature (PET) data from Mashhad City alongside urban morphology data to conduct multiple regression analyses, revealing their associations [50]. Another study developed multiple linear regression (MLR) models based on field-measured data to examine the relationship between built environment variables and thermal comfort indicators in hot regions [34]. Furthermore, stepwise multiple linear regression and partial least squares regression (PLSR) models have been used to analyze the linear relationship between urban morphology and UHI intensity [54].
However, traditional statistical models are often limited to analyzing linear relationships, constraining their ability to capture the complex phenomena observed in real-world scenarios. With the advancement of machine learning technologies, research has demonstrated that machine learning models are more effective in exploring the nonlinear associations between urban morphology and environmental performance. Particularly when sample sizes are limited, machine learning methods can deliver more reliable predictions.
Compared to traditional statistical analyses, such as correlation and regression analyses, the nonlinear relationship interpretation methods based on XGBoost and SHAP offer the following advantages:
(1)
Accuracy: On nonlinear datasets, XGBoost provides more precise predictions and interpretable analyses [55].
(2)
Handling high-dimensional data: XGBoost includes built-in regularization, effectively managing high-dimensional data and preventing overfitting [56]. In contrast, traditional methods require manual adjustment of regularization parameters and often face overfitting or computational complexity in high-dimensional cases.
(3)
Scalability: As an efficient machine learning algorithm, XGBoost can handle large-scale datasets, while SHAP’s feature importance analysis supports various model types and is capable of managing large-scale data, making it highly scalable [55,56].
These advantages make XGBoost and SHAP effective tools for studying complex nonlinear relationships, providing a more robust methodological foundation for analyzing the associations between urban morphology and environmental performance.
Many scholars emphasize that machine learning methods, particularly boosting algorithms, outperform traditional regression models, especially in capturing complex (nonlinear) relationships between independent and dependent variables. For example, a study using Gradient Boosting Decision Trees analyzed the impact of three community-level built environment factors on CO2 emissions, finding that proximity to public transport, employment density, and land-use diversity were key determinants [57]. Another study in China employed eXtreme Gradient Boosting to investigate the relationship between built environment characteristics and active travel for work and shopping. The results indicated that all built environment variables exhibited nonlinear associations with active travel, with relationships often showing an inverted U-shape or V-shape for work trips, while shopping trips displayed more complex patterns [58].
Therefore, this study will adopt the XGBoost [55] machine learning model and the SHAP [56] interpretability framework to investigate the nonlinear relationship between block morphology and environmental performance. Moreover, other studies have applied machine learning methods to examine relationships between the environment and human behavior [59,60], human health [61], and building energy consumption [62], further demonstrating the extensive potential of machine learning in analyzing complex environmental relationships.

2.4. Research Objectives and Significance

The studies in Section 2.1, Section 2.2 and Section 2.3 have thoroughly discussed the impact of outdoor environmental performance on elderly individuals, emphasizing the critical role of outdoor thermal environments and sunlight hours in promoting both the physical and mental health of the elderly. Additionally, these studies highlight the positive effects of optimizing block spatial morphology on improving outdoor environmental performance. From a methodological perspective, performance-driven design workflows based on parametric design platforms such as Rhino/Grasshopper have been widely recognized for their significant potential in multi-objective optimization tasks for outdoor environmental performance. These existing studies have facilitated the precise identification of spatial morphological indicators that may influence outdoor environmental performance, enabling architects to uncover the intrinsic relationships between “morphology and environment”. This, in turn, provides valuable design decision-making support for a range of applications, including urban design, architectural design, and urban renewal.
This study focuses on the outdoor environmental performance of elderly-oriented blocks. It applies the performance-driven workflow of “morphology generation–performance evaluation–morphology optimization” to enhance outdoor environmental performance for elderly groups. Using the combinations of various architectural forms within different prototypical blocks as decision variables determined by multi-objective optimization, this study aims to maximize the winter pedestrian UTCI (UTCI-W), minimize the summer pedestrian UTCI (UTCI-S), and maximize sunlight hours (SHs) as objective functions. It explores block morphology layouts under optimized outdoor environmental performance conditions, providing design references for elderly-friendly block layout schemes.
Furthermore, considering the advantages of machine learning over traditional regression methods in offering more reliable and accurate predictions, this study introduces the interpretable machine learning algorithm XGBoost (eXtreme Gradient Boosting) to uncover the nonlinear relationships between block spatial morphology and outdoor environmental performance. By identifying spatial morphological indicators that may affect the outdoor environmental experience of elderly individuals, this research combines parametric modeling and machine learning approaches to optimize elderly-friendly block morphology and achieve the high-precision identification of block morphology indicators influencing outdoor environmental performance.
The outcomes provide early-stage design decisions for block layout, reducing costs associated with later-stage environmental performance optimization and retrofitting. This research offers valuable references for the planning and layout of elderly-friendly blocks, improving the outdoor environment for elderly residents, enhancing their quality of life, and promoting the physical and mental health of the elderly population.

3. Methodology

3.1. Overview of the Framework

This study can be divided into six steps, as shown in Figure 1: (1) Extraction of typical block morphology prototype models: a basic data survey was conducted on 340 typical elderly residential buildings and their surrounding blocks in Beijing, gathering fundamental data such as building types and block scales, which will serve as the basis and constraints for the subsequent parametric block morphology intelligent generation. (2) Parametric block morphology intelligent generation: based on the parametric modeling platform Rhino/Grasshopper, and using the survey data from Step 1 as constraints, a parametric block morphology intelligent generation mechanism is proposed, and a parametric block morphology generation model is constructed. (3) Outdoor environmental performance simulation for the block: optimization objectives are determined, and performance evaluation plugins such as Ladybug Tools 0.0.68 [63] and Butterfly 0.0.05 [64] within the Rhino 7/Grasshopper platform are used to perform batch simulations of the block morphology generation model from Step 2. (4) Multi-objective optimization of outdoor environmental performance: the multi-objective optimization tool Wallacei V2.7 [65], based on the Rhino/Grasshopper platform, is used to automatically optimize outdoor environmental performance indicators by controlling the parameters of the block morphology generation model from Step 2. (5) Recording optimization results and morphology indicator calculation: the data-recording plugin TT Toolbox 1.8 [66] is used to record the optimized Pareto front, and the Colibri tool is used to calculate the spatial morphology indicators corresponding to the Pareto front, resulting in an optimized “morphology–environment” dataset for the block. (6) Exploration of the “morphology–environment” impact mechanism: the foundational dataset obtained in Step 5 is used, and the interpretable machine learning algorithm XGBoost 2.1.3 (eXtreme Gradient Boosting) is introduced to explore the nonlinear relationships between block spatial morphology and outdoor environmental performance.

3.2. Study Area

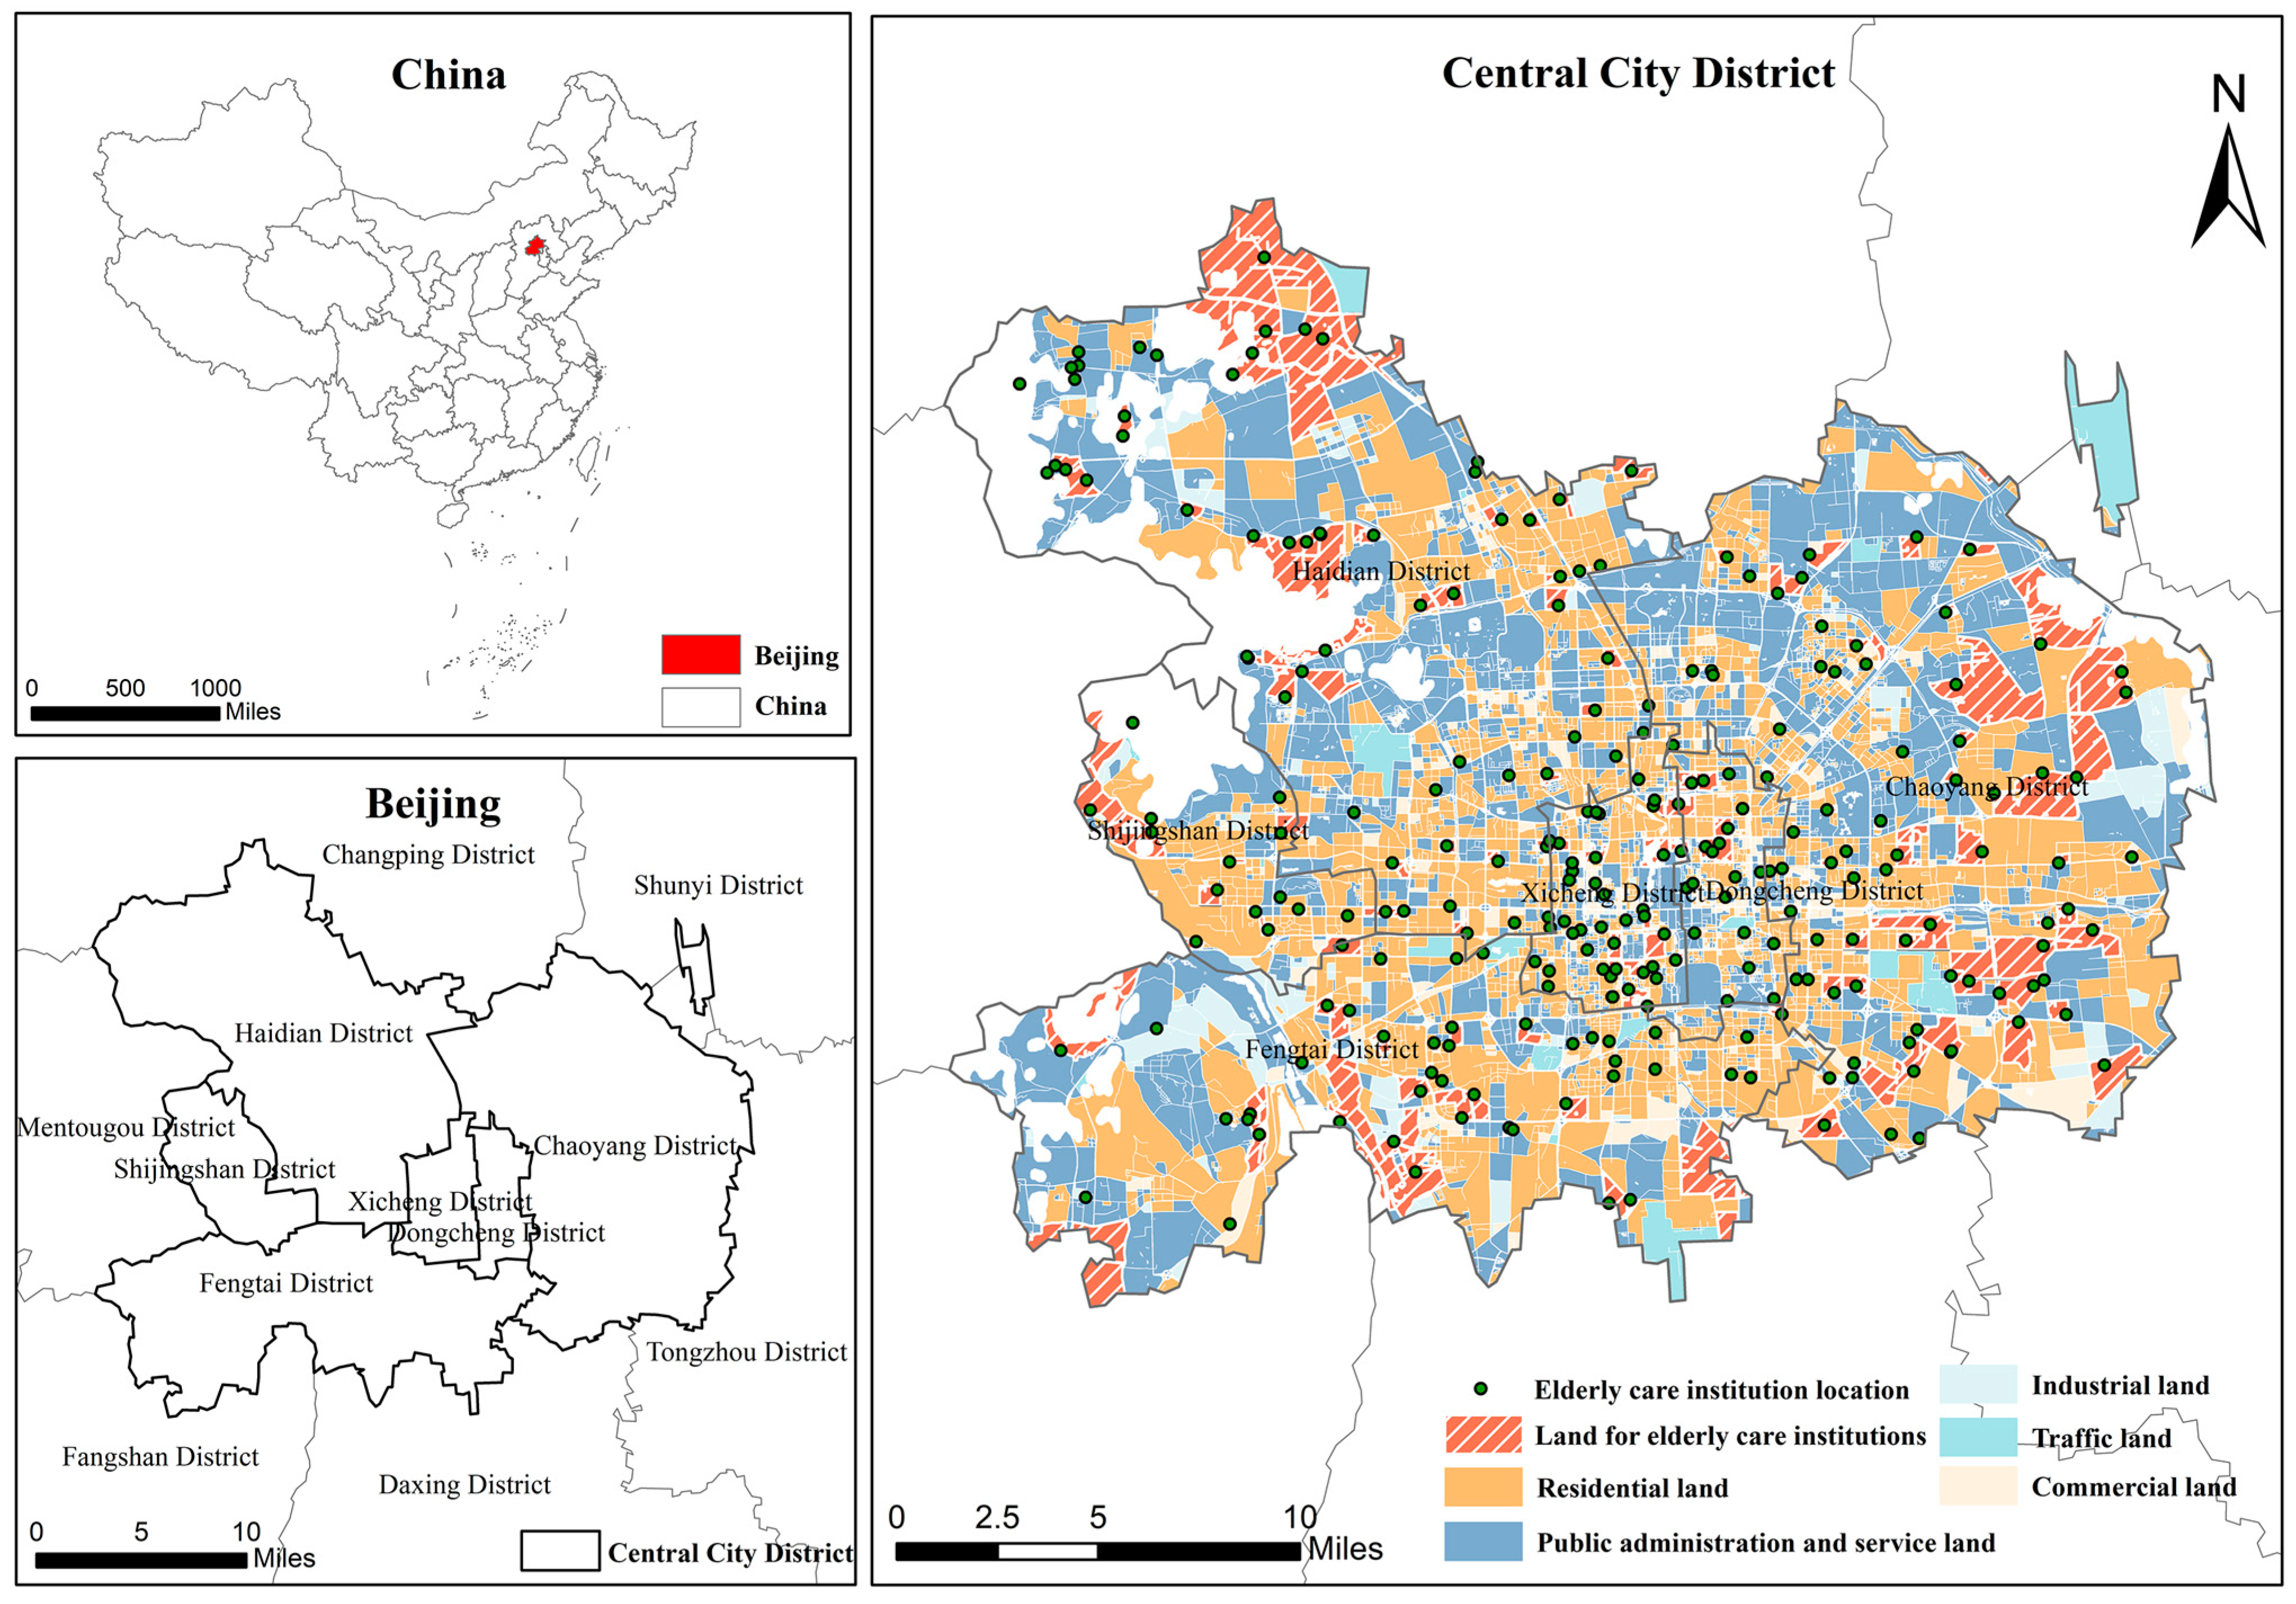
The typical elderly residential building morphology survey area selected for this study is Beijing, China (Figure 2). Beijing is located in the continental monsoon climate zone, characterized by short spring and autumn seasons, cold winters, hot and humid summers, large annual temperature differences, and low levels of precipitation.
On 11 October 2024, the Beijing Civil Affairs Bureau released the “2023 Beijing Aging Development Report” [67], highlighting a growing elderly population. In 2023, Beijing’s residents aged 60 and above reached 4.948 million, accounting for 22.6% of the total population, 1.5 percentage points above the national average. This marked a 6.4% increase from 2022, the fastest growth in eight years. To address aging, the Beijing government implemented various measures, including transforming eleven medical institutions into elderly care centers and six into palliative care centers. By the end of 2023, the city operated 1498 community elderly service stations, 301 care centers, and 571 elderly institutions, providing a total of 112,000 beds.
In terms of building an elderly-friendly society, in 2023, the city vigorously promoted the renovation of old neighborhoods as part of people’s livelihood projects. A total of 1043 new elevators were installed in old buildings, with 693 completed, bringing the total number of elevator installations to 3550. Over 32,000 elderly individuals benefited from these improvements.
In summary, compared with other cities, Beijing has a complex climate and a large and widely distributed elderly population, making the improvement of the outdoor environmental performance of elderly residential areas critical. In addition, Beijing’s high level of urbanization, well-developed infrastructure, and diverse types of elderly care buildings provide ample samples for the survey of typical elderly street morphology. Furthermore, the high-rise, high-density urban environment significantly impacts outdoor thermal conditions, wind conditions, and daylight hours, offering an ideal setting to verify the positive effect of urban spatial morphology optimization on improving outdoor environmental performance.

3.3. Parametric Urban Block Morphology Intelligent Generation

This study investigates 340 typical elderly residential buildings in Beijing, covering basic information such as building types, building heights, block scale, and road dimensions. Through the survey, 9 types of elderly residential buildings were identified (Figure 3). Based on building type, they were categorized into point-type (P-1, P-2, P-3), slab-type (S-1, S-2, S-3), and enclosed-type (C-1, C-2, C-3) buildings [48,68]. They were also divided into three building height categories, as follows: 1–3 stories (S-1, C-2, P-1), 4–9 stories (S-2, C-1, C-3), and 10–18 stories (S-3, P-2, P-3).
Based on the scale of typical elderly residential blocks, a 90 × 90 m square unit was selected as the basic block (with a street width of 10 m). A 330 × 330 m urban block was generated through a 3 × 3 modular configuration, with 9 basic blocks numbered from 0 to 8. Each basic block was required to contain only one building-type unit. In this study, a total of 10 building types were available for combination, including the 9 types of elderly residential buildings identified in the survey and 1 type of urban public space. A parametric model of the block morphology was constructed within the Rhino/Grasshopper platform. By combining different building forms in different basic blocks, a diversified parametric urban block model was generated. Figure 4 shows the process of generating the urban block parametric model by combining the 9 building types and 1 public space extracted in this study.
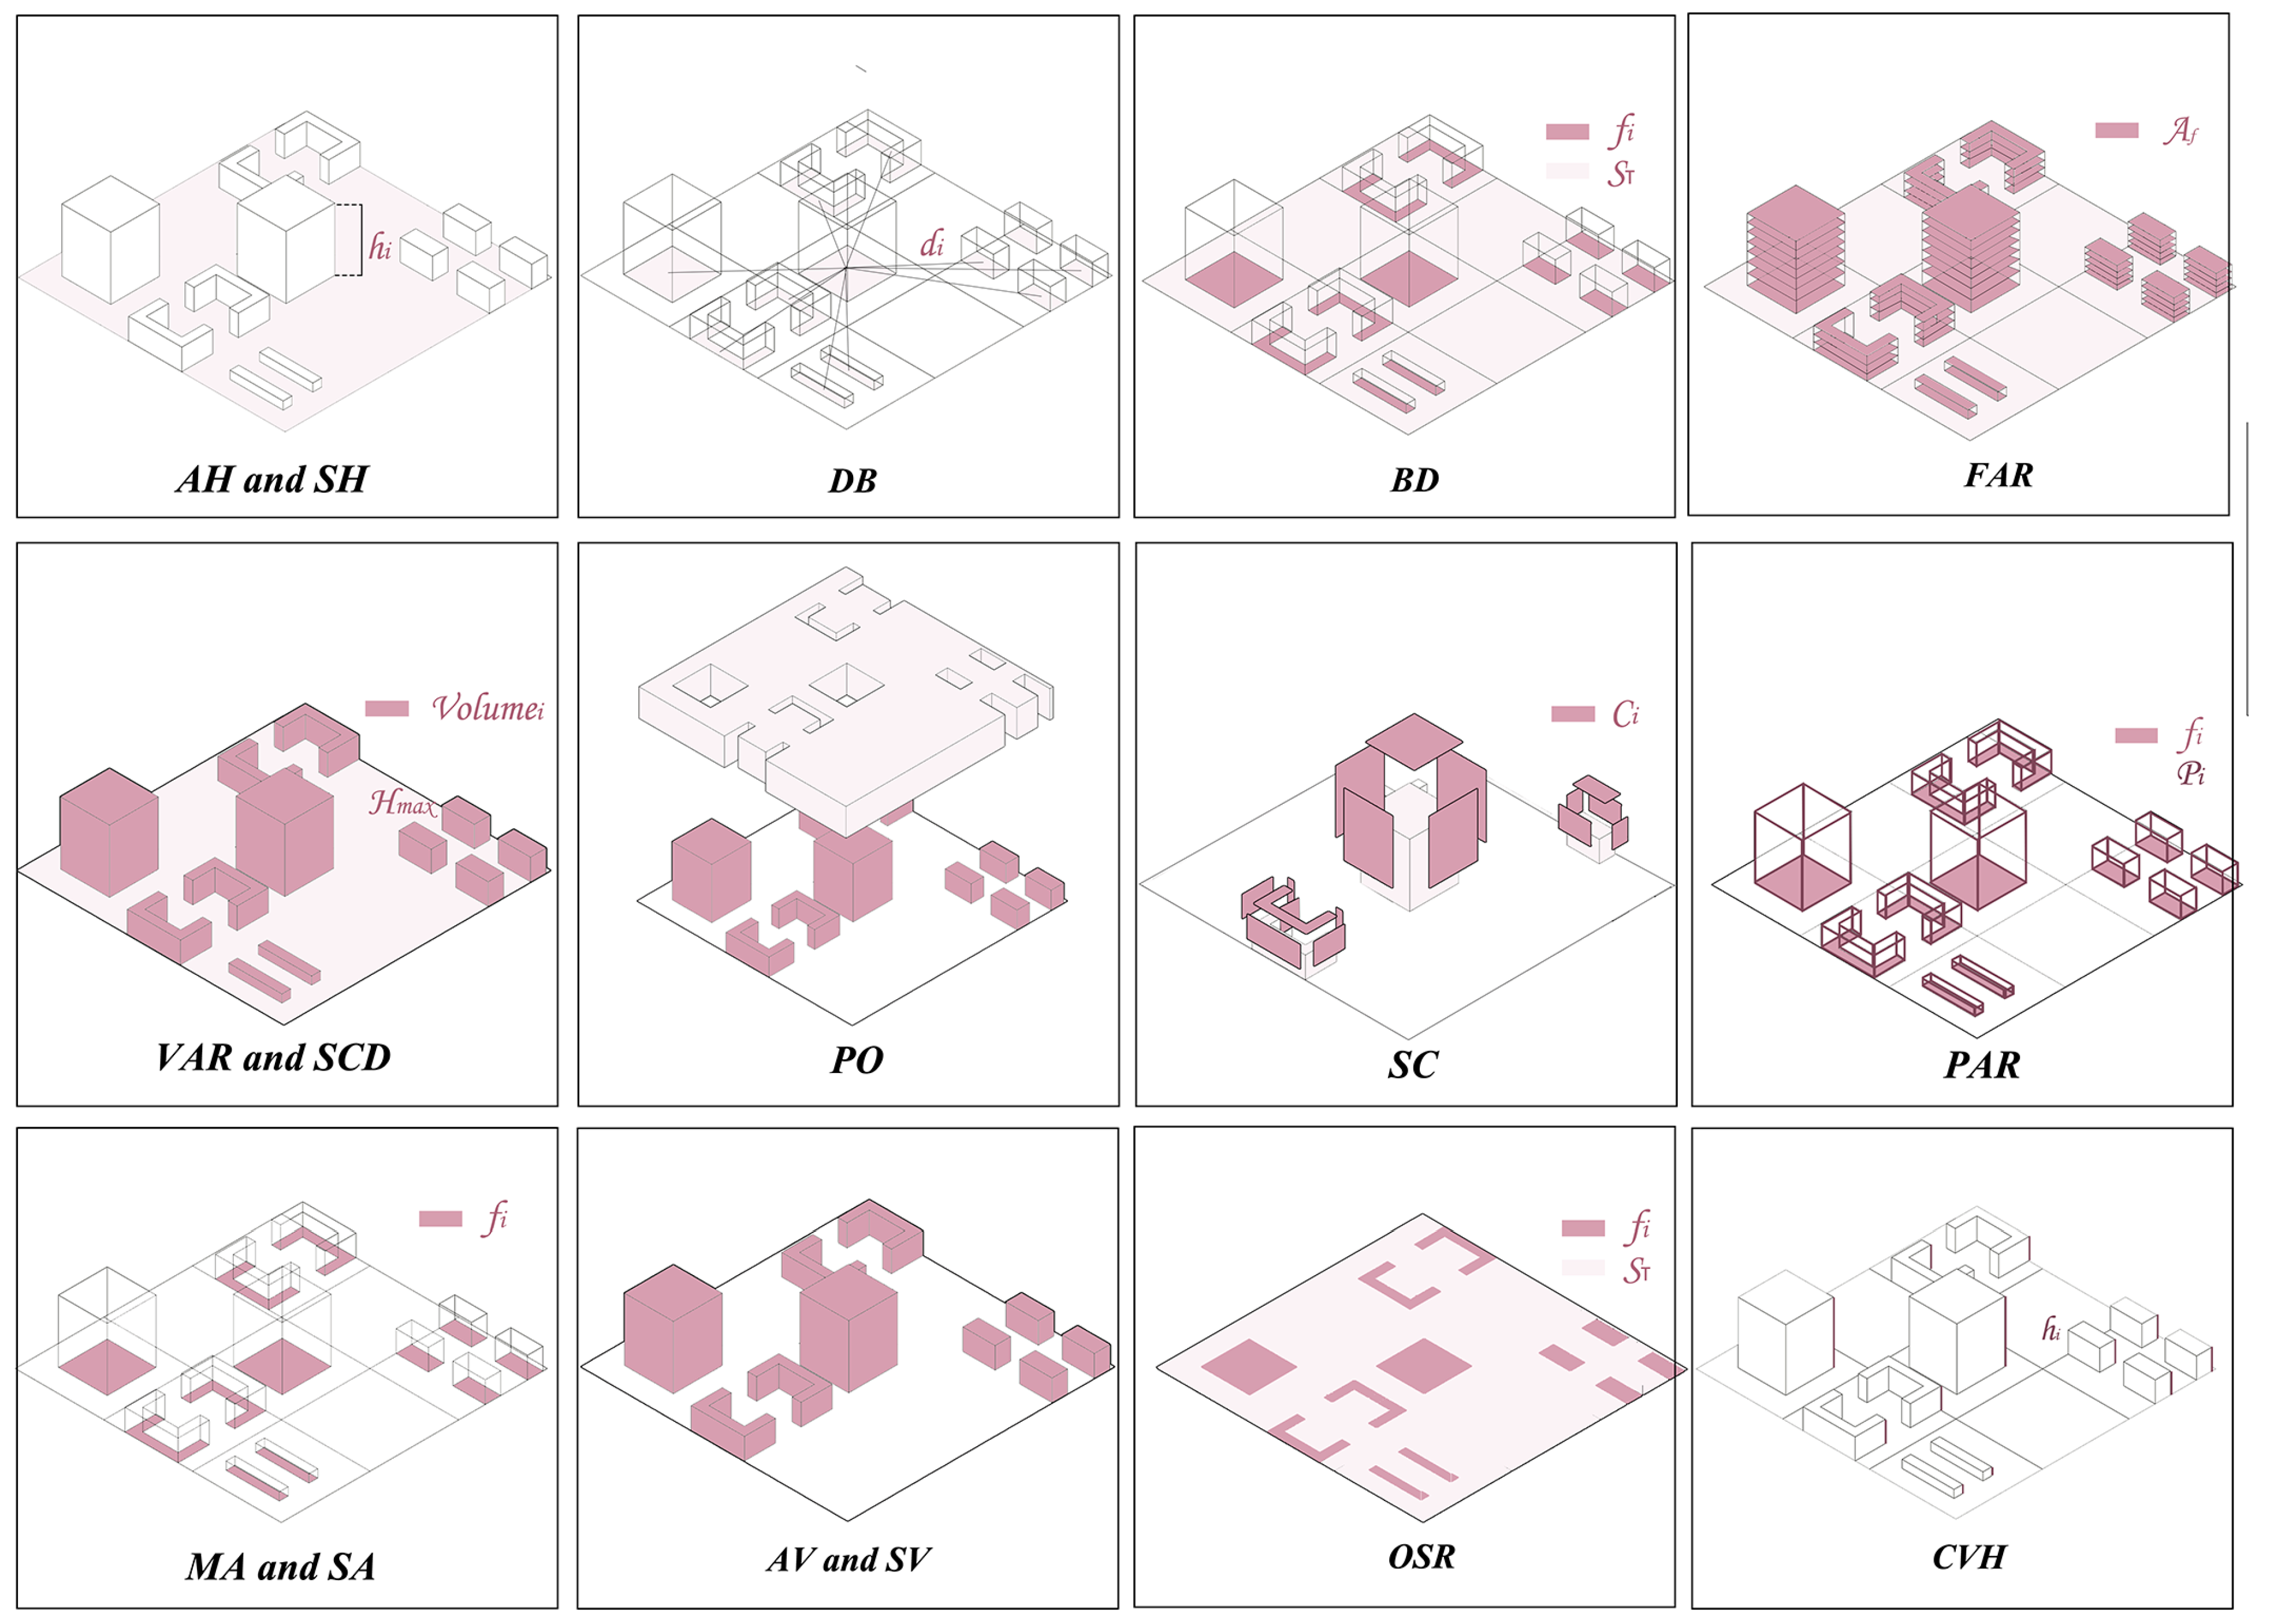
Sixteen morphological indicators, which have been proven in previous studies to be related to outdoor environmental performance, were selected to describe the generated parametric urban block models. These included average building height (AH), standard deviation of building height (StdH), Distance Between Buildings (DB), building density (BD), floor–area ratio (FAR), Volume–Area Ratio (VAR), Space Crowding Density (SCD), porosity (PO), Shape Coefficient (SC), perimeter–area ratio (PAR), Mean Building Area (MA), Standard Deviation of Building Area (SA), Average Building Volume (AV), Standard Deviation of Building Volume (SV), Open Space Ratio (OSR), and Coefficient of Variation for Building Height (CVH) [48,69,70]. The block morphology information described by these indicators is shown in Figure 5.
AH and StdH refer to the average building height and the standard deviation of building heights within the block, respectively. BD and FAR are critical indicators for urban block morphology and are essential in early urban planning. BD measures the proportion of the block area covered by buildings, while FAR reflects the total building area relative to the block area. High-density and high-intensity development often reduce wind speed, impacting thermal comfort. DB, calculated as the average distance between building centers, reflects block compactness or sprawl. Its impact on thermal comfort and sunlight exposure has received limited attention. VAR, the ratio of total building volume to site area, indicates land-use efficiency. While a higher VAR suggests better land utilization, excessive values can create environmental issues. SCD, the ratio of total building volume to the product of block area and tallest building height, measures indoor space efficiency. PO, the void-to-canopy volume ratio, assesses ventilation potential. SC, the surface-to-volume ratio of buildings, evaluates form complexity and energy efficiency, with a higher SC potentially increasing heat transfer. PAR, the perimeter-to-area ratio, highlights block compactness and permeability, with higher values indicating denser blocks. MA and SA assess the horizontal scale and variability of building volumes, influencing environmental stability. AV and SV reflect building volume characteristics. A higher AV can lead to increased shading, while a greater SV indicates variability that may affect wind conditions. OSR, the ratio of open to built-up areas, promotes better ventilation and cooling with higher values. CVH measures building height variation, with higher values indicating more uneven height distributions. Table 1 shows the calculation formulas for these morphological indicators.

3.4. Simulation of Outdoor Environmental Performance in Urban Blocks

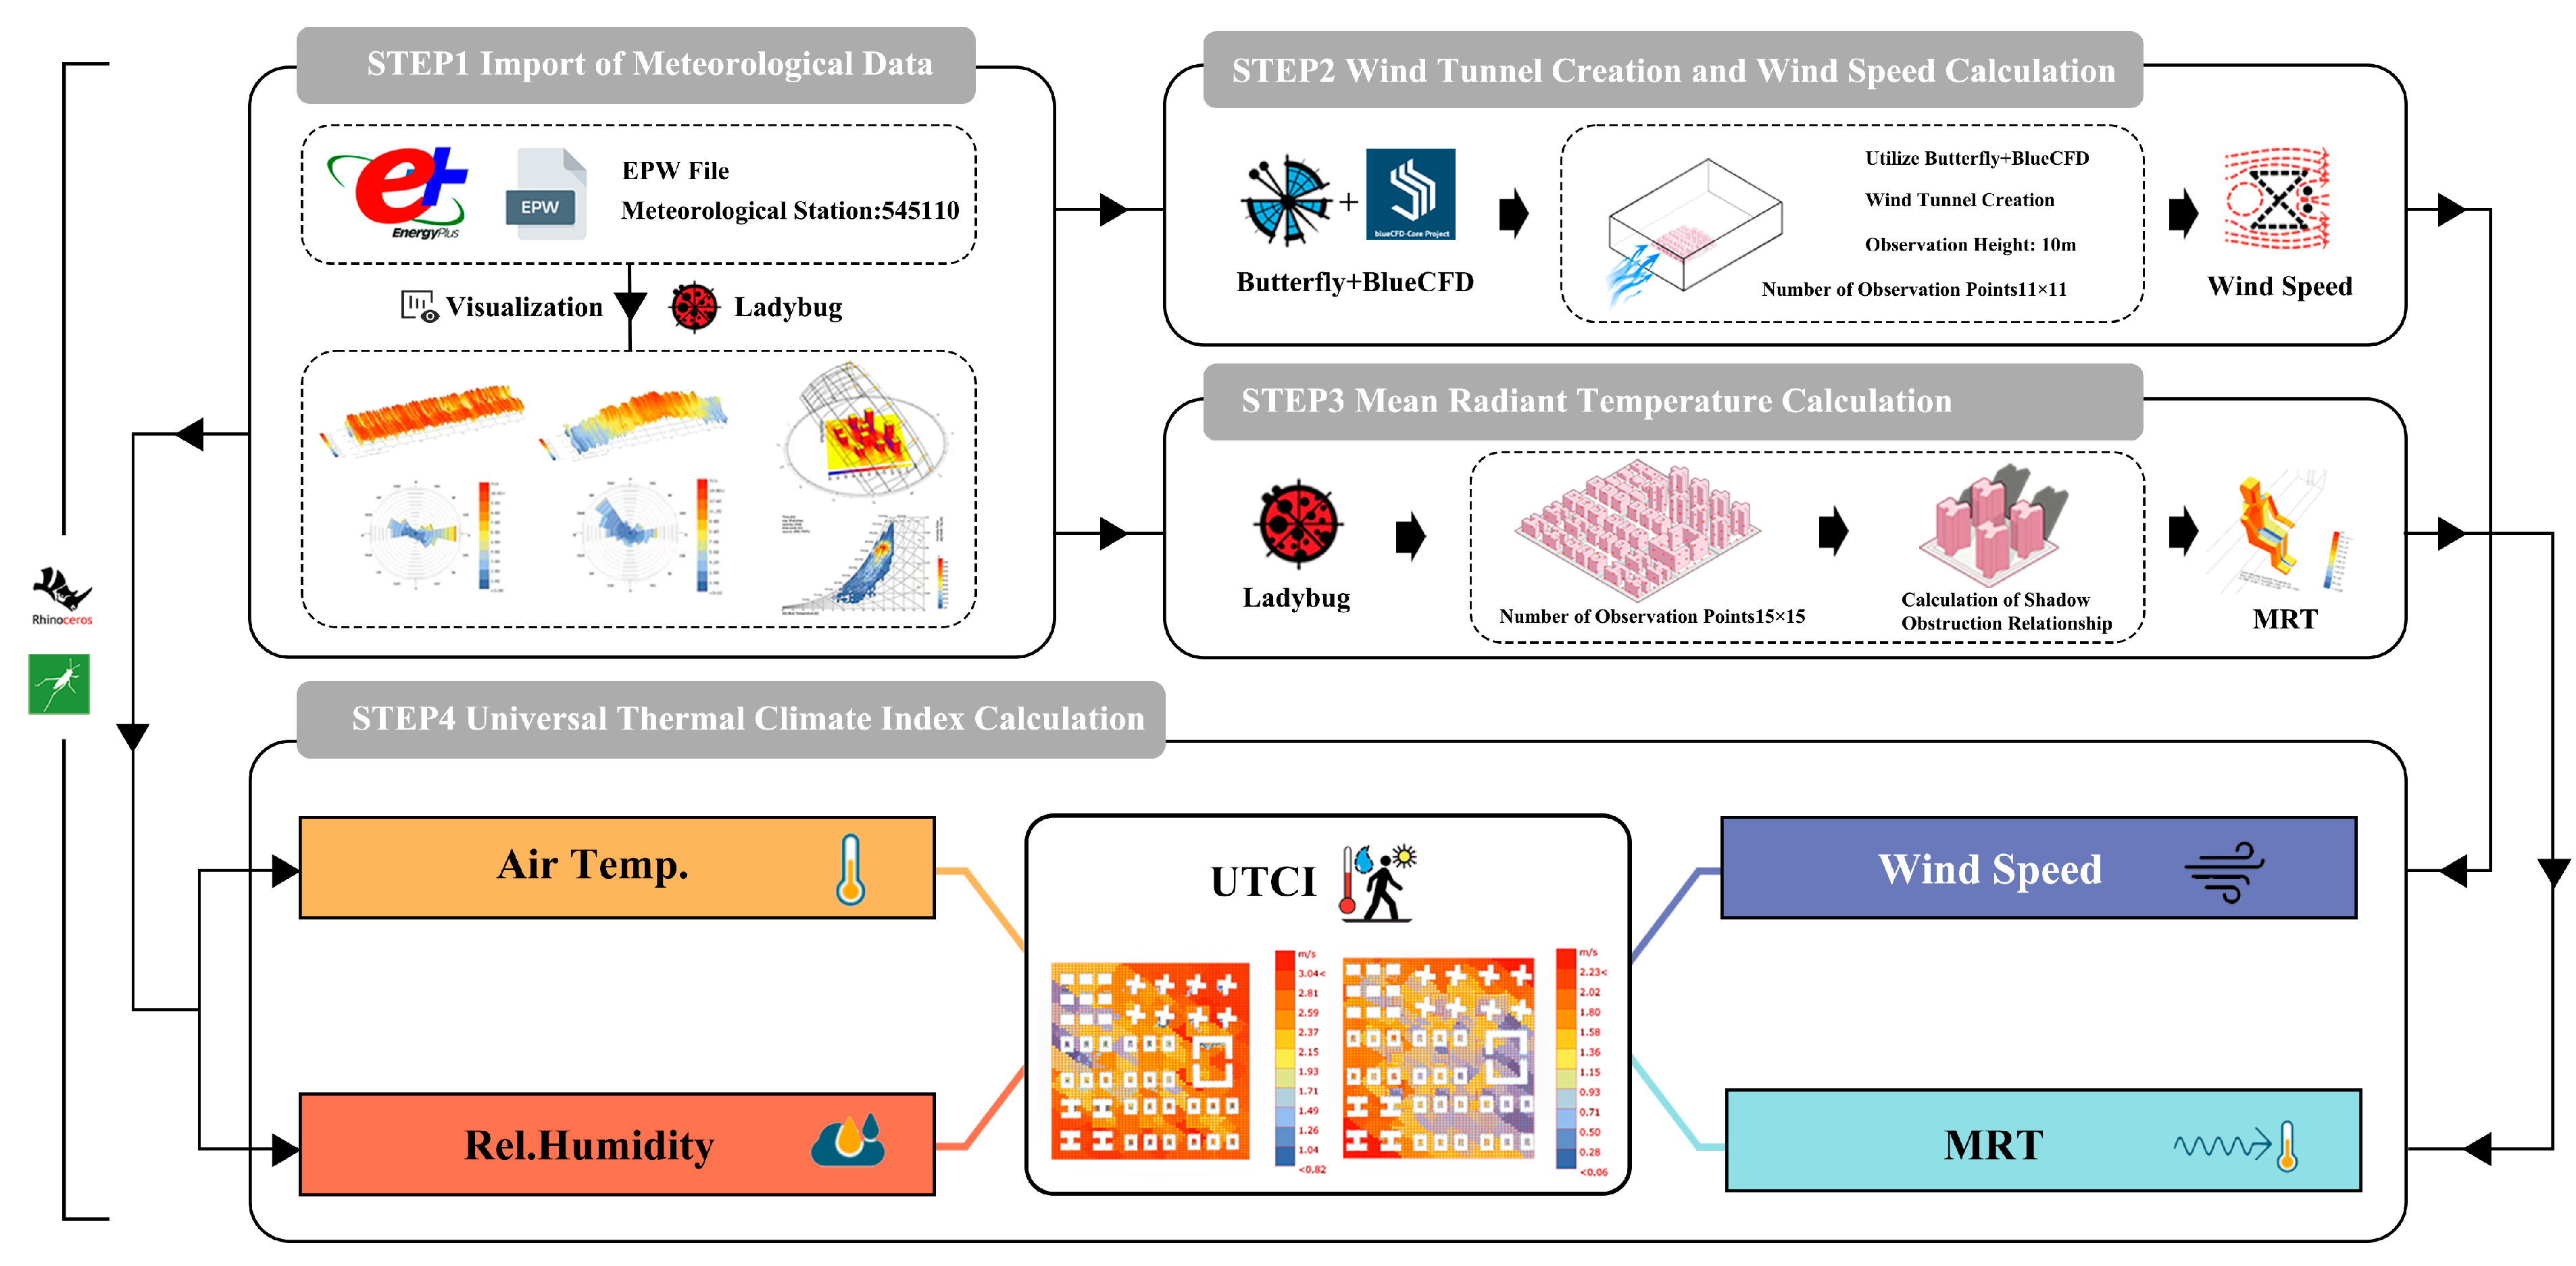
After completing the intelligent generation of parametric forms for elderly-oriented urban blocks, the subsequent step involved batch simulation of the outdoor environmental performance of the generated parametric models. Based on the relevant literature [71,72,73], two outdoor environmental performance indicators that significantly influence the outdoor activity experience of elderly individuals were selected as simulation targets: the Universal Thermal Climate Index (UTCI) at pedestrian height and sunlight hours (SHs). This study used the Ladybug Tools and Butterfly plugins, which are built-in tools of the Rhino/Grasshopper platform, to perform environmental performance simulations. As a widely recognized and accurate simulation engine in the field of building multi-objective optimization, the simulation results of Grasshopper [48,68,70] have been extensively validated and widely applied in urban environmental performance research. To further ensure the accuracy of the simulation results, the authors conducted detailed parameter tuning during the simulation process and employed targeted strategies to enhance the simulation precision. The specific procedures and parameter settings will be presented in detail in this section. The specific flowchart can be seen in Figure 6.

3.4.1. Simulation of Universal Thermal Climate Index (UTCI) at Pedestrian Height

The Universal Thermal Climate Index (UTCI) is an index used to describe human thermal comfort in outdoor environments [72]. It is based on human physiological research and the thermal radiation balance theory and assesses the human thermal stress response by integrating environmental parameters [74]. The UTCI is one of the most widely used thermal comfort assessment indicators internationally. Therefore, the UTCI is crucial for evaluating the impact of outdoor environments on human health. The calculation formula for UTCI is as follows:
U T C I = f ( T a ;   M R T ; v 10 ; R H )
where T a represents the air temperature, M R T denotes the mean radiant temperature, v 10 indicates the wind speed, and R H stands for relative humidity [75].
The numerical simulation of the UTCI for urban blocks involved several key parameters. First, the basic environmental data required for UTCI calculation, such as air temperature and relative humidity, were obtained from the EPW meteorological data of Beijing (weather station ID: 545110). Second, to acquire the wind data needed for UTCI calculation, the wind speed and direction data collected in the first step were imported into the virtual wind tunnel simulation module of the Butterfly plugin to ensure that the simulation process aligned with actual climatic conditions. Specifically, the Butterfly plugin was used as an interface to construct a virtual wind tunnel in BlueCFD, providing the necessary support for wind speed simulation. In this study, based on the actual environmental characteristics of Beijing, the surface roughness length was set to 0.5, and the wind tunnel calculation domain boundary was defined as 5Hmax (where Hmax refers to the maximum building height within the block). The wind environment detection plane was set at a pedestrian height of 1.5 m, with 121 monitoring points (11 × 11) arranged within the plane. Both the top and side boundaries were configured as symmetric boundary conditions to ensure that the wind speed, direction, and flow characteristics matched the actual environmental conditions.
The third step involved calculating the mean radiant temperature (MRT), which represents the actual temperature of an object influenced by radiant heat. The Radiance plugin within Ladybug Tools was utilized to calculate the mean radiant temperature of building surfaces and the surrounding environment. For this study, MRT monitoring points were placed at a height of 1.5 m, with a total of 225 points (15 × 15).
Finally, the average air temperature, MRT, wind speed, and relative humidity data for the selected dates were input into the UTCI module of the Ladybug plugin for calculation. Extreme heat and cold weeks were chosen as the calculation periods to comprehensively evaluate environmental performance under different climatic conditions.

3.4.2. Sunlight Hours (SHs)

SHs refer to the duration of direct sunlight at a given location over a specific period. For urban blocks, evaluating sunlight hours helps assess the sunlight exposure of different areas within the city, providing a basis for urban planning and architectural design.
Using the Ladybug plugin, the solar path was constructed based on the site’s geographic location to determine the hourly solar altitude and azimuth angles. Beijing’s EPW data served as the meteorological input for simulations, with 22 December (the winter solstice) selected as the simulation date. In this study, the simulation grid was applied to the outdoor ground surface within the block. To balance simulation time and accuracy, the grid size was set to 2 m. Finally, the average sunlight hours of all reference points were calculated to evaluate the solar performance of the entire block.

3.5. Multi-Objective Optimization of Outdoor Environmental Performance

To automate the selection of “optimal solutions” for urban block designs achieving “optimal environmental performance”, this study employed the Wallacei optimization tool on the Rhino/Grasshopper platform for multi-objective optimization of environmental performance. Wallacei primarily utilizes the NSGA-II algorithm [76], a common multi-objective genetic algorithm, which applies non-dominated sorting and crowding distance strategies to search for Pareto frontiers.
Optimization problems generally consist of objective functions, decision variables, and constraints. In this study, considering the climatic conditions of Beijing, the following three objective functions were selected:
(1)
Maximizing winter pedestrian UTCI (UTCI-W): to reduce the impact of cold temperatures and winds on elderly people’s outdoor activities in winter.
(2)
Minimizing summer pedestrian UTCI (UTCI-S): to mitigate the adverse effects of high temperatures on physical and mental health in summer.
(3)
Maximizing sunlight hours (SHs): to extend the duration of outdoor activities for the elderly.
The mathematical expressions for these optimization objectives are given in Equations (2)–(4), as follows:
M i n f U T C I S = i = 1 n = 10 g i ( x 1 , x 2 , , x k )
M a x f U T C I W = i = 1 n = 10 g i ( x 1 , x 2 , , x k )
M a x f S H = i = 1 n = 10 g i ( x 1 , x 2 , , x k )
where M i n f U T C I S , M a x f U T C I W , and M a x f S H , represent the three optimization objectives. The variables x 1 , x 2 , , x n represent the k dimensional design variables in this study, and g i ( x ) denotes the constraint function.
The decision variables were the combinations of different building forms on various prototype blocks. Using the NSGA-II algorithm, it was possible to automatically identify block combinations that met the three optimization objectives from up to 109 possible combinations. Since the study employed an idealized model for testing, constraints were simplified. In real-world optimization scenarios, constraints such as floor–area ratio, building density, fire safety distance, and sunlight spacing would need to be defined according to higher-level planning requirements.
In addition, the default setting of Wallacei is to minimize the objective function. Since the design objectives for “winter pedestrian UTCI” and “sunlight hours” are opposite to the default setting, these two objective functions are treated as negative values during the optimization process to ensure the accuracy of the results. The NSGA-II algorithm’s parameter settings are shown in Table 2.

3.6. Exploring the “Morphology–Environment” Interaction Mechanism

The Pareto front of the optimized solutions was recorded using the TT Toolbox, a data-recording plugin on the Rhino/Grasshopper platform. Subsequently, the Colibri tool was used to calculate spatial morphology indicators corresponding to the Pareto front, resulting in three datasets linking “morphology–environment” interactions for optimized elderly residential blocks.
To further investigate the interactions between urban spatial morphology and outdoor environmental performance, this study introduced the interpretable machine learning algorithm XGBoost (eXtreme Gradient Boosting) to reveal nonlinear relationships among variables.
XGBoost is a decision tree-based algorithm that uses ensemble learning to combine multiple weak learners into a strong learner. Compared to other machine learning algorithms, XGBoost demonstrates superior performance and flexibility in handling nonlinear relationships and complex datasets [57,77]. SHAP is a method used to interpret model predictions based on Shapley values from game theory. SHAP evaluates the contribution of each feature to the model’s predictions, providing both global feature importance rankings and local prediction explanations [78].
The combination of XGBoost and SHAP for nonlinear interpretation enables an in-depth exploration of the complex nonlinear relationships between urban spatial morphology and outdoor environmental performance [58]. This approach accurately identifies urban spatial morphology indicators that may influence the outdoor activity experience of elderly residents, offering valuable insights for planning and designing elderly-friendly neighborhoods. By creating better outdoor environments for the elderly, this study contributes to improving their overall quality of life.
This study employed three datasets, UTCI-S, UTCI-W, and SHs, for machine learning modeling. The data were split into training and testing sets in a ratio of 70% to 30%. Automated hyperparameter tuning was conducted using the efficient global optimization algorithm TPE (Tree-structured Parzen Estimator) based on Bayesian optimization. Table 3 records the R2 values of the training and testing sets for the three datasets.

4. Results and Discussion

4.1. Multi-Objective Optimization Results of Outdoor Environmental Performance

4.1.1. Optimization Process

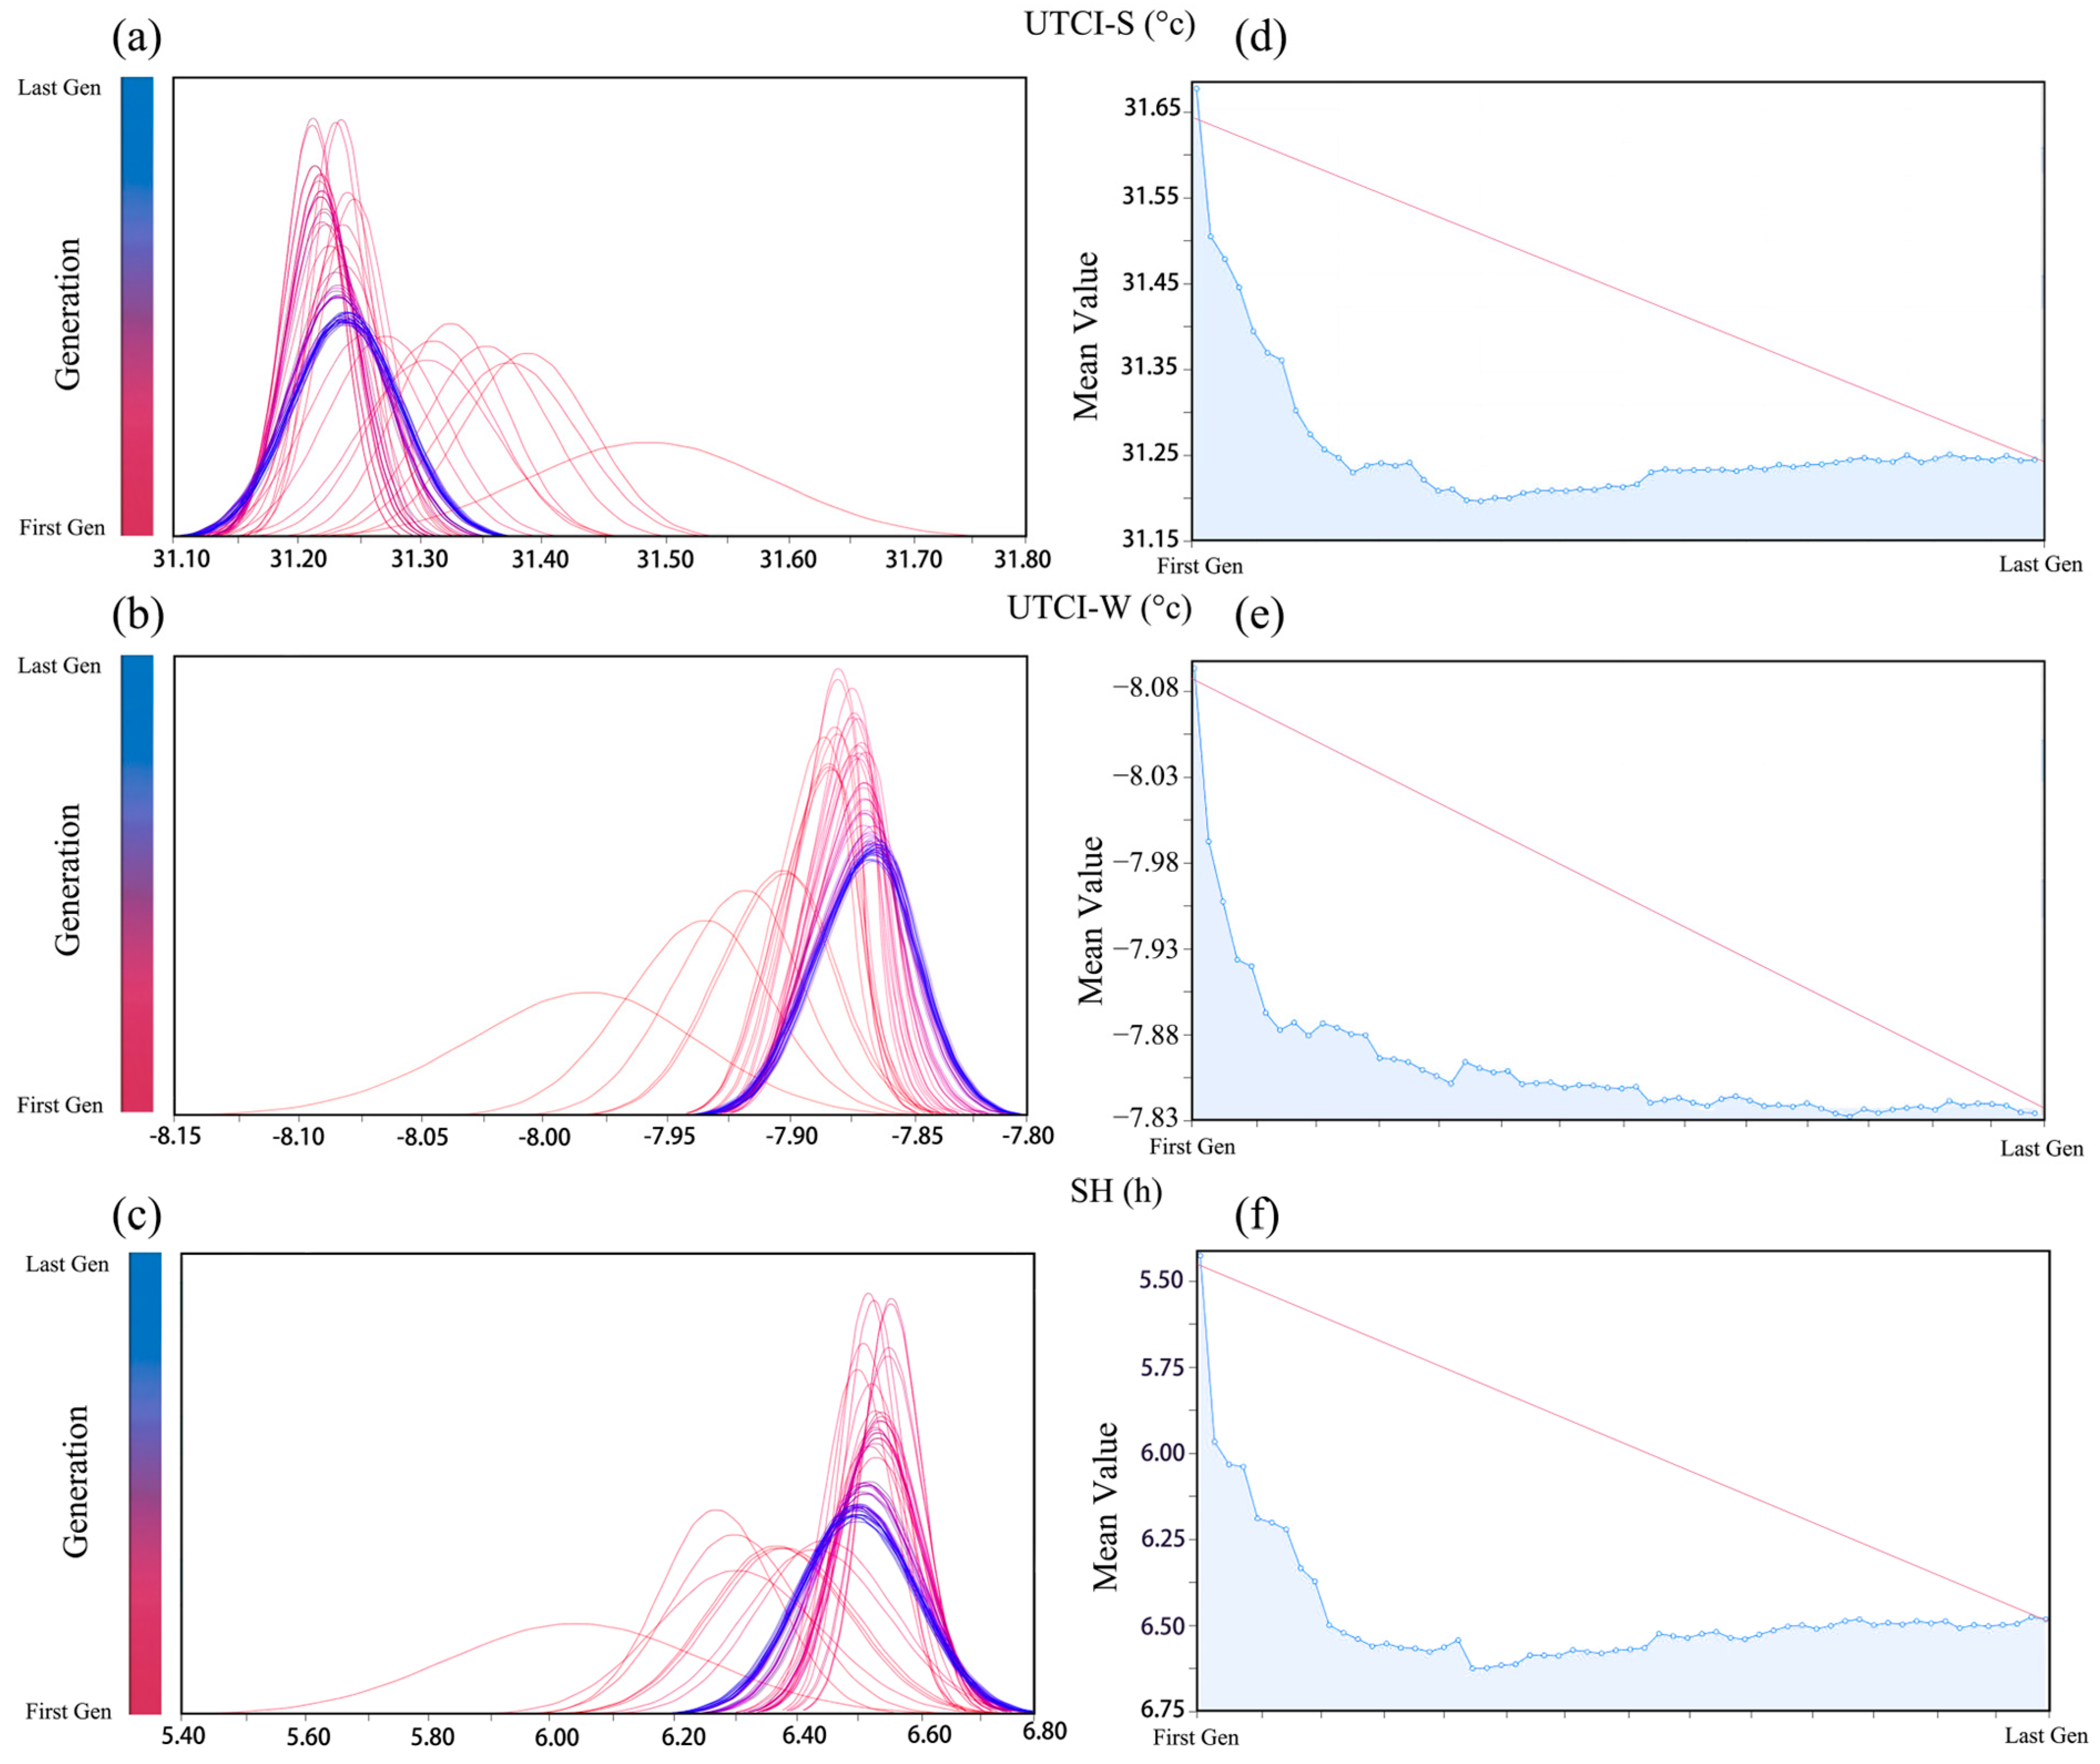
Figure 7 illustrates the iterative changes in the three objective functions during the optimization process. Figure 7a–c display the standard deviation (SD) variations for each objective function. Each curve represents the data from a generation of samples, where the highest point on the horizontal axis corresponds to the average objective value of that generation. The color transitions from red (initial generation) to blue (final generation). The width of the curve reflects the standard deviation, with narrower curves indicating a more concentrated distribution of objective values.
As shown in Figure 7a, the average objective value of the samples gradually decreases with iterations, the standard deviation diminishes, and the objective values converge. Overall, Figure 7a–c indicate significant differences between the initial and final values of the three optimization objectives, demonstrating a remarkable optimization effect and an increase in homogeneity among the final generations of samples.
Figure 7d–f further demonstrate the convergence of the genetic algorithm. Each blue circle in the figures represents the average objective value of 50 experiments in a single iteration, while the blue line shows the trend of the objective values across generations. The red dashed line represents the fitted trendline.
As shown, the objective value UTCI-W exhibited the most stable optimization process, with the average value increasing from −8.08 to approximately −7.90 during the early iterations, and then gradually stabilizing around −7.83. Figure 7d,f also reveal slight fluctuations in the middle and later iterations, ultimately reaching a stable state.
The entire optimization process took approximately 195 h, generating 3000 feasible solutions through multiple iterations. Among these, 388 solutions were identified as optimal, and after removing 247 duplicates, a total of 141 Pareto optimal solutions were obtained. Pareto optimal solutions represent a set of trade-offs among the three objectives—UTCI-W, UTCI-S, and sunlight hours—where no single objective can be improved without compromising at least one of the others. These solutions illustrate the balance between conflicting performance criteria, offering a range of options that cater to varying priorities in urban block design. This set of solutions provides urban designers with a foundation for making informed decisions and balancing environmental performance goals tailored to the needs of elderly residents.

4.1.2. Analysis of Optimization Results

(1)
Outdoor Environmental Performance Optimization Results
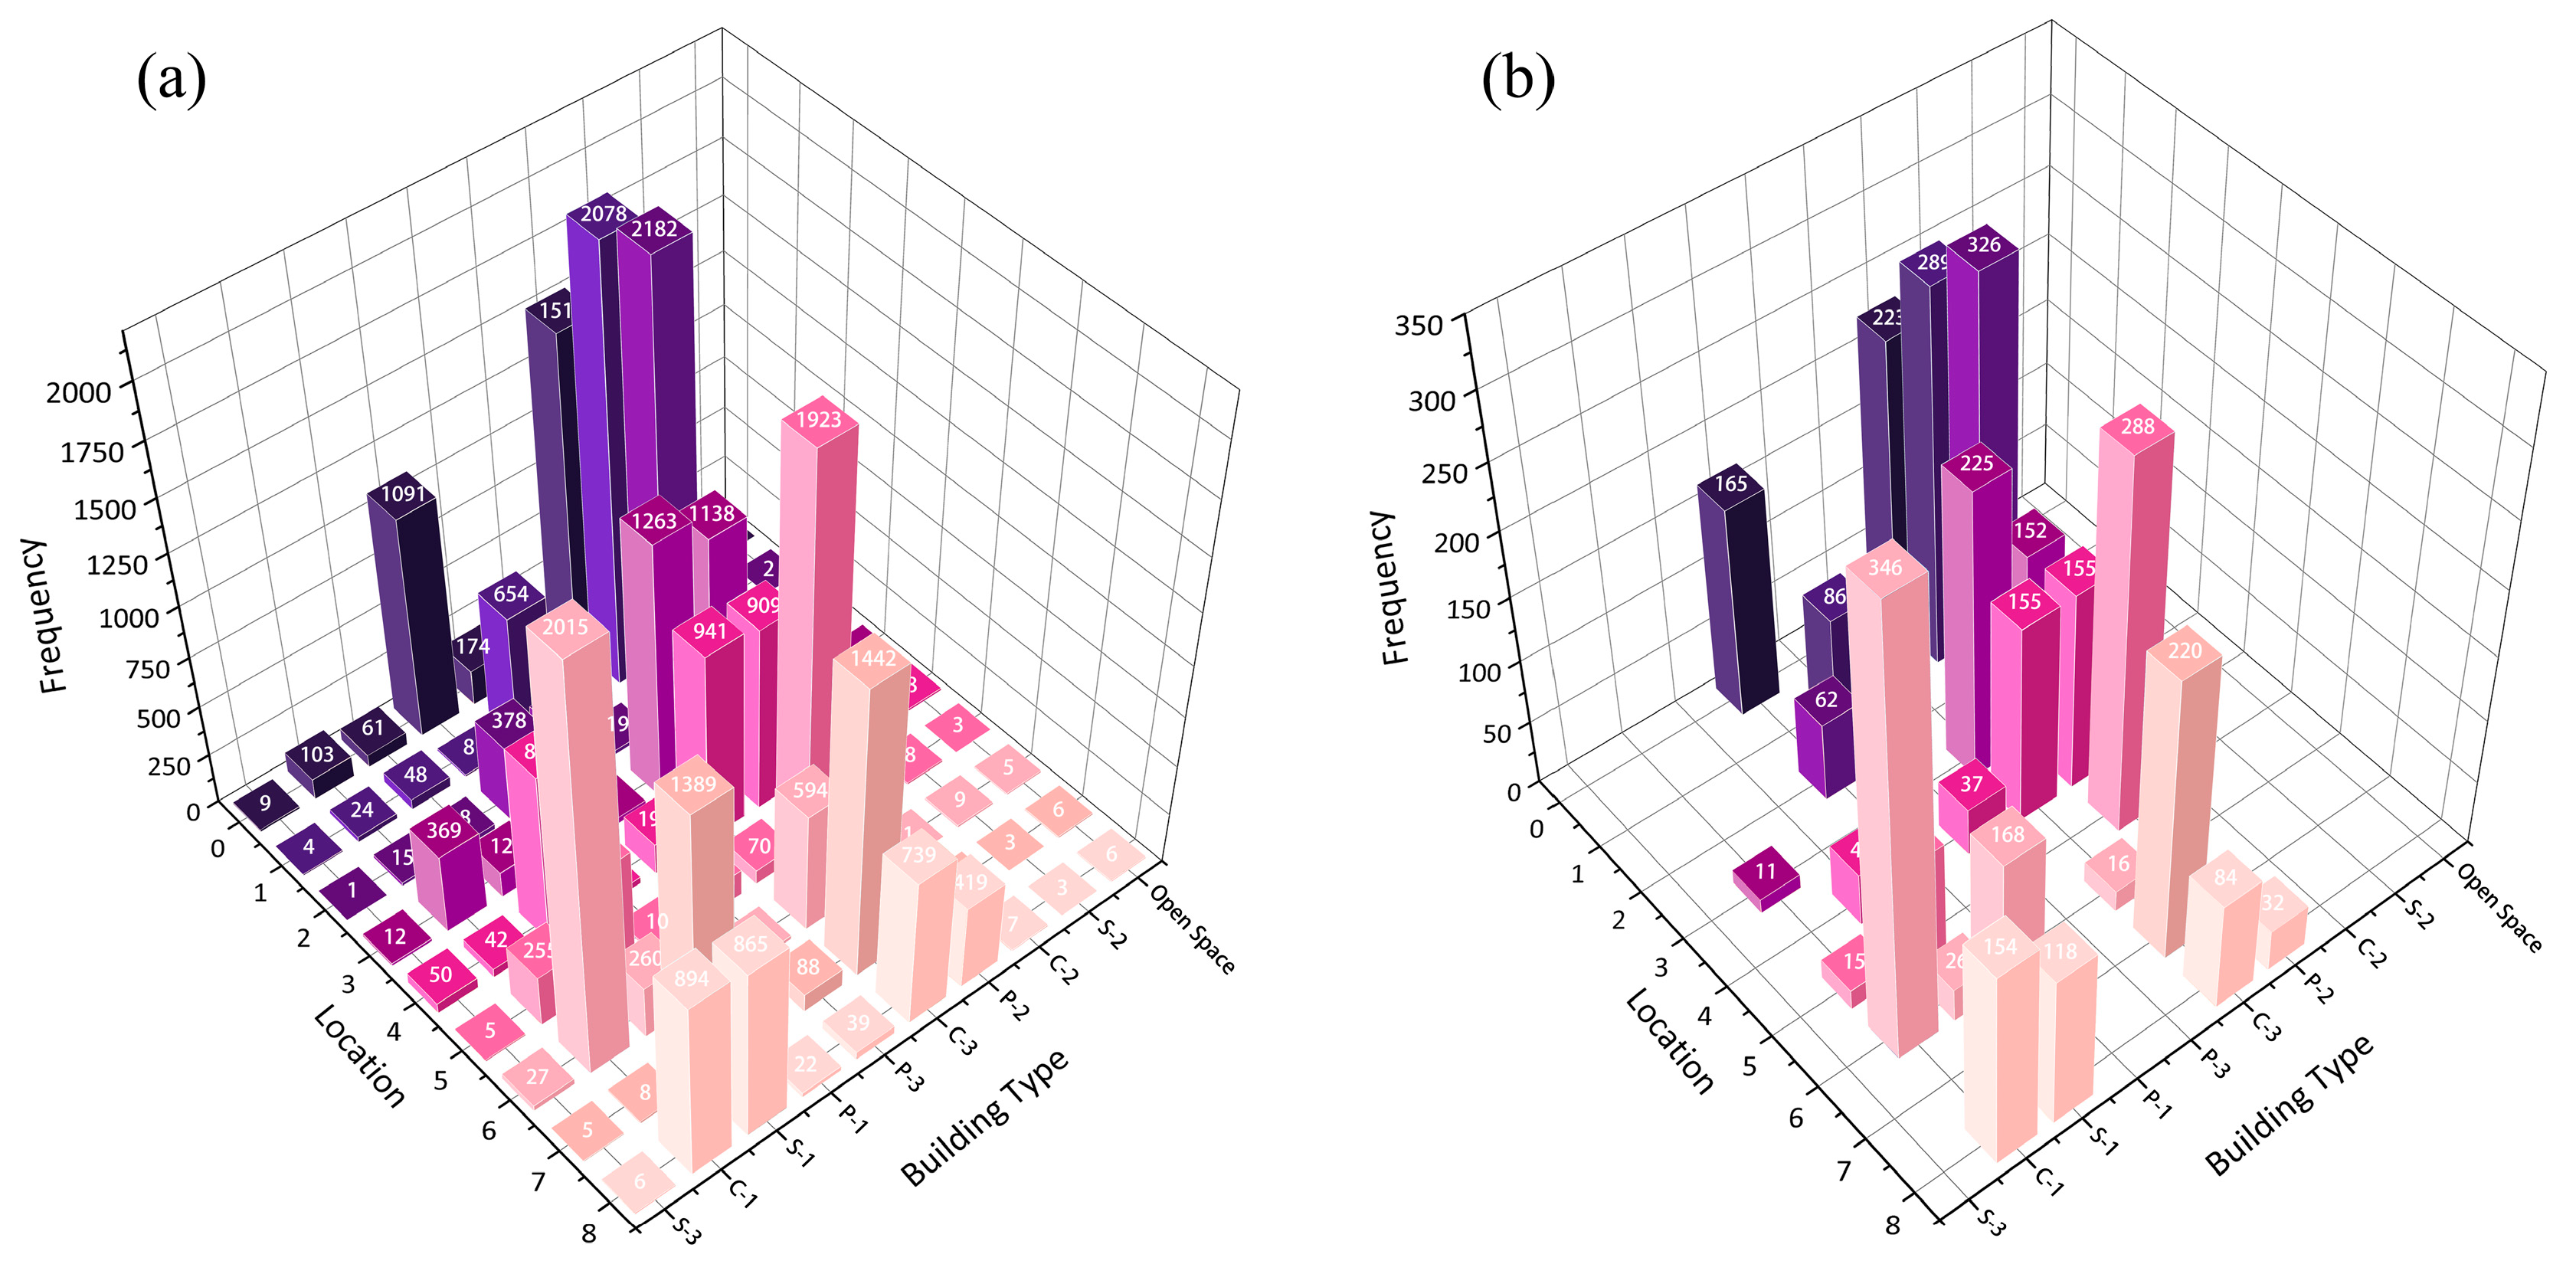
Figure 8a–c display the distribution of feasible solutions and Pareto solutions for the three objective functions. As shown, in all three objective functions, the Pareto solutions were optimized compared to the feasible solutions, indicating that urban spatial form optimization holds great potential for improving outdoor environmental performance.
Figure 8a shows that the median and mean values for the feasible solutions of the objective function UTCI-S are 31.8 °C, with a distribution range of 31.59–31.92 °C, and there are many outliers, indicating a dispersed data distribution. In contrast, the median of the Pareto solutions for UTCI-S is 31.20 °C, with a distribution range of 31.10–31.38 °C, and the data distribution is more concentrated. The Pareto solutions can create a more comfortable summer outdoor thermal environment compared to the feasible solutions.
Figure 8b shows that the median value for the UTCI-W feasible solutions is −8.25 °C, with a distribution range of −8.45 to −8.13 °C, and there are many outliers, indicating a dispersed data distribution. In contrast, the median of the Pareto solutions for UTCI-W is −8.05 °C, with a distribution range of −8.14 to −7.95 °C, and the data distribution is more concentrated. The Pareto solutions can create a more comfortable winter outdoor thermal environment compared to the feasible solutions.
Figure 8c shows that the distribution range for the SH objective function in the feasible solutions is 5.70–7.25 h, with many outliers, indicating a dispersed data distribution. In contrast, the distribution range for the Pareto solutions for SHs is 5.90–6.74 h. Although the extreme values of the Pareto solutions are lower than those of the feasible solutions, the Pareto solutions exhibit a more concentrated data distribution, resulting in better overall sunlight performance.
(2)
Optimization Results of Urban Spatial Form
Figure 9a shows the distribution of the urban spatial form in the feasible solution schemes during the optimization process. As shown, the feasible solutions tend to place high-rise buildings, such as P-2, on the northern and western sides of the urban block, particularly in land units 0, 1, 2, and 4. In contrast, the southern part of the block mainly features medium-rise buildings, such as C-3, while the eastern side, in blocks like 2 and 8, is predominantly composed of low-rise buildings. Overall, the spatial form in the feasible solutions presents a layout with higher buildings in the northwest and lower buildings in the southeast.
Figure 9b shows the distribution of urban spatial forms in the Pareto solutions during the optimization process. Similarly to the conclusions in Figure 8a, the spatial forms in the Pareto solutions also show a general northwest-high, southeast-low layout. However, unlike the feasible solutions, the proportion of high-rise buildings in the western land units decreases, while the proportion of medium- and low-rise buildings increases.
This layout may be due to the prevailing wind direction in Beijing, where the summer winds predominantly come from the southeast and the winter winds come from the northwest. By maintaining high-rise buildings on the north side while reducing the height of buildings on the west side, this layout not only ensures that high-rise buildings block the cold winds in winter but also allows the cool summer air to enter the block, carrying away heat and lowering the outdoor temperature. Additionally, considering that Beijing is located in the Northern Hemisphere, the northwest-high, southeast-low layout helps increase morning sunlight exposure in the block.
The enclosed building types C-2, C-1, and C-3 appear most frequently in both the feasible and Pareto solutions. According to previous studies, enclosed buildings have a smaller form factor, which can reduce the impact of cold winds on the outdoor environment in winter in cold northern regions and can create shaded areas in the summer by providing self-shading, improving the outdoor thermal environment.
In conclusion, the optimized urban spatial form can adapt to the unique climate conditions in Beijing, providing a comfortable thermal environment in both winter and summer while ensuring ample sunlight, thus creating a comfortable outdoor environment for the elderly.

4.2. Impact Mechanism of Urban Spatial Form on Outdoor Environmental Performance

Using the three datasets of “spatial form–environment” corresponding to UTCI-W, UTCI-S, and SHs, machine learning modeling was performed. The data were split into a training set (70%) and a testing set (30%), and the Bayesian optimization-based efficient global optimization algorithm TPE (Tree-structured Parzen Estimator) was used for automated parameter tuning. Compared to grid search (Grid Search) and random search (Random Search), TPE has better performance and convergence speed in parameter optimization.
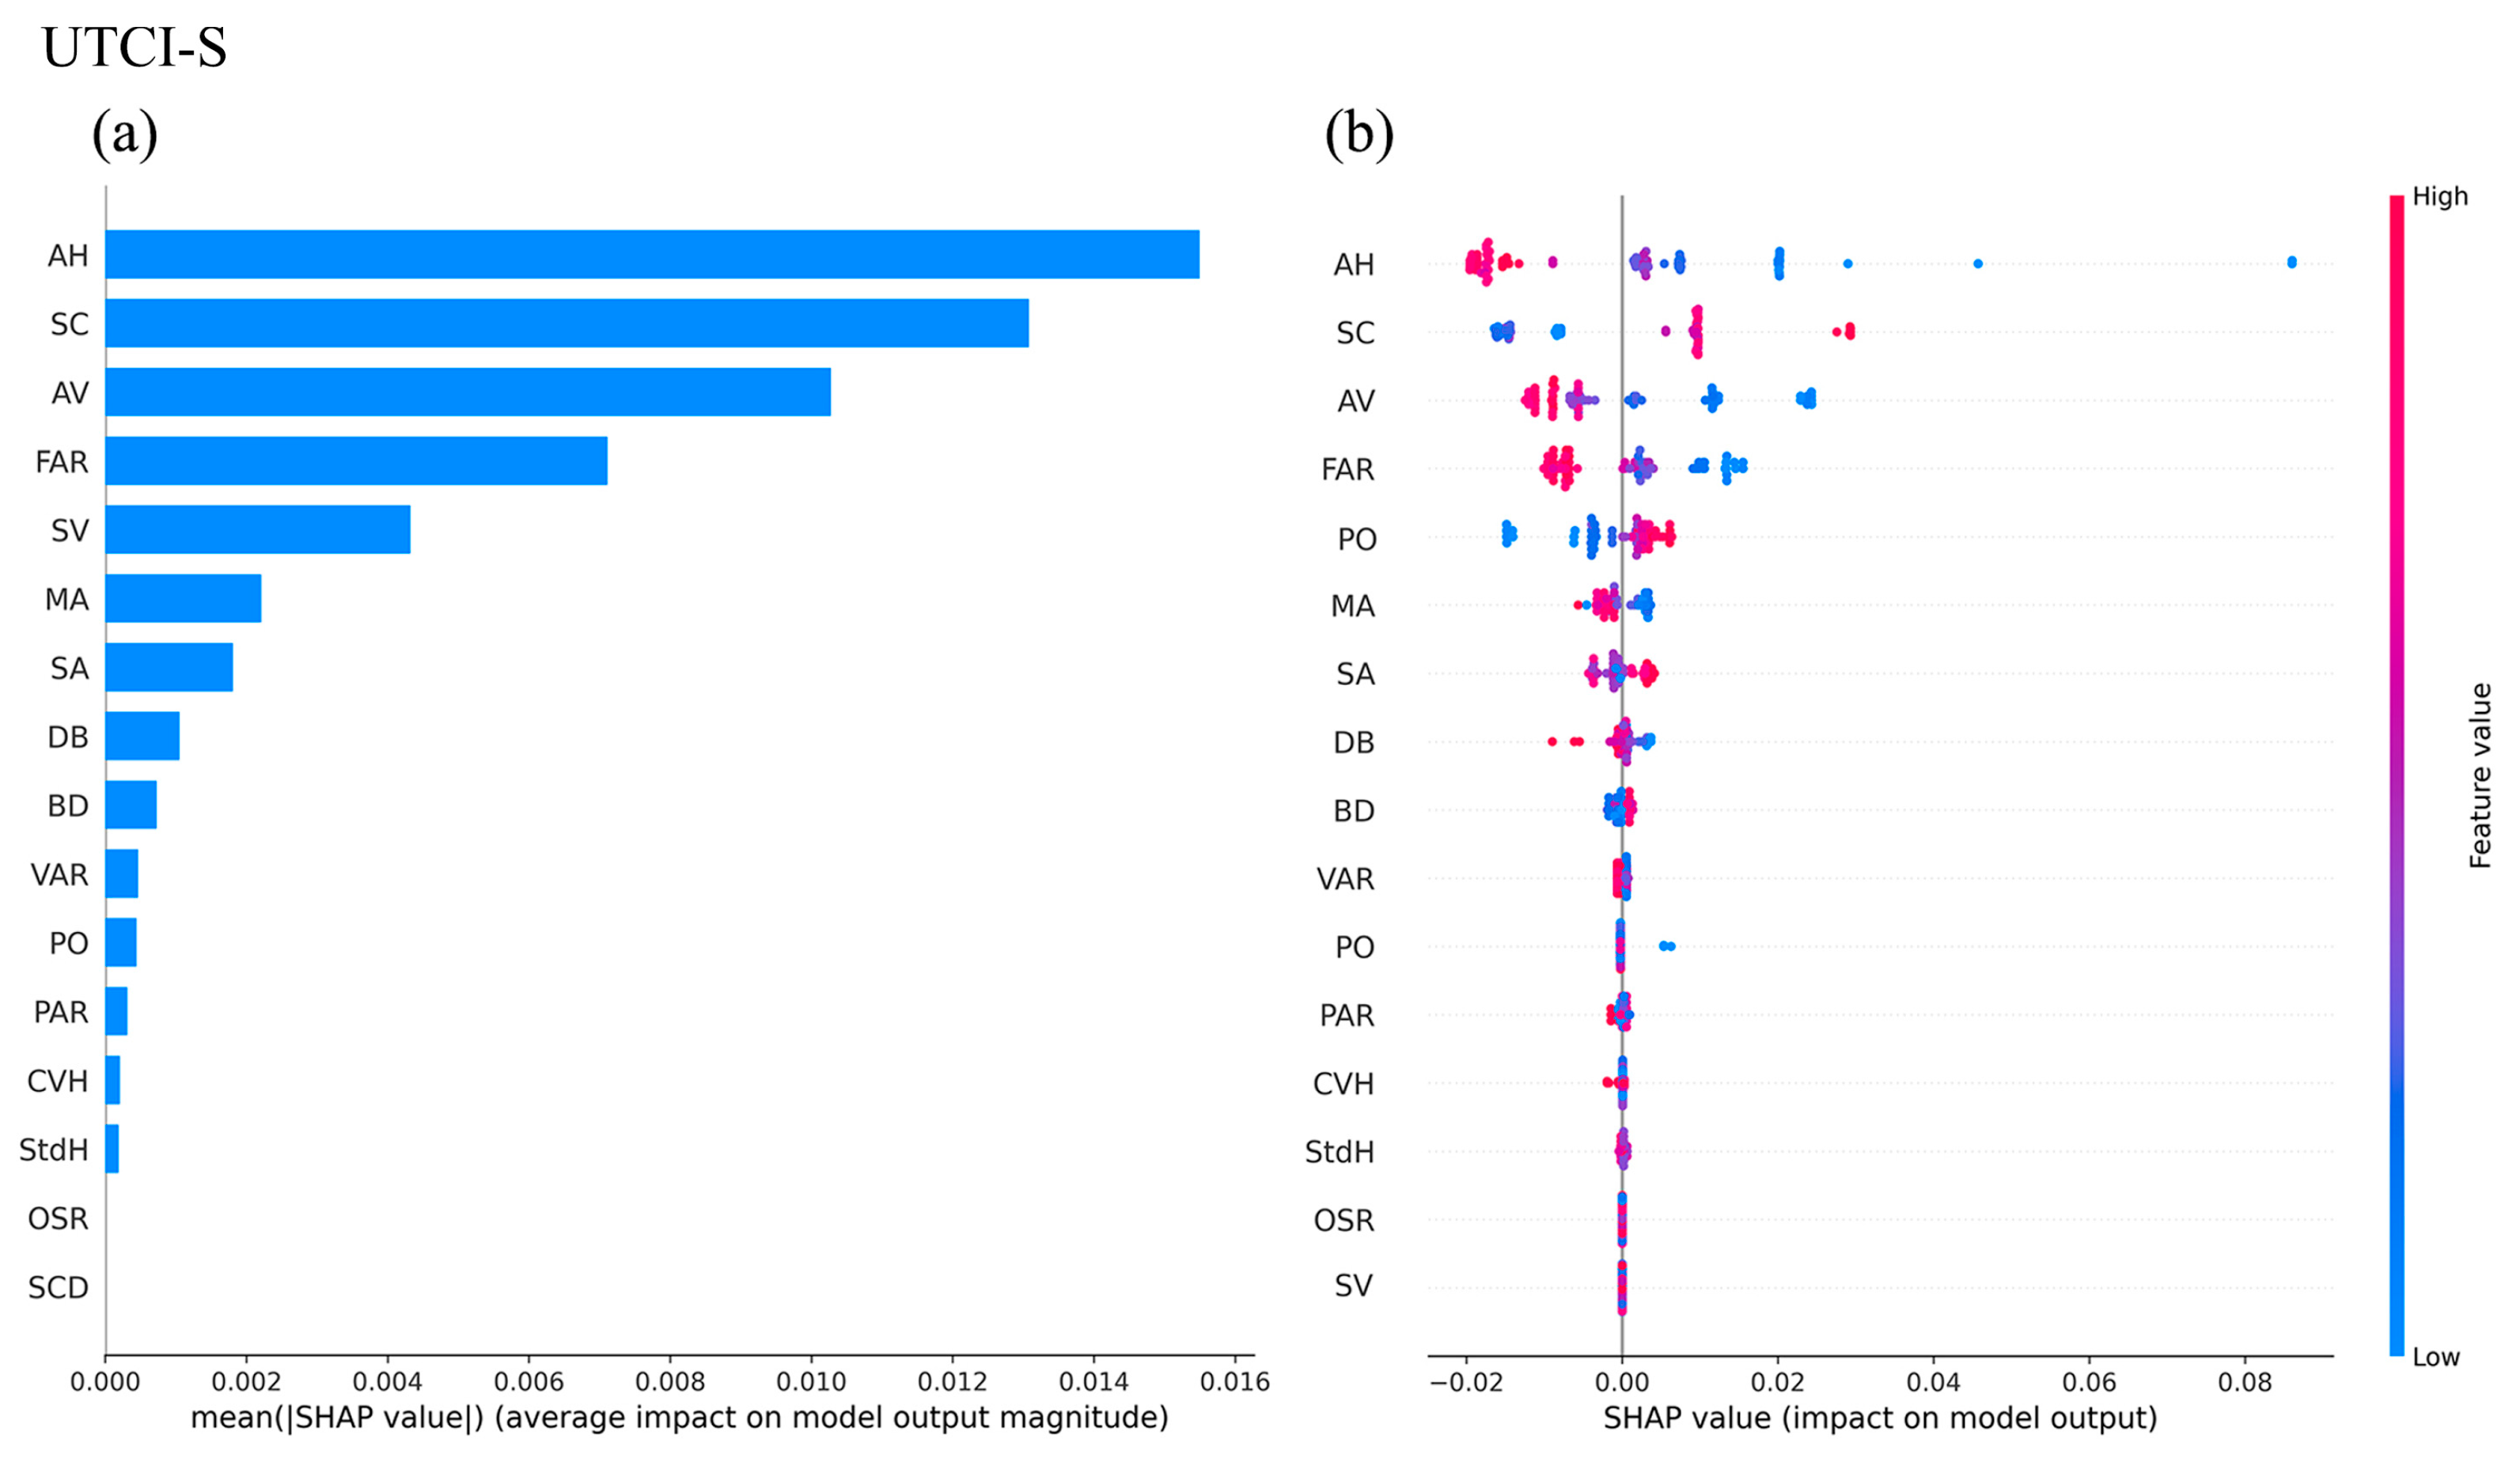
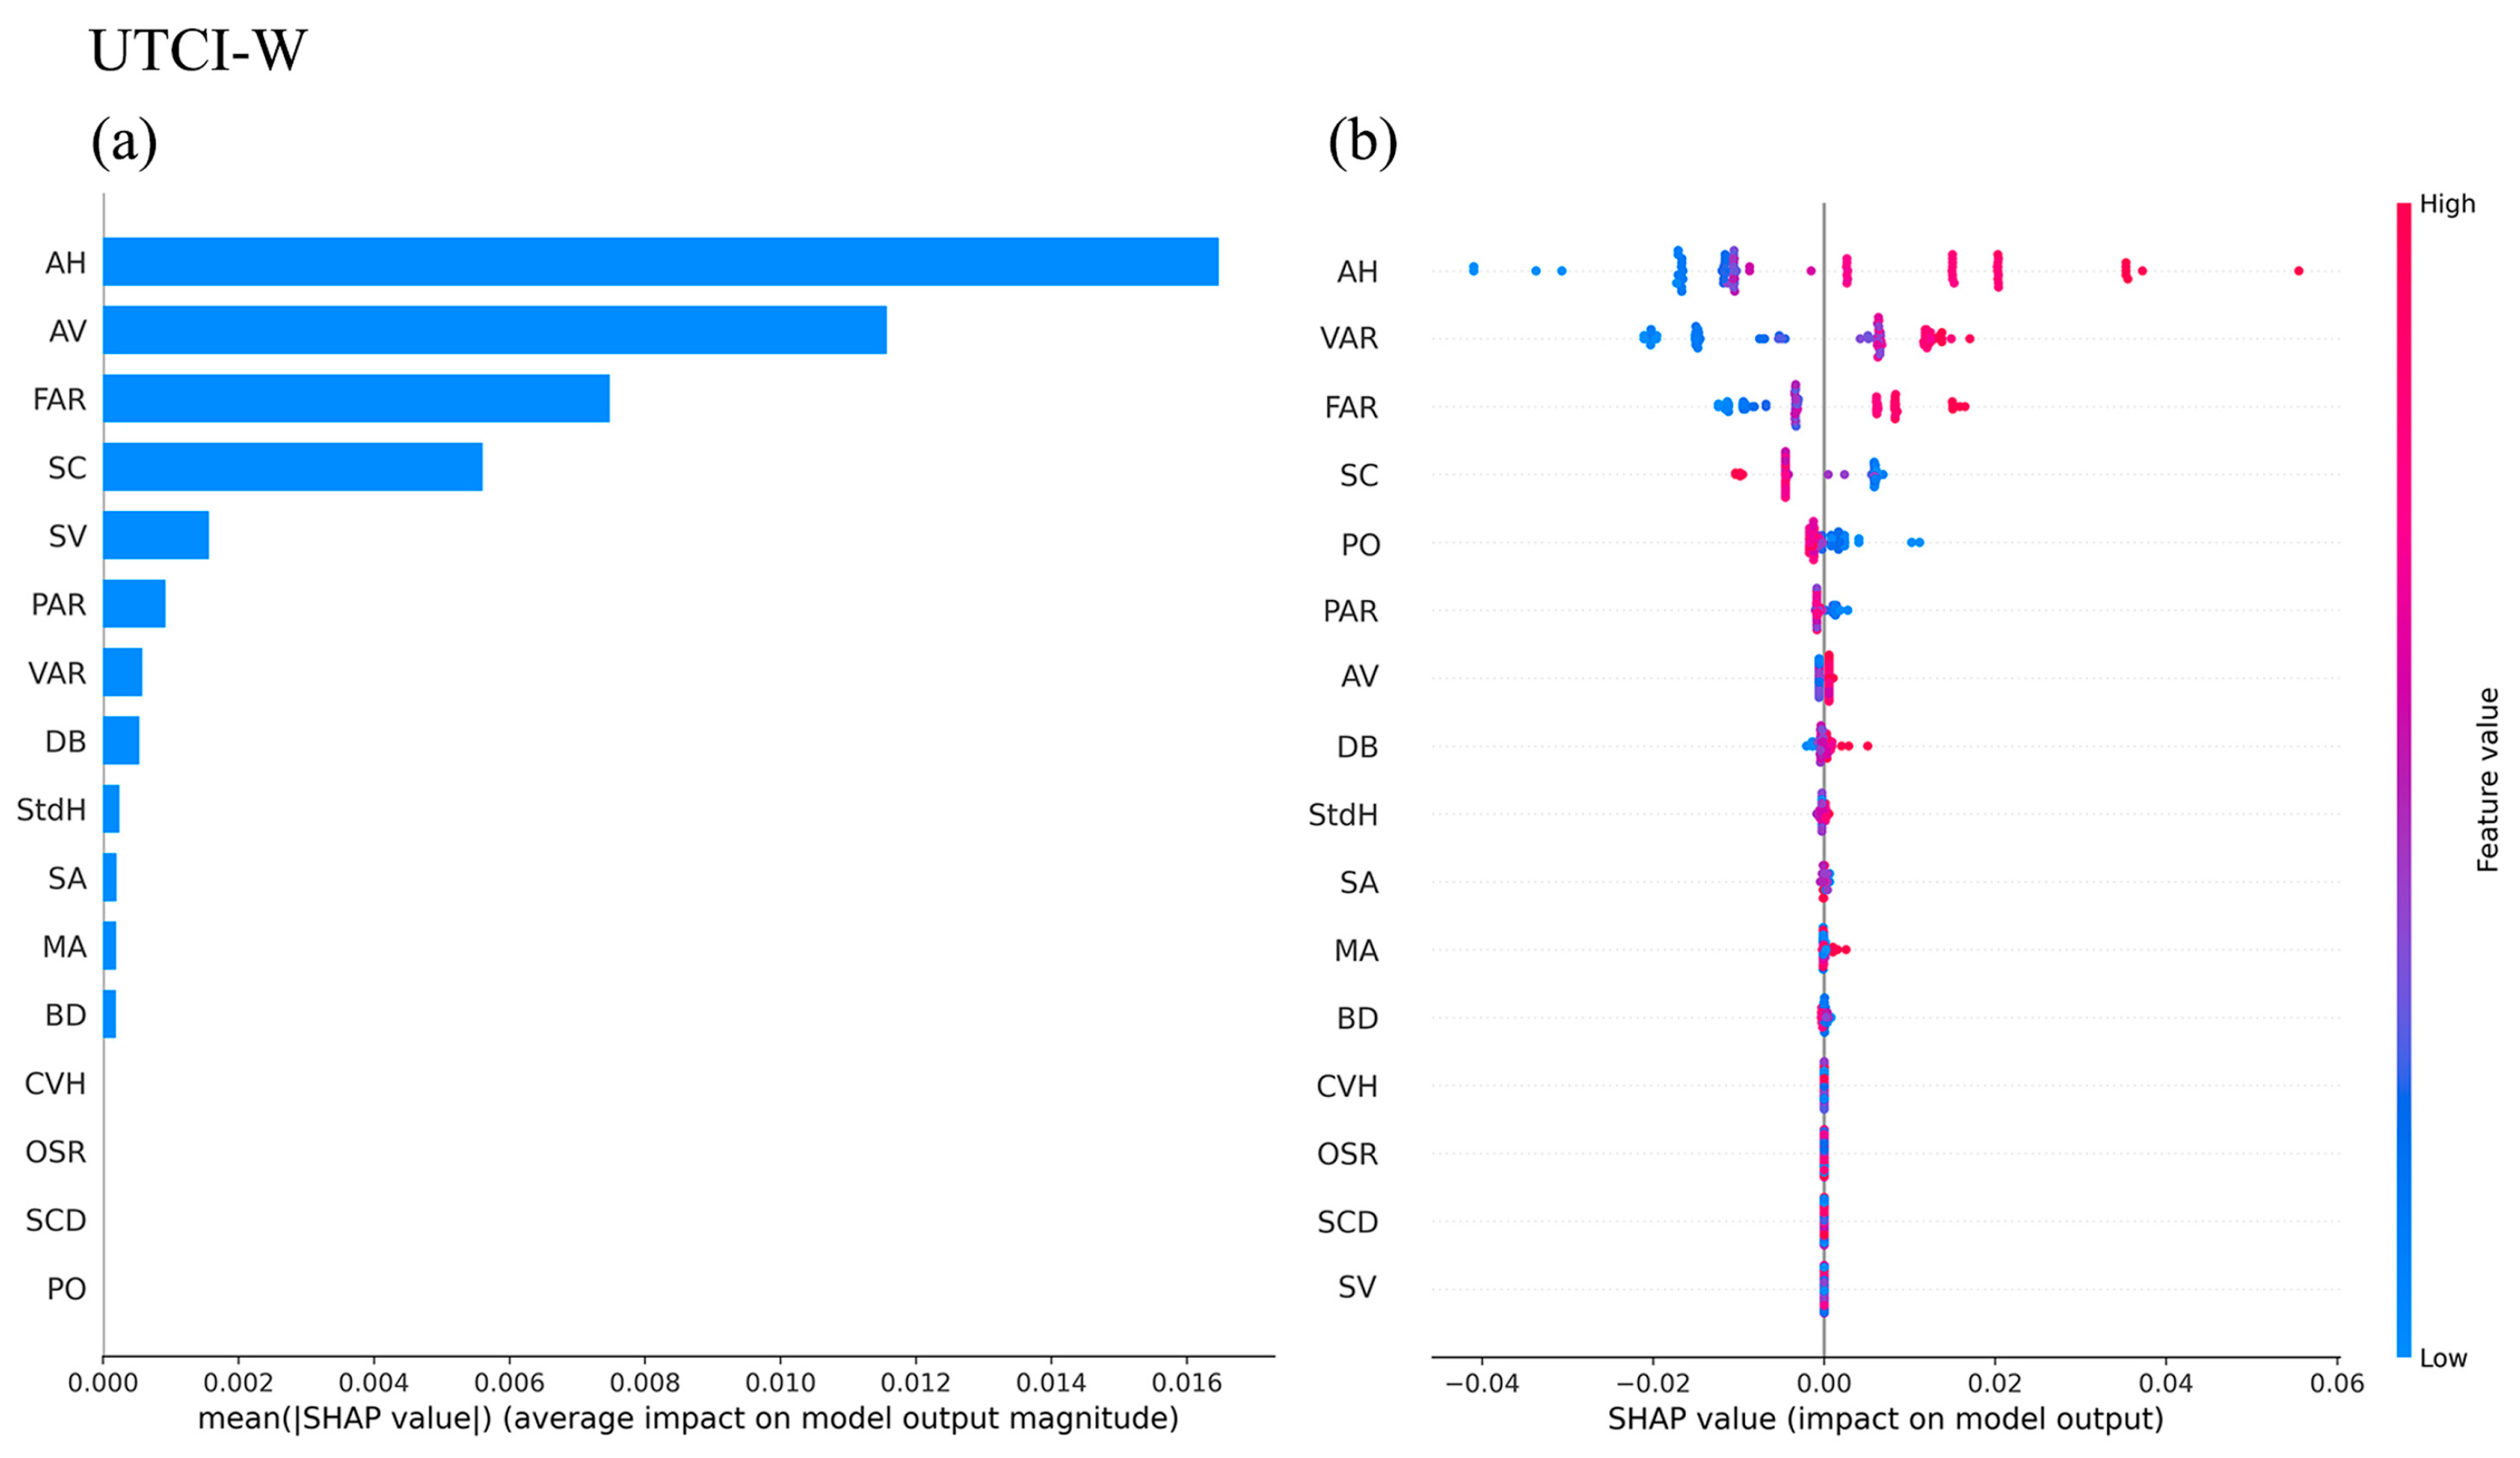
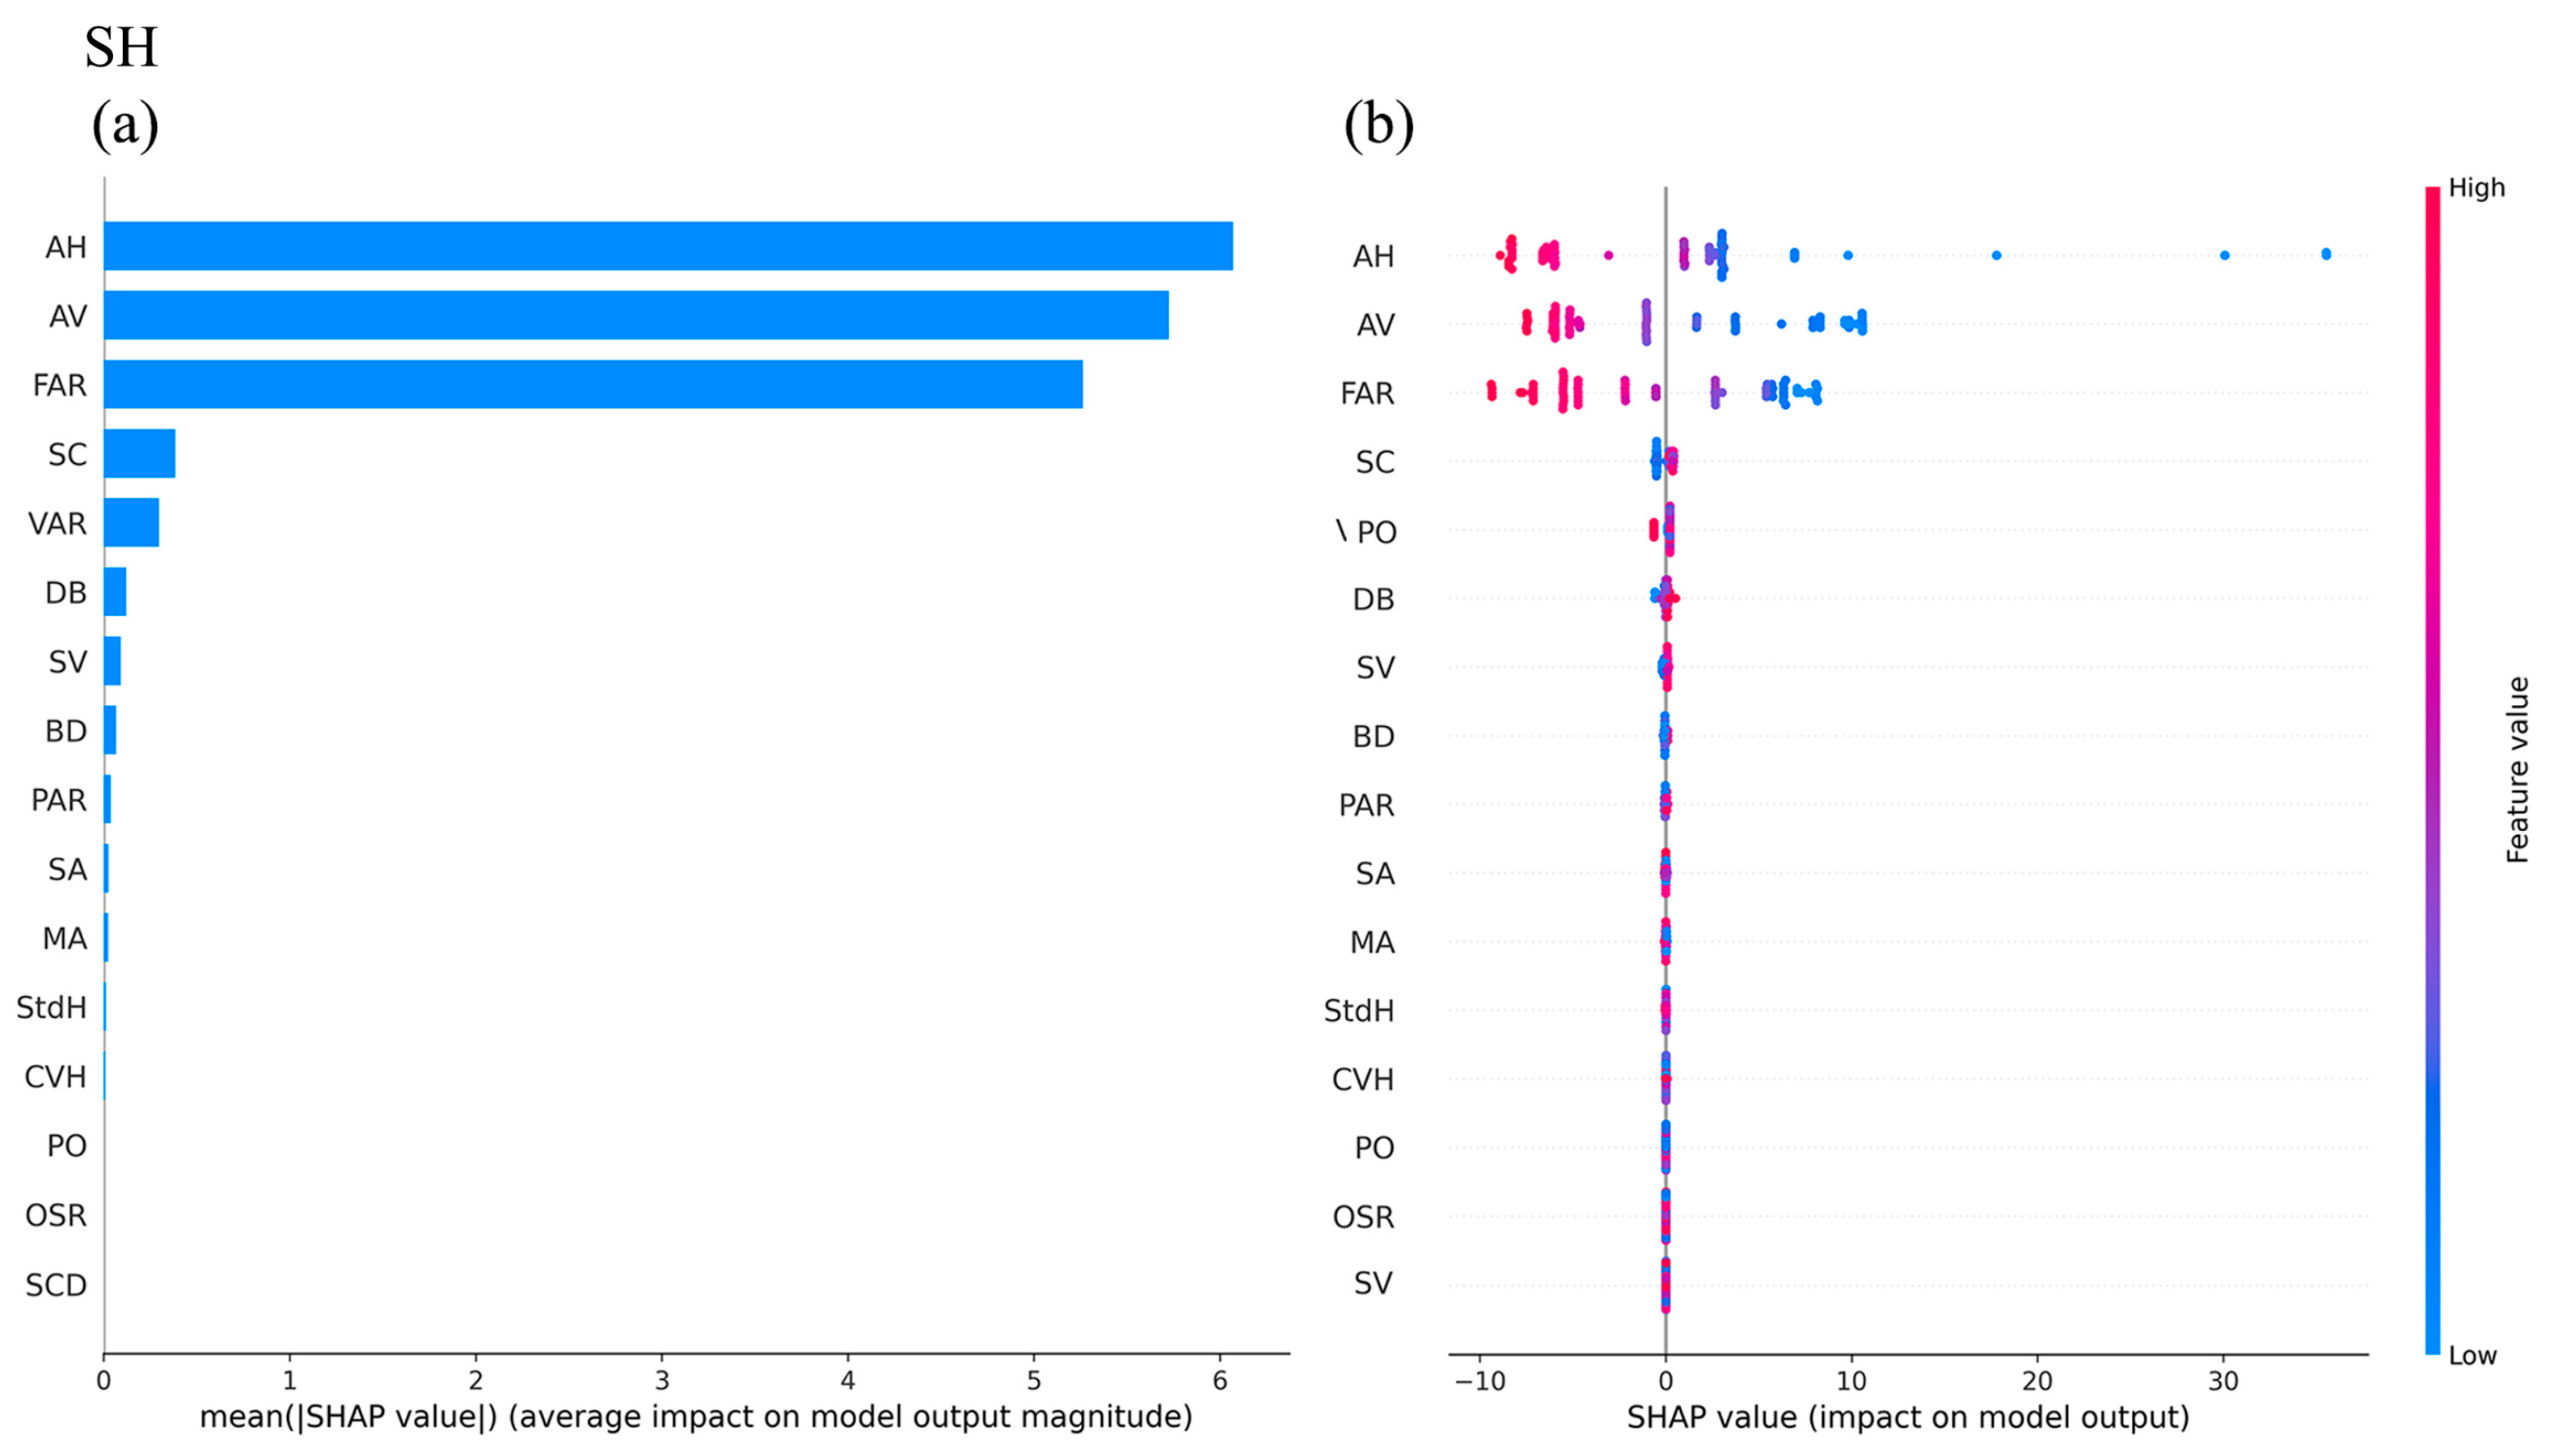
The best model, after tuning, underwent interpretability analysis. First, the global feature importance ranking of the model was output. The SHAP values for the model were presented in bar plots (Figure 10a, Figure 11a and Figure 12a) and summary plots (Figure 10b, Figure 11b and Figure 12b). The bar plots in Figure 10a, Figure 11a and Figure 12a represent the SHAP values, indicating the contribution of each variable to the model’s prediction. Each bar represents a variable, and the height of the bar is the absolute average SHAP value for all samples, indicating the strength of the variable’s influence on the prediction. The bars are ordered from top to bottom based on the importance of the variables.
The summary plots in Figure 10b, Figure 11b and Figure 12b show the same variable order as the bar plots, with each point in the plot representing a feature and its SHAP value for a given instance. The color gradient from blue to red indicates feature values from low to high. Points with the same SHAP value are stacked to display the distribution of local effects. SHAP values greater than zero indicate that the variable has a promoting effect on the corresponding behavior, while SHAP values less than zero indicate that the variable has a suppressing effect.
The analysis results show that the urban spatial form has a significant impact on outdoor environmental performance. In all three models, there were key spatial form indicators that showed significant effects on outdoor environmental performance.

4.2.1. Impact Mechanism of Urban Spatial Form on UTCI-S

In Model 1, the results of explainable machine learning (Figure 10a) show that the variables influencing UTCI-S include AH, SC, AV, FAR, SV, MA, SA, and others, while shape indicators such as CVH, StdH, OSR, and SCD have little impact on UTCI-S. The SHAP summary plot (Figure 10b) reveals that spatial form indicators such as SC, SA, and SV significantly promote UTCI-S, while AH, AV, MA, and FAR significantly suppress UTCI-S.
These results show the impact of urban spatial form on summer outdoor thermal comfort. Specifically, the higher the average building height, the larger the building volume, the greater the average building footprint, and the higher the floor–area ratio (FAR), the lower the UTCI value in summer, leading to a more comfortable overall thermal environment. This may be because increasing the building height and volume reduces the sun exposure distance between buildings in the same block, causing the outdoor area to remain in the shadow of buildings, reducing solar radiation on the same unit area, which lowers the temperature of the ground and surrounding air, and improving outdoor thermal comfort for the elderly during the summer.
On the other hand, the more complex the building shape and the greater the variation in building volume and area within the block, the higher the UTCI value in the summer. This may be due to the fact that complex-shaped blocks hinder natural ventilation, leading to heat accumulation, which raises the surrounding environment temperature and thus exacerbates the discomfort experienced by the elderly.

4.2.2. Impact Mechanism of Urban Spatial Form on UTCI-W

In Model 2, the results of explainable machine learning (Figure 11a) show that the variables influencing UTCI-W include AH, VAR, FAR, SC, PO, and others, while shape indicators such as CVH, OSR, SCD, and SV have little impact on UTCI-W. The SHAP summary plot (Figure 11b) reveals that spatial form indicators such as AH, VAR, and FAR significantly promote UTCI-W, while SC and PO significantly suppress UTCI-W.
These results demonstrate the impact of urban spatial form on winter outdoor thermal comfort. Specifically, the higher the porosity and form factor of the block, the lower the UTCI value in winter, resulting in a poorer overall thermal environment. This may be because increasing the block’s porosity and form factor reduces the ability of the block to block cold air in winter, leaving the outdoor area exposed to cold winds and low temperatures, thereby decreasing outdoor thermal comfort for the elderly in winter.
On the other hand, the higher the average building height, the larger the volume density and the floor–area ratio (FAR), and the higher the UTCI value in winter. This may be because a more concentrated layout helps the block withstand more cold winds in winter, causing heat to accumulate and therefore raising the surrounding environment temperature, thus improving thermal comfort for the elderly.
Comparing Figure 10 and Figure 11, it can be seen that the requirements for urban block spatial form in winter and summer are somewhat contradictory. In the summer, a high building density and floor–area ratio suppress natural ventilation due to the higher temperatures. However, in winter, increasing the building density enhances the cohesion of the block and reduces heat loss caused by cold winter winds, creating a more pleasant outdoor thermal environment. This presents higher demands for the climate-adaptive design of urban block spatial form.

4.2.3. Impact Mechanism of Urban Spatial Form on SHs

In Model 3, the results of explainable machine learning (Figure 12a) show that the variables influencing SHs include AH, AV, FAR, and SC, while MA, StdH, CVH, PO, OSR, SCD, and other shape indicators have little effect on SHs. The SHAP summary plot (Figure 12b) reveals that shape indicators that significantly promote UTCI-S are not apparent in the model, while AH, MA, and FAR significantly suppress SHs.
These results demonstrate the impact of urban spatial form on sunlight hours. Specifically, the higher the average building height, the larger the average building footprint, and the higher the floor–area ratio (FAR), the shorter the sunlight duration. This may be because increasing the building height, footprint, and FAR leads to more buildings on the same block scale, resulting in outdoor areas being in the shadow of buildings, thereby reducing sunlight hours per unit area.

5. Conclusions

This study applied a performance-driven workflow framework of “morphological generation–performance evaluation–morphological optimization” to improve outdoor environmental performance for elderly communities. Through surveying 340 typical elderly residential buildings in Beijing, basic data such as building types and block scale were used as references and constraints for a parametric urban form generation model. Sixteen morphological indicators, including average building height and standard deviation of building height, were selected to describe the generated parametric models of the blocks. The outdoor environmental performance criteria determined for this experiment include maximizing the winter pedestrian UTCI, minimizing the summer pedestrian UTCI, and maximizing sunlight hours. By using combinations of different types of buildings in various sub-blocks as decision variables for multi-objective optimization, the three environmental performance objectives were defined as target functions. The Wallacei plugin on the Grasshopper platform was employed for the automated optimization of urban spatial forms under optimal environmental performance conditions. Additionally, explainable machine learning algorithms, specifically XGBoost, were innovatively used to explore the nonlinear relationships between variables.
The optimization results show that the UTCI-S, UTCI-W, and SHs of the block have been optimized to some extent, demonstrating that the block form has an impact on outdoor environmental performance, which is consistent with previous studies. An analysis of the Pareto solutions obtained from the optimization experiment reveals that, compared to traditional blocks, the Pareto solutions for senior residential areas adapted to the climate of Beijing show a northwest-high, southeast-low layout. In terms of building form, the Pareto solutions tend to favor enclosed building types. This is likely because enclosed buildings have strong enclosure characteristics better suited to cope with the cold northern climate. To better achieve the set optimization goals, the Pareto solutions maintain the high-rise building layout on the northern side while reducing the height of buildings on the western side. This layout can accommodate the prevailing northwest winds in winter and southeast winds in summer in Beijing, ensuring outdoor thermal comfort in both winter and summer while increasing sunlight duration, which improves the outdoor activity experience for seniors. Such a block layout can create a better living environment for the elderly and improve their physical and mental health.
At the same time, the three sets of machine learning models established using experimental data, after hyperparameter optimization, had test set R2 values of 0.712, 0.843, and 0.966, respectively. This indicates a significant nonlinear relationship between the residential form and the environment. By using the calculated SHAP values, precise identification of the morphological indicators affecting outdoor environmental performance was achieved, which will help designers make better decisions in the early stages to create a better outdoor environment.
Model results show that, among the morphological indicators affecting summer outdoor thermal comfort, a higher average building height, larger building volume, higher average building footprint, and larger floor–area ratio (FAR) significantly reduce the summer outdoor UTCI value. Meanwhile, more complex building forms and greater variability in block area volume significantly increase the summer outdoor UTCI value. Among these, the average building height and building system coefficient have been widely proven by scholars to be key factors affecting outdoor thermal comfort. This may be because increasing the height of buildings reduces the shadow gaps within the same block scale, placing outdoor spaces in the building’s shadow and reducing solar radiation, thereby lowering ground and surrounding air temperatures and improving summer outdoor thermal comfort for seniors. In contrast, more complex building forms hinder natural ventilation in the block, leading to heat accumulation and an increase in surrounding temperatures, thereby exacerbating discomfort.
In terms of winter outdoor thermal comfort, indicators such as higher block porosity and building form coefficient significantly reduce the winter outdoor UTCI value, while a higher average building height, volume density, and FAR significantly increase the winter outdoor UTCI value. This may be because increasing the block porosity and building form coefficient makes it difficult for the same block to block cold air in winter, leaving outdoor spaces exposed to cold winds and low temperatures, thereby lowering winter thermal comfort. Conversely, more concentrated building layouts and taller buildings help the block resist more cold winds in winter, resulting in heat accumulation and a rise in surrounding temperatures, improving winter thermal comfort for seniors.
In terms of sunlight duration, a higher average building height, larger average building footprint, and larger FAR significantly reduce the sunlight duration. This is consistent with human experience and previous research: increasing building height, footprint, and FAR results in more shadowing within the same block scale, reducing the opportunity for seniors to receive sunlight.
Through the interpretation of the three sets of machine learning model results, it can be observed that the effects of different morphological indicators on different outdoor environmental performances are somewhat contradictory. Especially in the context of Beijing’s cold winter and hot summer climate, increasing building density and FAR to enhance block coherence and reduce heat loss caused by winter cold winds while creating a more comfortable outdoor thermal environment may suppress natural ventilation in summer, thereby reducing summer outdoor thermal comfort. Similarly, increasing the average building height to create more shadowed areas may also result in a loss of some sunlight duration. In the past, designers have often relied on their own experience to guide urban design decisions, but this workflow has been proven to be inefficient. This study, by combining parametric platforms with genetic algorithms, transforms the process into a quantifiable and controllable parametric design workflow, while exploring the morphological indicators affecting outdoor environmental performance to help designers focus on key aspects in early-stage decisions, improving work efficiency.
Based on the findings, the following design recommendations for climate-responsive block morphology are proposed:
(1)
High-rise buildings should be set on the north side of the block to ensure a high floor–area ratio while blocking winter cold winds.
(2)
Mid-to-high-rise buildings should be placed on the west side of the block to maintain natural ventilation in summer while reducing the impact of westward heat.
(3)
Low-rise buildings should be placed on the east and south sides to ensure direct sunlight penetration and increase sunlight hours.
(4)
The overall block layout should be considered, forming an enclosed shape with higher buildings on the outside and lower buildings on the inside, following the northwest-high, southeast-low principle, to ensure comfortable outdoor environments within the block.
(5)
The building forms should be simple, reducing the form factor, and clustered building types should be prioritized.
This study has the following contributions:
(1)
A “pre-evaluation” optimization framework considering outdoor comfort and lighting duration was applied to the shape design of the elderly block in cold areas, filling the gap in the quantitative study of the elderly block shape.
(2)
Through field research, performance simulation, and data analytics, the nonlinear relationship between the block shape of elderly residential buildings and environmental performance indicators was explained, and the key factors affecting elderly people’s outdoor environmental experience were accurately identified.
(3)
We translated the research results into design strategies, provided early design decisions for senior-friendly block form design, reduced the cost of later environmental performance optimization and transformation, provided a reference for block planning and layout, improved the outdoor environment of elderly people, improved the overall quality of life of elderly people, and promoted the physical and mental health of elderly people.
However, the study has some limitations, as follows:
(1)
It only considers the climate conditions of cold regions, and the applicability to extreme cold, hot summers, and cold winters; climates with hot summers and mild winters need further verification.
(2)
The parametric generation of the block form based on the Grasshopper platform’s shape syntax is limited by preset rules, lacking diversity and flexibility.
(3)
The optimization process, based on a static genetic algorithm, takes a long time and has a high convergence difficulty.
In future research, combining artificial neural networks with multi-objective optimization could enhance both the efficiency and accuracy of climate-adaptive urban spatial form design, from generation methods to spatial form prediction.

Author Contributions

L.Z.: conceptualization, methodology, writing—review and editing, data curation, formal analysis, investigation, software, visualization, and writing—original draft; Z.Q.: methodology, writing—review and editing, data curation, formal analysis, investigation, software, visualization, and writing—original draft; X.Y.: funding acquisition, project administration, supervision, and writing—review and editing; L.J.: formal analysis, investigation, and supervision. All authors have read and agreed to the published version of the manuscript.

Funding

This research was funded by the General Project of the Natural Science Foundation of Beijing City, grant number 8202017.

Institutional Review Board Statement

Not applicable.

Informed Consent Statement

This study did not involve humans.

Data Availability Statement

Data will be made available on request.

Acknowledgments

During the process of completing this paper, I received a great deal of help, and hereby express my sincere gratitude. I would like to thank Yang Xin for his meticulous guidance on the research direction and financial support. I also appreciate the efforts of the team members during the experimental and data—processing stages. They provided valuable suggestions and support.

Conflicts of Interest

The authors declare no conflicts of interest.

Abbreviations

UTCI-SUniversal Thermal Climate Index in summer (°C)
UTCI-WUniversal Thermal Climate Index in winter (°C)
SHsunlight hour (h)
AHaverage building height (m)
StdHstandard deviation of building height (m)
BDbuilding density (%)
DBDistance Between Buildings
FARfloor–area ratio
VARVolume–Area Ratio (%)
SCDSpace Crowding Density
POporosity (%)
SCShape Coefficient
PARperimeter–area ratio
MAMean Building Area (m2)
SAStandard Deviation of Building Area (m2)
AVAverage Building Volume (m3)
SVVolume Standard Deviation (m3)
OSROpen Space Ratio (%)
CVHCoefficient of Variation for Building Height
MOOmulti-objective optimization
SVFsky view factor
NSGA-IINon-dominated Sorting Genetic Algorithm II
XGBoost eXtreme Gradient Boosting
MRTmean radiant temperature (°C)
SDstandard deviation
SHAPShapley Additive Explanations

References

  1. Ageing and Health, n.d. Available online: https://www.who.int/news-room/fact-sheets/detail/ageing-and-health (accessed on 14 January 2025).
  2. Population Division World Population Prospects 2024-United Nations, n.d. Available online: https://population.un.org/wpp/ (accessed on 14 January 2025).
  3. National Bureau of Statistics of China. Total Population Growth is Maintained and the Level of Urbanisation Is steadily Increasing. Available online: http://www.stats.gov.cn/xxgk/jd/sjjd2020/202201/t20220118_1826609.html (accessed on 14 January 2025). (In Chinese)
  4. Liu, T.Y.; Wang, J.X.; Zhou, D.; Meng, X.Z.; Luo, X.L.; Wang, Y.P. Research on Optimization Design Strategies for Natural Ventilation in Living Units of Institutional Elderly Care Facilities Based on Computational Fluid Dynamics Simulation. Buildings 2024, 14, 1648. [Google Scholar] [CrossRef]
  5. Tam, V.W.Y.; Fung, I.W.H.; Tsang, Y.T.; Chan, L. Development of a Universal Design-Based Guide for Handrails: An Empirical Study for Hong Kong Elderly. Sustainability 2018, 10, 4233. [Google Scholar] [CrossRef]
  6. Zhou, S.; Li, B.Z.; Du, C.Q.; Liu, H.; Wu, Y.X.; Hodder, S.; Chen, M.Z.; Kosonen, R.; Ming, R.; Ouyang, L.Y.; et al. Opportunities and challenges of using thermal comfort models for building design and operation for the elderly: A literature review. Renew. Sust. Energ. Rev. 2023, 183, 18. [Google Scholar] [CrossRef]
  7. Kang, K.; Kim, T.; Kim, H. Effect of indoor and outdoor sources on indoor particle concentrations in South Korean residential buildings. J. Hazard. Mater. 2021, 416, 9. [Google Scholar] [CrossRef]
  8. Sander, B.; Markvart, J.; Kessel, L.; Argyraki, A.; Johnsen, K. Can sleep quality and wellbeing be improved by changing the indoor lighting in the homes of healthy, elderly citizens? Chronobiol. Int. 2015, 32, 1049–1060. [Google Scholar] [CrossRef] [PubMed]
  9. Petersen, J.; Austin, D.; Kaye, J.A.; Pavel, M.; Hayes, T.L. Unobtrusive in-home detection of time spent out-of-home with applications to loneliness and physical activity. IEEE J. Biomed. Health Inf. 2014, 18, 1590–1596. [Google Scholar] [CrossRef] [PubMed]
  10. Cedervall, Y.; Torres, S.; Åberg, A.C. Maintaining well-being and selfhood through physical activity: Experiences of people with mild Alzheimer’s disease. Aging Ment. Health 2015, 19, 679–688. [Google Scholar] [CrossRef] [PubMed]
  11. Zhu, D.; Liu, G.Y.; Lv, Z.; Wen, S.R.; Bi, S.; Wang, W.Z. Inverse associations of outdoor activity and vitamin D intake with the risk of Parkinson’s disease. J. Zhejiang Univ.-Sci. B 2014, 15, 923–927. [Google Scholar] [CrossRef] [PubMed]
  12. Suzuki, T.; Murase, S. Influence of Outdoor Activity and Indoor Activity on Cognition Decline: Use of an Infrared Sensor to Measure Activity. Telemed. J. E-Health 2010, 16, 686–690. [Google Scholar] [CrossRef]
  13. Blais, M.; Martin, E.; Albaret, J.M.; Tallet, J. Preservation of perceptual integration improves temporal stability of bimanual coordination in the elderly: An evidence of age-related brain plasticity. Behav. Brain Res. 2014, 275, 34–42. [Google Scholar] [CrossRef]
  14. Smith, R.M. Immunity, trauma and the elderly. Inj.-Int. J. Care Inj. 2007, 38, 1401–1404. [Google Scholar] [CrossRef]
  15. Hua, Y.; Qiu, Z.; Luo, W.J.; Wang, Y.; Wang, Z. Correlation between Elderly Migrants’ Needs and Environmental Adaptability: A Discussion Based on Human Urbanization Features. Int. J. Environ. Res. Public Health 2021, 18, 5068. [Google Scholar] [CrossRef] [PubMed]
  16. Aydelott, J.; Leech, R.; Crinion, J. Normal Adult Aging and the Contextual Influences Affecting Speech and Meaningful Sound Perception. Trends Amplif. 2010, 14, 218–232. [Google Scholar] [CrossRef] [PubMed]
  17. Chun, S.A.; Nam, K. A public healthscape framework for assessing geriatric long-term care public hospitals in South Korea by a Delphi expert consultation. Build. Environ. 2019, 165, 13. [Google Scholar] [CrossRef]
  18. Zhou, H.X.; Yu, W.; Zhao, K.Y.; Shan, H.Y.; Zhou, S.; Wei, S.; Ouyang, L.Y. Thermal demand characteristics of elderly people with varying levels of frailty in residential buildings during the summer. J. Build. Eng. 2024, 84, 16. [Google Scholar] [CrossRef]
  19. Esmaeilzadeh, S.; Oz, F. Effect of psychosocial care model applied in an “elderly day care center” on loneliness, depression, quality of life, and elderly attitude. Niger. J. Clin. Pract. 2020, 23, 189–197. [Google Scholar] [CrossRef]
  20. Aylaz, R.; Aktürk, Ü.; Erci, B.; Öztürk, H.; Aslan, H. Relationship between depression and loneliness in elderly and exami-nation of influential factors. Arch. Gerontol. Geriatr. 2012, 55, 548–554. [Google Scholar] [CrossRef]
  21. Antoine, P.; Antoine, C.; Poinsot, R. Elderly distress: Cognitive schemas identification. Psychol. NeuroPsychiatr. Vieil. 2007, 5, 305–314. [Google Scholar] [PubMed]
  22. Pokorski, M.; Cajdler, A.; Menzyk, K. SENSE OF SOCIAL INTERACTION IN THE ELDERLY. J. Physiol. Pharmacol. 2008, 59, 579–584. [Google Scholar]
  23. Yajima, M.; Asakawa, Y.; Yamaguchi, H. Contents and Construct of Subjective Enjoyment of Community-dwelling Elderly People Performing Physical Activities. J. Phys. Ther. Sci. 2013, 25, 207–209. [Google Scholar] [CrossRef]
  24. Zhang, Y.Y.; Wu, Z.Q.; Wu, Z.Y.; Liu, Y.D.; Yang, Z.Z. Using Space Syntax in Close Interaction Analysis between the Elderly: Towards a Healthier Urban Environment. Buildings 2023, 13, 1456. [Google Scholar] [CrossRef]
  25. Yin, Y.D.; Zhang, D.; Zhen, M.; Jing, W.Q.; Luo, W.; Feng, W. Combined effects of the thermal-acoustic environment on subjective evaluations in outdoor public spaces. Sust. Cities Soc. 2022, 77, 9. [Google Scholar] [CrossRef]
  26. Huang, J.X.; Zhou, C.B.; Zhuo, Y.B.; Xu, L.Y.; Jiang, Y. Outdoor thermal environments and activities in open space: An experiment study in humid subtropical climates. Build. Environ. 2016, 103, 238–249. [Google Scholar] [CrossRef]
  27. Cleary, M.; Raeburn, T.; West, S.; Childs, C. The environmental temperature of the residential care home: Role in thermal comfort and mental health? Contemp. Nurse 2019, 55, 38–46. [Google Scholar] [CrossRef]
  28. Kim, Y.; Kim, H.; Kim, D.S. Association between daily environmental temperature and suicide mortality in Korea (2001–2005). Psychiatry Res. 2011, 186, 390–396. [Google Scholar] [CrossRef] [PubMed]
  29. Cheng, J.; Meng, S.Q.; Lee, J.; Kwak, H.B.; Liu, Y.Q. Effects of walking and sun exposure on bone density and balance in elderly with osteopenia. J. Bone Miner. Metab. 2022, 40, 528–534. [Google Scholar] [CrossRef]
  30. Cui, Y.F.; Gong, Q.; Huang, C.; Guo, F.; Li, W.; Wang, Y.X.; Cheng, X. The relationship between sunlight exposure duration and depressive symptoms: A cross-sectional study on elderly Chinese women. PLoS ONE 2021, 16, 9. [Google Scholar] [CrossRef]
  31. Ishii, N.; Terao, T.; Araki, Y.; Kohno, K.; Mizokami, Y.; Arasaki, M.; Iwata, N. Risk factors for suicide in Japan: A model of predicting suicide in 2008 by risk factors of 2007. J. Affect. Disord. 2013, 147, 352–354. [Google Scholar] [CrossRef] [PubMed]
  32. Kööts, L.; Realo, A.; Allik, J. The Influence of the Weather on Affective Experience An Experience Sampling Study. J. Individ. Differ. 2011, 32, 74–84. [Google Scholar] [CrossRef]
  33. Martín, L.; March, L. Urban Space and Structures; Cambridge University Press: Cambridge, UK, 1972. [Google Scholar]
  34. Qaoud, R.; Adel, B.; Sayad, B.; Alkama, D.; Attia, S. Assessing the influence of neighborhood urban form on outdoor thermal conditions in the hot dry city of Biskra, Algeria. Ain Shams Eng. J. 2023, 14, 10. [Google Scholar] [CrossRef]
  35. Blocken, B.; Janssen, W.D.; van Hooff, T. CFD simulation for pedestrian wind comfort and wind safety in urban areas: General decision framework and case study for the Eindhoven University campus. Environ. Modell. Softw. 2012, 30, 15–34. [Google Scholar] [CrossRef]
  36. Ramponi, R.; Blocken, B.; de Coo, L.B.; Janssen, W.D. CFD simulation of outdoor ventilation of generic urban configurations with different urban densities and equal and unequal street widths. Build. Environ. 2015, 92, 152–166. [Google Scholar] [CrossRef]
  37. Ng, E. Policies and technical guidelines for urban planning of high-density cities—Air ventilation assessment (AVA) of Hong Kong. Build. Environ. 2009, 44, 1478–1488. [Google Scholar] [CrossRef]
  38. Li, J.N.; Niu, J.L.; Huang, T.Y.; Mak, C.M. Dynamic effects of frequent step changes in outdoor microclimate environments on thermal sensation and dissatisfaction of pedestrian during summer. Sustain. Cities Soc. 2022, 79, 17. [Google Scholar] [CrossRef]
  39. Yu, Y.C.; de Dear, R.; Chauhan, K.; Niu, J.L. Impact of wind turbulence on thermal perception in the urban microclimate. J. Wind Eng. Ind. Aerodyn. 2021, 216, 14. [Google Scholar] [CrossRef]
  40. Hang, J.; Li, Y.G.; Sandberg, M.; Buccolieri, R.; Di Sabatino, S. The influence of building height variability on pollutant dispersion and pedestrian ventilation in idealized high-rise urban areas. Build. Environ. 2012, 56, 346–360. [Google Scholar] [CrossRef]
  41. Chao, Y. Mitigating Urban Heat Island Effects of High Density Cities: A Study at Hong Kong. Archit. J. 2010, 54, 120–123, (In Chinese with English Abstract). [Google Scholar]
  42. Yan, L.; Moyan, Z.; Qimeng, C.; Xin, R.; Xiangfei, G.; Liu, Y. Research on total daily solar radiation in the middle and low density block. Ind. Constr. 2020, 50, 151–158, (In Chinese with English abstract). [Google Scholar] [CrossRef]
  43. Hong, P. Correlation between From Elements and Temperature of Commercial Block in Harbin Central Street. Build. Sci. 2019, 35, 11–17, (In Chinese with English abstract). [Google Scholar]
  44. Tian, J.; Xu, S. A morphology-based evaluation on block-scale solar potential for residential area in central China. Sol. Energy 2021, 221, 332–347. [Google Scholar] [CrossRef]
  45. Darbani, E.S.; Parapari, D.M.; Boland, J.; Sharifi, E. Impacts of urban form and urban heat island on the outdoor thermal comfort: A pilot study on Mashhad. Int. J. Biometeorol. 2021, 65, 1101–1117. [Google Scholar] [CrossRef] [PubMed]
  46. Liu, K.; Xu, X.D.; Huang, W.X.; Zhang, R.; Kong, L.Y.; Wang, X. A multi-objective optimization framework for designing urban block forms considering daylight, energy consumption, and photovoltaic energy potential. Build. Environ. 2023, 242, 19. [Google Scholar] [CrossRef]
  47. Wang, S.S.; Yi, Y.K.; Liu, N.X. Multi-objective optimization (MOO) for high-rise residential buildings’ layout centered on daylight, visual, and outdoor thermal metrics in China. Build. Environ. 2021, 205, 19. [Google Scholar] [CrossRef]
  48. Deng, X.D.; Nie, W.X.; Li, X.H.; Wu, J.; Yin, Z.; Han, J.J.; Pan, H.N.; Lam, C.K.C. Influence of built environment on outdoor thermal comfort: A comparative study of new and old urban blocks in Guangzhou. Build. Environ. 2023, 234, 18. [Google Scholar] [CrossRef]
  49. Wang, B.; Cot, L.D.; Adolphe, L.; Geoffroy, S.; Sun, S. Cross indicator analysis between wind energy potential and urban morphology. Renew. Energy 2017, 113, 989–1006. [Google Scholar] [CrossRef]
  50. Zheng, Y.S.; Ren, C.; Shi, Y.; Yim, S.H.L.; Lai, D.Y.F.; Xu, Y.; Fang, C.; Li, W.J. Mapping the spatial distribution of nocturnal urban heat island based on Local Climate Zone framework. Build. Environ. 2023, 234, 17. [Google Scholar] [CrossRef]
  51. Ding, C.; Cao, X.; Liu, C. How does the station-area built environment influence Metrorail ridership? Using gradient boosting decision trees to identify non-linear thresholds. J. Transp. Geogr. 2019, 77, 70–78. [Google Scholar] [CrossRef]
  52. Dong, W.; Cao, X.Y.; Wu, X.Y.; Dong, Y. Examining pedestrian satisfaction in gated and open communities: An integration of gradient boosting decision trees and impact-asymmetry analysis. Landsc. Urban Plan. 2019, 185, 246–257. [Google Scholar] [CrossRef]
  53. Chen, T.Q.; Guestrin, C.; Assoc Comp, M. XGBoost: A Scalable Tree Boosting System. In Proceedings of the 22nd ACM SIGKDD International Conference on Knowledge Discovery and Data Mining (KDD), San Francisco, CA, USA, 13–17 August 2016; pp. 785–794. [Google Scholar]
  54. Nohara, Y.; Matsumoto, K.; Soejima, H.; Nakashima, N.; Assoc Comp, M. Explanation of Machine Learning Models Using Improved Shapley Additive Explanation. In Proceedings of the 10th ACM International Conference on Bioinformatics, Computational Biology and Health Informatics (ACM-BCB), Niagara Falls, NY, USA, 7–10 September 2019; p. 546. [Google Scholar]
  55. Wu, X.Y.; Tao, T.; Cao, J.S.; Fan, Y.L.; Ramaswami, A. Examining threshold effects of built environment elements on travel-related carbon-dioxide emissions. Transport. Res. Part D-Transport. Environ. 2019, 75, 1–12. [Google Scholar] [CrossRef]
  56. Liu, J.X.; Wang, B.; Xiao, L.Z. Non-linear associations between built environment and active travel for working and shopping: An extreme gradient boosting approach. J. Transp. Geogr. 2021, 92, 12. [Google Scholar] [CrossRef]
  57. Yang, L.; Ao, Y.; Ke, J.; Lu, Y.; Liang, Y. To walk or not to walk? Examining non-linear effects of streetscape greenery on walking propensity of older adults. J. Transp. Geogr. 2021, 94, 103099. [Google Scholar] [CrossRef]
  58. Tao, T.; Wu, X.Y.; Cao, J.; Fan, Y.L.; Das, K.; Ramaswami, A. Exploring the Nonlinear Relationship between the Built Environment and Active Travel in the Twin Cities. J. Plan. Educ. Res. 2023, 43, 637–652. [Google Scholar] [CrossRef]
  59. Liang, J.H.; Huang, S.; Bao, W.W.; Pu, Y.Q.; Liu, M.L.; Yang, X.Z.; Wu, Z.W.; Chen, J.Q.; Dong, G.H.; Chen, Y.J. Longitudinal relationship between built environment and physical fitness in Chinese children and adolescents: Findings from the COHERENCE study. Build. Environ. 2025, 267, 9. [Google Scholar] [CrossRef]
  60. Nejati, F.; Tahoori, N.; Sharifian, M.A.; Ghafari, A.; Nehdi, M.L. Estimating Heating Load in Residential Buildings Using Multi-Verse Optimizer, Self-Organizing Self-Adaptive, and Vortex Search Neural-Evolutionary Techniques. Buildings 2022, 12, 1328. [Google Scholar] [CrossRef]
  61. Ladybug Tools|Ladybug, (n.d.). Available online: https://www.ladybug.tools/ladybug.html (accessed on 14 January 2025).
  62. Ladybug Tools|Butterfly, (n.d.). Available online: https://www.ladybug.tools/butterfly.html (accessed on 14 January 2025).
  63. Evolutionary Engine for Grasshopper3D, Wallacei (n.d.). Available online: https://www.wallacei.com (accessed on 14 January 2025).
  64. TT Toolbox, Food4Rhino. 2013. Available online: https://www.food4rhino.com/en/app/tt-toolbox (accessed on 14 January 2025).
  65. National Bureau of Statistics of China. Report on the Development of the Elderly Career in Beijing. 2023. Available online: https://www.gov.cn/lianbo/difang/202410/content_6979496.htm (accessed on 4 December 2024). (In Chinese)
  66. Alothaimeen, I.; Arditi, D.; Türkakin, O.H. Multi-objective optimization for LEED-new construction using BIM and genetic algorithms. Autom. Constr. 2023, 149, 22. [Google Scholar] [CrossRef]
  67. Joshi, M.Y.; Rodler, A.; Musy, M.; Guernouti, S.; Cools, M.; Teller, J. Identifying urban morphological archetypes for microclimate studies using a clustering approach. Build. Environ. 2022, 224, 15. [Google Scholar] [CrossRef]
  68. Li, H.D.; Liu, Y.G.; Zhang, H.W.; Xue, B.; Li, W.L. Urban morphology in China: Dataset development and spatial pattern characterization. Sust. Cities Soc. 2021, 71, 12. [Google Scholar] [CrossRef]
  69. Geng, X.T.; Xie, D.; Gou, Z.H. Optimizing urban block morphologies for net-zero energy cities: Exploring photovoltaic potential and urban design prototype. Build. Simul. 2024, 17, 607–624. [Google Scholar] [CrossRef]
  70. Naskar, P.R.; Mohapatra, M.; Singh, G.P.; Das, U. Spatiotemporal variations of UTCI based discomfort over India. J. Earth Syst. Sci. 2024, 133, 21. [Google Scholar] [CrossRef]
  71. China Meteorological Administration. China Climate Bulletin. 2022. Available online: https://www.cma.gov.cn/zfxxgk/gknr/qxbg/202303/t20230324_5396394.html (accessed on 14 January 2025).
  72. Ohashi, Y.; Katsuta, T.; Tani, H.; Okabayashi, T.; Miyahara, S.; Miyashita, R. Human cold stress of strong local-wind “Hijikawa-arashi” in Japan, based on the UTCI index and thermo-physiological responses. Int. J. Biometeorol. 2018, 62, 1241–1250. [Google Scholar] [CrossRef]
  73. Blazejczyk, K.; Twardosz, R. Secular changes (1826–2021) of human thermal stress according to UTCI in Krakow (southern Poland). Int. J. Climatol. 2023, 43, 4220–4230. [Google Scholar] [CrossRef]
  74. Kuchcik, M. Mortality and thermal environment (UTCI) in Poland-long-term, multi-city study. Int. J. Biometeorol. 2021, 65, 1529–1541. [Google Scholar] [CrossRef] [PubMed]
  75. Huang, C.Y.; Zhang, G.J.; Yao, J.W.; Wang, X.X.; Calautit, J.K.; Zhao, C.R.; An, N.; Peng, X. Accelerated environmental performance-driven urban design with generative adversarial network. Build. Environ. 2022, 224, 22. [Google Scholar] [CrossRef]
  76. Ma, H.P.; Zhang, Y.J.; Sun, S.Y.; Liu, T.; Shan, Y. A comprehensive survey on NSGA-II for multi-objective optimization and applications. Artif. Intell. Rev. 2023, 56, 15217–15270. [Google Scholar] [CrossRef]
  77. Alam, S.M.K.; Li, P.Y.; Rahman, M.; Fida, M.; Elumalai, V. Key factors affecting groundwater nitrate levels in the Yinchuan Region, Northwest China: Research using the eXtreme Gradient Boosting (XGBoost) model with the SHapley Additive exPlanations (SHAP) method. Environ. Pollut. 2025, 364, 11. [Google Scholar] [CrossRef]
  78. Panda, C.; Mishra, A.K.; Dash, A.K.; Nawab, H. Predicting and explaining severity of road accident using artificial intelligence techniques, SHAP and feature analysis. Int. J. Crashworthiness 2023, 28, 186–201. [Google Scholar] [CrossRef]
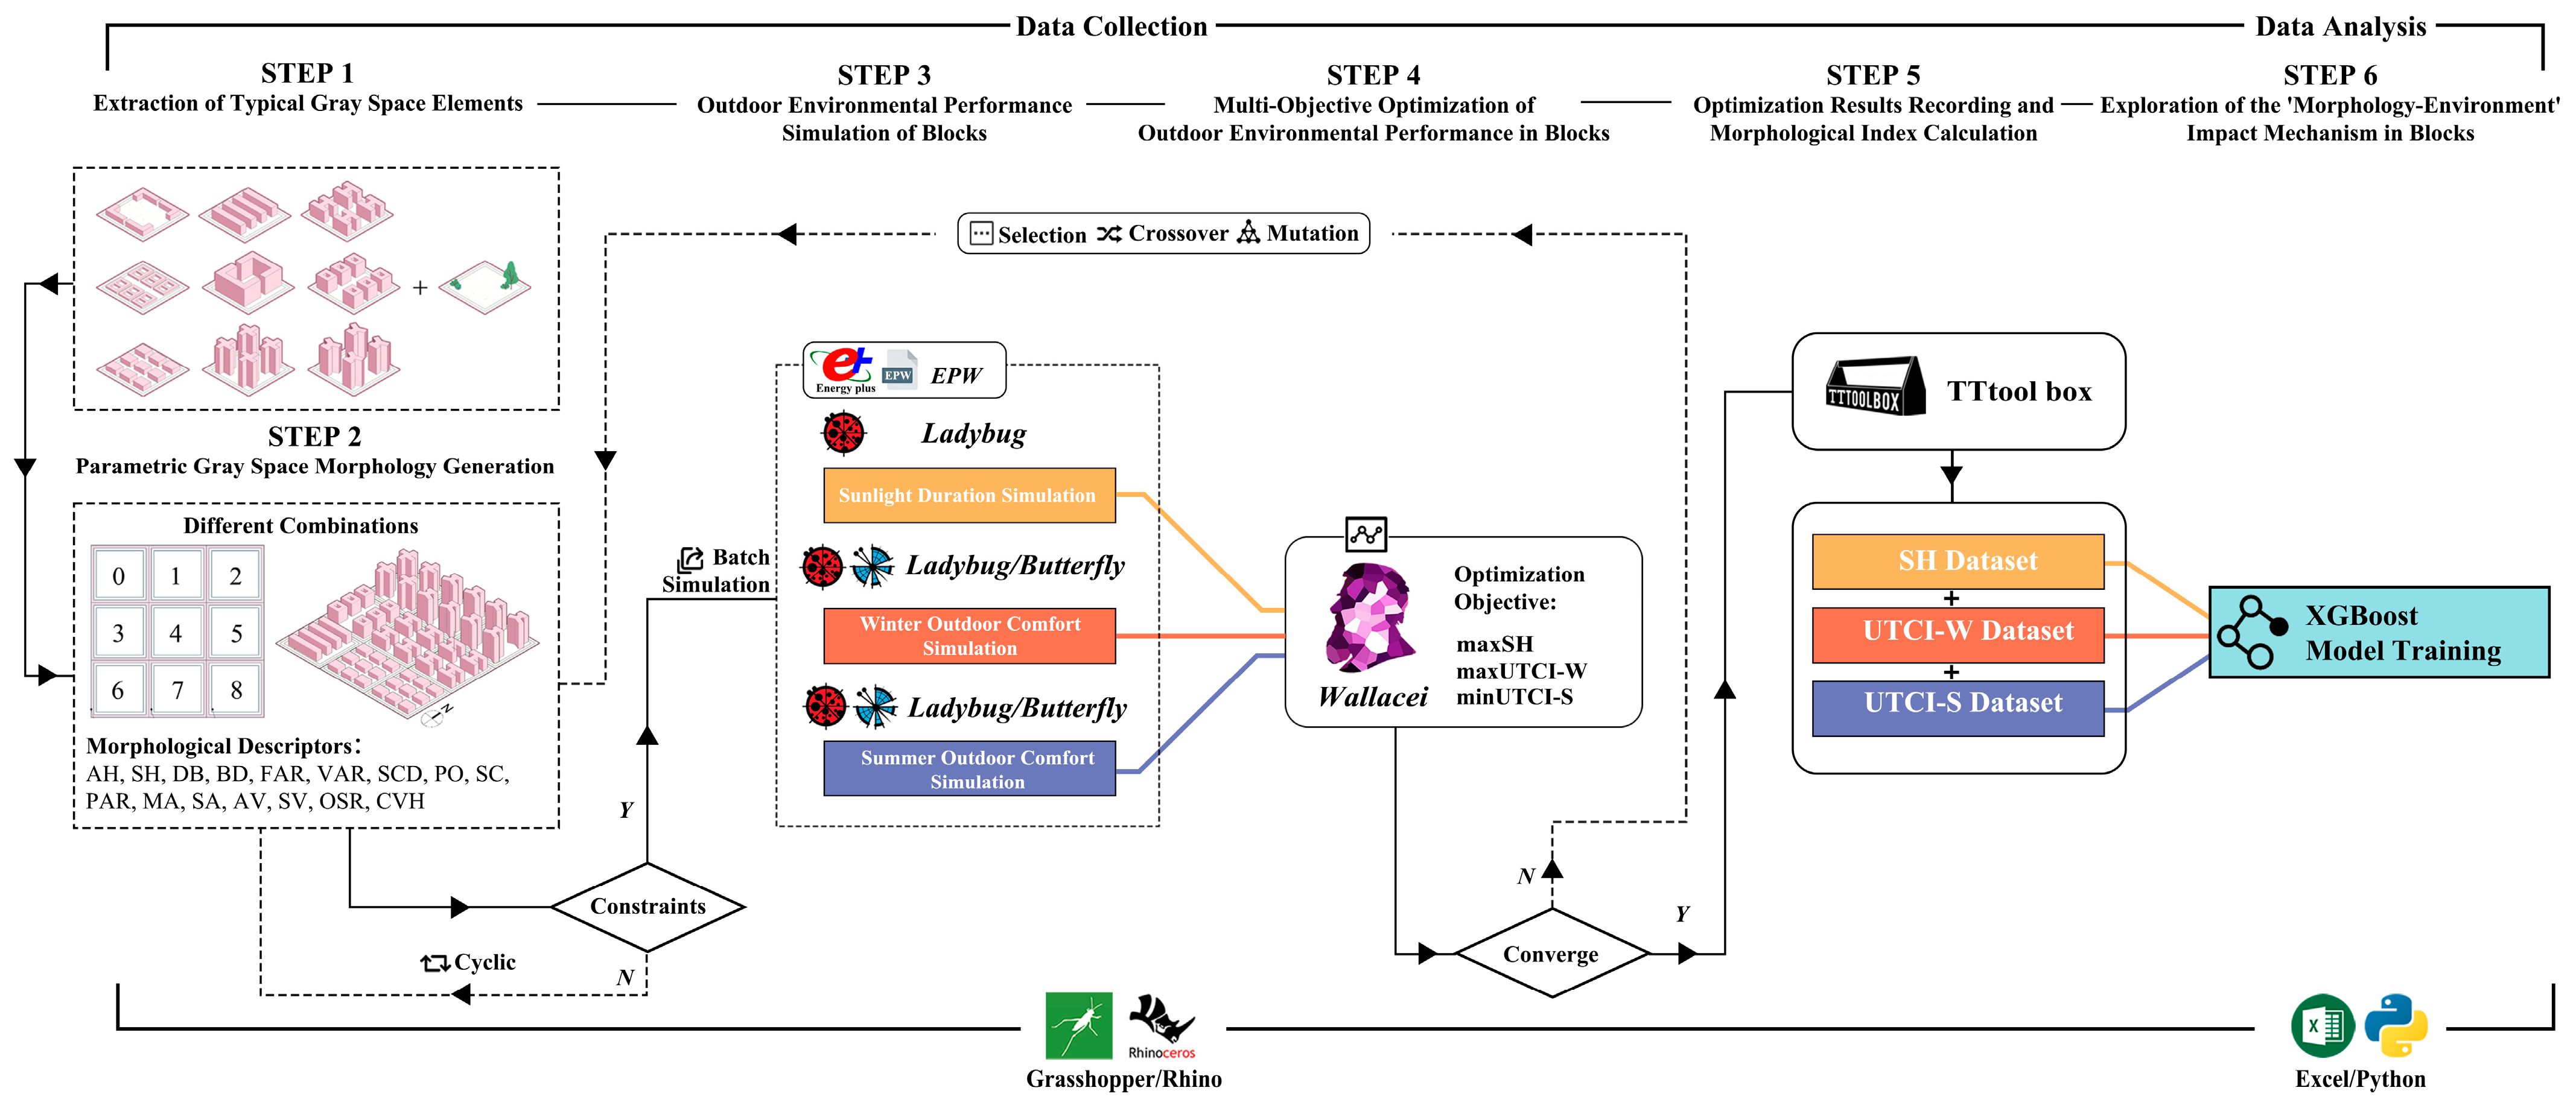
Figure 1. Workflow of this study. (In the figure, Y/N indicates whether the generated result meets the constraints. If it is Y (yes), the generated result will proceed to the next step along the solid line. If it is N (no), the generated result will return to the previous step along the dotted line and enter a loop).
Applsci 15 01449 g001
Figure 2. Study area and distribution of survey points.
Applsci 15 01449 g002
Figure 3. Building type simplification with specific modeling parameters. (The figure shows the information of nine different types of buildings, including axonometric drawings (on the left), floor plans (on the upper right), and elevation drawings (on the lower right)).
Applsci 15 01449 g003
Figure 4. Neighborhood generation process.
Applsci 15 01449 g004
Figure 5. Visualization of morphological indicators: definitions and calculation methods.
Applsci 15 01449 g005
Figure 6. UTCI calculation flowchart. The arrows in the figure represent the simulation and calculation process of UTCI values using basic climate data.
Applsci 15 01449 g006
Figure 7. Standard deviations of objectives and average values of Pareto solution sets during the optimization process. (a) Standard deviation of objectives in the optimization process for UTCI-S. (b) Standard deviation of objectives in the optimization process for UTCI-W. (c) Standard deviation of objectives in the optimization process for SH. (d) Average values of Pareto solution sets for UTCI-S. (e) Average values of Pareto solution sets for UTCI-W. (f) Average values of Pareto solution sets for SH.
Applsci 15 01449 g007
Figure 8. Boxplots of data distribution for feasible solutions and Pareto solutions. (a) Data distribution for feasible solutions and Pareto solutions of UTCI-S. (b) Data distribution for feasible solutions and Pareto solutions of UTCI-W. (c) Data distribution for feasible solutions and Pareto solutions of SHs. The points in the figure represent the discrete data points in the three - group data, and the lines are the markers of the median.
Applsci 15 01449 g008
Figure 9. Three-dimensional (3D) bar charts of spatial morphology optimization results. (a) Data distribution of feasible solutions in the design space. (b) Data distribution of Pareto solutions optimized by the algorithm.
Applsci 15 01449 g009
Figure 10. Interpretability analysis of the UTCI-S model using explainable machine learning. (a) SHAP value bar plot. (b) SHAP summary plot. The black line in the figure is a reference line for a SHAP value of 0. The features corresponding to the points on the left of the line have negative SHAP values, while the features corresponding to the points on the right of the line have positive SHAP values.
Applsci 15 01449 g010
Figure 11. Interpretability analysis of the UTCI-W model using explainable machine learning. (a) SHAP value bar plot. (b) SHAP summary plot.
Applsci 15 01449 g011
Figure 12. Interpretability analysis of the SH model using explainable machine learning. (a) SHAP value bar plot. (b) SHAP summary plot.
Applsci 15 01449 g012
Table 1. Formulas for morphological indicators.
Indicator NameIndicator SymbolFormulaIndicator Unit
Average Building HeightAH A H = i = 1 n h i × n n m
Standard Deviation of Building HeightStdH S t d H = 1 n ( h i h ¯ ) 2 m
Distance Between BuildingsDB D B = 1 n i = 1 n d i m
Building DensityBD B D = i = 1 n f i S T %
Floor–Area RatioFAR F A R = i = 1 n A f S T -
Volume–Area RatioVAR V A R = i = 1 n V o l u m e i S T m
Space Crowding DensitySCD S C D = i = 1 n V o l u m e i H m a x S T -
PorosityPO P O = ( H m a x S T ) i = 1 n V o l u m e i H m a x S T %
Shape CoefficientSC S C = i = 1 n C i i = 1 n h i f i -
Perimeter–Area RatioPAR P A R = i = 1 n P i i = 1 n f i -
Mean Building AreaMA M A = 1 n i = 1 n f i m2
Standard Deviation of Building AreaSA S A = 1 n ( f i f ¯ ) 2 m2
Average Building VolumeAV A V = 1 n i = 1 n V o l u m e i m3
Standard Deviation of Building VolumeSV S V = 1 n ( V o l u m e i V ¯ ) 2 m3
Open Space RatioOSR O S R = S T i = 1 n f i i = 1 n f i %
Coefficient of Variation for Building HeightCVH C V H = S H h ¯ m
Table 2. The NSGA-II algorithm’s parameter configurations.
ElitismMutation ProbabilityMutation
Rate
Crossover RateMutation Distribution IndexGeneration SizeGeneration Count
0.50.30.50.9205060
Table 3. Model performance of XGBoost-TPE R2.
DatasetTraining Set (R2)Testing Set (R2)
UTCI-S0.9440.712
UTCI-W0.9930.843
SH1.0000.966
Disclaimer/Publisher’s Note: The statements, opinions and data contained in all publications are solely those of the individual author(s) and contributor(s) and not of MDPI and/or the editor(s). MDPI and/or the editor(s) disclaim responsibility for any injury to people or property resulting from any ideas, methods, instructions or products referred to in the content.