Article

High-Pressure Hydrogen Charge Check-Valve Energy Loss-Based Correlation Analysis Affecting Internal Flow Characterizations

by
Seung-Hun Oh
1,
Sun-Min Jang
1 and
Hyun-Kyu Suh
2,*
1
Graduate School of Mechanical Engineering, Kongju National University, 1223-24 Cheonan-daero, Seobuk-gu, Cheonan-si 31080, Chungcheongnam-do, Republic of Korea
2
Division of Mechanical and Automotive Engineering, Kongju National University, 1223-24 Cheonan-daero, Seobuk-gu, Cheonan-si 31080, Chungcheongnam-do, Republic of Korea
*
Author to whom correspondence should be addressed.
Appl. Sci. 2025, 15(3), 1428; https://doi.org/10.3390/app15031428
Submission received: 30 December 2024 / Revised: 27 January 2025 / Accepted: 28 January 2025 / Published: 30 January 2025

Abstract

:
In this study, we analyzed changes in flow characteristics and energy-dissipation characteristics due to changes in hydrogen temperature and inlet/outlet differential pressure in a check valve, which affect the storage safety and reliability of high-pressure hydrogen refueling systems. The effects of flow separation and recirculation flow generation at the back end of the valve were investigated, and the pressure, flow rate, pressure coefficient, and energy dissipation at the core part (where the hydrogen inflow is blocked) and the outlet part (where the hydrogen is discharged) were numerically analyzed. The hydrogen-inlet temperature (Tin) was selected as 233 K, 293 K, and 363 K, and the differential pressure (∆P) was selected in the range of 2 to 10 MPa in 2 MPa steps. To ensure the reliability of the numerical results, mesh dependence was performed, and the effect of the mesh geometry on the results was less than 2%. The numerical simulation results showed that the hydrogen introduced into the core part is discharged into the discharge part, and the pressure decreases by up to 6% and the velocity increases by up to 16% at the 95 mm position of the L-shaped curved tube. In addition, for the hydrogen-inlet temperature of 233 K in the L-shaped curved tube, the flow velocity decreases by up to 60% and the pressure coefficient increases at the 2.3 mm point in the Y-axis direction, indicating that the main flow area is biased towards the bottom of the valve due to the constriction of the veins caused by flow separation. The TDR results showed that the hydrogen discharge to the discharge region increased by 96% at 95 mm compared to 90 mm, and the turbulent kinetic energy of the hydrogen was dissipated, resulting in a temperature increase of up to 4.5 K. The exergy destruction was maximized in the core region where flow separation occurs, indicating that the pressure, velocity, and TDR changes due to flow separation and recombination have a significant impact on the energy loss of the flow in the check valve.

1. Introduction

In recent years, there has been increasing interest in developing technologies that utilize hydrogen—an environmentally friendly energy source that has the advantage of controllable carbon dioxide emissions and low environmental pollutant emissions—to move towards a carbon-neutral society [1,2,3]. In particular, since hydrogen fuel-cell vehicles use electricity generated by the reaction of hydrogen and oxygen in the gaseous state as an energy source, it is necessary to develop technologies for the efficient production, storage, and transport of hydrogen. In general, hydrogen is currently stored by compressing gaseous hydrogen under high pressure in order to increase the range of hydrogen fuel-cell vehicles and make hydrogen storage more economical and efficient [4,5,6,7].
Hydrogen storage systems are regulated by the SAE J2601 Hydrogen Charging Protocol, which specifies the maximum storage pressure and temperature range of hydrogen. Depending on the class of hydrogen tank, hydrogen is stored at high pressure, such as 35 MPa or 70 MPa [8], and in order to utilize hydrogen in the gaseous state at high pressure, it is essential to decompress it to a certain pressure, but the safety of this process is being improved for the commercialization of hydrogen energy [9,10]. As a safety component of hydrogen storage systems, the check valve directly affects the safety of the hydrogen storage system by preventing depressurization and reverse flow during the hydrogen storage process and by blocking the inflow of hydrogen under abnormal pressure conditions through flow, temperature and pressure control. In particular, during this process, performance degradation occurs due to energy loss from flow resistance caused by changes in the state of the hydrogen entering the check valve and internal geometry, which directly affects the performance of the hydrogen storage system [11]. Therefore, research on check valves that directly affect the supply and shut-off of hydrogen is necessary to ensure the safety and reliability of hydrogen storage systems.
This need has led to the following studies for hydrogen energy utilization. Yu et al. [12] parameterized the control elements of a conical hydrogen control pressure-reducing valve and analyzed the correlation between hydrogen decompression performance, cone angle, and pressure difference when the flow is stable and constant. This results showed that the flow characteristics along the surface change from a free jet to a parallel flow when the cone angle is less than 45 degrees, confirming that the optimization of the cone structure has a significant effect on the flow pattern and hydrogen decompression performance at the surface. Qian et al. [13] analyzed the energy loss and exergy loss within the valve by analyzing the number of stages and pressure ratio between the inlet and outlet of the valve for a multi-stage hydrogen decompression valve. The results show that the Mach number and exergy losses increase as the pressure ratio increases, but the opposite is true as the number of valve stages decreases. Ye et al. [14] analyzed the effect of the spool head angle of the check valve on the performance and transient hydrogen flow characteristics based on the moving mesh technique. They found that the time to reach the maximum spool displacement decreased as the spool head angle increased from 10 degrees to 50 degrees. Ariyadi et al. [15] analyzed the flow and noise generation characteristics inside a solenoid check valve during rapid hydrogen charging by numerical analysis. As a result, the number and area of the outlets were changed to reduce the intensity of the strong turbulence at the bottom of the valve, which resulted in a reduction in noise generation.
Previous studies have analyzed decompression and flow characteristics in response to changes in valve geometry conditions but have not analyzed the impact of energy losses due to pressure and temperature changes within the valve on valve performance. Among them, changes in pressure, temperature, and turbulence characteristics affect energy efficiency, which is expected to have a significant impact on valve performance, charging efficiency, and safety [16,17,18]. Therefore, it is necessary to analyze the effects of changes in hydrogen charging conditions and changes in valve internal pressure, temperature, and turbulence characteristics on energy loss, and to identify quantitative correlations between changes in turbulence and flow characteristics and energy loss.
Therefore, this study qualitatively compared the changes in turbulence characteristics due to changes in flow conditions inside the check valve through flow velocity, pressure, and turbulent dissipation rate (TDR) results, then quantitatively analyzed the energy loss through exergy destruction results. For this purpose, we compared the flow changes inside the valve due to the differential pressure at the inlet and outlet of the check valve and the temperature change of the incoming hydrogen, and then we analyzed the results in terms of pressure distributions, velocity distributions, and turbulent dissipation ratio (TDR). In addition, temperature, velocity, and pressure coefficients were analyzed to determine the effect of flow resistance on fluid flow in the check valve, and the effect of flow resistance on energy loss was quantitatively analyzed by comparing the results of exergy destruction, which is an irreversible energy loss caused by the dissipation of turbulent kinetic energy.

2. Numerical Analysis Method

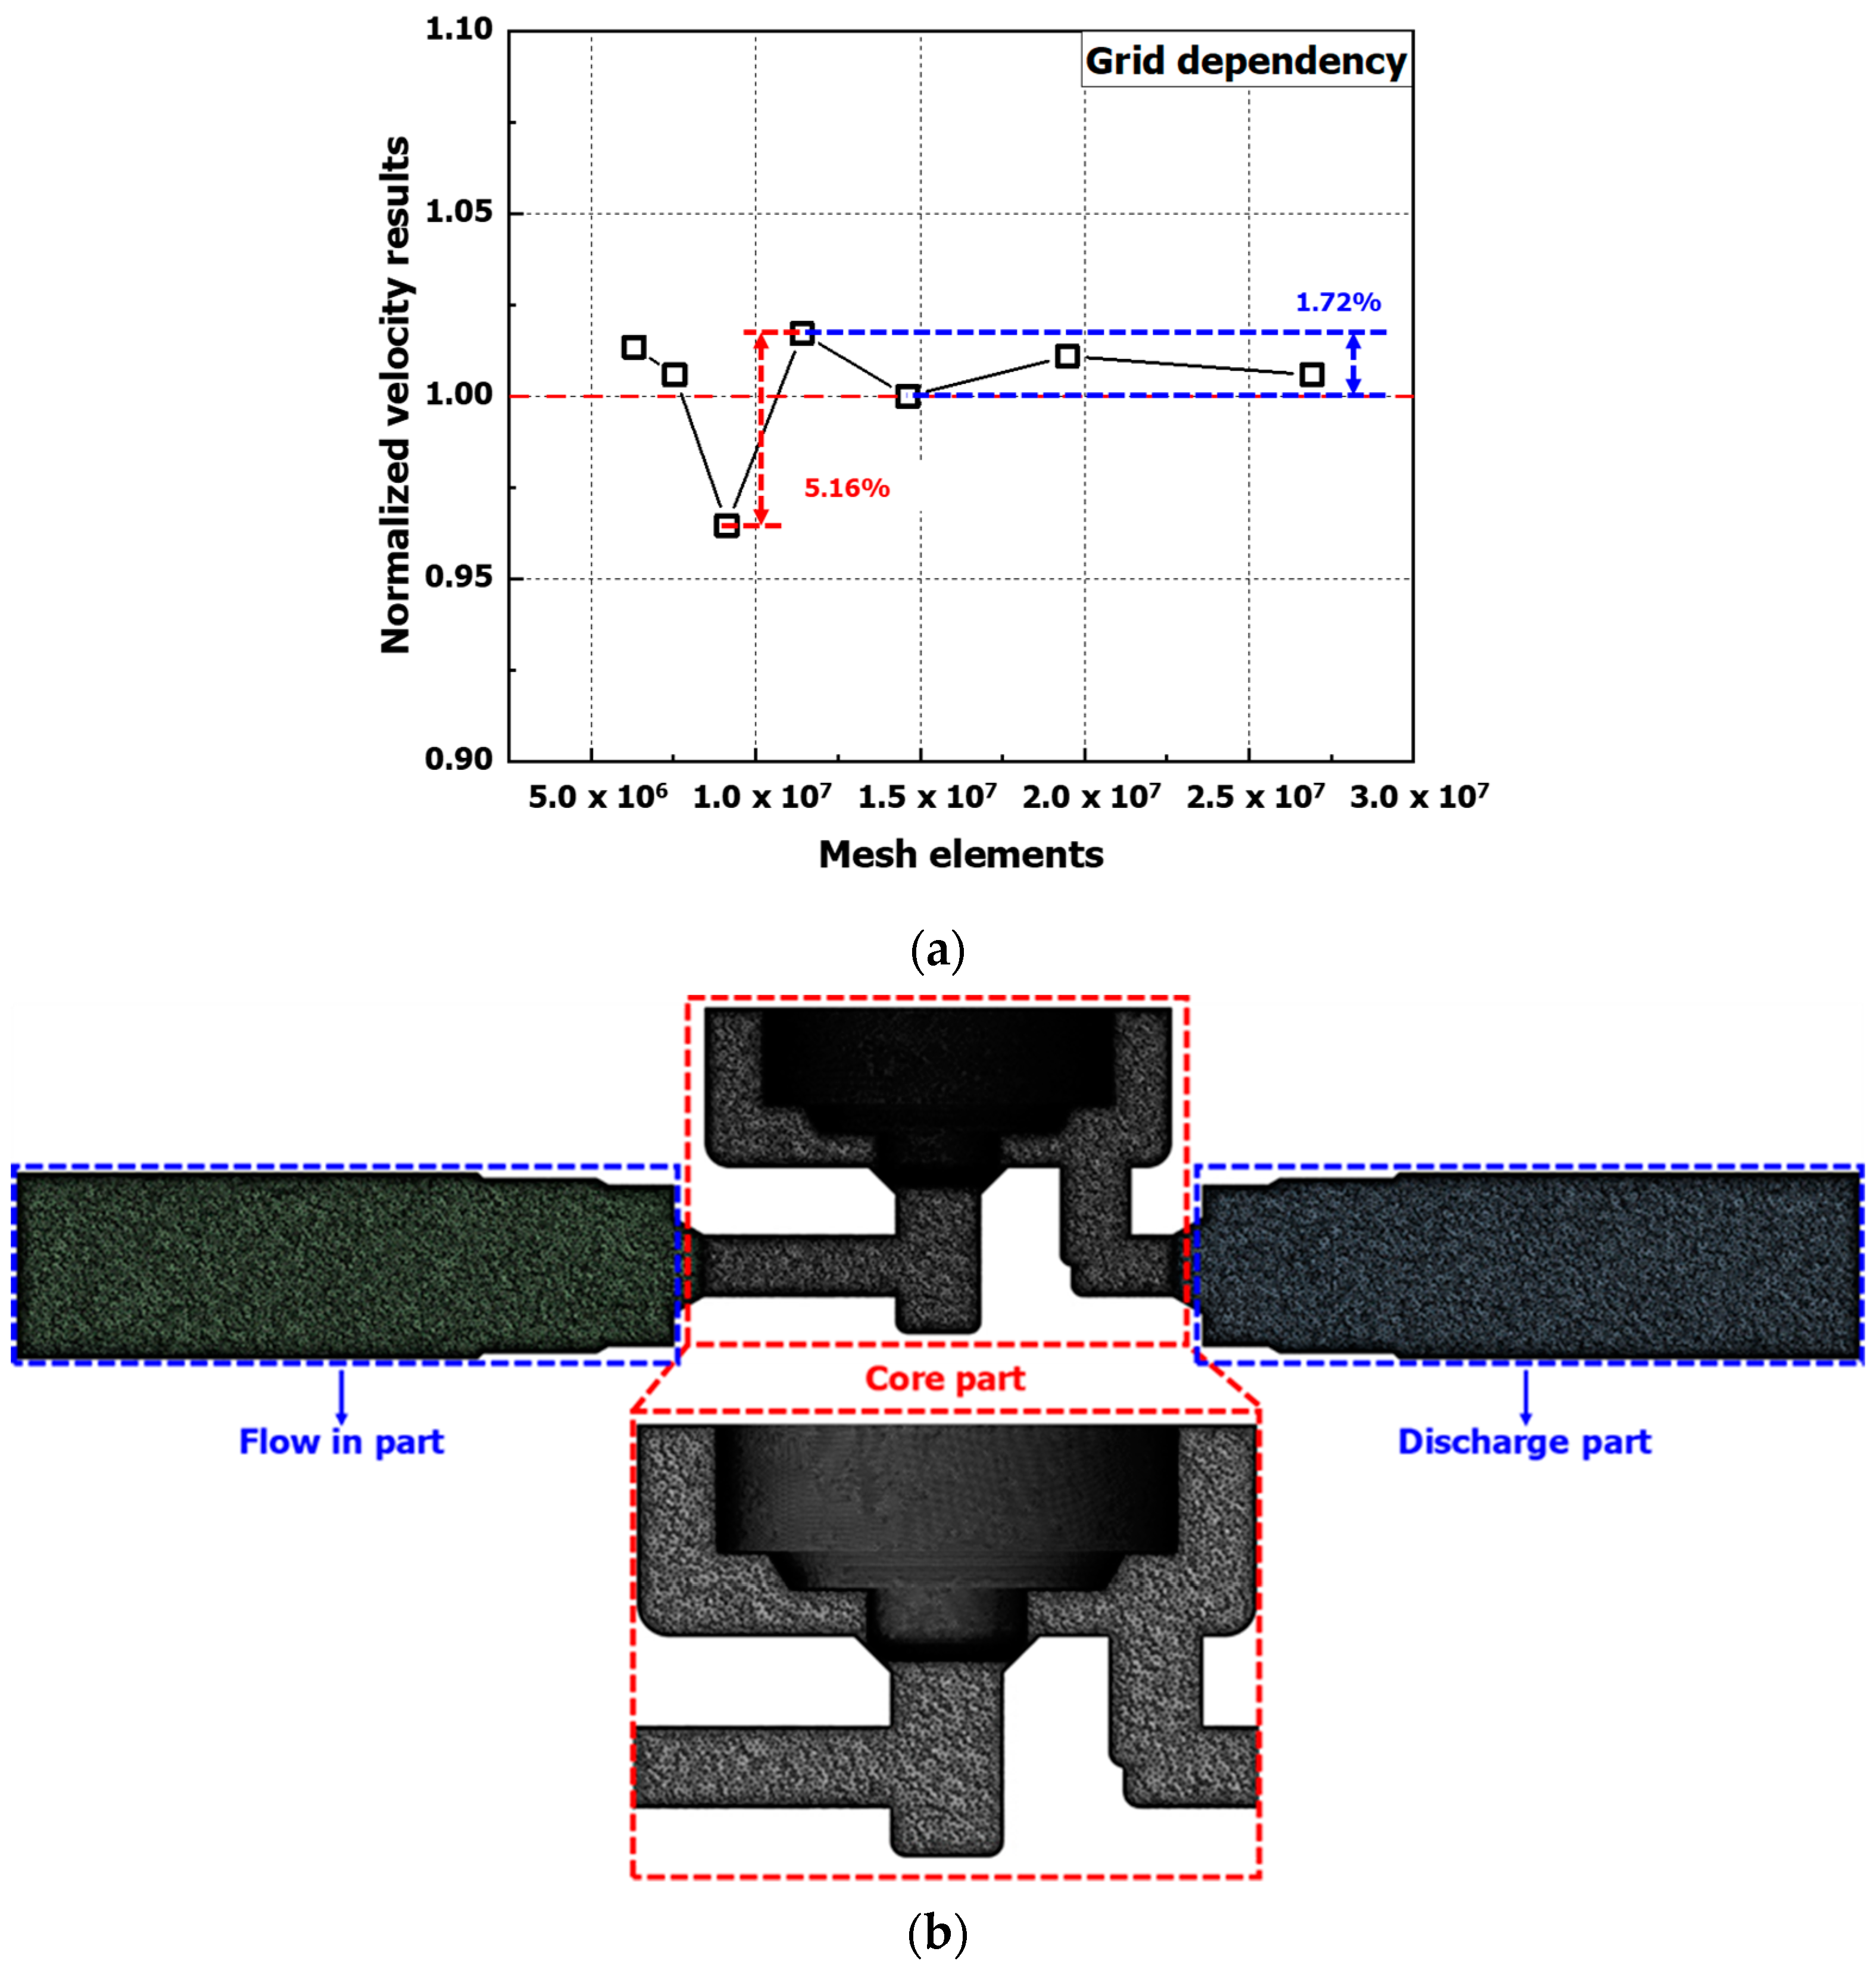
2.1. Check-Valve Shape and Analysis Conditions

In this study, a solenoid-type check valve, which blocks the hydrogen flow when the pressure and temperature limits of the hydrogen refueling process are exceeded, was applied to the numerical analysis. The check valve was selected to be in the normal open state (Open ratio = 100%), which is a condition where hydrogen flows in without changing the open ratio during the normal charging process. In order to compare the results in the area where hydrogen flows in and out of the core part, which is the area blocking the hydrogen inflow of the check valve shown in Figure 1a, a total of 150 mm of pipe geometry was applied before and after the valve to simulate the fully developed flow. The detailed geometry and specifications of the check valve used in this study are shown in Figure 1a and Table 1.
For the numerical analysis, the charging conditions of the check valve were selected based on the hydrogen charging protocol (SAE J2601). The inlet pressure of the check valve (Pin) was selected to be 70 MPa, and the outlet pressure (Pout) was equally spaced at 2 MPa [8]. To select the initial inlet temperature (Tin) condition of the hydrogen, we selected 233 K for the cryogenic temperature, 298 K for the normal temperature, and 363 K for the high temperature, referring to the charging limit temperature range specified in the hydrogen charging protocol. In addition, during the numerical analysis, the wall was subjected to the no-slip condition, the solution methods were subjected to the coupled scheme condition, and the spatial discretization was subjected to the second-order upwind scheme. The details of the check-valve differential pressure (∆P) and inlet temperature (Tin) conditions are shown in Table 2.
To determine the effect of energy loss in the check valve on performance, the exergy destruction results were analyzed. Exergy represents the useful potential work of a given amount of energy in a given state and is the thermodynamic losses that occur due to irreversibility within a system. Therefore, the turbulence characteristic changes and energy losses were calculated as shown in Equations (1)–(3) by comparing the exergy destruction within the system boundary due to the entropy that flows into and out of the system and is destroyed by the irreversible effect. In addition, the flow-separation phenomenon and energy change were analyzed by comparing the pressure coefficient (Cp)—a dimensionless number that indicates how much the pressure at a given point in the flow has changed compared to the dynamic pressure of the free flow, which is calculated as shown in Equation (4).
ψ = h h 0 T 0 S S 0 + V 2 2 + g z
Δ ψ = h 2 h 1 T 0 S 2 S 1 + V 2 2 V 1 2 2 + g ( Z 2 Z 1 )
( 1 T 0 T K ) q K W + ψ 1 ψ 2 x d e s t r o y e d = 0
Equation (1) is the exergy of the flow or stream, and Equation (2) is the exergy change of the flowing fluid from state 1 to state 2. h is enthalpy, S is entropy, V 2 2 is kinetic energy, gz is potential energy, and T0 is the temperature state of the matter at rest. Equation (3) represents a single-flow exergy equilibrium with one inlet and one outlet in a steady flow process, where ψ 1 and ψ 2 are the flow exergy at the inlet and outlet, and x d e s t r o y e d is the exergy loss.
C P = p p γ 2 p M 2
In Equation (4), P is the static pressure at the computation site, P is the pressure in the free flow, and M is the Mach number in the far field [19].
In order to analyze the changes in the flow and turbulence characteristics inside the check valve in response to changes in the inlet temperature and outlet pressure of hydrogen, a measurement position was selected in the X-axis direction of the check valve, as shown in Figure 1b. Measurement positions at 5 mm intervals were selected based on the core part, where the flow changes significantly due to the decrease in flow path area, and the results were analyzed from the point after x = 65 mm to the check-valve outlet, where flow characteristics change significantly due to the change in flow path area. In addition, the average pressure and velocity results were measured according to the X-axis direction measurement position to analyze the overall flow characteristic changes in the core part and the discharging part, where local flow changes occurred more and less. To analyze the flow-separation result in the L-shaped curved tube area, the line measurement position in the Y-axis direction was selected to compare the U-direction velocity result with the pressure coefficient result.
If the mesh geometry in the numerical analysis is dense or rough, it will affect the reliability of the analysis results, so it is necessary to configure the appropriate mesh elements and geometry [20]. Therefore, in order to analyze the effect of mesh formation conditions on the results, a mesh dependency validation was performed, as shown in Figure 2a. The mesh dependency was performed at the check-valve hydrogen-inlet temperature (Tin) of 233 K and outlet pressure (Pout) of 60 MPa. The flow velocity results at the y = 6.8 mm position in the y-axis direction of the core part area, which is expected to be affected by the number of mesh elements due to the decrease in the flow area, are compared and analyzed. As shown in Figure 2a, the error of the obtained results tends to stabilize gradually as the number of mesh elements increases. As the number of mesh elements increases from about 9 × 10⁶ to 1.1 × 10⁷, the results affected by the number of mesh elements show a difference of up to about 5%, but when the mesh condition changes after 1.4 × 10⁷, the error rate of the results is within 1%. Therefore, a mesh element number of 1.4 × 10⁷ was selected and applied to the numerical analysis because the mesh element number and shape have a small effect on the results, satisfy the grid dependency, and have the advantage of analysis time. In addition, the mesh geometry applied in the numerical simulation consisted of a tetrahedral lattice system, 12 prism layers were created to simulate the flow at the check-valve wall, and mesh conditions with Y+ ranging from 30 to 300 were applied. The results are shown in Figure 2b.

2.2. Turbulence Models

The type of turbulence model has an important influence on the numerical solution time, the reliability of the results, and the flow and viscous properties of the flowing fluid. In this study, the realizable k-ϵ model, which calculates the Reynolds stress similarly to the actual turbulence, was applied to simulate the flow characteristics and compressible turbulence characteristics of hydrogen under high pressure in a check valve [21,22,23,24].
t ρ u i + x j ρ u i u j = p x i + p x j μ u i x j + u j x i 2 3 δ i j u l x l + x j ( ρ u i u j ¯ )
ρ u i u j ¯ = μ t u i x j + u i x i 2 3 ρ k + μ t u k x k δ i j
μ t = ρ C μ k 2 ϵ
The realizable k-ϵ model derived from the Reynolds Averaged Navier–Stokes (RANS) equation, which is expressed as Equation (5), is solved for the Reynolds stress term and the average velocity gradient term by applying the Boussinesq hypothesis, which is shown in Equation (6). At this time, the μ t (turbulent viscosity) of the realizable k-ϵ model is expressed as in Equation (7).
t ρ k + x j ρ k u j = x j μ + μ t σ k k x j + G k + G b ρ ϵ Y M + K k
t ρ ϵ + x j ρ ϵ u j = x j μ + μ t σ ϵ ϵ x j + ρ C 1 S ϵ ρ C 2 ϵ 2 k + ν ϵ + C 1 ϵ ϵ k C 3 ϵ G b + S ϵ
The realizable k-ϵ model is governed by the transport equation, where the turbulent kinetic energy (k) term in Equation (8) and the turbulent dissipation rate (ϵ) term in Equation (9) are summarized by the transport equation, and Y M represents the effect of the fluctuating expansion of the dissipation rate in the turbulent flow. σ k and σ ϵ represent the turbulent Prandtl numbers for the turbulent kinetic energy and the turbulent dissipation rate, and G k and G b are the turbulent kinetic energy summarized by the buoyancy force and the averaged velocity gradient [25].

3. Result and Discussions

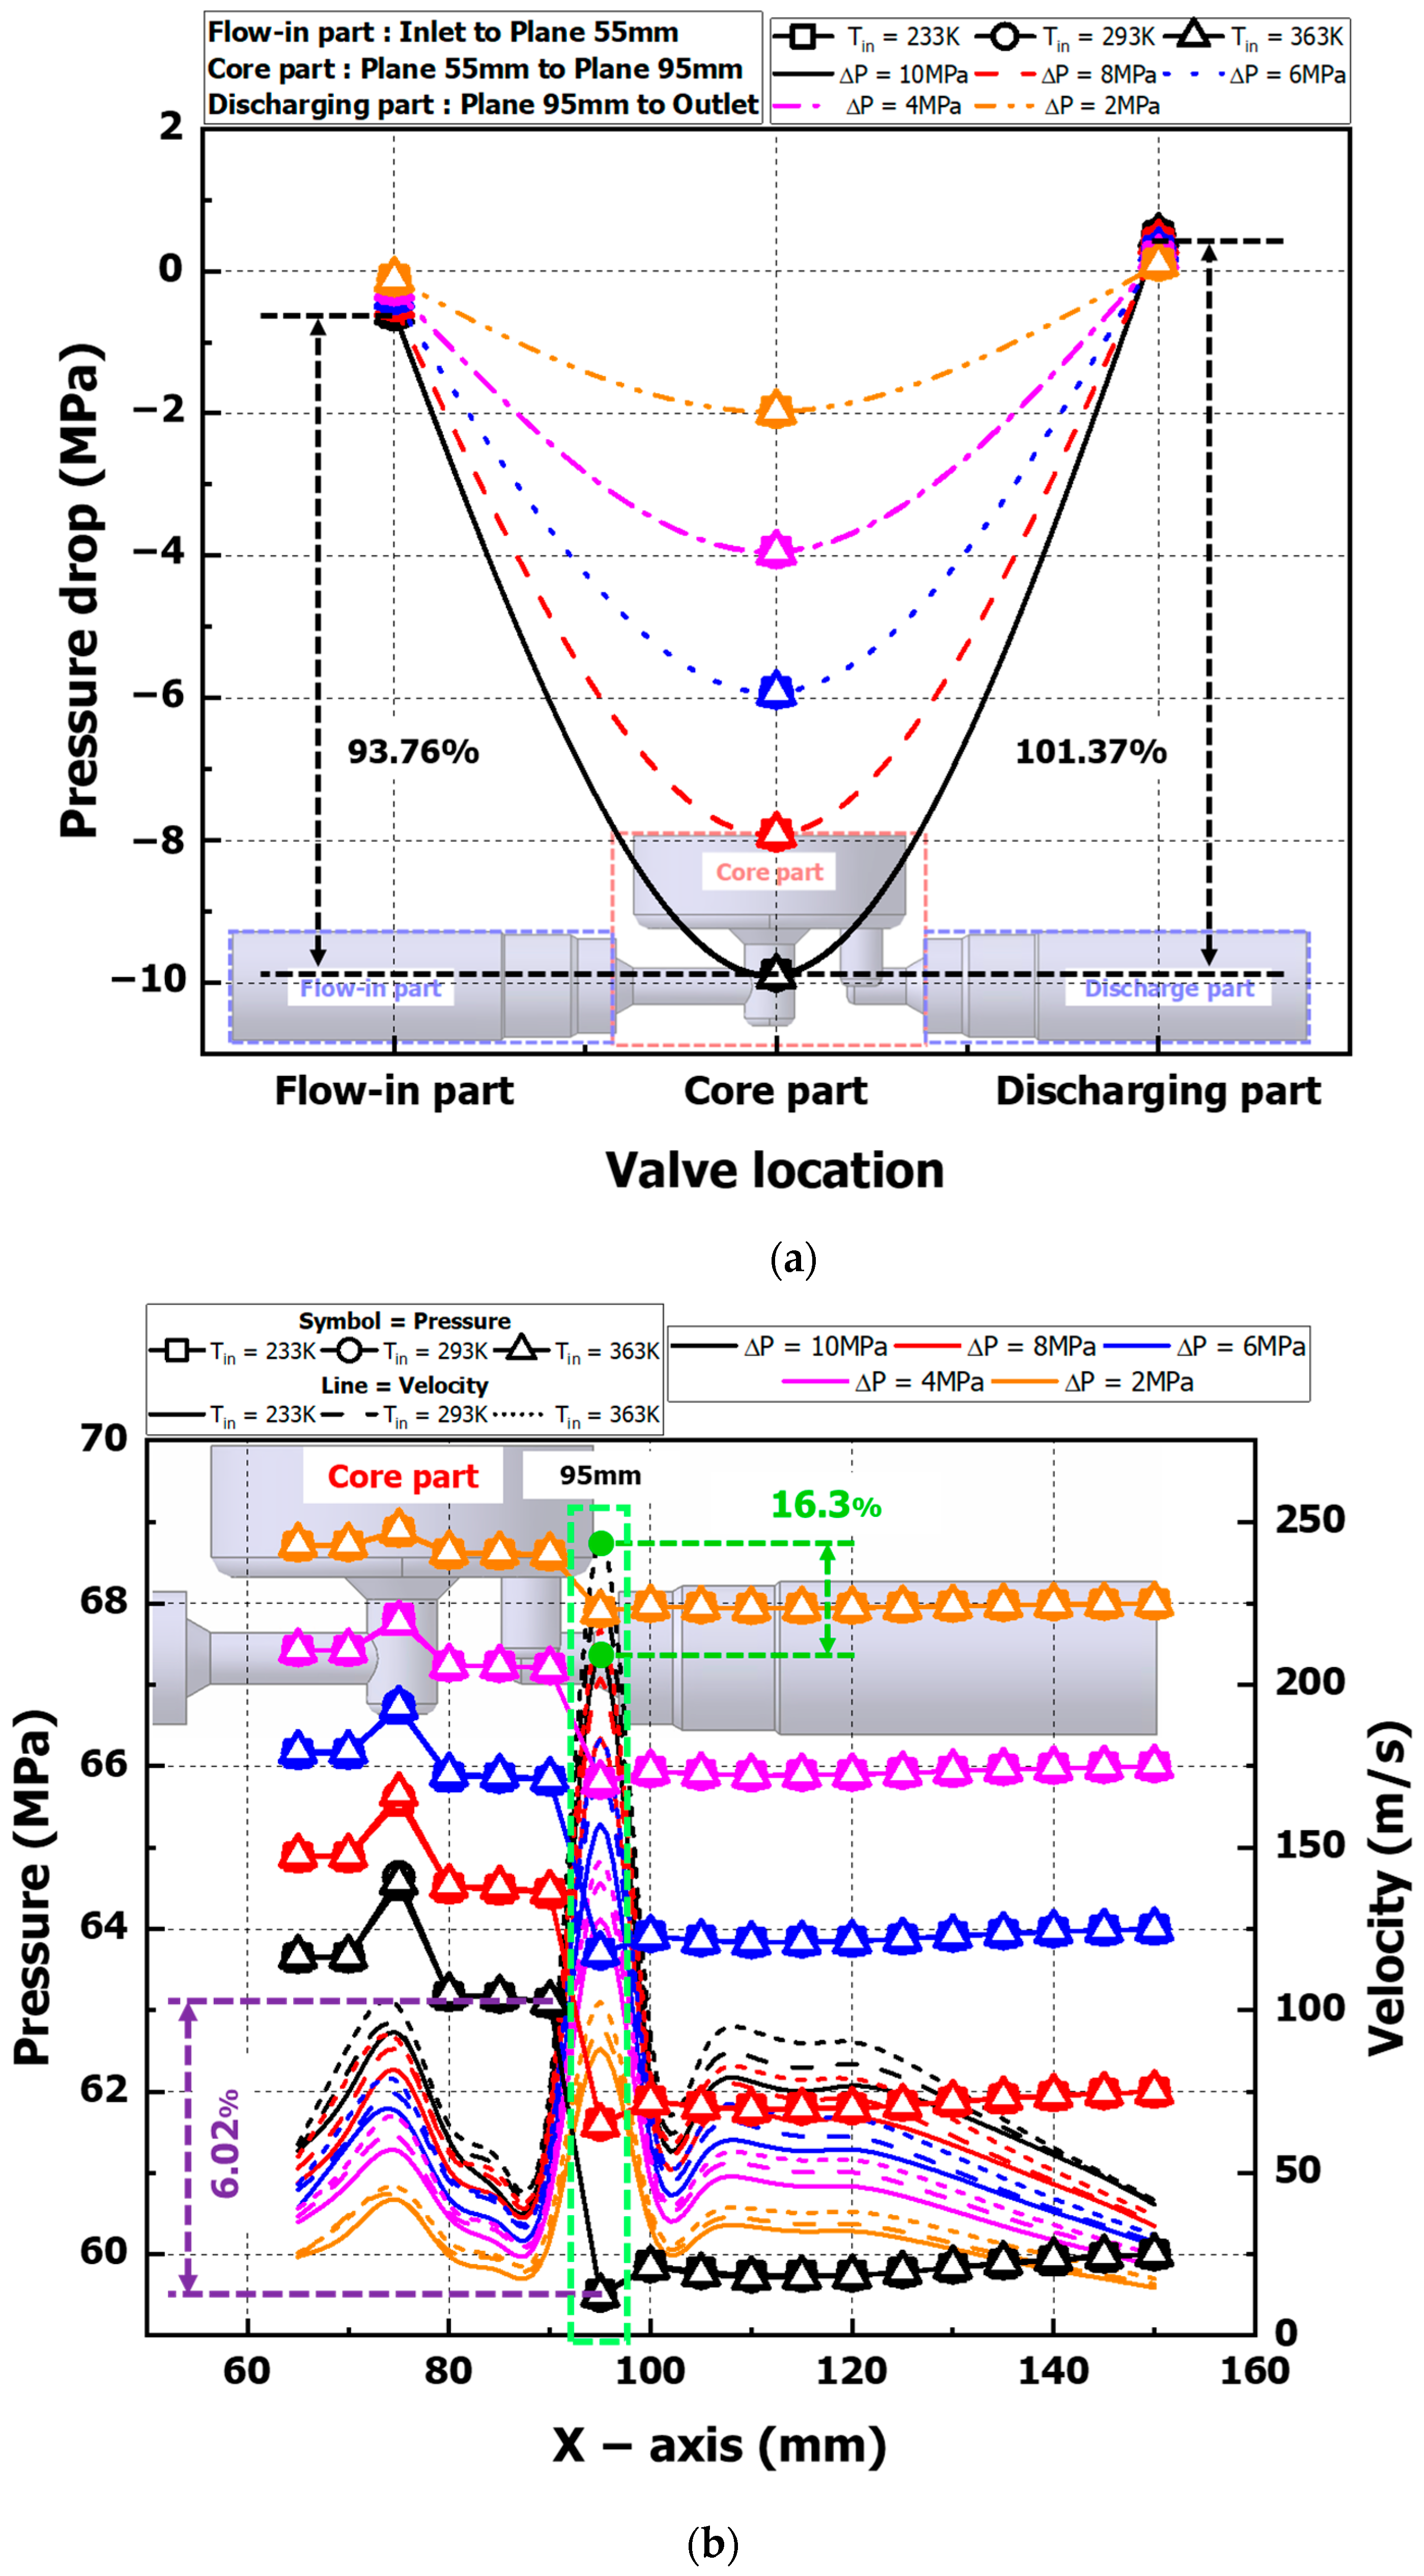
3.1. Analysis of Pressure and Velocity Results According to Inlet Temperature and Differential Pressure Change

Figure 3 shows the in-valve pressure and flow results for the check-valve differential pressure (∆P) and hydrogen-inlet temperature (Tin) conditions. The pressure change distributions in Figure 3a show that the pressure decreases locally in the nozzle neck region of the core part where the area of the flow path decreases rapidly, and the pressure has a constant distribution in the upper part of the core part where the area of the flow path increases, but the pressure decreases significantly as hydrogen is discharged to the discharging part. The results of the flow velocity change distribution for the flow direction in Figure 3b show that the flow direction changes to the (+)Y axis due to the inflow of hydrogen into the core part, and the flow velocity locally increases significantly in the nozzle neck region, where the flow area decreases sharply. The flow velocity decreases at the top of the core part, where the flow area increases, and the flow changes in the (−)Y-axis direction. Hydrogen is discharged into the discharging part, and we can see that the flow changes in the X-axis direction through the L-shaped curved tube. At this time, it can be seen that the pressure decreases significantly in the L-shaped curved tube area and the flow rate tends to increase to the maximum. Also, the flow-separation phenomenon occurs, which diverts the flow to the lower part of the check valve.
Figure 4a shows the pressure drop results from the flow-in part to the discharging part for the flow direction. In the flow-in part, before the hydrogen enters the core part, a pressure drop of up to 0.6 MPa occurs under the conditions of a 233 K hydrogen-inlet temperature (Tin) and a 10 MPa differential pressure (∆P), and a pressure drop of up to 9.89 MPa occurs in the core part, where the area change of the flow passage occurs rapidly. The pressure-drop result at the discharging part shows that the pressure of hydrogen is recovered, and the pressure change due to the change in the area of the flow path at the core part location is considered to be the dominant influence on the pressure-drop result.
Figure 4b graphs the pressure and flow velocity results at the measurement positions in the X-axis direction to analyze the overall flow characteristics inside the core part. It can be seen that the pressure decreases significantly at the 95 mm point, where the L-shaped curved tube that discharges hydrogen to the discharging part is located, and the pressure in the 95 mm region is reduced by up to 6% compared to the 90 mm region under the condition of 10 MPa differential pressure (∆P). The hydrogen discharged to the discharging part shows a local pressure increase after the X = 100 mm point of the plane and then shows a constant distribution, which is understood to be due to the stabilization of the flow of the discharged hydrogen due to the increase in the flow area of the discharging part and the lack of change in area, resulting in a constant distribution of pressure. The flow velocity results show a maximum increase in flow velocity at the 95 mm point where pressure drop is maximized and a decrease in flow velocity at the 100 mm point where hydrogen is discharged from the check-valve outlet. The difference in the maximum flow velocity at the 95 mm point under the differential pressure (∆P) 10 MPa condition was found to be up to 16% for the 363 K hydrogen-inlet temperature (Tin) condition compared to the 233 K hydrogen-inlet temperature (Tin) condition, indicating that the maximum flow velocity increases with increasing inlet temperature. The hydrogen flowing into the discharging part shows a difference of less than 4% in the flow velocity due to the change in the inlet temperature after the measurement position X = 140 mm in the valve, indicating that the flow of hydrogen flowing into the discharging part has stabilized and the distribution of pressure and flow velocity is constant. The flow inside the check valve showed a similar trend for all hydrogen-inlet temperature conditions according to the hydrogen charging protocol. In this case, the flow rate increases proportionally as the differential pressure (∆P) increases, and the flow velocity increases as the hydrogen-inlet temperature (Tin) increases under the same conditions as the differential pressure, so the change in hydrogen-inlet temperature seems to be the main factor affecting the flow-rate change. Through the correlation analysis of pressure and velocity changes with the initial hydrogen-inlet temperature change, it is found that the velocity increases as the hydrogen-inlet temperature increases in the on-board condition, but the effect on the pressure change of the check valve is insignificant.

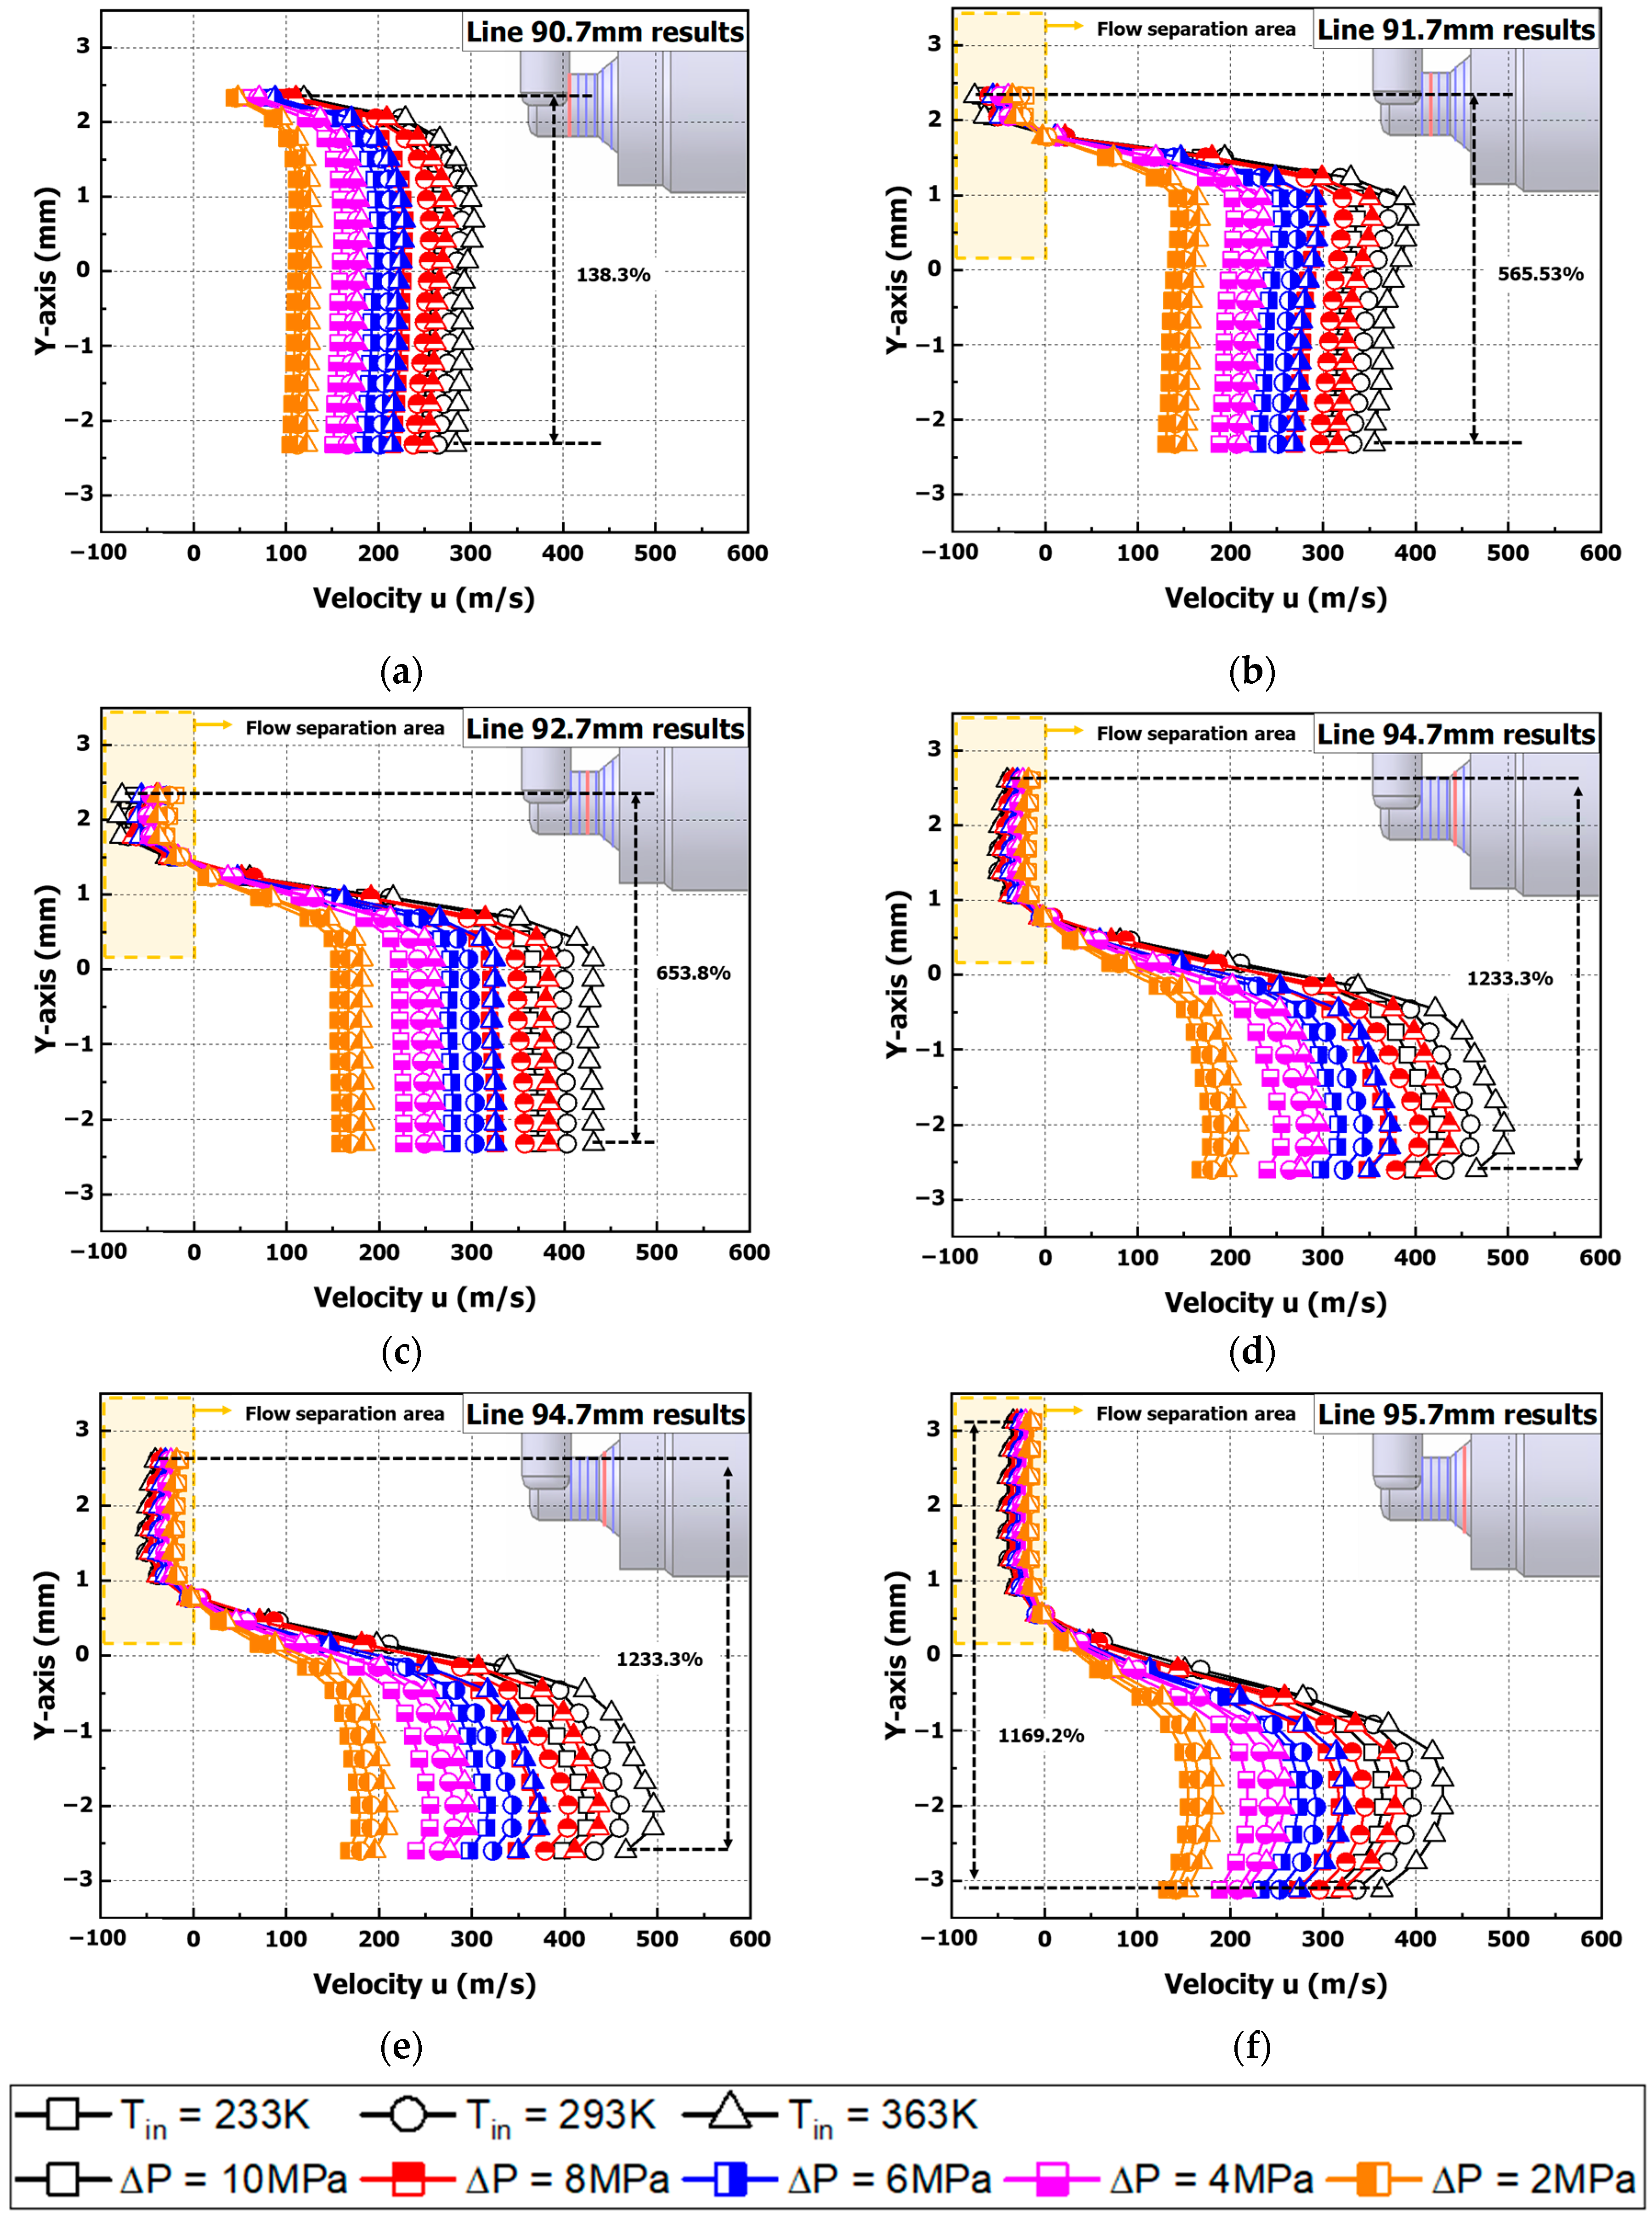
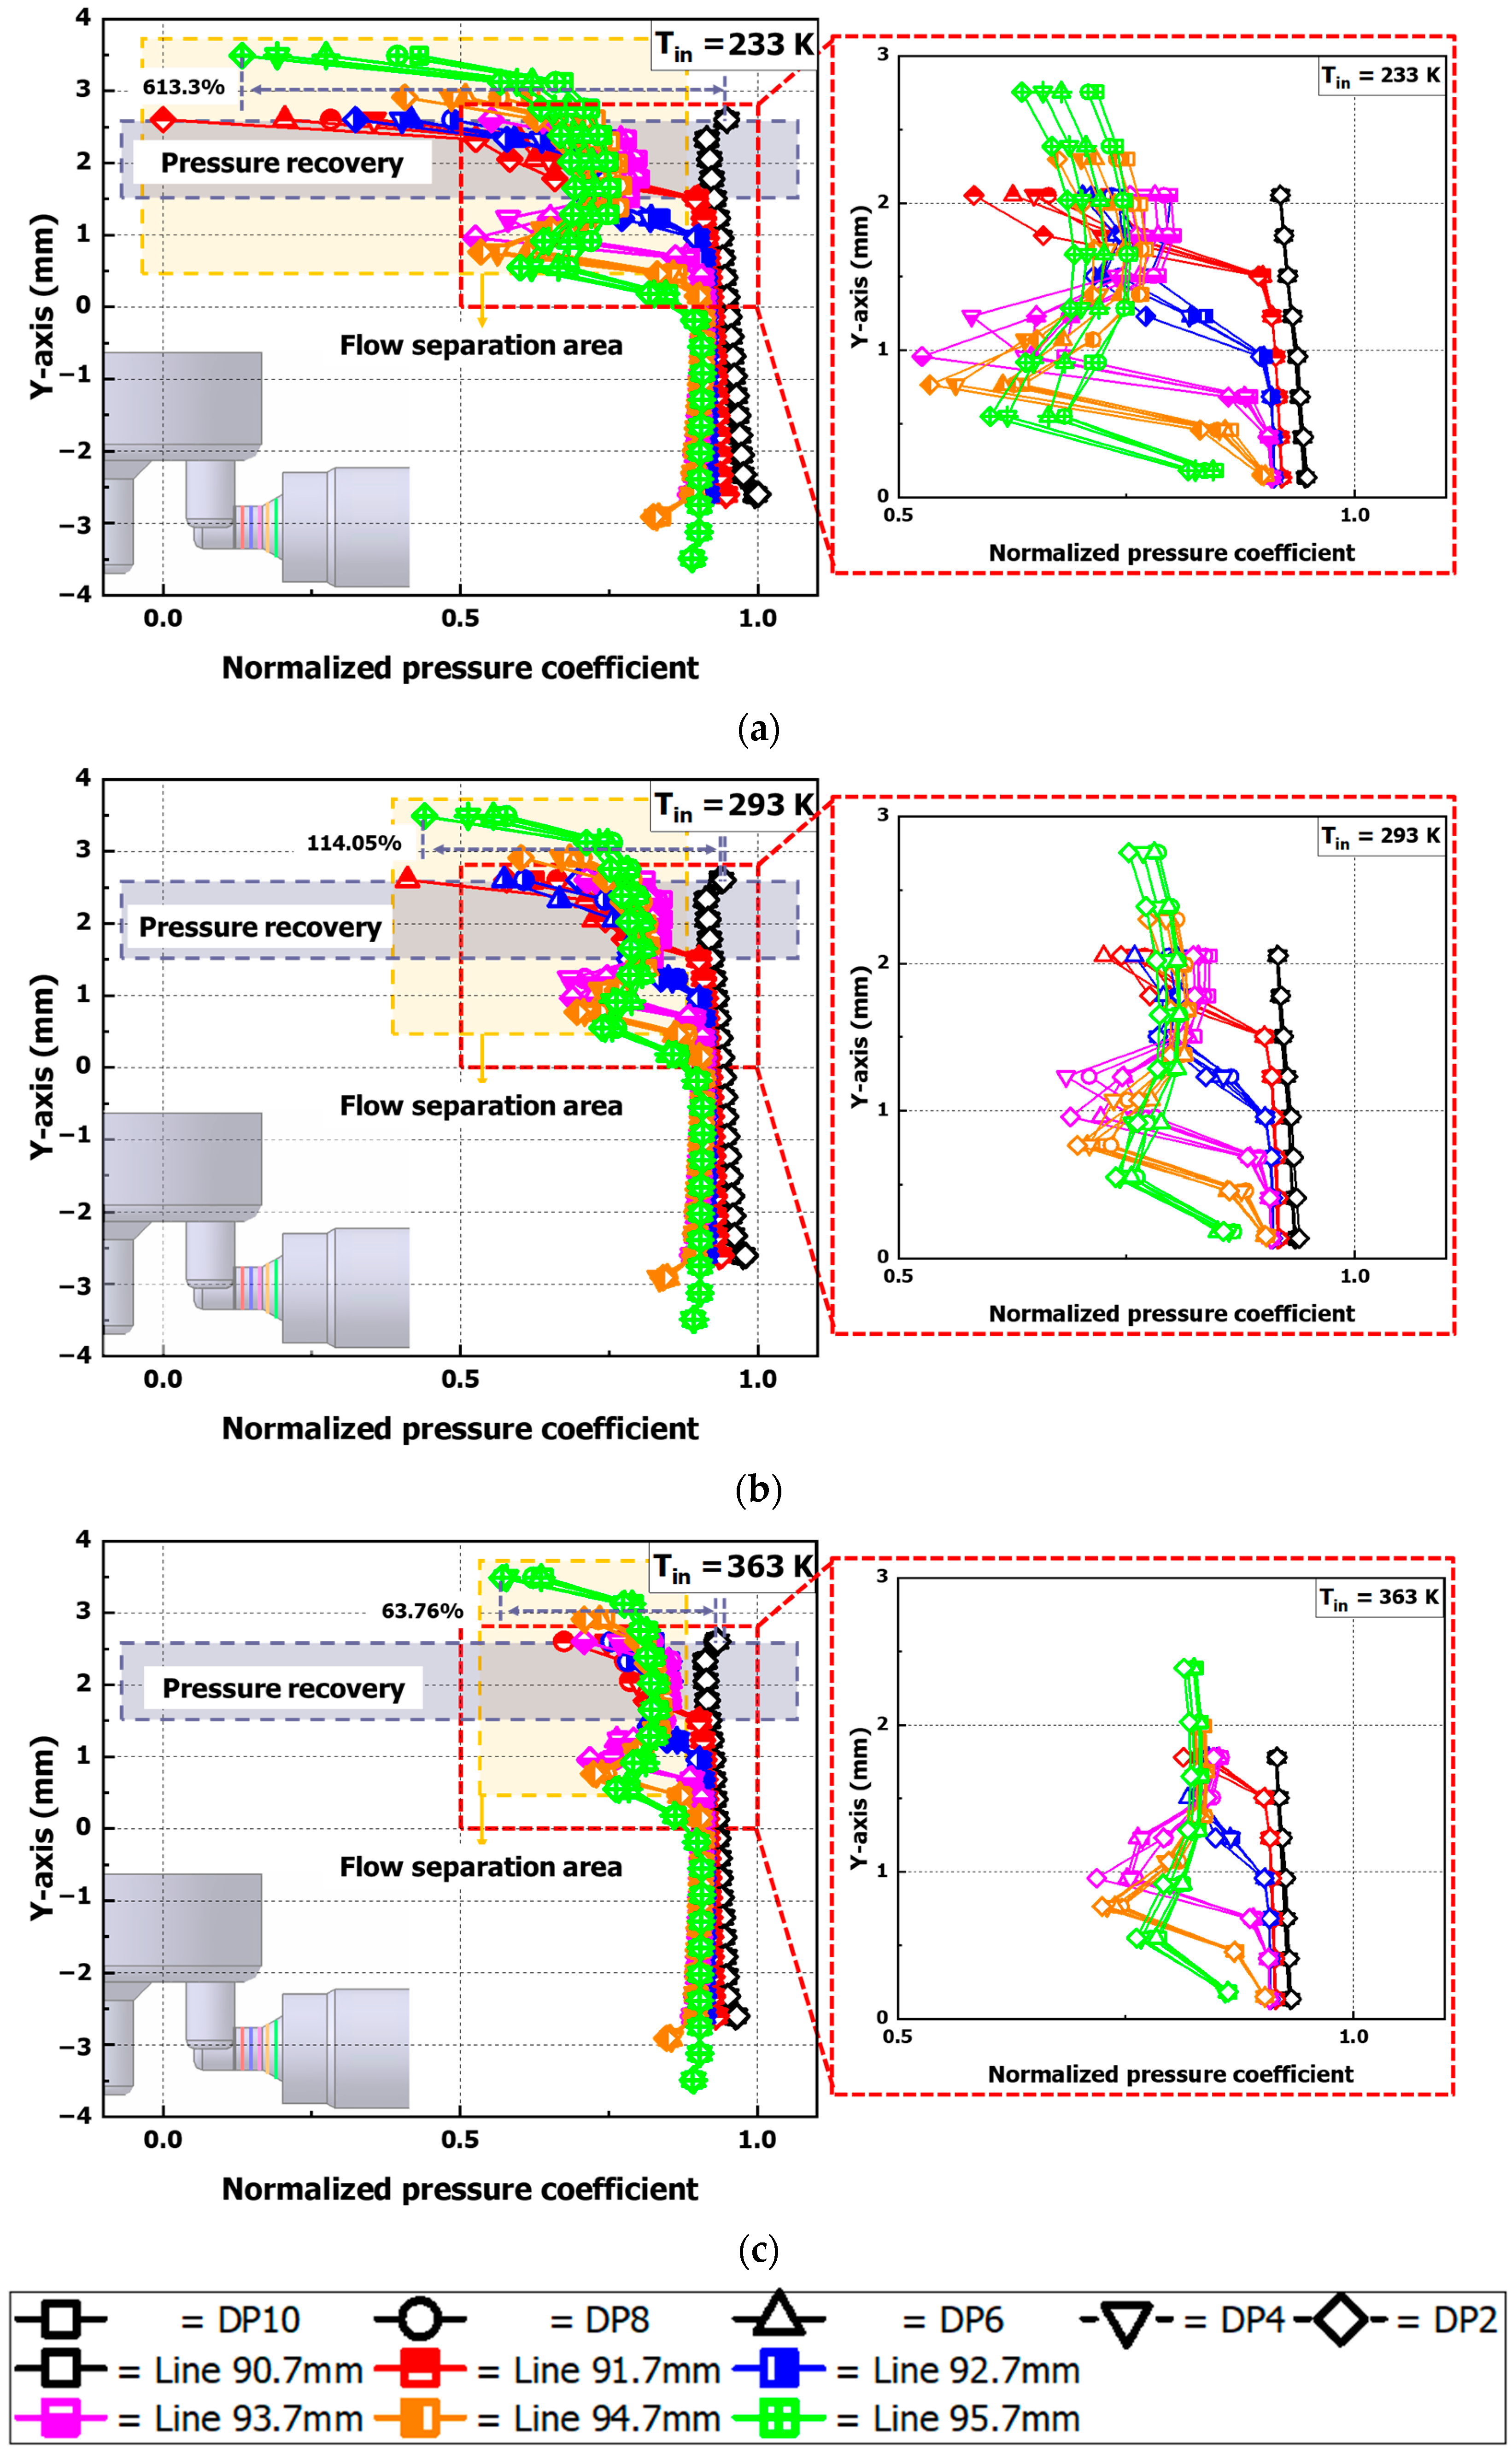
3.2. Analysis of Pressure Coefficient (CP) and Velocity Results in L-Shaped Bend of Check Valve

In order to analyze the flow characteristics at a localized location of the L-shaped curved tube inside the check valve, the velocity_u results and the pressure coefficient (Cp) results in the Y-axis direction were analyzed at X-axis line measurement positions at 1 mm intervals starting from the X = 90.7 mm point, as shown in Figure 1b. Figure 5 shows a graph of Velocity_u results as a function of line measurement position in an L-shaped curved tube for all differential pressure (∆P) and inlet temperature (Tin) conditions. In the L-shaped curved tube area of the core part, when the flow changes from the (−)Y-axis to the X-axis, the flow-separation phenomenon occurs due to wall viscosity. At this time, due to the reverse pressure gradient, a reverse flow is formed within the flow stagnation point and flow-separation zone, and the flow velocity is very low and the reverse flow direction is produced. At a differential pressure (∆P) of 10 MPa and a hydrogen-inlet temperature (Tin) of 363 K, the maximum flow velocity of 303 m/s is obtained at the X = 90.7 mm point, but the flow velocity decreases to about 60% at the top of the valve at Y = 2.3 mm. This is considered to be due to the effect of flow separation, which is characterized by a reverse pressure gradient in the direction of flow, as the flow velocity decreases and the pressure increases due to wall viscosity, forming a separation point. Also, as the measurement position changes from X = 91.7–95.7 mm, the Velocity_u result at the top of the valve becomes negative, indicating a change in flow direction. The X = 91.7 mm point shows a negative characteristic at Y = 2 mm, while the X = 95.7 mm point is derived as negative at Y = 0.55 mm, indicating that the flow-separation region tends to extend towards the bottom of the valve. In this case, the flow velocity results in the lower region of the valve after the Y = 0 mm point show an increase to a maximum of approximately 550 m/s at the X = 93.7 mm point. This means that wake and reverse flows occur in the flow-separation area, and a recirculation area is formed to deflect the flow towards the bottom of the valve. As the flow-separation area increases, the flow resistance increases, and flow deflection occurs, which reduces the flow area of the main flow stream, which is considered to be the main influencing factor in the occurrence of the vena contract phenomenon and increases the flow velocity [26,27]. In addition, due to the decrease in the area of the main flow path area caused by the occurrence of the vena contract phenomenon, the flow of hydrogen tends to decrease in pressure and increase in flow velocity due to the Venturi effect. At the same time, the area of the flow path towards the rear end of the valve increases, resulting in a decrease in flow velocity and an increase in static pressure, which is believed to be due to the loss of kinetic energy, preventing the total kinetic energy from being completely converted into pressure energy [28].
In order to understand the effect of changes in flow characteristics such as hydrogen flow velocity and temperature changes caused by flow separation in the L-shaped curved tube region on the hydrogen flow at the back end of the valve, the pressure coefficient (Cp) results at the line measurement position were analyzed and are shown in Figure 6. Figure 6a shows the pressure coefficient (Cp) results at a hydrogen-inlet temperature (Tin) of 233 K, Figure 6b shows the results at a hydrogen-inlet temperature (Tin) of 293 K, and Figure 6c shows the results at a hydrogen-inlet temperature (Tin) of 363 K.
For all inlet temperature (Tin) conditions, as the flow moves from X = 90.7 mm to X = 95.7 mm, the pressure coefficient decreases sharply at X = 91.7 mm, followed by a similar trend of increasing pressure coefficient (CP) up to X = 94.7 mm and then decreasing at X = 95.7 mm. For the (Tin) 233 K condition, the pressure coefficient (CP) at the point X = 95.7 mm compared to the point X = 90.7 mm shows a difference of 613.3%, the pressure coefficient (CP) at the 293 K inlet temperature (Tin) condition shows a difference of 114.05%, and the pressure coefficient (CP) at the (Tin) 363 K condition shows a difference of 63.76%, indicating that the change in pressure coefficient (CP) tends to be less as the inlet temperature increases. In this case, under all inlet temperature conditions, the point where the pressure coefficient (CP) decreases towards the rear of the measurement position tends to increase in the direction of the (−)Y-axis, but the pressure coefficient increases from the point of Y = about 2.3 mm to the point of 1.5 mm, and a pressure recovery phenomenon occurs. This is thought to be due to wall flow reattachment within the flow-separation region, which reduces the flow velocity and allows the pressure to recover. In this case, due to the wake and recirculation flow caused by the flow reattachment within the flow-separation area formed at point X = 90.7 mm, the flow-separation area expands towards the rear of the valve, deflecting the flow toward the bottom of the valve, and the point where the pressure coefficient (CP) decreases increases in the (−)Y-axis direction as the measurement position is located at the rear.
For all inlet temperature and differential pressure conditions, the pressure coefficient results increase in the direction of the bottom of the valve, and the pressure coefficient results for the change in measurement position from X = 91.7 mm to X = 95.7 mm have a decreasing distribution compared to the point X = 90.7 mm. This is thought to be due to the effect that when hydrogen enters the L-shaped curved tube, the flow direction changes, causing stagnation of the flow, which locally reduces the flow velocity and increases the pressure. The low distribution of pressure coefficient results at the boundary layer of the valve surface is due to flow delamination, which causes fluid to move away from the wall, creating near-vacuum conditions in some of these regions, resulting in reduced pressure coefficient results. In addition, the pressure coefficient in the flow-separation region increases towards the bottom of the valve but decreases locally at the boundary layer of the main flow region, where the flow rate increases and then increases. This indicates that pressure changes occur due to irregular changes in flow velocity caused by reverse flow from the recirculation area to the flow-separation area. In addition, it is believed that the flow that has separated from the boundary layer does not reattach and forms a low-pressure region relative to the free flow region, resulting in no pressure recovery. The pressure coefficient tends to decrease at the boundary layer point between the flow-separation and the main flow region, but it is found that the pressure coefficient has a constant distribution as a result of flow stabilization due to the lack of significant change in flow velocity in the main flow region. In this case, the pressure coefficient increases by up to 98% at point X = 91.7 mm for the (Tin) 233 K condition compared to the (Tin) 363 K condition. This can be explained by the fact that as the hydrogen-inlet temperature increases, the viscosity increases, which increases the flow-separation region and facilitates the reattachment of flows that have dropped out of the boundary layer. By analyzing the pressure coefficient results, the flow-separation region was formed to understand the effect of flow separation and reattachment at the boundary layer on the pressure change. In addition, the mixing of reverse flow and wake caused by recirculation flow appears to cause flow reattachment and delayed pressure recovery due to energy loss within the boundary layer.
In order to understand the effect of the energy loss due to the flow-separation phenomenon on the change of flow characteristics in the discharging part, the temperature result graph in the Y-axis direction is shown in Figure 7. Hydrogen, which has the physical property of a reverse Joule–Thomson coefficient, increases in temperature due to the Joule–Thomson effect in regions where the pressure decreases and the volume expands [29], resulting in a localized decrease in temperature as hydrogen is expelled from the L-shaped curved tube region to the discharging part. As the X-axis measurement position changes to the back end, the temperature distribution in the Y-axis direction shows a localized increase in the upper part of the valve, while the temperature decreases in the lower part of the valve. If the hydrogen enters at (Tin) 363 K in the region where the flow rate of hydrogen is reduced and flow separation is identified as occurring, the temperature of the hydrogen will increase by up to about 4 K compared to the entering temperature of the hydrogen, but the temperature difference will be up to (Tin) 7 K at the bottom of the valve where the flow rate increases in the direction of the main flow. It is judged that the flow velocity increases due to the phenomenon of the vena contract, which reduces the flow area of the main flow due to the occurrence of flow separation in the L-shaped curved tube area, and the pressure decreases, resulting in a decrease in temperature due to the Joule–Thomson effect.

3.3. Analysis of Turbulent Dissipation Rate (TDR) and Exergy Destruction Results at Check-Valve Part Location

To characterize the conversion of turbulent kinetic energy into internal thermal energy within the check valve, the turbulent dissipation rate (TDR) and temperature results were compared. In addition, to quantitatively compare the energy losses, we analyzed the results of exergy destruction, which indicates the irreversible energy losses in a thermodynamic system and the efficiency of the system.
Figure 8 shows a graph of the TDR results for inlet temperature and differential pressure change at the measurement position in the valve along the X-axis, and Figure 9 shows a graph of the temperature results at the measurement position along the X-axis. The X = 80 mm point, where the flow of hydrogen into the core part inside the check valve changes in the vertical direction, results in a differential pressure (∆P) of 10 MPa compared to the X = 65 mm point and a TDR increase of up to approximately 900% or more for all inlet temperature conditions. At the X = 90 mm point, which is the area where hydrogen is discharged from the L-shaped curved tube area to the discharging part, the TDR was reduced by up to approximately 90% compared to the X = 80 mm point. The differential pressure (∆P) discharged from the L-shaped curved tube to the discharging part is 10 MPa, and the hydrogen in all inlet temperature conditions shows a maximum increase of about 3000% TDR at the point X = 95 mm compared to the point X = 90 mm. Also, the TDR results after the point X = 100 mm gradually decrease and show a constant distribution.
The graph of temperature results at the x-axis orientation measurement position in Figure 9 shows a correlation of increasing temperature at points where the TDR increases. The temperature results at X = 95 mm, where the TDR increases the most, show a maximum increase of about 4.5 K compared to the inlet temperature for a differential pressure (∆P) of 10 MPa and an inlet temperature (Tin) of 233 K. For all inlet temperature conditions, the temperature tends to decrease from X = 100 mm to X = 110 mm. The hydrogen discharged to the discharging part, which has a constant distribution with a gradual decrease in TDR, has an increasing distribution from the point X = 115 mm. This means that as the turbulent kinetic energy dissipated by the flow is converted to internal thermal energy, the temperature also rises to a maximum at the point where the TDR rises to a maximum. In this case, the conversion to internal thermal energy is reduced in the region where the TDR has a constant distribution after the discharging part, indicating that the Joule–Thomson effect dominates the temperature rise.
Figure 10 shows the graph of the exergy destruction results measured in the core part and the outlet part where the L-shaped curved tube area exists inside the check valve. Compared with the core part, the exergy destruction result in the discharging part shows a maximum decrease of about 74% when the hydrogen-inlet temperature (Tin) is 233 K, and the difference in the exergy destruction result in the discharging part is insignificant as the hydrogen-inlet temperature condition changes. On the other hand, in the core part, where there is an L-shaped curved tube region where the flow direction changes from vertical to horizontal, the flow resistance increases due to the flow-separation phenomenon, resulting in energy loss, which is understood to increase the exergy destruction. In addition, the TDR change tends to be largest in the 363 K inlet temperature (Tin) condition, so it was expected that the exergy destruction would also increase, but it was found that the hydrogen-inlet temperature (Tin) in the core part increased by 14.5% in the 233 K condition compared to the 363 K condition. At the point X = 95 mm, where the TDR is maximized, the temperature results show that the differential pressure (∆P) is the same and the temperature increase rate decreases by 3.9% as the hydrogen-inlet temperature (Tin) increases from 233 K to 363 K. However, it can be seen that the (Tin) 233 K condition has a higher density compared to the (Tin) 363 K condition, which increases the incoming mass flow rate and promotes viscous effects within the inner boundary layer of the valve, resulting in significant viscous losses. Therefore, it is believed that the mass flow rate and viscosity-loss phenomenon increase in the denser (Tin) 233 K condition compared to the (Tin) 363 K condition, and the temperature rises due to the accumulated thermal energy, which accelerates the entropy increase and increases the exergy destruction.

4. Conclusions

In this study, pressure and flow results were compared for the conditions of differential pressure between the inlet and outlet and hydrogen-inlet temperature change for the purpose of analyzing the change of turbulence characteristics and energy loss of the check valve for high-pressure hydrogen charging. The exergy destruction results were compared for the purpose of analyzing the effect of the flow-separation phenomenon on the energy loss, and the following conclusions were obtained.
(1)
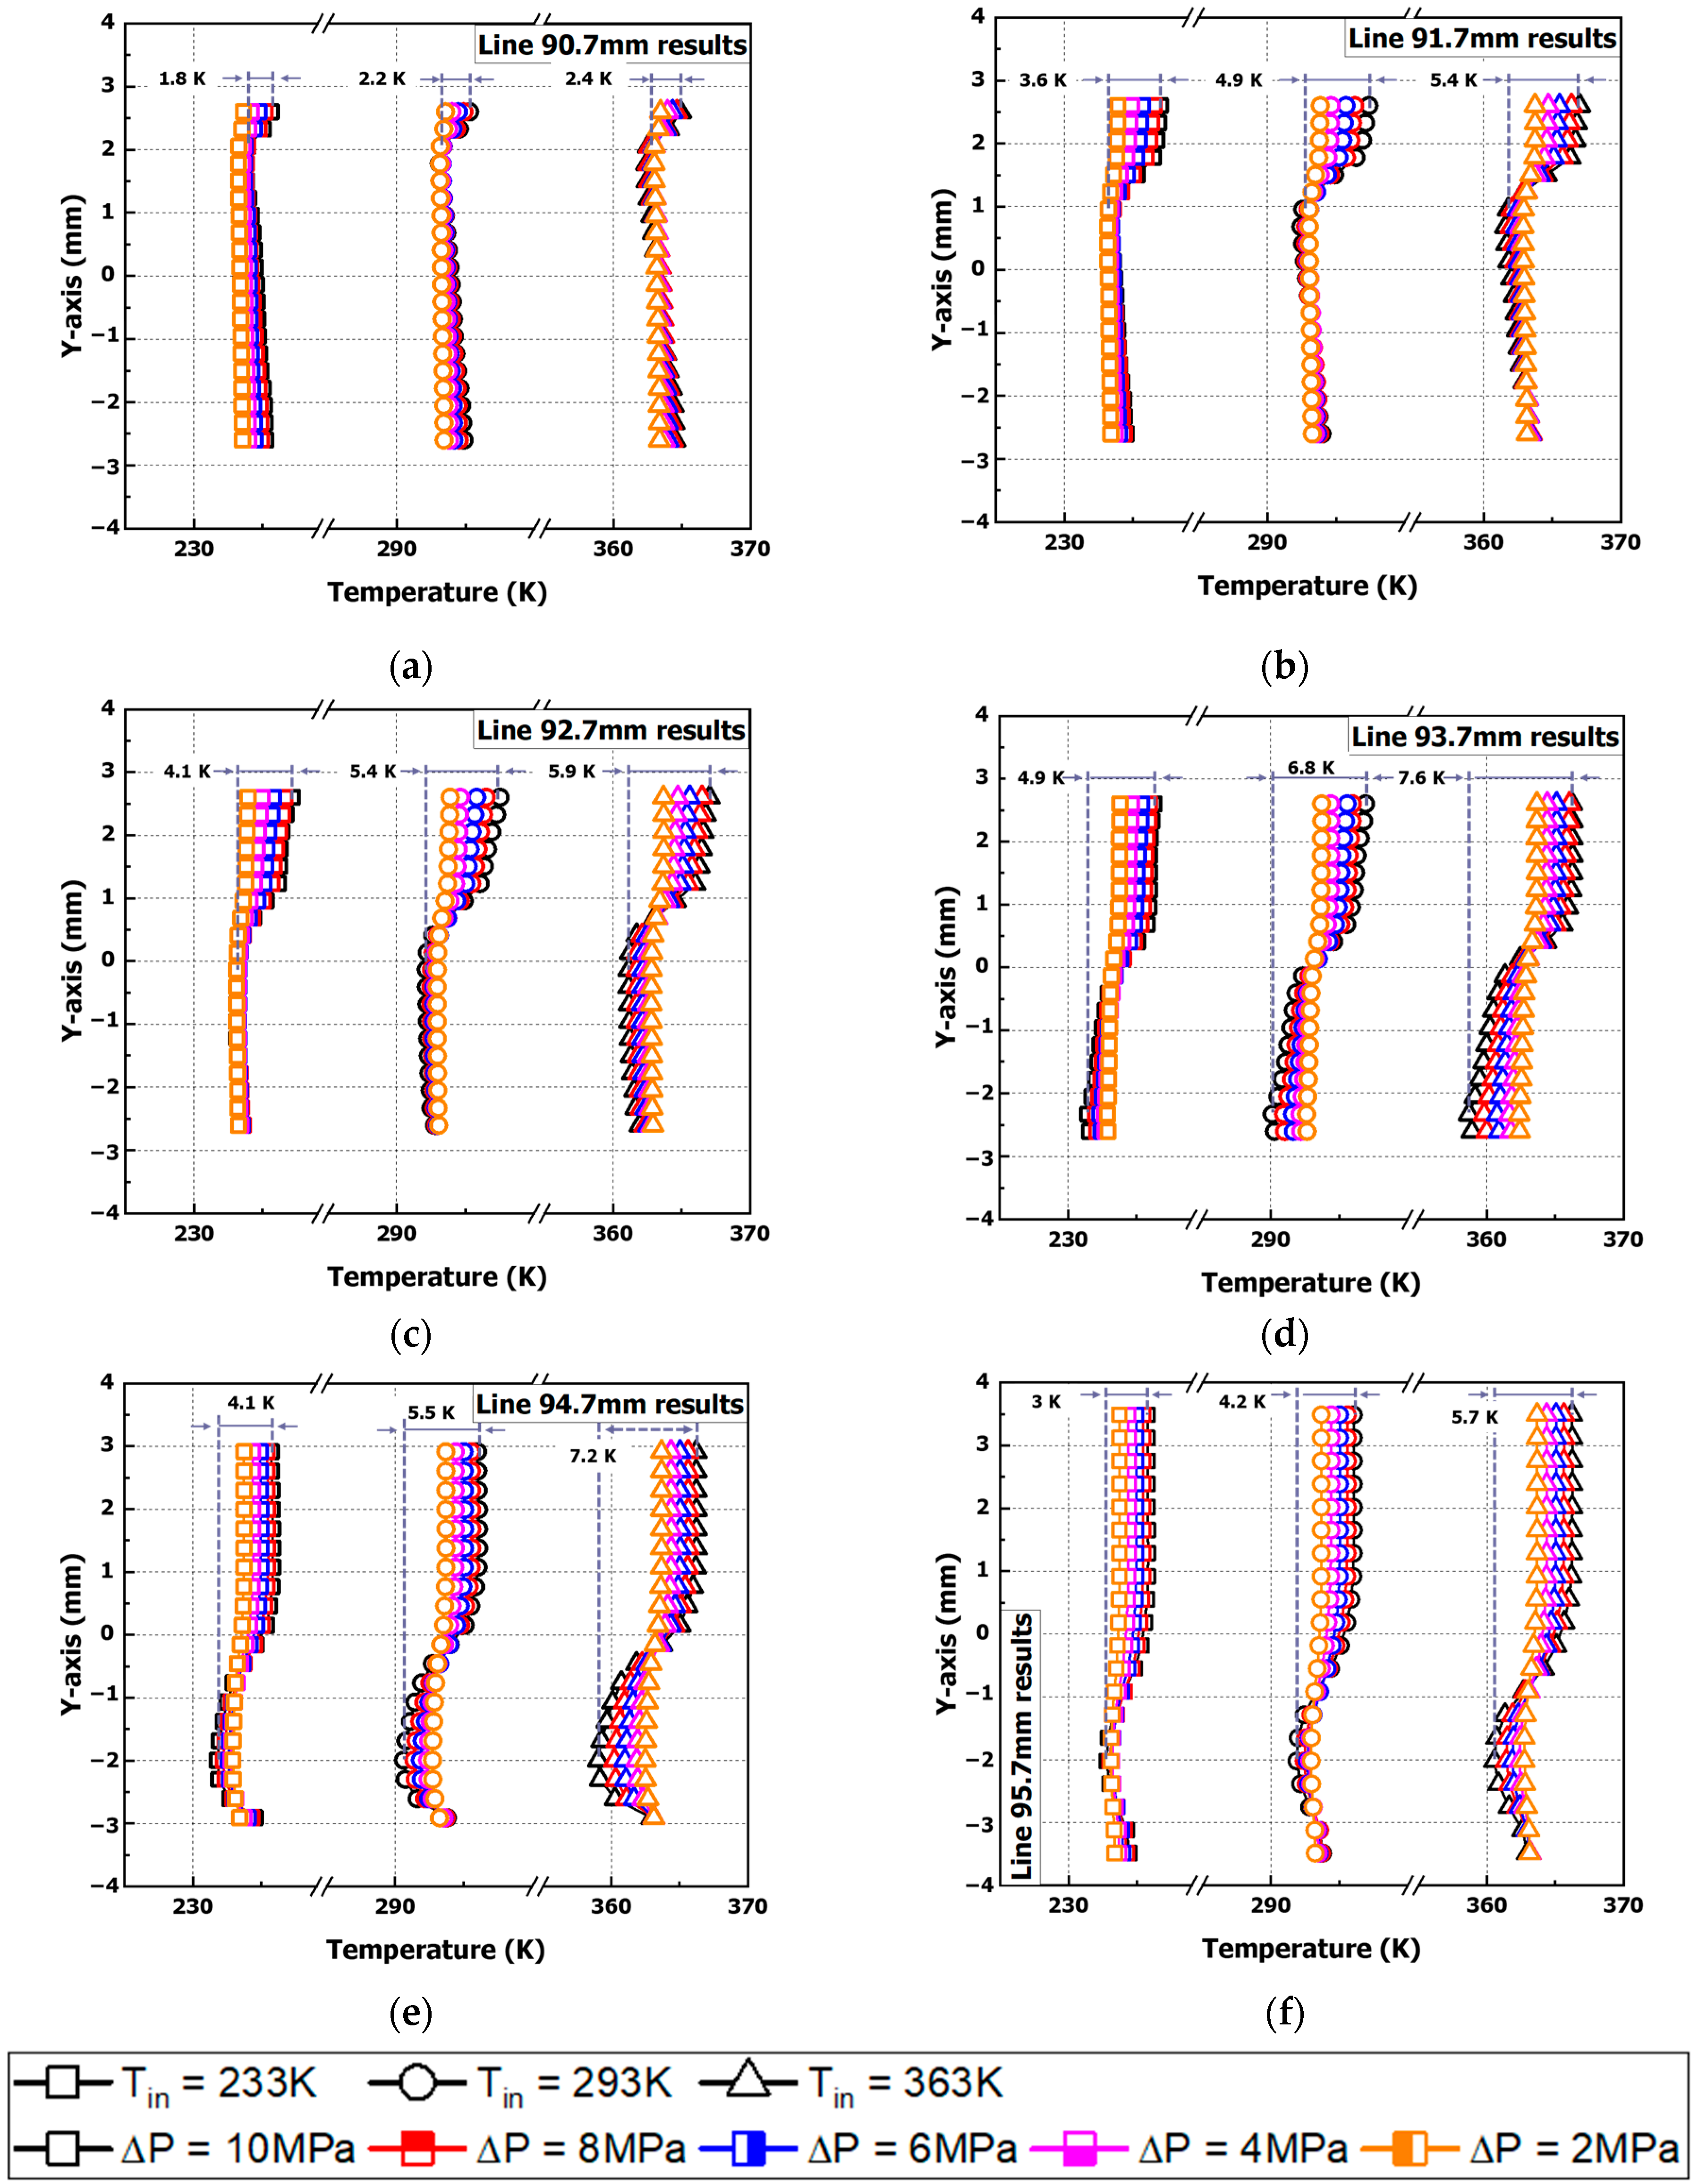
In the case of a differential pressure (ΔP) of 10 MPa and a hydrogen-inlet temperature (Tin) of 363 K at the point X = 90.7 mm in the L-shaped curved tube area of the check valve, the flow rate at the point Y = 2.3 mm at the top of the valve decreases by up to approximately 60%, and it is found that the flow rate decreases and the pressure increases due to the viscosity of the wall surface, forming a separation point.
(2)
The flow separation that occurs in an L-shaped curved tube causes a wake and reverse flow to form in the downstream region, which affects the delay in pressure recovery at the boundary layer and the occurrence of a recirculation area, and it reduces the flow area of the main flow, resulting in a bias towards the bottom of the check valve.
(3)
The pressure coefficient (CP) analysis shows that the pressure coefficient increases by up to 98% at the X = 91.7 mm measurement position in the (Tin) 233 K condition compared to the (Tin) 363 K condition. This is believed to be due to the fact that the increase in hydrogen-inlet temperature promotes flow reattachment within the boundary layer of the flow-separation region, which reduces the pressure change.
(4)
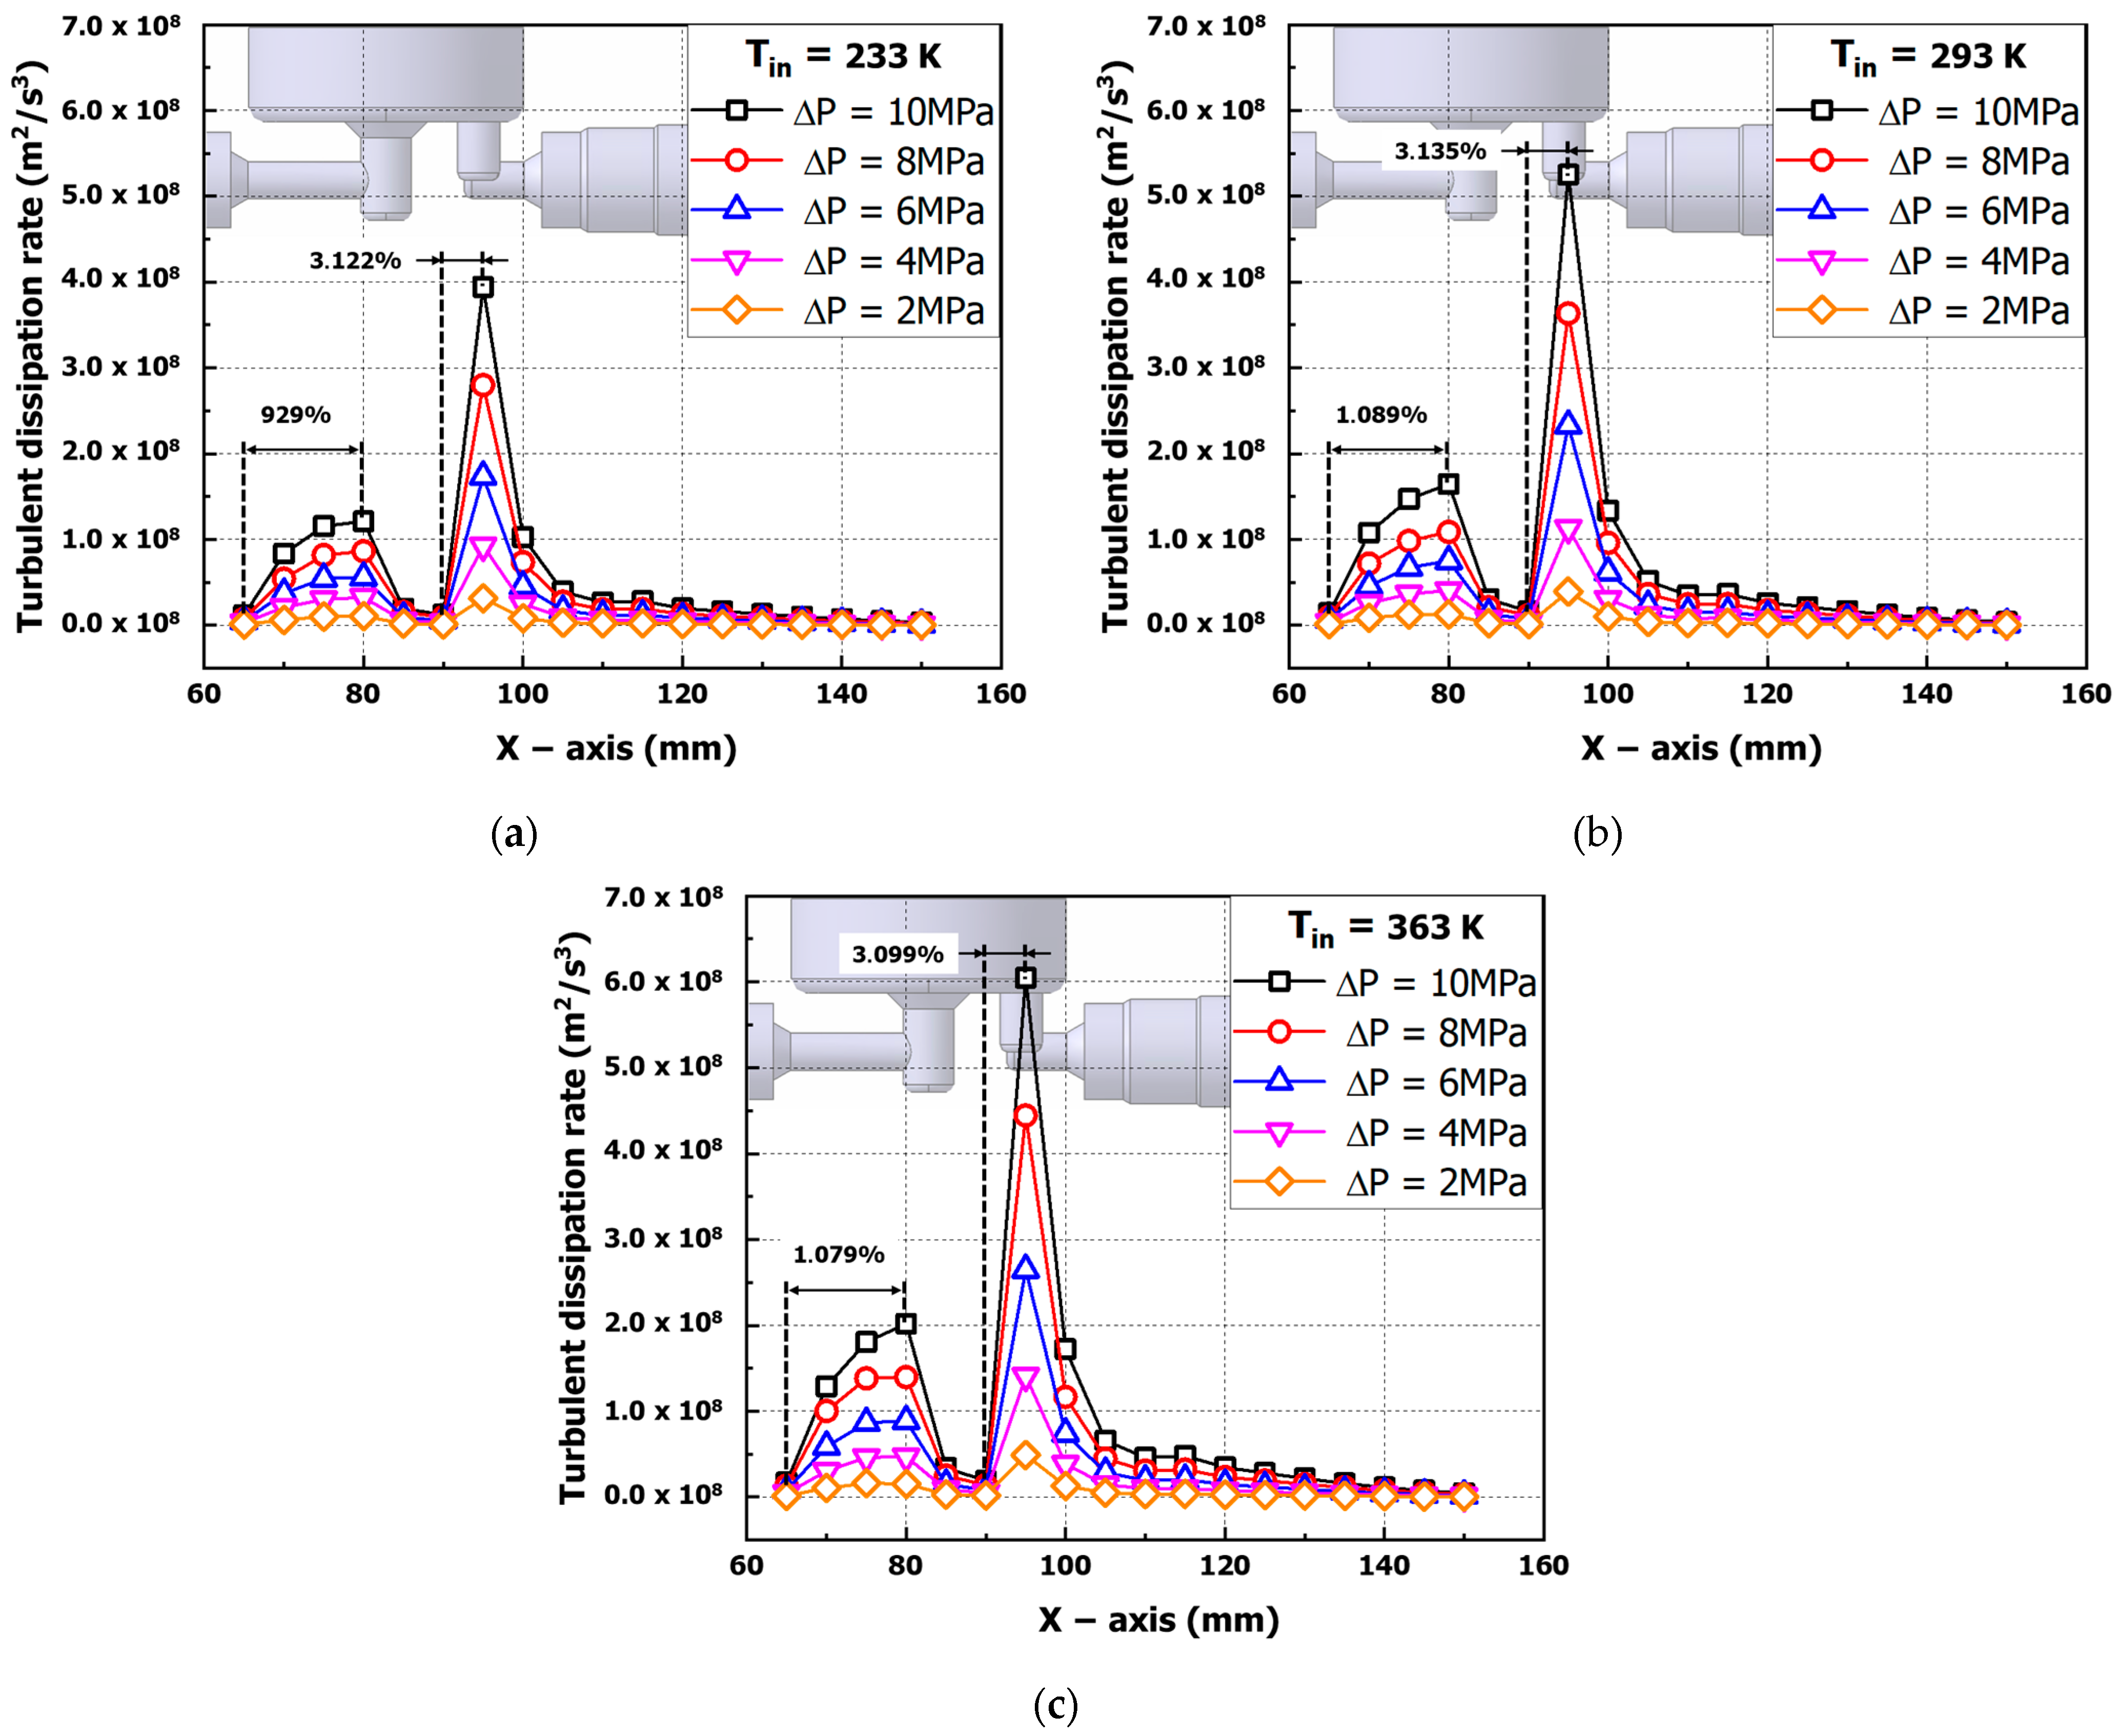
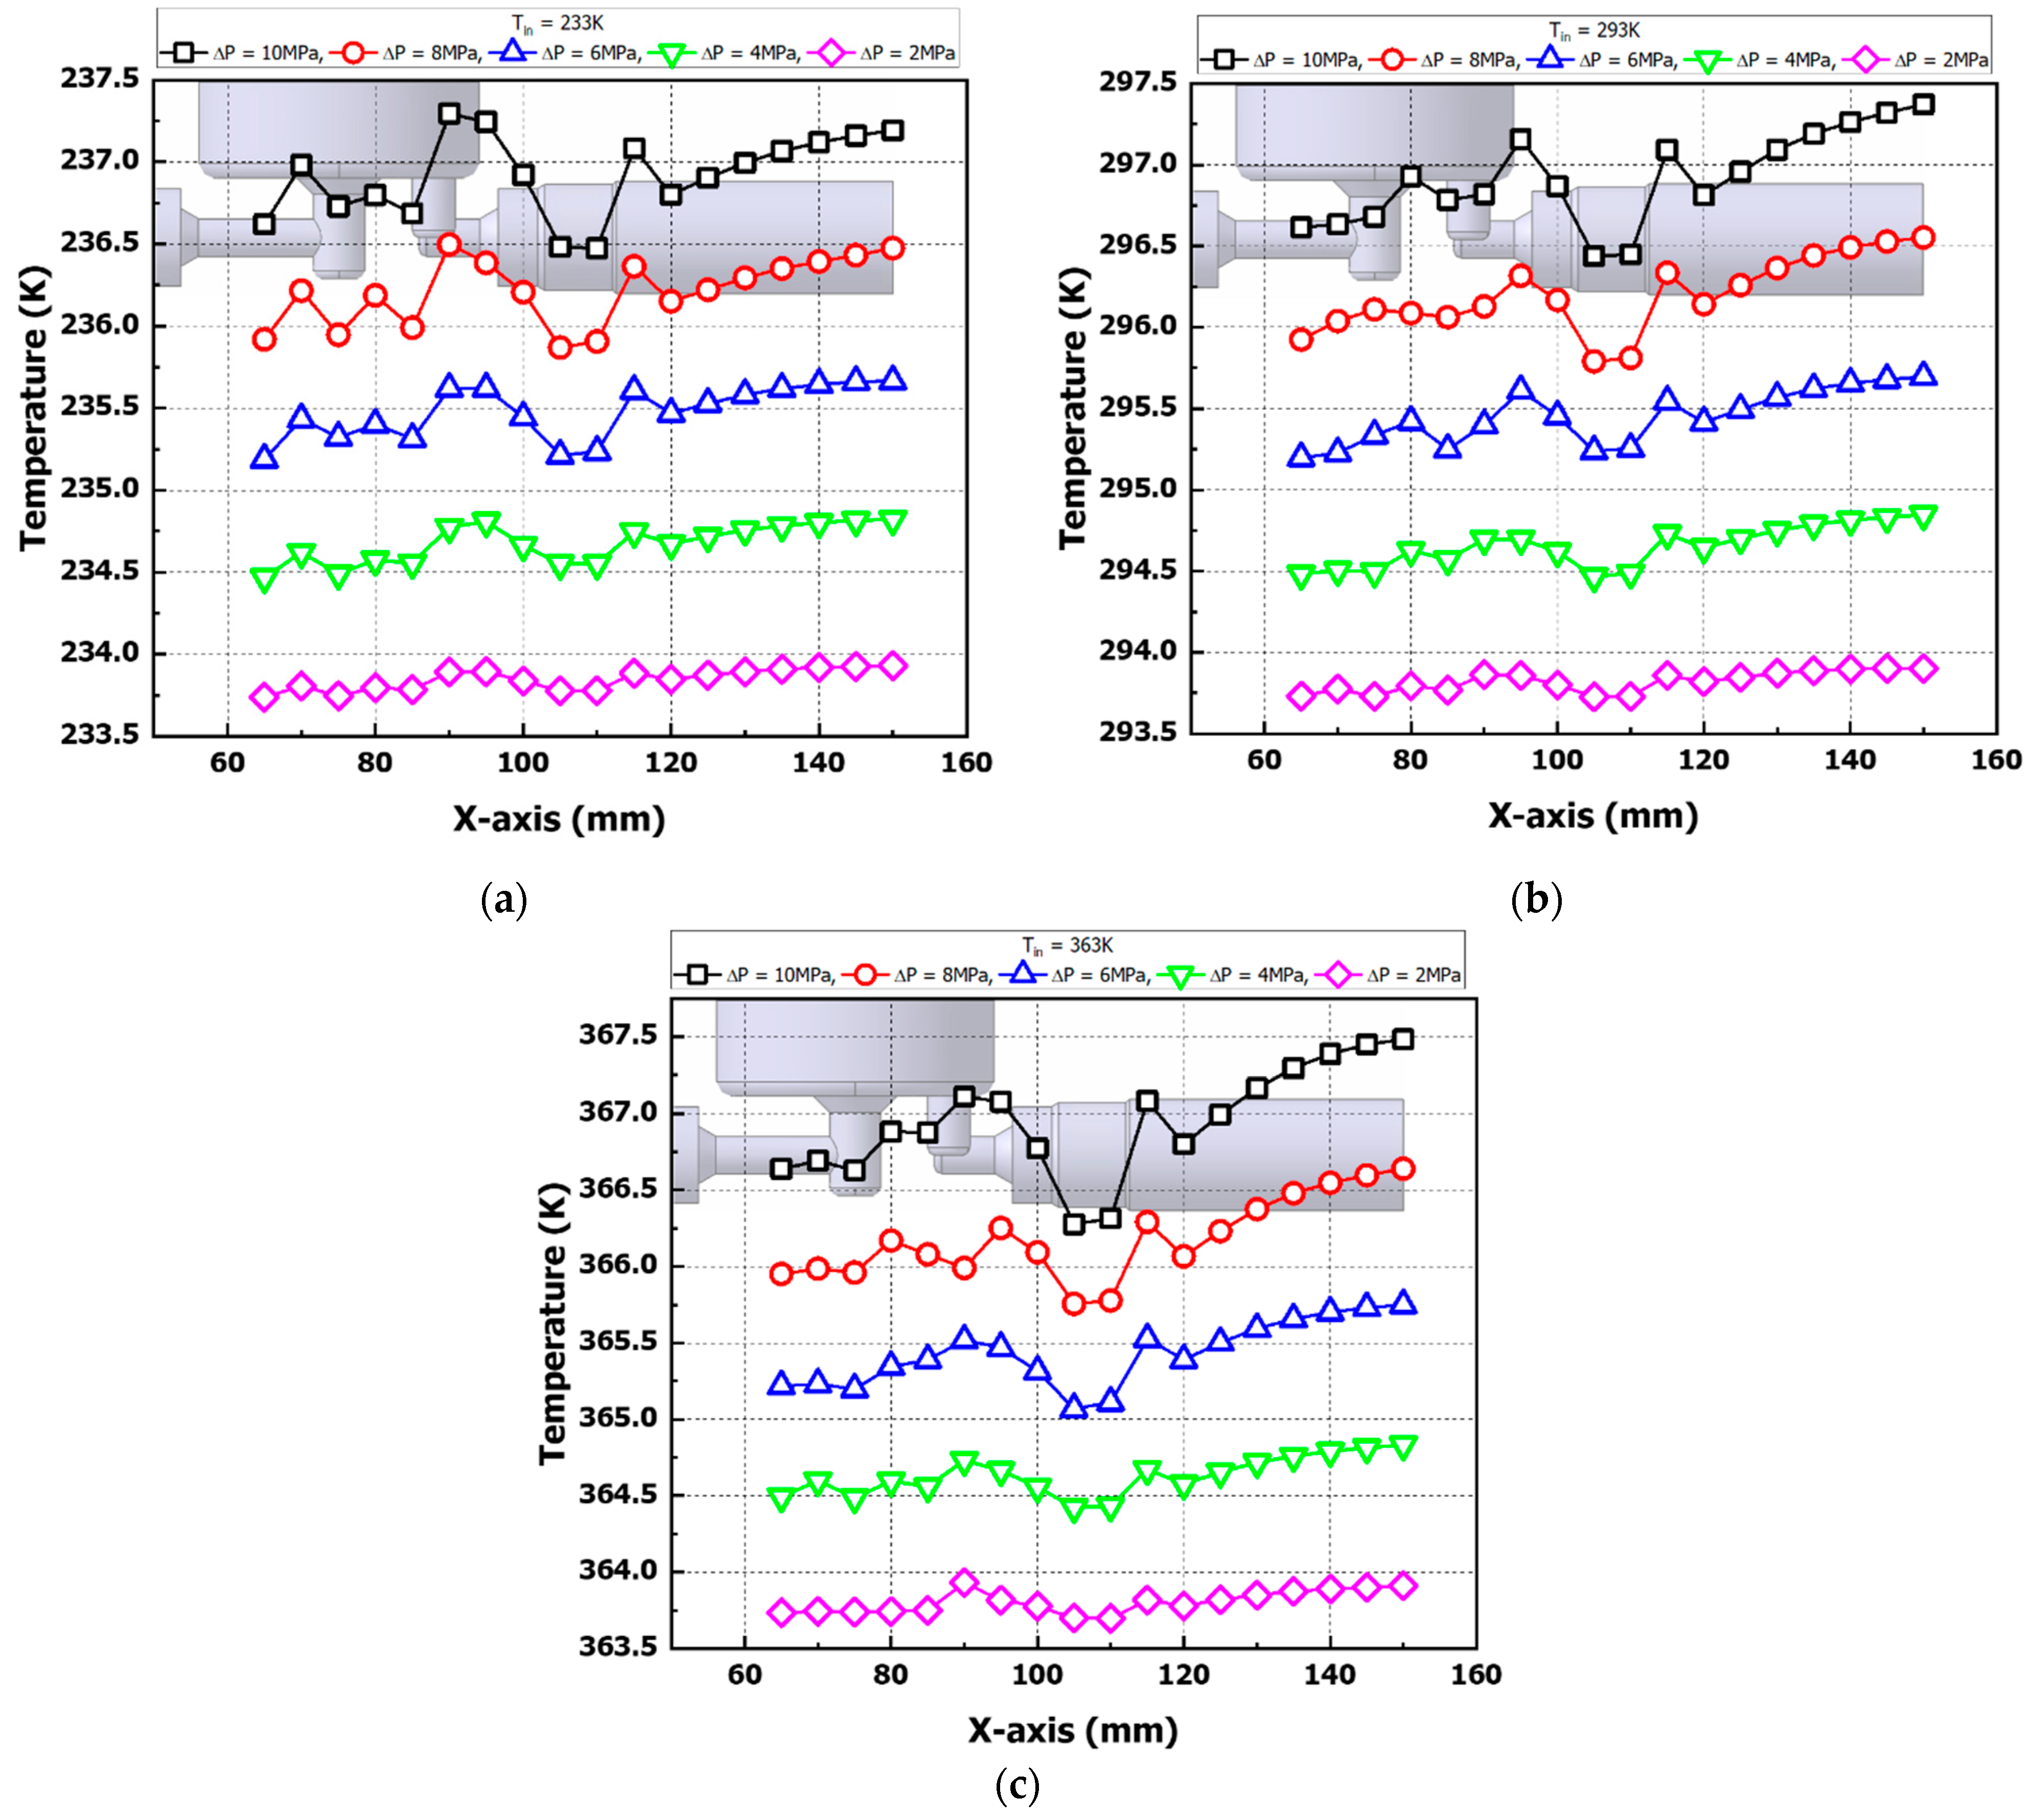
In the L-shaped curved tube region of the core part, the turbulent dissipation rate (TDR) at the X = 95 mm point increased by up to about 3000% compared to the X = 90 mm point, and the temperature results also increased by up to about 4.5 K compared to the inlet temperature. This is due to the conversion of the dissipated turbulent kinetic energy into heat energy, which is the major contributor to the temperature rise and energy loss of hydrogen.
(5)
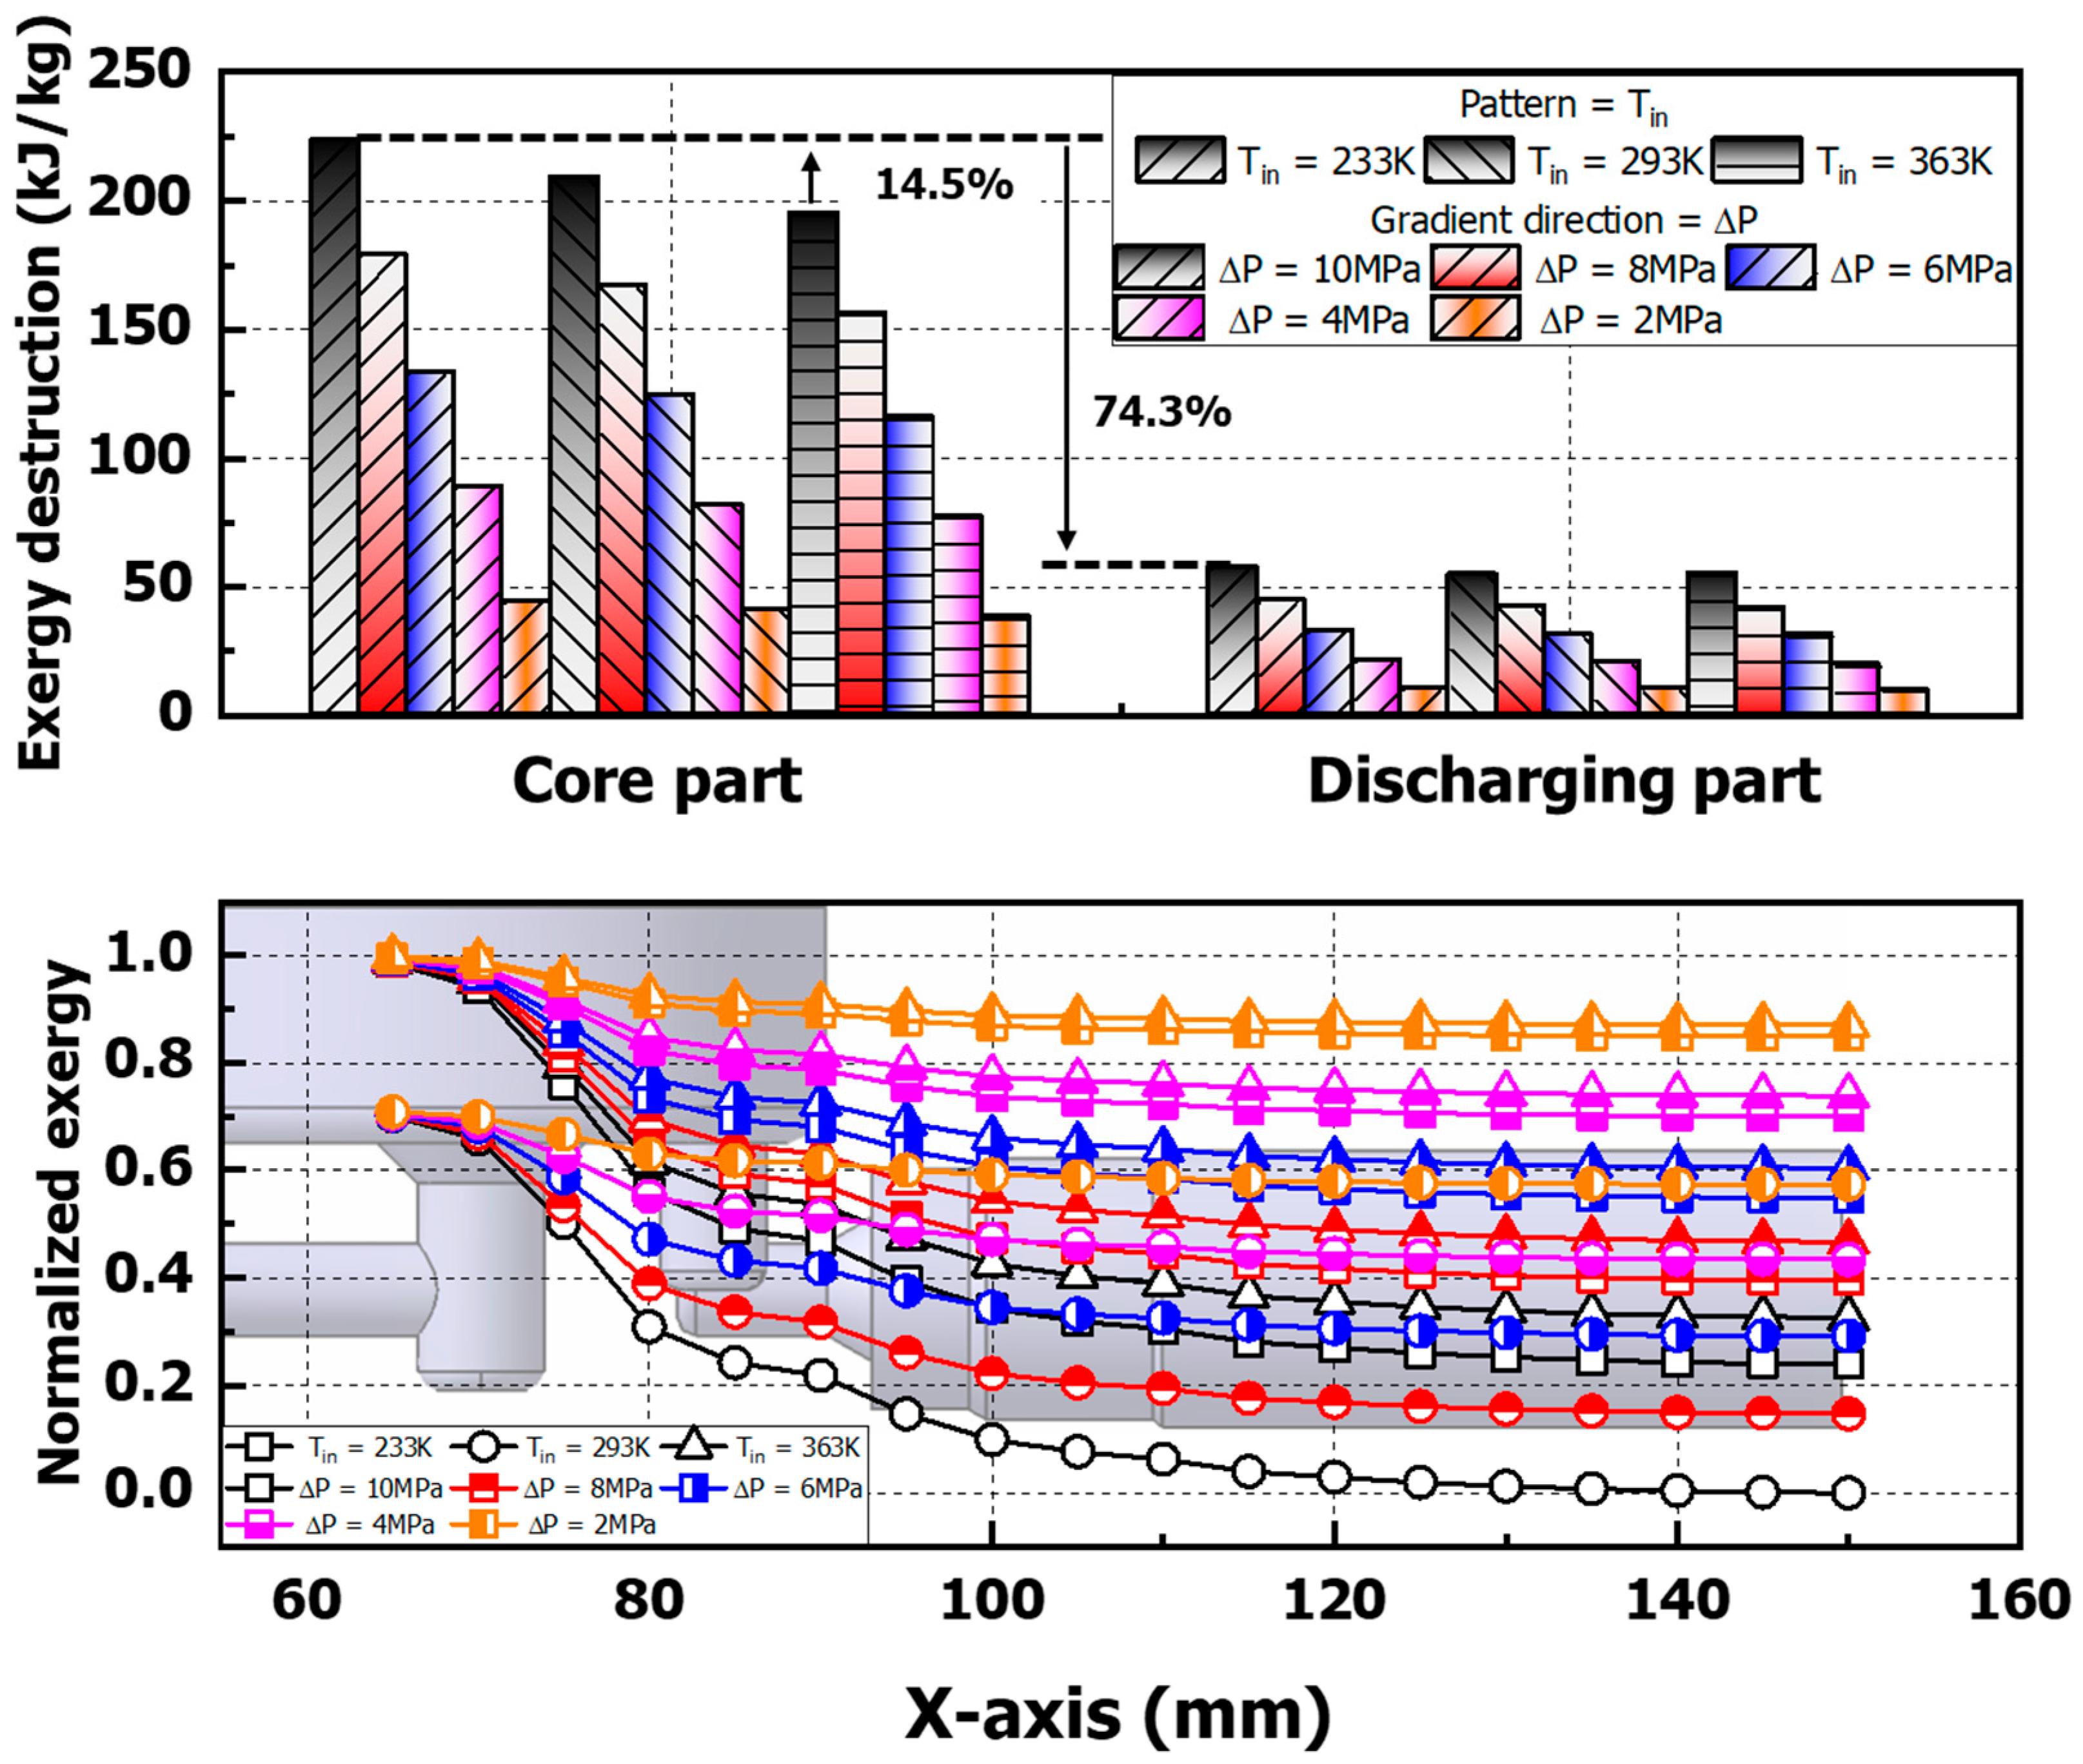
The exergy destruction results show a 74% decrease in the discharging part compared to the core part for the (Tin) 233 K condition, and the differential pressure (∆P) increases by up to 14.6% for the 233 K condition compared to the (Tin) 363 K hydrogen-inlet temperature condition under the same conditions. This is believed to be due to the higher density at Tin of 233 K, which increases the viscosity dissipation within the boundary layer of the flow-separation zone and increases the temperature-rise rate and energy-dissipation rate, resulting in increased exergy destruction.

Author Contributions

Conceptualization, S.-H.O., S.-M.J. and H.-K.S.; methodology, S.-H.O. and H.-K.S.; software, S.-H.O. and S.-M.J.; validation, S.-H.O. and H.-K.S.; formal analysis, H.-K.S.; investigation, S.-H.O.; resources, S.-H.O.; data curation, S.-H.O. and S.-M.J.; writing—original draft preparation, S.-H.O.; writing—review and editing, H.-K.S.; visualization, H.-K.S.; supervision, H.-K.S.; project administration, H.-K.S.; funding acquisition, H.-K.S. All authors have read and agreed to the published version of the manuscript.

Funding

This study was conducted with the support of Korea Energy Technology Evaluation and planning funded by the Ministry of Trade, Industry and Energy (202303004020C, Develop technology to for parts of hydrogen storage tank system).

Institutional Review Board Statement

Not applicable.

Informed Consent Statement

Not applicable.

Data Availability Statement

The data presented in this study are available on request from the corresponding author due to (Their use in ongoing business collaborations).

Conflicts of Interest

The authors declare no conflicts of interest.

References

  1. Li, X.; Raorane, C.J.; Xia, C.; Wu, Y.; Tran, T.K.N.; Khademi, T. Latest Approaches on Green Hydrogen as a Potential Source of Renewable Energy Towards Sustainable Energy: Spotlighting of Recent Innovations, Challenges, and Future Insights. Fuel 2023, 334, 126684. [Google Scholar] [CrossRef]
  2. Xu, X.; Zhou, Q.; Yu, D. The Future of Hydrogen Energy: Bio-Hydrogen Production Technology. Int. J. Hydrog. Energy 2022, 47, 33677–33698. [Google Scholar] [CrossRef]
  3. Tiwari, A.K.; Nasreen, S.; Hammoudeh, S.; Selmi, R. Dynamic Dependence of Oil, Clean Energy and the Role of Technology Companies: New Evidence from Copulas with Regime Switching. Energy 2021, 220, 119590. [Google Scholar] [CrossRef]
  4. Abdalla, A.M.; Hossain, S.; Nisfindy, O.B.; Azad, A.T.; Dawood, M.; Azad, A.K. Hydrogen Production, Storage, Transportation and Key Challenges with Applications: A Review. Energy Convers. Manag. 2018, 165, 602–627. [Google Scholar] [CrossRef]
  5. Moradi, R.; Groth, K.M. Hydrogen Storage and Delivery: Review of the State of the Art Technologies and Risk and Reliability Analysis. Int. J. Hydrog. Energy 2019, 44, 12254–12269. [Google Scholar] [CrossRef]
  6. Zheng, J.; Liu, X.; Xu, P.; Liu, P.; Zhao, Y.; Yang, J. Development of High Pressure Gaseous Hydrogen Storage Technologies. Int. J. Hydrog. Energy 2012, 37, 1048–1057. [Google Scholar] [CrossRef]
  7. Apostolou, D.; Xydis, G. A Literature Review on Hydrogen Refuelling Stations and Infrastructure. Current Status and Future Prospects. Renew. Sustain. Energy Rev. 2019, 113, 109292. [Google Scholar] [CrossRef]
  8. J2601_201612; Fueling Protocols for Light Duty Gaseous Hydrogen Surface Vehicles (J2601_201612). SAE International: Warrendale, PA, USA; p. 2016.
  9. Li, M.; Bai, Y.; Zhang, C.; Song, Y.; Jiang, S.; Grouset, D.; Zhang, M. Review on the Research of Hydrogen Storage System Fast Refueling in Fuel Cell Vehicle. Int. J. Hydrog. Energy 2019, 44, 10677–10693. [Google Scholar] [CrossRef]
  10. Zhang, C.; Cao, X.; Bujlo, P.; Chen, B.; Zhang, X.; Sheng, X.; Liang, C. Review on the Safety Analysis and Protection Strategies of Fast Filling Hydrogen Storage System for Fuel Cell Vehicle Application. J. Energy Storage 2022, 45, 103451. [Google Scholar] [CrossRef]
  11. Soboleva, J.A.; Kerimov, A.M.; Anudinov, S.S.; Kocharov, M.A. Operation Simulation for a Check Valve used in High-Performance Systems. Civ. Eng. J. 2023, 9, 3202–3217. [Google Scholar] [CrossRef]
  12. Ye, J.; Zhao, Z.; Cui, J.; Hua, Z.; Peng, W.; Jiang, P. Transient Flow Behaviors of the Check Valve with Different Spool-Head Angle in High-Pressure Hydrogen Storage Systems. J. Energy Storage 2022, 46, 103761. [Google Scholar] [CrossRef]
  13. Yu, L.; Yang, X.; Zhang, Z.; Lin, Z.; Jin, Z.; Qian, J. Parametric Analysis on Throttling Elements of Conical Throttling Valve for Hydrogen Decompression in Hydrogen Fuel Cell Vehicles. J. Energy Storage 2023, 65, 107342. [Google Scholar] [CrossRef]
  14. Qian, J.; Chen, M.; Gao, Z.; Jin, Z. Mach Number and Energy Loss Analysis Inside Multi-Stage Tesla Valves for Hydrogen Decompression. Energy 2019, 179, 647–654. [Google Scholar] [CrossRef]
  15. Ariyadi, H.M.; Jeong, J.; Saito, K. Computational Analysis of Hydrogen Flow and Aerodynamic Noise Emission in a Solenoid Valve during Fast-Charging to Fuel Cell Automobiles. J. Energy Storage 2022, 45, 103661. [Google Scholar] [CrossRef]
  16. Jin, X.; Shen, C.; Wu, X. Numerical Study on Regenerative Cooling Characteristics of Kerosene Scramjets. Int. J. Aerosp. Eng. 2020, 2020, 8813929. [Google Scholar] [CrossRef]
  17. Mi, J.; Yu, J.; Huang, G. Direct-Drive Electro-Hydraulic Servo Valve Performance Characteristics Prediction Based on Big Data and Neural Networks. Sensors 2023, 23, 7211. [Google Scholar] [CrossRef]
  18. Dindorf, R. Study of the Energy Efficiency of Compressed Air Storage Tanks. Sustainability 2024, 16, 1664. [Google Scholar] [CrossRef]
  19. Oosthuizen, P.H.; Carscallen, W.E. Introduction to Compressible Fluid Flow; CRC Press: Boca Raton, FL, USA, 2013. [Google Scholar]
  20. Celik, I.B.; Ghia, U.; Roache, P.J.; Freitas, C.J. Procedure for Estimation and Reporting of Uncertainty due to Discretization in CFD Applications. J. Fluids Eng. Trans. ASME 2008, 130, 078001. [Google Scholar] [CrossRef]
  21. Shih, T. A Realizable Reynolds Stress Algebraic Equation Model; National Aeronautics and Space Administration: Washington, DC, USA, 1993; Volume 105993. [Google Scholar]
  22. Shih, T.; Liou, W.W.; Shabbir, A.; Yang, Z.; Zhu, J. A New K-Ε Eddy Viscosity Model for High Reynolds Number Turbulent Flows. Comput. Fluids 1995, 24, 227–238. [Google Scholar] [CrossRef]
  23. Shih, T.; Zhu, J.; Lumley, J.L. A New Reynolds Stress Algebraic Equation Model. Comput. Methods Appl. Mech. Eng. 1995, 125, 287–302. [Google Scholar] [CrossRef]
  24. Zhang, Y.; Liu, B.; She, X.; Luo, Y.; Sun, Q.; Teng, L. Numerical Study on the Behavior and Design of a Novel Multistage Hydrogen Pressure-Reducing Valve. Int. J. Hydrog. Energy 2022, 47, 14646–14657. [Google Scholar] [CrossRef]
  25. Ansys Fluent Theory Guide; Ansys lnc.: Canonsburg, PA, USA, 2023.
  26. Liu, X.; Farhat, M.; Li, Y.; Liu, Z.; Yang, W. Onset of Flow Separation Phenomenon in a Low-Specific Speed Centrifugal Pump Impeller. J. Fluids Eng. 2023, 145, 021206. [Google Scholar] [CrossRef]
  27. Hwang, H.; Woo, S.; Han, S. Boil-Off Gas Generation in Vacuum-Jacketed Valve used in Liquid Hydrogen Storage Tank. Energies 2024, 17, 2341. [Google Scholar] [CrossRef]
  28. Wang, Y.; Semlitsch, B.; Mihaescu, M.; Fuchs, L. Flow Induced Energy Losses in the Exhaust Port of an Internal Combustion Engine. J. Fluids Eng. 2015, 137, 011105. [Google Scholar] [CrossRef]
  29. Hendricks, R.C.; Peller, I.C.; Baron, A.K. Joule-Thomson Inversion Curves and Related Coefficients for several Simple Fluids. In Joule-Thomson Inversion Curves and Related Coefficients for Several Simple Fluids; National Aeronautics and Space Administration: Washington, DC, USA, 1972. [Google Scholar]
Figure 1. Schematics of check valve for hydrogen charging system. (a) Internal flow zone of check valve; (b) Measurement positions.
Applsci 15 01428 g001
Figure 2. Grid dependency result and mesh information of the check valve. (a) Grid dependency result of average velocity at y = 6.8 mm; (b) Generated mesh of check valve.
Applsci 15 01428 g002
Figure 3. Pressure and velocity distribution results of check valve. (a) Results of pressure distribution; (b) Results of velocity distribution.
Applsci 15 01428 g003
Figure 4. Pressure and velocity results of check valve. (a) Pressure-drop result of check valve at flow-in, core and discharging part; (b) Pressure and velocity results at x-axis measurement positions.
Applsci 15 01428 g004
Figure 5. Velocity_u results at X-axis measurement position. (a) X = 90.7 mm; (b) X = 91.7 mm; (c) X = 92.7 mm; (d) X = 93.7 mm; (e) X = 94.7 mm; (f) X = 95.7 mm.
Applsci 15 01428 g005
Figure 6. Normalized pressure coefficient results at X-axis measurement position. (a) Tin = 233 K condition; (b) Tin = 293 K condition; (c) Tin = 363 K condition.
Applsci 15 01428 g006
Figure 7. Temperature results at X-axis measurement position. (a) X = 90.7 mm; (b) X = 91.7 mm; (c) X = 92.7 mm; (d) X = 93.7 mm; (e) X = 94.7 mm; (f) X = 95.7 mm.
Applsci 15 01428 g007
Figure 8. Turbulent dissipation rate results at X-axis measurement position. (a) Tin = 233 K condition; (b) Tin = 293 K condition; (c) Tin = 363 K condition.
Applsci 15 01428 g008
Figure 9. Temperature results at X-axis measurement position. (a) Tin = 233 K condition; (b) Tin = 293 K condition; (c) Tin = 363 K condition.
Applsci 15 01428 g009
Figure 10. Exergy destruction results on check valve [Tin = 233 K, 293 K, 363 K, ΔP = 2, 4, 6, 8, 10 MPa].
Applsci 15 01428 g010
Table 1. Specifications of the check valve.
Specification of Check Valve
Valve length (mm)150
Valve height (mm)29
Inlet and outlet diameter (mm)15.2
Table 2. Analysis conditions.
ParametersConditions
Turbulence modelRealizable k ϵ
Real gas equationSRK EOS
Inlet pressure (MPa)70
Differential pressure (MPa)2, 4, 6, 8, 10
H2 temperature (K)233, 293, 363
Disclaimer/Publisher’s Note: The statements, opinions and data contained in all publications are solely those of the individual author(s) and contributor(s) and not of MDPI and/or the editor(s). MDPI and/or the editor(s) disclaim responsibility for any injury to people or property resulting from any ideas, methods, instructions or products referred to in the content.

