Article

Modeling the Chemical Hydrolysis of Mesquite (Prosopis laevigata) Seed Husk Using Response Surface Methodology and Artificial Neural Networks

by
Rogelio Pérez-Cadena
1,
Silvana Vázquez-Maldonado
1,
Alejandro Téllez-Jurado
2,
Maria Guadalupe Serna-Diaz
3 and
Joselito Medina-Marin
4,*
1
Ingeniería en Energía, Universidad Politécnica Metropolitana de Hidalgo, Boulevard Acceso a Tolcayuca No. 1009, ExHacienda de San Javier, Tolcayuca 43860, Hidalgo, Mexico
2
Laboratorio de Agrobiotecnología, Universidad Politécnica de Pachuca, Zempoala 43830, Hidalgo, Mexico
3
Área Académica de Química, Instituto de Ciencias Básicas e Ingeniería, Universidad Autónoma del Estado de Hidalgo, Carretera Pachuca-Tulancingo Km. 4.5, Ciudad del Conocimiento, Mineral de la Reforma 42184, Hidalgo, Mexico
4
Área Académica de Ingeniería y Arquitectura, Instituto de Ciencias Básicas e Ingeniería, Universidad Autónoma del Estado de Hidalgo, Carretera Pachuca-Tulancingo Km. 4.5, Ciudad del Conocimiento, Mineral de la Reforma 42184, Hidalgo, Mexico
*
Author to whom correspondence should be addressed.
Appl. Sci. 2025, 15(3), 1419; https://doi.org/10.3390/app15031419
Submission received: 28 November 2024 / Revised: 14 January 2025 / Accepted: 22 January 2025 / Published: 30 January 2025

Abstract

:
The increasing emission of greenhouse gases that comes with the rise in industrialization is harmful to the environment. Thus, finding new renewable energy sources is becoming increasingly important in the energy field. One such renewable energy source is biomass, which provides valuable energy carriers—for example, biofuels. The objective of this work was to evaluate the release of total reducing sugars (TRSs) from mesquite pod seed hulls by chemical and enzymatic hydrolysis. The husks were crushed and separated by screens (#16, #30 and #50). The effect of hydrolysis time (10, 20, and 30 min) and sulfuric acid concentration (0, 0.25, and 0.5 N) was analyzed. The #50 mesh showed the highest TRS release, increasing from 3.19 to 17.49 g/L as the reaction time was extended. Additionally, enzymatic hydrolysis with endo-1, 4-β-xylanase and β-glucanase enzymes was evaluated on the solid and liquid fractions obtained. Statistical analysis with Design Expert showed that, for the solid fractions, after 31 h there were no significant differences, reaching 79.46 g/L TRS. In the liquid fractions, the TRS released reached 113.37 g/L after 54 h of enzymatic treatment. The release of TRS by chemical hydrolysis was also modeled with artificial neural networks, considering the particle size, the hydrolysis time, and the sulfuric acid concentration. The coefficient of determination (r2) indicates that the ANNs present a better data fit (r2 > 0.99) to predict the experimental conditions that maximize the study variables.

1. Introduction

Renewable biomass is currently presented as a sustainable alternative and a positive option in the face of environmental challenges. Its benefits include the reduction in greenhouse gas emissions and climate change mitigation [1]. Within lignocellulosic biomass are various types of agricultural waste, such as fibers, wood residues, energy crops, short-rotation crops, forestry waste, and paper residues [2,3,4].
Lignocellulosic materials contain varying proportions of cellulose (30–50%), hemicellulose (15–35%), and lignin (10–30%) [5]. These polymers can be subjected to hydrolysis pretreatments to obtain sugars that can be converted into bioethanol by microbial fermentation [6]. Chemical pretreatments with acids such as sulfuric, hydrochloric, nitric, phosphoric, and acetic acids are the most common [7]. In this process, the acid medium mainly decomposes hemicellulose because it is easier to hydrolyze compared to cellulose [8]. However, the resulting lignocellulosic residues still limit the complete conversion of carbohydrates into sugar monomers [9]. For this reason, a cocktail of degrading enzymes, such as cellulases and hemicellulases, that act synergistically is required to achieve complete cellulose degradation [10].
The genus Prosopis, known as mesquite, is considered one of the most valuable woody resources [11]. In Mexico, its distribution covers more than 3.5 million hectares, harboring a wide variety of native species [12]. As a non-timber product, mesquite produces a fruit known as pods, mainly used as feed for livestock. In human consumption, the pods are processed into flour or used in the preparation of fermented beverages [12]. Currently, this legume stands out for its ability to generate a unique flour, rich in protein and with a remarkable sweetening power [13].
Structurally, mesquite pods can be mechanically fragmented to obtain the exocarp (outer layer), mesocarp (spongy part), and endocarp (hard inner layer which protects the seed) [14]. The latter structure, which is solid, fibrous, and indehiscent, presents variations in thickness according to seed dimensions [15] and is mainly formed by cellulosic polysaccharides (40%) and lignin (17%) in P. glandulosa [16]. In addition, the endocarp contains closed segments or septa between the seeds, giving it a compact appearance [17].
When subjected to different treatments, mathematical and statistical techniques can be used to determine the best conditions for reducing sugars. One of these techniques is response surface methodology (RSM), which is used to model and analyze problems in which the variable of interest is influenced by others. On the other hand, the artificial neural network (ANN) model has also been used recently. It helps process information that is difficult to explain with traditional math models; moreover, it can handle missed values and mistakes well [18].
In the literature, there are research works related to modeling the production of biofuels, but there are no reports related to modeling the obtainment of total reducing sugar from mesquite (Prosopis laevigata). A performance comparison between RSM and ANNs was carried out in [19], where bioethanol was produced from pumpkin waste. The ANN showed a better fit to the data gathered from experiments. In another research paper, the yield of fermentable sugar from Colocynthis vulgaris Shrad seeds shell was predicted using ANN, RSM, and an adaptive neuro-fuzzy inference system [20].
Moreover, ANNs have been applied to the process modeling of the pretreatment, thermal processing, and enzymatic processing of lignocellulosic biomass [21]. RSM and ANN were applied for modeling the process of the induction-assisted in situ nanoparticle synthesis of cocoa pod shells to yield fermentable sugars for biofuel production [22].
Therefore, the aim of this work is related to the comparison of both models in the representation of chemical hydrolysis for obtaining TRS.

2. Materials and Methods

2.1. Obtaining the Sample

The mesquite pod husk was obtained from the fermentation process during the production of the Vigate “Ndat’i” distillate. The sample had been previously treated to eliminate residual sugars. A 500 g sample was crushed in a commercial mill and separated by 16, 30, and 50 mesh sizes (1180, 600, and 300 mm for particle size). The flour was stored in plastic bags and kept in a dry space until use.

2.2. Chemical Hydrolysis

From the particle sizes obtained, the pod husk sample was hydrolyzed in 125 mL flasks with 10% w/v solids using H2SO4 at 0, 0.25, and 0.5 N concentrations. The effect of time on hydrolysis was simultaneously evaluated for 10, 20, and 30 min at 121 °C. After the pretreatment, the experimental units were neutralized with NaOH, centrifuged at 4000 rpm for 5 min, and, subsequently, the supernatant was separated from the filtrate. Each experiment was performed in triplicate. The concentration of total reducing sugars (TRSs) was determined in the liquid fraction using the dinitrosalicylic acid method described by Miller [23]; glucose was used as a standard at a concentration of 2 g/L.

2.3. Enzymatic Hydrolysis

The effect of enzymatic hydrolysis on the solid fraction obtained from the pretreatment (FSP) and on the hydrolysate obtained from another pretreatment (HP) was evaluated on the #50 mesh sample for 20 min at 121 °C with a 0.5 N acid concentration. Two commercial enzymes were used: endo-1, 4-β-xylanase from Trichoderma longibrachiatum. SDS No. X2629 (Sigma-Aldrich®, Merck KGaA, Darmstadt, Germany) (EC 3.2.1.8) and β-glucanase from Trichoderma longibrachiatum. SDS No. G4423 (Sigma-Aldrich®, Merck KGaA, Darmstadt, Germany) (EC 3.2.1.6) [24]. In triplicate, the effect of the combination of 50 and 25 activity units (AUs)/mL, respectively, was evaluated. The pH for the HP fraction was adjusted to 4.5, while the FSP fraction was suspended in a 0.01 mM acetate buffer solution at a pH of 4.5 with a 10% w/v solid content. Each experimental unit was spiked with 40 mg/mL gentamicin to avoid bacterial contamination and incubated at 35 °C for 96 h on an orbital shaker at 140 rpm. During enzymatic hydrolysis, samples were taken in 1.5 mL Eppendorf tubes at regular time intervals. The sample was deactivated in boiling water for 5 min and subsequently centrifuged at 10,000 rpm for 5 min. The supernatant was filtered through a 0.22 μm filter to determine the concentration of TRS [25].

2.4. Data Adjustment Techniques

2.4.1. Data Adjustment via Response Surface Methodology

The response surface methodology (RSM) is a set of mathematical techniques used to identify the influence of quantitative factors on a response variable. To obtain the correlation between the values of the concentration of TRS and input parameters such as the particle size of the mesquite sample, the hydrolysis time, and the sulfuric acid concentration, the modeling of the data gathered from the experiments was carried out by RSM. The average of the experimental results is shown in Table 1. Comparisons of the results from the different treatments were performed by ANOVA for a 3k design in which the variables were coded as −1, 0, and +1 for the various levels, using the Design Expert 13 software. A mathematical model was created for the variables’ response, based on the quadratic model of the response surface shown in Equation (1).
f = β 0 + i = 1 k β i x i + j = 2 k i = 1 j 1 β i j x i x j + i = 1 k β i i x i 2 + e
where β0 is the equation constant, βi is the linear term coefficient, βij is the variable interaction term coefficient, βii is the quadratic term coefficient, xi and xj are the independent variables, and e represents the model error.
The quadratic model allows for the examination of both linear and curvature effects in the relationship between the independent variables and the response. The intercept ( β 0 ) is the value of the response when both independent variables are zero. The linear terms ( β i ) capture the linear effects, while the quadratic terms ( β i i ) account for curvature in the response surface. The cross-product coefficient ( β i j ) represents the interaction between the two independent variables; it shows whether there is a combined effect that is not explained by the individual effects. These coefficients are determined through a regression analysis of experimental data. The experimental design often involves running a set of experiments with different combinations of input variables and measuring the corresponding response variable.

2.4.2. Data Adjustment via Artificial Neural Network

Artificial neural networks are computational models inspired by the structure and function of biological neural networks in the human brain. They are a type of machine learning that works well for tasks like recognizing patterns, figuring out what to perform next, and making difficult decisions. ANNs are composed of interconnected nodes, commonly referred to as neurons or perceptrons. They are organized into layers to allow a better fit for data [26].
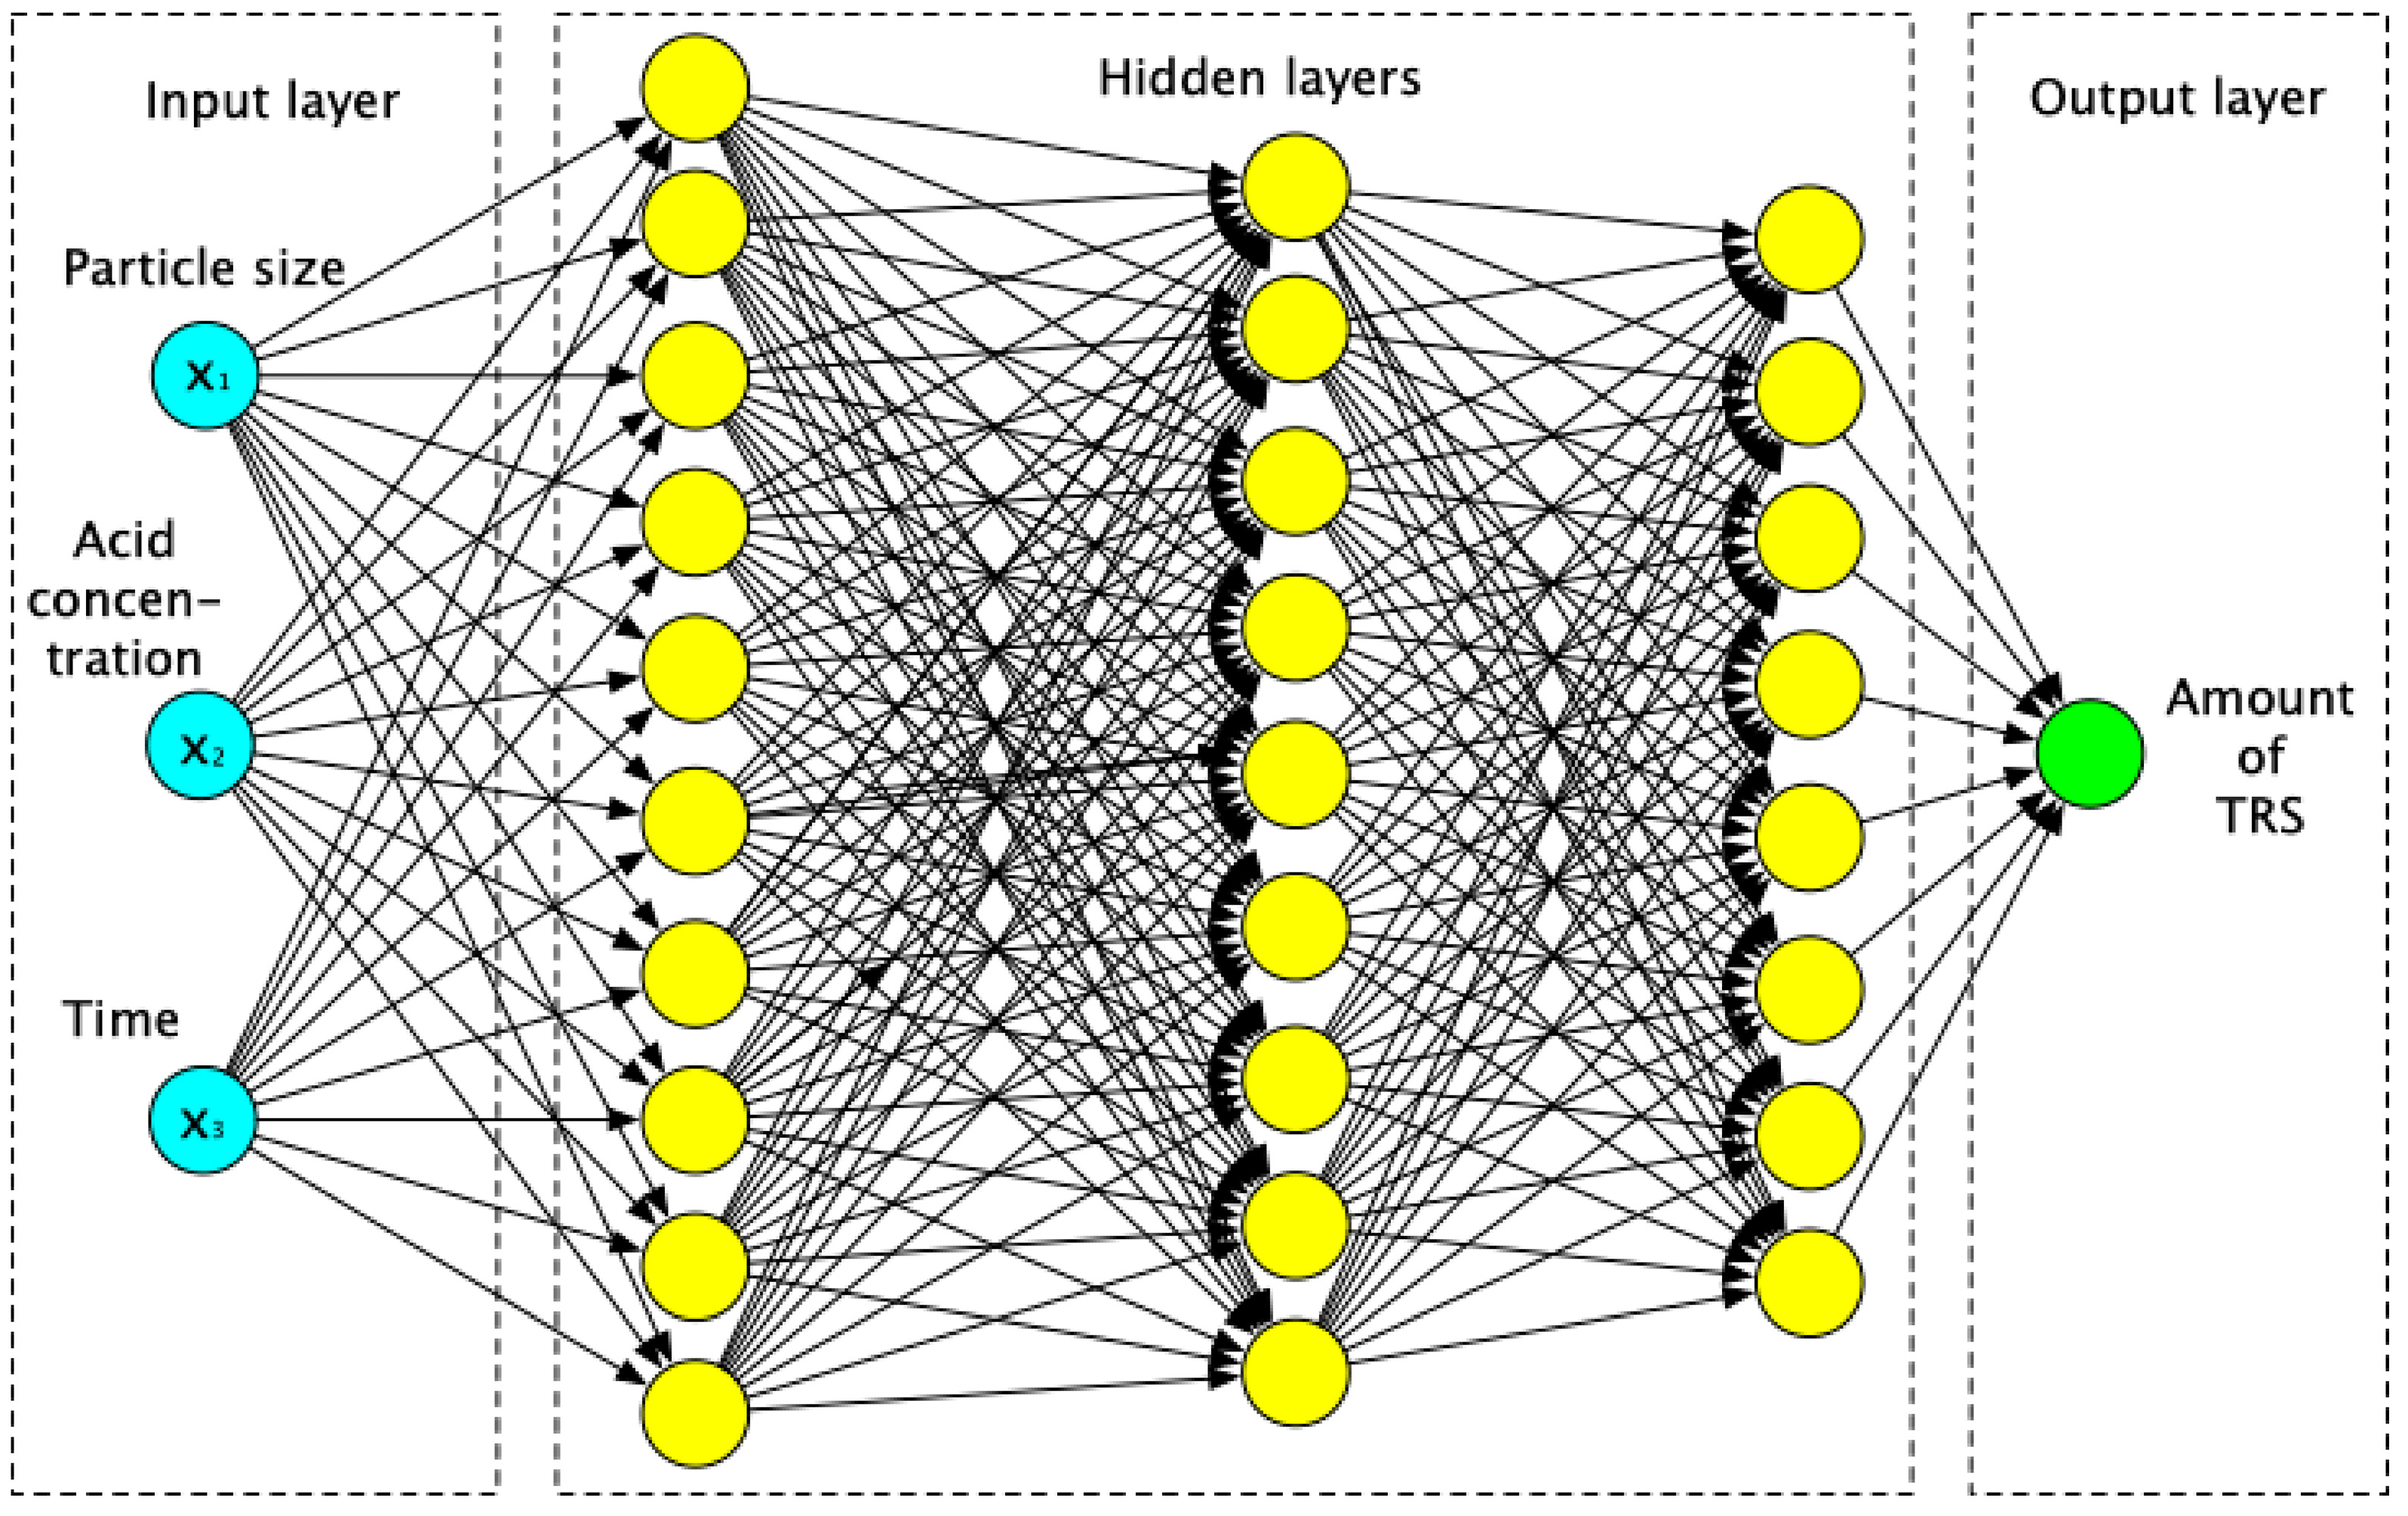
To generate the ANN models, the software Matlab version 9.9 R2020b (provided by MathWorks, Natick, MA, USA) was employed. The response variable was, in the same way, the value of total reducing sugar. Thus, an ANN model was developed, where the input layer contained three neurons, denoting as input parameters the particle size of the mesquite sample, the hydrolysis time, and the sulfuric acid concentration; meanwhile, the output layer was composed of only one neuron, representing the response variable. To obtain the ANN model with the best performance, different configurations of the hidden layer were trained. To avoid an exhaustive search for the best arrangement of neurons in the hidden layers, a local search algorithm was applied [27], starting from a random configuration of one to three hidden layers. Every hidden layer was assigned a random number of neurons between one and ten.
To avoid overfitting the neural network models, 70% of the data were randomly chosen, 15% were used to check the model, and the other 15% were used to test it.
For ANN training, the hyperbolic tangent sigmoid transfer function was used in the hidden layers due to its ability to handle the non-linearity present in obtaining total reducing sugar. The linear transfer function was applied to the output layer. Furthermore, the learning rate utilized for training was 0.01, and the number of epochs was configured at 1000. This process used the backpropagation algorithm because it uses gradient descent, which facilitates the efficient training of neural networks [28].

2.5. Comparison of RSM and ANN Models

The coefficient of determination (r2) (Equation (2)), the root mean square error (RMSE) (Equation (3)), and the mean absolute percentage error (MAPE) (Equation (4)) allow one to see how well RSM and ANN models work [29].
r 2 = i = 1 n A i A i ¯ F i F i ¯ 2 i = 1 n A i A i ¯ 2 F i F i ¯ 2
R M S E = 1 n i = 1 n F i A i 2
M A P E = 1 n i = 1 n A i F i A i
where n is the number of values, Ai is the actual value, and Fi is the forecasted value with the RSM or ANN model.
The lowest RMSE and MAPE and the highest r2 were used to identify the models with the best performance.

3. Results

3.1. Experimental Values

To determine the effect of chemical hydrolysis on mesquite pod seed endocarp, the effect of temperature and reaction time on different acid concentrations and particle sizes was evaluated (Table 1).
With these results, we decided to apply RSM and ANN modeling to find the best conditions for obtaining the maximum amount of TRS, as this would allow for the production of more biofuel. The results will prove the promising use of mesquite as a source of bioethanol.

3.1.1. Effect of Particle Size, Acid, and Reaction Time on Obtaining TRS

From the results obtained from the experimental design (Table 1), it was observed that, under the conditions studied, minimum amounts of TRS were present in the treatments without acid and at reaction times of 10 min (experiments 6, 7, and 8). On the other hand, maximum values of TRS were obtained with the highest acid concentration (0.5) and high values for particle size and time (experiments 5 and 14).
The analysis of the evaluated factors indicated that the particle size obtained with a #50 mesh positively affected the release of reducing sugars during pretreatment, increasing from 3.19 to 17.49 g/L as the reaction time increased from 10 to 30 min, while the experiments with a #30 mesh size released from 5.45 g/L to 15.96 g/L of TRS during the 10 and 30 min treatments, respectively. The particle size of lignocellulosic biomass is known to play an important role in the efficiency of the hydrolysis process because particle size reduction increases the ratio between the effective surface area and the volume [30,31]. In the present work, it was observed that, with a reaction time of 20 min, a TRS amount of 17.64 (+2.17) g/L was found, which was the same as that obtained during a 30 min reaction for the #50 mesh (17.49 + 2.2 g/L). Therefore, the best results observed in terms of TRS increase were obtained when using a smaller particle size. In the study reported in [32], the authors evaluated three particle sizes and determined that the order of hemicellulose and lignin degradation was 400 > 850 > 1300 µm, confirming that treatment efficiency improves with finer particle sizes in sesame plant residues.
A positive effect of the sulfuric acid concentration on the amount of TRS released during pretreatment was observed. By increasing the acid concentration from 0.25 to 0.5 N for the particle size obtained from the #16 mesh, it was found that the TRS concentration increased from 5 to 15 g/L as a result. Meanwhile, the treatments without acid did not show an increase in the amount of TRS, remaining at an average of 1.8 g/L. This might have been because the pressure and temperature conditions were not conducive to observing an effect on the lignocellulosic material. In another work, it is mentioned that water used in a liquid form for physicochemical pretreatment should be between 170 and 230 °C with pressures up to 10 MPa to achieve hemicellulose hydrolysis, rendering the cellulose more accessible [33].
The results obtained with a #30 mesh size showed an increase in TRS concentration from 8.11 g/L to 15 g/L. Similar results indicated that the solubilization of glucan and xylan decreased from 17.7 to 8.5% and from 89.7 to 73.9%, respectively, with biomass particle sizes from 5 to 20 mm. This could be attributed to the decreased susceptibility to dilute-acid hydrolysis with an increase in biomass particle size, as the diffusion of acid into biomass could be reduced with an increasing particle size [34].
The effect of acid concentration on the reaction time was mainly observed at a 0.25 N concentration and a 20 min treatment duration, increasing from 3.5 g/L to 14.7 g/L at a #16 mesh size. For a #30 mesh size, a TRS increase of 8.11 g/L was found for the treatment lasting 30 min and employing a 0.25 N concentration, while the 20 min treatment with a 0.5 N acid concentration obtained 9.9 g/L TRS. Previous studies have shown that sugar yield is highly dependent on temperature, acid concentration, and reaction time: for instance, hydrolysis processes utilizing corn with yields greater than 10% solids should be conducted at temperatures below 200 °C to avoid the degradation of pentoses to 5-hydroxymethylfurfual [7].

3.1.2. Effect of Chemical and Enzymatic Hydrolysis on Mesquite Husk

The solid filtrate obtained from the pretreatment (FSP) and the hydrolysate obtained from a different pretreatment (HP) were adjusted to a pH of 4.5 and subjected to enzymatic hydrolysis with endo-1, 4-β-xylanase and β-glucanase. It was determined that, for the FSP sample, after 31 h of treatment, no statistical difference in values was found until the end of the study, remaining at 79.46 g/L. For HP, it was observed that, from 54 h onwards, no difference was found in the amount of TRS released, obtaining up to 113.37 g/L.
During the first 31 h of hydrolysis, a steady increase in TRS release was observed, measuring 2.28 g/Lh for SFP and 2.78 g/Lh for HP. In agreement with [35], during the initial stages of hydrolysis, xylose is released at a higher rate than glucose until it reaches equilibrium. This is mainly because xylanase, present in the enzymatic system, attacks the hemicellulose in the biomass efficiently and hydrolyzes it rapidly during the initial stages of hydrolysis. Subsequently, endoglucanases (EC 3.2.1.4) randomly attack the cellulose chains, exposing the reducing and non-reducing ends of the cellulose [36].

3.2. Response Surface Methodology

The results obtained were compared with the values predicted by the second-order model, in which a linear behavior was observed, with an adjusted r2 value of 96% and an r2 value of 93% for the predicted values (Figure 1). The ANOVA showed that the factors evaluated, in addition to the interactions between the factors #mesh-acid (AB) and acid-time (BC), presented a value of p < 0.05, indicating that the values of the constants for the model were statistically significant, while the factor #mesh-time (AC) did not present a significant effect on the model for obtaining reducing sugars (Equation (5)).
T R S = 9.77118 + 1.36641 A + 4.6238 B + 2.07084 C + 1.93845 A B + 0.07494 A C + 2.32814 B C 2.41307 A 2 0.19984 B 2 3.42226 C 2

3.3. Artificial Neural Network

Considering the coefficient of determination r2, the root mean square error (RMSE), and the mean absolute percentage error (MAPE), an ANN with the best performance was obtained. The ANN with the best fitness for predicting the TRS (r2 = 0.99, RMSE = 0.4365, MAPE = 3.645833%) was composed of one input layer with three neurons, three hidden layers with ten, nine, and eight neurons, and an output layer with one neuron denoting the TRS (Figure 2). The ANN linear correlation is shown in Figure 3a, where most of the points are very close to the blue line, indicating good precision of the ANN model. The best conditions for obtaining the maximum amount of TRS were the following: a particle size of 43, a concentration of 6% acid, and 40 min, producing 18.6762 g/L TRS. Like the experimental results, Figure 3a–c show that the minimum values for particle size, acid concentration, and time produced minimum values for the TRS and vice versa, whereby, given the maximum values for the input variables, the ANN model predicted high values for the TRS. The ANN model could thus predict sugar production during chemical hydrolysis. For the optimal conditions obtained experimentally (particle size #50, 0.5N H2SO4, and 20 min), the TRS was 16.41, while the ANN model’s forecast was 16.40. However, it is possible to investigate optimal conditions even outside the range considered in the lab experiments.
The optimal conditions used by the ANN model to obtain the maximum TRS (particle size #43, 0.6N H2SO4, and 40 min) could be validated. However, due to the lack of screens with certain granularity, this was difficult. This is a limitation of this study, as the particle size could not be adjusted exactly to the size indicated by the ANN.
To prevent overfitting, the artificial neural networks were evaluated using a subset of data not utilized for training purposes. The small size of the RMSE and MAPE and the proximity of r2 to 1 indicated that the ANN model could be generalized without overfitting.

3.4. Model Comparison

The outcomes of the two methodologies were evaluated by calculating the coefficient of determination (r2), the root mean square error (RMSE), and the mean absolute percentage error (MAPE) (Table 2). This analysis aimed to identify the method that delivered the most accurate predictions and, consequently, determine the optimal conditions for maximizing TRS yield.
Both methods achieved satisfactory data fits; however, the artificial neural network (ANN) demonstrated superior predictive accuracy, with an r2 exceeding 0.99 for all three variables studied: particle size, acid concentration, and time. In contrast, the r2 values obtained through the RSM were lower. Similarly, the RMSE and MAPE followed a consistent trend, as the ANN model produced lower errors compared to the RSM model.
This work provides a precedent for the implementation of ANNs in the prediction of TRS amounts in the chemical hydrolysis of mesquite (Prosopis laevigata) and its use in the production of bioethanol.

4. Conclusions

Because of the increasing production of greenhouse gases, the use of renewable energy sources is an urgent necessity. Mathematical models such as RSM and ANN are increasingly utilized in the biofuel production industry to anticipate and enhance processes. The use of these models allows for the prediction of optimal conditions for the utilization of mesquite (Prosopis laevigata) as a natural resource for producing biofuel. The main contribution of this work is the process applied for deriving TRS and the model generated by ANN, which was applied to the model for obtaining the values of TRS in chemical hydrolysis. This indicates that ANNs can effectively represent the relationship between the input variables (particle size, acid, and time) and the output variable (TRS) in the study of mesquite as an alternative in the production of biofuels. These statistical models can be applied to analyze different natural resources as alternative options for biofuels by extending and applying them to energy production. As a result of further research, this methodology will be applied to other clean energy alternatives for proposing environmentally friendly alternatives to carbon-based fuels that have an impact on the environment.

Author Contributions

Conceptualization, A.T.-J. and R.P.-C.; funding acquisition, J.M.-M.; investigation, S.V.-M., A.T.-J. and R.P.-C.; methodology, S.V.-M., A.T.-J., R.P.-C., M.G.S.-D. and J.M.-M.; software, J.M.-M. and M.G.S.-D.; validation, M.G.S.-D., R.P.-C. and J.M.-M.; writing—original draft, R.P.-C., M.G.S.-D. and J.M.-M.; writing—review and editing, A.T.-J. and J.M.-M. All authors have read and agreed to the published version of the manuscript.

Funding

This study was partially supported by the National Council for Humanities, Science and Technology (CONAHCYT), with project number CB-2017-2018-A1-S-43008.

Institutional Review Board Statement

Not applicable.

Informed Consent Statement

Not applicable.

Data Availability Statement

The data presented in this study are available in this paper.

Acknowledgments

The authors wish to acknowledge the Universidad Politécnica Metropolitana de Hidalgo for the facilities used in the development of this research project.

Conflicts of Interest

The authors declare that they have no known competing financial interests or personal relationships that could have appeared to influence the work reported in this paper.

References

  1. Hallett, J.P.; Eckert, C.A.; Ragauskas, A.J.; Nagy, M.; Kim, D.H.; Liotta, C.L. From wood to fuels: Integrating biofuels and pulp production. Ind. Biotechnol. 2006, 2, 55–65. [Google Scholar] [CrossRef]
  2. Betiku, E.; Taiwo, A.E. Modeling and optimization of bioethanol production from breadfruit starch hydrolyzate vis-á-vis response surface methodology and artificial neural network. Renew. Energy 2015, 74, 87–94. [Google Scholar] [CrossRef]
  3. Vasić, K.; Knez, Ž.; Leitgeb, M. Bioethanol Production by Enzymatic Hydrolysis from Different Lignocellulosic Sources. Molecules 2021, 26, 753. [Google Scholar] [CrossRef] [PubMed]
  4. Wong, Y.C.; Sanggari, V. Bioethanol Production from Sugarcane Bagasse using Fermentation Process. Orient. J. Chem. 2014, 30, 507–513. [Google Scholar] [CrossRef]
  5. Mankar, A.R.; Pandey, A.; Modak, A.; Pant, K.K. Pretreatment of lignocellulosic biomass: A review on recent advances. Bioresour. Technol. 2021, 334, 125235. [Google Scholar] [CrossRef]
  6. Petersson, A.; Thomsen, M.; Hauggaard-Nielsen, H.; Thomsen, A. Potential bioethanol and biogas production using lignocellulosic biomass from winter rye, oilseed rape and faba bean. Biomass Bioenergy 2007, 31, 812–819. [Google Scholar] [CrossRef]
  7. Zhou, Z.; Liu, D.; Zhao, X. Conversion of lignocellulose to biofuels and chemicals via sugar platform: An updated review on chemistry and mechanisms of acid hydrolysis of lignocellulose. Renew. Sustain. Energy Rev. 2021, 146, 111169. [Google Scholar] [CrossRef]
  8. Cardona, C.A.; Quintero, J.A.; Paz, I.C. Production of bioethanol from sugarcane bagasse: Status and perspectives. Bioresour. Technol. 2010, 101, 4754–4766. [Google Scholar] [CrossRef]
  9. Huang, C.; Jiang, X.; Shen, X.; Hu, J.; Tang, W.; Wu, X.; Ragauskas, A.; Jameel, H.; Meng, X.; Yong, Q. Lignin-enzyme interaction: A roadblock for efficient enzymatic hydrolysis of lignocellulosics. Renew. Sustain. Energy Rev. 2022, 154, 111822. [Google Scholar] [CrossRef]
  10. Agrawal, R.; Verma, A.; Singhania, R.R.; Varjani, S.; Di Dong, C.; Kumar Patel, A. Current understanding of the inhibition factors and their mechanism of action for the lignocellulosic biomass hydrolysis. Bioresour. Technol. 2021, 332, 125042. [Google Scholar] [CrossRef]
  11. Soto, X.; Fernández, K. Aprovechamiento del Fruto del Mezquite (Prosopis glandulosa y Prosopis spp) en la Zona de San Luis Rio Colorado, Sonora, Para la Elaboración y Comercialización de Harina de alto Valor Nutricional (Use of Mesquite Fruit (Prosopis glandulosa and Prosopis spp) in the area of San Luis Rio Colorado, Sonora, for the Production and Marketing of Flour of High Nutritional Value). In Ciencias Agropecuarias; Aguilera, M., Ramos, V., Eds.; Handbook T-II; ECORFAN®: Valle de Santiago, Mexico, 2014; pp. 1–5. [Google Scholar]
  12. Sauceda, E.N.R.; Martínez, G.E.R.; Valverde, B.R.; Ruiz, R.M.; Hermida, M.d.l.C.C.; Torres, S.M.M.; Ruiz, H.H.P. Análisis técnico del árbol del mezquite (Prosopis laevigata Humb. & Bonpl. ex Willd.) en México (Technical analysis of the mesquite tree (Prosopis laevigata Humb. & Bonpl. ex Willd.) in Mexico). Ra Ximhai 2014, 10, 173–194. [Google Scholar] [CrossRef]
  13. Luna Castañón, R. Variabilidad Morfologica y Genética del Mezquite Prosopis laevigata (Humb. & Bonpl. ex Willd.) en el Estado de Aguascalientes (Morphological and Genetic Variability of Mesquite Prosopis laevigata (Humb. & Bonpl. ex Willd.) in the State of Aguascalientes). Master’s Thesis, Universidad Autonoma de Aguascalientes, Aguascalientes, Mexico, 2014. Available online: http://bdigital.dgse.uaa.mx:8080/xmlui/bitstream/handle/11317/305/398549.pdf?sequence=1&isAllowed=y (accessed on 10 October 2024).
  14. Peña-Avelino, L.; Pinos-Rodríguez, J.; Yáñez-Estrada, L.; Juárez-Flores, B.; Mejia, R.; Andrade-Zaldivar, H. Chemical composition and in vitro degradation of red and white mesquite (Prosopis laevigata) pods. S. Afr. J. Anim. Sci. 2014, 44, 298. [Google Scholar] [CrossRef]
  15. Mom, M.P. Caracterización Estructural y Propiedades Funcionales de las Harinas de Los Frutos de Prosopis alba Griseb., P. chilensis (Molina) Stuntz Emend. Burkart y P. flexuosa DC. Desarrollo de un Proceso de Secado, Molienda y Mezcla Para Optimizar la Calidad del Producto. Ph.D. Thesis, Universidad de Buenos Aires, Buenos Aires, Argentina, 17 December 2012. Available online: https://bibliotecadigital.exactas.uba.ar/greenstone3/exa/collection/tesis/document/tesis_n5217_Mom (accessed on 24 September 2024).
  16. Pasiecznik, N.M.; Felker, P.; Harris, P.J.C.; Harsh, L.N.; Cruz, G.; Tewari, J.C.; Cadoret, K.; Maldonado, L.J. The Prosopis Juliflora—Prosopis Pallida Complex: A Monograph; HDRA: Coventry, UK, 2001. [Google Scholar]
  17. Azpeitia, L.G.; Labrada-Delgado, G.J.; Montalvo-González, E.; Loza-Cornejo, S. Morphometric and anatomical characters of fruits and seeds of a population of Prosopis laevigata (Fabaceae) in Lagos de Moreno, Jalisco, Mexico. Acta Bot. Mex. 2022, 129, e2057. [Google Scholar] [CrossRef]
  18. Asanza, W.R.; Olivo, B.M. Redes Neuronales Artificiales Aplicadas al Reconocimiento de Patrones (Artificial Neural Networks Applied to Pattern Recognition); Editorial UTMACH: Machala, Ecuador, 2018. [Google Scholar]
  19. Chouaibi, M.; Daoued, K.B.; Riguane, K.; Rouissi, T.; Ferrari, G. Production of bioethanol from pumpkin peel wastes: Comparison between response surface methodology (RSM) and artificial neural networks (ANN). Ind. Crops Prod. 2020, 155, 112822. [Google Scholar] [CrossRef]
  20. Igwilo, C.N.; Ude, N.C.; Onoh, I.M.; Enekwe, C.B.; Alieze, B.A. RSM, ANN and ANFIS applications in modeling fermentable sugar production from enzymatic hydrolysis of Colocynthis Vulgaris Shrad seeds shell. Bioresour. Technol. Rep. 2022, 18, 101056. [Google Scholar] [CrossRef]
  21. Pradhan, D.; Jaiswal, S.; Jaiswal, A.K. Artificial neural networks in valorization process modeling of lignocellulosic biomass. Biofuels Bioprod. Biorefining 2022, 16, 1849–1868. [Google Scholar] [CrossRef]
  22. Vibha, R.; Sandesh, K.; Ujwal, P.; Shet, V.B. RSM-and ANN-based modeling for a novel hydrolysis process of lignocellulose residues to produce cost-effective fermentable sugars. Biomass Convers. Biorefinery 2024, 14, 24181–24196. [Google Scholar] [CrossRef]
  23. Miller, G.L. Use of Dinitrosalicylic Acid Reagent for Determination of Reducing Sugar. Anal. Chem. 1959, 31, 426–428. [Google Scholar] [CrossRef]
  24. Pérez-Cadena, R.; Espinosa-Solares, T.; Medina-Moreno, S.A.; Martínez, A.; Lizardi-Jiménez, M.A.; Téllez-Jurado, A. Effect of the age of Opuntia ficus-indica cladodes on the release of simple sugars. Biocatal. Agric. Biotechnol. 2021, 33, 102010. [Google Scholar] [CrossRef]
  25. Liu, W.; Wu, R.; Wang, B.; Hu, Y.; Hou, Q.; Zhang, P.; Wu, R. Comparative study on different pretreatment on enzymatic hydrolysis of corncob residues. Bioresour. Technol. 2020, 295, 122244. [Google Scholar] [CrossRef]
  26. Aggarwal, C.C. Neural Networks and Deep Learning; Springer: Cham, Switzerland, 2018; Volume 10, p. 3. [Google Scholar]
  27. Zhang, Z.; Feng, Q.; Huang, J.; Guo, Y.; Xu, J.; Wang, J. A local search algorithm for k-means with outliers. Neurocomputing 2021, 450, 230–241. [Google Scholar] [CrossRef]
  28. Hagan, M.T.; Demuth, H.B.; Beale, M.H.; De Jesus, O. Neural Network Design, 2nd ed.; Oklahoma State University: Stillwater, OK, USA, 2014; Available online: http://hagan.okstate.edu/NNDesign.pdf (accessed on 3 September 2024).
  29. Geyikçi, F.; Kılıç, E.; Çoruh, S.; Elevli, S. Modelling of lead adsorption from industrial sludge leachate on red mud by using RSM and ANN. Chem. Eng. J. 2012, 183, 53–59. [Google Scholar] [CrossRef]
  30. Alokika, A.; Kumar, A.; Kumar, V.; Singh, B. Cellulosic and hemicellulosic fractions of sugarcane bagasse: Potential, challenges and future perspective. Int. J. Biol. Macromol. 2021, 169, 564–582. [Google Scholar] [CrossRef] [PubMed]
  31. Chundawat, S.P.S.; Venkatesh, B.; Dale, B.E. Effect of particle size based separation of milled corn stover on AFEX pretreatment and enzymatic digestibility. Biotechnol. Bioeng. 2007, 96, 219–231. [Google Scholar] [CrossRef]
  32. Kumar, P.; Kumar, V.; Kumar, S.; Singh, J.; Kumar, P. Bioethanol production from sesame (Sesamum indicum L.) plant residue by combined physical, microbial and chemical pretreatments. Bioresour. Technol. 2020, 297, 122484. [Google Scholar] [CrossRef]
  33. Sarker, T.R.; Pattnaik, F.; Nanda, S.; Dalai, A.K.; Meda, V.; Naik, S. Hydrothermal pretreatment technologies for lignocellulosic biomass: A review of steam explosion and subcritical water hydrolysis. Chemosphere 2021, 284, 131372. [Google Scholar] [CrossRef]
  34. Kapoor, M.; Semwal, S.; Satlewal, A.; Christopher, J.; Gupta, R.P. The impact of particle size of cellulosic residue and solid loadings on enzymatic hydrolysis with a mass balance. Fuel 2019, 245, 514–520. [Google Scholar] [CrossRef]
  35. Baksi, S.; Ball, A.K.; Sarkar, U.; Banerjee, D.; Wentzel, A.; Preisig, H.A.; Kuniyal, J.C.; Birgen, C.; Saha, S.; Wittgens, B.; et al. Efficacy of a novel sequential enzymatic hydrolysis of lignocellulosic biomass and inhibition characteristics of monosugars. Int. J. Biol. Macromol. 2019, 129, 634–644. [Google Scholar] [CrossRef]
  36. Infanzón-Rodríguez, M.I.; Ragazzo-Sánchez, J.A.; del Moral, S.; Calderón-Santoyo, M.; Aguilar-Uscanga, M.G. Enzymatic hydrolysis of lignocellulosic biomass using native cellulase produced by Aspergillus niger ITV02 under liquid state fermentation. Biotechnol. Appl. Biochem. 2021, 69, 198–208. [Google Scholar] [CrossRef]
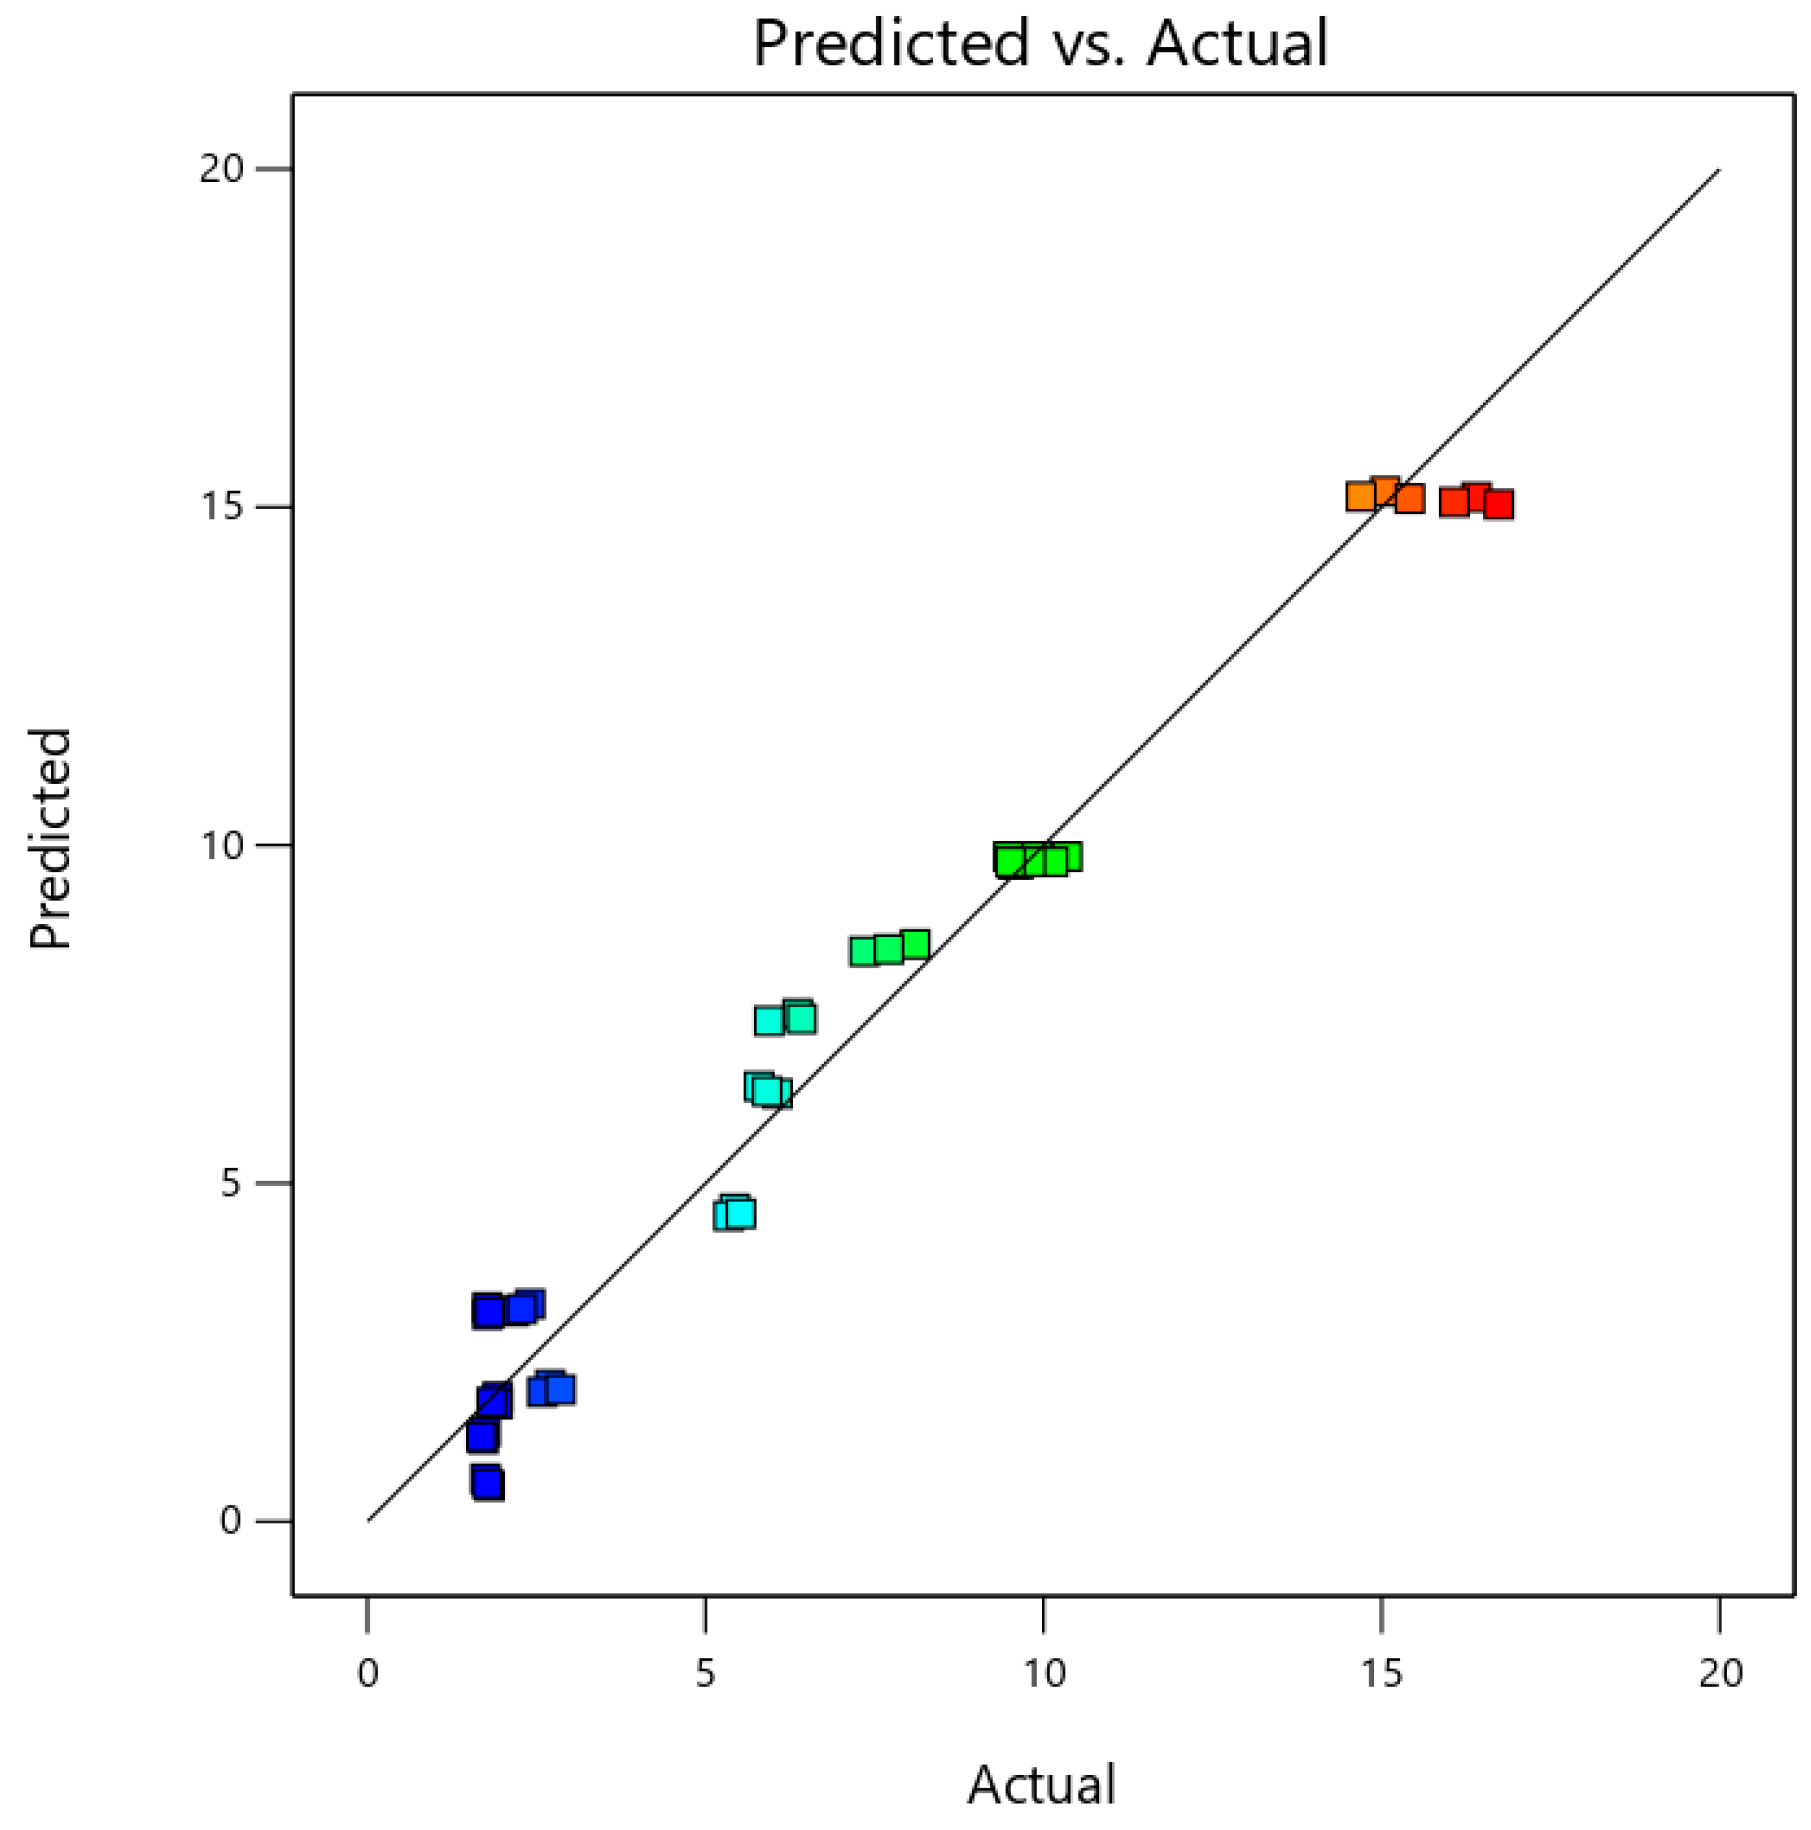
Figure 1. Statistical comparison of the experimental values and the values predicted by the RSM model.
Applsci 15 01419 g001
Figure 2. ANN architecture of the model for obtaining the amount of TRS.
Applsci 15 01419 g002
Figure 3. Linear correlation (a) and ANN plots for TRS with particle sizes of 16 (b), 30 (c), and 50 (d).
Applsci 15 01419 g003
Table 1. Box–Behnken experimental design for obtaining reducing sugars from chemical hydrolysis.
No.Particle Size
(A)
Acid (N)
(B)
Time (min)
(C)
TRS (g/L)
Experimental
130 (0)0.25 (0)20 (0)9.75
216 (−1)0 (−1)20 (0)1.79
350 (+1)0 (−1)20 (0)2.72
416 (−1)0.5 (+1)20 (0)7.72
550 (+1)0.5 (+1)20 (0)16.41
616 (−1)0.25 (0)10 (−1)1.78
750 (+1)0.25 (0)10 (−1)2.29
830 (0)0.25 (0)20 (0)9.91
916 (−1)0.25 (0)30 (+1)5.43
1050 (+1)0.25 (0)30 (+1)6.24
1130 (0)0 (−1)10 (−1)1.90
1230 (0)0.5 (+1)10 (−1)5.92
1330 (0)0 (−1)30 (+1)1.72
1430 (0)0.5 (+1)30 (+1)15.06
1530 (0)0.25 (0)20 (0)9.65
Table 2. Comparative metrics of RSM and ANN models.
Coefficient of
Determination r2
Root Mean Square
Error (RMSE)
Mean Absolute Percentage Error (MAPE)
RSMANNRSMANNRSMANN
0.930.991.480.4426.22%3.65%
Disclaimer/Publisher’s Note: The statements, opinions and data contained in all publications are solely those of the individual author(s) and contributor(s) and not of MDPI and/or the editor(s). MDPI and/or the editor(s) disclaim responsibility for any injury to people or property resulting from any ideas, methods, instructions or products referred to in the content.