Article

Spatio-Temporal Evolution and Influencing Factors of Supply–Demand Coupling and Coordination in Civil Aviation Passenger Transport

1
College of Civil Aviation, Nanjing University of Aeronautics and Astronautics, Nanjing 211106, China
2
School of Transportation Management, Xinjiang Vocational and Technical College of Communications, Urumqi 831401, China
*
Author to whom correspondence should be addressed.
Appl. Sci. 2025, 15(3), 1362; https://doi.org/10.3390/app15031362
Submission received: 18 December 2024 / Revised: 13 January 2025 / Accepted: 23 January 2025 / Published: 28 January 2025

Abstract

:
The interaction between supply and demand of civil aviation passenger transport serves as an important reference for airport planning, transportation structure optimization and dynamic matching of supply and demand. Based on the panel data of 31 province-level administrative divisions (excluding Hong Kong, Macao, and Taiwan) in China spanning from 2004 to 2019, this study employs the entropy-weighted TOPSIS method to evaluate the supply level and demand level of civil aviation passenger transport. On this foundation, this study uses the modified coupling coordination degree model to measure the coupling coordination degree of civil aviation passenger transport supply and demand, further analyzes the spatio-temporal evolution characteristics of coupling coordination degree and employs the double fixed-effect model to investigate the influencing factors. The results indicate that China’s civil aviation passenger supply, demand and supply and demand coupling coordination degree are increasing year by year. The level of provincial supply and demand coupling coordination has risen to the upper-middle level, and has shown significant spatial differences. Economically developed regions demonstrate a higher level of coordination. Economic development, urbanization rate and the degree of opening to the outside world have a positive impact on the coupling and coordinated development.

1. Introduction

The supply and demand of civil aviation passenger transport are two interdependent and opposite subsystems in the aviation system. On the one hand, passenger supply is the carrier of passenger demand and the improvement of supply infrastructure and service level has stimulated aviation demand and promoted the improvement of passenger demand. On the other hand, a higher level of demand development will reversely force the continuous improvement of supply infrastructure and service levels. The supply and demand of civil aviation passenger transport interact with and promote each other. Through interaction and feedback, the resonance and superposition between the two subsystems are realized, thus forming a development situation in which the two complement each other and are coupled and coordinated. However, in actual development, there are often problems such as waste of resources or insufficient service capabilities. China’s 14th Five-Year Civil Aviation Development Plan points out that the industry capacity is insufficient and the problem of unbalanced development is still prominent, and the infrastructure support capacity is facing double bottlenecks of capacity and efficiency. Demand exceeding supply leads to demand being rejected, and flight delays affect service quality. Supply exceeding demand leads to overcapacity, which reduces flight occupancy and fleet utilization, resulting in unnecessary waste and loss. This is inconsistent with the concept of green development. The coordinated development of both plays an important role in solving the contradiction between supply and demand of civil aviation passenger transport, implementing macro-control and realizing the sustainable development of high-quality civil aviation. Supply-side reform and demand-side management are indispensable.
The following sections of this study are organized as detailed below: Section 2 contains the literature review. Section 3 introduces the research methods. Section 4 analyzes the spatio-temporal evolution of coupling coordination and its influencing factors. Section 5 summarizes the conclusions of this study.

2. Literature Review

Research related to this study mainly focuses on the development level and evolution of passenger traffic patterns of civil aviation airports (supply side) and factors influencing demand and demand forecasting (demand side), as well as the coordinated development of air transport with the economy and industries, etc.
From the supply side, scholars have carried out research from the aspects of airport competitiveness index construction and evaluation, competitiveness influencing factors, airport operation efficiency, passenger transport pattern evolution, etc. Shao, G. [1], Pashkevich, A. et al. [2] constructed an evaluation index system to evaluate the competitiveness of airports. Zhang, Y. et al. [3] studied the competitiveness of China’s civil aviation airports from the perspective of spatial and temporal changes. Zhang, X. et al. [4] constructed indicators to assess the degree of coordinated development of multi-airports in the Yangtze River Delta region. Zhu, C. et al. [5] found that the core indicators that determine the competitiveness of China’s airports are cargo and mail throughput, passenger throughput, aircraft take-off and landing, number of runways and number of airport complaints. Cui, Q. et al. [6] believed that airport investment and urban R&D investment are the two most important factors affecting the competitiveness of China’s airports. Lei, X. et al. [7] believed that the competitive environment, competitive strength and competitive potential affect the competitiveness of airports. Huynh, T.M. et al. [8] used a two-stage approach to measure the efficiency of major airports in Southeast Asia. Patrícia Belfiore, F. [9] found that airport operation characteristics, governance structure, service strategy, fleet composition, quality indicators and economic factors are the determinants of Brazil’s airport efficiency. Fu, Z. et al. [10] found that the hinterland economy, airport size, airport level and multi-airport system promoted China’s airport operation efficiency. J. Cifuentes-Faura et al. [11] applied the Data Envelopment Analysis (DEA) method to study the efficiency of Spanish airports in 2018. Miao, Y. et al. [12] used the number of airports and passenger and cargo throughput to explore the spatio-temporal evolution of China’s civil aviation airport structure, service scope and the supply and demand relationship of air travel. Jia, P. et al. [13] used the standard deviation ellipse and GIS spatial analysis method to find that per capita GDP and regional GDP are the main driving factors of the evolution mechanism of passenger transport patterns. Ma, S. et al. [14] used the standard deviation ellipse method to compare and analyze the evolution characteristics of China’s air passenger transport and airport pattern. Yu, S. et al. [15] explored the spatio-temporal evolution and influencing factors of China’s civil aviation passenger transport from the perspective of passenger transport structure.
From the demand side, scholars have studied the impact of factors such as population (Dziedzic, M. et al. [16]), economy (Marazzo, M. et al. [17], Profillidis, V. et al. [18]), income (You, K.K. et al. [19]), tourism (Xu, W.H. [20]), urbanization level (Wu, X.L. et al. [21]), market competition (Hoyos, D.T. et al. [22]), geographic position (Inan, A. et al. [23]), airport service quality (Prentice, C. et al. [24], Liao, W. et al. [25]), alternative modes of transportation (Wang, J.E. et al. [26]) and other factors on aviation demand. Gu, W.F. et al. [27] used a SARIMA-BP combined model, Suryani, E. et al. [28] used a system dynamics model, Zhao, Z.X. et al. [29] used a time series model, Jichao, L. et al. [30] used a multi-prediction model, Cheng, L. [31] used a multiple regression analysis model and time series ARIMA model, Hu, Y.C. [32] utilized nonadditive forecast combination with gray prediction, Chen, Y. et al. [33] applied the GM (1, 1) gray prediction model and the GM (2, 1) gray prediction model and Anupam, A. et al. [34] used nonlinear autoregression (NARX) to predict air passenger flow. Javanmard, M.E. et al. [35] developed a hybrid framework integrating machine learning algorithms to predict passengers. Liang, X.Z. et al. [36] utilized search engine data (SED) to improve air passenger demand forecasting.
Scholars have also studied the coordinated development of air transport, economy and industry. Zhao, S.X. [37] introduced the concept of adaptability in the scale economy of airport construction and analyzed the conditions for realizing the best scale of airport construction in line with social and economic factors. Nasution, D. et al. [38] investigated the correlation between air transportation and economic development. N.J.P.J.o.A.E.; Mehmood, B. et al. [39] suggested that the air transport industry promoted economic growth. Jiao’e, W. et al. [40] adopted a panel VAR model to deeply investigate the coupling relationship between the air transport industry and tourism development. Ji, K.W. et al. [41] conducted an analysis on the coupling coordination relationship and spatial effects between China’s aviation and tourism industries by employing coupling coordination degree metrics alongside a spatial econometric model. Zhang, W. et al. [42] studied the spatio-temporal relationship between civil aviation transportation and tourism in western China.
There are still some limitations in the previous scholars’ research. (1) Scholars mostly perform qualitative and quantitative research on one side of the supply or demand factors of civil aviation passenger transport. There are relatively few examples in the literature that study the supply and demand of civil aviation passenger transport as a system. (2) There are few systematic studies on the coupling and coordination of supply–demand of civil aviation passenger transport. Moreover, there is no clear understanding of the factors affecting the coupling and coordination of supply–demand, and there is a lack of a quantitative basis for guiding policy formulation. (3) The study on the regional characteristics of the coupling and coordination of provincial passenger transport supply–demand in space is neglected.
This study puts both the supply (supply side) and the demand (demand side) of civil aviation passenger transport in an overall framework. The civil aviation subsystem is taken as an organic whole to make up for the limitation of separating the civil aviation subsystem from the previous research to one-sidedly characterize the development status of civil aviation passenger transport. Focusing on data from 31 province-level administrative divisions (excluding Hong Kong, Macao, and Taiwan) in China between 2004 and 2019, this study evaluates the levels of supply and demand in civil aviation passenger transport, assesses the stages of coupling and coordinated development and investigates the spatio-temporal evolution of these dynamics. Additionally, it analyzes the factors influencing the degree of coupling coordination. The aim of this study is to establish a theoretical and practical foundation for enhancing the coordinated development between the supply and demand of civil aviation passenger transport. There are two innovations in this study. Firstly, it develops an evaluation system designed to assess the coupling and coordination between the supply and demand within the civil aviation passenger transport sector. Secondly, it illustrates the spatio-temporal evolution of the degree of coupling coordination between supply and demand in civil aviation passenger transport and conducts an analysis of the influencing factors.

3. Research Methods

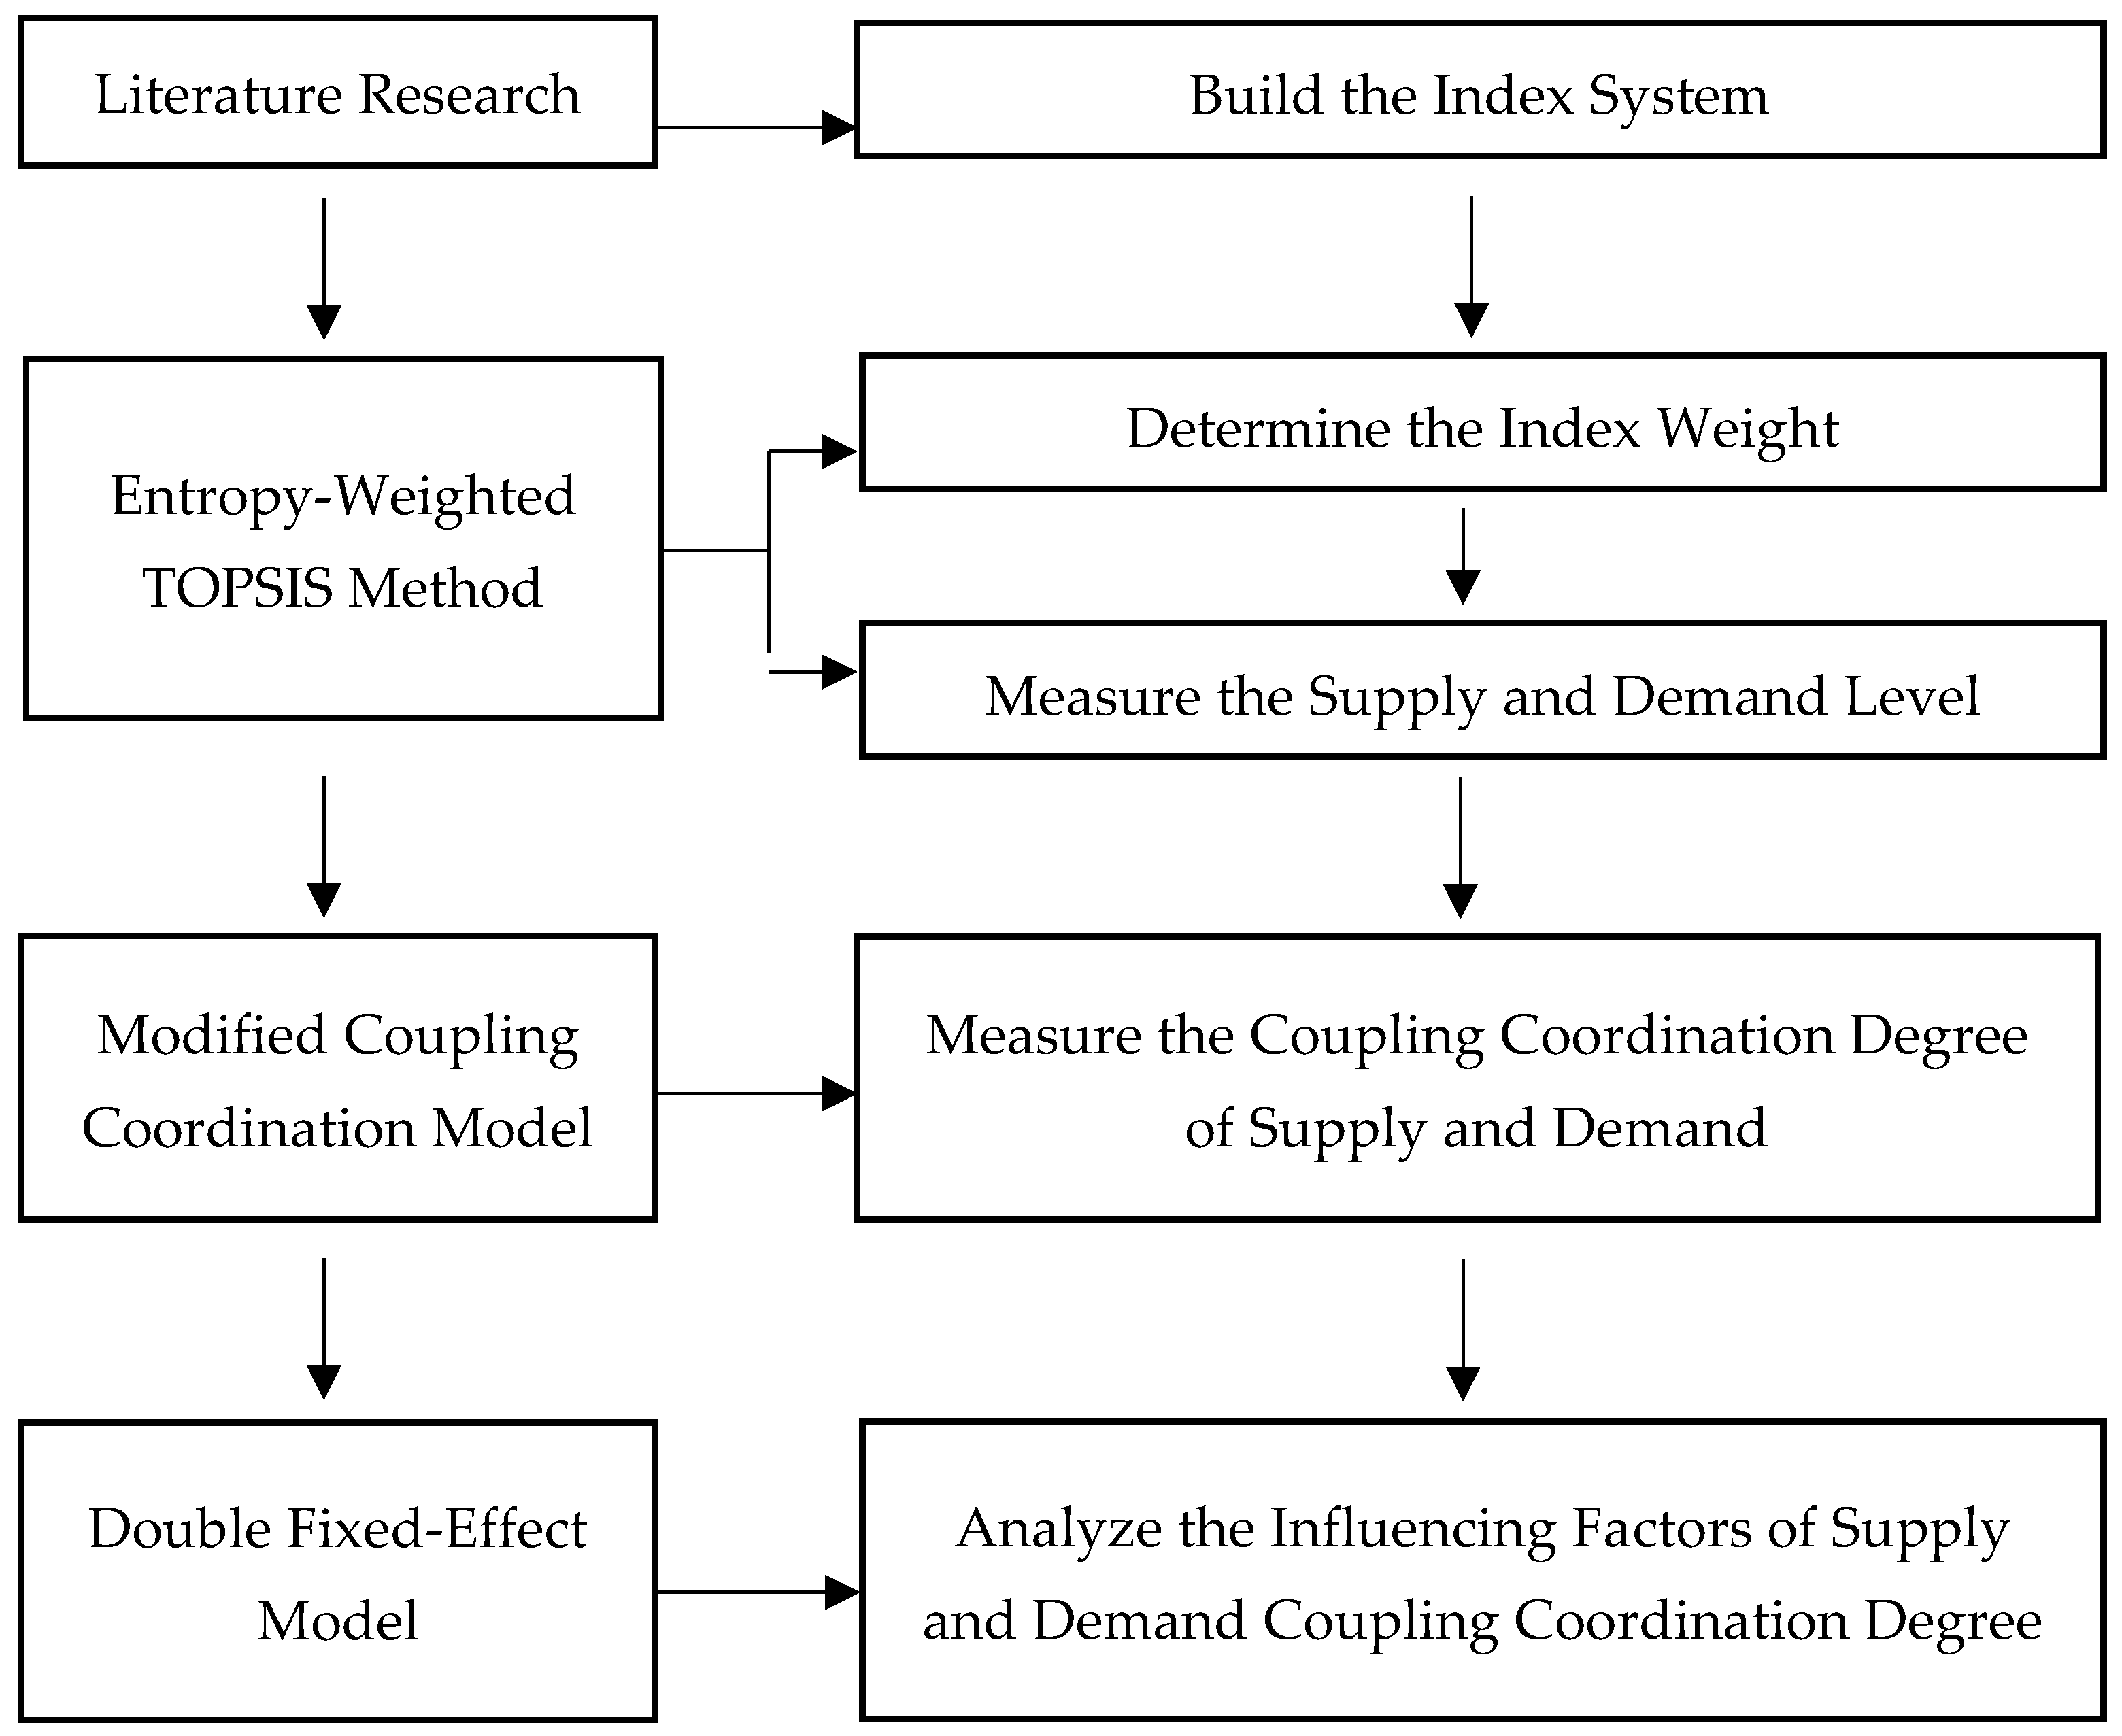
3.1. Study Framework

This study selects two systems of civil aviation passenger supply and demand. Firstly, combined with literature research, the evaluation index system of two systems is constructed. Secondly, the entropy-weighted TOPSIS method is used to determine the weight of the evaluation index and measure the supply and demand level of civil aviation passenger transport. Thirdly, the modified coupling coordination model is used to calculate the coupling coordination degree of supply and demand of civil aviation passenger transport. Finally, the double fixed-effect model is used to analyze the influencing factors of the coupling coordination degree. The methodology diagram of this study is shown in Figure 1:

3.2. Evaluation Index System of Supply and Demand of Civil Aviation Passenger Transport

This study follows the principles of index selection such as objectivity, rationality and data availability and draws on the existing relevant literature and the ‘China Civil Aviation High-quality Development Index Framework System’ to build an evaluation system (Table 1). This study constructs the evaluation index of civil aviation passenger transport supply from the two aspects of facility system and service system and selects the number of airports, airport density, number of airports per million people, runway number and airport terminal area to reflect the facility system and selects the number of civil aviation employees and the proportion of civil aviation employees to reflect the service system. This study constructs civil aviation passenger demand indicators from the two aspects of demand status and demand potential and selects passenger throughput, aircraft take-off and landing sorties, single-runway aircraft take-off and landing sorties and passenger throughput per square kilometer to reflect the demand status and selects passenger throughput annual growth rate, aircraft take-off and landing sorties annual growth rate, passenger throughput and permanent population ratio to reflect demand potential.

3.3. Data Source

This study focuses on the 31 province-level administrative divisions (excluding Hong Kong, Macao, and Taiwan) in China as the subjects of investigation. The research period is delineated from 2004 to 2019. The data come from ‘China Statistical Yearbook’ [43], ‘Civil Aviation Airport Production Statistics Bulletin’ [44], ‘Civil Aviation from a Statistical Perspective’ [45], ‘China Civil Airport’ [46], ‘China Civil Aviation Statistical Data Compilation’ [47] and ‘China Civil Airport Encyclopedia. National Airport Information List’ [48], as well as Statistical Yearbook and Statistical Bulletin of each administrative division, and Baidu Encyclopedia. After systematic collection and collation, the initial data set is formed. For individual missing data, the trend extrapolation method and interpolation method are used to estimate.

3.4. Methods

3.4.1. Entropy-Weighted TOPSIS Method

The entropy-weighted method assigns weights based on the amount of information conveyed by the statistical data of the indices. The TOPSIS method assesses the relative strengths and weaknesses of existing schemes by evaluating the proximity of the evaluation objects to an idealized goal. The entropy-weighted TOPSIS method combines the entropy method of objective weighting with the technique for order preference by similarity to an ideal point method. It is not interfered with by subjective factors and reference sequence selection. It has the advantages of intuitive, simple operation, less information loss and so on [49]. Therefore, this study adopts this method to measure the supply–demand level of civil aviation passenger transport. The steps for performing the calculations are outlined below:
Step 1: Standardize the original data matrix.
Positive indicators:
Y i j = X i j min X j max X j min X j
Negative indicators:
Y i j = max X j X i j max X j min X j
Step 2: Calculate information entropy.
E j = k i = 1 m p i j l n p i j In   the   following   formula :   p ij = Y ij i = 1 m Y i j ;   k = 1 ln m
Step 3: Calculate the weight of each index.
W j = 1 E j j = 1 n 1 E j
Step 4: Construct a weighted decision matrix.
R = r ij m × n ,   r ij = w j × Y ij
Step 5: Calculate the positive ideal solution and negative ideal solution.
R j + = max ( r 1 j ,     r 2 j , r n j ) , R j = min (   r 1 j ,   r 2 j , r n j )
Step 6: Calculate the Euclidean distance between each scheme and the optimal solution and the worst solution.
d i + = j = 1 n r ij R j + 2 ,   d i = j = 1 n r i j R j 2
Step 7: Calculate the comprehensive evaluation index.
U i = d i d i + + d i ,   U i [ 0 ,   1 ] .

3.4.2. Modified Coupling Coordination Degree Model

The coupling degree refers to the extent of interaction and mutual influence among the system and its internal components. The degree of coordination indicates a positive interaction among the system or its internal components. The coupling coordination degree quantifies the harmony among the system and its internal components during the developmental process, indicating the progression of the system from a state of disorder to one of order. The coupling coordination of supply and demand of civil aviation passenger transport is a research problem in the field of social science. The coupling degree C, as calculated by the traditional coupling coordination degree model, exhibits minimal variation, leading to a reduced differentiation that undermines the explanatory validity of the coupling degree. To address this issue, this study adopts the modified coupling coordination degree model, drawing on the insights of scholars such as Wang, S.J. et al. [50], to effectively characterize the coupling coordination level of China’s civil aviation passenger transport supply–demand. The calculation formula is as follows:
Assume that maxUi is Ux,
C = 1 ( U x U y ) × U y U x
D = C × T
T = a U 1 + b U 2
where C represents the degree of coupling, C ∈ [0, 1]. U1 and U2 represent the comprehensive evaluation value of supply and demand of civil aviation passenger transport, respectively. D is the coupling coordination degree, D ∈ [0, 1]. T is the comprehensive adjustment index of supply and demand of civil aviation passenger transport and a and b are the undetermined coefficients of supply and demand of civil aviation passenger transport. This study considers that supply and demand are equally important to the development of civil aviation passenger transport system, so that a + b = 1, a = b = 0.5.
Drawing on the standards of coordination level division in previous scholars’ research, this study categorizes the coupling coordination degree of civil aviation passenger transport supply–demand in China into five distinct levels, ranging from low to high (Table 2).

3.4.3. Kernel Density Estimation

Kernel density estimation is a non-parametric estimation method, which can describe the distribution of random variables more accurately and improve the continuity of estimation results than a histogram. The formula is as follows:
f x = 1 n h i = 1 n K X i x h
in which n is the number of observations; h is the bandwidth; K (•) is the kernel function; Xi is an independent and identically distributed observation; x is the mean value; and f(x) is a probability density function estimation of the coupling coordination degree of supply and demand of civil aviation passenger transport.

3.4.4. Global Spatial Autocorrelation Analysis

This study uses global Moran’s I to assess the spatial autocorrelation of the coupling coordination degree of civil aviation passenger transport supply and demand in China. The global Moran index formula is as follows:
I =   n i = 1 n j = 1 n W i j ( x i x ̄ ) ( x j x ̄ ) i = 1 n j = 1 n W i j i = 1 n ( x i x ̄ ) 2
where n denotes the total count of spatial units within the designated study area and xi and xj denote the observation values of a certain geographical attribute in regions i and j, respectively. x ̄ is the sample mean of a geographical attribute value. Wij represents the spatial weight matrix. In this study, the 0–1 adjacency matrix is used. If region i and region j have a common boundary or node, then Wij = 1; if the contrary holds, then Wij = 0. The global Moran index ranges from −1 to 1. A positive value suggests that there is a spatial positive correlation among the variables, while a negative value signifies the presence of a spatially negative correlation. If the index equals zero, it signifies that there is no spatial correlation.

3.4.5. Measurement Model

Using panel data collected from 31 province-level administrative divisions (excluding Hong Kong, Macao, and Taiwan) in China over the period from 2004 to 2019, this study develops a regression model to investigate the influencing factors of the coupling coordination degree of supply–demand of civil aviation passenger transport.
D i t = β 0 + β 1 H 1 , i t β n H n , i t + δ i + θ t + ε i t
in which D denotes the coupling coordination degree; i denotes any province-level administrative division; t denotes the year; H1Hn denotes the first to nth influencing factor; δ denotes the province-level fixed effect; θ is the year fixed effect; ε denotes the random error term; β0 denotes a constant; and β1 βn denote the coefficient of the model.

4. Results

4.1. Coupling Coordination Analysis

This study employs the entropy-weighted TOPSIS method to derive the comprehensive scores for the two subsystems of supply and demand. Building on this foundation, this study utilizes a modified coupling coordination degree model to assess the coupling coordination degree between these two subsystems. The temporal trend of the coupling coordination degree of supply–demand of civil aviation passenger transport from 2004 to 2019 is shown in Figure 2. Overall, the coupling coordination degree of China’s civil aviation passenger transport supply and demand has demonstrated a steady annual increase. The coupling coordination value was 0.19 in 2004 and increased to 0.34 in 2019, achieving a transition from extreme imbalance to low coordination. The supply and demand subsystems also show a steady upward trend.

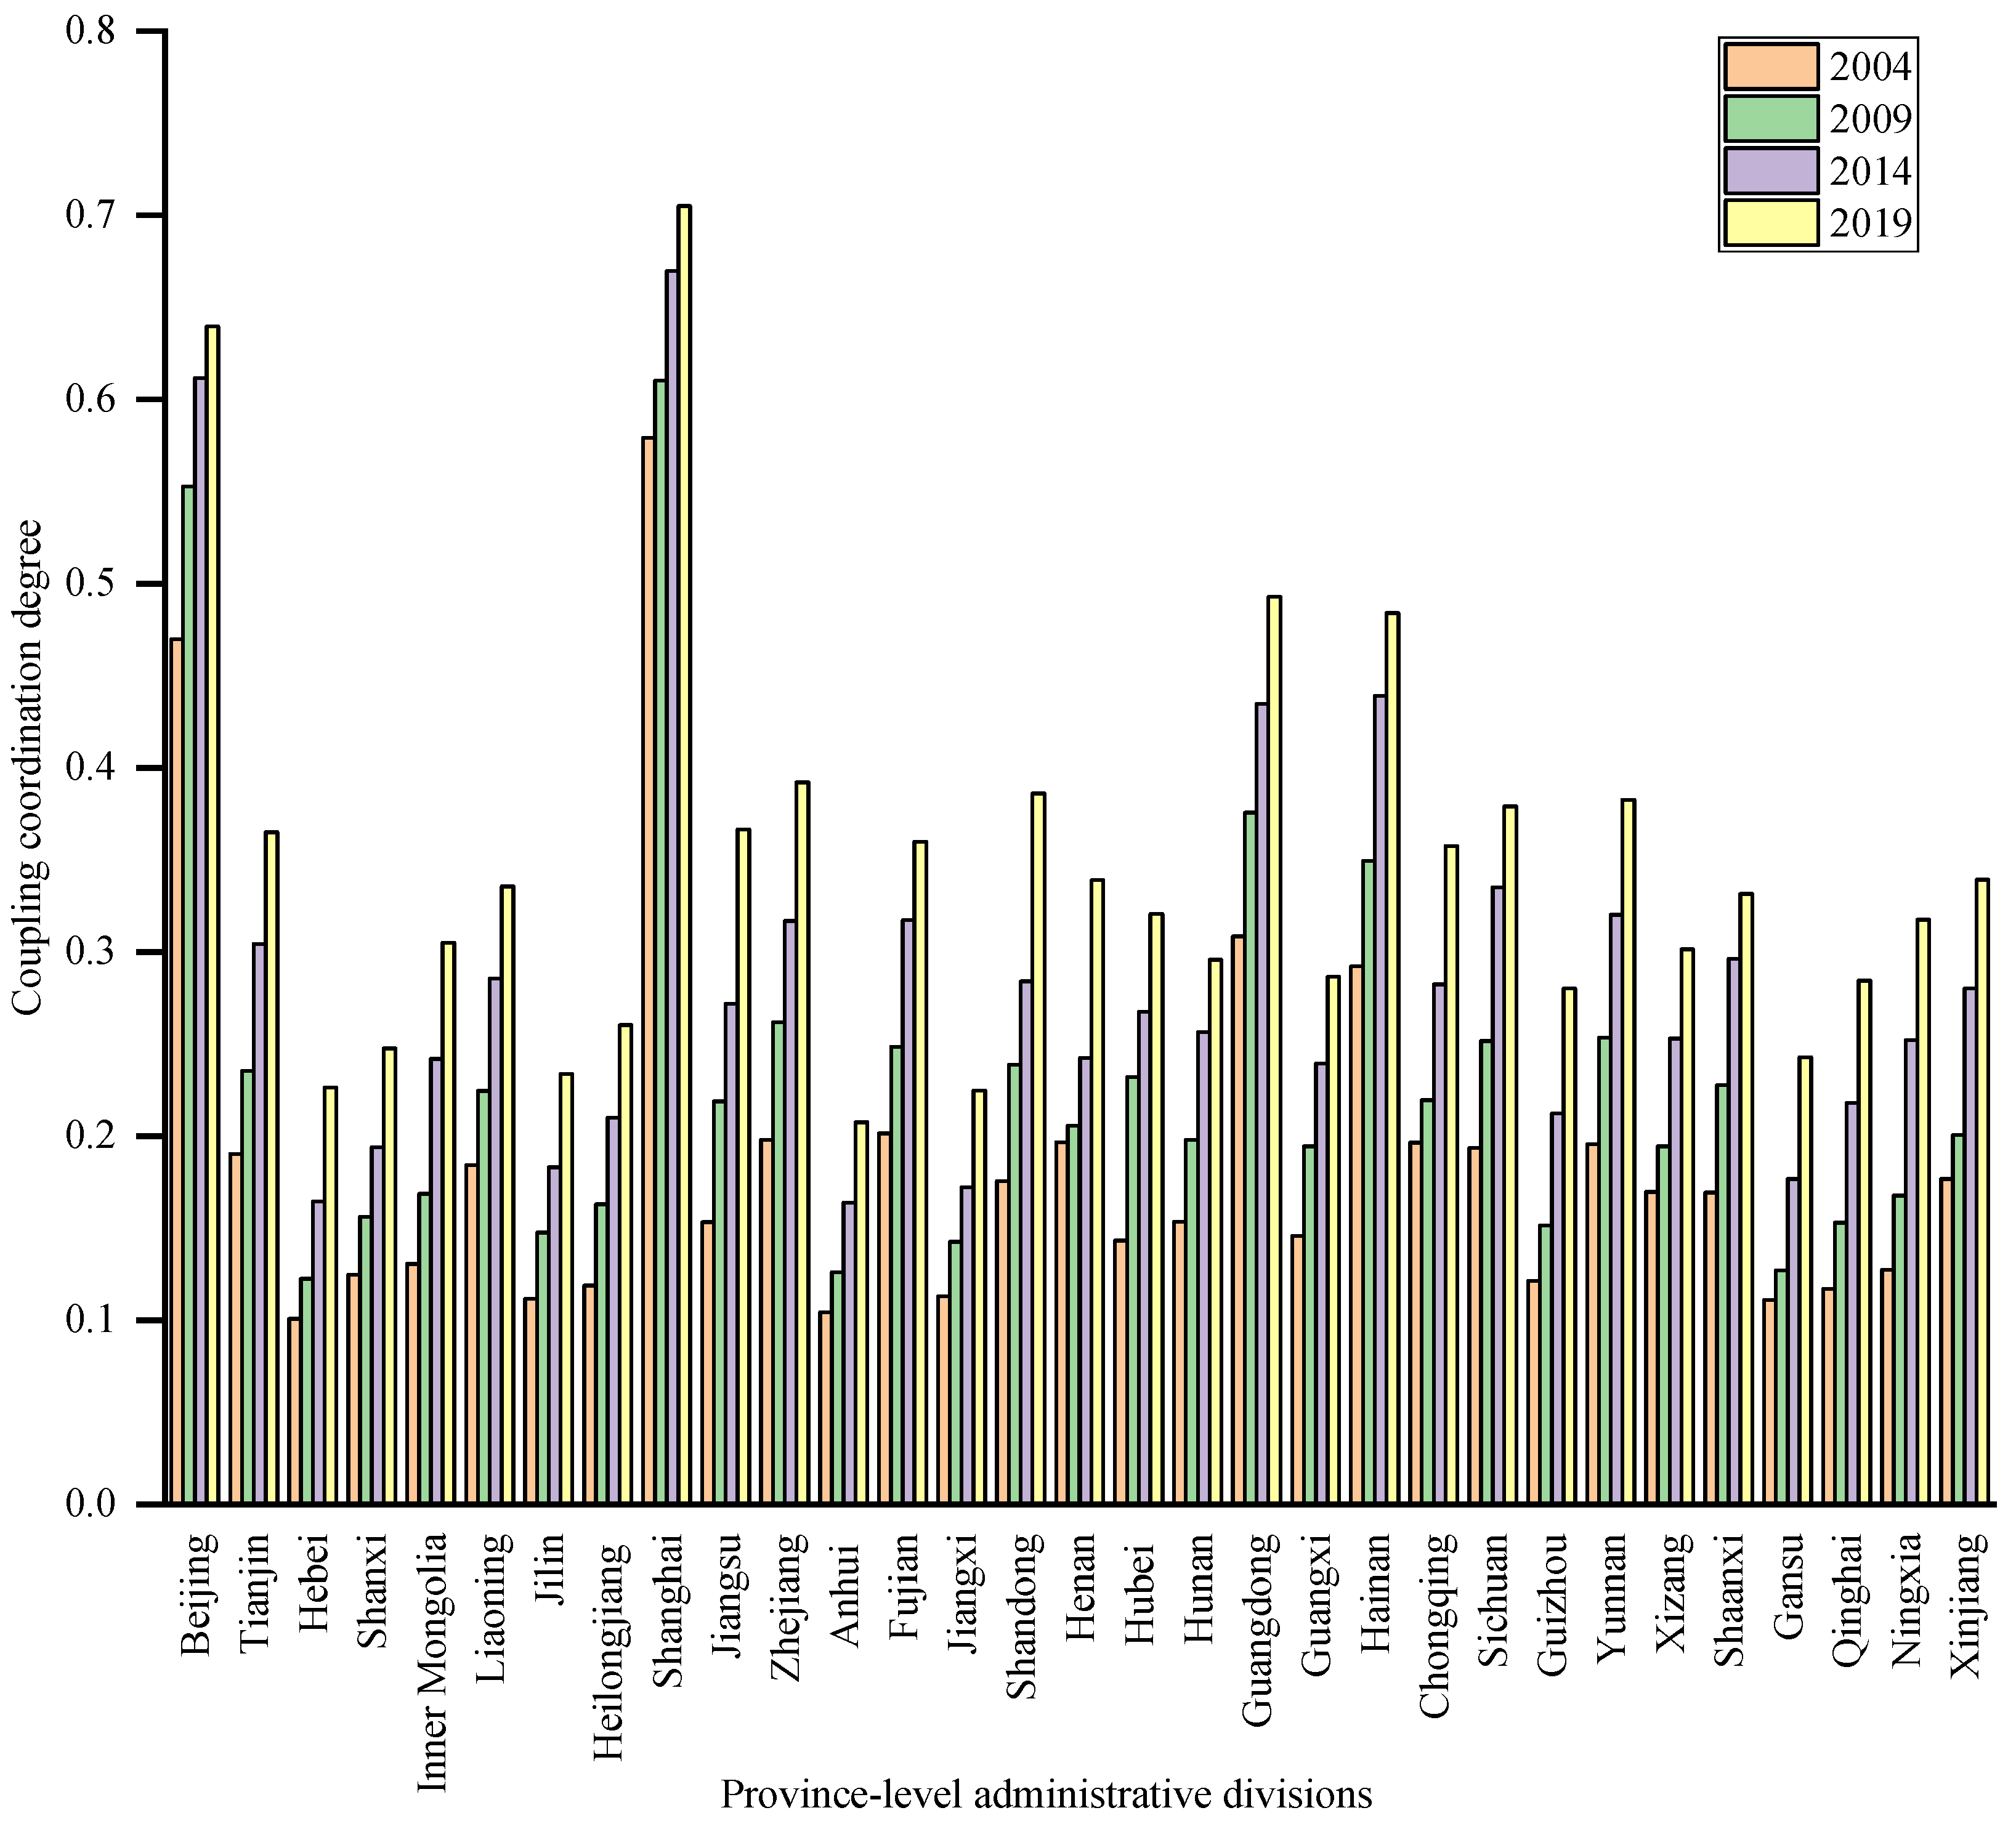
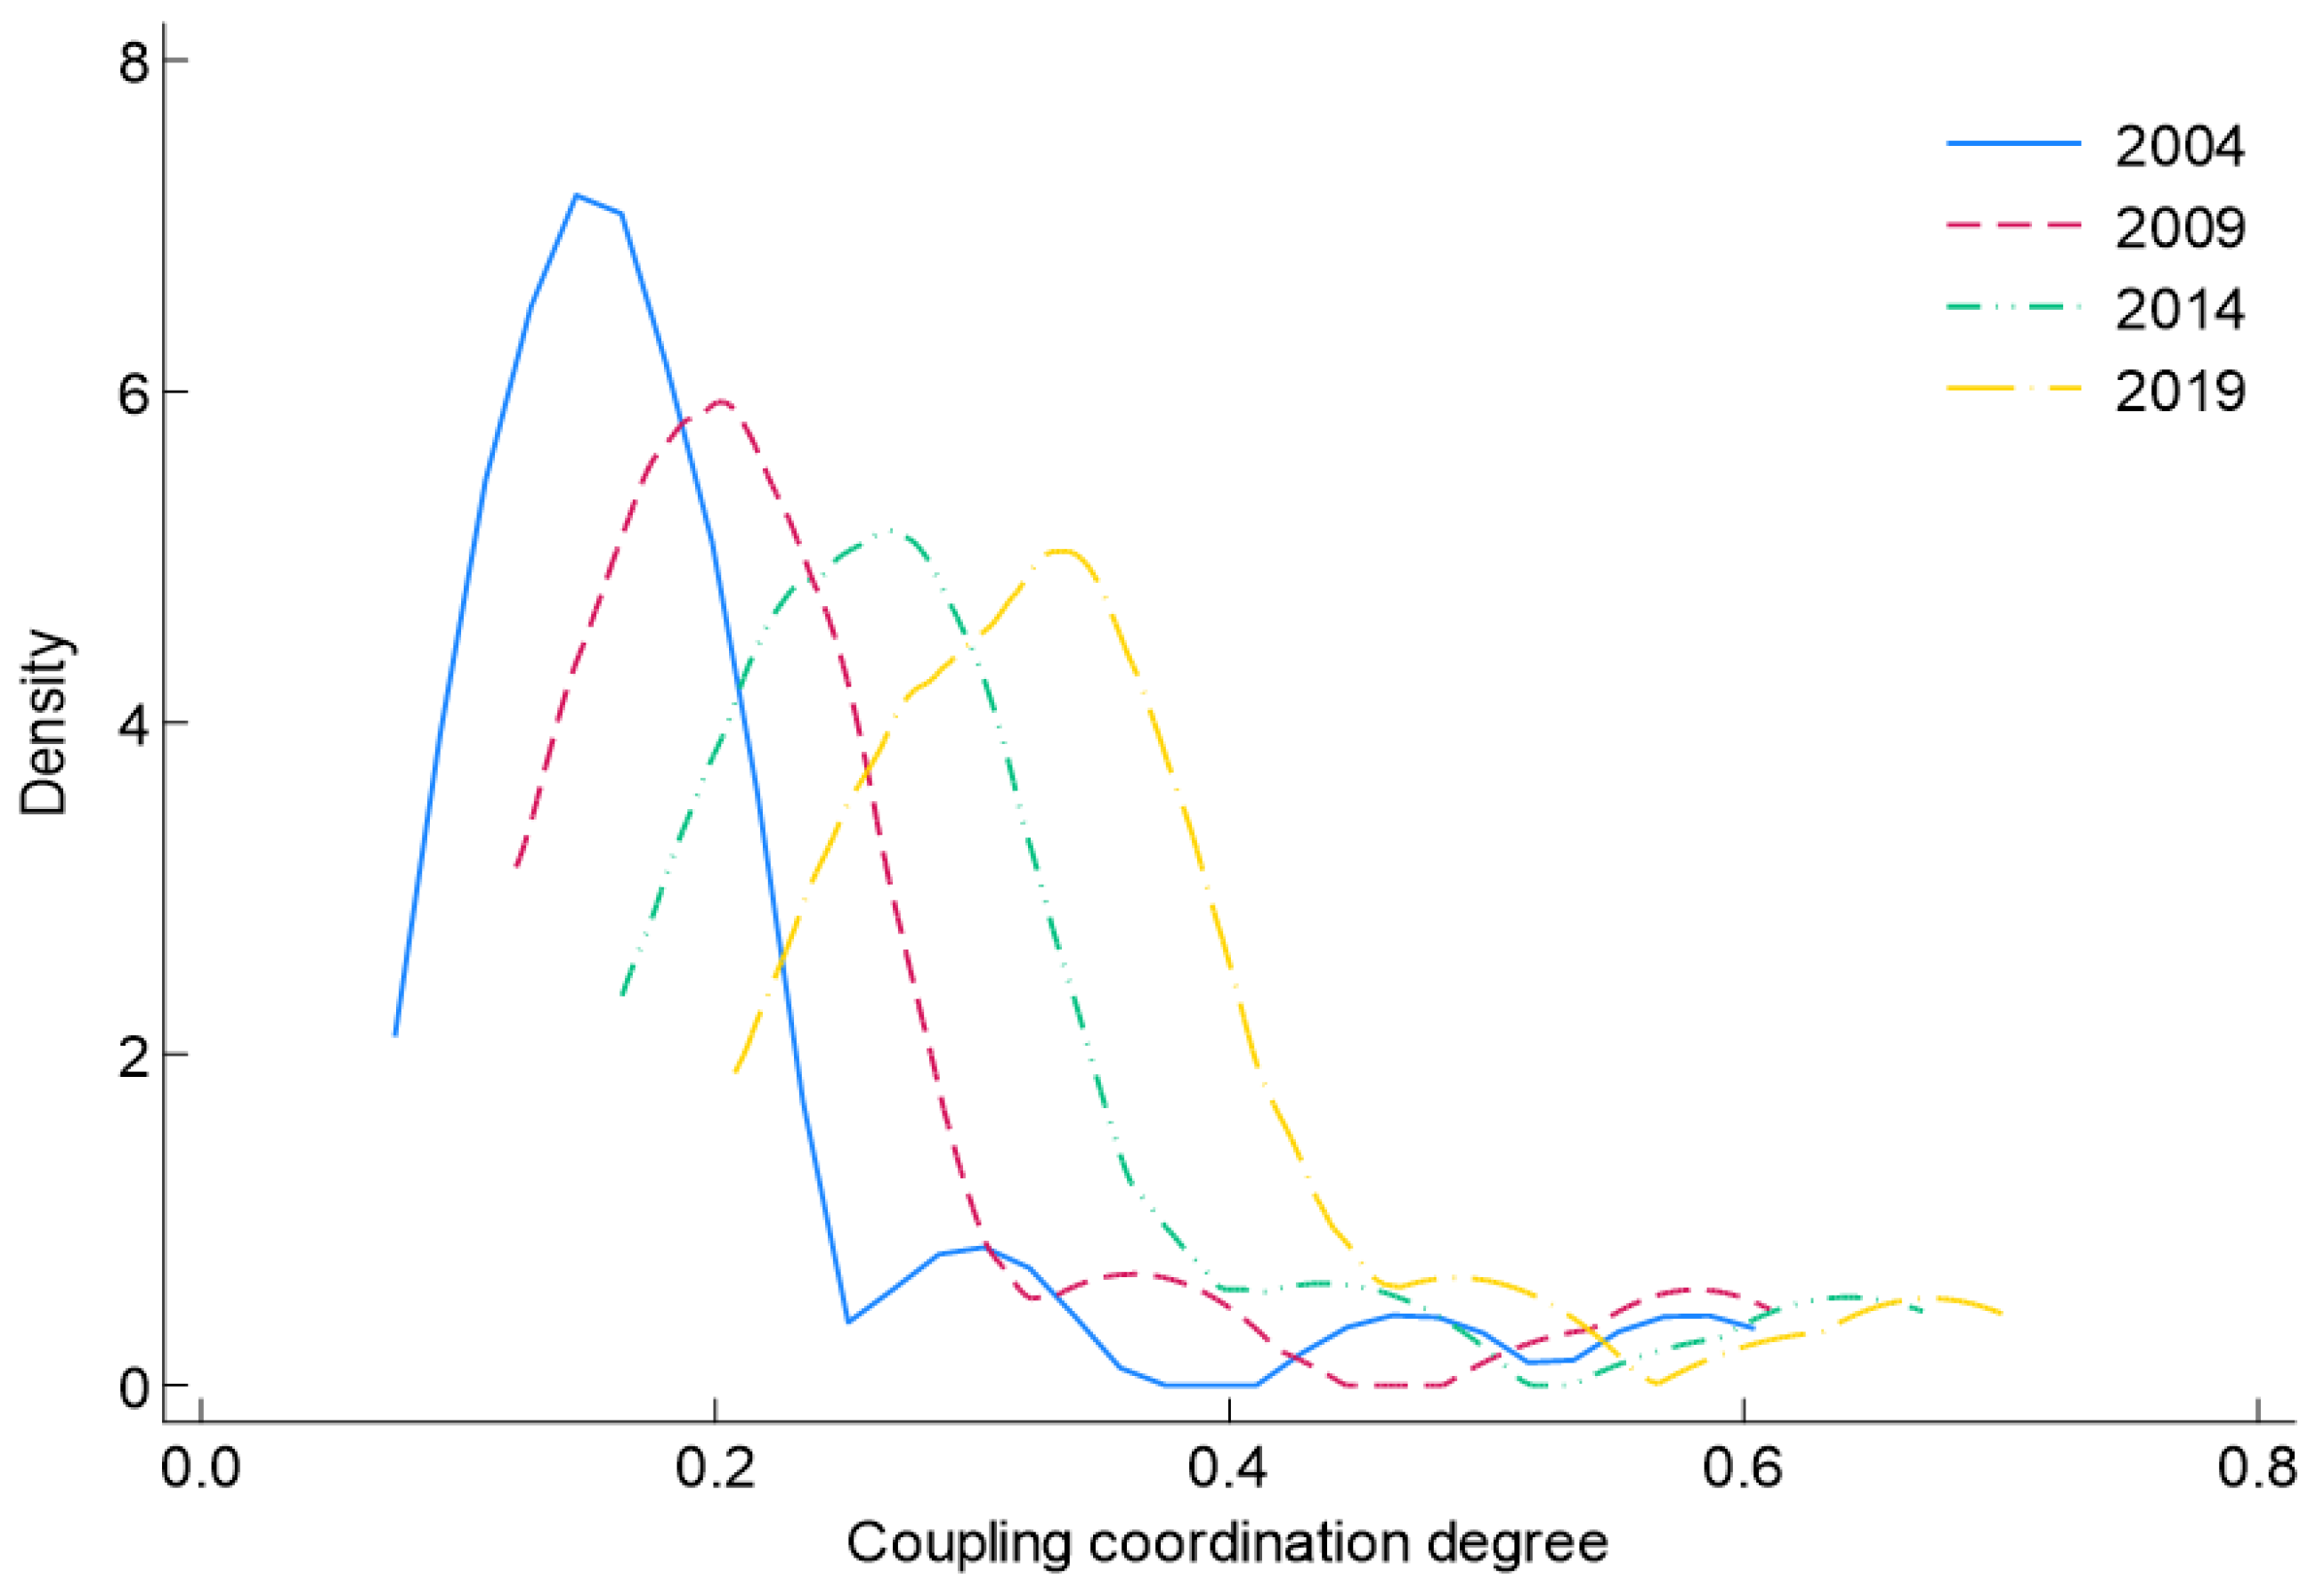
4.1.1. Time Characteristics Analysis of Supply–Demand Coupling Coordination Degree of Civil Aviation Passenger Transport

Taking 2004, 2009, 2014 and 2019 as representative years, the coupling coordination degree of civil aviation passenger transport supply–demand in 31 province-level administrative divisions (excluding Hong Kong, Macao, and Taiwan) in China is shown in Figure 3. In 2004, Shanghai, Beijing, Guangdong, Hainan and Fujian ranked as the top five in terms of the provincial coupling coordination degree. The supply–demand coupling coordination of the above province-level administrative divisions was relatively good, and the matching relationship between the supply subsystem and the demand subsystem was relatively appropriate. The last five were Jiangxi, Jilin, Gansu, Anhui and Hebei. The matching relationship between the supply and demand of civil aviation passenger transport in the above province-level administrative divisions was relatively imbalanced. The lag of one party or the advanced development of the other party led to the incomplete release of the interaction effect between the two. In 2019, Shanghai, Beijing, Guangdong, Hainan and Zhejiang ranked as the top five in terms of the coupling coordination degree of provincial supply–demand while Gansu, Jilin, Hebei, Jiangxi and Anhui ranked as the bottom five. The top province-level administrative divisions have superior natural conditions, developed economies, perfect transportation networks, rich tourism resources and strong residential consumption ability. The province-level administrative divisions ranked in the bottom have poor natural conditions, backward economic foundations, weak traffic accessibility and insufficient consumer potential. The reason may be that the supply and demand coupling level of civil aviation passenger transport is affected by regional economic development.
Taking 2004, 2009, 2014 and 2019 as representative years, the kernel density map is drawn in Figure 4, based on the coupling coordination degree of civil aviation passenger transport supply and demand in 31 province-level administrative divisions (excluding Hong Kong, Macao, and Taiwan) in China. From the perspective of the time dimension, the kernel density curve of the coupling coordination degree of civil aviation passenger supply and demand moves to the right, indicating that the coupling coordination level of civil aviation passenger supply and demand is constantly improving. The shape of the nuclear density curve gradually becomes flat and there is a right tail, indicating that there are differences in the coupling coordination degree between province-level administrative divisions during the investigation period.

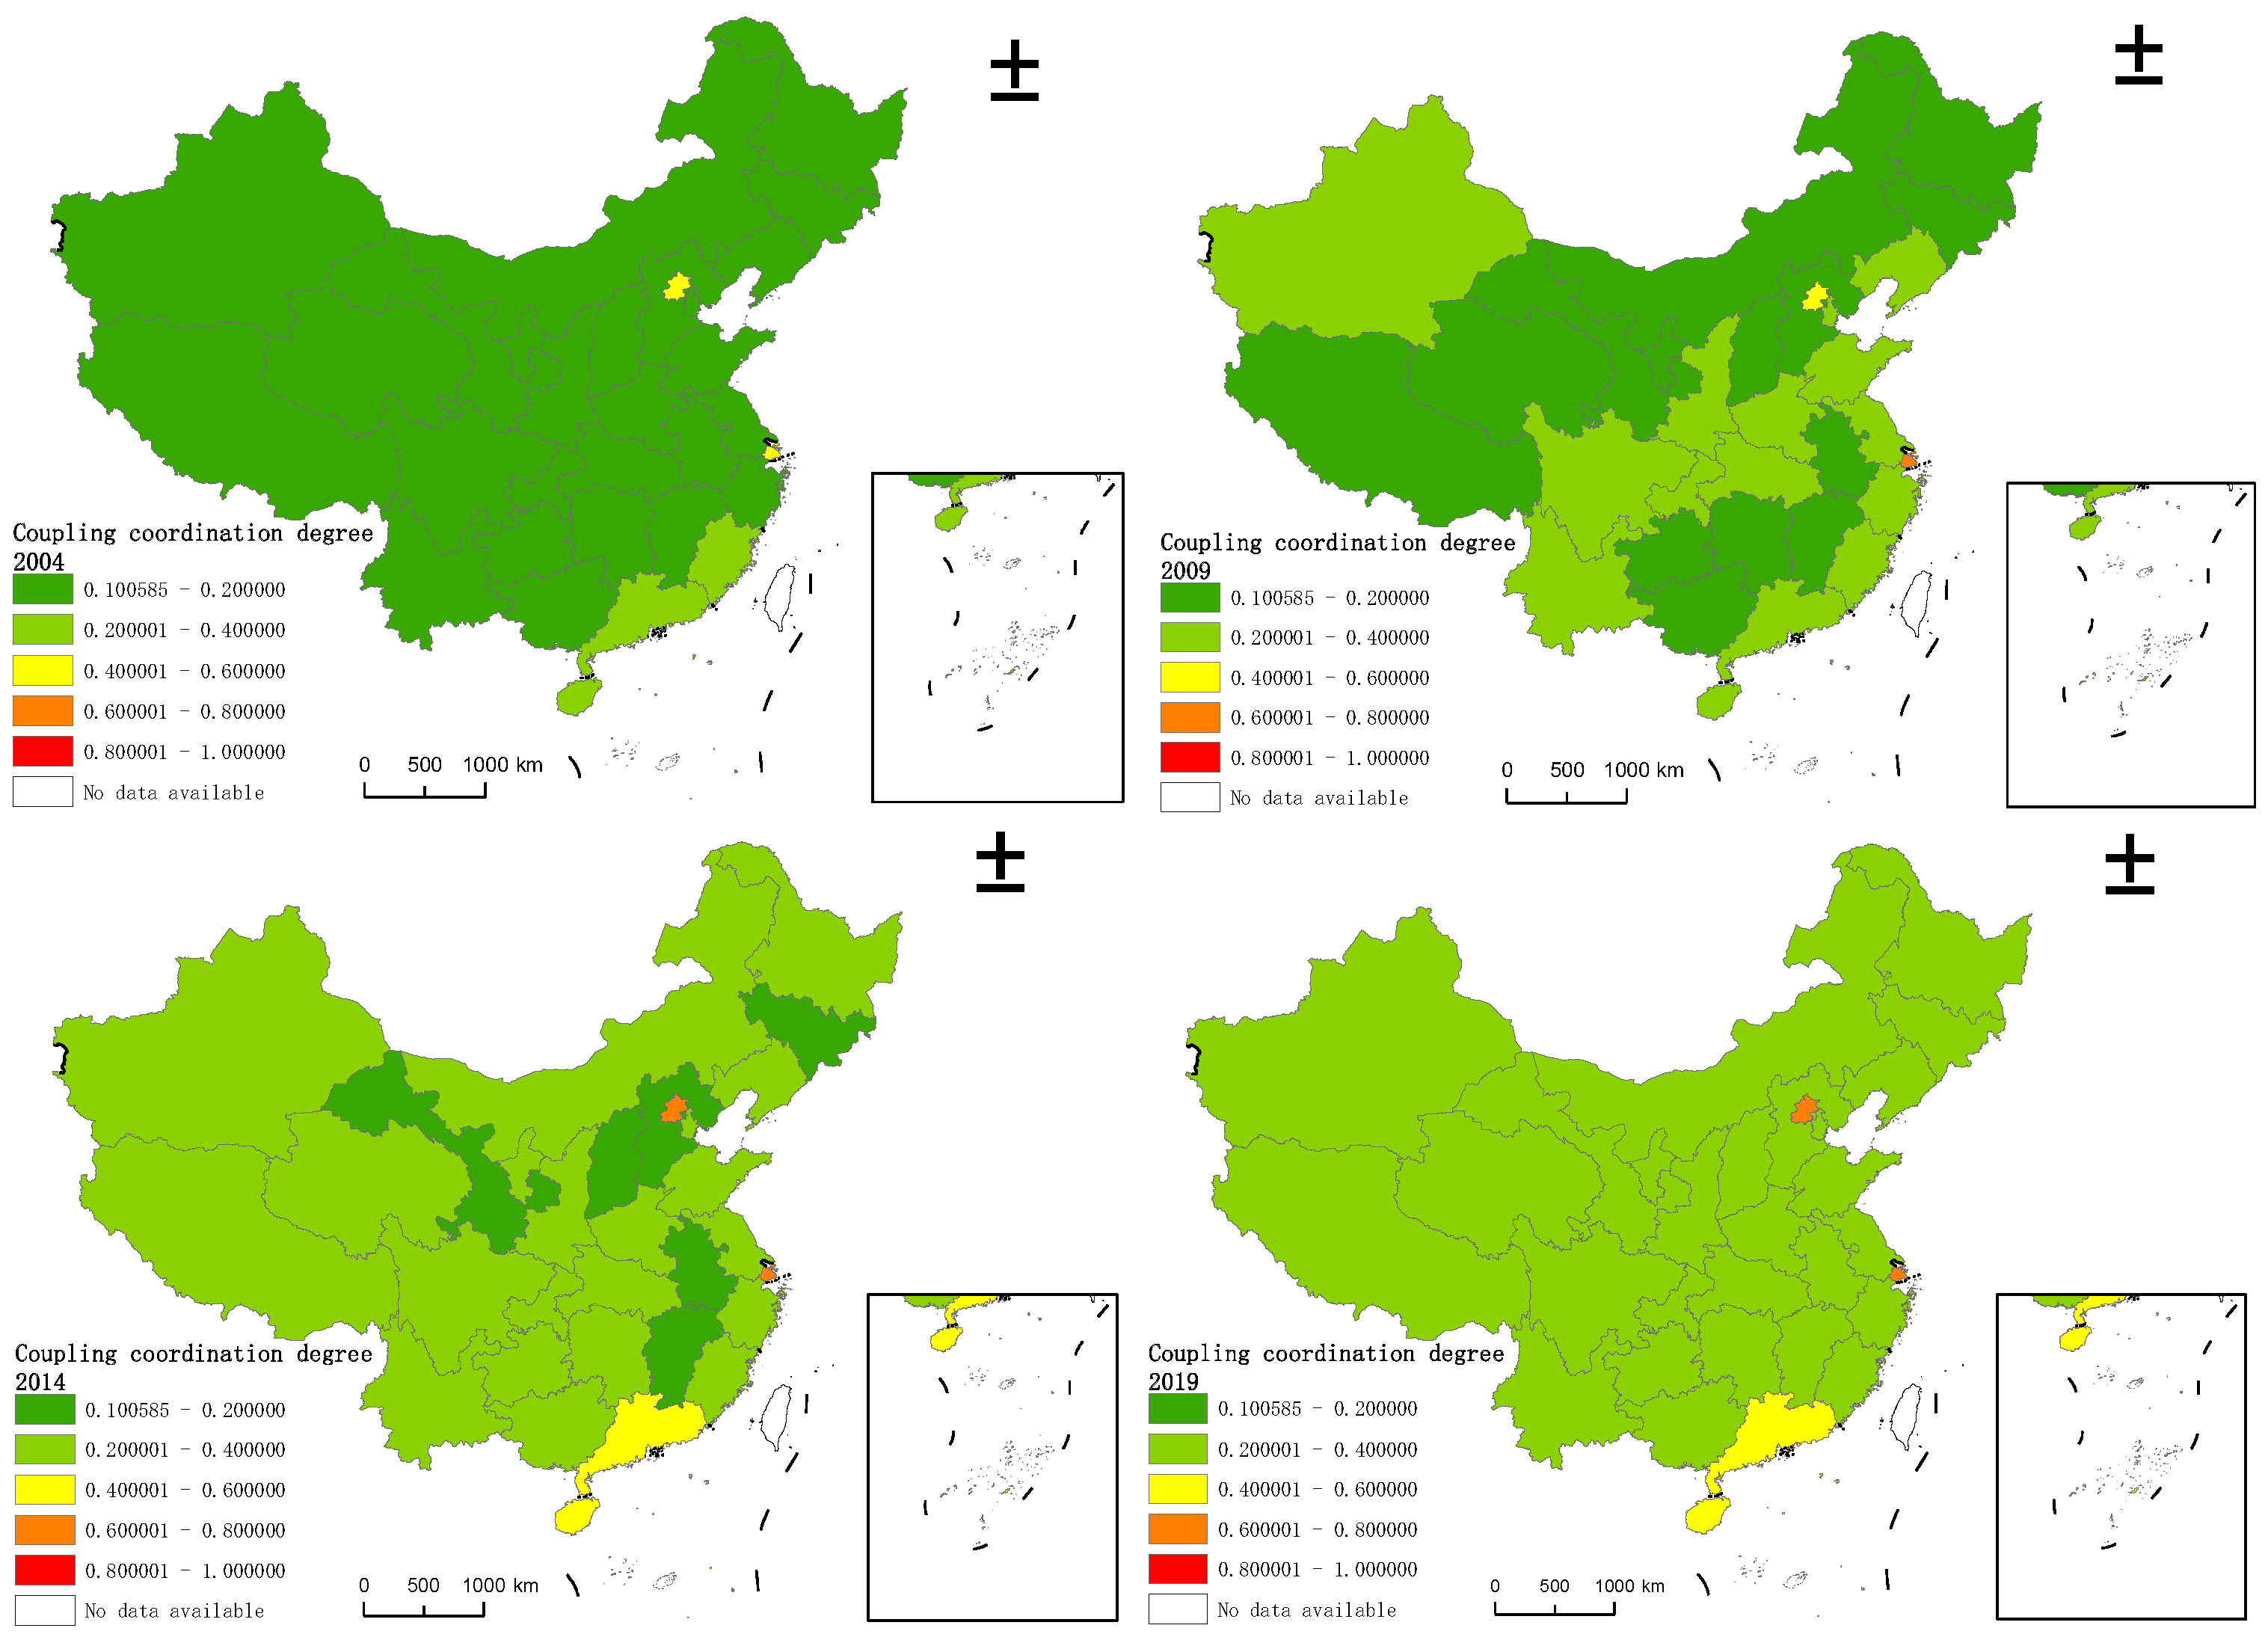
4.1.2. Analysis of Spatial Characteristics of Supply–Demand Coupling Coordination Degree of Civil Aviation Passenger Transport

This study uses ArcGIS 10.8 to draw a spatial variation of supply–demand coupling coordination degree of civil aviation passenger transport in 31 province-level administrative divisions (excluding Hong Kong, Macao, and Taiwan) in China in 2004, 2009, 2014 and 2019 (Figure 5) and calculates the proportion of supply–demand coupling coordination level of civil aviation passenger transport in 2004, 2009, 2014 and 2019 (Figure 6). From 2004 to 2019, the coupling coordination degree of supply–demand of civil aviation passenger transport in various province-level administrative divisions increased year by year, but there was a large spatial heterogeneity. In 2004, the coupling coordination level of provincial civil aviation supply and demand was not extreme coordination. Only Shanghai and Beijing were in moderate coordination. Guangdong, Hainan and Fujian were in low coordination. A total of 83.97% of the province-level administrative divisions were extreme incoordination, which was the main type of coupling coordination level in this period. In 2009, Shanghai was in high coordination, Beijing was in moderate coordination and Guangdong, Hainan, Zhejiang, Yunnan, Sichuan, Fujian, Shandong, Tianjin, Hubei, Shaanxi, Liaoning, Chongqing, Jiangsu, Henan and Xinjiang were in low coordination. A total of 48.39% of the province-level administrative divisions were in low coordination, which was the main type of coupling coordination degree in this period. The remaining province-level administrative divisions were extreme incoordination. In 2014, Shanghai and Beijing were moderate coordination, Hainan and Guangdong were in the moderate coordination stage and Sichuan, Yunnan, Fujian, Zhejiang, Tianjin, Shaanxi, Liaoning, Shandong, Chongqing, Xinjiang, Jiangsu, Hubei, Hunan, Xizang, Ningxia, Henan, Inner Mongolia, Guangxi, Qinghai, Guizhou and Heilongjiang were in low coordination. The remaining 19.35% of the province-level administrative divisions were in extreme incoordination. In 2019, the coupling coordination degree of supply–demand of provincial civil aviation passenger transport increased significantly. No province-level administrative division was in extreme coordination and all province-level administrative divisions were in the low-level coordination stage and above. From 2004 to 2019, the distribution of highly coordinated, moderately coordinated and low-coordination province-level administrative divisions showed a spatial expansion trend, and the distribution of extremely unbalanced province-level administrative divisions showed a spatial convergence trend. In this process, the provincial civil aviation passenger transport supply–demand coupling coordination degree level was upgraded to the upper level. The coupling and coordination levels of civil aviation passenger transport supply–demand have been improved to varying degrees in different province-level administrative divisions. This is due to China’s large-scale investment and planning in civil aviation infrastructure. The construction of regional airports has improved inter-regional traffic connectivity. The civil aviation industry responds to changes in market demand by optimizing capacity supply and improving service quality. Thus, the level of supply and demand coupling coordination is improved.

4.2. Global Spatial Correlation Test

This study uses the global Moran I index to analyze the coupling and coordination of supply–demand of China’s civil aviation passenger transport. From the numerical size of the Global Moran (Table 3), the Moran index in 2004 was positive and did not pass the 10% significance test. From 2005 to 2008, Moran index showed an upward trend and passed the 10% significance test. There was spatial autocorrelation. Socio-economic, policy-oriented and resource allocation factors strengthened the spatial dependence among province-level administrative divisions. The Moran index of 2009–2016 decreased significantly, failed to passed the 10% significance test and the spatial agglomeration effect was significantly weakened. The main reason was that China accelerated the construction of the central and western regional and western trunk airports, the supply of civil aviation passenger transport tended toward provincial homogenization, which led to the growth of demand, and the imbalance of the coordinated development of supply–demand among province-level administrative divisions was weakening. From 2017 to 2019, the Moran’s index increased, and through the 10% significance test, there was a trend of spatial positive correlation. The main reason was the improvement of infrastructure.

4.3. Influencing Factors of Coupling Coordination Degree

The supply and demand of civil aviation passenger transport is a process of multi-dimensional interaction between endogenous forces and exogenous forces, market forces and government forces. In this study, the coupling coordination degree is taken as the explained variable. Referring to the high-frequency indicators in the relevant research results, this study selects the level of economic development, population agglomeration, urbanization level, government support, tourism development level, openness, industrial structure, traffic location conditions, etc. as explanatory variables. The influencing factors of the supply–demand coupling coordination degree of China’s civil aviation passenger transport are discussed. (1) Economic development. The higher the level of economic development, the greater the demand for air transport modes as well as provision of capital support for optimizing the allocation of public resources for civil aviation passenger transport supply, which is the material guarantee for the coordinated development of coupling. Specific indicators are expressed as per capita GDP. (2) Population agglomeration. Population agglomeration has an impact on the demand for infrastructure and also drives the vitality of regional demand through agglomeration to enhance the level of demand. The specific indicators are expressed by population density. (3) Urbanization level. The process of urbanization is accompanied by the improvement of urban infrastructure which is attractive to capital and scientific and technological talents and stimulates the improvement of urban production efficiency and the growth of consumer demand. The specific indicators are expressed by urbanization rate. (4) Government regulation. Government investment and infrastructure support have improved the supply capacity of civil aviation passenger transport and optimized the market environment to stimulate the potential demand for passenger transport. Specific indicators are expressed as per capita fiscal expenditure. (5) Level of tourism development. The rise in tourist numbers directly promotes the growth of civil aviation passenger demand. The specific indicators are expressed by the ratio of the number of domestic tourists to the resident population. (6) Opening to the outside world. The improvement of openness can promote the upgrading of regional industrial structure and create a substantial number of jobs to promote population agglomeration. The specific indicators are expressed by the ratio of total import and export volume to regional GDP. (7) Industrial structure. The industrial structure represents the existing condition of industrial resources and the surrounding industrial environment. Adjusting the industrial structure can improve the stability of the urban economy and create conditions for guiding population agglomeration and household consumption. The specific indicators are represented by the proportion of the added value of the tertiary industry in GDP. (8) Traffic location conditions. Railway and aviation are both important components of the regional transportation system, and the construction of railway facilities will affect the air traffic volume. The specific indicators are represented by railway density.
Based on the above influencing factors, a two-way fixed-effect model is established. The results of the regression analysis are presented in (Table 4). The regression coefficient for per capita GDP is positive and has passed the significance test at the 1% level, indicating that the level of economic development has a significant impact on fostering the coordinated development of coupling. The regression coefficient of urbanization rate is positive and has passed the significance test at the 5% level, denoting that an increase in the level of urbanization contributes positively to the enhancement of coupling coordination. The regression coefficient of the total import and export volume and the proportion of GDP is positive and has passed the significance level test at the 5% level, which denotes that opening up can promote the improvement of coupling coordination. The regression coefficients of population density, per capita fiscal expenditure, the proportion of added value of the tertiary industry in GDP and railway density are positive and do not pass the 5 % significance level. This shows that population agglomeration, government regulation, industrial structure and traffic location conditions have no significant impact on coupling coordination. The regression coefficient for the ratio of domestic tourists to the resident population is negative and does not meet the criteria for significance. This suggests that the influence of the level of tourism development on coupling coordination is not pronounced.

5. Conclusions

This study measures the supply and demand levels of civil aviation passenger transport. It assesses the degree of coupling coordination between these two elements and examines the factors that influence this degree of coupling coordination. The key findings of the study are summarized as follows:
(1)
China’s civil aviation passenger supply, demand and supply–demand coupling coordination degree show a steady upward trend. From 2004 to 2019, the average annual growth rates of China’s civil aviation passenger supply, demand and their coupling and coordination were 4.97%, 8.66% and 4.19%. The average annual growth rate of demand exceeds that of supply and coupling coordination. The overall coupling and coordination relationship between supply and demand is on the rise, indicating that the relationship between supply and demand is gradually optimizing.
(2)
In terms of time series, in 2000, the top five province-level administrative divisions in the supply–demand coupling coordination degree were Shanghai, Beijing, Guangdong, Hainan and Fujian, and the last five were Jiangxi, Jilin, Gansu, Anhui and Hebei. In 2019, the top five province-level administrative divisions in the supply–demand coupling coordination degree were Shanghai, Beijing, Guangdong, Hainan and Zhejiang, and the last five province-level administrative divisions were Gansu, Jilin, Hebei, Jiangxi and Anhui. Shanghai, ranked first, is 3.4 times that of Anhui, ranked last. There are differences in the degree of coupling coordination among province-level administrative divisions in China. The province-level administrative divisions with high coordination degree are mostly those with superior natural conditions, developed economies and perfect transportation infrastructure. The province-level administrative divisions with low coordination degree are mostly those with poor natural conditions, low levels of economic development and poor transportation infrastructure. This is closely related to natural conditions, socio-economic foundation and regional development strategies. Balanced development should be promoted through policy guidance and regional development strategies.
(3)
In terms of spatial variation, the coupling coordination degree of each province-level administrative division exhibits a consistent trend, showing a yearly increase. In 2004, 83.97% of the provincial coupling coordination degree was in extreme imbalance. In 2009, 48.39% of the province-level administrative divisions were in low coordination. In 2014, 67.74% of the province-level administrative divisions were in low coordination. In 2019, no province-level administrative division was in extreme imbalance, and all province-level administrative divisions were in low-level coordination and above. From 2004 to 2019, the province-level administrative divisions with high coordination, moderate coordination and low coordination showed a trend of spatial expansion, and the province-level administrative divisions with extreme imbalance showed a trend of spatial convergence. The supply–demand coupling coordination degree in all province-level administrative divisions has been raised to the upper level. Extreme coordination has not yet appeared. On the whole, the coupling and coordination level of China’s civil aviation passenger transport supply and demand needs to be improved.
(4)
The development of economic level, the improvement of urbanization rate and the enhancement of opening degree can actively promote the coupling and coordinated development of civil aviation passenger transport supply–demand. These factors are the key driving factors to strengthen the synergy between supply and demand of civil aviation passenger transport. These factors work together in the civil aviation passenger transport market. By improving residents’ income, increasing consumption capacity and expanding the international market, the growth of air transport demand has been promoted, and the quality and capacity of air transport services have been improved. The benign interaction between supply and demand is realized, and the coupling and coordinated development of civil aviation passenger transport supply and demand is promoted.
To enhance the coordinated growth of China’s civil aviation passenger supply and demand, the following policy recommendations are proposed: strengthen the construction of international hubs, improve airport layout planning and build a 1 h aviation service circle to enhance supply capacity; increase public transport routes and frequency, optimize road network and traffic management, improve the quality of public transport services and encourage the use of public transport to improve public transport to enhance airport accessibility; improve airport service capacity and efficiency to improve effective supply; improve service quality to meet passengers’ quality, diversified and personalized air travel needs; encourage enterprise innovation to launch more products and services that meet market demand; use advanced technologies such as artificial intelligence and big data to improve passenger travel experience; promote the deep integration of aviation and tourism and attract more passengers to choose air travel; find the balance between competition and cooperation between civil aviation and high-speed rail, promote the coordinated development of the two through policy guidance, technological innovation and service optimization, improve the overall efficiency of the transportation system and provide passengers with more convenient and efficient travel choices.

Author Contributions

Conceptualization, Y.Y., M.H., J.Y. and W.W.; methodology, Y.Y., M.H., J.Y. and W.W.; software, Y.Y., M.H., J.Y. and W.W.; validation, Y.Y., M.H., J.Y. and W.W.; formal analysis, Y.Y., M.H., J.Y. and W.W.; investigation, Y.Y., M.H., J.Y. and W.W.; resources, Y.Y., M.H., J.Y. and W.W.; data curation, Y.Y., M.H., J.Y. and W.W.; writing—original draft preparation, Y.Y., M.H., J.Y. and W.W.; writing—review and editing, Y.Y., M.H., J.Y. and W.W.; visualization, Y.Y., M.H., J.Y. and W.W.; supervision, Y.Y., M.H., J.Y. and W.W. All authors have read and agreed to the published version of the manuscript.

Funding

This research was supported by the National Natural Science Foundation of China (No. 52002178) and Natural Science Foundation of Jiangsu Province (No. BK20190416).

Institutional Review Board Statement

Not applicable.

Informed Consent Statement

Not applicable.

Data Availability Statement

The data used to support the findings of this study are available from the corresponding author on request.

Conflicts of Interest

The authors declare that they have no conflicts of interest.

References

  1. Shao, G. Research on the Evaluation and Promotion of the Competitiveness of Hub Airport. Master’s Thesis, Wuhan University of Technology, Wuhan, China, 2011. [Google Scholar]
  2. Pashkevich, A.; Nommik, A.; Antov, D. Competitiveness Analysis of Regional Airports Based on Location Planning Models: The Case Study of Finland. In Proceedings of the 21st International Scientific Conference on Transport Means (Transport Means), Juodkrante, Lithuania, 20–22 September 2017; Kaunas University Technology Press: Kaunas, Lithuania, 2017; pp. 754–761. [Google Scholar]
  3. Zhang, Y.; Jin, X.; Li, M.; Liu, R.T.; Jing, Y. Evaluating civil aviation airport competitiveness in the Yangtze River Economic Belt of China: A lens of spatial-temporal evolution. Front. Environ. Sci. 2022, 10, 14. [Google Scholar] [CrossRef]
  4. Zhang, X.; Du, Q.; Xu, Z.L.; Tao, H.Q. Construction of evaluation index system of regional multi-airport coordinated development in the Yangtze River Delta region. In Proceedings of the 7th International Conference on Computing and Convergence Technology (ICCCT), Seoul, Republic of Korea, 3–5 December 2012; IEEE: Piscataway, NJ, USA, 2012; pp. 338–341. [Google Scholar]
  5. Zhu, C.; Gu, P.; Xu, Z. Domestic airport competitiveness evaluation based on entropy weight TOPSIS method. J. Beijing Jiaotong Univ. 2019, 43, 124–130. [Google Scholar]
  6. Cui, Q.; Kuang, H.-B.; Wu, C.-Y.; Li, Y. Dynamic formation mechanism of airport competitiveness: The case of China. Transp. Res. A Policy Pract. 2013, 47, 10–18. [Google Scholar] [CrossRef]
  7. Lei, X.; Haibin, Y.; Xu, L.; Qing, Z. System Dynamics Modeling and Simulation Analysis on Airport Competitiveness, AADNIC-ABMECR 2021. In Proceedings of the 3rd Africa-Asia Dialogue Network (AADN) International Conference on Advances in Business Management and Electronic Commerce Research, Ganzhou, China, 26–28 November 2021; pp. 49–58. [Google Scholar]
  8. Huynh, T.M.; Kim, G.; Ha, H.-K. Comparative analysis of efficiency for major Southeast Asia airports: A two-stage approach. J. Air Transp. Manag. 2020, 89, 9. [Google Scholar] [CrossRef]
  9. Patrícia Belfiore, F. Critical Success Factors to Evaluate the Efficiency of Brazilian Airports; FAPESP: São Paulo, Brazil, 2017. [Google Scholar]
  10. Fu, Z.; Shao, Y.; Xiao, J.; Wang, S. Operational Efficiency of Major Airports in China Based on Dual-Oriented DEA Model. J. Transp. Syst. Eng. Inf. Technol. 2013, 13, 193–199. [Google Scholar]
  11. Cifuentes-Faura, J.; Faura-Martínez, U. Measuring Spanish airport performance: A bootstrap data envelopment analysis of efficiency. Util. Policy 2023, 80, 9. [Google Scholar] [CrossRef]
  12. Miao, Y.; Wang, C.; Wu, Y.; Yuan, Y.; Xu, H. The Spatio-Temporal Evolution Characteristics of Chinas Civil Airports Structure and Its Optimization. Econ. Geogr. 2017, 37, 37–45. [Google Scholar]
  13. Jia, P.; Hu, Y.; Kuang, H. Evolution analysis and driving factors of spatial distribution pattern of airport traffic in China. Syst. Eng. Theory Pract. 2019, 39, 1198–1211. [Google Scholar]
  14. Ma, S.; Zhao, Z.; Zhao, Z.; Bai, B. Evolution and influencing factors of air passenger transport in China from 2000 to 2019. Sci. Geogr. Sin. 2023, 43, 1011–1021. [Google Scholar]
  15. Yu, S.; Miao, Y.; Wang, C.; Wang, J.; Hu, R.; Chen, P.A. The Location Entropy of China’s Civil Aviation Passenger Transport: Spatiotemporal Characteristics and Influencing Factors. Econ. Geogr. 2023, 43, 35–43. [Google Scholar]
  16. Dziedzic, M.; Njoya, E.T.; Warnock-Smith, D.; Hubbard, N. Determinants of air traffic volumes and structure at small European airports. Res. Transp. Econ. 2020, 79, 13. [Google Scholar] [CrossRef]
  17. Marazzo, M.; Scherre, R.; Fernandes, E. Air transport demand and economic growth in Brazil: A time series analysis. Transp. Res. E Logist. Transp. Rev. 2010, 46, 261–269. [Google Scholar] [CrossRef]
  18. Profillidis, V.; Botzoris, G. Air passenger transport and economic activity. J. Air Transp. Manag. 2015, 49, 23–27. [Google Scholar] [CrossRef]
  19. You, K.; Xiong, J. Airline Passenger Numbers Impact Analysis based on the Income Elasticity. In Proceedings of the 2nd International Conference on Computer Engineering, Information Science and Internet Technology (CII), Sanya, China, 11–12 November 2017; Destech Publications, Inc: Lancaster, PA, USA, 2017; pp. 560–565. [Google Scholar]
  20. Xu, W.H. Influencing Factors and Trend Prediction of Passenger Throughput of Shanghai Civil Aviation Airport. Master’s Thesis, Shanghai Academy of Social Sciences, Shanghai, China, 2019. [Google Scholar]
  21. Wu, X.; Man, S. Air transportation in China: Temporal and spatial evolution and development forecasts. J. Geogr. Sci. 2018, 28, 1485–1499. [Google Scholar] [CrossRef]
  22. Hoyos, D.T.; Olariaga, O.D. Behavior of Air Passenger Demand in a Liberalized Market. Transp. Telecommun. J. 2020, 21, 1–14. [Google Scholar] [CrossRef]
  23. İnan, T.T.; Gökmen, R. The determination of the factors affecting air transportation passenger numbers. Int. J. Aviat. Aeronaut. Aerosp. 2021, 8, 4. [Google Scholar]
  24. Prentice, C.; Kadan, M. The role of airport service quality in airport and destination choice. J. Retail. Consum. Serv. 2019, 47, 40–48. [Google Scholar] [CrossRef]
  25. Liao, W.; Cao, X.; Li, T.; Gao, X. The Influence of Airport Service Quality on Air Travel Choices: A Case Study of the Guangdong-Hong Kong-Macao Greater Bay Area. Trop. Geogr. 2024, 44, 195–211. [Google Scholar]
  26. Wang, J.E.; Hu, H. Competition and cooperation of high-speed rail and air transport in China: A perspective from spatial service market view. Acta Geogr. Sin. 2013, 68, 175–185. [Google Scholar]
  27. Gu, W.; Guo, B.; Zhang, Z.; Lu, H. Civil Aviation Passenger Traffic Forecasting: Application and Comparative Study of the Seasonal Autoregressive Integrated Moving Average Model and Backpropagation Neural Network. Sustainability 2024, 16, 17. [Google Scholar] [CrossRef]
  28. Suryani, E.; Chou, S.-Y.; Chen, C.-H. Air passenger demand forecasting and passenger terminal capacity expansion: A system dynamics framework. Expert Syst. Appl. 2010, 37, 2324–2339. [Google Scholar] [CrossRef]
  29. Zhao, Z.-X.; Wang, H.-X.; Qiu, Y.-Q.; Lu, X.-L. The Application of a Time Series Forecasting Model in Air Passenger Volume Prediction Research. In Proceedings of the 2nd International Conference on Modeling, Simulation and Optimization Technologies and Applications (MSOTA), Xiamen, China, 25–26 November 2018; Destech Publications, Inc.: Lancaster, PA, USA, 2018; pp. 43–47. [Google Scholar]
  30. Jichao, L.; Xiaolei, C.; Xiaoyong, L. Aviation Business Volume Forecast of Xianyang International Airport Based on Multiple Prediction Models. IOP Conf. Ser. Mater. Sci. Eng. 2019, 688, 022028. [Google Scholar]
  31. Cheng, L. Combined forecasting of civil aviation passenger volume based on ARIMA-REGRESSION. Int. J. Syst. Assur. Eng. Manag. 2019, 10, 945–952. [Google Scholar]
  32. Hu, Y.-C. Air passenger flow forecasting using nonadditive forecast combination with grey prediction. J. Air Transp. Manag. 2023, 112, 12. [Google Scholar] [CrossRef]
  33. Hen, Y.; Li, Y. Comparison of Two Grey Models’ Applicability to the Prediction of Passenger Flow in Sanya Airport, Data Science. In Proceedings of the 9th International Conference of Pioneering Computer Scientists, Engineers and Educators, ICPCSEE 2023, Harbin, China, 22–24 September 2023; pp. 225–236. [Google Scholar]
  34. Anupam, A.; Lawal, I.A. Forecasting air passenger travel: A case study of Norwegian aviation industry. J. Forecast. 2024, 43, 661–672. [Google Scholar] [CrossRef]
  35. Javanmard, M.E.; Tang, Y.; Martínez-Hernández, J.A. Forecasting air transportation demand and its impacts on energy consumption and emission. Appl. Energy 2024, 364, 20. [Google Scholar] [CrossRef]
  36. Liang, X.; Hong, C.; Chen, J.; Wang, Y.; Yang, M. A hybrid forecasting architecture for air passenger demand considering search engine data and spatial effect. J. Air Transp. Manag. 2024, 118, 21. [Google Scholar] [CrossRef]
  37. Zhao, S.X. Research on the Economic Adaptability Theory and Evaluation of Airport Construction Scale. Ph.D. Thesis, Southwest Jiaotong University, Chengdu, China, 2017. [Google Scholar]
  38. Nasution, D.; Mawengkang, H.; Zarlis, F.M. An Analysis Air Traffic Prediction During a Pandemic. In Proceedings of the 2022 4th International Conference on Cybernetics and Intelligent System (ICORIS), Medan, Indonesia, 8–9 October 2022; pp. 1–6. [Google Scholar]
  39. Mehmood, B.; Aleem, M.; Shahzad, N. Air-Transport and Macroeconomic Performance in Asian Countries: An Analysis. Pak. J. Appl. Econ. 2015, 25, 179–192. [Google Scholar]
  40. Jiao’e, W.; Han, W.; Jingjuan, J. Measurement of the relationship between China’s air transport industry and tourism development level. Sci. Geogr. Sin. 2016, 36, 1125–1133. [Google Scholar]
  41. Ji, K.W.; Qi, J.B. The coupling coordination degree of China’s aviation and tourism industry and its spatial effect analysis. Res. Financ. Educ. 2020, 33, 10–21. [Google Scholar]
  42. Zhang, W.; Yin, R.; Zhan, Y.; Zhang, X. Interaction between civil aviation transportation and tourism development in the western China. Sci. Geogr. Sin. 2023, 43, 1774–1782. [Google Scholar]
  43. National Bureau of Statistics of China. Statistical Yearbook of China; China Statistics Press: Beijing, China, 2005–2020. [Google Scholar]
  44. Civil Aviation Administration of China. Civil Aviation Airport Production Statistics Bulletin; Civil Aviation Administration of China: Beijing, China, 2004–2019. [Google Scholar]
  45. Civil Aviation Administration of China. Civil Aviation from a Statistical Perspective; Civil Aviation Administration of China: Beijing, China, 2005–2020. [Google Scholar]
  46. Zhang, G.H. China Civil Airport; Volume I and Volume II; China Civil Aviation Press: Beijing, China, 2008. [Google Scholar]
  47. China Academy of Civil Aviation Science and Technology. China Civil Aviation Statistical Data Compilation (1949–2011); China Civil Aviation Publishing House: Beijing, China, 2014. [Google Scholar]
  48. China Civil Airport Encyclopedia. National Airport Information List; Civil Aviation Administration of China: Beijing, China, 2021. [Google Scholar]
  49. Xiong, X.X.; Zhang, X.L.; Guo, W.C.; Zhang, Q.L. Research on spatio-temporal evolution of modern marine cities based on entropy weight TOPSIS method-obstacle degree model-modified coupling coordination degree model. Mar. Sci. Bull. 2024, 43, 784–796. [Google Scholar]
  50. Wang, S.J.; Kong, W.; Ren, L.; Zhi, D.; Dai, B. Misconceptions and corrections of the domestic coupled coordination degree model. Nat. Resour. J. 2021, 36, 793–810. [Google Scholar]
Figure 1. Methodology diagram.
Applsci 15 01362 g001
Figure 2. Time series changes in supply–demand coupling coordination degree and subsystem evaluation index of China’s civil aviation passenger transport from 2004 to 2019.
Applsci 15 01362 g002
Figure 3. Coupling coordination degree of supply–demand of civil aviation passenger transport in 31 province-level administrative divisions (excluding Hong Kong, Macao, and Taiwan) in China in 2004, 2009, 2014 and 2019.
Applsci 15 01362 g003
Figure 4. Evolution curve of supply and demand coupling coordination degree of civil aviation passenger transport.
Applsci 15 01362 g004
Figure 5. Spatial variation of supply–demand coupling coordination degree of civil aviation passenger transport in 31 province-level administrative divisions (excluding Hong Kong, Macao, and Taiwan) in China in 2004, 2009, 2014 and 2019.
Applsci 15 01362 g005
Figure 6. Proportion of supply–demand coupling coordination level of civil aviation passenger transport in 31 province-level administrative divisions (excluding Hong Kong, Macao, and Taiwan) in China in 2004, 2009, 2014 and 2019.
Applsci 15 01362 g006
Table 1. Evaluation index system of supply and demand of civil aviation passenger transport.
Target LayerCriterion LayerSub-Criterion LayerIndicator LayerProperty
Coupling coordination of supply and demand of civil aviation passenger transportSupply
level
Facilities
system
Number of airports (pcs)+
Airport density (pcs/10000 km2)+
Number of airports per million people
(pcs/million people)
+
Number of runways (strip)+
Airport terminal area (hectare)+
Service systemNumber of aviation employees (person/year)+
Proportion of civil aviation employees (%)+
Demand intensityDemand statusPassenger throughput (person-time)+
Aircraft take-off and landing sorties (time)+
Single-runway aircraft take-off and landing sorties (time/strip)+
Passenger throughput per square kilometer (person/km2)+
Demand
potential
Annual growth rate of passenger throughput (%)+
Annual growth rate of aircraft take-off and landing sorties (%)+
Ratio of passenger throughput to resident population+
Note: ‘+’ represents the positive indicator. These indicators are positively correlated with the coordinated development of the system.
Table 2. Coupling coordination metrics and types.
Coupling Coordination TypeExtreme IncoordinationLow CoordinationModerate CoordinationHigh CoordinationExtreme Coordination
D-value
interval
0 < D ≤ 0.20.2 < D ≤ 0.40.4 < D ≤ 0.60.6 < D ≤ 0.80.8 < D ≤ 1
Table 3. Moran’s I index of coupling coordination degree of supply–demand of civil aviation passenger transport in China from 2004 to 2019.
YearIZp
20040.0550.8570.196
20050.1091.3620.087
20060.1231.4740.070
20070.1271.4960.067
20080.1611.8170.035
20090.0871.1190.132
20100.0841.0850.139
20110.0650.9320.176
20120.0480.7610.223
20130.0650.9070.182
20140.0851.0790.140
20150.0750.9830.163
20160.0801.0300.152
20170.1101.2970.097
20180.1161.3520.088
20190.1101.2840.100
Table 4. Regression results of two-way fixed-effect model.
Influencing FactorsExplanatory VariableCountry
Economic developmentPer capita GDP0.5399 ***
(3.95)
Population agglomerationPopulation density0.1378
(0.84)
Urbanization levelUrbanization rate0.0804 **
(2.12)
Government regulationPer capita fiscal expenditure0.1605
(0.60)
Tourism development levelRatio of number of domestic tourists to resident population−0.0002
(−0.88)
Opening to the outside worldRatio of total import and export to GDP0.0189 **
(2.11)
Industrial structureProportion of the added value of the tertiary industry to GDP0.0301
(0.87)
Traffic location conditionsRailway density0.0637
(0.25)
-Year FEYES
-Province FEYES
-R20.9878
Note: *** and ** denote statistical significance at the 1% and 5% levels, respectively, with the corresponding t-values presented in parentheses. The 5% significance level indicates that the null hypothesis is rejected at a 5% probability, indicating that the result has a 95% probability of being true. The 1% significance level indicates that the null hypothesis is rejected at a probability of 1%, and the result has the highest credibility.
Disclaimer/Publisher’s Note: The statements, opinions and data contained in all publications are solely those of the individual author(s) and contributor(s) and not of MDPI and/or the editor(s). MDPI and/or the editor(s) disclaim responsibility for any injury to people or property resulting from any ideas, methods, instructions or products referred to in the content.

