Article

Optimization of Microwave-Assisted Extraction Process for Production of Polyphenol-Rich Crude Extract from Cinnamomum iners Leaves

by
Keerati Tanruean
1,
Suwaporn Luangkamin
2,
Thanarak Srisurat
3,
Wasitthi Bunmusik
3 and
Panawan Suttiarporn
3,*
1
Program in Biology, Faculty of Science and Technology, Pibulsongkram Rajabhat University, Phitsanulok 65000, Thailand
2
Department of Fundamental Science and Physical Education, Faculty of Science at Sriracha, Kasetsart University, Sriracha Campus, Chonburi 20230, Thailand
3
Faculty of Science, Energy and Environment, King Mongkut’s University of Technology North Bangkok, Rayong Campus, Rayong 21120, Thailand
*
Author to whom correspondence should be addressed.
Appl. Sci. 2025, 15(3), 1265; https://doi.org/10.3390/app15031265
Submission received: 24 November 2024 / Revised: 19 January 2025 / Accepted: 23 January 2025 / Published: 26 January 2025

Abstract

:
Cinnamomum iners Reinw. ex Blume has long been recognized as a plant with food and medicinal uses. This study was designed to optimize the MAE process to produce a high-value, polyphenol-rich crude extract from cinnamon leaves (PCL). The primary goal was to apply response surface methodology (RSM) with a face-centered central composite design (FCCD) to identify the ideal conditions for microwave-assisted extraction (MAE). Key factors such as the MAE time, microwave power, and solid-to-liquid ratio were examined to produce a polyphenol-rich crude extract from C. iners leaves. The resulting extracts were assessed for extraction yield, total phenolic content (TPC), total flavonoid content (TFC), and antioxidant activity. The results showed that MAE using a methanol solvent had a significant impact on antioxidant compound levels. The R2 values for all responses, yield, TPC, TFC, and DPPH radical scavenging activity were 0.9497, 0.9494, 0.9199, and 0.9570, respectively, indicating that the developed quadratic polynomial models were accurate and suitable for analyzing MAE parameter interactions. The optimum MAE parameters were determined to be an MAE time of 25 min, microwave power of 214.24 W, and plant leaf–solvent ratio of 1:195.76 g/mL. In these optimized MAE conditions, the predicted extraction yield, TPC, TFC, and IC50 of DPPH scavenging were 18.56%, 22.86 mg GAE/g, 13.89 mg QE/g, and 83.30 µg/mL, respectively. The enhanced efficiency of MAE comes from microwave-induced heating, which disrupts cell walls for faster compound release, making it more effective and time-efficient than traditional HRE for polyphenol extraction. This study demonstrated that polyphenols can be efficiently extracted from C. iners using MAE, producing a valuable extract with potential as a natural preservative in food and a skin-protective, anti-aging ingredient in cosmetics.

1. Introduction

Cinnamomum iners Reinw. ex Blume is widely distributed across tropical regions of Southeast Asia, including Malaysia, Indonesia, Thailand, and the Philippines. C. iners leaves have been utilized in conventional therapies to treat bacterium-related illnesses, including fevers, digestive issues, and coughs, due to their strong antioxidant activity and potent antimicrobial properties [1]. The major bioactive compounds found in the leaves of Cinnamomum iners can be classified into several groups: terpenoids, including linalool, caryophyllene, caryophyllene oxide, camphor, geraniol, and xanthorrhizol (a sesquiterpenoid); phenylpropanoids, such as cinnamic aldehyde, 2-hydroxycinnamaldehyde, cinnamophilin, and safrole; phenolics, including eugenol, hydroxychalcone, and coumarin; and other compounds, such as benzyl benzoate [2].
An appropriate extraction strategy was designed based on the chemical properties of antioxidants, selecting the correct solvent and extraction method to maximize recovery while preserving stability and bioactivity. Methanol and ethanol are examples of polar solvents that are frequently utilized due to their effectiveness in recovering phenolic compounds from plant matrices. The selection of solvents and extraction procedures depends on the nature and stability of the phenolic components, ensuring efficient extraction based on their chemical characteristics [3]. Contemporary extraction methods, such as supercritical fluid extraction (SFE), microwave-assisted extraction (MAE), ultrasound-assisted extraction (UAE), and pressurized liquid extraction (PLE), address the shortcomings of traditional methods by improving yield, reducing the extraction time, minimizing solvent use, and preserving bioactive compounds, thereby resolving issues like low efficiency, long processing times, and compound degradation [4].
Microwave-assisted extraction (MAE) is recognized as a sustainable and eco-conscious technique for extracting antioxidant compounds from medicinal plants since it requires less solvent, less energy, and shorter extraction times than traditional procedures. MAE is an efficient, rapid, and selective method for recovering valuable bioactive compounds using the direct effects of electromagnetic radiation, which induces microwave-induced molecular movement, allowing materials to absorb electromagnetic energy and transform it into thermal energy. This method produces excellent yields while maintaining the integrity of the chemical by uniformly heating the solvent of choice and plant substrate. Microwave energy enhances the extraction of bioactive phytochemicals like phenolics and flavonoids by using ionic conduction and dipole rotation to heat polar solvents, breaking down cell walls and increasing solubility for faster and more efficient extraction [5].
The ability of the MAE process to extract antioxidant-rich compounds requires the consideration of variations in solvent concentration, irradiation time, microwave power, and material-to-solvent ratio characteristic of the plant sample and its water content and extraction temperature, as these factors may have independent or interactive effects on the efficiency and quality of the extraction [6]. Optimizing MAE parameters is essential in enhancing antioxidant production from medicinal plants, with response surface methodology (RSM) offering an effective approach to modeling and analyzing the interactions among these variables [7]. RSM, a popular multivariate optimization technique, is particularly useful in addressing the challenges of optimizing multiple factors by providing a systematic approach to identifying the optimal combination of conditions that enhance extraction efficiency [8]. RSM offers a more efficient and systematic approach to optimizing MAE conditions compared to the full factorial design, which can be time-consuming and resource-intensive, or one factor at a time, which lacks structure and may miss important interactions between variables, leading to incomplete optimization. Response surface methodology (RSM) has been employed to enhance the efficiency of MAE in extracting bioactive phytochemicals from various plant materials. For example, RSM has been successfully used to enhance the extraction of phenolics and flavonoids from plant resources like avocado [9], chestnut shells [10], and duku [11], where it helped in determining the best extraction conditions to maximize yield and quality.
Polyphenol-rich crude extracts are valuable due to their complex mixture of bioactive compounds that work synergistically, enhancing their overall therapeutic effects. Recently, polyphenols have attracted significant attention in the nutraceutical industry due to their potential efficacy in combating oxidative stress-related disorders, aligning with emerging consumer trends favoring natural food items devoid of artificial ingredients and those promoting health, sustainability, and social responsibility [12]. Known for their strong antioxidant properties, polyphenols help prevent cellular damage and provide additional well-being benefits, such as anti-inflammatory, anticancer, and cardiovascular protective effects. The two main classes of polyphenols are flavonoids (such as isoflavones, quercetins, cyanidins, and catechins) and phenolic acids (such as caffeic and ferulic acids) [13]. Consequently, extracting polyphenol-rich crude extracts from plant sources is essential in enhancing the bioactive potential of natural products used in functional foods, natural medicines, and cosmetics [14].
To the best of our knowledge, there is a significant knowledge gap regarding the optimization of microwave-assisted extraction (MAE) conditions specifically tailored toward maximizing the production of polyphenol-rich crude extracts from Cinnamomum iners leaves. The present investigation employed response surface methodology (RSM) to optimize the MAE process for producing a polyphenol-rich crude extract from cinnamon leaves by determining the effects and interactions among the MAE time, microwave power, and solid-to-liquid ratio. This method allowed for the simultaneous optimization of all MAE factors, minimizing the number of experiments needed while predicting the most efficient conditions. RSM was used to model the impact of these factors on polyphenol extraction from Cinnamomum iners leaves. TPC, TFC, and the DPPH assay were used to evaluate the potential of the model, ensuring maximum extraction efficiency in polyphenol extraction and assessing their antioxidant properties.

2. Materials and Methods

2.1. Chemicals and Plant Material Preparation

Aluminum chloride (AR) was acquired from KEMAUS (Cherrybrook, NSW, Australia). Potassium chloride was obtained from CARLO ERBA reagents (Cornaredo, MI, Italy). Sodium carbonate (AR) was purchased from QRëC (Auckland, New Zealand). Extraction solvents, including acetone, ethanol, and methanol (AR), were obtained from RCI Labscan (Bangkok, Thailand). The Folin–Ciocalteu reagent and sodium nitrite were sourced from Loba (Mumbai, India), while gallic acid, quercetin, and DPPH were obtained from Sigma-Aldrich (St. Louis, MO, USA). The cinnamon leaf samples utilized in this investigation were cultivated in Khiri Mat, Sukhothai province, Thailand (16°56′07″ N, 99°44′18″ E). The cinnamon leaf samples were dried at 40 °C and crushed into powdered leaves with a particle size lower than 500 µm using a microfine grinder (MF10 basic with MF10.1, IKA, Staufen, Germany). The material was authenticated by the Faculty of Science and Technology, Pibulsongkram Rajabhat University, Phitsanulok. Cinnamomum iners Reinw. ex Blume was preserved with a specimen number (PSRU1121). The cinnamon leaves were cleaned with water after harvesting to eliminate any contaminants. The C. iners were ground and run through sieve number 35 (500 μm) after being dried in an oven at 40 °C until they reached a consistent weight. A desiccator was used to store the plant powders.

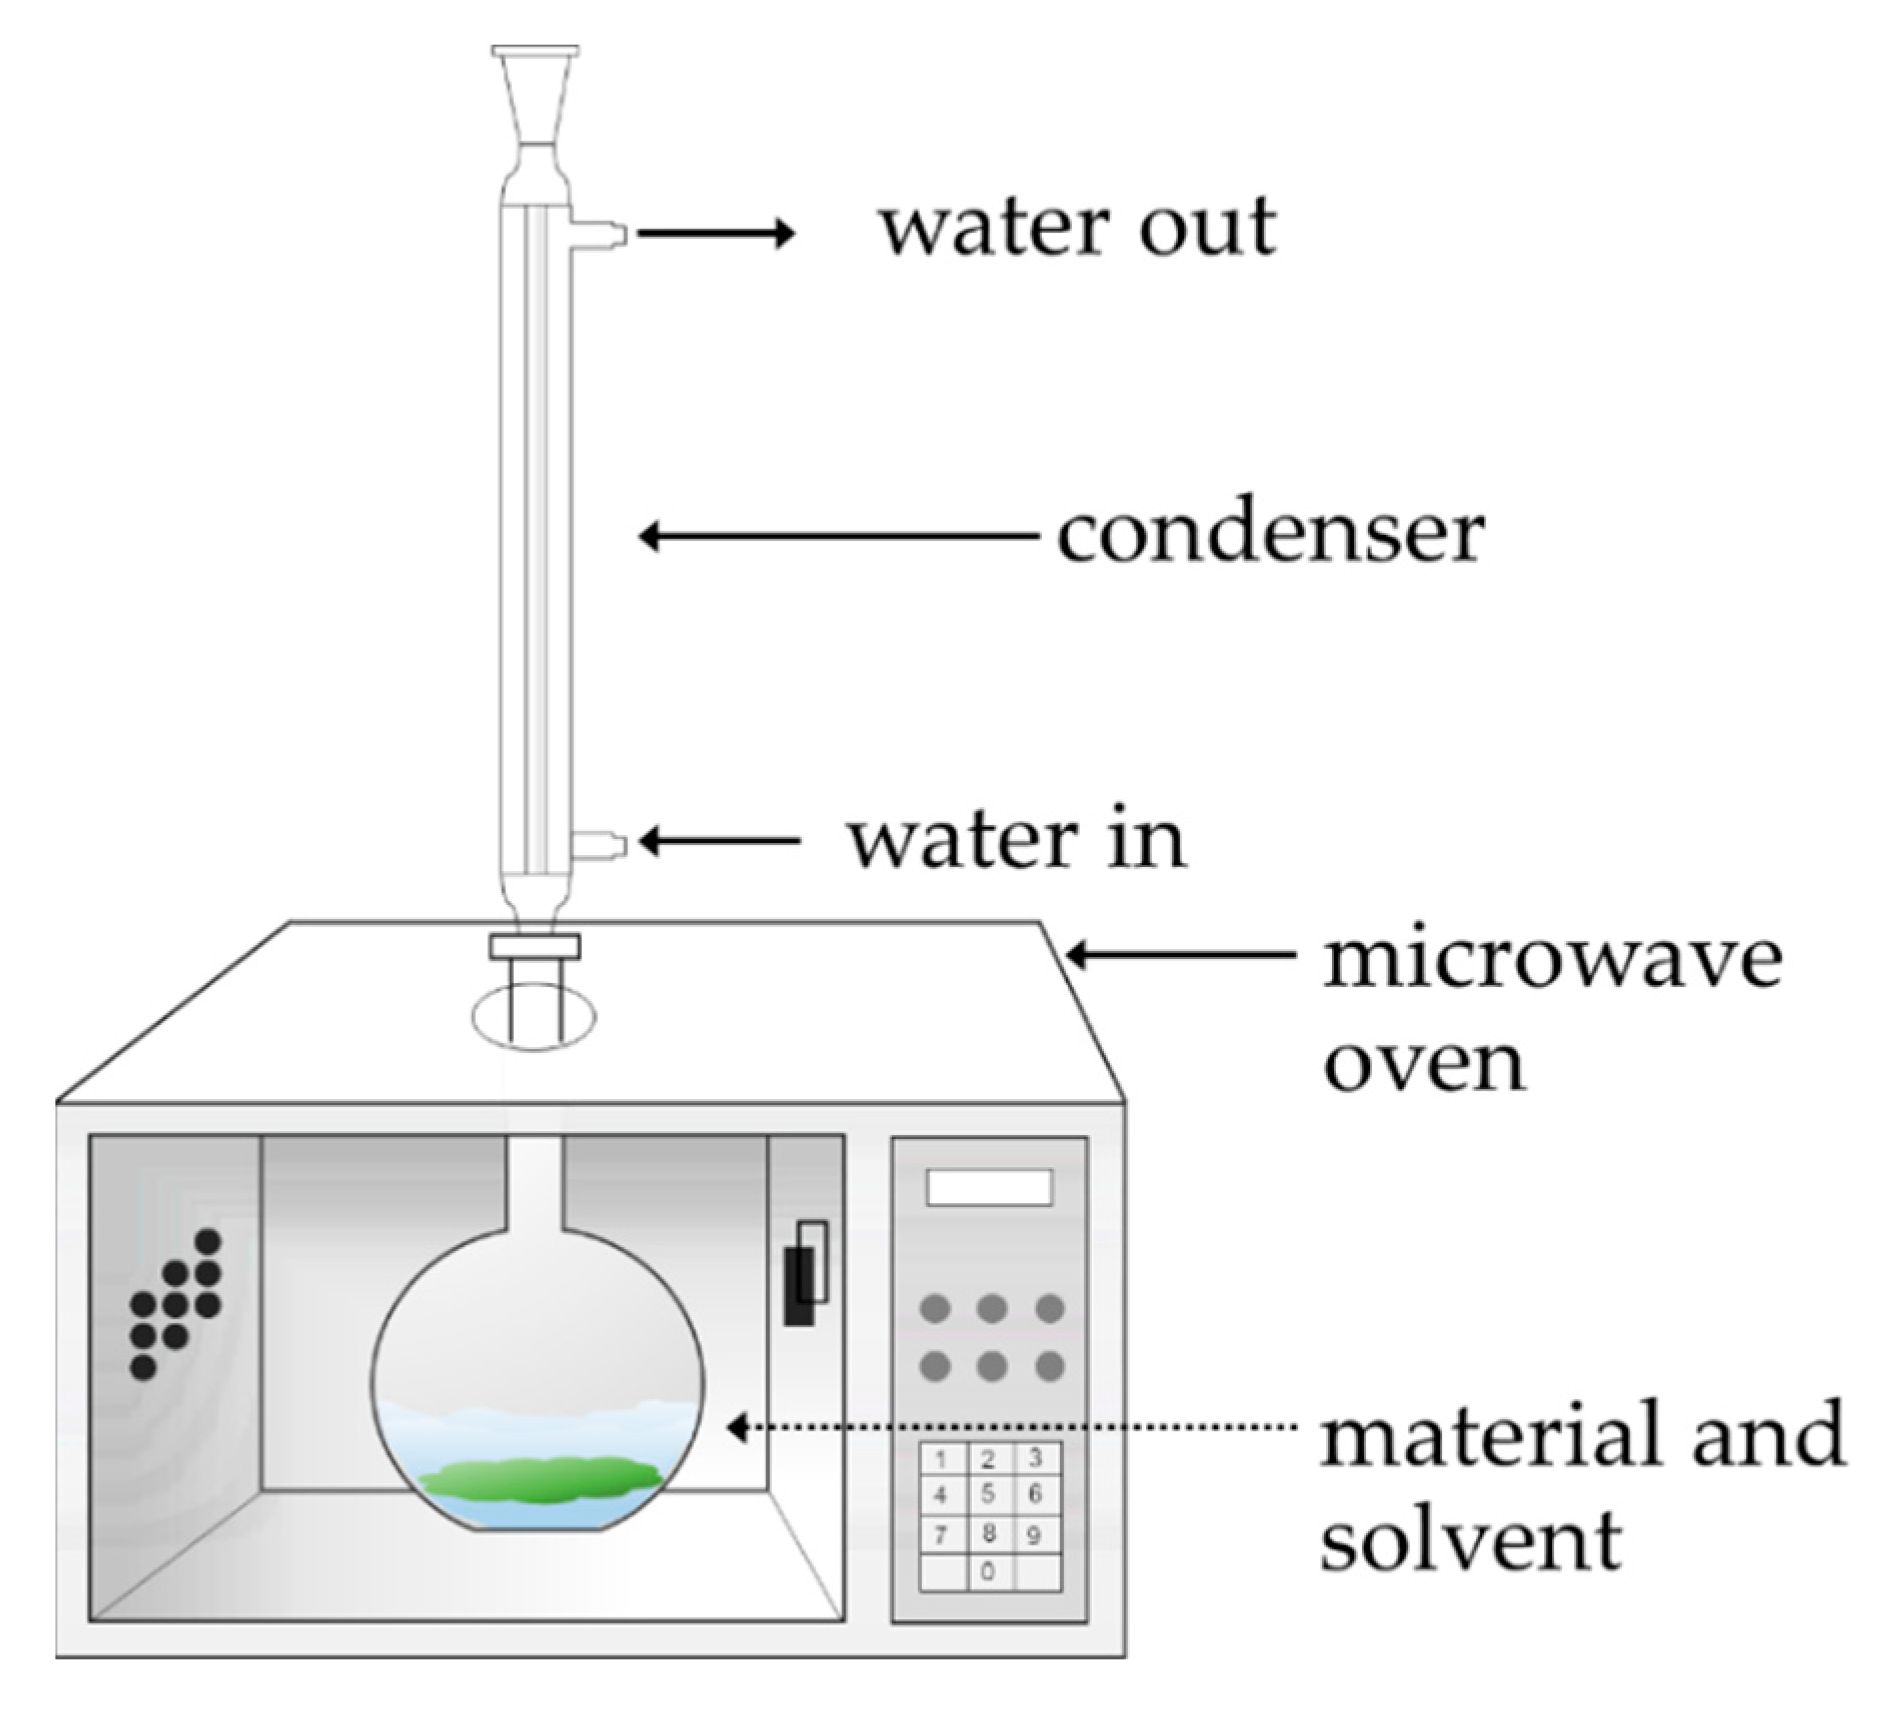
2.2. MAE Process for Polyphenol-Rich Crude Extract Production

The microwave-assisted extraction (MAE) procedure was carried out in a specially designed microwave oven (EME2024MW, Electrolux, Bangkok, Thailand) combined with a reflux apparatus (Figure 1). The extraction settings included varied extraction times (5–25 min) and levels of microwave power (70–350 W). The plant-to-solvent ratio of 1 g of C. iners leaves per an appropriate amount of selected solvents (60–300 mL) in a flat-bottom flask was used for the extraction process, using a microwave oven coupled with reflux distillation, according to the extraction time and microwave power settings specified in the experimental design.
The solutions were subsequently filtered, and the solvent was taken out using a rotary evaporator at 40 °C until a constant weight was achieved, yielding the polyphenol-rich crude extract of cinnamon leaves (PCL). Finally, the crude extract was weighed. The yield of C. iners leaf extract was calculated using Equation (1). After being adjusted to a volume of 10 mL, the crude extracts were stored at 4 °C. Testing with every extraction condition was carried out three times.
PCL   yield   ( % ) = Mass   of   crude   extract Mass   of   cinnamon   leaf × 100

2.3. Single-Factor Design

Single-factor investigation allows for the identification of suitable MAE conditions or factor ranges that influence responses by examining the effect of each parameter individually while keeping other factors unchanged. The yield of polyphenol-rich crude extract of cinnamon leaves (PCL), antioxidant compounds (TPC and TFC), and antioxidants against the free radical DPPH from PCL extracts was investigated using a single-factor experiment.
An initial screening of solvents was conducted to determine the most suitable solvent for single-factor MAE parameters, with methanol, ethanol, and acetone evaluated for their extraction efficiency. The MAE condition (1:60 g/mL, 20 min, and 210 W) was set to investigate the optimal solvent for the separation of antioxidant compounds contained in C. iners leaf (yield, TPC, and TFC) and the DPPH assay.
For the MAE single-factor experiment, the effects of the MAE time (5–25 min), microwave power (70–350 W), and solid–to–solvent ratio (1:60–1:300 g/mL) were investigated. The yield, TPC, TFC, and IC50 values were expressed as the mean ± standard deviation (SD) following three repetitions.

2.4. Response Design and Optimization of MAE Variables

The operational parameters were optimized through response surface methodology (RSM) combined with a face-centered central composite design (FCCD) to further assess the key factors influencing the MAE for PCL production. In FCCD, the axial points are set at ±1 from the center along each axis, placing them on the faces of the factorial cube, which is why it is called “face-centered”. This is an adjustment from standard central composite design (CCD), where the axial points are positioned at ±α along each axis, with α typically greater than 1 to achieve rotatability [15].
Based on single-factor tests, the extraction time (X1: 5–25 min), microwave power (X2: 70–350 W), and solid-to-solvent ratios (X3: 1:60–1:300 g/mL) were used as the MAE independent variables (Table 1). The yields of PCL (Y1), TPC (Y2), TFC (Y3), and 50% inhibition concentration on DPPH (IC50) (Y4) were selected as a dependent variable.
The MAE experimental setting was designed, and the data that were gathered were examined using Minitab software (trial version 18, Minitab Inc., State College, PA, USA) to construct models based on response surface methodology (RSM). All responses were collected under varying conditions based on the 20-run experimental design, with each experiment conducted in triplicate. A second-order polynomial model was applied to fit the response data from the MAE experiments. The polynomial regression was given as Equation (2).
Y = β 0 + i = 1 3 β i X i + i = 1 3 β ii X i 2 + i = 1 2 j = i + 1 3 β ij X i X j + ε
where Y represents the response variables; X1, X2, and X3 represents the MAE independent variables; β0 is the intercept; βi represents the linear coefficients; βii represents the quadratic coefficients; βij represents the interaction coefficients; and ε is the random error.
The model analysis and optimization of MAE conditions for the responses (yield, TPC, TFC, and IC50) were conducted using analysis of variance (ANOVA) with a 95% confidence interval. The regression coefficient (R2) and the lack-of-fitness statistic were used to test the adequacy of the model fitting. Based on the data from the FCCD models, MAE conditions were optimized. The optimum MAE conditions led to the maximum yield, TPC, TFC, and minimum IC50. The interaction effects of each MAE parameter on the response level were depicted in a 3D surface plot. The interaction effects of each parameter on the response data were illustrated through 3D surface plots constructed using Design Expert V12 Trial Software (Stat-Ease Inc., Minneapolis, MN, USA). By performing extraction three times with the optimal MAE setting, the data model validity for the MAE optimized results was confirmed. Finally, the predicted values and the actual results were compared in order to determine the validity of the MAE model.

2.5. Determination of Total Phenolic Content

The Folin–Ciocalteu technique, as examined by Bunmusik et al., 2023 [16], was applied to quantify the total phenolic content (TPC), with a few modifications. Briefly, 250 µL of PCL or standard solution 2.5 mL of distilled water and 500 µL of Folin–Ciocalteu reagent were combined and incubated for approximately 5 min, and then 500 μL of sodium carbonate solution (20% (w/v) Na2CO3) was added. A UV-Vis spectrophotometer (Thermo Scientific GENESYS 20, Dreieich, Germany) was used to measure absorbance at 760 nm following mixing and an hour of room temperature storage. The calibration standard used was diluted gallic acid. The gallic acid equivalent (GAE) of the total phenolic content was expressed as mg gallic acid equivalent (GAE) per gram of dried weight.

2.6. Determination of Total Flavonoid Content

The total flavonoid content (TFC) was determined using the aluminum chloride colorimetric method with slight modifications, as outlined by Tanruean et al., 2021 [17]. A total of 500 μL of PCL or standard solution was mixed with 2 mL of methanol, followed by the addition of 150 μL of sodium nitrate (50 g/L NaNO2) and incubation for 5 min. Next, 150 μL of aluminum chloride solution (100 g/L AlCl3) was added, and the solution combination was incubated at room temperature for 15 min. At 415 nm, the absorbance was determined with a UV-Vis spectrophotometer, with diluted quercetin used as a calibration standard. The total flavonoid content was calculated in mg quercetin equivalent (QE) per gram of dried weight.

2.7. DPPH Radical Scavenging Activity Assessment

Following a few modest adjustments, the DPPH radical scavenging capacity test was used to assess the antioxidant properties of cinnamon leaf crude extract [16]. A 500 μL stock solution of PCL at varying concentrations and 1.5 mL of DPPH solution (0.1 mM) were added. The blank substance was methanol. After 30 min at room temperature in the dark, the UV-Vis spectrophotometer was applied to determine absorbance at 517 nm. The inhibition of DPPH (%) was investigated using Equation (3), as follows:
Inhibition   of   DPPH   ( % ) = ( A control     A sample ) A control × 100
where Acontrol is the absorbance value of the blank and Asample is the absorbance of PCL with DPPH solution. A graph of the inhibition percentage versus PCL concentration enabled the calculation of the extract concentration that provided 50% scavenging (IC50).

2.8. Comparison of MAE and Conventional HRE

Conventional heat reflux extraction (HRE) is an approach to extracting compounds from cinnamon leaves, which we compared with microwave-assisted extraction (MAE) under optimal conditions at various time intervals (until the crude extract yield, TPC, TFC, and DPPH inhibition activity reached a plateau). During the HRE process, the temperature was maintained at the boiling point of methanol. The solutions were subsequently filtered, and the solvent was removed using a rotary evaporator at 40 °C until a constant weight was achieved, yielding a polyphenol-rich crude extract of cinnamon leaves (PCL).

3. Results

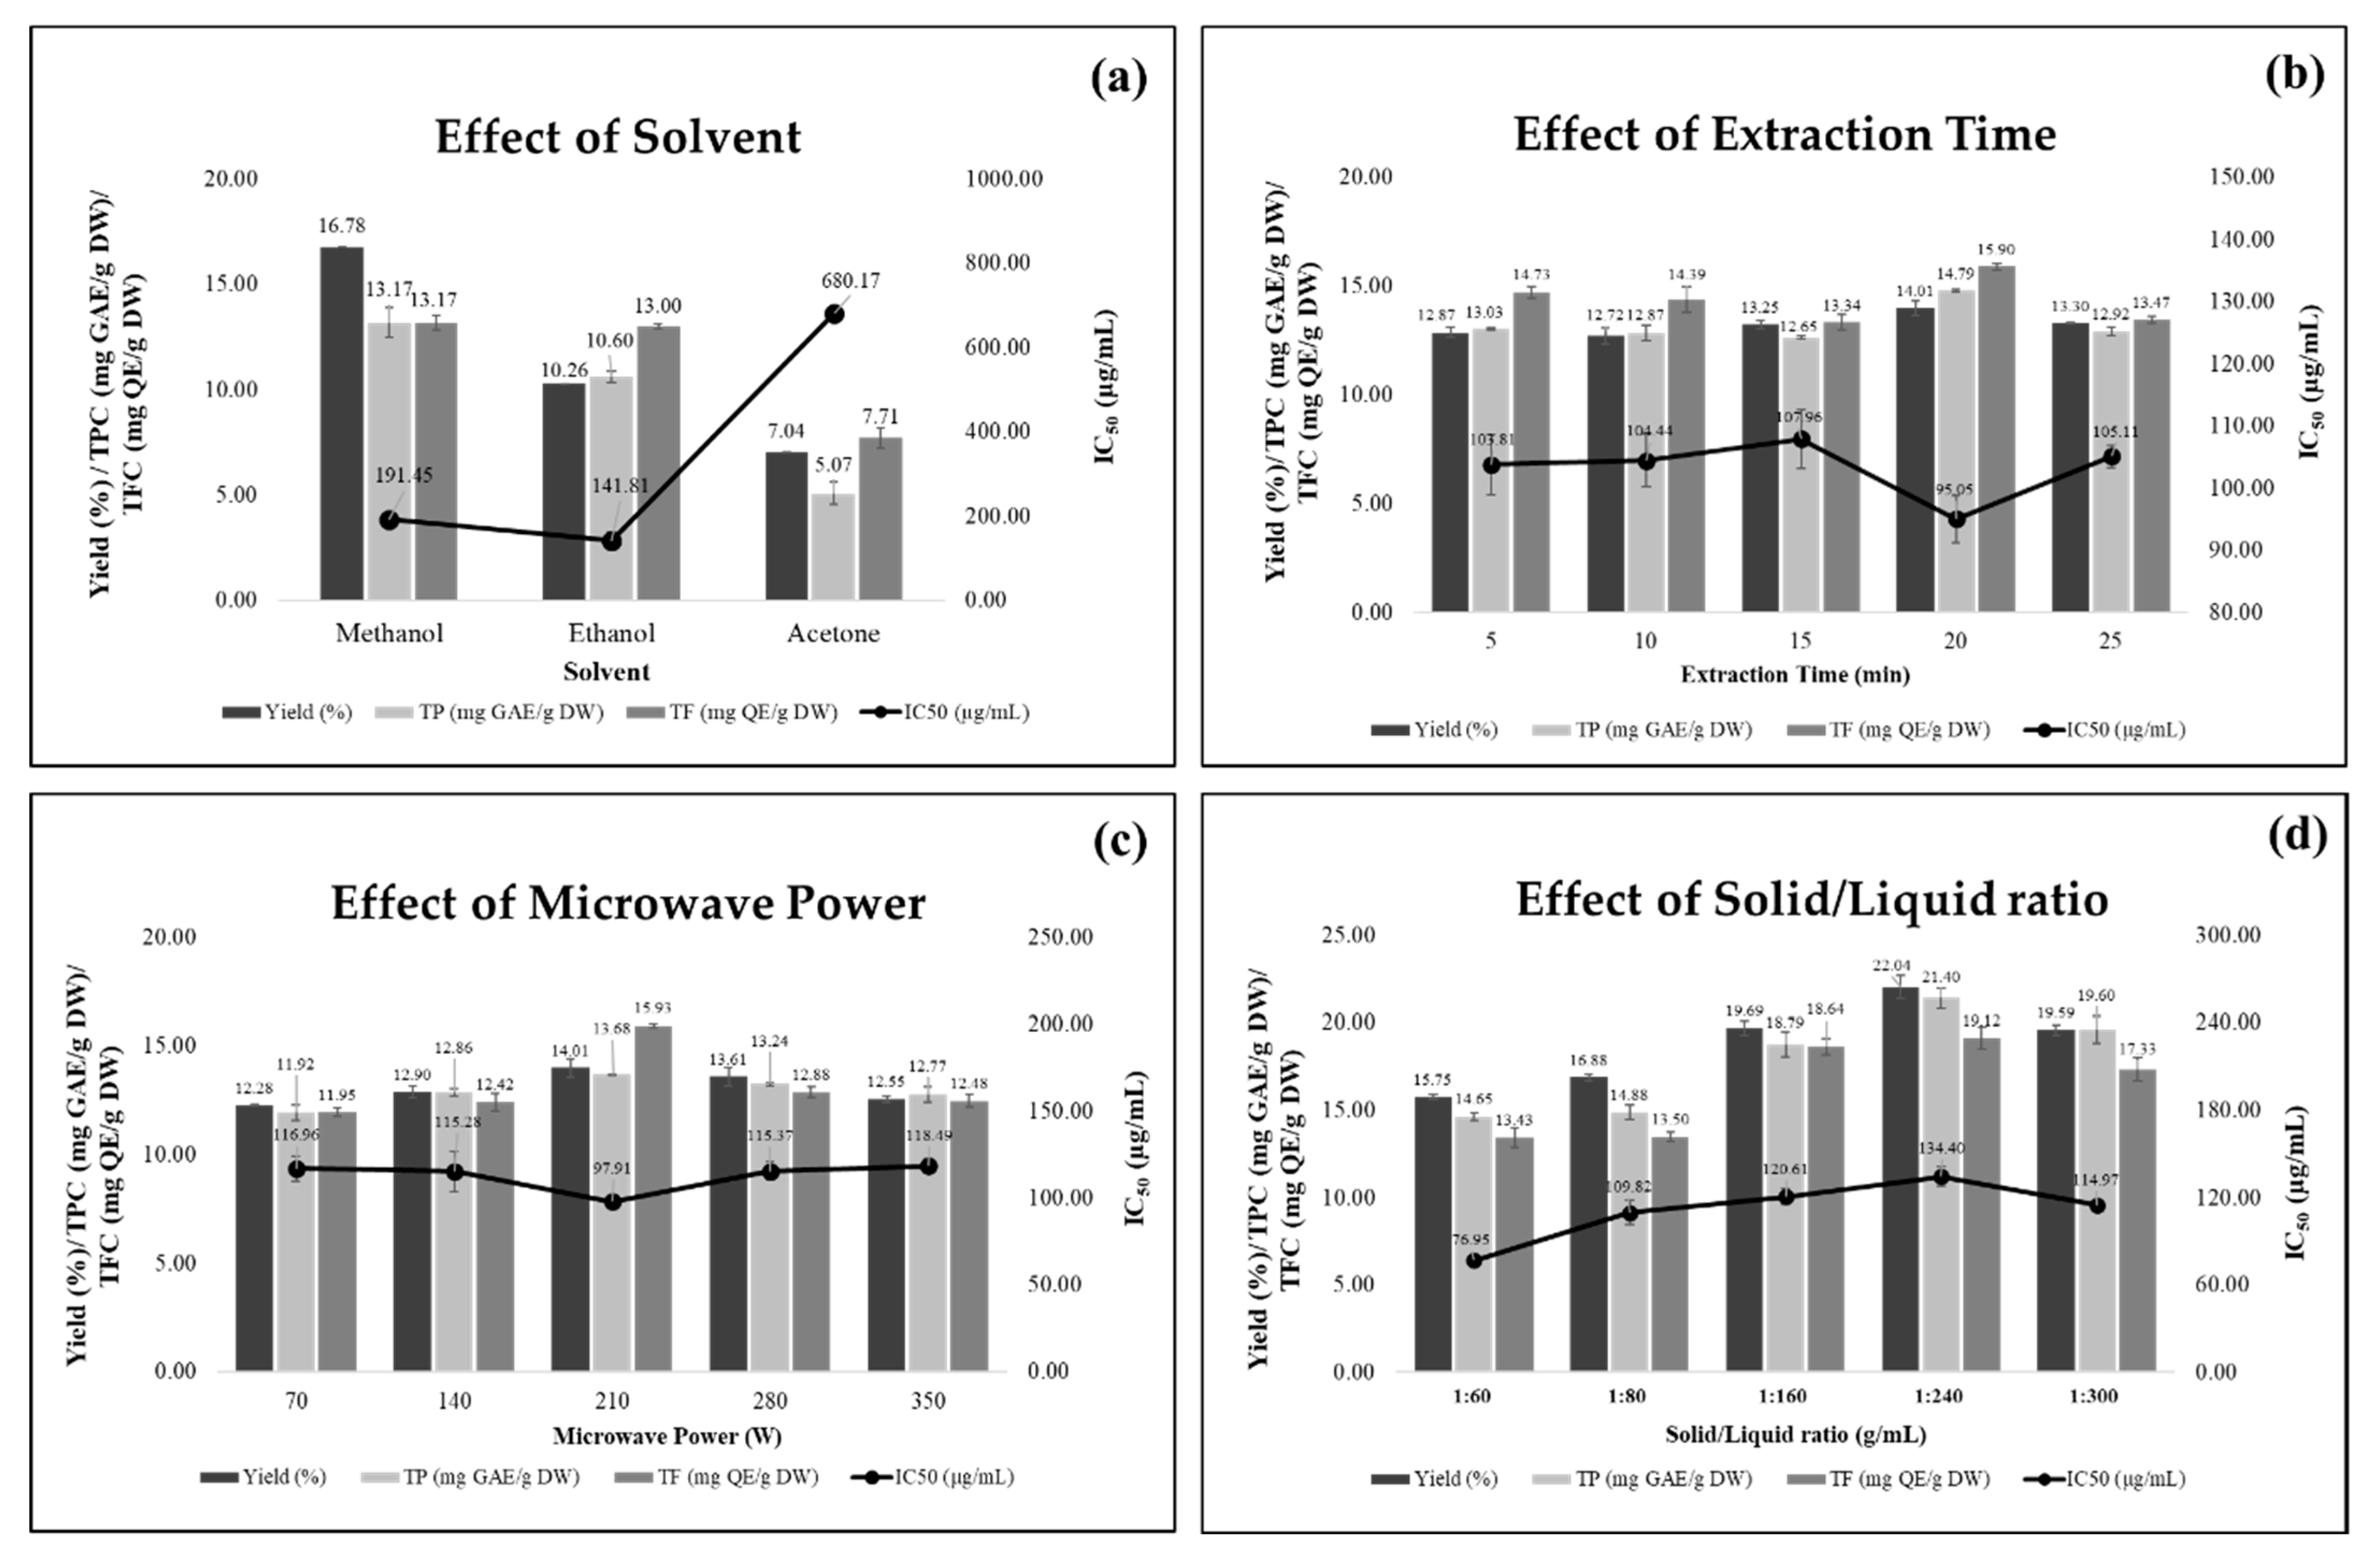
3.1. Impact of Single Factors on Antioxidant Compounds and Activity
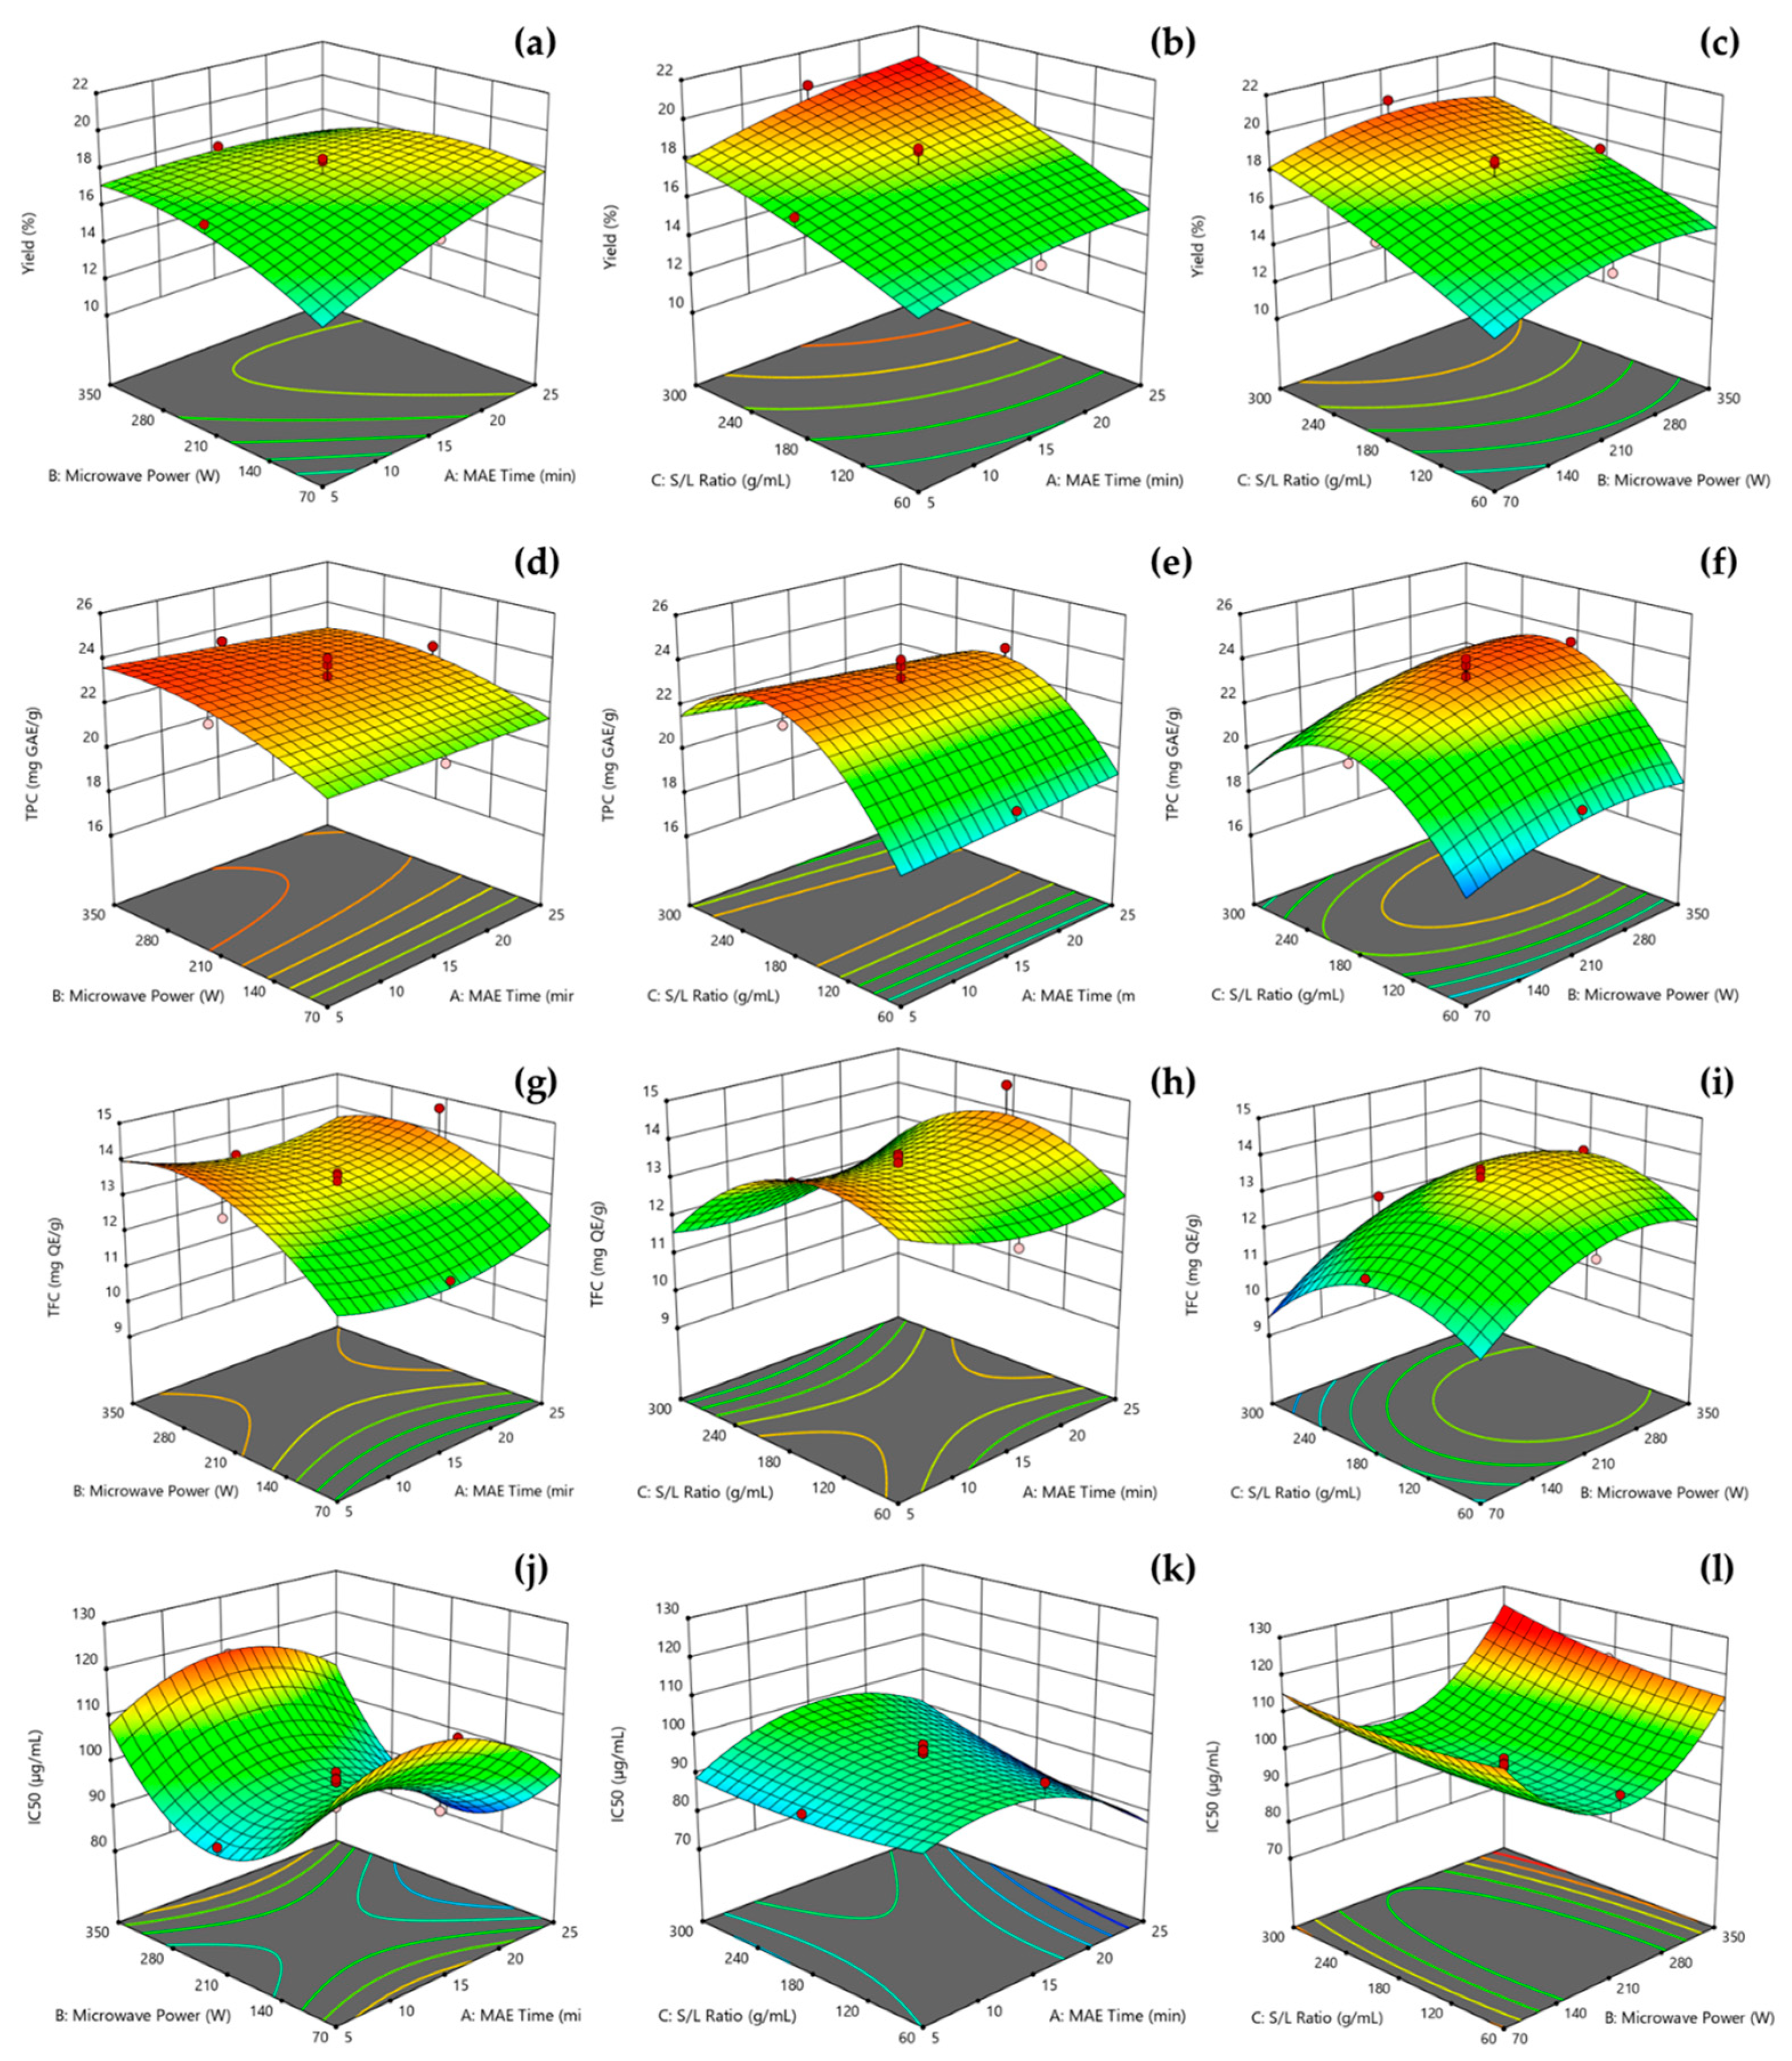
Regarding the various solvents utilized in the MAE process, the yield, TPC, and TFC were as follows: methanol > ethanol > acetone. Under these conditions, methanol emerged as the optimal solvent, yielding the highest percentage at 16.78 ± 0.10% (Figure 2a). Moreover, it resulted in the highest TPC at 13.17 ± 0.72 mg GAE/g and the highest TFC at 13.17 ± 0.35 mg QE/g. Methanol’s high polarity and hydrogen-bonding capability make it highly effective in extracting polyphenols, as it interacts well with their polar groups, enhancing solubility and extraction efficiency. This property makes methanol a preferred solvent for achieving high yields of polyphenols (TPC and TFC) from C. iners due to its ability to preserve the desired antioxidants’ chemical structural stability [18]. Regarding the DPPH assay, it was elucidated that the methanol (191.45 ± 3.55 µg/mL) and ethanol (141.81 ± 19.11 µg/mL) extracts showed higher antioxidant activities than acetone (680.17 ± 4.11 µg/mL) extracts. The DPPH experiment revealed that the methanol and ethanol extracts exhibited greater antioxidant capacity compared to the acetone extracts. The antioxidant capacity of extracts is closely associated with TPC and TFC. Stronger quantities of total phenolics in the extracts are also associated with stronger antioxidant activity. The solubility of certain antioxidant chemicals and the estimate of antioxidant activity are impacted by variations in solvent polarity [19].
Figure 2b shows that the different MAE time obtained various values for extraction yield (12.72 ± 0.38 to 14.01 ± 0.33%), TPC (12.87 ± 0.36 to 14.79 ± 0.06 mg GAE/g), TFC (13.34 ± 0.35 to 15.90 ± 0.16 mg QE/g), and IC50 (105.11 ± 1.83 to 95.05 ± 3.76 µg/mL). The MAE time that provided the highest yield, TPC, and TFC was 20 min, with values as follows: yield, 14.01 ± 0.33%; TPC, 14.79 ± 0.06 mg GAE/g; and TFC, 15.90 ± 0.16 mg QE/g extract. The MAE time of 20 min also yielded the best antioxidant capacity in the cinnamon leaf extract, with an IC50 value of 95.05 ± 3.76 µg/mL. Prolonged extraction times are known to cause the degradation of antioxidants in the extract [20].
Figure 2c shows that different levels of microwave power led to the obtention of various values for extraction yield (12.28 ± 0.06 to 14.01 ± 0.33%), TPC (11.92 ± 0.35 to 13.68 ± 0.04 mg GAE/g), TFC (11.95 ± 0.18 to 15.93 ± 0.08 mg QE/g), and IC50 (118.49 ± 4.22 to 97.91 ± 3.52 µg/mL). At a microwave power of 210 W, the extraction achieved the highest yield of 14.01 ± 0.33%, a TPC of 13.68 ± 0.04 mg GAE/g, a TFC of 15.93 ± 0.08 mg QE/g, and the best IC50 antioxidant capacity of 97.91 ± 3.52 µg/mL. Higher microwave power accelerates extraction by disrupting hydrogen bonds and enhancing solvent penetration, but beyond a certain point, further increases may not improve yield and may instead lead to the degradation of phenolic compounds due to excessive heat [21].
Figure 2d shows that different solid–liquid ratios led to the obtention of various values for extraction yield (15.75 ± 0.13 to 22.04 ± 0.66%), TPC (14.65 ± 0.21 to 21.40 ± 0.60 mg GAE/g), TFC (13.43 ± 0.56 to 19.12 ± 0.64 mg QE/g), and IC50 (134.40 ± 6.60 to 76.95 ± 2.31 µg/mL). With a solid-to-liquid ratio of 1:240 g/mL, the extraction reaches its highest values, yielding 22.04 ± 0.66%, with a TPC of 21.40 ± 0.60 mg GAE/g and a TFC of 19.12 ± 0.64 mg QE/g. In contrast, at a 1:60 g/mL ratio, the optimal IC50 antioxidant activity is 76.95 ± 2.31 µg/mL. When the solid–liquid ratio is greater than 1:240, the responses gradually decrease. This could be because increasing the material-to-liquid ratio raises the solvent’s osmotic pressure, which leads to the dissolution of other impurities, thereby reducing the extraction efficiency of the target compound [22].
Selecting the appropriate range is essential in capturing the full response behavior, enabling the second-order model to accurately identify the optimal conditions and optimize the process [8]. Too little or too much of any of the three parameters (MAE time, microwave power, or solid-to-solvent ratio) can negatively impact the extraction efficiency and the quality of the phenolic compounds [23]. The optimal conditions lie in a range that maximizes extraction while minimizing degradation or energy inefficiencies. Thus, the region that yielded the best response through a single-factor experiment was found to have an optimal MAE time between 5 and 25 min, an optimal microwave power ranging from 70 to 350 W, and the best solid-to-liquid ratio between 1:60 and 1:300 g/mL, as these intervals encompassed the points of maximum response. Single-factor experiment helps in identifying the “mountain” shape on a response surface plot, where the peak represents the optimal conditions. Selecting too narrow a range too close to the peak can lead to a response surface that lacks the characteristic “mountain” shape, making it difficult to identify the optimal conditions. By ensuring that the range is broad enough to encompass the peak, RSM can effectively fine-tune the process and accurately predict the best combination of variables, leading to optimal and efficient results. These optimal ranges will serve as the basis for designing the next step of the experiment using RSM.

3.2. Model Fitting

Response surface methodology (RSM) can be used to investigate and optimize multivariable applications by identifying the correlation between the responses of antioxidant compounds, as well as DPPH scavenging activity, and the independent variables of MAE factors. A face-centered central composite design (FCCD) was employed to investigate and optimize the effects of MAE factors, including the MAE time, microwave power, and solid-to-liquid ratio, to yield a polyphenol-rich crude extract from cinnamon leaves (PCL) with maximum yield, TPC, TFC, and DPPH activity.
Twenty experimental designs for RSM were constructed using an FCCD with six center points. The experiment values obtained ranged from 14.26 ± 0.37 to 20.22 ± 0.52% for antioxidant yield, 16.43 ± 0.21 to 23.75 ± 0.56 mg GAE/g for TPC, 9.37 ± 0.46 to 14.68 ± 0.72 mg QE/g for TFC, and 80.02 ± 3.90 to 120.12 ± 7.25 µg/mL for IC50 of DPPH scavenging activity (Table 2).
Based on ANOVA (Table 3), the data for antioxidant yield, TPC, TFC, and DPPH in all four models were remarkably significant (p < 0.05). The respective values of R2 and Adj-R2 for antioxidant yield (0.9497 and 0.9044, respectively), TPC (0.9494 and 0.9038, respectively), TFC (0.9199 and 0.8479, respectively), and IC50 of DPPH (0.9570 and 0.9183, respectively) were all close to 1, indicating that the models were substantial and reasonable. In terms of pure error, the lack-of-fit analysis was not significant (p > 0.05), indicating that the quadratic model was not statistically significant for the antioxidant yield, TPC, TFC, and DPPH assay.
Yield: The MAE time (X1), microwave power (X2), and solid–liquid ratio (X3) were significant (p < 0.05). The quadratic effect (X22) was also significant (p < 0.05). The second-order polynomial equation for yield is shown as Equation (4).
Y1 = 17.760 + 0.859X1 + 0.493X2 + 2.100X3 − 0.922X22 − 1.040X1X2
Figure 3a–c show the 3D response surface plots that illustrate the impact of the MAE independent factors and their interactions on antioxidant yield. There was a significant (p < 0.05) interaction between MAE time and microwave power (X1X2). MAE times between 18 and 25 min combined with microwave power levels of 70–250 W tended to yield the highest extraction yield, achieving yields of over 18%, as shown in Figure 3a. The increase in microwave power, along with longer extraction time, led to a higher extraction yield. This phenomenon can be attributed to the enhanced mass transfer rate and solubility of phenolic compounds, resulting from the reduced surface tension and solvent viscosity. These effects improve sample wetting and facilitate better matrix penetration, respectively. At a microwave-assisted extraction (MAE) time of 18–25 min and a microwave power exceeding 250 W, the extraction yield decreases due to the degradation of certain polyphenol compounds [9].
TPC: The microwave power (X2), and solid–liquid ratio (X3) were significant (p < 0.05). The quadratic effect (X32) was also significant (p < 0.05). The second-order polynomial equation of TPC is shown as Equation (5).
Y2 = 23.052 + 0.917X2 + 1.108X3 − 3.339X32
The impacts of the MAE independent variables and their interactions on TPC are illustrated in the 3D response surface plots shown in Figure 3d–f. However, the interaction term is not significant for TPC.
TFC: The microwave power (X2) and solid–liquid ratio (X3) were significant (p < 0.05). The quadratic effect (X22 and X32) was also significant (p < 0.05). The second-order polynomial equation of TFC is shown as Equation (6).
Y3 = 13.342 + 0.901X2 − 0.475X3 − 0.956X22 − 1.366X32 + 0.444X1X3
There was a significant (p < 0.05) interaction between the MAE time and the solid–liquid ratio (X1X3). The influence of the MAE independent variables and their interactions on TFC is depicted in the 3D response surface plots presented in Figure 3g–i. Using an extraction time of 5–11 min with a solid–liquid ratio of 1:60–1:210 g/mL or an extraction time of 20–25 min with a solid–liquid ratio of 1:110–1:250 g/mL is likely to maximize the total flavonoid content, exceeding 14 mg QE/g, as illustrated in Figure 3h. A solid-to-liquid ratio greater than 1:250 results in a decrease in TFC. In MAE, a higher solvent volume can lead to lower recoveries because it reduces the solvent’s ability to effectively extract flavonoids [24].
DPPH: The extraction time (X1), microwave power (X2), and solid–liquid ratio (X3) were significant (p < 0.05). The quadratic effect (X12 and X22) was also significant. There was a significant (p < 0.05) interaction between the MAE time and the microwave power (X1X2), the extraction time and the solid–liquid ratio (X1X3), and the microwave power and the solid–liquid ratio (X2X3). Figure 3j–l display 3D response surface plots that illustrate how the impact of the MAE independent factors and their interactions affect antioxidant activity. The second-order polynomial equation of DPPH is shown as Equation (7).
Y4 = 95.20 − 3.284X1 + 2.188X2 + 2.662X3 − 9.75X12 + 20.13X22
+ 3.030X1X2 + 4.330X1X3 + 2.50X2X3
Figure 3j shows that an MAE time of 24–25 min combined with a microwave power of 150–250 W tends to achieve the lowest 50% radical scavenging inhibition concentration (IC50), below 90 µg/mL. Figure 3k shows that an MAE time of 24–25 min with a solid-to-liquid ratio of 1:60–1:130 g/mL similarly tends to yield the lowest IC50, below 80 µg/mL. Figure 3l shows that using a microwave power between 190 and 240 W and a solid-to-liquid ratio of 1:60–1:170 g/mL is also likely to achieve the lowest IC50, below 95 µg/mL. When the extraction time is less than 24 min, the DPPH radical scavenging is low. Moreover, When the microwave power is below 150 W or above 250 W, the DPPH radical scavenging activity is low. Low microwave power may not be sufficient to extract an adequate amount of polyphenols, leading to diminished antioxidant activity. Conversely, excessive microwave power can cause the thermal degradation of polyphenols, which also results in a reduction in their antioxidant properties [9].
The optimization of MAE parameters using FCCD and RSM successfully developed reliable models for yield, TPC, TFC, and DPPH scavenging activity. These models are characterized by high R2 and R2 Adj values and non-significant lack-of-fit, confirming their reliability. The significant quadratic terms in the models enable the use of polynomial equations, which effectively predict conditions to maximize extraction yield and antioxidant concentrations while minimizing IC50, further emphasizing the efficiency of MAE for functional ingredient production.

3.3. Optimization of MAE and Verification of Predictive Model

The optimal MAE conditions for producing a polyphenol-rich crude extract from cinnamon leaves (PCL) using MAE were predicted by maximizing the response values for yield, TPC, TF, and DPPH radical scavenging activity using Minitab 18 based on maximum desirability. The desirability value of yield, TPC, TFC, and DPPH were 0.8038, 0.8436, 0.8505, and 0.9182, respectively. According to the desirability scale, the results indicate that the desirability model falls within the range of acceptable to excellent, with values between 0.8 and 1 [25]. The optimal MAE conditions were evaluated to be an MAE time of 25 min, a microwave power of 214.24 W, and a solid–liquid ratio of 1:195.76 g/mL. The optimization provided the maximum predicted levels of 18.56% for extraction yield, 22.86 mg GAE/g for TPC, 13.89 mg QE/g for TFC, and 83.30 µg/mL for IC50 of DPPH scavenging. The results of experiments conducted under optimal MAE parameters are shown in Table 4. A relative percent error of 2.30% for yield, 1.04% for TPC, 1.32% for TFC, and 0.50% for antioxidant activity was calculated, indicating the variation between the predicted and actual experimental results. The experimental results were consistent with the anticipated results, demonstrating the validity of the FCCD model’s capacity to predict the presence of antioxidant phytochemicals and antioxidant activity using MAE.
The optimal MAE conditions for producing a valuable PCL yield were a 25 min of extraction time, 214.24 W microwave power, and a solid–liquid ratio of 1:195.76 g/mL. The verification of the predictive model under these conditions showed minimal relative percent errors, confirming the accuracy and reliability of the FCCD model in predicting extraction yield, antioxidant content, and activity.

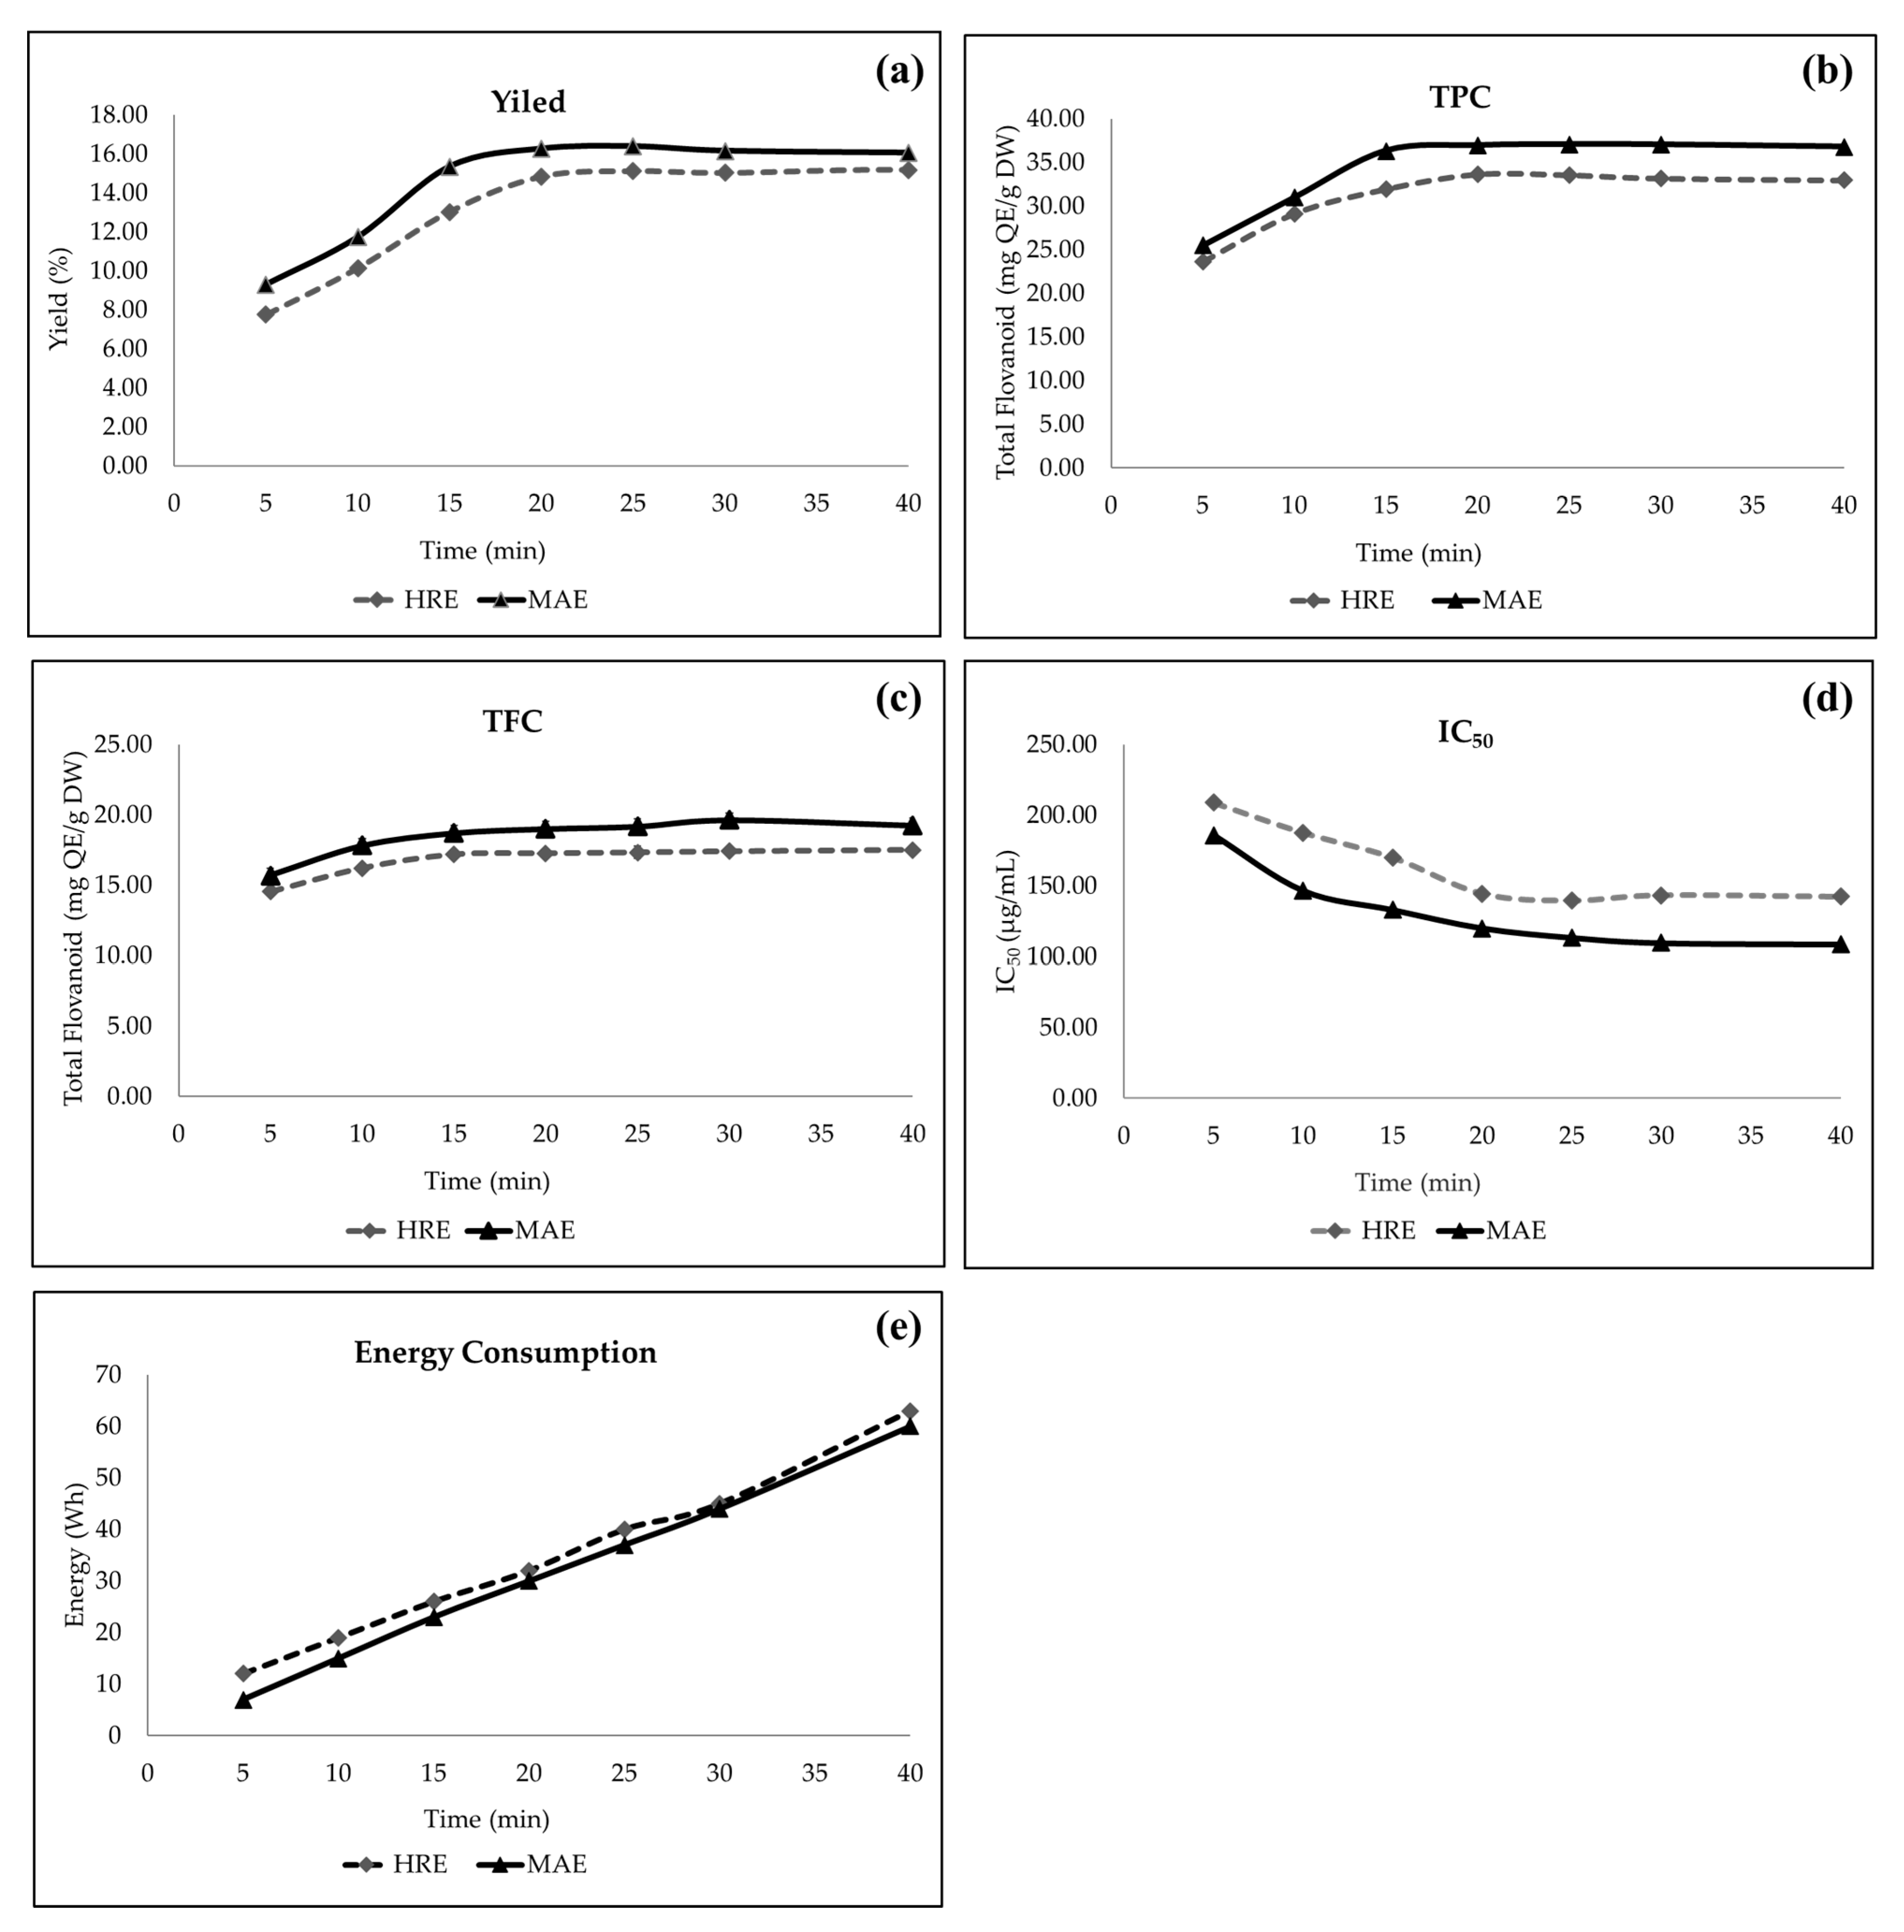
3.4. Comparison of MAE and HRE

Figure 4a presents the extraction yield profiles of two methods over time, illustrating distinct patterns. Experiments were conducted at atmospheric pressure and under optimal conditions (214.24 W with MAE), with the yield defined as the percentage of polyphenol-rich crude extract from cinnamon leaves mass-extracted relative to the initial mass of cinnamon leaves. The extraction kinetics for both microwave-assisted extraction (MAE) and heat reflux extraction (HRE) reveal four key phases [26,27]. The initial “zero phase” is the heating stage, where the temperature increases from room temperature to methanol boiling point.
Phase 1 shows a rapid yield increase as polyphenol is extracted from the surface of plant cells, accounting for approximately 57% of the total yield with MAE and 51% with HRE. In Phase 2, the yield rises further due to the internal diffusion of antioxidant compounds from within the particles to the surrounding medium, driven by thermal conduction within plant cells; this phase adds about 43% to the MAE total yield and 47% to that of HRE. Phase 3 is when a plateau or equilibrium is reached, with a steady yield indicating the end of MAE, which is typically reached between 20 and 25 min; with HRE, this is between 25 and 30 min.
Phase 3 represents a plateau or equilibrium, where the extraction yield stabilizes, signaling the completion of the extraction process. For MAE, this phase is typically reached between 20 and 25 min, with higher extraction efficiency compared to HRE, where the plateau is reached between 25 and 30 min. MAE is more efficient, as it reaches the plateau phase faster, requiring less time to achieve a high extraction yield, making it a quicker and more effective method than other techniques.
The HRE profile (also shown in Figure 4a–d) shows similar phases but differs from MAE. Its heating stage takes longer, as it heats both the plant material and the water. Phase 1 yields only 7.75% within the first 5 min, with a lower antioxidant yield than MAE (9.30%). At 25 min, the values of responses in MAE are higher than in HRE, with 16.30 ± 0.10% for extraction yield, 37.07 ± 0.66 mg GAE/g for TPC, 19.17 ± 0.42 mg QE/g for TFC, and 113.43 ± 0.26 µg/mL for the IC50 of DPPH scavenging.
The energy required for the extraction processes, calculated based on the power consumption of heat reflux extraction (HRE) and microwave-assisted extraction (MAE) during their complete extraction periods, is 63 Wh for HRE and 60 Wh for MAE (Figure 4e). This demonstrates a considerable energy saving of 4.7% with MAE, underscoring its cost efficiency compared to HRE. In terms of energy consumption in extraction methods, the MAE method presents significant advantages over HRE, including a 6–8% reduction in energy consumption. This enhanced efficiency is largely attributed to its considerably shorter extraction time, with MAE reaching the plateau phase far more quickly than HRE.
We found typical extraction curves for both methods, highlighting changes in yield over time. While both methods follow a similar pattern, they differ in yield rate and extraction time. This suggests that the MAE mechanism benefits from microwave irradiation, which heats polar molecules within plant cells outward, aided by the synergy of heat and mass transfer. The rapid yield increase in Phase 1 typically represents the rapid release of target compounds from the plant matrix. During this initial phase, microwave energy causes localized heating, which disrupts cell walls, resulting in the quick release of polyphenols into the solvent. A key difference between MAE and HRE is MAE’s ability to rapidly reach high polyphenol yields and hence high antioxidant activity [28]. This efficiency likely results from microwaves’ stronger extraction potential, which combines heat and mass transfer effects in a synergistic way.

4. Discussion

The creation of “rich extracts”, which are concentrated formulations containing a wide variety of bioactive components present in plants, has been prompted by the expansion of phytochemicals’ potential. MAE is a superior choice for producing high-quality, polyphenol-rich crude extracts, as it offers improved extraction speed, reduced solvent usage, and enhanced yields of antioxidant compounds through targeted heating, which accelerates cell wall disruption and improves solvent penetration [29].
The appropriate ranges for MAE variables are as follows: an extraction time in the range of 5–25 min, a microwave power in the range of 70–350 W, and a solid-to-liquid ratio in the range of 1:60 to 1:300 g/mL. These ranges allow the RSM model to better capture the underlying relationships between the variables and the responses. In explaining the factor interactions in MAE for PCL production, MAE time and microwave power interact to improve the efficiency of the extraction process. Increases in microwave power and an optimized extraction time generally lead to higher extract yield by rapidly heating the solvent and matrix. This results in an enhanced mass transfer rate and improved solubility of antioxidant compounds due to a reduction in surface tension and solvent viscosity with higher microwave power. These factors contribute to better sample wetting and deeper matrix penetration, facilitating the release of antioxidant compounds [30]. However, prolonged heat exposure during the MAE process can cause the degradation of these compounds due to their thermal sensitivity [9]. Phenolic compounds, including flavonoids, are known for their thermal sensitivity, making them prone to degradation or structural changes when exposed to high temperatures. In particular, flavonoids are highly susceptible to oxidation, epimerization, hydrolysis, and polymerization-elevated thermal conditions [31]. In the case of short MAE times with a low solid–liquid ratio, the microwave energy facilitates the diffusion and solubility of flavonoids, enabling effective extraction even with a smaller solvent volume. On the other hand, when both the MAE time and solid–liquid ratio are higher, the increased solvent volume enhances the penetration of the solvent into the matrix, while the extended MAE time allows for a more thorough extraction, leading to higher flavonoid yields. A longer extraction time allows for a more complete extraction of bioactive compounds, including antioxidants, from the matrix. It can be observed that a longer extraction time enhances the DPPH scavenging activity of the extract. This finding is consistent with the results reported by [32] in their study on chardonnay grape marc.
The recommended optimum extraction conditions were determined to be an MAE time of 25 min, a microwave power of 214.24 W, and a solid–liquid ratio of 1:195.76 g/mL, yielding predicted yield, TPC, TFC, and IC50 values of 18.56%, 22.86 mg GAE/g, 13.89 mg QE/g, and 83.30 µg/mL, respectively. These conditions are ideal for producing a polyphenol-rich crude extract of cinnamon leaves. Related research indicates that the methanolic extract of C. iners leaves may contribute to peripheral analgesic effects during the inflammatory phase [33] and inhibit the proliferation of various cancer cell lines, showing significant antikinase activity against MKK1 [34]. The methanolic extract of C. iners leaves demonstrated greater reducing power than the standard antioxidant vitamin E at concentrations of 1.00–2.50 mg/mL, with its reducing power increasing proportionally with concentration [35]. In the case of the medicinal plant Cinnamomum, the total phenolic content (TPC), total flavonoid content (TFC), and antioxidant activity of leaf extracts from several Cinnamomum species (C. burmanni, C. cassia, C. pauciflorum, C. tamala, and C. zeylanica) were compared. The report showed that the extracts of Cinnamomum exhibited potential antioxidant activities, which were positively correlated (R2) with TPC and TFC. Moreover, three flavonoid compounds (quercetin, kaempferol, and quercetrin) were detected by high-performance liquid chromatography coupled with a diode array detector (HPLC-DAD) [36]. The phenolic hydroxyl groups in flavonoids and phenolic compounds within the extract likely enhance its reducing potential by donating electrons, further contributing to its biological activity [37].

5. Conclusions

The MAE conditions were successfully optimized to maximize the production of polyphenol-rich crude extracts from Cinnamomum iners leaves. Using a three-variable FCCD and RSM, the MAE process yielded a reliable second-order polynomial model, demonstrating the effectiveness of the optimization approach. MAE optimal conditions (25 min, 214.24 W, 1:195.76 g/mL) resulted in predicted values of 18.56% for yield, 22.86 mg GAE/g for TPC, 13.89 mg QE/g for TFC, and an IC50 of 83.30 µg/mL for DPPH scavenging activity. MAE efficiently enhances heat and mass transfer through internal microwave heating, rapidly releasing polyphenols. In contrast, the slower, prolonged heating in HRE yields lower antioxidant and polyphenol concentrations after 25 min. This highlights the efficacy of MAE, as microwave-driven heating disrupts cell walls, rapidly releasing compounds and enhancing antioxidant activity. The MAE conditions developed are ideal for producing polyphenol-rich crude extracts from cinnamon leaves, making them valuable in functional foods, industrial applications, and skincare formulations in the cosmetic industry. However, the batch-scale setup used in this study does not fully address the challenges of industrial-scale processing. Investigating the feasibility of scaling up the process using continuous-flow microwave extraction systems represents a potential avenue for future research, to address industrial production requirements. These advancements, combined with the extracts’ antioxidant synergy, position MAE as a promising method for scale-up applications in functional foods and cosmetics.

Author Contributions

Conceptualization, P.S.; methodology, W.B. and T.S.; software, S.L.; validation, P.S. and K.T.; investigation, P.S.; resources, K.T.; writing—original draft preparation, P.S.; writing—review and editing, P.S.; supervision, P.S.; funding acquisition, P.S. All authors have read and agreed to the published version of the manuscript.

Funding

This research was supported by King Mongkut’s University of Technology North Bangkok under Contract No. KMUTNB-65-KNOW-29.

Institutional Review Board Statement

Not applicable.

Informed Consent Statement

Not applicable.

Data Availability Statement

The raw data supporting the conclusions of this article will be made available by the authors on request.

Acknowledgments

The authors express their gratitude to the Faculty of Science, Energy, and Environment, King Mongkut’s University of Technology North Bangkok, for providing instrument support.

Conflicts of Interest

The authors declare no conflicts of interest.

References

  1. Anis, Z.; Sulaiman, O.; Hashim, R.; Mehdi, H.S.; Ghalib, M.R. Radical Scavenging Activity, Total Phenol Content and Antifungal Activity of Cinnamomum iners Wood. Iran. J. Energy Environ. 2012, 3, 74–78. [Google Scholar] [CrossRef]
  2. Mustaffa, F.; Indurkar, J.; Shah, M.; Ismail, S.; Mansor, S.M. Review on Pharmacological Activities of Cinnamomum iners Reinw. ex Blume. Nat. Prod. Res. 2013, 27, 888–895. [Google Scholar] [CrossRef] [PubMed]
  3. Majeed, M.; Hussain, A.I.; Chatha, S.A.; Khosa, M.K.K.; Kamal, G.M.; Kamal, M.A.; Zhang, X.; Liu, M. Optimization Protocol for the Extraction of Antioxidant Components from Origanum vulgare Leaves Using Response Surface Methodology. Saudi J. Biol. Sci. 2016, 23, 389–396. [Google Scholar] [CrossRef] [PubMed]
  4. López-Salazar, H.; Camacho-Díaz, B.H.; Ocampo, M.L.A.; Jiménez-Aparicio, A.R. Microwave-Assisted Extraction of Functional Compounds from Plants: A Review. Bioresources 2023, 18, 6614. [Google Scholar] [CrossRef]
  5. Suttiarporn, P.; Choommongkol, V. Microwave-Assisted Improved Extraction and Purification of Anticancer Nimbolide from Azadirachta indica (Neem) Leaves. Molecules 2020, 25, 2913. [Google Scholar] [CrossRef]
  6. Shang, A.; Luo, M.; Gan, R.-Y.; Xu, X.-Y.; Xia, Y.; Guo, H.; Liu, Y.; Li, H.-B. Effects of Microwave-Assisted Extraction Conditions on Antioxidant Capacity of Sweet Tea (Lithocarpus polystachyus Rehd.). Antioxidants 2020, 9, 678. [Google Scholar] [CrossRef]
  7. Choommongkol, V.; Punturee, K.; Klumphu, P.; Rattanaburi, P.; Meepowpan, P.; Suttiarporn, P. Microwave-Assisted Extraction of Anticancer Flavonoid, 2′,4′-Dihydroxy-6′-Methoxy-3′,5′-Dimethyl Chalcone (DMC), Rich Extract from Syzygium nervosum Fruits. Molecules 2022, 27, 1397. [Google Scholar] [CrossRef]
  8. Weremfo, A.; Abassah-Oppong, S.; Adulley, F.; Dabie, K.; Seidu-Larry, S. Response Surface Methodology as a Tool to Optimize the Extraction of Bioactive Compounds from Plant Sources. J. Sci. Food Agric. 2023, 103, 26–36. [Google Scholar] [CrossRef]
  9. Weremfo, A.; Adulley, F.; Adarkwah-Yiadom, M. Simultaneous Optimization of Microwave-Assisted Extraction of Phenolic Compounds and Antioxidant Activity of Avocado (Persea americana Mill.) Seeds Using Response Surface Methodology. J. Anal. Methods Chem. 2020, 2020, 7541927. [Google Scholar] [CrossRef]
  10. Tomasi, I.T.; Santos, S.C.; Boaventura, R.A.; Botelho, C.M. Optimization of Microwave-Assisted Extraction of Phenolic Compounds from Chestnut Processing Waste Using Response Surface Methodology. J. Clean. Prod. 2023, 395, 136452. [Google Scholar] [CrossRef]
  11. Febriani, H.; Lubis, M.F.; Sumaiyah, S.; Hasibuan, P.A.Z.; Syahputra, R.A.; Astyka, R.; Juwita, N.A. Optimization of Microwave-Assisted Extraction to Obtain a Polyphenol-Rich Crude Extract from Duku (Lansium domesticum Corr.) Leaf and the Correlation with Antioxidant and Cytotoxic Activities. Kuwait J. Sci. 2025, 52, 100315. [Google Scholar] [CrossRef]
  12. Liu, N.; Li, X.; Zhao, P.; Zhang, X.; Qiao, O.; Huang, L.; Guo, L.; Gao, W. A Review of Chemical Constituents and Health-Promoting Effects of Citrus Peels. Food Chem. 2021, 365, 130585. [Google Scholar] [CrossRef] [PubMed]
  13. Safer, A.M.; Afzal, M.; Nomani, M.; Mousa, S.A. Chapter 76—Green Tea Extract in the Management of Hepatic Fibrosis. In Tea in Health and Disease Prevention; Preedy, V.R., Ed.; Academic Press: Cambridge, MA, USA, 2013; pp. 903–909. [Google Scholar]
  14. Ibrahim, F.M.; Abdelsalam, E.; Mohammed, R.S.; Ashour, W.E.S.; Vilas-Boas, A.A.; Pintado, M.; El Habbasha, E.S. Polyphenol-Rich Extracts and Essential Oil from Egyptian Grapefruit Peel as Potential Antioxidant, Antimicrobial, and Anti-Inflammatory Food Additives. Appl. Sci. 2024, 14, 2776. [Google Scholar] [CrossRef]
  15. Phantu, S.; Suttiarporn, P. CMMSE: A Comparison of Model Fitting Using Different Response Surface Designs for Optimizing Microwave-Assisted Simultaneous Distillation and Extraction in Khlu Herbal Tea Essential Oil Production. J. Math. Chem. 2024, 1–18. [Google Scholar] [CrossRef]
  16. Bunmusik, W.; Suttiarporn, P.; Phankaew, T.; Thitisut, P.; Seangwattana, T. The Effects of Solvent-Based Ultrasonic-Assisted Extraction of Bioactive Compounds and Antioxidant Activities from Pigmented Rice Bran. Mater. Today Proc. 2023, 77, 1073–1078. [Google Scholar] [CrossRef]
  17. Tanruean, K.; Poolprasert, P.; Suwannarach, N.; Kumla, J.; Lumyong, S. Phytochemical Analysis and Evaluation of Antioxidant and Biological Activities of Extracts from Three Clauseneae Plants in Northern Thailand. Plants 2021, 10, 117. [Google Scholar] [CrossRef]
  18. Liu, X.; Dong, M.; Chen, X.; Jiang, M.; Lv, X.; Yan, G. Antioxidant Activity and Phenolics of an Endophytic Xylaria sp. from Ginkgo biloba. Food Chem. 2007, 105, 548–554. [Google Scholar] [CrossRef]
  19. Zhou, K.; Yu, L. Effects of Extraction Solvent on Wheat Bran Antioxidant Activity Estimation. LWT Food Sci. Technol. 2004, 37, 717–721. [Google Scholar] [CrossRef]
  20. Ismail-Suhaimy, N.W.; Gani, S.S.A.; Zaidan, U.H.; Halmi, M.I.E.; Bawon, P. Optimizing Conditions for Microwave-Assisted Extraction of Polyphenolic Content and Antioxidant Activity of Barleria lupulina Lindl. Plants 2021, 10, 682. [Google Scholar] [CrossRef]
  21. Hihat, S.; Touati, N.; Sellal, A.; Madani, K. Response Surface Methodology: An Optimal Design for Maximising the Efficiency of Microwave-Assisted Extraction of Total Phenolic Compounds from Coriandrum sativum Leaves. Processes 2024, 12, 1031. [Google Scholar] [CrossRef]
  22. Wang, D.; Lv, J.; Fu, Y.; Shang, Y.; Liu, J.; Lyu, Y.; Yu, X. Optimization of Microwave-Assisted Extraction Process of Total Flavonoids from Salicornia Bigelovii Torr. and Its Hepatoprotective Effect on Alcoholic Liver Injury Mice. Foods 2024, 13, 647. [Google Scholar] [CrossRef] [PubMed]
  23. Zhao, C.N.; Zhang, J.J.; Li, Y.; Meng, X.; Li, H.B. Microwave-Assisted Extraction of Phenolic Compounds from Melastoma sanguineum Fruit: Optimization and Identification. Molecules 2018, 23, 2498. [Google Scholar] [CrossRef] [PubMed]
  24. Karami, Z.; Emam-Djomeh, Z.; Mirzaee, H.A.; Khomeiri, M.; Mahoonak, A.S.; Aydani, E. Optimization of Microwave-Assisted Extraction (MAE) and Soxhlet Extraction of Phenolic Compound from Licorice Root. J. Food Sci. Technol. 2015, 52, 3242–3253. [Google Scholar] [CrossRef] [PubMed]
  25. Boateng, I.D.; Kumar, R.; Daubert, C.R.; Flint-Garcia, S.; Mustapha, A.; Kuehnel, L.; Somavat, P. Sonoprocessing Improves Phenolics Profile, Antioxidant Capacity, Structure, and Product Qualities of Purple Corn Pericarp Extract. Ultrason. Sonochem. 2023, 95, 106418. [Google Scholar] [CrossRef] [PubMed]
  26. Benmoussa, H.; Farhat, A.; Romdhane, M.; Bouajila, J. Enhanced Solvent-Free Microwave Extraction of Foeniculum vulgare Mill. Essential Oil Seeds Using Double Walled Reactor. Arab. J. Chem. 2019, 12, 3863–3870. [Google Scholar] [CrossRef]
  27. Farhat, A.; Benmoussa, H.; Bachoual, R.; Nasfi, Z.; Elfalleh, W.; Romdhane, M.; Bouajila, J. Efficiency of the Optimized Microwave-Assisted Extractions on the Yield, Chemical Composition, and Biological Activities of Tunisian Rosmarinus officinalis L. Essential Oil. Food Bioprod. Process. 2017, 105, 224–233. [Google Scholar] [CrossRef]
  28. Chan, C.H.; Yeoh, H.K.; Yusoff, R.; Ngoh, G.C. A First-Principles Model for Plant Cell Rupture in Microwave-Assisted Extraction of Bioactive Compounds. J. Food Eng. 2016, 188, 98–107. [Google Scholar] [CrossRef]
  29. González-de-Peredo, V.; Vázquez-Espinosa, M.; Espada-Bellido, E.; Ferreiro-González, M.; Barbero, F.; Palma, M.; Carrera, C. Optimization of a Microwave-Assisted Extraction Method for Maximum Flavonols and Antioxidant Activity of Onion Extracts. Antioxidants 2022, 11, 2393. [Google Scholar] [CrossRef]
  30. Nour, A.H.; Oluwaseun, A.R.; Nour, A.H.; Omer, M.S.; Ahmed, N. Microwave-Assisted Extraction of Bioactive Compounds. In Microwave Heating: Electromagnetic Fields Causing Thermal and Non-Thermal Effects; IntechOpen: London, UK, 2021; pp. 1–31. [Google Scholar]
  31. Esparza, I.; Cimminelli, M.J.; Moler, J.A.; Jiménez-Moreno, N.; Ancín-Azpilicueta, C. Stability of Phenolic Compounds in Grape Stem Extracts. Antioxidants 2020, 9, 720. [Google Scholar] [CrossRef]
  32. Garrido, T.; Gizdavic-Nikolaidis, M.; Leceta, I.; Urdanpilleta, M.; Guerrero, P.; de la Caba, K.; Kilmartin, P.A. Optimizing the Extraction Process of Natural Antioxidants from Chardonnay Grape Marc Using Microwave-Assisted Extraction. Waste Manag. 2019, 88, 110–117. [Google Scholar] [CrossRef]
  33. Gertsch, J.; Leonti, M.; Raduner, S.; Rácz, I.; Chen, J.-Z.; Xie, X.-Q.; Altmann, K.-H.; Karsak, M.; Zimmer, A. Beta-Caryophyllene Is a Dietary Cannabinoid. Proc. Natl. Acad. Sci. USA 2008, 105, 9099–9104. [Google Scholar] [CrossRef] [PubMed]
  34. Pang, K.L.; Thong, W.L.; How, S.E. Cinnamomum iners as Mitogen-Activated Protein Kinase Kinase Inhibitor. Int. J. Eng. Technol. 2009, 1, 310–313. [Google Scholar] [CrossRef]
  35. Mustaffa, F.; Indurkar, J.; Ismail, S.; Mordi, M.N.; Ramanathan, S.; Mansor, S.M. Antioxidant Capacity and Toxicity Screening of Cinnamomum iners Standardized Leaves Methanolic Extract. Int. J. Pharmacol. 2010, 6, 888–895. [Google Scholar] [CrossRef]
  36. Prasad, K.N.; Yang, B.; Dong, X.; Jiang, G.; Zhang, H.; Xie, H.; Jiang, Y. Flavonoid Contents and Antioxidant Activities from Cinnamomum Species. Innov. Food Sci. Emerg. Technol. 2009, 10, 627–632. [Google Scholar] [CrossRef]
  37. Shahidi, F.; Wanasundara, P.K.J. Phenolic Antioxidants. Crit. Rev. Food Sci. Nutr. 1992, 32, 67–103. [Google Scholar] [CrossRef]
Figure 1. Solvent-based microwave-assisted extraction (MAE).
Applsci 15 01265 g001
Figure 2. Effects of (a) type of solvent, (b) MAE time, (c) microwave power, and (d) solid–liquid ratio on the yield, TPC, TFC, and DPPH assay of cinnamon leaf extract.
Applsci 15 01265 g002
Figure 3. Response surface 3D plots showing the interactive effect of MAE parameters on (ac) yield, (df) TPC, (gi) TFC, and (jl) IC50.
Applsci 15 01265 g003
Figure 4. (a) Yield profiles of the crude cinnamon leaf extract obtained by MAE and conventional HRE: (b) TPC, (c) TFC, (d) inhibition concentration against DPPH, (e) energy consumption for different extraction times.
Applsci 15 01265 g004
Table 1. MAE independent variable levels in the face-centered central composite design (FCCD).
Independent VariableCodeLevel
−101
MAE time (min)X1 5 15 25
Microwave power (W)X2 70 210 350
Plant leaf-to-solvent ratio (g/mL)X31:601:1801:300
Table 2. The FCCD of the MAE experiment and response data.
RunX1X2X3Y1
(%)
Y2
(mg GAE/g)
Y3
(mg QE/g)
Y4
(µg/mL)
61 (25)−1 (70)1 (1:300) 19.96   ± 0.69 18.00   ± 0.02 10.43   ± 0.18 105.47   ± 0.45
170 (15)0 (210)0 (1:180) 17.06   ± 0.86 22.42   ± 0.94 13.65   ± 0.35 95.65   ± 12.16
140 (15)0 (210)1 (1:300) 20.22   ± 0.52 20.25   ± 0.28 12.01   ± 0.88 95.75   ± 11.24
160 (15)0 (210)0 (1:180) 17.34   ± 0.35 22.84   ± 0.23 13.14   ± 0.25 95.53   ± 0.10
5−1 (5)−1 (70)1 (1:300) 15.51   ± 0.25 20.07   ± 0.12 9.37   ± 0.46 107.43   ± 1.48
130 (15)0 (210)−1 (1:60) 14.70   ± 0.65 19.06   ± 0.21 12.19   ± 0.92 98.30   ± 9.31
41 (25)1 (350)−1 (1:60) 14.26   ± 0.37 17.87   ± 0.49 12.22   ± 0.71 100.20   ± 10.80
7−1 (5)1 (350)1 (1:300) 17.97   ± 0.41 22.08   ± 0.84 11.97   ± 0.76 112.02   ± 0.60
21 (25)−1 (70)−1 (1:60) 15.33   ± 0.77 18.01   ± 0.20 10.78   ± 0.04 93.50   ± 2.25
101 (25)0 (210)0 (1:180) 17.92   ± 0.37 23.23   ± 0.28 14.68   ± 0.72 80.02   ± 3.90
9−1 (5)0 (210)0 (1:180) 17.03   ± 0.33 22.72   ± 0.66 13.33   ± 0.19 90.53   ± 0.51
110 (15)−1 (70)0 (1:180) 16.28   ± 0.80 21.06   ± 0.71 11.68   ± 0.68 113.46   ± 4.73
1−1 (5)−1 (70)−1 (1:60) 11.77   ± 0.45 16.43   ± 0.21 11.86   ± 0.19 114.81   ± 5.96
150 (15)0 (210)0 (1:180) 18.44   ± 0.81 22.22   ± 0.29 12.60   ± 0.11 97.90   ± 6.98
3−1 (5)1 (350)−1 (1:60) 15.31   ± 0.42 18.64   ± 0.47 13.54   ± 0.48 107.36   ± 2.52
180 (15)0 (210)0 (1:180) 17.74   ± 0.13 23.26   ± 0.0913.58 ± 0.08 96.44   ± 0.42
120 (15)1 (350)0 (1:180) 17.53   ± 0.16 23.46   ± 0.47 13.34   ± 0.25 116.85   ± 3.14
190 (15)0 (210)0 (1:180) 17.12   ± 0.52 23.75   ± 0.56 13.42   ± 0.29 90.03   ± 0.69
200 (15)0 (210)0 (1:180) 18.59   ± 0.64 24.05   ± 0.46 13.17   ± 0.3096.30 ± 10.88
81 (25)1 (350)1 (1:300) 18.71   ± 0.59 20.69   ± 0.23 12.06   ± 0.21 120.12   ± 7.25
Table 3. The anticipated second-order polynomial model regression coefficients for yield, TPC, TFC, and IC50.
SourceY1—YieldY2—TPCY3—TFCY4—IC50
F-Valuep-ValueF-Valuep-ValueF-Valuep-ValueF-Valuep-Value
Model20.970.000 a20.830.000 a12.770.000 a24.720.000 a
X118.830.001 a0.870.372 NS0.000.950 NS12.200.006 a
X26.200.032 a16.050.002 a33.360.000 a5.410.042 a
X3112.530.000 a23.430.001 a9.270.012 a8.010.018 a
X120.870.373 NS0.000.966 NS3.280.100 NS29.570.000 a
X225.960.035 a2.830.124 NS10.330.009 a126.000.000 a
X320.940.354 NS58.510.000 a21.080.001 a1.240.291 NS
X1 X222.080.001 a0.670.434 NS0.750.406 NS8.290.016 a
X1 X32.290.161 NS4.350.064 NS6.470.029 a16.930.002 a
X2 X30.510.493 NS1.650.228 NS0.630.445 NS5.650.039 a
Lack of Fit0.770.610 NS1.630.511 NS2.300.191 NS2.180.363 NS
R20.94970.94940.91990.9570
Adj-R20.90440.9038 0.8479 0.9183
Pred-R20.77520.6009 0.5181 0.7673
a p < 0.05; NS not significant.
Table 4. Response variable predictions under optimum MAE settings.
VariableUnitOptimal ConditionModified Optimal
Condition
Extraction timemin25.0025.00
Microwave powerW214.24210
Solid–liquid ratiog/mL1:195.761:196
ResponseUnitPredicted ValuePredicted ValueActual Value
Yield%18.5618.58 19.01   ± 0.23
TPCmg GAE/g22.8622.83 23.10   ± 0.26
TFCmg QE/g13.8913.86 14.01   ± 0.07
Antioxidant activity (IC50)µg/mL83.3083.13 82.11   ± 0.32
Disclaimer/Publisher’s Note: The statements, opinions and data contained in all publications are solely those of the individual author(s) and contributor(s) and not of MDPI and/or the editor(s). MDPI and/or the editor(s) disclaim responsibility for any injury to people or property resulting from any ideas, methods, instructions or products referred to in the content.

