Article

Phenolic Acid Profile and In Vitro Antioxidant and Anticholinesterase Activities of Romanian Wild-Grown Acer spp. (Sapindaceae)

by
Cornelia Bejenaru
1,†,
Adina-Elena Segneanu
2,†,
Ludovic Everard Bejenaru
3,*,
Andrei Biţă
3,†,
Antonia Radu
1,
George Dan Mogoşanu
3,
Maria Viorica Ciocîlteu
4 and
Costel Valentin Manda
4
1
Department of Pharmaceutical Botany, Faculty of Pharmacy, University of Medicine and Pharmacy of Craiova, 2 Petru Rareş Street, 200349 Craiova, Romania
2
Institute for Advanced Environmental Research, West University of Timişoara (ICAM–WUT), 4 Oituz Street, 300086 Timişoara, Romania
3
Department of Pharmacognosy & Phytotherapy, Faculty of Pharmacy, University of Medicine and Pharmacy of Craiova, 2 Petru Rareş Street, 200349 Craiova, Romania
4
Department of Instrumental and Analytical Chemistry, Faculty of Pharmacy, University of Medicine and Pharmacy of Craiova, 2 Petru Rareş Street, 200349 Craiova, Romania
*
Author to whom correspondence should be addressed.
These authors contributed equally to this work.
Appl. Sci. 2025, 15(3), 1235; https://doi.org/10.3390/app15031235
Submission received: 27 December 2024 / Revised: 23 January 2025 / Accepted: 24 January 2025 / Published: 25 January 2025

Abstract

:
This study investigated, for the first time, the phenolic acid profile along with the in vitro antioxidant and acetylcholinesterase (AChE) inhibitory activities of leaves and fruits from five Romanian wild-grown Acer spp. (Sapindaceae): A. campestre L., A. monspessulanum L., A. platanoides L., A. pseudoplatanus L., and A. tataricum L. High-performance liquid chromatography coupled with ultraviolet and mass spectrometry (HPLC/UV/MS) was employed to identify and quantify key phenolic acids, including gallic, caffeic, protocatechuic, chlorogenic, and p-coumaric acids. Total phenolic content (TPC) ranged from 61.48 ± 3.76 to 512.8 ± 20.54 µg gallic acid equivalents (GAE)/mL. Antioxidant activities, assessed through 2,2-diphenyl-1-picrylhydrazyl (DPPH) and 2,2′-azino-bis(3-ethylbenzothiazoline-6-sulfonic acid) (ABTS) assays, demonstrated the strongest radical scavenging capacities for A. tataricum fruits, with half maximal inhibitory concentration (IC50) values of 10.88 ± 3.39 µg/mL and 10.39 ± 2.86 µg/mL, respectively. The ferric-reducing antioxidant power (FRAP) assay revealed the highest reducing power for A. tataricum fruits (1158 ± 48.98 µmol Fe2+/L) and leaves (1119 ± 164.6 µmol Fe2+/L). AChE inhibition was only found in A. tataricum, with an IC50 of 7.91 ± 7.50 mg/mL for leaves and 15.95 ± 8.52 mg/mL for fruits. These results highlight A. tataricum as a promising source of natural antioxidants and neuroprotective agents.

1. Introduction

Acer genus (formerly Aceraceae, now classified under Sapindaceae family) includes trees and more rarely shrubs with opposite, long-petiolate, deciduous leaves that are typically palmately lobed (less commonly entire or pinnately compound). The flowers are often unisexual, greenish or yellowish, sometimes apetalous, actinomorphic, pentamerous, and arranged in inflorescences. The fruit is a double samara, with each of the two nutlets bearing a lateral, reticulately veined wing, which may be membranous or coriaceous [1,2,3,4]. The Acer genus comprises 129 species distributed across the temperate regions of the Northern Hemisphere (Europe, North Africa, Asia, and North America) [1,2,3,4,5,6]. In Europe, fifteen species are found, and five are native to Romania (A. campestre L., A. monspessulanum L., A. platanoides L., A. pseudoplatanus L., A. tataricum L.) [1,2,3,4]. Most Acer spp. are found in China, where there are 99 species, of which 61 are endemic [5,6]. The name of the Acer genus originates from the Latin word meaning “hard”, referring to the strength of the wood of these plants [1]. In Romania, Acer spp. are commonly referred to as “Arţar”, “Paltin”, or “Jugastru”. The popular names for the five native species in Romania are as follows: A. campestre L.—Field Maple (Jugastru); A. monspessulanum L.—Banat Field Maple (Jugastru de Banat); A. platanoides L.—Norway Maple (Arţar, Paltin de câmp); A. pseudoplatanus L.—Sycamore Maple (Paltin, Paltin de munte); A. tataricum L.—Tatar Maple (Arţar tătărăsc, Gladiş) [1,2,3,4].
Acer spp. are utilized in traditional medicine, in the food industry (notably for producing maple syrup as a sweetener), in constructions, and as ornamental plants (valued for their foliage shape and color) or for street planting [5,6,7,8]. In traditional medicine across East Asia, Europe, and North America, 40 species and 11 subspecies of Acer genus are used to treat hypertension and indigestion, as anti-inflammatory agents, for arthralgia, rheumatism, sore throat, pneumonia, and liver and eye diseases, and as emetics [5,6]. In traditional Chinese medicine, more than 20 Acer spp. are employed for therapeutic purposes [5,6]. In northeastern Asia, particularly Japan and Korea, several Acer spp. have been used for years in traditional medicine, including A. maximowiczianum Miq., A. pictum Thunb., A. pycnanthum K. Koch, and A. tegmentosum Maxim. [5]. In Japan, A. pycnanthum has been used for eye care, while in Korea, A. tegmentosum was utilized to treat liver conditions such as hepatitis, cirrhosis, and even hepatic cancer, as well as traumatic hemorrhages [5,8]. In China, A. truncatum Bunge is recommended for angina pectoris and cerebrovascular diseases, whereas A. ginnala Maxim. is used for acute diarrhea and tonsillopharyngitis [5,8,9,10]. In Europe, Acer spp. are less studied and known for their medicinal properties. Therapeutic formulations derived from Acer spp. include extracts made from roots, bark, leaves, flowers, and fruits [5,6,7,8,9,10].
The chemical composition of plants in the Acer genus includes over 331 compounds identified in 34 species, encompassing flavonoids, tannins, diarylheptanoids, phenylpropanoid derivatives, terpenoids, and phytosterols, as well as benzoic acid derivatives, alkaloids, carbohydrates, fatty acids, amino acids, vitamins, and minerals [5,9,10,11]. Flavonoids, found in leaves and/or branches, are the primary components, with more than 62 compounds identified across 21 species. These include flavan-3-ols, flavanonols, anthocyanidins, flavones, flavanones, isoflavones, and chalcones. The main aglycones of these compounds are kaempferol, quercetin, myricetin, apigenin, luteolin, naringenin, and isorhamnetin [5,9]. A total of 41 tannin compounds have been identified, the majority being gallic (hydrolysable) tannins, along with five ellagitannins and four condensed tannins [5,6,12,13]. The known phenylpropanoid derivatives total 74, classified based on their structure into simple phenylpropanoids, lignans, or coumarins [5,6,14]. Fatty acids have been identified in the seed oil of Acer spp., such as A. monspessulanum [15], A. platanoides, A. pseudoplatanus [16], A. truncatum [17,18,19], with γ-linolenic acid playing a significant role among omega-6 fatty acids.
The pharmacological actions of Acer spp. have been increasingly studied over the past 20 years, utilizing various types of extracts, preparations, or natural compounds [5]. Reported activities include hepatoprotective [5,10,12,20], antioxidant [5,11,12,21,22,23], anti-inflammatory [5,12,24,25,26], neuroprotective [5,27,28], antiproliferative [5,12,21,29,30,31], estrogen-like [5,32,33], bone-protective [5,34], antimicrobial [5,21,35], hypoglycemic [5,36], anti-obesity [5,12,20,28,37,38,39], anti-tyrosinase and anti-melanogenic [5,12,40], and skin protective and anti-photoaging [5,12,41,42,43]. Additionally, studies have been conducted to explore the correlation between chemical structure and pharmacological activity [5].
Current data have highlighted aspects of the chemical composition and pharmacological actions of the five Acer spp. that spontaneously grow in Romania. However, the majority of studies in recent years have focused on A. truncatum, a species native to northern China traditionally used for treating cardiovascular diseases. Due to its beneficial properties, it has been introduced to East Asia, Europe, and North America. Studies on A. truncatum have confirmed its antioxidant, antimicrobial, antitumor, anti-inflammatory, and neuroprotective properties [8,14,17,18,19,36,37,44,45,46,47,48]. Additionally, two subspecies of A. tataricum (subsp. ginnala and subsp. theiferum) have been studied for their antioxidant activity, attributed to their rich polyphenol content. The leaves and branches of these subspecies are used to prepare a tea consumed in China as a green tea substitute [49].
Due to their content in toxic dipeptides, such as hypoglycin A (HGA), hypoglycin B (HGB), methylenecyclopropylglycine (MCPrG), and γ-glutamyl-MCPrG, Acer spp. (e.g., A. pseudoplatanus) are responsible for some cases of herbivore poisoning [50,51].
Our paper aimed to investigate, for the first time, the content of phenolic acids in leaves and fruits from Acer spp., which grow spontaneously in Romania, collected from the southwestern region, along with their antioxidant and acetylcholinesterase (AChE) inhibitory activities. Also, the research provides entirely new data in the context of understanding Acer spp. from a therapeutic perspective.

2. Materials and Methods

2.1. Plant Material

The leaves and fruits of wild-grown Acer spp. species were collected during the summer period (June–July 2024) from southwest Romania flora (Oltenia Region). All vegetal samples for analysis were stored in the Herbarium of the Department of Pharmaceutical Botany, Faculty of Pharmacy, University of Medicine and Pharmacy of Craiova. Twenty-four hours before processing for extraction and analysis, the plant material was first air-dried and then deposited in brown paper bags, at room temperature (RT), in a cool and dark area. Endangered or protected herbal species are not included in our research.
In this study, the samples were denoted using a systematic notation to represent different species of the Acer genus and their respective plant parts. This notation facilitated a clear and organized reference to the specific plant species and parts analyzed in the experiments (Table 1).

2.2. Chemicals and Reagents

A variety of high-purity solvents and reagents were employed throughout the experimental procedures to ensure precise and reliable outcomes. The solvents used included ethanol, methanol, acetonitrile, toluene, and ethyl acetate (Merck, Darmstadt, Germany). A HALIOS 12 lab water system (Neptec, Montabaur, Germany) was used for the production of ultrapure water, ensuring the appropriate degree of purity for aqueous solutions and required dilutions. Additionally, for high-performance liquid chromatography (HPLC) assay, formic acid (Merck) was utilized as an additive to enhance the performance of the mobile phases.
Reagents for specific assays and analytical procedures were carefully selected to support the experimental goals. These included Folin–Ciocalteu reagent, sodium carbonate, 2,2-diphenyl-1-picrylhydrazyl (DPPH), 2,2′-azino-bis(3-ethylbenzothiazoline-6-sulfonic acid) (ABTS), potassium persulfate, acetate buffer, 2,4,6-tris(2-pyridyl)-1,3,5-triazine (TPTZ), ferric chloride (FeCl3), ferrous sulfate heptahydrate (FeSO4·7H2O), and hydrochloric acid (HCl) (Sigma-Aldrich, Taufkirchen, Germany). The reagents were tailored for the determination of total phenolic content (TPC), antioxidant activity, and enzymatic assays.
In the AChE inhibition assay, key reagents comprised 1-naphthyl acetate, Fast Blue B salt, and rivastigmine (Sigma-Aldrich), which served as a positive control.
For HPLC analysis, a set of phenolic acid standards, including caffeic acid, chlorogenic acid, p-coumaric acid, ferulic acid, gallic acid, protocatechuic acid, syringic acid, and vanillic acid (Merck Millipore), was used for calibration and compound identification.
High-performance thin-layer chromatography (HPTLC) Silica gel 60 F254 and 20 × 10 cm glass plates were purchased from Merck.

2.3. Sample Preparation

The extraction of plant material was performed using an ultrasound-assisted extraction (UAE) method with 70% ethanol as the solvent. A precise quantity of 0.1 g of finely powdered plant material was mixed with 10 mL of the ethanol solution in a suitable container. This mixture was subjected to ultrasonic treatment using a Bandelin Sonorex Digiplus DL 102H ultrasound bath (Bandelin electronic GmbH & Co. KG, Berlin, Germany–power 100 W; frequency 35 kHz) for 20 min at a controlled temperature of 50 °C. The ultrasonic waves disrupted the plant cell walls, facilitating the release of bioactive compounds into the solvent. Post-extraction, the solution was filtered using a 0.22 μm syringe filter with a WWPTFE membrane (Acrodisc, Pall Corporation, Port Washington, NY, USA) to separate the liquid extract from the solid residue. The resulting extract was utilized for determining total polyphenol content as well as conducting antioxidant and neuroprotection assays.
For the HPLC analysis, 2 mL of the extract was dried under a gentle nitrogen stream to remove the solvent. The dried material was reconstituted with a solvent mixture of water and acetonitrile (9:1, v/v) to ensure compatibility with the HPLC mobile phase system. This step optimized the dissolution of bioactive compounds for chromatographic separation and detection. The reconstituted solution was filtered through a 0.22 μm syringe filter before injection into the HPLC system.

2.4. Preparation of Standards

Standards for the HPLC analysis included eight phenolic acids: caffeic acid, chlorogenic acid, p-coumaric acid, ferulic acid, gallic acid, protocatechuic acid, syringic acid, and vanillic acid. These standards were prepared as stock solutions at a concentration of 1 mg/mL using methanol. Serial dilutions were then made to achieve calibration concentrations ranging from 0.1 μg/mL to 50 μg/mL. A volume of 10 μL was injected into the HPLC system for both standards and samples.

2.5. Total Phenolic Content Assay

TPC was determined by loading 20 μL of the plant extract into a 96-well microplate, followed by the addition of 100 μL of Folin–Ciocalteu reagent. After mixing for three minutes, 80 μL of a 4% sodium carbonate solution was added, and the mixture was stirred for another three minutes. To allow the development of the reaction, the plate was incubated two hours in the dark. The FLUOstar Optima microplate reader (BMG Labtech, Ortenberg, Germany) was used for the absorbance measurement at 620 nm. Gallic acid was used to prepare a standard curve, with calibration solutions ranging from 5 mg/mL to 625 μg/mL. All measurements were performed in triplicate.

2.6. DPPH Antioxidant Assay

For the DPPH assay, 50 μL of each sample was added to a 96-well microplate, followed by serial dilutions to obtain a range of decreasing concentrations. Then, 150 μL of a solution of 0.2 mM DPPH in ethanol was added. The mixtures were incubated in the dark for 30 min at RT, and absorbance was measured at 517 nm using a FLUOstar Optima microplate reader. Antioxidant activity was quantified by calculating the half maximal inhibitory concentration (IC50) value, representing the sample concentration required to inhibit 50% of the DPPH free radicals. All analyses were performed in triplicate.

2.7. ABTS Antioxidant Assay

The ABTS assay involved the addition of 50 μL of sample to a 96-well microplate. Serial dilutions were prepared similar to the previous antioxidant assay, and then 150 μL of the ABTS solution (a mixture of 7.4 mM ABTS and 2.6 mM potassium persulfate) was added. After six minutes, FLUOstar Optima microplate reader was used for the absorbance measurement at 620 nm. The IC50 value was established from a dose–response curve, meaning the concentration that inhibited 50% of ABTS radicals. For all samples, the measurements were executed in triplicate.

2.8. FRAP Antioxidant Assay

For the ferric-reducing antioxidant power (FRAP) assay, the reagent was prepared by combining acetate buffer (pH 3.6), 10 mM TPTZ solution in 40 mM HCl, and 20 mM FeCl3 solution. A calibration curve was generated using Fe2+ standards ranging from 65 μmol/L to 500 μmol/L. In each assay, 10 μL of the sample or standard was added to a 96-well microplate with 190 μL of the freshly prepared FRAP reagent. Reaction mixtures were incubated for 30 min at RT, and absorbance was measured at 595 nm. Results were expressed as μmol Fe2+ equivalents. All samples were analyzed in triplicate.

2.9. Acetylcholinesterase Inhibition Assay

The evaluation of AChE inhibitory activity was conducted in triplicate using a detailed microplate-based assay to determine the inhibitory potential of the tested samples.
Each sample was serially diluted directly on a 96-well microplate to generate a range of concentrations for the analysis. Starting with an initial volume of the stock solution, serial dilutions were performed to ensure the final volume in each well was precisely 50 μL. This systematic approach allowed for a detailed evaluation of the inhibitory effects across varying sample concentrations. To each well containing 50 μL of the samples, 50 μL of 1-naphthyl acetate solution (3 mg/mL in ethanol) was added. This substrate serves as a reactant in the enzymatic reaction catalyzed by AChE. Following the addition of the substrate, 150 μL of AChE solution (3.33 U/mL) was carefully introduced into each well. This step initiated the enzymatic reaction, producing measurable products that reflect enzyme activity. To enable visualization of the reaction and quantify enzyme activity, 50 μL of Fast Blue B salt solution (3 mg/mL in water) was added to the wells. This reagent reacts with the enzymatic products, generating a distinct color that correlates with AChE activity.
Rivastigmine, a recognized AChE inhibitor, was prepared at a concentration of 1 mg/mL in methanol and included in the assay as a positive control. This ensured a reliable reference point for evaluating the inhibitory potential of the test samples.
Absorbance was measured at 595 nm using a using a FLUOstar Optima microplate reader. The data collected was analyzed to calculate the IC50 value for each sample, representing the concentration required to inhibit 50% of AChE activity.

2.10. HPTLC–DPPH Fingerprint

On HPTLC plates, 8 μL of each ethanolic extract was applied as 8 mm bands, employing a CAMAG Linomat 5 applicator (CAMAG, Muttenz, Switzerland). In a twin trough chamber, using toluene–ethyl acetate–formic acid (6:6:1, v/v/v) solvent mixture, the HPTLC plates were developed up to a 90 mm migration distance. Using a hair dryer, the HPTLC plates were dried for five minutes after development. Then, the HPTLC plates were documented, firstly without derivatization under ultraviolet (UV) light at 254 nm and 365 nm and secondly after DPPH derivatization (0.05% DPPH reagent in methanol) for the assessment of antioxidant activity under white light. Phenolic acid standards (caffeic acid, chlorogenic acid, p-coumaric acid, gallic acid, and protocatechuic acid, in that order), each of a 1 mg/mL concentration, were added on HPTLC plates as 2 μL bands.

2.11. HPLC/UV/MS Analysis

HPLC analysis was conducted using a Waters Acquity Arc system equipped with a photodiode array (PDA) detector and a QDa mass detector. Chromatographic separation was performed using a CORTECS C18 column (4.6 × 50 mm, 2.7 μm particle size) maintained at 30 °C. Mobile phases included water with 0.01% formic acid (A) and acetonitrile with 0.01% formic acid (B). The HPLC gradient method began with a mobile phase composition of 99% A, at a constant flow rate of 0.8 mL/min. This initial condition was held for one minute. From 1 to 13 min, the proportion of mobile phase A decreased to 70%. At 13.10 min, the mobile phase composition remained steady at 70% A. Subsequently, from 13.60 to 17.60 min, the composition shifted to 20% A, which was maintained for column cleaning and to remove any strongly retained compounds. After this phase, at 18.10 min, the mobile phase returned to the initial condition of 99% A, and this composition was held until 21.10 min for re-equilibration and preparation for the next injection. Between each injection, the column was equilibrated for 10 min to ensure stability and reproducibility. Samples were maintained at 8 °C during the analysis to preserve their integrity.
Quantification was carried out at 265 nm for gallic acid, protocatechuic acid, vanillic acid, and syringic acid and at 325 nm for chlorogenic acid, caffeic acid, p-coumaric acid, and ferulic acid, while mass confirmation was performed in negative mode using specific mass-to-charge ratios (m/z). These included protocatechuic acid (m/z 153), p-coumaric acid (m/z 163), vanillic acid (m/z 167), gallic acid (m/z 169), caffeic acid (m/z 179), ferulic acid (m/z 193), syringic acid (m/z 197), and chlorogenic acid (m/z 353).

2.12. Statistical Analysis

Statistical analyses were performed to evaluate the relationships between phenolic compounds, TPC, and antioxidant (DPPH, ABTS, FRAP) and AChE inhibitory activities. We assessed the normality of the data distribution using the Shapiro–Wilk test. The strength and direction of linear relationships between the variables were determined by calculation of Pearson’s correlation coefficients. To visualize and explore multivariate relationships and patterns among the measured variables, principal component analysis (PCA) was conducted. All statistical tests and analyses were performed using GraphPad Prism version 9.1.0, which provided comprehensive tools for normality testing, correlation analysis, and multivariate data exploration. Statistical significance was considered at a p-value threshold of less than 0.05 for all tests. All datasets followed a normal distribution, as they passed the normality test (p < 0.05). This confirms the suitability of parametric statistical methods for further analysis.

3. Results

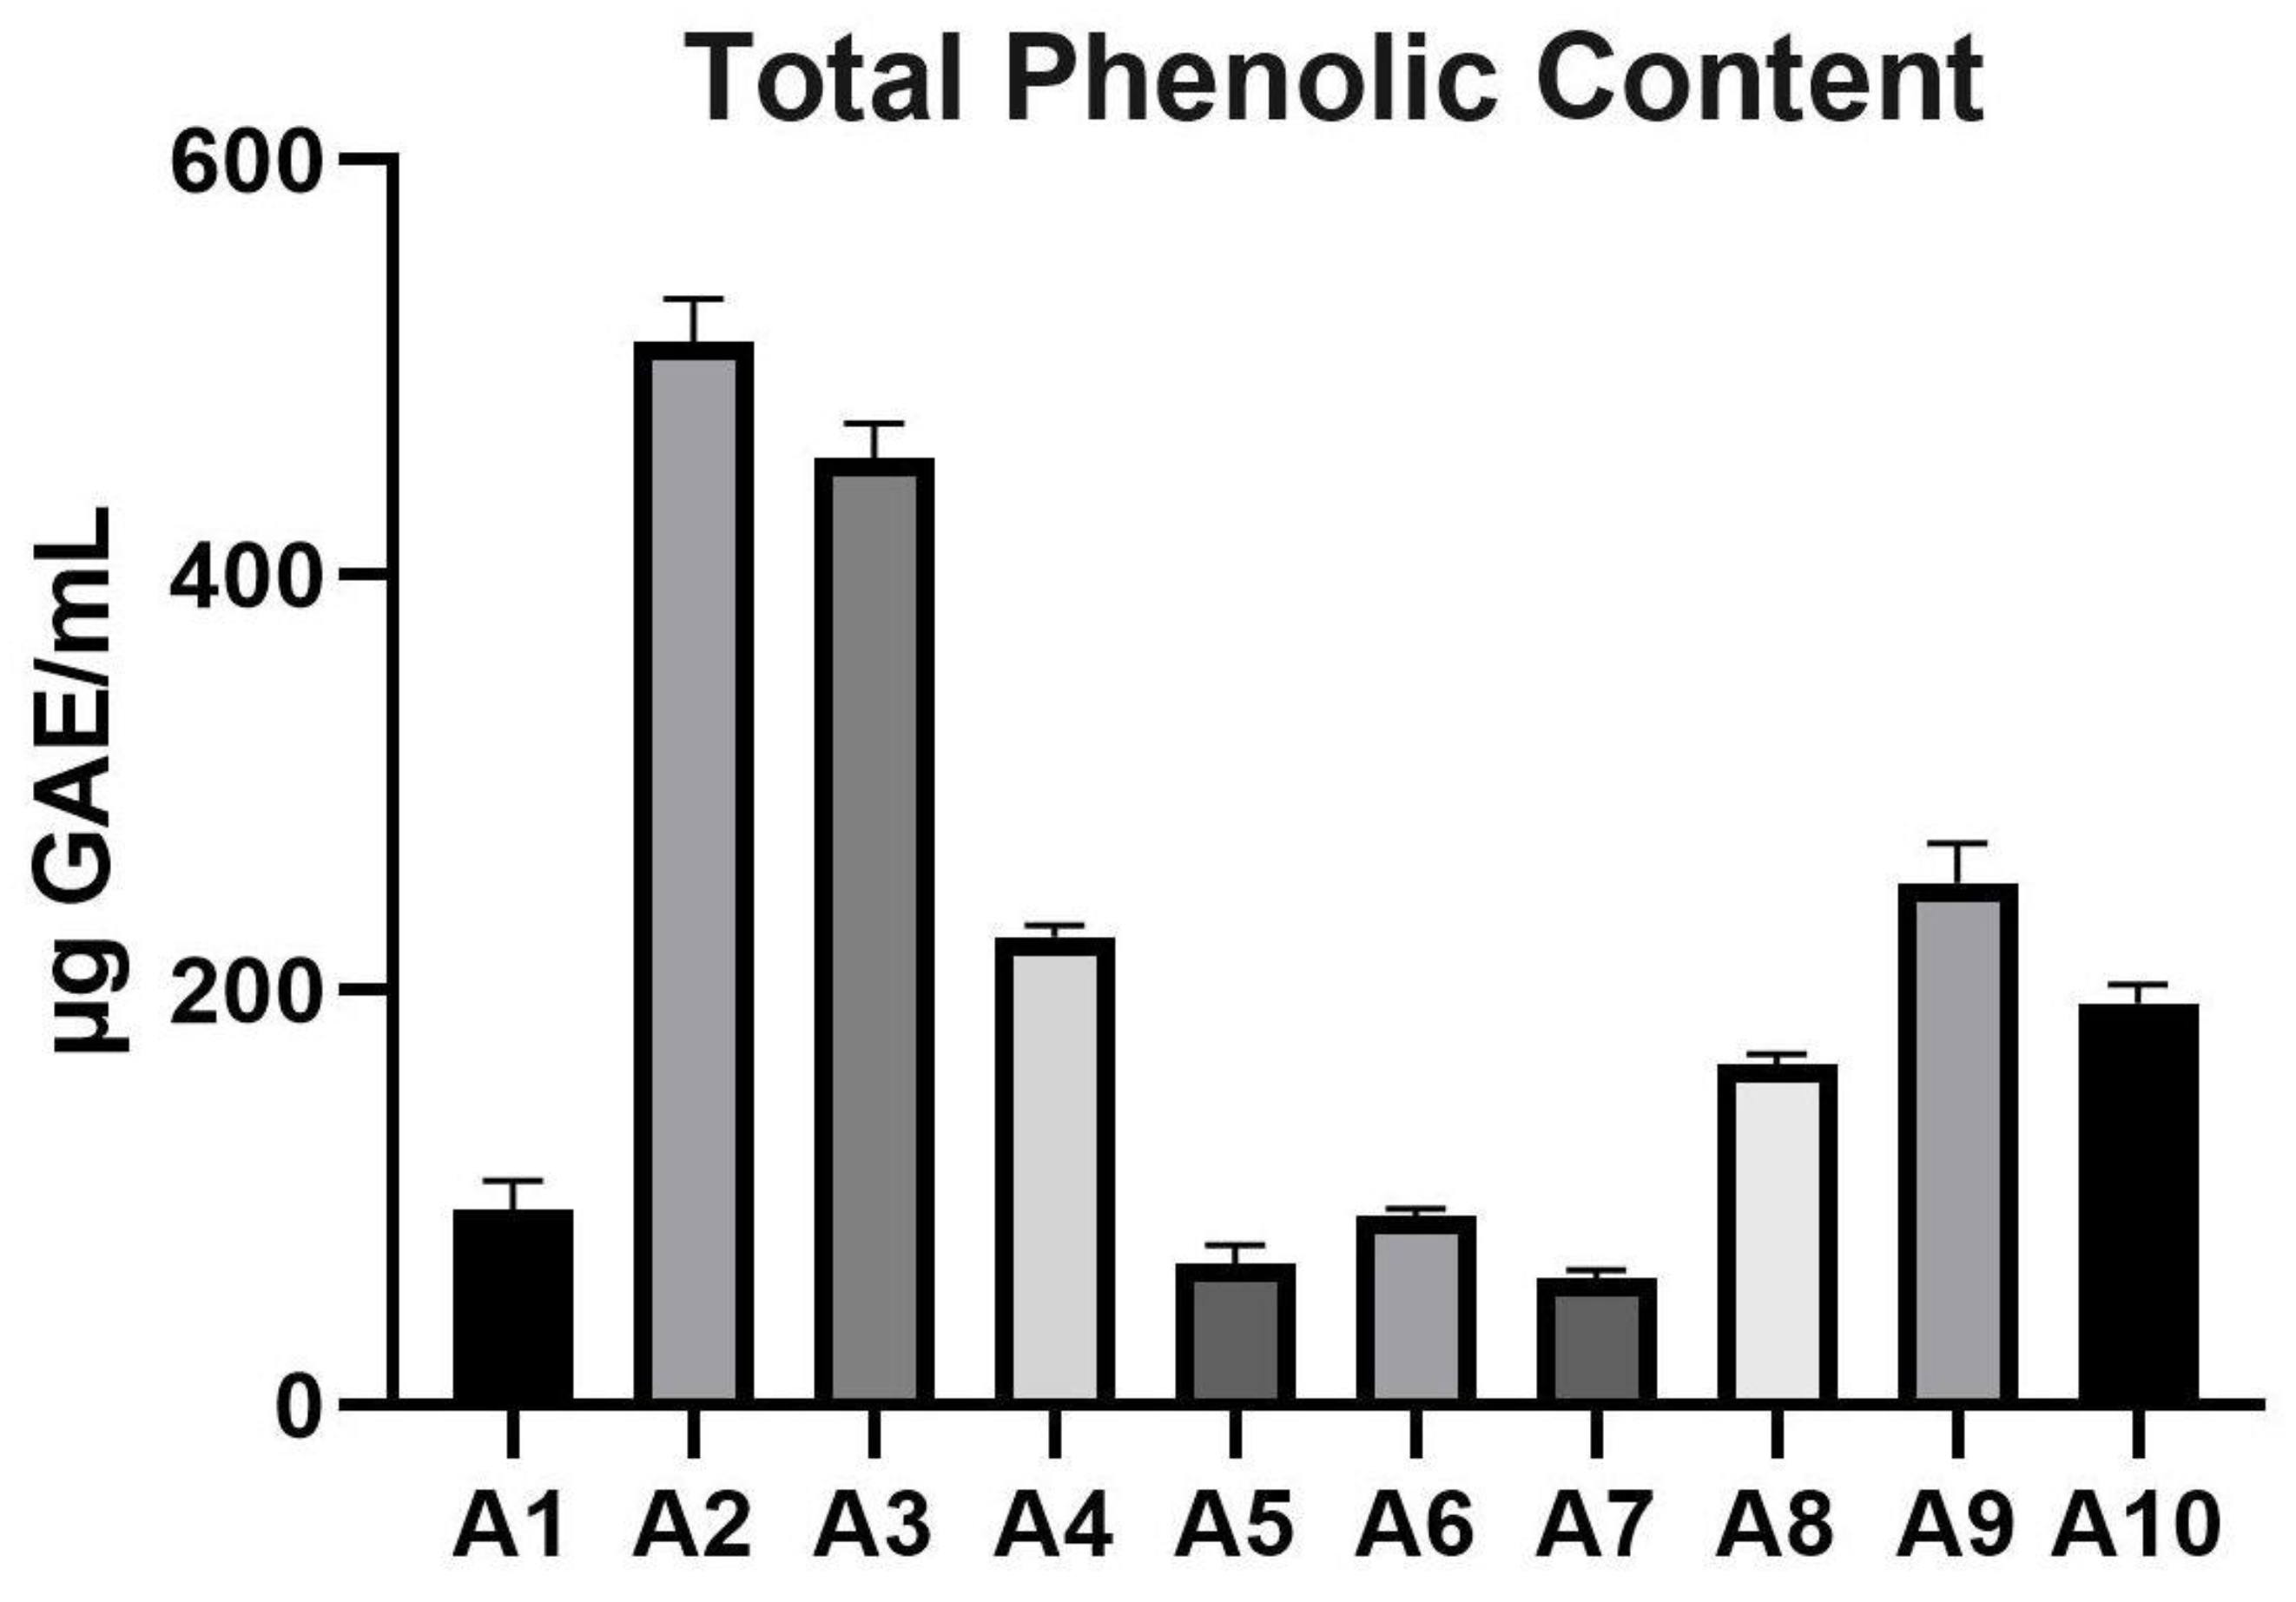
3.1. Total Phenolic Content

TPC of the analyzed Acer samples ranged from 61.48 ± 3.76 μg GAE/mL (A7 sample) to 512.8 ± 20.54 μg GAE/mL (sample A2). Among the samples, A2 exhibited the highest TPC, followed by A3 with 456.1 ± 16.94 μg GAE/mL, while A7 and A5 showed the lowest values, with 61.48 ± 3.76 and 68.45 ± 8.56 μg GAE/mL, respectively. Moderate TPC values were observed in samples such as A9 (251.8 ± 19.06 μg GAE/mL) and A10 (193.8 ± 8.93 μg GAE/mL). The variation in TPC across samples suggests significant diversity in the phenolic composition among Acer spp. The data are presented in Figure 1.

3.2. Antioxidant Activity

DPPH and ABTS antioxidant assays were used to assess the radical scavenging activities of the Acer samples, expressed as IC50 values (μg/mL), where lower values indicate higher antioxidant activity. Sample A3 exhibited the highest antioxidant activity in both assays, with IC50 values of 10.88 ± 3.39 μg/mL for DPPH and 10.39 ± 2.86 μg/mL for ABTS. Sample A2 also showed strong antioxidant potential, with IC50 values of 22.61 ± 3.28 μg/mL (DPPH) and 15.68 ± 3.31 μg/mL (ABTS). In contrast, sample A7 had the weakest antioxidant activity, with IC50 values of 290.2 ± 39.2 μg/mL (DPPH) and 271.2 ± 60.7 μg/mL (ABTS). Moderate antioxidant activities were observed in samples such as A9 (54.25 ± 10.59 μg/mL for DPPH, 37.75 ± 9.7 μg/mL for ABTS) and A10 (60.62 ± 12.72 μg/mL for DPPH, 57.58 ± 13.61 μg/mL for ABTS). These results are highlighted in Table 2.
FRAP assay, measured in μmol Fe2+/L, revealed significant differences in antioxidant capacity among the Acer samples. Sample A2 demonstrated the highest reducing power at 1119 ± 164.6 μmol Fe2+/L, followed closely by sample A3, with 1158 ± 48.98 μmol Fe2+/L. Samples A9 (471 ± 12.87 μmol Fe2+/L) and A10 (378.1 ± 5.64 μmol Fe2+/L) exhibited moderate reducing capacities. In contrast, samples A1 (117.8 ± 7.659 μmol Fe2+/L) and A7 (139.8 ± 5.361 μmol Fe2+/L) displayed the lowest reducing power. These findings underscore substantial variability in the antioxidant potential of the Acer samples, as shown in Table 2.

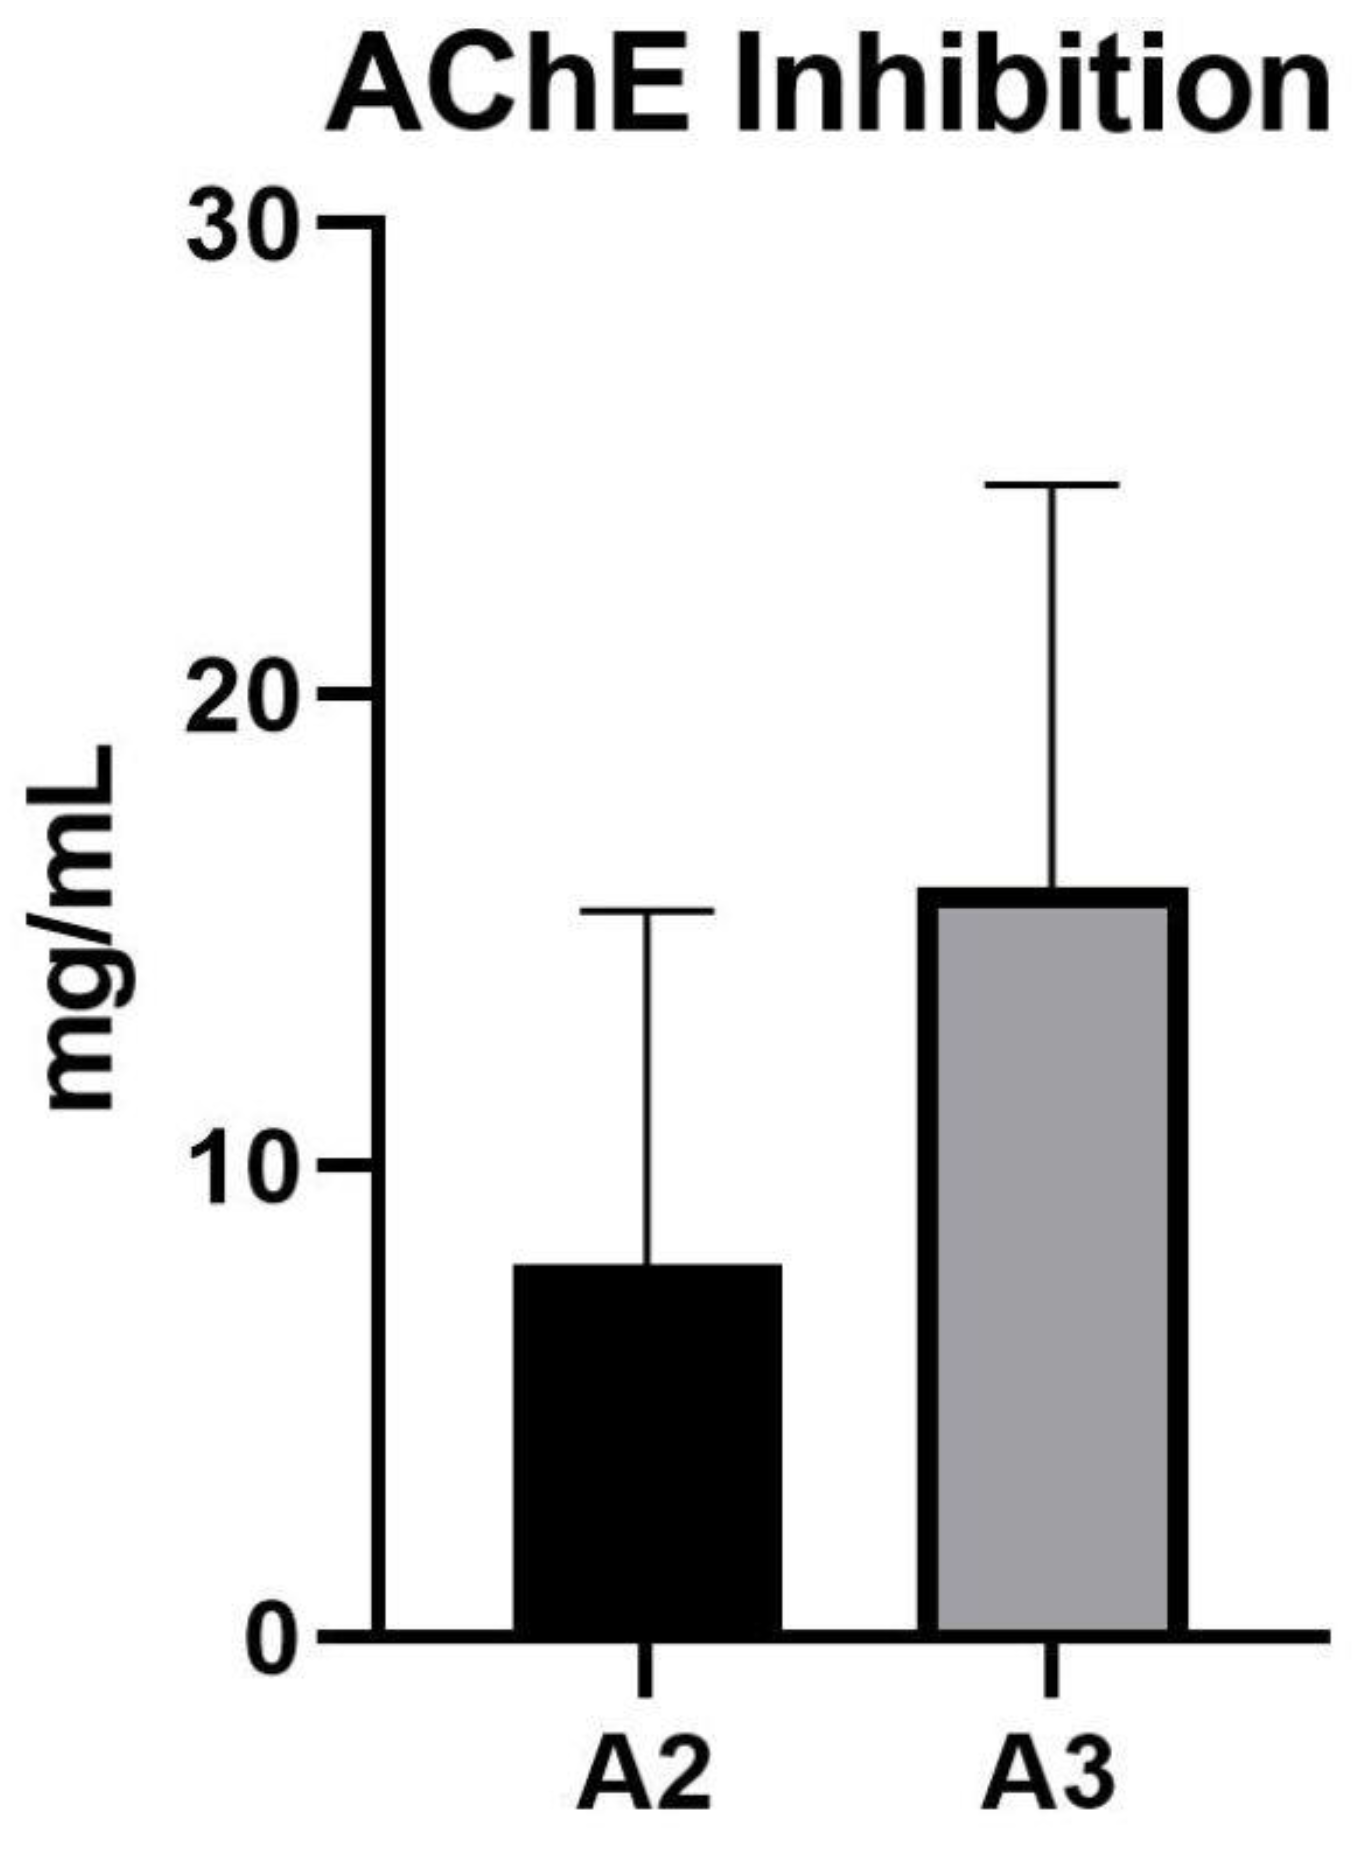
3.3. Acetylcholinesterase Inhibition Activity

AChE inhibition assay revealed that only two Acer samples, A2 and A3, demonstrated a positive inhibitory response. Sample A2 exhibited an IC50 value of 7.908 ± 7.503 mg/mL, while A3 showed a higher inhibitory activity with an IC50 value of 15.95 ± 8.52 mg/mL. These findings suggest that samples A2 and A3 possess potential AChE inhibitory properties, as presented in Figure 2.

3.4. HPLC/UV/MS Analysis

HPLC analysis demonstrated effective separation and reproducibility of the compounds of interest under the selected parameters. The retention times for the identified compounds are presented in Table S1.
HPLC chromatograms for all samples were successfully obtained at both 265 nm and 325 nm, showing distinct peaks corresponding to the compounds of interest. These results highlight the reliability of the method for analyzing the target compounds across the samples (Figures S1 and S2).
The HPLC analysis revealed significant variability in the concentrations of phenolic acids across the Acer samples. Gallic acid was the most abundant compound in several samples, with the highest concentration observed in A6 (39.796 ± 0.809 mg/g). Protocatechuic acid also showed notable concentrations, particularly in samples A6 (6.219 ± 0.227 mg/g) and A3 (6.528 ± 0.101 mg/g). Chlorogenic acid exhibited the highest concentration in A9 (7.488 ± 0.237 mg/g), whereas syringic acid was most prominent in A10 (8.49 ± 0.206 mg/g). Vanillic acid levels were especially high in A10 (11.519 ± 0.168 mg/g), indicating its predominance in this sample. Caffeic acid and ferulic acid were present in lower concentrations overall, with their highest levels detected in A6 (1.323 ± 0.019 mg/g) and A7 (0.665 ± 0.027 mg/g), respectively. p-Coumaric acid was present in moderate amounts in most samples, with the highest concentration observed in A8 (1.401 ± 0.016 mg/g), followed by A7 (0.283 ± 0.013 mg/g). In contrast, syringic acid was detected in significantly higher amounts in A10 (8.49 ± 0.206 mg/g), making it the predominant compound in this sample. Other samples, such as A3 (0.82 ± 0.017 mg/g), also showed moderate levels of syringic acid, while lower levels were observed in the remaining samples (Table 3).

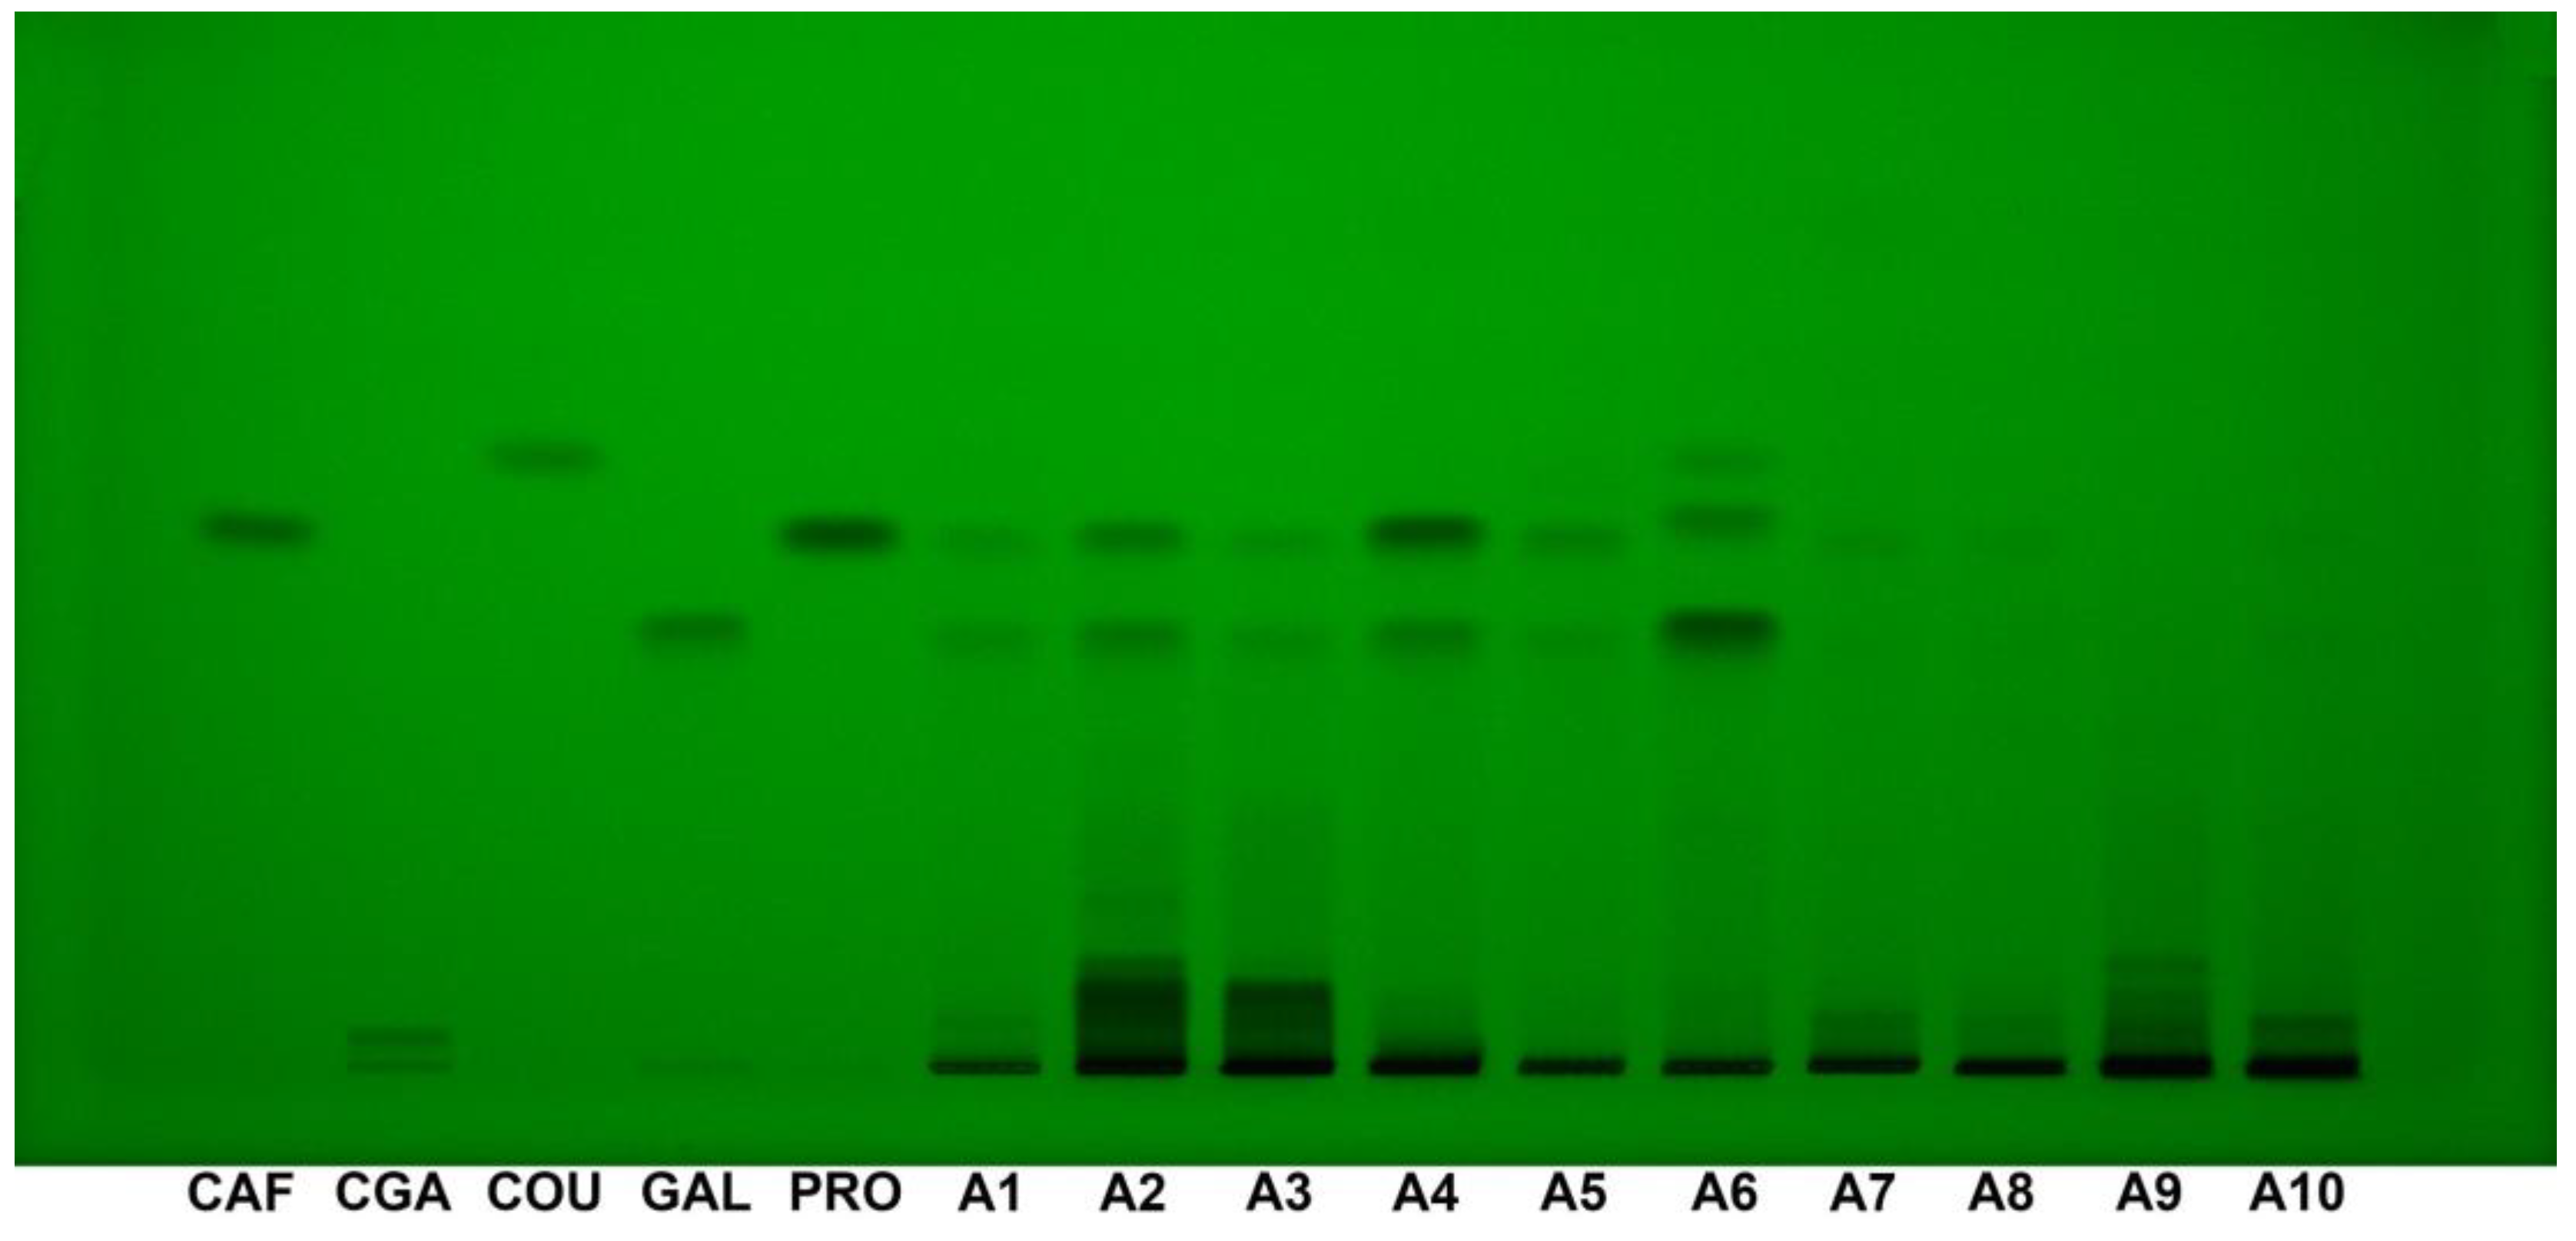
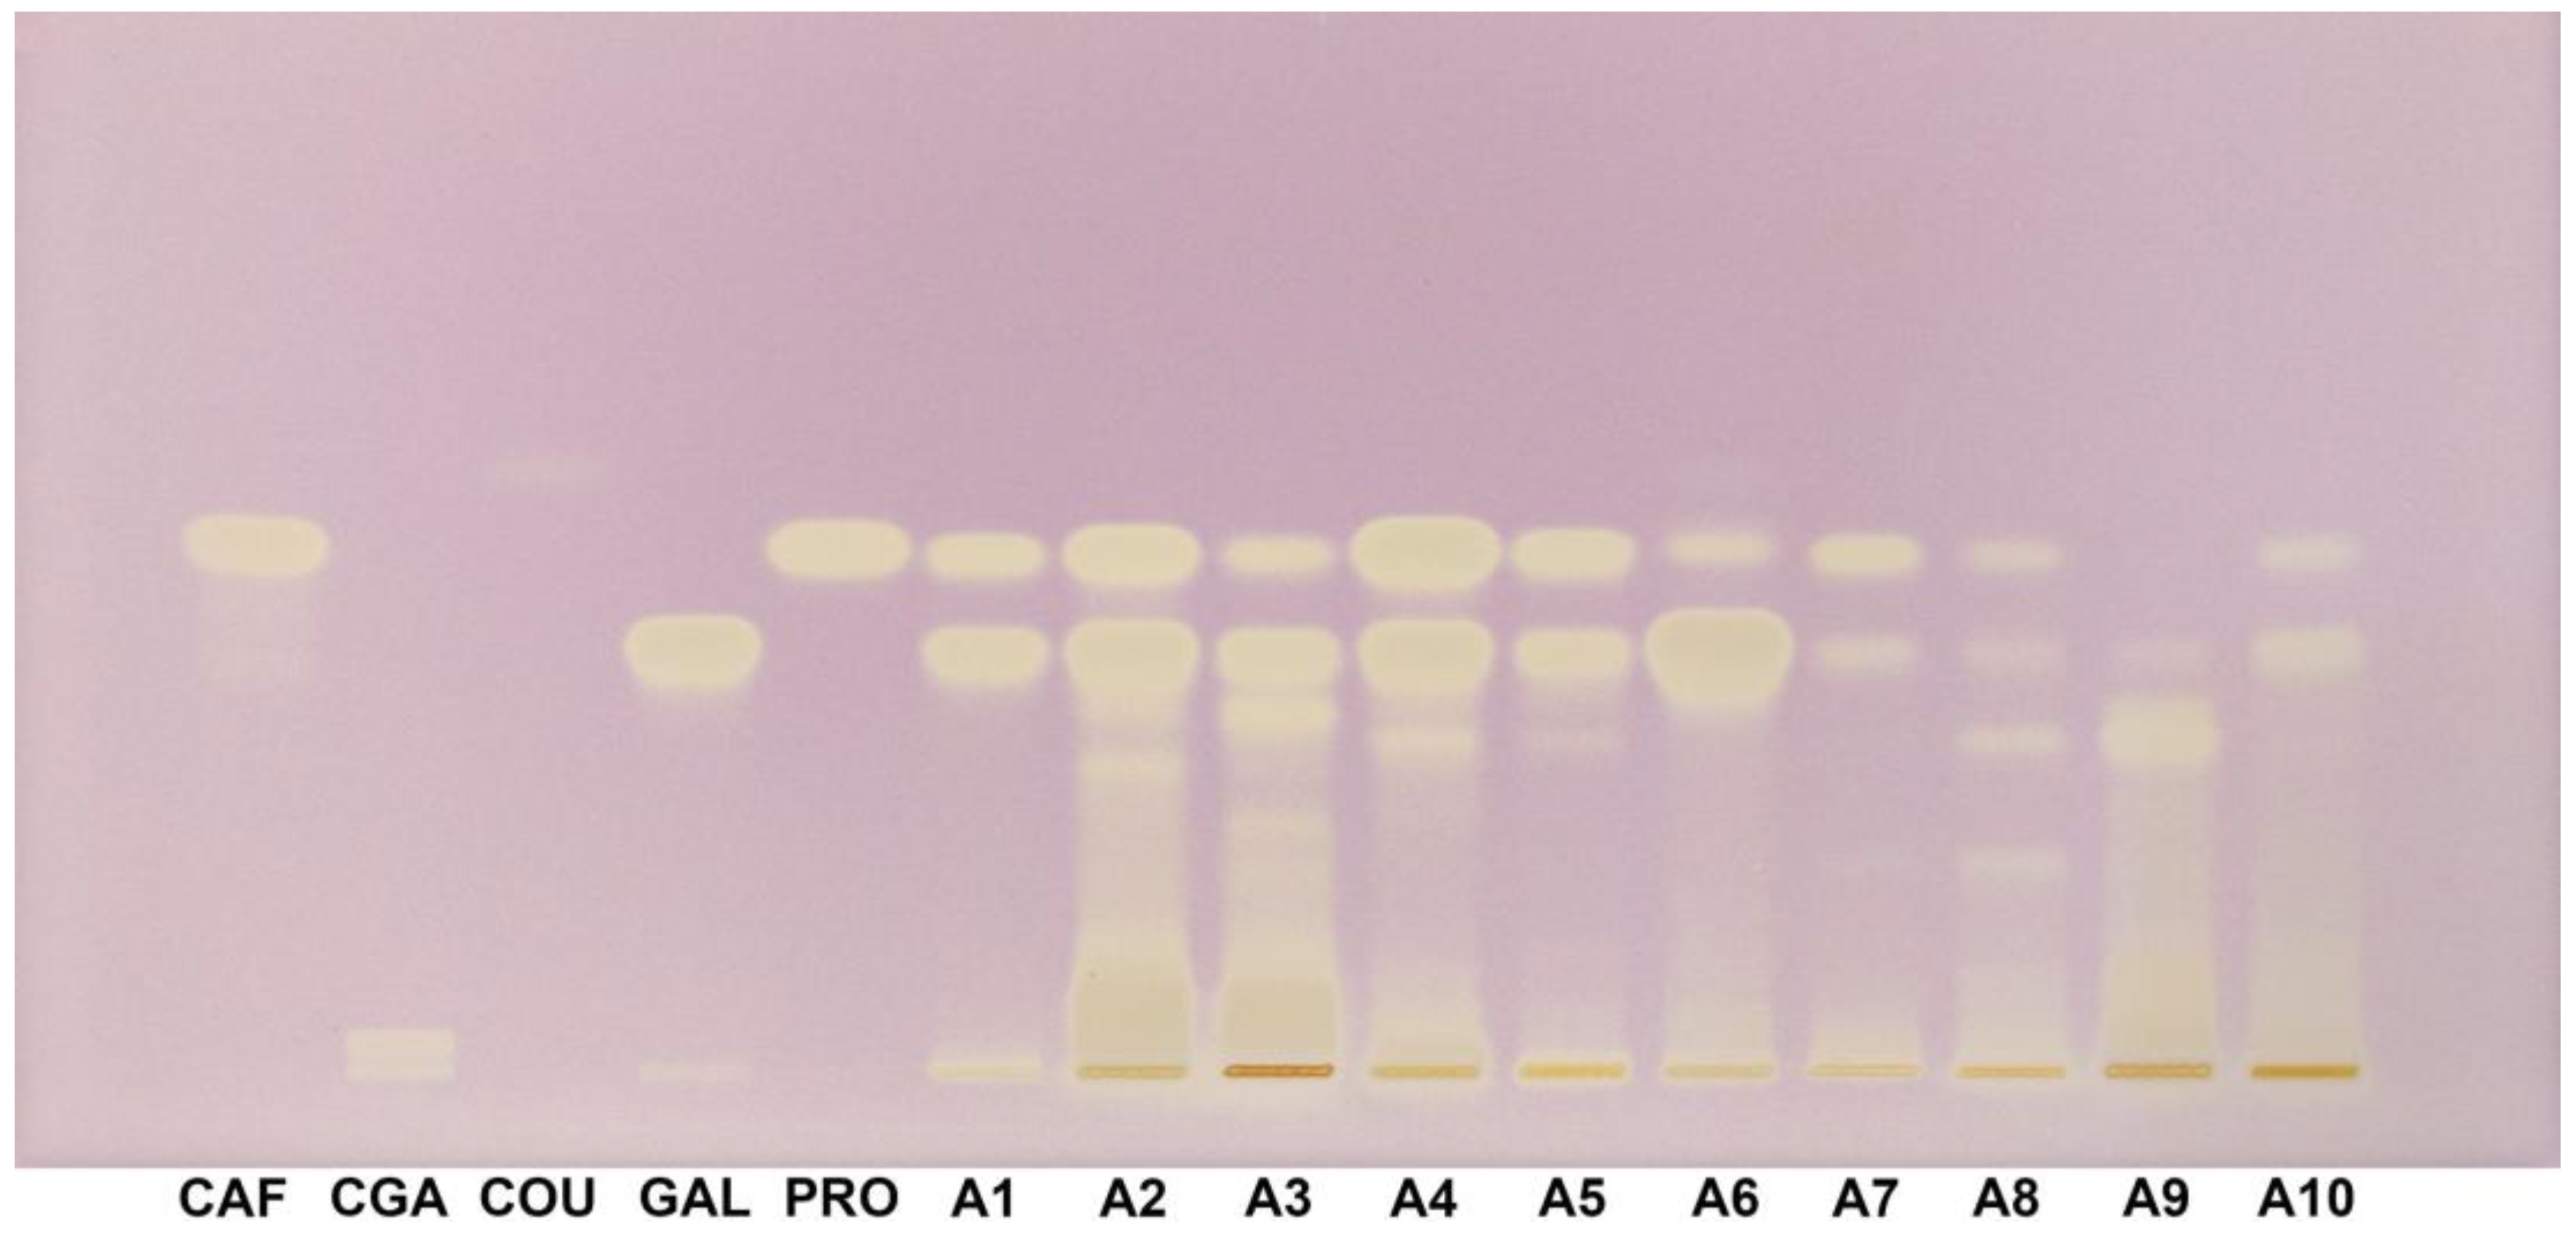
3.5. HPTLC–DPPH Fingerprint

HPTLC fingerprint at 254 nm showed clear and distinct bands for all the standards, including caffeic acid (Rf 0.51), chlorogenic acid (Rf 0.033), p-coumaric acid (Rf 0.58), gallic acid (Rf 0.42), and protocatechuic acid (Rf 0.50). The intensity of the bands was consistent, with all standards being well-visible under these conditions, indicating that this wavelength provides optimal visualization for detecting the tested phenolic compounds (Figure 3).
At 365 nm, the visibility of the standards varied significantly. While caffeic acid (Rf 0.51) and chlorogenic acid (Rf 0.033) exhibited clear and prominent fluorescence, gallic acid (Rf 0.42) and protocatechuic acid (Rf 0.50) were not visible under this wavelength. p-Coumaric acid (Rf 0.58) was faintly visible with very low fluorescence intensity, indicating a reduced ability to detect certain phenolic compounds under these conditions (Figure 4).
Under white light with DPPH staining, the standards demonstrated varying intensities of radical scavenging activity. Caffeic acid (Rf 0.51), chlorogenic acid (Rf 0.033), gallic acid (Rf 0.42), and protocatechuic acid (Rf 0.50) exhibited strong and distinct bands, indicative of high antioxidant activity. However, p-coumaric acid (Rf 0.58) showed only a very faint band with low intensity compared to the other standards, suggesting a weaker radical scavenging response under these conditions (Figure 5).

4. Discussion

The relationship between TPC and the various activities, including in vitro antioxidant (DPPH, ABTS, and FRAP) and AChE inhibitory activities, reveals critical insights into the role of phenolics in bioactive processes. These activities provide a comprehensive understanding of the functional properties of phenolic compounds, particularly in their capacity to influence biological mechanisms [52,53,54,55,56].

4.1. Correlation of TPC with Antioxidant and AChE Inhibitory Activities

Antioxidant activities, as assessed through DPPH, ABTS, and FRAP assays, display significant correlations with TPC, underscoring the central role of phenolic compounds in determining radical scavenging capacity, reducing power, and overall antioxidant potential. DPPH assay, which measures free radical scavenging activity based on IC50 values, demonstrates a strong negative correlation with TPC (r = −0.787, p = 0.007). This finding suggests that higher TPC is associated with lower IC50 values, reflecting stronger antioxidant activity. This relationship can be attributed to the ability of phenolic compounds to donate electrons or hydrogen atoms, neutralizing free radicals effectively. Similarly, ABTS assay also reveals a strong negative correlation with TPC (r = −0.732, p = 0.016). Although DPPH and ABTS employ distinct radical systems, the consistent trends between the two assays reinforce the role of phenolic content as a critical determinant of antioxidant efficacy across varying methodologies.
FRAP assay, which evaluates reducing power, exhibits the strongest positive correlation with TPC (r = 0.969, p < 0.0001). This indicates that higher TPC contributes directly to an increased capacity to reduce Fe3+ ions to Fe2+ ions, a key indicator of reducing power. This robust correlation suggests that phenolic compounds, through their hydroxyl groups, serve as potent electron donors, thereby enhancing the antioxidant potential of the samples. Among the antioxidant activities, the FRAP assay’s relationship with TPC highlights the pivotal role of phenolics in governing reducing power.
In addition to antioxidant activity, TPC also correlates significantly with anti-AChE activity, as assessed by AChE IC50 values. The positive correlation between TPC and AChE inhibitory activity (r = 0.818, p = 0.004) reflects the contribution of phenolic compounds to the inhibition of AChE, an enzyme associated with neurodegenerative disorders like Alzheimer’s disease. Phenolic compounds are known to interact with cholinesterase enzymes through various mechanisms, including hydrogen bonding, hydrophobic interactions, and π–π stacking. This finding underscores the dual role of phenolic content in contributing not only to antioxidant properties but also to neuroprotective effects. The correlation between TPC and AChE inhibitory activity suggests that phenolics play a central role in modulating enzyme activity, further reinforcing their multifunctional bioactivity [57].
The interrelationships among the activities themselves provide additional evidence of the importance of TPC in driving biological efficacy. For example, the strong correlation between DPPH and ABTS activities (r = 0.983, p < 0.0001) reflects overlapping mechanisms of radical scavenging facilitated by phenolic compounds, while the significant relationship between FRAP and anti-AChE activities (r = 0.902, p = 0.00036) highlights the interconnectedness between reducing power and enzyme inhibition. This interplay suggests that phenolic compounds influence these activities through shared biochemical pathways, making TPC a comprehensive marker of their bioactive potential.
Overall, these findings emphasize the critical role of TPC in determining the antioxidant and anti-AChE activities of phenolic-rich samples. The strong correlations between TPC and these bioactivities underscore its importance as a predictor of functional properties, with higher TPC levels associated with enhanced biological efficacy [57]. These insights have significant implications for the development and application of natural products, particularly in therapeutic contexts where antioxidant and neuroprotective properties are desired. By optimizing phenolic content during extraction or processing, the bioactive potential of plant-derived products can be maximized, offering promising avenues for managing oxidative stress and neurodegenerative diseases. This relationship between TPC and biological activities highlights the centrality of phenolic compounds in contributing to health-promoting properties and the potential for their targeted utilization in functional food and pharmaceutical formulations.
Furthermore, when comparing with reference papers analyzing bark extracts [11], our findings are consistent with the established understanding that leaf and fruit extracts generally contain lower polyphenol amounts. This disparity reflects the distinct biological roles of plant tissues; bark serves as a primary protective barrier enriched in polyphenolic compounds to defend against environmental stressors, while leaves and fruits are more metabolically active and less specialized for structural defense [11].

4.2. Correlation of Phenolic Acids with TPC, Antioxidant and AChE Inhibitory Activities

The lack of significant correlations between the quantified phenolic compounds and the measured activities (DPPH, ABTS, FRAP, and anti-AChE) or TPC suggests that the biological activities and overall phenolic content are not solely attributable to the individual compounds analyzed. This is further supported by the HPTLC–DPPH fingerprint, which reveals the presence of more intense antioxidant zones beyond those corresponding to the reference compounds quantified in this study. These findings indicate that other phenolic compounds, not quantified here, or synergistic interactions among various bioactive constituents likely play a pivotal role in determining the observed activities and TPC. The structural diversity and specific properties of the quantified phenolics may not fully align with the mechanisms assessed in the antioxidant and anticholinesterase assays, further explaining the lack of correlation. This underscores the complexity of natural extracts, where the overall activity often arises from the collective influence and synergistic interactions of multiple compounds, rather than the isolated effects of individual phenolics. The HPTLC–DPPH results highlight the importance of considering the entire phenolic profile and unquantified compounds when evaluating the bioactive potential of plant-based samples [52,53,55].
The PCA biplot provides valuable insights into the relationships between phenolic compounds, antioxidant (DPPH, ABTS, FRAP) and anti-AChE activities, and TPC. By illustrating how these variables group and align across two principal components, the PCA plot complements the Pearson’s correlation analysis and highlights patterns of association that may not be immediately evident from numerical correlations alone (Figure 6).
The PCA analysis revealed that the first principal component (PC1) explained 50.94% of the total variance, while the second principal component (PC2) accounted for 30.98%. Together, these two components explained 81.92% of the variability in the dataset, providing a robust summary of the relationships among the analyzed variables. The remaining variance was distributed among subsequent components, which were not considered for further analysis due to their lower explanatory power (Figure 6).
In the PCA plot, gallic acid, caffeic acid, and protocatechuic acid are positioned positively along the first principal component (PC1), which is closely aligned with AChE inhibitory, FRAP, and TPC assays. This grouping suggests that these compounds contribute to the activities associated with this axis. However, when examining the Pearson’s correlation for gallic acid and TPC, the value is weakly negative (r = −0.154, p = 0.67), indicating that gallic acid’s contribution to TPC is either negligible or slightly antagonistic. This apparent contradiction can be explained by the overall complexity of interactions among the phenolic compounds and other bioactive constituents, as the PCA represents collective variance rather than individual direct correlations.
PCA also shows that DPPH and ABTS activities, which are represented as IC50 values, are located on the negative side of PC1, opposite to TPC, FRAP, and AChE inhibitory activities. This positioning reflects the inverse relationships between DPPH and ABTS with TPC, as confirmed by the strong negative Pearson’s correlations (DPPH, r = −0.787, p = 0.007; ABTS, r = −0.732, p = 0.016). These findings underscore the fact that higher TPC, which correlates positively with FRAP and anti-AChE activity, is associated with lower IC50 values for DPPH and ABTS, indicating stronger radical scavenging activity.
Chlorogenic acid and p-coumaric acid, on the other hand, are positioned negatively along PC1 and show limited alignment with TPC, FRAP, and AChE inhibitory assays. This visual separation is consistent with their weak or negligible Pearson’s correlations with these activities, reflecting their minor or indirect roles in contributing to overall bioactivity. Additionally, the proximity of protocatechuic acid to TPC and anti-AChE activity in the PCA plot highlights its moderate influence on these activities, even though its Pearson’s correlations with TPC (r = 0.16, p = 0.66) and AChE inhibitory (r = 0.521, p = 0.12) assays do not reach statistical significance.
Overall, the PCA plot visually reinforces the strong interrelationships among TPC, FRAP, and anti-AChE assays, which are tightly clustered in the same quadrant, suggesting overlapping mechanisms of action and shared contributions to bioactivity. At the same time, the inverse placement of DPPH and ABTS relative to TPC and FRAP reflects their distinct role as measures of radical scavenging activity, inversely related to total phenolics. The PCA also reveals the varying contributions of individual phenolic compounds to these activities, emphasizing the complexity of interactions within the phenolic matrix and the need to consider both individual and collective effects of bioactive compounds.

4.3. Study Limitation

A limitation of the present study, which will be addressed in future work, is the analysis and correlation with more polar compounds, such as flavonoids. This is particularly evident from the HPTLC chromatogram, where compounds with higher affinity for the stationary phase and lower Rf values were not quantified or correlated with the measured activities. These polar compounds may play a significant role in the observed bioactivities, including antioxidant and anticholinesterase effects. Additionally, screening for compounds with potential AChE inhibitory activity directly on the HPTLC plate, similar to the DPPH assay used for antioxidant detection, represents another avenue for extending the study. These efforts will provide a more comprehensive understanding of the phenolic profile and its contributions to the observed biological activities [52].
Furthermore, the selection of phenolic acid standards was limited to the most common and widely studied compounds due to the scarcity of studies on these specific Acer spp. While this approach provided a starting point, it may not fully capture the complete phenolic profile of these plants. Lastly, while full validation of the HPLC method was beyond the scope of this study, the methodology followed established protocols to ensure reliable results. Future work will aim to incorporate method validation to further enhance the robustness of the findings.

5. Conclusions

For the first time, research on Romanian wild-grown Acer spp. highlights the relationships between phenolic compounds, antioxidant activities, anticholinesterase activity, and TPC. While TPC exhibited strong correlations with FRAP and AChE inhibitory activities, the quantified phenolic compounds showed limited individual contributions, suggesting the involvement of unquantified polar compounds and potential synergistic effects. These findings emphasize the complexity of Acer spp. extracts and the need for a broader analysis of bioactive constituents, including flavonoids and HPTLC-based activity screening, to fully understand their functional roles. Future studies will address these limitations to provide a deeper understanding of the bioactive potential of Acer spp.
Among the analyzed species, A. tataricum demonstrated the most potent antioxidant and neuroprotective properties, with both its fruits and leaves showing remarkable bioactivity. This species exhibited the lowest IC50 values for both DPPH and ABTS assays, indicating a strong free radical scavenging capacity. Additionally, its fruits and leaves showed the highest reducing power in the FRAP assay. In terms of neuroprotective potential, A. tataricum had the only AChE inhibitory activity of all Acer spp. studied. These findings highlight the significant contributions of both fruits and leaves from A. tataricum, positioning them as promising sources for bioactive compounds targeting oxidative stress and neurodegenerative conditions.

Supplementary Materials

The following supporting information can be downloaded at https://www.mdpi.com/article/10.3390/app15031235/s1. Figure S1: HPLC/UV (254 nm) chromatograms for Acer (A1–A10) samples; Figure S2: HPLC/UV (365 nm) chromatograms for Acer (A1–A10) samples; Table S1: Retention times for phenolic acid reference compounds.

Author Contributions

Conceptualization, C.B., A.-E.S. and C.V.M.; methodology, L.E.B. and A.B.; validation, A.-E.S., A.B. and M.V.C.; investigation, A.-E.S., A.B., A.R. and M.V.C.; data curation, G.D.M. and C.V.M.; writing—original draft preparation, L.E.B., A.B. and G.D.M.; writing—review and editing, A.B. and G.D.M.; supervision, C.B., A.-E.S. and L.E.B. All authors have read and agreed to the published version of the manuscript.

Funding

This research received no external funding.

Institutional Review Board Statement

Not applicable.

Informed Consent Statement

Not applicable.

Data Availability Statement

The original contributions presented in this study are included in the article. Further inquiries can be directed to the corresponding author.

Conflicts of Interest

The authors declare no conflicts of interest.

References

  1. Săvulescu, T.; Nyarady, E.I. (Eds.) Flora R.P.R., 1st ed.; Romanian Academy Publishing House: Bucharest, Romania, 1958; Volume VI, pp. 220–248. (In Romanian) [Google Scholar]
  2. Tutin, T.G.; Heywood, V.H.; Burges, N.A.; Moore, D.M.; Valentine, D.H.; Walters, S.M.; Webb, D.A. (Eds.) Flora Europaea. Vol. 2: Rosaceae to Umbelliferae, 1st ed.; Cambridge University Press: Cambridge, UK, 1968; pp. 237–239. [Google Scholar]
  3. Ciocârlan, V. Flora ilustrată a României. Pteridophyta et Spermatophyta, 3rd ed.; Ceres Publishing House: Bucharest, Romania, 2009; pp. 442–443. (In Romanian) [Google Scholar]
  4. Sârbu, I.; Ştefan, N.; Oprea, A. Plante vasculare din România. Determinator ilustrat de teren, 1st ed.; Victor B Victor Publishing House: Bucharest, Romania, 2013; pp. 364–366. (In Romanian) [Google Scholar]
  5. Bi, W.; Gao, Y.; Shen, J.; He, C.; Liu, H.; Peng, Y.; Zhang, C.; Xiao, P. Traditional uses, phytochemistry, and pharmacology of the genus Acer (maple): A review. J. Ethnopharmacol. 2016, 189, 31–60. [Google Scholar] [CrossRef] [PubMed]
  6. Fan, Y.; Lin, F.; Zhang, R.; Wang, M.; Gu, R.; Long, C. Acer truncatum Bunge: A comprehensive review on ethnobotany, phytochemistry and pharmacology. J. Ethnopharmacol. 2022, 282, 114572. [Google Scholar] [CrossRef] [PubMed]
  7. Şen Utsukarçi, B.; Bal, Y.; Gurdal, B.; Bardakçı Altan, H.; Yılmaz, F.N.; Döşler, S. Pharmacognostical Studies on Acer campestre L. subsp. campestre. Int. J. Second. Metab. 2020, 7, 126–138. [Google Scholar] [CrossRef]
  8. Sun, Y.; Yu, R.; Liu, Y.; Liu, J.; Zhang, X.; Gong, Z.; Qu, T. Metabolomics Combined with Transcriptomics Analysis Reveals the Regulation of Flavonoids in the Leaf Color Change of Acer truncatum Bunge. Int. J. Mol. Sci. 2024, 25, 13325. [Google Scholar] [CrossRef]
  9. Liu, W.; Ouyang, Y.; Wan, C.P. Flavonoids of the Genus of Acer: A Mini Review. Asian J. Chem. 2013, 25, 7075–7078. [Google Scholar] [CrossRef]
  10. Chang, B.Y.; Jung, Y.S.; Yoon, C.-S.; Oh, J.S.; Hong, J.H.; Kim, Y.-C.; Kim, S.Y. Fraxin Prevents Chemically Induced Hepatotoxicity by Reducing Oxidative Stress. Molecules 2017, 22, 587. [Google Scholar] [CrossRef]
  11. Royer, M.; Diouf, P.N.; Stevanovic, T. Polyphenol contents and radical scavenging capacities of red maple (Acer rubrum L.) extracts. Food Chem. Toxicol. 2011, 49, 2180–2188. [Google Scholar] [CrossRef]
  12. García-Pérez, M.-E.; Kasangana, P.-B.; Stevanovic, T. Bioactive Molecules from Myrianthus arboreus, Acer rubrum, and Picea mariana Forest Resources. Molecules 2023, 28, 2045. [Google Scholar] [CrossRef]
  13. Geoffroy, T.R.; Meda, N.R.; Stevanovic, T. Suitability of DPPH spiking for antioxidant screening in natural products: The example of galloyl derivatives from red maple bark extract. Anal. Bioanal. Chem. 2017, 409, 5225–5237. [Google Scholar] [CrossRef]
  14. Dong, L.-P.; Ni, W.; Dong, J.-Y.; Li, J.-Z.; Chen, C.-X.; Liu, H.-Y. A New Neolignan Glycoside from the Leaves of Acer truncatum. Molecules 2006, 11, 1009–1014. [Google Scholar] [CrossRef]
  15. Aouinti, H.; Touhami, I.; Khouja, M.; Messaoud, C.; Khaldi, A. Chemical composition analysis of seed oil from the three wild Tunisian provenances of Acer monspessulanum L. J. New Sci. 2022, 90, 5106–5112. [Google Scholar] [CrossRef]
  16. Hovanet, M.V.; Dociu, N.; Dinu, M.; Ancuceanu, R.; Morosan, E.; Oprea, E. A Comparative Physico-chemical Analysis of Acer platanoides and Acer pseudoplatanus Seed Oils. Rev. Chim. 2015, 66, 987–991. Available online: https://revistadechimie.ro/Articles.asp?ID=4562 (accessed on 5 December 2024).
  17. Le, X.; Zhang, W.; Sun, G.; Fan, J.; Zhu, M. Research on the Differences in Phenotypic Traits and Nutritional Composition of Acer truncatum Bunge Seeds from Various Regions. Foods 2023, 12, 2444. [Google Scholar] [CrossRef] [PubMed]
  18. Qi, Y.; Huang, Y.; Dong, Y.; Zhang, W.; Xia, F.; Bai, H.; Stevanovic, Z.D.; Li, H.; Shi, L. Effective Improvement of the Oxidative Stability of Acer truncatum Bunge Seed Oil, a New Woody Oil Food Resource, by Rosemary Extract. Antioxidants 2023, 12, 889. [Google Scholar] [CrossRef]
  19. Chang, P.; Ma, J.; Xin, H.; Wang, S.; Chen, Z.; Hong, X.; Zhang, B.; Li, L. Comparative Study of the Fatty Acid Composition of the Acer truncatum Bunge from Different Producing Areas. Forests 2022, 13, 1409. [Google Scholar] [CrossRef]
  20. Li, L.; Ma, H.; Liu, T.; Ding, Z.; Liu, W.; Gu, Q.; Mu, Y.; Xu, J.; Seeram, N.P.; Huang, X.; et al. Glucitol-Core Containing Gallotannins-Enriched Red Maple (Acer rubrum) Leaves Extract Alleviated Obesity via Modulating Short-Chain Fatty Acid Production in High-Fat Diet-Fed Mice. J. Funct. Foods 2020, 70, 103970. [Google Scholar] [CrossRef]
  21. Kausar, F.; Farooqi, M.-A.; Farooqi, H.-M.-U.; Salih, A.-R.-C.; Khalil, A.-A.-K.; Kang, C.-w.; Mahmoud, M.H.; Batiha, G.-E.-S.; Choi, K.-h.; Mumtaz, A.-S. Phytochemical Investigation, Antimicrobial, Antioxidant and Anticancer Activities of Acer cappadocicum Gled. Life 2021, 11, 656. [Google Scholar] [CrossRef]
  22. Bhatta, S.; Ratti, C.; Poubelle, P.E.; Stevanovic, T. Nutrients, Antioxidant Capacity and Safety of Hot Water Extract from Sugar Maple (Acer saccharum M.) and Red Maple (Acer rubrum L.) Bark. Plant Foods Hum. Nutr. 2018, 73, 25–33. [Google Scholar] [CrossRef]
  23. Meda, N.R.; Poubelle, P.E.; Stevanovic, T. Antioxidant Capacity, Phenolic Constituents and Toxicity of Hot Water Extract from Red Maple Buds. Chem. Biodivers. 2017, 14, e1700028. [Google Scholar] [CrossRef]
  24. Yim, N.-H.; Park, E.; Cho, W.-K.; Kim, Y.-H.; Ma, J.Y. Therapeutic Effects of Acer palmatum Thumb. Leaf Extract (KIOM-2015E) on Benzalkonium Chloride-Induced Dry Eye in a Mouse Model. Int. J. Mol. Sci. 2022, 23, 14964. [Google Scholar] [CrossRef]
  25. Meda, N.R.; Stevanovic, T.; Poubelle, P.E. Anhydroglucitol-core gallotannins from red maple buds modulate viability of human blood neutrophils. Toxicol. Vitro 2019, 60, 76–86. [Google Scholar] [CrossRef] [PubMed]
  26. Kim, Y.-H.; Oh, T.W.; Park, E.; Yim, N.-H.; Park, K.I.; Cho, W.K.; Ma, J.Y. Anti-Inflammatory and Anti-Apoptotic Effects of Acer palmatum Thumb. Extract, KIOM-2015EW, in a Hyperosmolar-Stress-Induced In Vitro Dry Eye Model. Nutrients 2018, 10, 282. [Google Scholar] [CrossRef] [PubMed]
  27. Lee, D.-S.; Cha, B.-Y.; Woo, J.-T.; Kim, Y.-C.; Jang, J.-H. Acerogenin A from Acer nikoense Maxim Prevents Oxidative Stress-Induced Neuronal Cell Death through Nrf2-Mediated Heme Oxygenase-1 Expression in Mouse Hippocampal HT22 Cell Line. Molecules 2015, 20, 12545–12557. [Google Scholar] [CrossRef] [PubMed]
  28. Kim, J.H.; Lee, S.; Cho, E.J. The Protective Effects of Acer okamotoanum and Isoquercitrin on Obesity and Amyloidosis in a Mouse Model. Nutrients 2020, 12, 1353. [Google Scholar] [CrossRef] [PubMed]
  29. Son, S.-Y.; Choi, J.-H.; Kim, E.-B.; Yin, J.; Seonu, S.-Y.; Jin, S.-Y.; Oh, J.-Y.; Lee, M.-W. Chemopreventive Activity of Ellagitannins from Acer pseudosieboldianum (Pax) Komarov Leaves on Prostate Cancer Cells. Plants 2023, 12, 1047. [Google Scholar] [CrossRef]
  30. Farooqi, H.M.U.; Sammantasinghar, A.; Kausar, F.; Farooqi, M.A.; Chethikkattuveli Salih, A.R.; Hyun, K.; Lim, J.-H.; Khalil, A.A.K.; Mumtaz, A.S.; Choi, K.H. Study of the Anticancer Potential of Plant Extracts Using Liver Tumor Microphysiological System. Life 2022, 12, 135. [Google Scholar] [CrossRef]
  31. González-Sarrías, A.; Li, L.; Seeram, N.P. Effects of Maple (Acer) Plant Part Extracts on Proliferation, Apoptosis and Cell Cycle Arrest of Human Tumorigenic and Non-Tumorigenic Colon Cells. Phytother. Res. 2012, 26, 995–1002. [Google Scholar] [CrossRef]
  32. Nguyen, Q.N.; Lee, S.R.; Kim, B.; Hong, J.-H.; Jang, Y.S.; Lee, D.E.; Pang, C.; Kang, K.S.; Kim, K.H. Estrogenic Activity of 4-Hydroxy-Benzoic Acid from Acer tegmentosum via Estrogen Receptor α-Dependent Signaling Pathways. Plants 2022, 11, 3387. [Google Scholar] [CrossRef]
  33. Lee, S.R.; Park, Y.J.; Han, Y.B.; Lee, J.C.; Lee, S.; Park, H.-J.; Lee, H.-J.; Kim, K.H. Isoamericanoic Acid B from Acer tegmentosum as a Potential Phytoestrogen. Nutrients 2018, 10, 1915. [Google Scholar] [CrossRef]
  34. Ha, H.; Shim, K.-S.; Kim, T.; An, H.; Lee, C.-J.; Lee, K.J.; Ma, J.Y. Water Extract of Acer tegmentosum Reduces Bone Destruction by Inhibiting Osteoclast Differentiation and Function. Molecules 2014, 19, 3940–3954. [Google Scholar] [CrossRef]
  35. Phong, N.V.; Min, B.S.; Yang, S.Y.; Kim, J.A. Inhibitory Effect of Coumarins and Isocoumarins Isolated from the Stems and Branches of Acer mono Maxim. against Escherichia coli β-Glucuronidase. Appl. Sci. 2022, 12, 10685. [Google Scholar] [CrossRef]
  36. Zhang, X.-Y.; Liu, Y.-H.; Liu, D.-Z.; Xu, J.-Y.; Zhang, Q. Insulin-Mimic Components in Acer truncatum Leaves: Bio-Guided Isolation, Annual Variance Profiling and Regulating Pathway Investigated by Omics. Pharmaceuticals 2021, 14, 662. [Google Scholar] [CrossRef] [PubMed]
  37. Liang, Y.; Kong, F.; Ma, X.; Shu, Q. Inhibitory Effect of Acer truncatum Bunge Seed Coat Extract on Fatty Acid Synthase, Differentiation and Lipid Accumulation in 3T3-L1 Adipocytes. Molecules 2022, 27, 1324. [Google Scholar] [CrossRef] [PubMed]
  38. Cho, H.-H.; Lee, S.-J.; Kim, S.-H.; Jang, S.-H.; Won, C.; Kim, H.-D.; Kim, T.H.; Cho, J.-H. Acer tegmentosum Maxim Inhibits Adipogenesis in 3t3-l1 Adipocytes and Attenuates Lipid Accumulation in Obese Rats Fed a High-Fat Diet. Nutrients 2020, 12, 3753. [Google Scholar] [CrossRef]
  39. Kim, J.H.; Lee, S.; Cho, E.J. Flavonoids from Acer okamotoanum Inhibit Adipocyte Differentiation and Promote Lipolysis in the 3T3-L1 Cells. Molecules 2020, 25, 1920. [Google Scholar] [CrossRef]
  40. Ma, H.; Xu, J.; DaSilva, N.A.; Wang, L.; Wei, Z.; Guo, L.; Johnson, S.L.; Lu, W.; Xu, J.; Gu, Q.; et al. Cosmetic applications of glucitol-core containing gallotannins from a proprietary phenolic-enriched red maple (Acer rubrum) leaves extract: Inhibition of melanogenesis via down-regulation of tyrosinase and melanogenic gene expression in B16F10 melanoma cells. Arch. Dermatol. Res. 2017, 309, 265–274. [Google Scholar] [CrossRef]
  41. Li, H.; Roy, T.; Boateng, S.T.; He, H.; Liu, C.; Liu, W.; Li, D.; Wu, P.; Seeram, N.P.; Chamcheu, J.C.; et al. Standardized Pomegranate (Pomella®) and Red Maple (Maplifa®) Extracts and Their Phenolics Protect Type I Collagen by the Inhibition of Matrix Metalloproteinases, Collagenase, and Collagen Cross-Linking. Molecules 2022, 27, 7919. [Google Scholar] [CrossRef]
  42. Jin, Y.-J.; Ji, Y.; Jang, Y.-P.; Choung, S.-Y. Acer tataricum subsp. ginnala Inhibits Skin Photoaging via Regulating MAPK/AP-1, NF-κB, and TGFβ/Smad Signaling in UVB-Irradiated Human Dermal Fibroblasts. Molecules 2021, 26, 662. [Google Scholar] [CrossRef]
  43. Ma, H.; Guo, H.; Liu, C.; Wan, Y.; Seeram, N.P. Protective Effects of a Red Maple (Acer rubrum) Leaves Extract on Human Keratinocytes against H2O2-induced Oxidative Stress. FASEB J. 2018, 32, 656.33. [Google Scholar] [CrossRef]
  44. Liu, J.; Liang, S.; Qin, K.; Jia, B.; Ren, Z.; Yang, X.; Yang, X. Acer truncatum leaves extract modulates gut microbiota, improves antioxidant capacity, and alleviates lipopolysaccharide-induced inflammation in broilers. Poult. Sci. 2023, 102, 102951. [Google Scholar] [CrossRef]
  45. Chen, X.; Song, Y.; Song, W.; Han, J.; Cao, H.; Xu, X.; Li, S.; Fu, Y.; Ding, C.; Lin, F.; et al. Multi-omics reveal neuroprotection of Acer truncatum Bunge Seed extract on hypoxic-ischemia encephalopathy rats under high-altitude. Commun. Biol. 2023, 6, 1001. [Google Scholar] [CrossRef] [PubMed]
  46. Chen, X.; Song, W.; Song, Y.; Cao, H.; Xu, X.; Li, S.; Fu, Y.; Xue, T.; Ding, C.; Lin, F.; et al. Lipidomics reveal the cognitive improvement effects of Acer truncatum Bunge seed oil on hypoxic-ischemic encephalopathy rats. Food Funct. 2023, 14, 6610–6623. [Google Scholar] [CrossRef] [PubMed]
  47. Song, W.; Zhang, K.; Xue, T.; Han, J.; Peng, F.; Ding, C.; Lin, F.; Li, J.; Sze, F.T.A.; Gan, J.; et al. Cognitive improvement effect of nervonic acid and essential fatty acids on rats ingesting Acer truncatum Bunge seed oil revealed by lipidomics approach. Food Funct. 2022, 13, 2475–2490. [Google Scholar] [CrossRef] [PubMed]
  48. Mohsenpour, H.; Pesce, M.; Patruno, A.; Bahrami, A.; Pour, P.M.; Farzaei, M.H. A Review of Plant Extracts and Plant-Derived Natural Compounds in the Prevention/Treatment of Neonatal Hypoxic-Ischemic Brain Injury. Int. J. Mol. Sci. 2021, 22, 833. [Google Scholar] [CrossRef] [PubMed]
  49. Bi, W.; Shen, J.; Gao, Y.; He, C.; Peng, Y.; Xiao, P. Ku-jin tea (Acer tataricum subsp. ginnala or A. tataricum subsp. theiferum), an underestimated functional beverage rich in antioxidant phenolics. J. Funct. Foods 2016, 24, 75–84. [Google Scholar] [CrossRef]
  50. El-Khatib, A.H.; Engel, A.M.; Weigel, S. Co-Occurrence of Hypoglycin A and Hypoglycin B in Sycamore and Box Elder Maple Proved by LC-MS/MS and LC-HR-MS. Toxins 2022, 14, 608. [Google Scholar] [CrossRef]
  51. Renaud, B.; Kruse, C.-J.; François, A.-C.; Grund, L.; Bunert, C.; Brisson, L.; Boemer, F.; Gault, G.; Ghislain, B.; Petitjean, T.; et al. Acer pseudoplatanus: A Potential Risk of Poisoning for Several Herbivore Species. Toxins 2022, 14, 512. [Google Scholar] [CrossRef]
  52. Kamiński, P.; Gruba, M.; Fekner, Z.; Tyśkiewicz, K.; Kobus, Z. The Influence of Water Extraction Parameters in Subcritical Conditions and the Shape of the Reactor on the Quality of Extracts Obtained from Norway Maple (Acer platanoides L.). Processes 2023, 11, 3395. [Google Scholar] [CrossRef]
  53. Zhang, M.; Choe, J.; Bu, T.; Liu, S.; Kim, S. Comparison of Antioxidant Properties and Metabolite Profiling of Acer pseudoplatanus Leaves of Different Colors. Antioxidants 2023, 12, 65. [Google Scholar] [CrossRef]
  54. Kim, I.; Ha, J.-H.; Jeong, Y. Optimization of Extraction Conditions for Antioxidant Activity of Acer tegmentosum Using Response Surface Methodology. Appl. Sci. 2021, 11, 1134. [Google Scholar] [CrossRef]
  55. Atroune, F.; Chaker, S.; Djebbar, R.; Dahmani-Megrerouche, M. Comparative evaluation of phenolics content and antioxidant activity of leaves and branches of field maple (Acer campestre) from two populations of Northeastern Algeria. An. Univ. Oradea Fasc. Biol. 2019, 26, 7–13. Available online: https://www.bioresearch.ro/2019-1.html (accessed on 5 December 2024).
  56. Yang, L.; Yin, P.; Fan, H.; Xue, Q.; Li, K.; Li, X.; Sun, L.; Liu, Y. Response Surface Methodology Optimization of Ultrasonic-Assisted Extraction of Acer truncatum Leaves for Maximal Phenolic Yield and Antioxidant Activity. Molecules 2017, 22, 232. [Google Scholar] [CrossRef] [PubMed]
  57. Meng, R.; Ou, K.; Chen, L.; Jiao, Y.; Jiang, F.; Gu, R. Response Surface Optimization of Extraction Conditions for the Active Components with High Acetylcholinesterase Inhibitory Activity and Identification of Key Metabolites from Acer truncatum Seed Oil Residue. Foods 2023, 12, 1751. [Google Scholar] [CrossRef] [PubMed]
Figure 1. TPC of the analyzed Acer (A1–A10) samples. GAE: gallic acid equivalents; TPC: total phenolic content.
Applsci 15 01235 g001
Figure 2. AChE inhibitory activity IC50 values for Acer (A2 and A3) samples. AChE: acetylcholinesterase; IC50: half-maximal inhibitory concentration.
Applsci 15 01235 g002
Figure 3. HPTLC fingerprint (254 nm, without derivatization) for Acer (A1–A10) samples and phenolic acid reference bands. CAF: caffeic acid; CGA: chlorogenic acid; COU: p-Coumaric acid; GAL: gallic acid; PRO: protocatechuic acid.
Applsci 15 01235 g003
Figure 4. HPTLC fingerprint (365 nm, without derivatization) for Acer (A1–A10) samples and phenolic acid reference bands. For A4 and A7 samples, the red bands that appear in the solvent front are due to chlorophyll content. CAF: caffeic acid; CGA: chlorogenic acid; COU: p-Coumaric acid; GAL: gallic acid; PRO: protocatechuic acid.
Applsci 15 01235 g004
Figure 5. HPTLC–DPPH fingerprint (white light) for Acer (A1–A10) samples and phenolic acids reference bands. CAF: caffeic acid; CGA: chlorogenic acid; COU: p-Coumaric acid; GAL: gallic acid; PRO: protocatechuic acid.
Applsci 15 01235 g005
Figure 6. PCA highlights the relationships between phenolic acid content, TPC, and antioxidant (DPPH, ABTS, FRAP) and AChE inhibitory activities. ABTS: 2,2′-Azino-bis(3-ethylbenzothiazoline-6-sulfonic acid; AChE: acetylcholinesterase; DPPH: 2,2-Diphenyl-1-picrylhydrazyl; FRAP: ferric-reducing antioxidant power; PCA: principal component analysis; TPC: total phenolic content.
Applsci 15 01235 g006
Table 1. Sample coding of plant material.
SampleSpecies/Vegetal ProductDate/Site of Collection (Southwest Romania Flora)Voucher Specimen
A1A. pseudoplatanus/folium1 July 2024/Craiova City, Dolj CountyACER-PPT-2024-0701
A2A. tataricum/folium12 June 2024/Craiova City, Dolj CountyACER-TAT-2024-0612
A3A. tataricum/fructus
A4A. campestre/folium12 June 2024/Craiova City, Dolj CountyACER-CAM-2024-0612
A5A. campestre/fructus
A6A. pseudoplatanus/fructus1 July 2024/Craiova City, Dolj CountyACER-PPT-2024-0701
A7A. platanoides/folium7 July 2024/Craiova City, Dolj CountyACER-PLT-2024-0707
A8A. platanoides/fructus
A9A. monspessulanum/folium21 July 2024/Dubova Village, Mehedinţi CountyACER-MON-2024-0721
A10A. monspessulanum/fructus
Table 2. Values (mean ± SD) of in vitro antioxidant (DPPH, ABTS, and FRAP) assays for analyzed Acer (A1–A10) samples.
SampleDPPH IC50 (μg/mL)ABTS IC50 (μg/mL)FRAP (μmol Fe2+/L)
A1137.4 ± 51.9132.5 ± 27.3117.8 ± 7.659
A222.61 ± 3.2815.68 ± 3.311119 ± 164.6
A310.88 ± 3.38510.39 ± 2.8611158 ± 48.98
A463.14 ± 8.9650.45 ± 10.89310.6 ± 18.36
A5226.9 ± 32212.7 ± 63.3154.4 ± 9.225
A6138.2 ± 20.479.29 ± 17.3294.5 ± 26.92
A7290.2 ± 39.2271.2 ± 60.7139.8 ± 5.361
A881.78 ± 25.2757.28 ± 15.97354.7 ± 20.75
A954.25 ± 10.5937.75 ± 9.7471 ± 12.87
A1060.62 ± 12.7257.58 ± 13.61378.1 ± 5.64
ABTS: 2,2′-Azino-bis(3-ethylbenzothiazoline-6-sulfonic acid); DPPH: 2,2-Diphenyl-1-picrylhydrazyl; FRAP: ferric-reducing antioxidant power; IC50: half-maximal inhibitory concentration.; SD: standard deviation.
Table 3. Concentrations (mean ± SD) of phenolic acids quantified in Acer (A1–A10) samples.
SampleCaffeic Acid (mg/g)Chlorogenic Acid (mg/g)p-Coumaric Acid (mg/g)Ferulic Acid (mg/g)Gallic Acid (mg/g)Protocatechuic Acid (mg/g)Syringic Acid (mg/g)Vanillic Acid (mg/g)
A10.003 ± 0.0010.005 ± 0.0010.012 ± 0.0010.001 ± 0.0010.977 ± 0.0150.169 ± 0.0020.012 ± 0.0010.24 ± 0.01
A20.122 ± 0.0040.114 ± 0.0040.024 ± 0.0010.109 ± 0.0054.75 ± 0.2051.171 ± 0.0210.459 ± 0.0072.076 ± 0.036
A30.043 ± 0.0010.14 ± 0.0040.062 ± 0.0010.19 ± 0.0045.929 ± 0.2046.528 ± 0.1010.82 ± 0.0170.863 ± 0.021
A40.35 ± 0.0090.07 ± 0.0020.158 ± 0.0020.08 ± 0.00214.05 ± 0.4731.04 ± 0.0120.081 ± 0.0020.436 ± 0.007
A50.071 ± 0.0010.011 ± 0.0010.091 ± 0.0040.029 ± 0.0012.878 ± 0.0632.145 ± 0.0290.009 ± 0.0010.21 ± 0.005
A61.323 ± 0.0190.302 ± 0.0090.227 ± 0.0020.01 ± 0.00139.796 ± 0.8096.219 ± 0.2270.154 ± 0.0030.173 ± 0.005
A70.312 ± 0.0092.016 ± 0.0350.283 ± 0.0130.665 ± 0.0272.19 ± 0.1041.371 ± 0.0620.235 ± 0.0072.613 ± 0.122
A80.105 ± 0.0010.239 ± 0.0041.401 ± 0.0160.025 ± 0.0010.94 ± 0.0242.304 ± 0.0480.091 ± 0.0032.167 ± 0.052
A90.282 ± 0.0057.488 ± 0.2371.04 ± 0.0160.471 ± 0.0191.15 ± 0.0140.001 ± 00.001 ± 02.317 ± 0.041
A100.622 ± 0.0061.648 ± 0.070.412 ± 0.0150.061 ± 0.0022.926 ± 0.1192.459 ± 0.0318.49 ± 0.20611.519 ± 0.168
Disclaimer/Publisher’s Note: The statements, opinions and data contained in all publications are solely those of the individual author(s) and contributor(s) and not of MDPI and/or the editor(s). MDPI and/or the editor(s) disclaim responsibility for any injury to people or property resulting from any ideas, methods, instructions or products referred to in the content.

