Article

Research on Influencing Factors of Promotion of Prefabricated Housing in Hainan Province Based on BPNN–DEMATEL

1
Sanya Science and Education Innovation Park, Wuhan University of Technology, Sanya 572000, China
2
School of Civil Engineering and Architecture, Wuhan University of Technology, Wuhan 430070, China
3
School of Civil Engineering, Tsinghua University, Beijing 100084, China
*
Author to whom correspondence should be addressed.
Appl. Sci. 2025, 15(3), 1116; https://doi.org/10.3390/app15031116
Submission received: 9 December 2024 / Revised: 13 January 2025 / Accepted: 18 January 2025 / Published: 23 January 2025

Abstract

:
In order to solve the problem of the lack of an index system of influencing factors and an unclear evolution path of prefabricated housing development in Hainan Province, a method of identifying key influencing factors and analyzing the evolution path based on a back propagation neural network (BPNN) and decision experiment and evaluation laboratory (DEMATEL) was proposed. Firstly, the index system of influencing factors was constructed based on grounded theory; then, the key influencing factors were revealed through an expert survey and a BPNN-optimized DEMATEL model; finally, the evolution path of key influencing factors was explored. The research results show that factors F1 (imperfect standards and specifications), F2 (imperfect incentives), F9 (lack of motivation for corporate strategic transformation), F14 (insufficient market demand), and F17 (ununified design product standards) are the top five key influencing factors. Among the three basic paths and three composite paths, the weight of the composite path is higher than that of the basic path, and the degree of influence gradually increases with the complexity of direct and indirect effects between key influencing factors. In addition to coupling the basic path with key influencing factors, the composite path can also be obtained through the interaction evolution of the basic path.

1. Introduction

In order to implement the dual-carbon strategy of “carbon peaking in 2030 and carbon neutrality in 2060”, my country attaches great importance to the prominent role of new building systems and their products in energy conservation and carbon reduction [1]. As an innovative model in the field of construction, prefabricated construction has the characteristics of factory production, standardized design, and modular construction. It has significant advantages in energy-saving, carbon reduction, solid waste reduction, and resource recycling. It has become a new development concept and has facilitated key measures for new productivity in the construction industry [2]. Hainan Province, as a tropical island province in my country, has unique ecological environment advantages and geographical location advantages. These advantages complement the implementation of the strategic goal of building a national clean energy free trade island and provide important support for the application of green and low-carbon technologies in the construction field. As an important part of its development strategy, prefabricated housing has become an important means to promote the development of green buildings in Hainan Province due to its short construction cycle, energy-saving, environmental protection, and strong adaptability. Although Hainan Province has broad potential for the development of prefabricated housing, due to its unique geographical location, industrial structure, and enterprise development, its prefabricated housing development stage is late and the cycle lags [3]. It faces technology, market, and policy difficulties, and practical challenges in various aspects, such as funding, have seriously hindered the high-quality green development of prefabricated housing in Hainan Province [4]. These problems urgently need to be solved through scientific research and systematic analysis. Therefore, systematically identifying the key influencing factors of the promotion of prefabricated housing in Hainan Province and analyzing its dynamic evolution path can not only provide a scientific decision-making basis for policy makers, but can also provide theoretical support for the high-quality promotion of prefabricated housing, which is also important for Hainan cleanliness. The construction of an energy free trade island and the realization of the “double carbon” strategic goal are of great significance.
In recent years, prefabricated housing has received widespread attention due to its significant advantages in energy-saving, emission reduction and rapid construction. Research has shown that prefabricated homes have significant potential to improve energy efficiency. In 2018, Yue Teng et al. [5] used the PRISMA (the Preferred Reporting Items for Systematic Reviews and Meta-Analyses method) method to compare the energy efficiency of traditional houses and prefabricated houses. The results showed that prefabricated housing achieves 15.6% carbon emission reduction compared to traditional housing. In 2020, Jianli Hao et al. [6] evaluated the carbon emission reduction potential of prefabricated houses and traditional houses in the materialization stage based on BIM (Building Information Modeling). The carbon emissions of prefabricated houses in this stage were reduced by about 15%. Research on the social benefits of prefabricated housing is also increasing. In 2022, Sha Liu et al. [7] used TBL (Team-Based Learning) theory and SD (System Dynamics) to analyze the benefit parameters of prefabricated housing. Research shows that the construction of prefabricated housing improves resource utilization, and when the resource utilization rate increases by 20%, construction waste is reduced by 34.55%, and land protection increases by 29.29%. In addition, the development of prefabricated housing can not only promote local economic growth, but can also optimize the employment structure of workers, increasing job positions by approximately 132%. A number of studies have been conducted to discuss the factors influencing the promotion of prefabricated housing. In 2018, Xiaolong Gan et al. [8] used SEM (Structural Equation Modeling) to analyze the obstacles to the transformation of my country’s construction industry in relation to prefabricated housing, mainly including incomplete laws and regulations, lack of professional skills, and low standardization. In 2019, Ibrahim Y. Wuni et al. [9] used SEM to analyze the driving factors of prefabricated technology and believed that innovation and sustainability are key factors in the promotion of prefabricated technology. In 2020, Pei Dang et al. [10] identified 27 factors from the literature and interviews, used the entropy method and fuzzy analytic hierarchy process to rank these factors, studied the top five key factors, and discussing measures to solve the problem. In 2022, Jing Peng et al. [11] analyzed the factors affecting the promotion of prefabricated buildings in Hainan Province from five dimensions, such as policy and industry, and used the expert scoring method to obtain the top nine factors, and put forward corresponding measures and suggestions for them. In 2022, Xiao Wang et al. [12] identified 19 key factors for the promotion of prefabricated housing through a literature review, and found through ISM (Interpretive Structural Modeling) analysis that shortening construction time can directly promote its development. In 2023, Qiankun Wang et al. [13] combined the PEST theory and the technology–organization–environment framework, and through a literature review, listed 27 influencing factors in terms of policy, economy, society, technology, and management. And based on the hierarchical analysis method, 15 main influencing factors were identified. The matrix influence path-multiplier classification method was used to classify the factors. The results showed that technical factors accounted for the largest proportion, followed by social, economic, and political factors, and, finally, management factors. Overall, these studies lay the foundation for theoretical research and practical application in the promotion of prefabricated housing. However, at this stage, there is a lack of systematic research on the quantification of the causal relationships and the evolution paths of key factors affecting prefabricated housing, and further exploration is urgently needed.
The DEMATEL (Decision Making Trial and Evaluation Laboratory) method is a decision analysis tool based on graph theory and matrix operations. It is mainly used to analyze the causal relationship and influence degree of various factors in complex systems [14]. In 1971, Fontela et al. [15] first proposed the DEMATEL method, which has since been widely used in supply chain management [16], product development [17], innovation evaluation [18], and other fields. Its core idea is to construct an influence relationship matrix, calculate the causal relationship and centrality of each factor, reveal the relationship between various factors in the system, and further analyze the importance of these factors. Therefore, on the basis of constructing an index system of factors affecting the promotion of prefabricated housing, the DEMATEL method is used to analyze the relationship between factors affecting the promotion of prefabricated housing, so as to quantify the importance of these factors. This is the step to determine the key factors affecting the promotion of prefabricated housing and it also lays an important foundation for the path evolution analysis of key factors affecting the promotion of prefabricated housing.
Traditional DEMATEL models mostly collect research data in the form of questionnaires or expert scoring. When faced with complex system evaluation factors, the evaluation subject needs to spend a certain amount of time and energy to compare and measure each factor, which will make the final research data one-sided and subjective, and then cause partial distortion of the evaluation data, thereby reducing the accuracy of the evaluation results. In order to solve this problem, the BPNN model can effectively reduce human bias and improve the reliability and accuracy of the evaluation results by adjusting and optimizing the system data. The BPNN model (Back Propagation Neural Network) [19] is a basic and typical network type of an artificial neural network. It consists of an input layer, a hidden layer, and an output layer. Its main feature is that it calculates the error loss between the actual output and the expected output of the input sample, and transmits this error signal back to the network to achieve parameter adjustment and optimization of the neural network. This process involves adjusting the weights and biases to minimize the error, so that the network can more accurately approximate the complex input–output relationship and can effectively solve the problem of direct impact on the matrix assignment bias when there are too many evaluation system elements [20].
In summary, this paper proposes an analysis of factors affecting the promotion of prefabricated housing in Hainan Province based on the BPNN and DEMATEL methods by combining the special economic and environmental background of Hainan Province. Through the grounded theory, an index system of factors affecting the promotion of prefabricated housing in Hainan Province was constructed. For the first time, the BPNN–DEMATEL model was used to systematically analyze the key factors affecting the promotion of prefabricated housing in Hainan Province and their evolution path, in order to provide a reference for the promotion of prefabricated housing in Hainan Province.

2. Evaluation Indicators

2.1. Sample Collection

In order to obtain the factors affecting the promotion of prefabricated housing in Hainan Province with high completeness, this paper adopted three methods of research interviews, policy combing, and literature analysis to collect an original corpus. The time of this survey was from August 2023 to August 2024. This survey interview focused on interviewing teachers and students of relevant majors in colleges and universities in Hainan Province, relevant personnel engaged in the construction industry in Hainan Province, workers in relevant departments of the Hainan local government, and experts in the prefabricated housing industry in Hainan Province, totaling 30 people, with 206 in the original corpus. In the process of focusing on collecting 20 documents and materials in Hainan Province, 89 original corpora were obtained. In the literature analysis stage, 49 relevant documents were sorted out from databases such as WOS and CNKI, and 227 original corpora were collected. Based on these 522 original corpora, open coding, main axis coding and selective coding were performed on them. And they were classified from four aspects: policy, economy, technology, and market, and finally formed an index system of factors affecting the promotion of prefabricated housing in Hainan Province.

2.2. Open Coding

First, the original corpus was subjected to open coding analysis, and initial concepts were formed through the process of “original corpus-open coding-labeling”. These concepts were then classified and compared, and concepts with a frequency of less than three times were eliminated. The 122 labels generated by open coding are detailed in Table 1. The labels generated by research interviews, policy review, and literature analysis are prefixed with KI, KII, and KIII, respectively (for example: KI0101, KII0102, KIII0103, etc.). Among them, “KI0101” represents the first label generated after open coding of the original corpus of interviewee 1 in the research interview.

2.3. Axis Coding

Through the process of “open coding-axial coding”, the original corpus was transformed into “label–concept–category”. First, labels that can reflect the initial coding characteristics of the data were selected to integrate and distinguish concepts. Then, the labels were conceptualized, and the concepts of open coding were summarized and organized. Finally, based on the internal logic of “label–concept”, the influencing factors of the promotion of prefabricated housing in Hainan Province were summarized to form initial categories. Finally, 63 concepts and 27 initial categories were extracted from 122 labels. The axial coding process of the preliminary category “B1 imperfect standards and specifications” is shown in Table 2.

2.4. Selective Coding

In order to construct an evaluation index system for factors affecting the promotion of prefabricated housing in Hainan Province, 27 initial categories were selectively coded, and 20 main categories (F1~F20) were finally determined. The core categories of influencing factors were condensed to form four core categories: policy factors (S1), economic factors (S2), market factors (S3), and technical factors (S4). On this basis, the constructed index system was verified with new data randomly selected, and no new categories appeared, indicating that the index system passed the saturation test. The final evaluation index system of factors affecting the promotion of prefabricated housing in Hainan Province is shown in Table 3.

3. Methodology

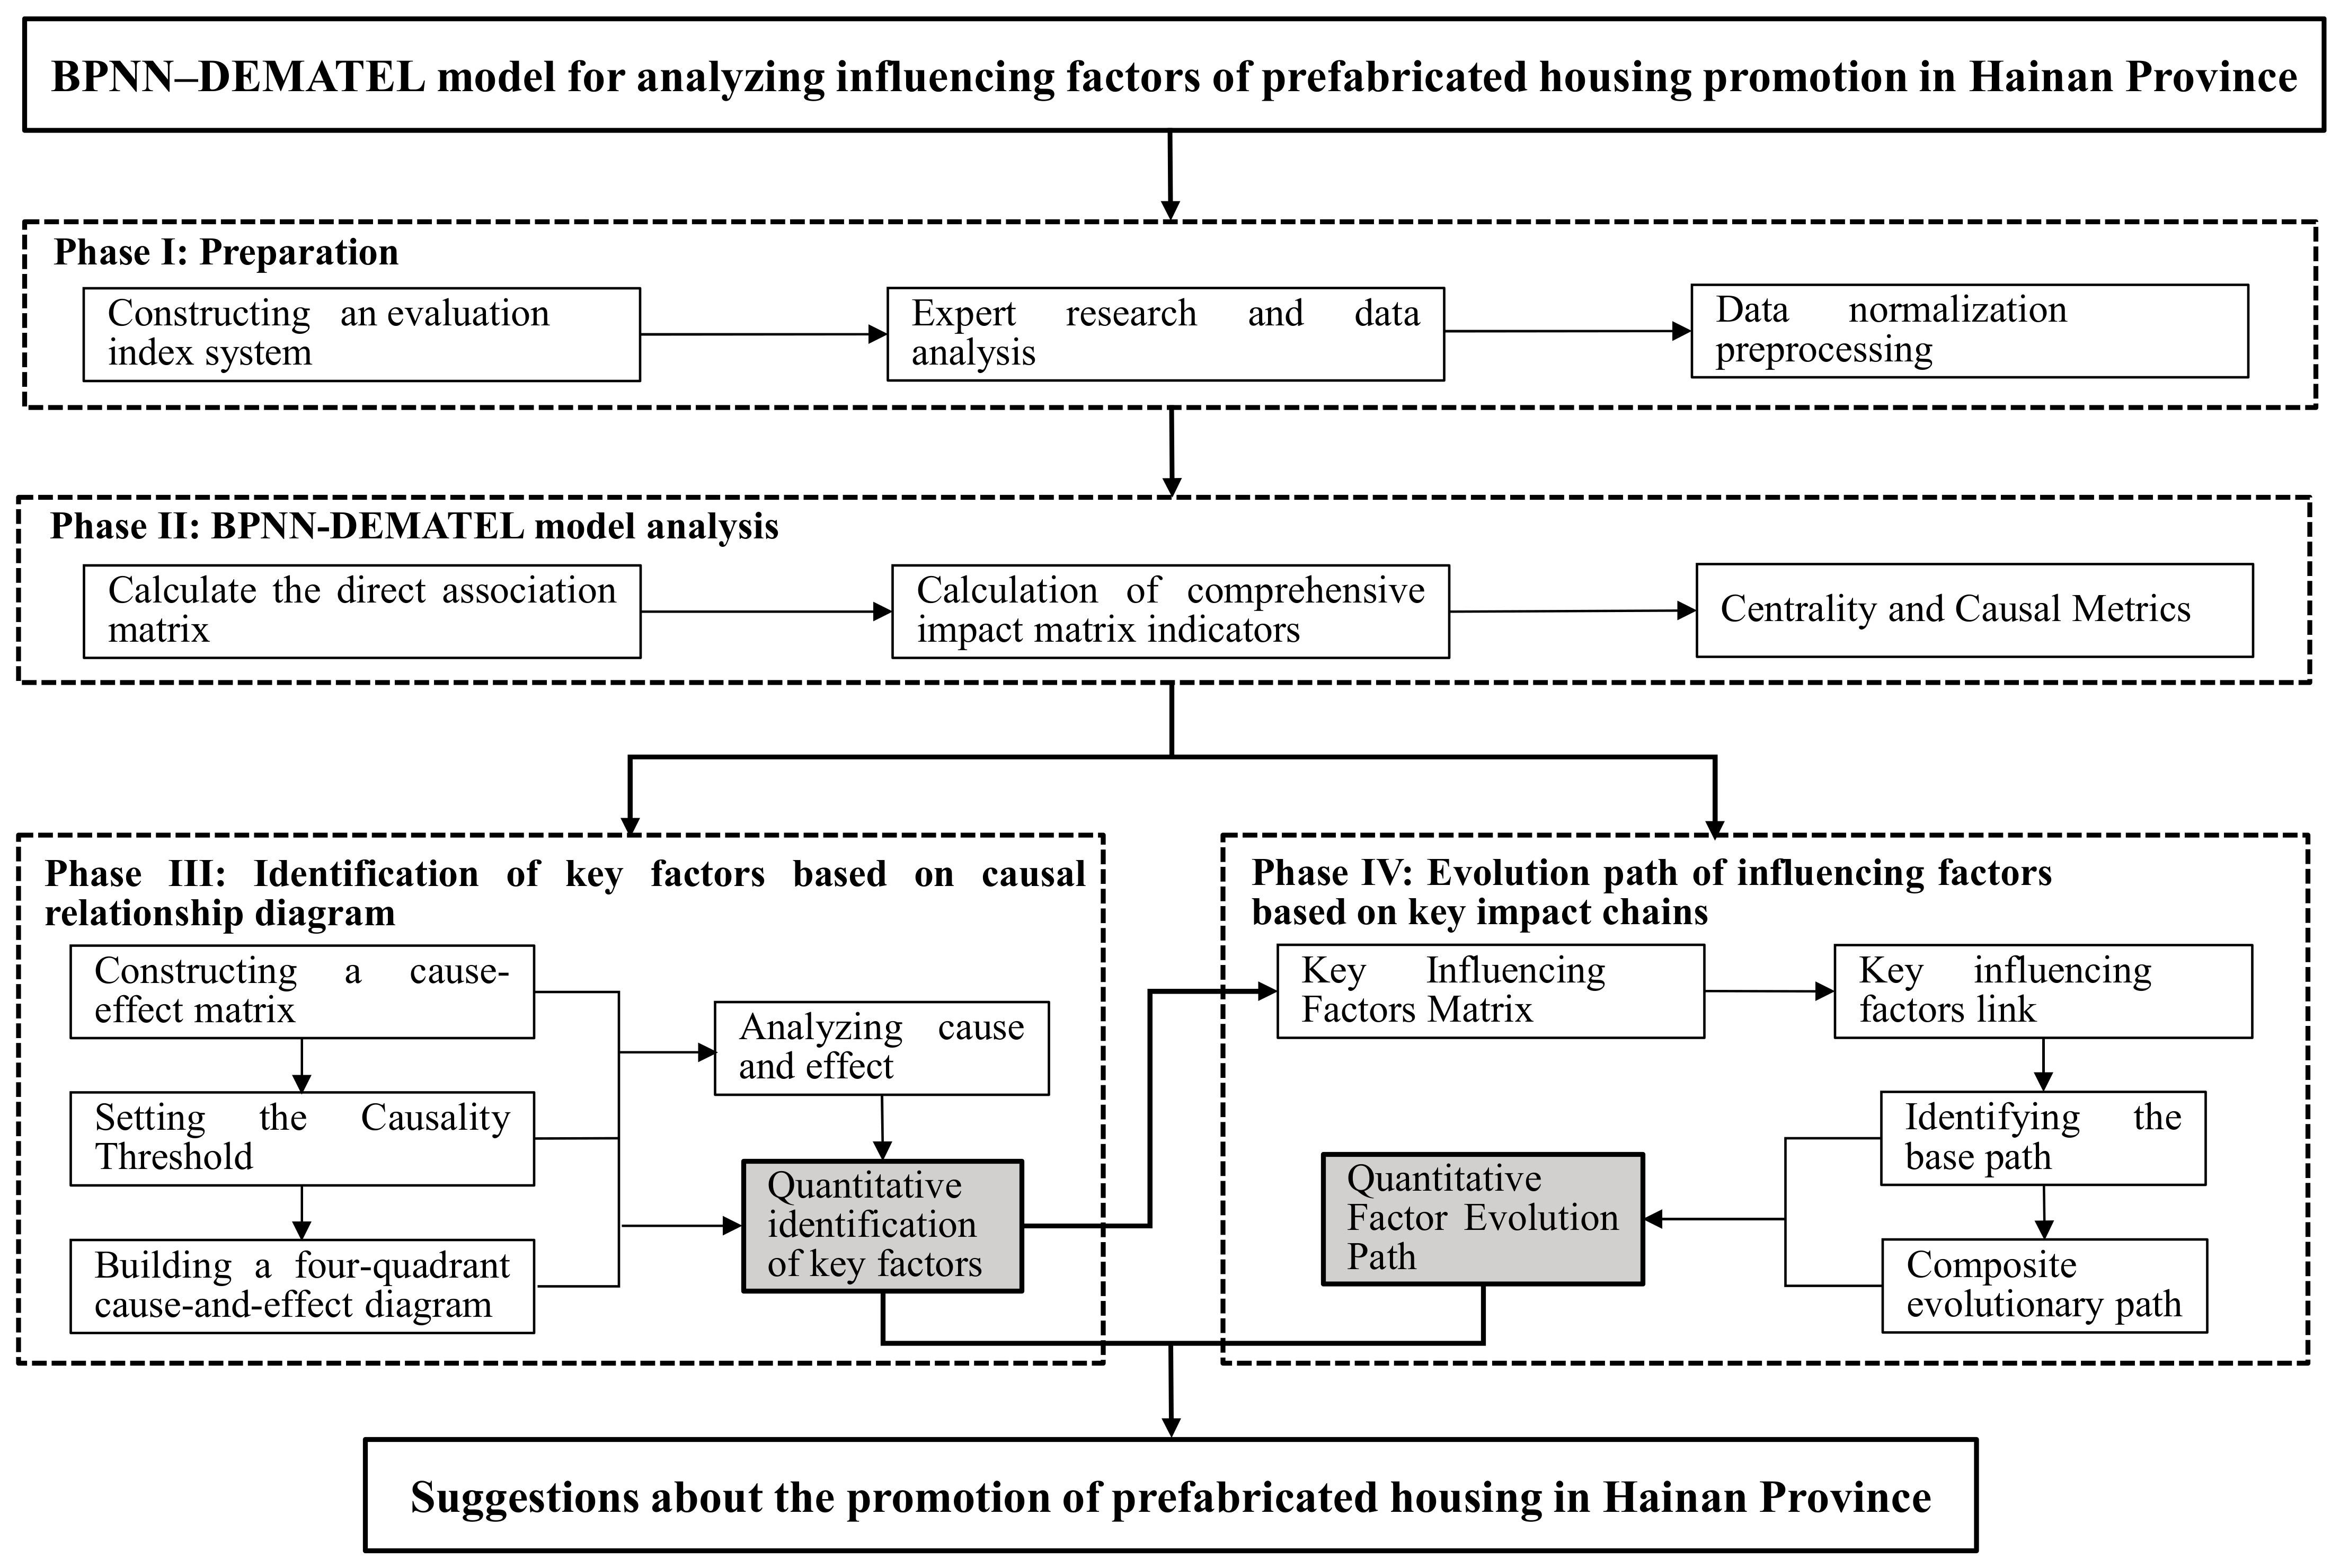
3.1. BPNN and DEMATEL Model Research Framework

In order to determine the key influencing factors in the promotion of prefabricated housing in Hainan Province, this paper analyzes the influencing factors in the promotion of prefabricated housing in Hainan Province based on BPNN–DEMATEL. First, through the grounded theory, the factors affecting the implementation of prefabricated housing projects in Hainan Province were sorted out, and classified into four aspects: policy, economy, market, and technology. Based on this, questionnaire surveys and data analysis were carried out. BNPP was used to construct a nonlinear mapping from the input layer to the output layer to achieve an in-depth analysis of the internal structure of the system network space, calculate the weights of the input and output variables, and obtain the degree of influence of the input factors on the target state and the correlation between the factors. The direct influence matrix between the input factors was obtained; then, DEMATEL normalization and quantitative analysis were performed on the basis of the relationship matrix, and the centrality and causal degree values were calculated in combination with the comprehensive influence matrix; then, a causal relationship matrix was constructed according to the quantitative results of the influencing factors, and the threshold of the causal relationship matrix was set to establish a four-quadrant causal relationship diagram, and the key influencing factors were quantitatively identified based on the causal relationship analysis. Finally, the key factor matrix was converted into a key factor link, the basic path was identified, and the composite path coupling evolution analysis was performed. The technical route of the BPNN and DEMATEL models is shown in Figure 1. The detailed steps are shown in Section 3.2, Section 3.3, Section 3.4 and Section 3.5

3.2. BPNN Model Data Processing

In order to overcome the subjectivity of the direct impact matrix obtained through questionnaire surveys and other methods, the original direct impact matrix was established according to the questionnaire scores, and the BPNN model was used to correct the original matrix. There were four main steps:
(1) First, K experts were invited to score. This paper uses the Likert 5-level scale to score (the value range is 0 to 4: 0 no influence, 1 weak influence, 2 medium influence, 3 strong influence, 4 extremely strong influence) to evaluate the influence of each first-level indicator factor and second-level indicator factor. The scoring results of K experts on the second-level indicator factors were recorded as M = m a i k × 20 , and the scoring results of K experts on the first-level indicator factors were recorded as N = n a j k × 4 , where mai is the evaluation of the influence of the a(a ∈ [1, K ]) expert on the i(i ∈ [1, 20]) second-level indicator factor, and naj is the evaluation of the influence of the a(a ∈ [1, K ]) expert on the j(j ∈ [1, 4]) first-level indicator factor. Then, the collected data were forward-processed to limit the values to the interval [0, 1], and the standardized matrices M ¯ and N ¯ were obtained, respectively. The processing formula is shown in Equation (1):
y = x i x m i n x m a x x m i n
x and y represent the data values before and after the conversion, respectively. x i represents the score of the i sample of each indicator factor. x m a x and x m i n represent the maximum and minimum values in the sample data, respectively.
(2) M ¯ was taken as the input layer of the BPNN model and N ¯ as the output layer. Matlab2021b was used to calculate the weight matrix U from the input layer to the hidden layer and the weight matrix V from the hidden layer to the output layer. To calculate U and V , it was necessary to first determine the number of nodes Z in the hidden layer. The calculation formulas for Z , U and V are shown in Equations (2)–(4):
Z = s + t + c
U = u i s m × z i = 1 , 2 , , m ;   s = 1 , 2 , , z
V = v s j z × n j = 1 , 2 , , n ;   s = 1 , 2 , , z
where s is the number of input layer nodes, t is the number of output layer nodes, c is a constant of [1, 10], m is the number of secondary indicator factors, n is the number of primary indicator factors, and z is the number of hidden layer neuron nodes.
(3) The overall weight matrix B and the overall weight vector B were calculated. The calculation formula is shown in Equation (5): The calculation formulas for B and B are shown in Equations (5) and (6):
B = B i j m × z = m e a n a b s U × a b s V
B = l = 1 k ( B i j ) m × n
The a b s function means to find the absolute value of each element of the matrix, and the m e a n function takes the average value of each column of a b s U × a b s V .
(4) The direct correlation matrix T = t i j 20 × 20 was calculated. The calculation formula for T is shown in Equation (7):
T = t i j 20 × 20 = t 11 t 1 n t n 1 t n n , t i j = B j B j
t i j represents the direct influence of the i influencing factor on the j influencing factor in the secondary indicator factors, where t n n = 0 .

3.3. Constructing a Decision Matrix Using the DEMATEL Method

In order to construct the decision-making matrix for the analysis of factors affecting the promotion of prefabricated housing in Hainan Province, the DEMATEL method was used to establish the decision-making matrix for the analysis of factors affecting the promotion of prefabricated housing in Hainan Province based on the weight matrix modified by the BPNN model, so as to reveal the correlation between the interactions among the influencing factors. This process was divided into the following four main steps:
(1) The total direct influence matrix of the evaluation indexes F1~F20 was calculated. The modified direct correlation matrix T = t i j 20 × 20 was normalized to obtain the normalized direct correlation matrix G = [gij]20×20. The calculation formula of g i j is shown in Equation (8):
G = g i j n × n = T · 1 m a x j = 1 20 t i j
(2) The comprehensive influence matrix of evaluation indexes F1~F20 was calculated. According to the Markov chain principle, the y i j of the influencing factor index was calculated, and the comprehensive correlation matrix Y = y i j 20 × 20 was obtained. The calculation formula of y i j is shown in Equation (9):
Y = y i j 20 × 20 lim t G + G 2 + + G t = lim t G I G t / I G = G 1 G 1 i , j = 1 , 2 , , 20
(3) In order to obtain the causal relationship and comprehensive influence of each influencing factor, it was necessary to calculate the influence of each factor. The calculation formulas for the influence value ( Q i ) and the impact value ( P i ) are shown in Equations (10) and (11):
Q i = i = 1 20 y i j 20 × 1 = y i 20 × 1 i , j = 1 , 2 , , 20
P i = i = 1 20 y i j 1 × 20 = y i 1 × 20 i , j = 1 , 2 , , 20
(4) To obtain the importance of each influencing factor, it was necessary to calculate the centrality (Wi) and causal degree (Ri) of each influencing factor. The calculation formulas of Wi and Ri are shown in Equations (12) and (13):
W i = Q i + P i i = 1 , 2 , , 20
R i = Q i P i i = 1 , 2 , , 20
The causal relationship Q i P i indicates whether a factor is the main influencing factor (cause) or the affected factor (effect). If Q i P i , the factor mainly affects other factors; if Q i P i , the factor is mainly affected by other factors.
Comprehensive influence ( Q i + P i ) indicates the total degree of interaction of factors in the system. The larger the Q i + P i value, the more important the factor is in the system.

3.4. Using the Cause–Effect Diagram to Identify Key Factors

In order to identify the key factors affecting the promotion of prefabricated housing in Hainan Province, a four-quadrant causal relationship diagram was drawn based on the centrality and causal degree of the quantitative evaluation indicators F1~F20 of the DEMATEL decision matrix, and the key factors were quantitatively identified according to the regional characteristics and causal relationships of the evaluation indicators.
In the four-quadrant causal relationship diagram established for the influencing factor Xi, the initial coordinate system was constructed with the centrality Wi as the horizontal coordinate and the causal degree Ri as the vertical coordinate, and the four-quadrant relationship diagram was divided according to the mean of the centrality and the causal degree. The mean calculation standard is shown in Equations (14) and (15):
W i m e a n = 1 20 W i 20
R i m e a n = 1 20 R i 20
where: Wi(mean) is the centrality screening criterion, and Ri(mean) is the cause degree screening criterion.
According to the centrality and causality division standards, a four-quadrant causal relationship diagram was drawn. According to Equations (14) and (15), the identified evaluation indicators F1~F20 of the influencing factors of the promotion of prefabricated housing were divided into four different regions (I, II, III, and IV). Both centrality and causality have an important influence on the causal relationship of the influencing factors. Therefore, the influencing factors in regions I, II, and IV could be used as key factors for key analysis and research.

3.5. Using Key Factor Chains to Analyze Evolutionary Paths

In order to explore the evolution path and the relationship between the key influencing factors of the promotion of prefabricated housing in Hainan Province, the comprehensive influence matrix T = [tij]20×20 was improved by screening the key influencing factors to obtain the key influencing factors. The mutual influence relationship diagram of the key influencing factors of the promotion of prefabricated housing was constructed, and the total weight of the directed closed path was calculated to quantitatively explore the evolution path of the key influencing factors. Taking the key influencing factors F1, F2, F3, and F4 of the promotion of prefabricated housing screened as an example, the mutual influence relationship of the key influencing factors was established as shown in Figure 2.
From the analysis of Figure 2, we can see that the interaction relationship between the key influencing factors F1, F2, F3, and F4 forms three paths: F1F2F3F1, F4F3F1 and F4F1F2F3. Among them, there is a closed path F1F2F3F1, and the total weight of this closed path is 3.72. In this paper, the total weight is introduced to measure the degree of mutual influence and interaction between factors in the closed path. That is, the larger the total weight of the closed path, the greater the degree of mutual influence and interaction between the factors in the closed path and the higher the importance in the entire influence chain, indicating that as the degree of the action relationship deepens, it will cause a greater impact.
A closed path refers to a path whose starting point and end point coincide, while an open path refers to a path with a starting point, an intermediate point, and an end point, and the starting point and end point do not coincide. A basic path refers to a closed path composed of three factors, and a composite path refers to a closed path composed of more than three factors. The key influencing factors F1, F2, and F3 form a closed path. The deepening of F1 will lead to the deepening of F2, and the deepening of F2 will lead to the deepening of F3. F3 continues to deepen the influence of F1, indicating that the three key influencing factors exist at the same time, and their interaction will eventually lead to an increase in the overall influence. From the perspective of influencing factor control, on the basis of identifying key influencing factors at the micro level, conducting an evolutionary path analysis at the macro level is conducive to formulating refined response measures and providing a reference for the promotion of prefabricated housing in Hainan Province.

4. Investigation and Analysis

4.1. Analysis of Influencing Factors Based on BPNN–DEMATEL Model
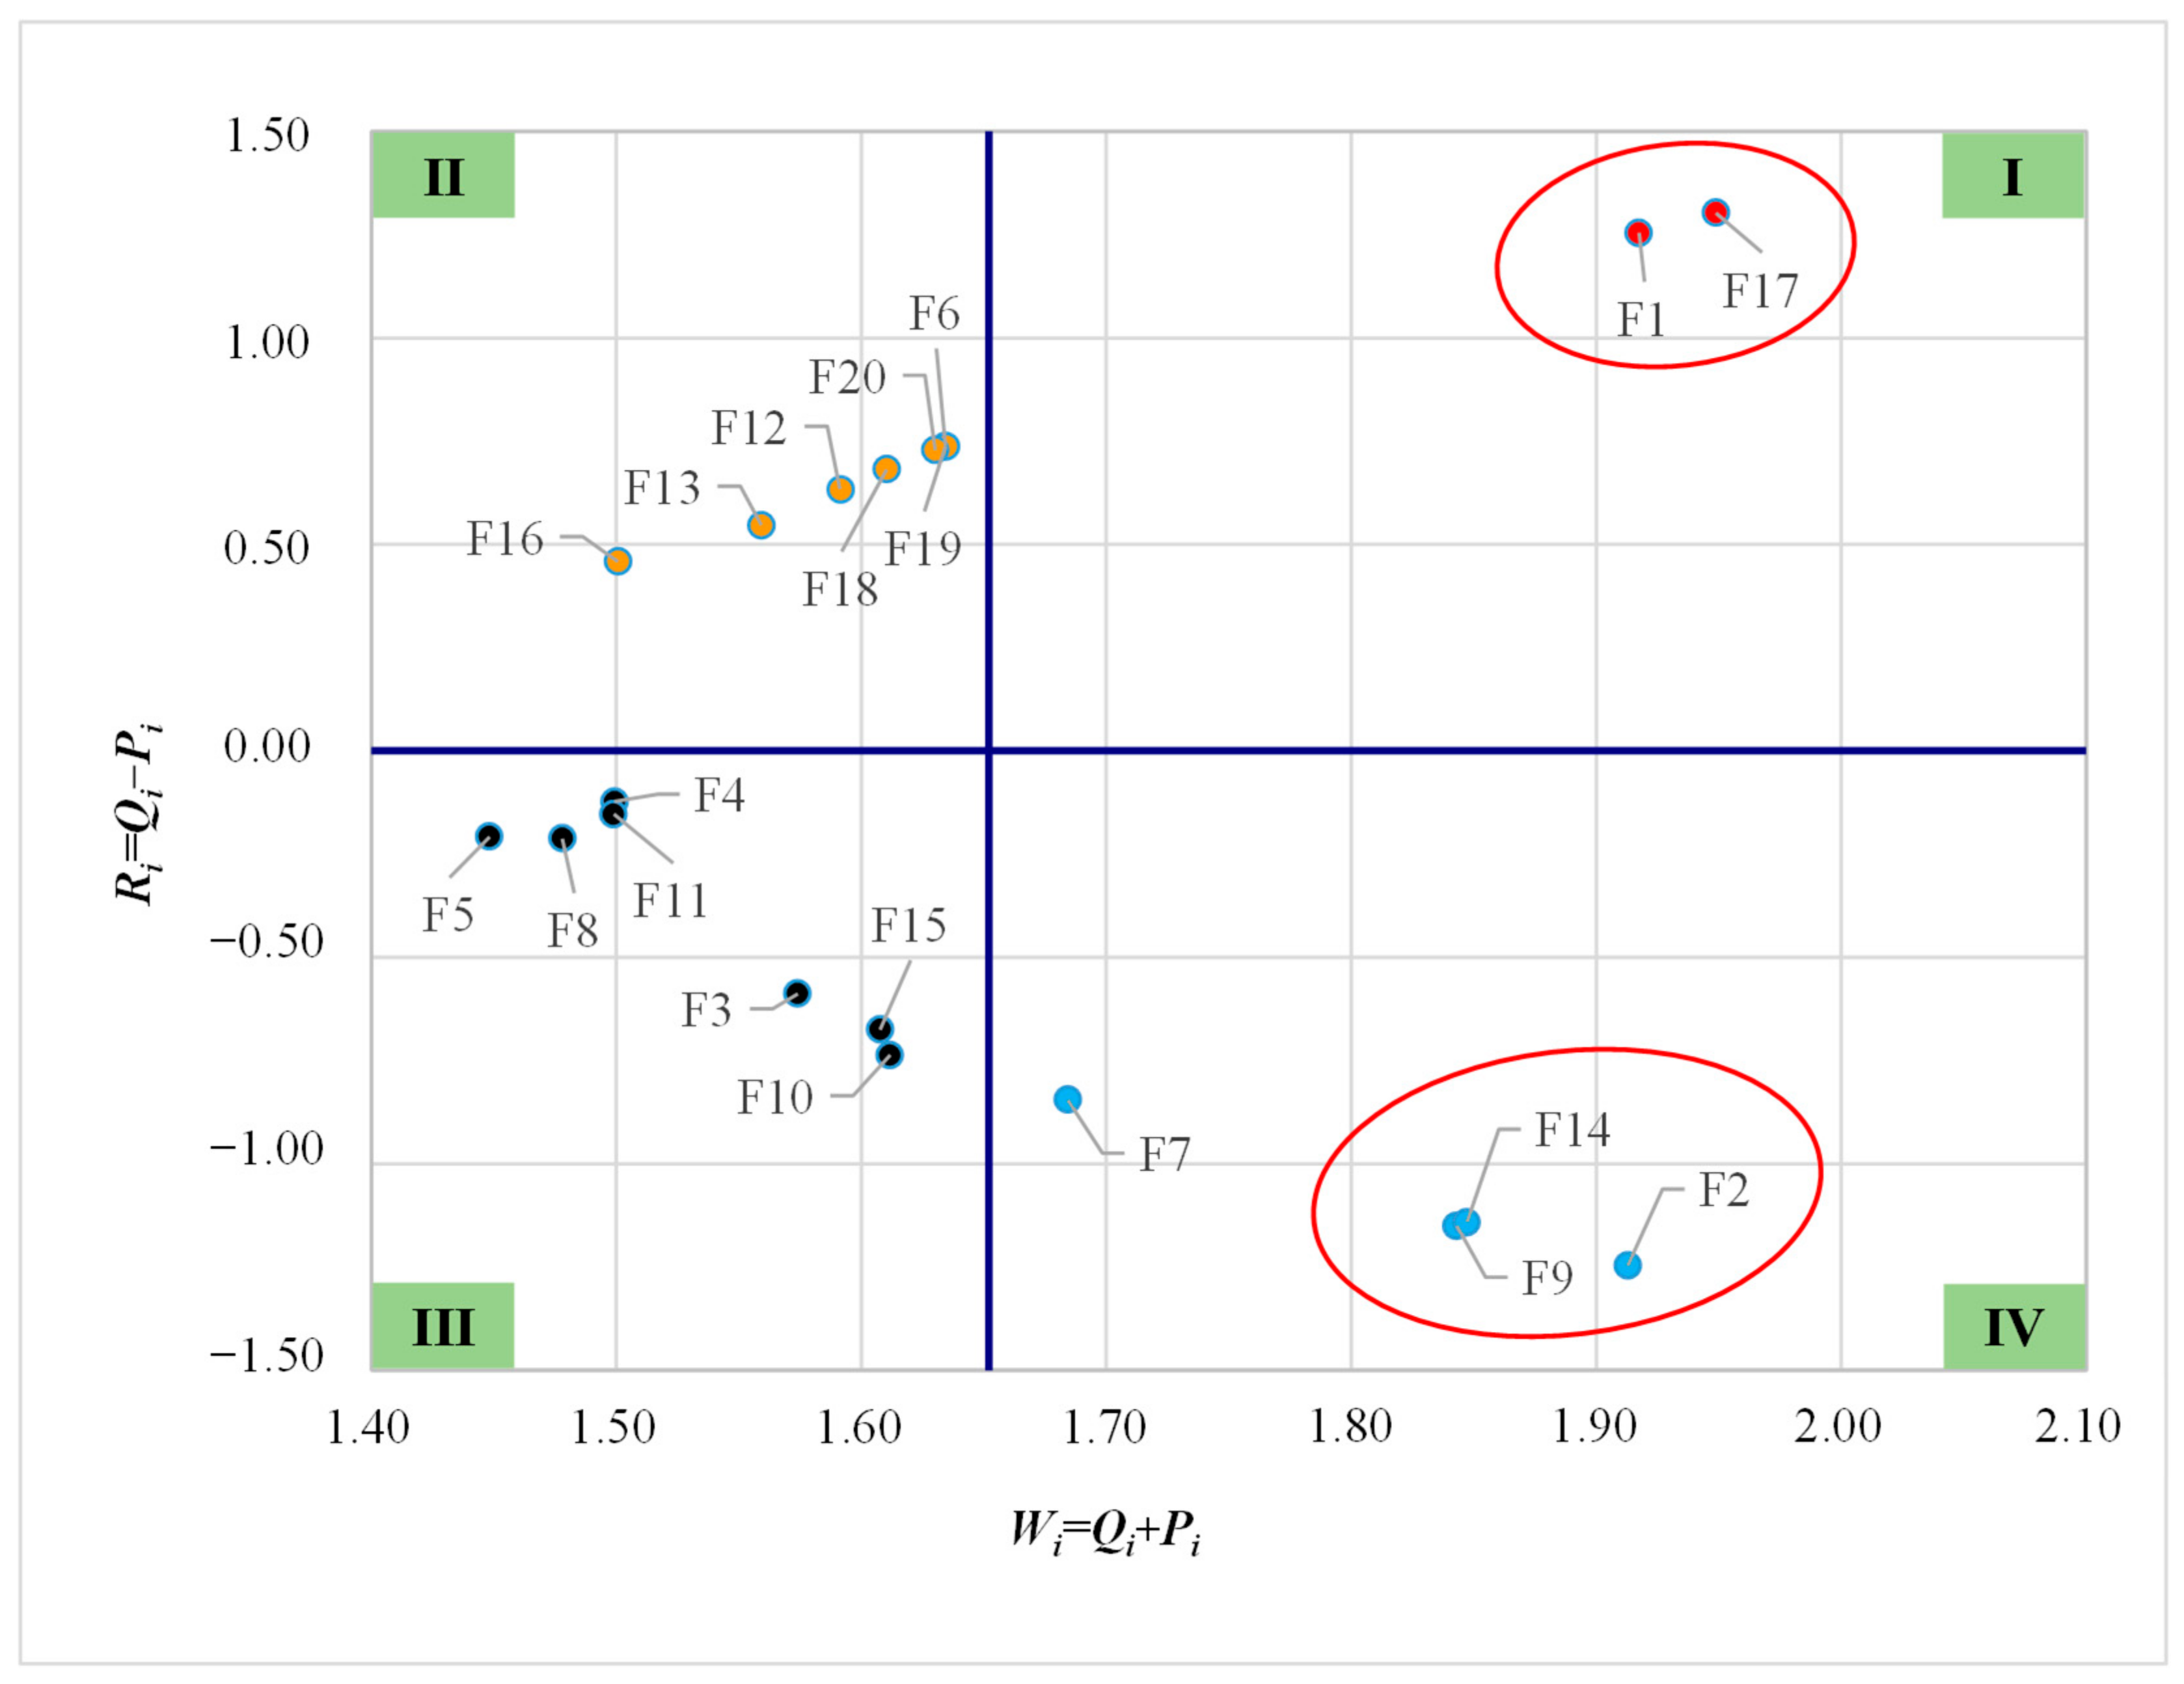
In order to better analyze the factors affecting the promotion of prefabricated housing in Hainan Province, 25 experts with at least 2 years of experience in prefabricated housing management and research were invited to score the mutual influence between the primary and secondary factors in this survey. They were government-related personnel (6 people), enterprise practitioners (12 people), some university experts (4 people) and prefabricated housing users (3 people) who have been engaged in prefabricated housing for many years in Hainan Province, and their academic qualifications were all above junior college. Likert 5-level scale assignment (0 = “very unimportant”, 1 = “unimportant”, 2 = “no impact”, 3 = “important”, 4 = “very important”) was used to score each primary indicator factor and secondary indicator factor. This survey lasted nearly 2 months. After sorting out the questionnaires, 19 valid questionnaires were finally obtained, and the questionnaire recovery rate reached 76%. The statistical results of the working years and unit distribution of the 19 experts in the field are shown in Table 4. SPSS 26 software was used for a consistency test, and the Cronbach reliability coefficient was 0.913 > 0.8; the single measurement in the intraclass correlation coefficient was 0.919 > 0.75; and the average measurement was 0.908 > 0.75, and both were significant levels, indicating that the survey data can provide data support for the model construction and empirical analysis of this article.
In this paper, the scoring results of the 19 experts on the secondary index factors were recorded as M 19 × 20 , and the scoring results on the primary index factors were recorded as N 19 × 20 . The original scoring results were standardized by Formula (1) to obtain the matrix M ¯ 19 × 20 and the matrix N ¯ 19 × 20 . M ¯ was used as the input layer of the BPNN model, and N ¯ was used as the output layer. The code was written with the help of Matlab2021b software. Through multiple tests and comparisons within the range of the number of hidden layer nodes, it was found that the training effect is best when the number of hidden layer nodes is 13, so the number of hidden layer nodes was determined to be 13. Matlab software was used to write the BPNN–DEMATEL model code, and the tansig function was selected as the transfer function between the BPNN input layer and the hidden layer, and the purelin function was selected as the transfer function between the hidden layer and the output layer. The initial learning rate was set to 0.05, the maximum number of training times was 1000 times, and the training accuracy was required to be 0.001. The code was run to train the BPNN until the network structure was stable. On this basis, we obtained the weight matrices U and V between the input layer and the hidden layer, and between the hidden layer and the output layer. We used Formula (5) to find the overall weight matrix B , and Formula (6) to find the overall weight vector B :
B 20 × 1   =   ( 2.41   0.53   0.77   1.02   1.00   1.81   0.66   0.98   0.55   0.71   1.04   1.70   1.61   0.56   0.73   1.50   2.47   1.75   1.81   1.80   1.80 ) T
Using Formula (7), we could obtain the direct correlation matrix T between the influencing factors of the promotion of prefabricated housing in Hainan Province. (See Table 5.)
Equation (8) was used to normalize T = [tij]20×20 to obtain the normalized matrix G = [gij]20×20. According to Formula (9), the comprehensive correlation matrix Y = [yij]20×20 of the evaluation index was established. (See Table 6.)
In order to quantify the correlation between the factors affecting the promotion of prefabricated housing in Hainan Province, the importance of each factor, the degree of influence on other factors, and the degree of influence by other factors, according to the analysis principle of the DEMATEL method, were identified. This information was based on the comprehensive correlation matrix Y = [yij]20×20, the influence degree value (Qi), impact degree value (Pi), centrality value (Wi), and cause degree value (Ri) of the influencing factors F1~F20, which were calculated by Equations (10)–(13), and the results are shown in Table 7.
On this basis, a four-quadrant causal relationship diagram was drawn according to the center line of the centrality (the mean of the maximum and minimum centrality values Wi(mean) = 1.652) and the dividing line of the causal degree (Ri(mean) = 0), with the horizontal axis being the centrality value (Wi) and the vertical axis being the causal degree value (Ri), as shown in Figure 3.
As can be seen from Figure 3, the cause–effect relationship diagram was divided into four quadrants, and the influencing factors in the four areas of I, II, III, and IV were analyzed.
(1)
In quadrant I, factors F1 and F17 have high centrality and causality. In short, F1 and F17 are causal factors and have high importance. That is, F1 (imperfect standards and specifications) and F17 (ununified design product standards) have high centrality and causality, and their influence on other factors is greater than the influence of other factors on themselves, and they also have a greater impact on other factors. Therefore, F1 and F17 can be considered as key factors in the promotion of prefabricated housing in Hainan Province.
(2)
In quadrant II, factors F6, F12, F13, F16, F18, F19, and F20 have low centrality but high causality, that is, F6, F12, F13, F16, F18, F19, and F20 have low importance but are causal factors. Although F6 (high construction cost), F12 (consumers lack knowledge of prefabricated housing), F13 (low market recognition of prefabricated housing), F16 (lack of information technology application), F18 (enterprises lack innovation ability), F19 (construction units lack professional construction equipment), and F20 (lack of professional and technical personnel related to prefabricated housing) are of low importance, these factors have a greater impact on other influencing factors. Therefore, F6, F12, F13, F16, F18, F19, and F20 can be determined as key factors.
(3)
In quadrant III, the influencing factors F3, F4, F5, F8, F10, F11, and F15 have low centrality and low causality, that is, F3, F4, F5, F8, F10, F11, and F15 are of low importance and are result factors. These factors have a low impact on other factors and are also affected to a low degree. Therefore, F3, F4, F5, F8, F10, F11, and F15 can be considered non-key factors.
(4)
In quadrant IV, the influencing factors F2, F7, F9, and F14 have high centrality and low causality, and are highly important and result factors. That is, F2 (imperfect incentives), F7 (high production and transportation costs of PC components), F9 (lack of motivation for corporate strategic transformation), and F14 (lack of market demand) have high centrality and are important themselves. Moreover, F2 (imperfect incentives), F7 (high production and transportation costs of PC components), F9 (lack of motivation for corporate strategic transformation), and F14 (lack of market demand) are greatly affected by other factors. These factors deserve attention, as they are affected by other factors and induce their own influence. Therefore, F2, F7, F9, and F14 can be determined as key factors.
Based on the above analysis of the four quadrants, from the perspective of centrality, the larger the value, the more important it is. From the perspective of causality, the larger the absolute value, the more important it is. Therefore, in order to express the comprehensive importance of influencing factors, the key influencing factors for the promotion of prefabricated housing in Hainan Province were comprehensively analyzed, and the D value was introduced, that is, the distance from each influencing factor to the point (Wi(mean), Ri(mean)). The larger the distance, the higher the importance of the influencing factor. The calculation formula of D is shown in Equation (16):
D = W i m e a n W i 2 + R i m e a n R i 2
where Wi(mean) = 1 20 W i / 20 , Ri(mean) = 1 20 R i / 20 . The comprehensive importance of each influencing factor was calculated and ranked according to Formula (16). The results are shown in Table 8.
As shown in Table 8, F1, F2, F9, F14, and F17 rank in the top five. Based on the results of the four-quadrant causal relationship diagram, F1, F2, F6, F7, F9, F12, F13, F14, F16, F17, F18, F19, and F20 are the key factors affecting the promotion of prefabricated housing in Hainan, and the above five factors are all among the key factors. Comprehensive analysis shows that factors F1 (imperfect standards and specifications), F2 (imperfect incentives), F9 (lack of motivation for corporate strategic transformation), F14 (insufficient market demand), and F17 (ununified design product standards) are key influencing factors.

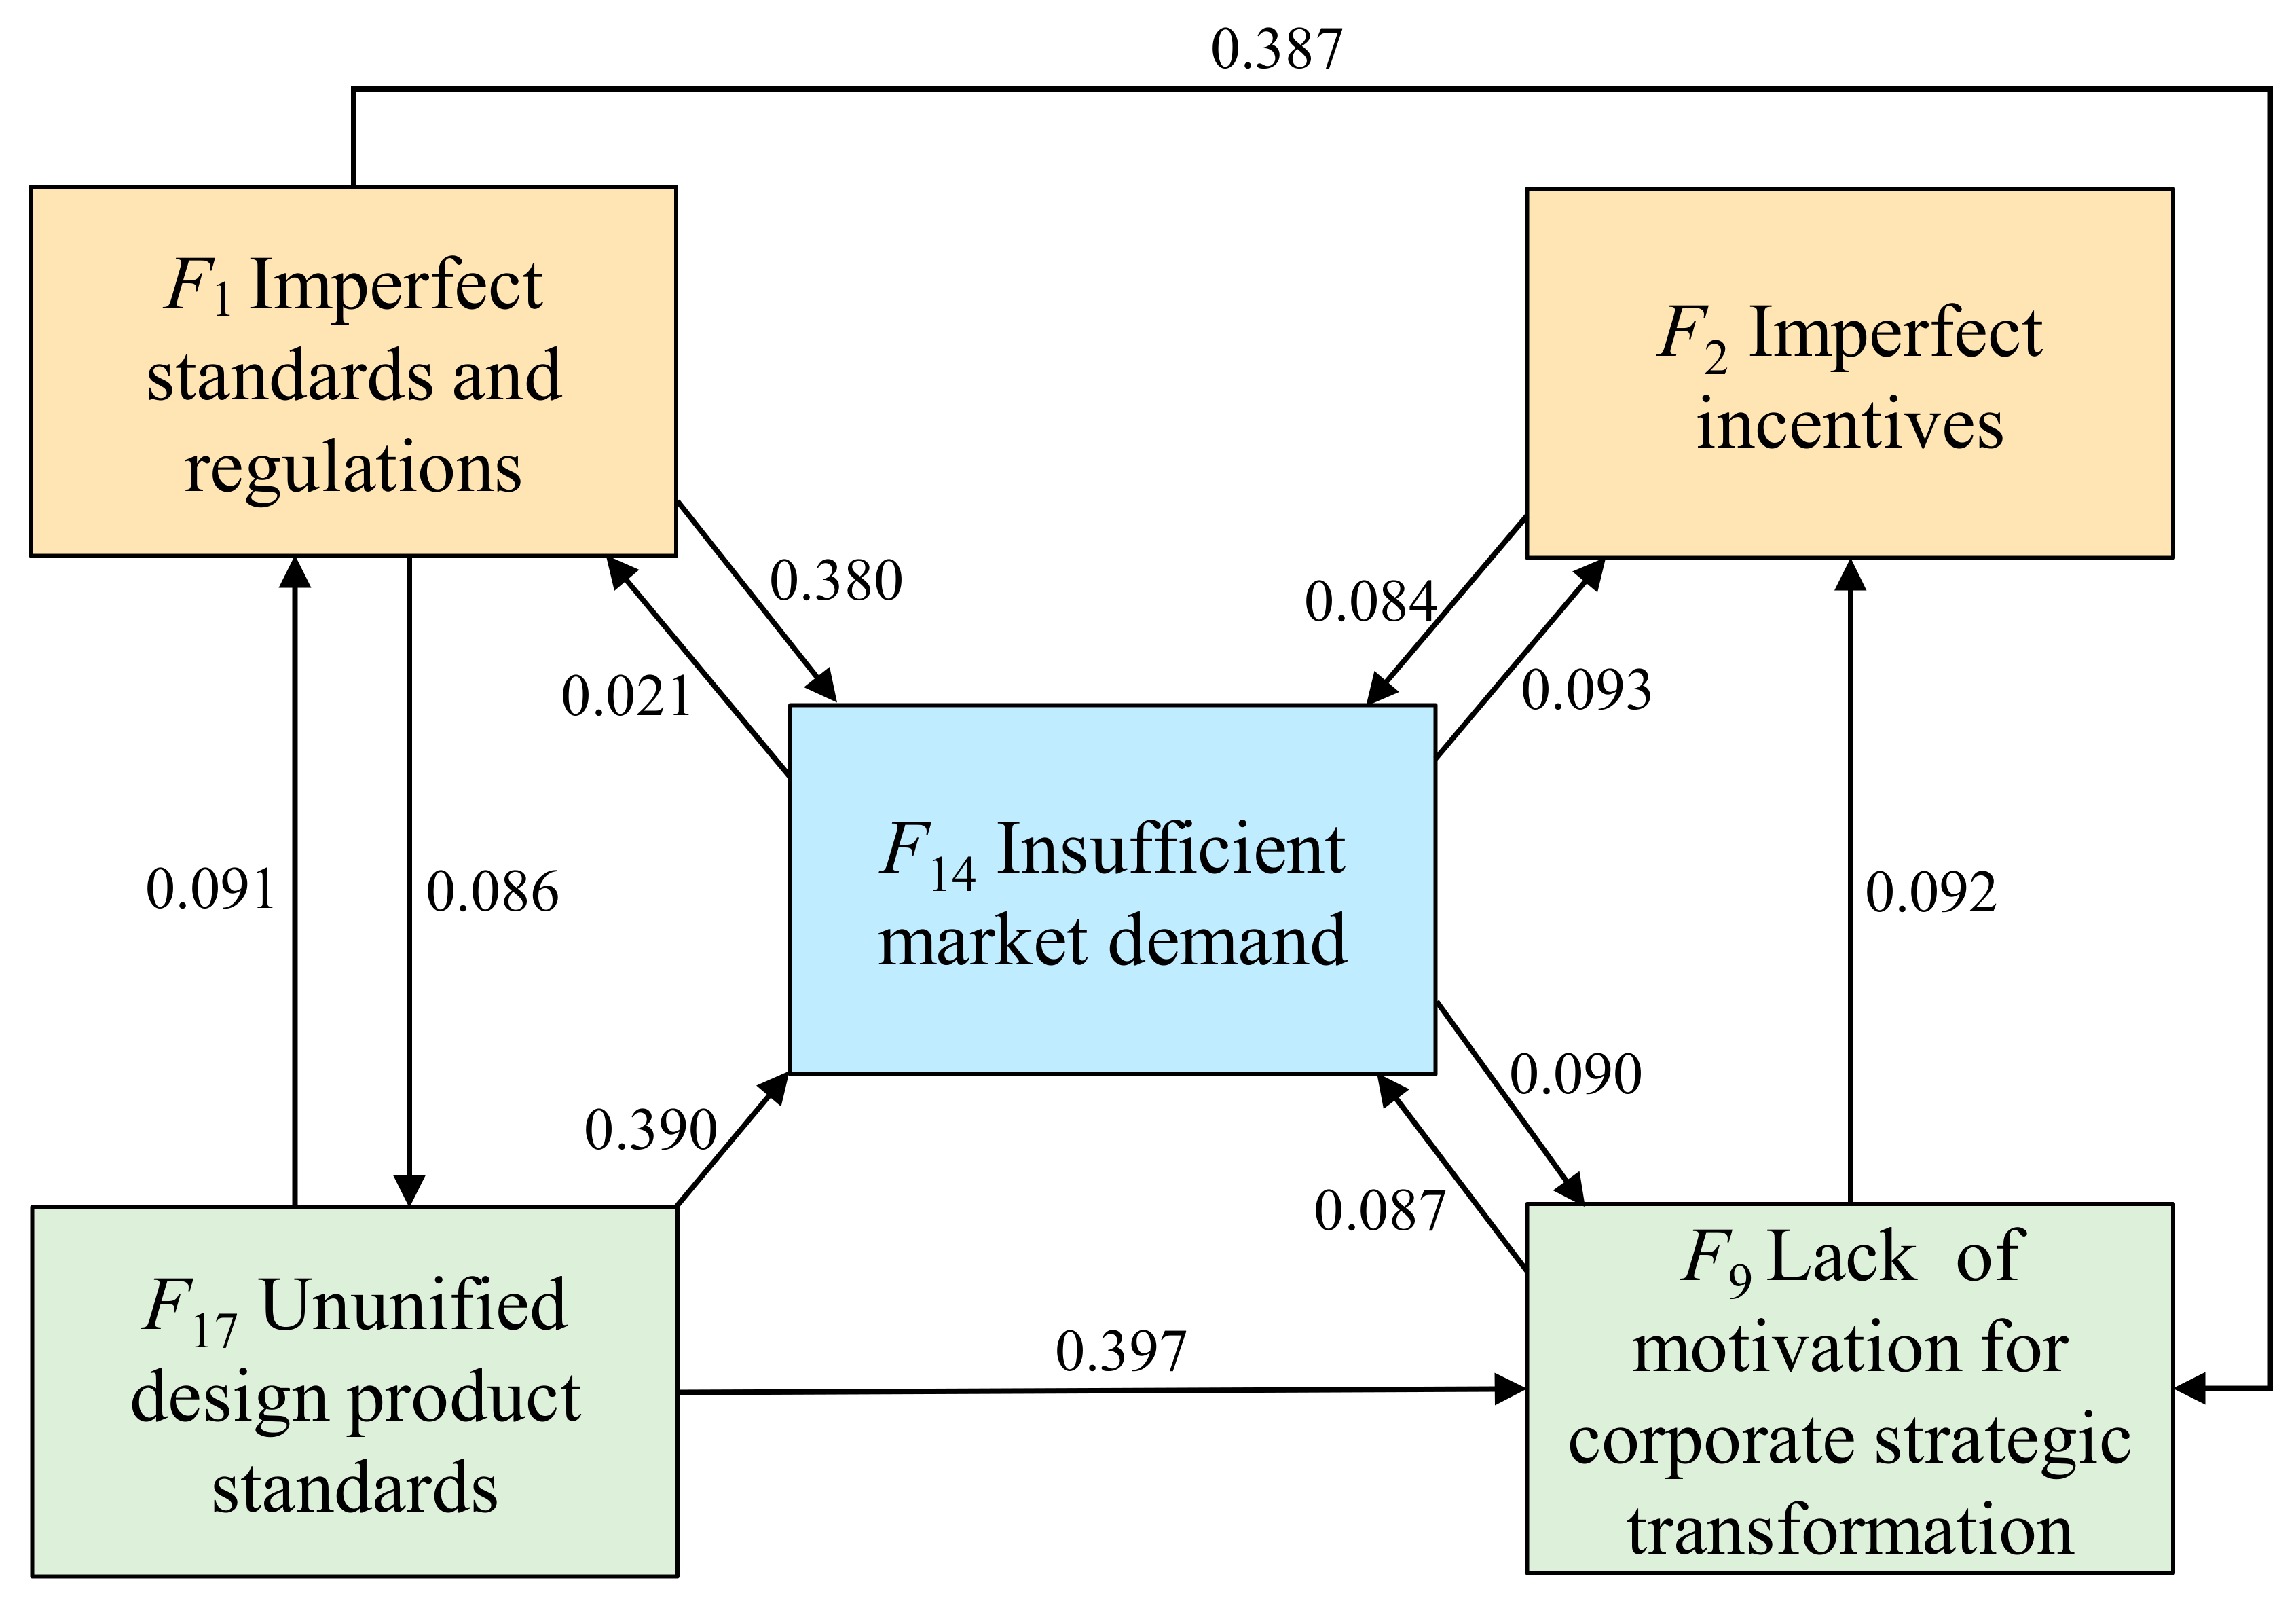
4.2. Evolution Path of Factors Affecting the Promotion of Prefabricated Housing in Hainan Province Based on Key Factor Chain

In order to explore the evolution path of influencing factors in the promotion of prefabricated housing in Hainan Province, the final screening indicators F1, F2, F9, F14, and F17 were taken as key factors, and a comprehensive correlation matrix Y 5×5 of key factors was established. (See Table 9.)
In order to intuitively display the action relationship and evolution path of key factors, the mutual influence relationship diagram of key factors was drawn according to Table 9. The numbers on the arrows indicate the degree of influence of the key influencing factors at the tail of the arrow on the key influencing factors at the arrow point. The mutual influence relationship of F1, F2, F9, F14, and F17 is shown in Figure 4. According to the mutual influence and action relationship between the influencing factors, the interactive coupling between at least three factors can form a loop. In this paper, the loop formed by the three influencing factors is called the basic path, and the path formed by the interaction of the basic path and other factors is called the composite path.
From Figure 4, we can find six paths, including three basic paths, including path 1: F1F17F14F1 (0.497), path 2: F1F9F14F1 (0.495), and path 3: F14F9F2F14 (0.266). There are three conforming paths, including path 4: F1F17F9F14F1 (0.591), path 5: F1F17F9F2F14F1 (0.680), and path 6: F1F9F2F14F1 (0.584). From the analysis of Figure 4, we can see that the weight of the composite path is higher than that of the basic path, which means that as the interaction relationship becomes more complicated, it will cause a greater impact.
(1)
Evolution analysis of basic paths 1, 2, and composite path 4
As shown in Figure 5, composite path 4 is obtained through interactive evolution based on basic path 1 and basic path 2. Specifically, for basic path 1 F1F17F14F1 (0.497), due to imperfect standards and specifications, the design product standards are not unified, which in turn leads to insufficient market demand. For basic path 2 F1F9F14F1 (0.495), due to imperfect standards and specifications, the enterprise lacks motivation for strategic transformation, which in turn leads to insufficient market demand. The two paths are combined to obtain composite path 4: F1F17F9F14F1 (0.591). Due to imperfect standards and specifications, the design product standards are not unified, which in turn leads to a lack of motivation for strategic transformation of enterprises, and ultimately insufficient market demand.
(2)
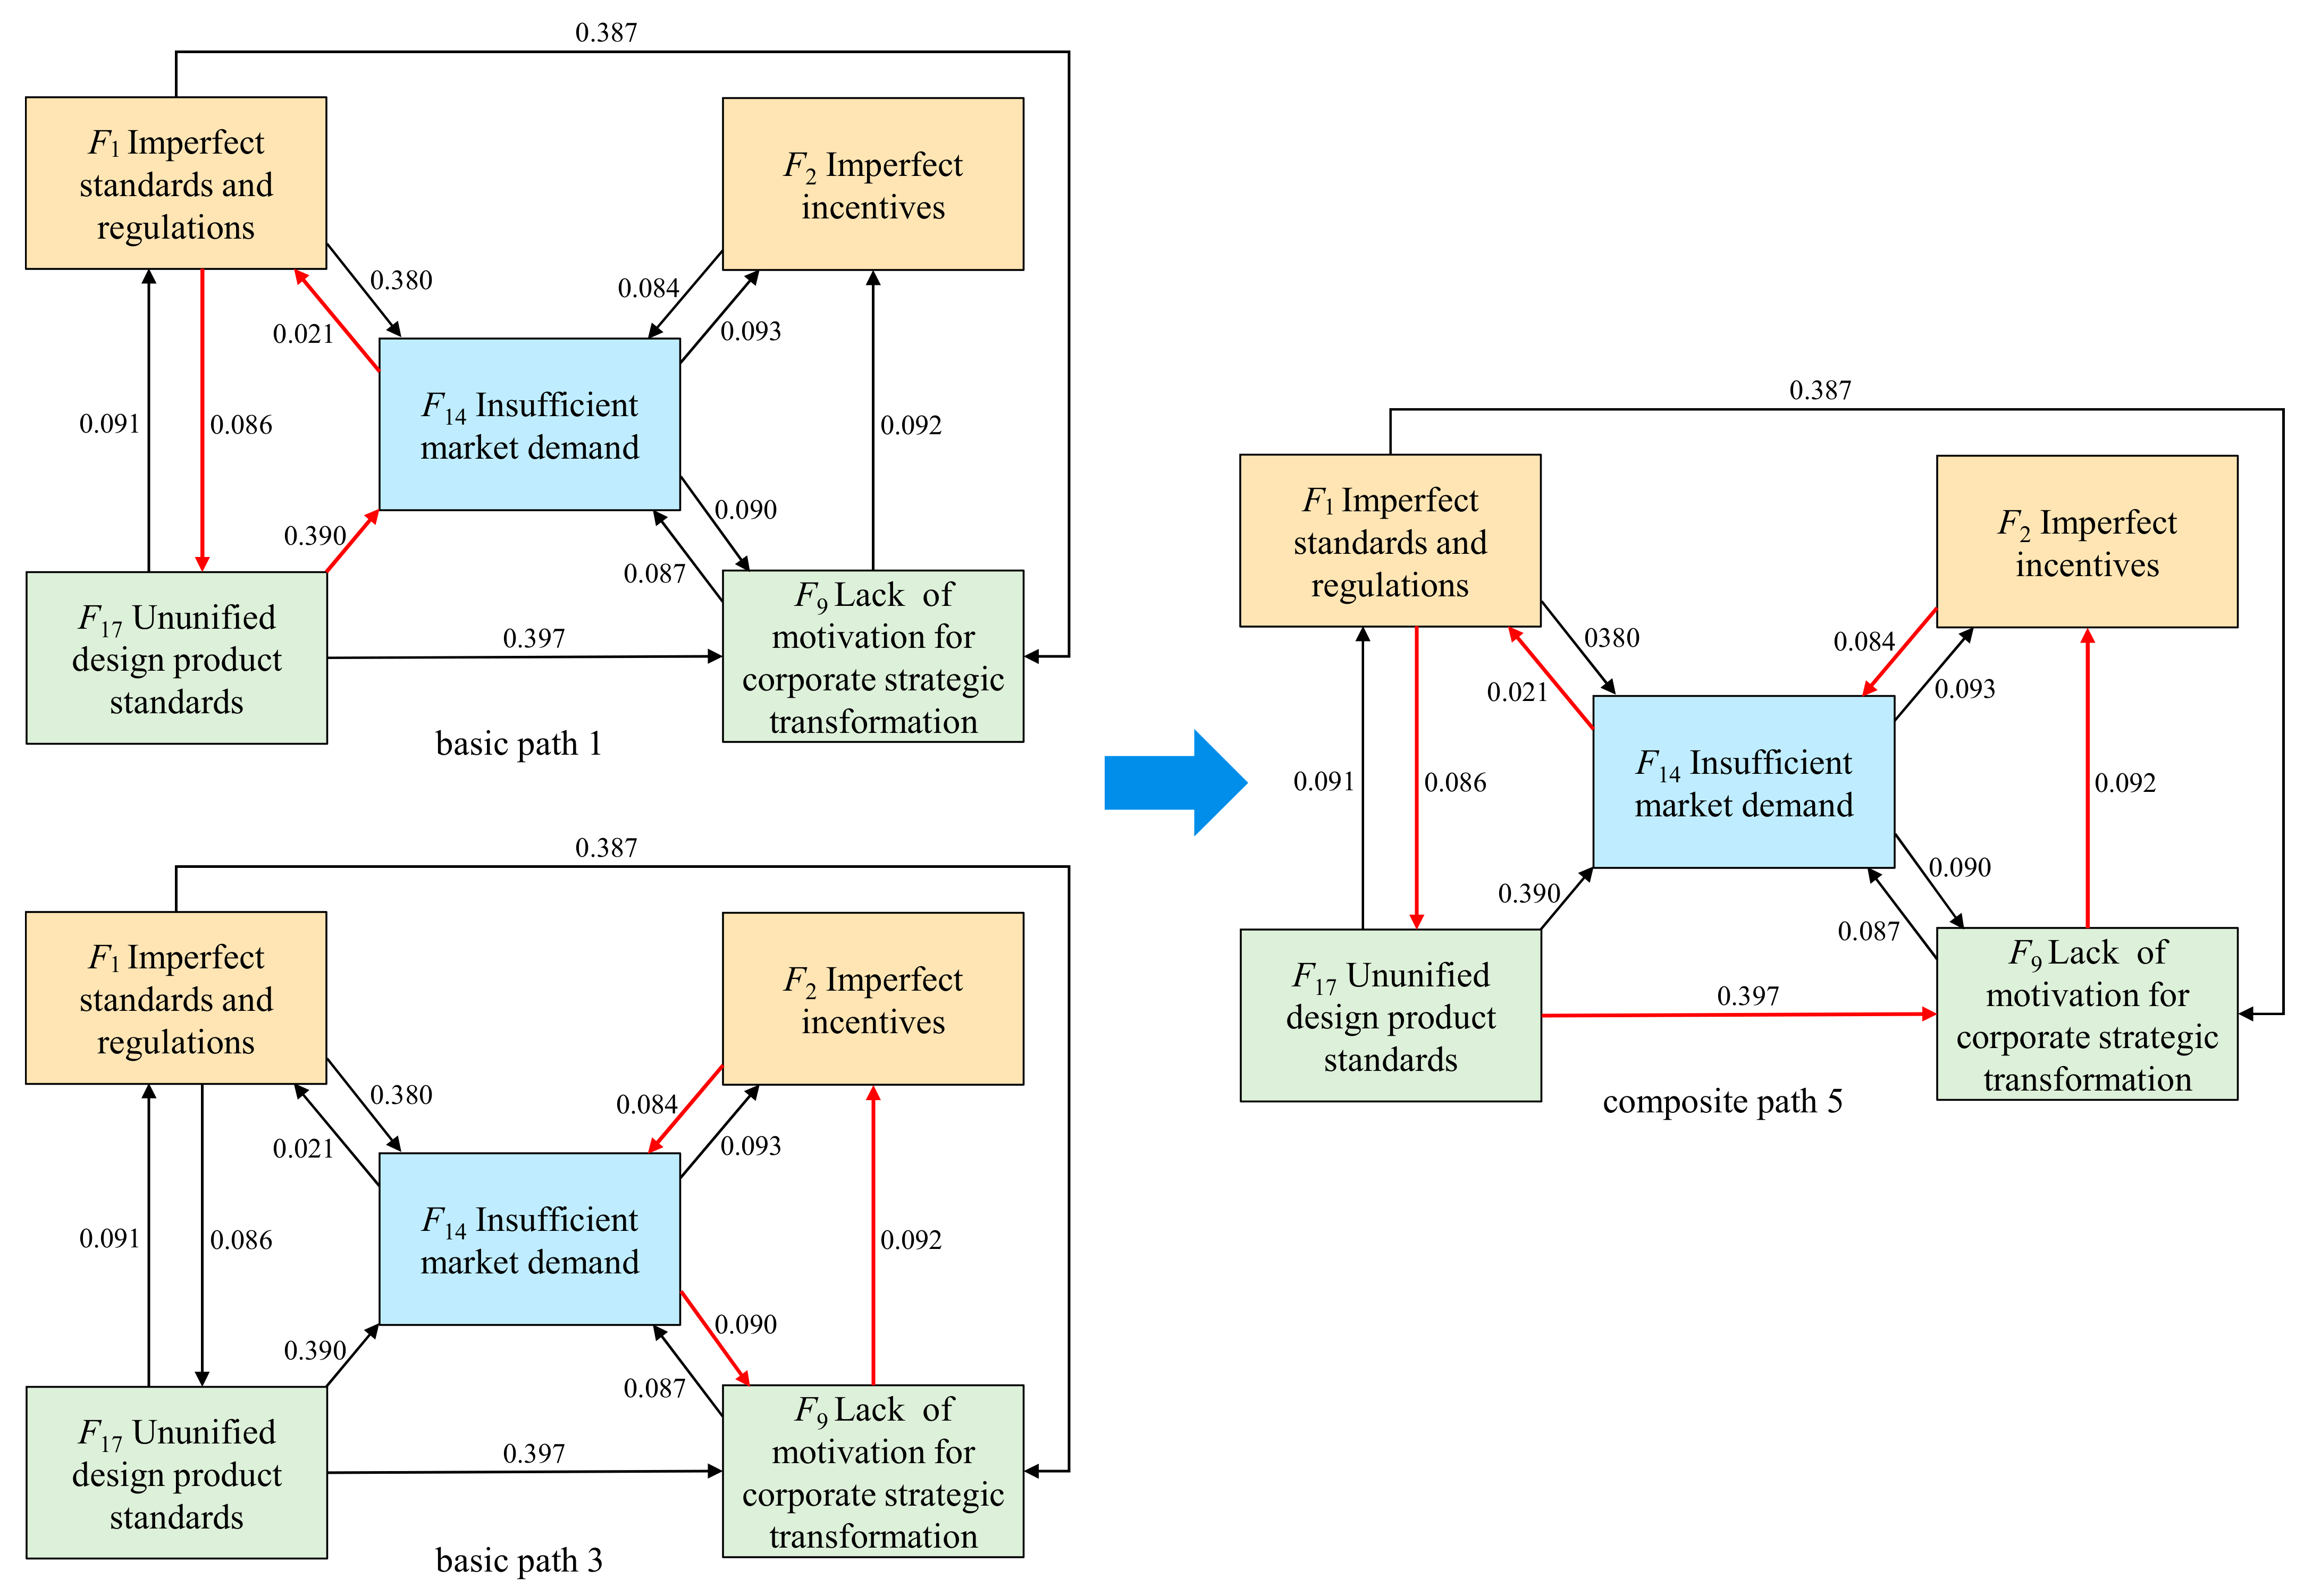
Evolution analysis of basic paths 1, 3, and composite path 5
As shown in Figure 6, compound path 5 is obtained by interactive evolution based on basic path 1 and basic path 3. Specifically, for basic path 1 F1F17F14F1 (0.497), due to imperfect standards and specifications, the design product standards are not unified, which in turn leads to insufficient market demand. For basic path 3 F14F9F2F14 (0.266), due to insufficient market demand, the enterprise lacks motivation for strategic transformation, which in turn leads to imperfect incentives. The two paths are combined to obtain composite path 5: F1F17F9F2F14F1 (0.680). Due to imperfect standards and specifications, the design product standards are not unified, which in turn leads to a lack of motivation for corporate strategic transformation, which in turn leads to imperfect incentives, and ultimately leads to insufficient market demand.
(3)
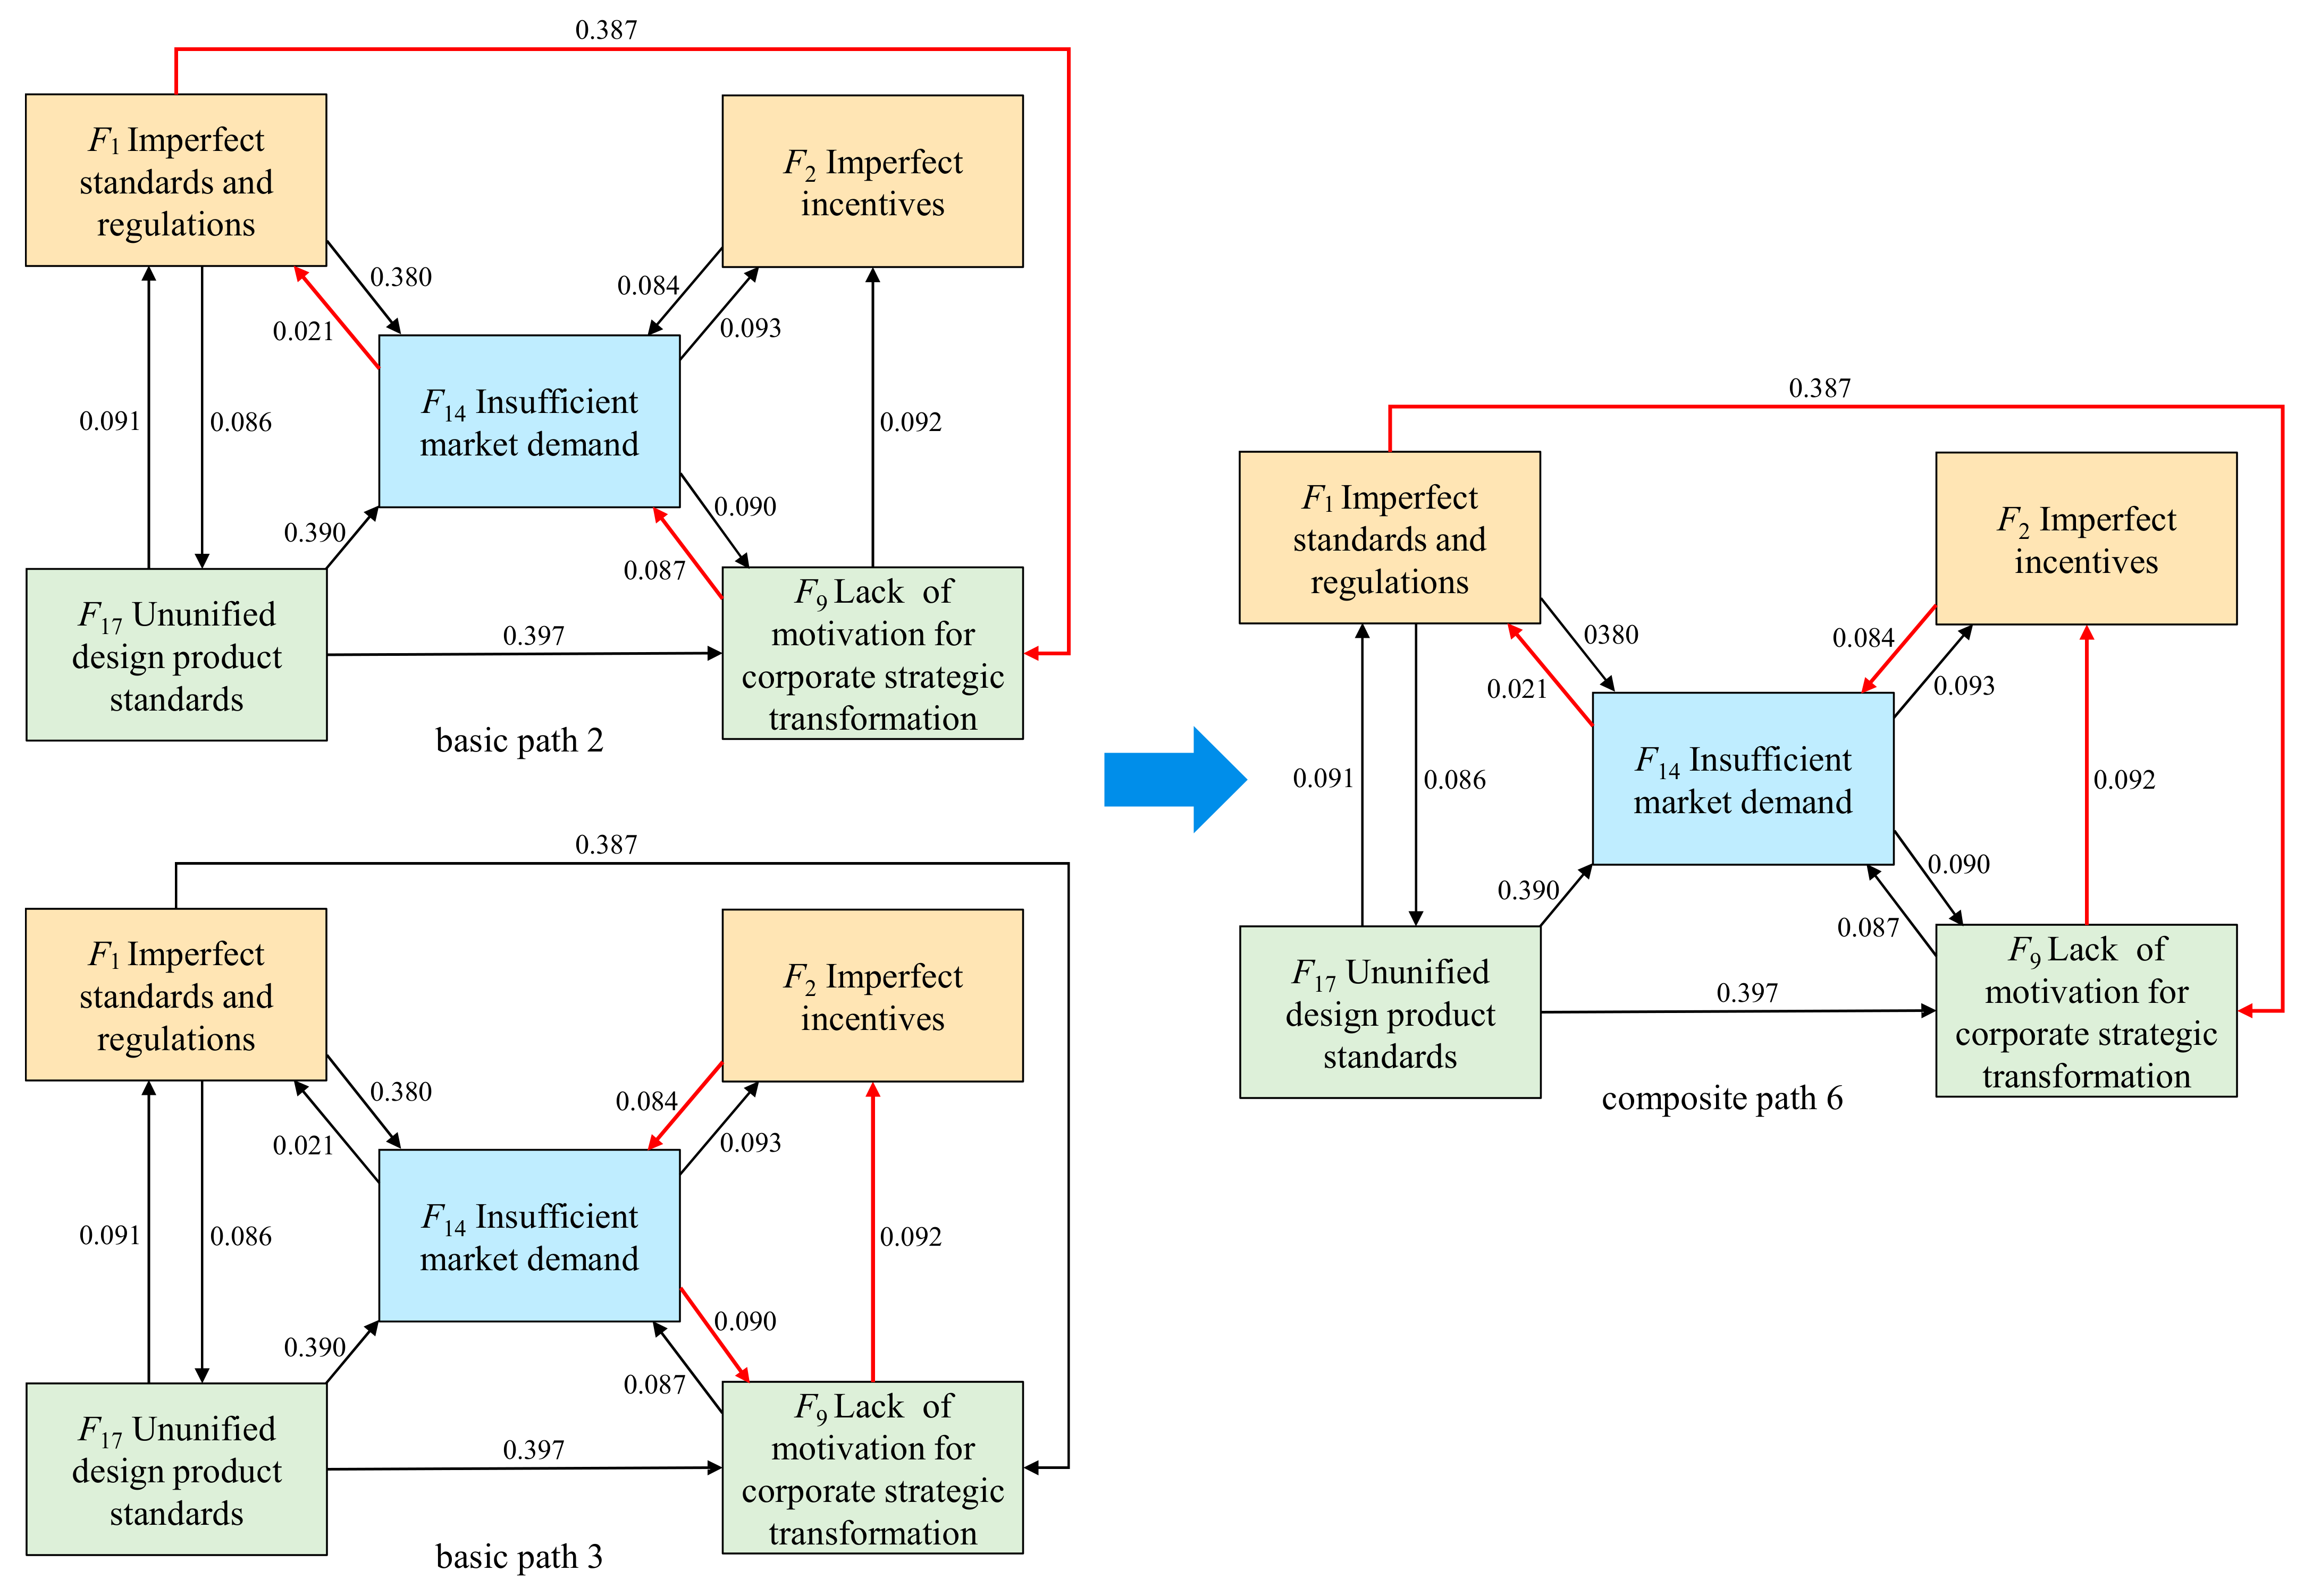
Evolution analysis of basic paths 2, 3, and composite path 6
As shown in Figure 7, compound path 6 is obtained by interactive evolution based on basic paths 2 and 3. Specifically, for basic path 2 F1F9F14F1 (0.495), due to imperfect standards and specifications, the enterprise lacks motivation for strategic transformation, which in turn leads to insufficient market demand. For basic path 3 F14F9F2F14 (0.266), due to insufficient market demand, the enterprise lacks motivation for strategic transformation, which in turn leads to imperfect incentives. The two paths are combined to obtain composite path 6 F1F9F2F14F1 (0.584). Due to imperfect standards and specifications, the design product standards are not unified, which in turn leads to imperfect incentives, and ultimately insufficient market demand.
In summary, in addition to direct effects, key influencing factors can also indirectly act through mediating variables. When formulating promotion strategies for prefabricated housing in Hainan Province, we should not only focus on these key factors, but also pay attention to the cross-coupling effects of multiple influencing links. Specifically, the cross-coupling effect refers to the dynamic relationship of interaction and mutual feedback between multiple influencing factors. For example, the five key factors F1, F2, F9, F14, and F17 not only affect the promotion of prefabricated housing in Hainan Province independently, but also have a more complex impact on the promotion of prefabricated housing in Hainan Province through interaction.

4.3. Suggestions on Formulating Countermeasures to Promote Prefabricated Housing in Hainan Province

(1)
The decision matrix of factors influencing the promotion of prefabricated housing in Hainan Province constructed using the Decision Testing and Evaluation Laboratory Method (DEMATEL) shows that F1, F2, F9, F14, and F17 are key influencing factors, and these factors have a greater impact on other influencing factors through a triggering effect. Therefore, when formulating promotion strategies for prefabricated housing in Hainan Province, these key factors should be given priority.
(2)
Identify the key influencing factors of the promotion of prefabricated housing in Hainan Province through the causal relationship diagram. The analysis shows that the influencing factors located in areas I, II, and IV in the four quadrants of the causal relationship diagram are F1, F2, F6, F7, F9, F12, F13, F14, F15, F16, F17, F18, F5, F19, and F20, which are the key influencing factors for the promotion of prefabricated housing in Hainan Province. When formulating countermeasures to promote prefabricated housing in Hainan Province, special attention should be paid, and corresponding countermeasures should be formulated based on these factors.
(3)
Based on the analysis of the evolution path of prefabricated housing promotion in Hainan Province based on the key influence chain, from the comparison of the weights of the composite path and the basic path, the weight of the composite path is significantly higher than the basic path, which indicates the interaction between key influencing factors The more complex the relationship, the more difficult it is to promote prefabricated housing in Hainan Province. This result suggests that in the process of promoting prefabricated housing in Hainan Province, it is necessary to comprehensively consider the complex relationships between influencing factors to formulate more effective promotion strategies.

5. Conclusions

This paper applies the fusion model based on BPNN–DEMATEL to the evaluation of the influencing factors of the promotion of prefabricated housing in Hainan Province, constructs an index system of the influencing factors of the promotion of prefabricated housing in Hainan Province, identifies key influencing factors through case empirical research, and explores the dynamic effect of key influencing factors. The following conclusions were drawn for this case:
(1)
Through survey interviews, policy collation, and literature analysis, a total of 522 original corpora were obtained. The grounded theory was used to implement open coding, axial coding, and selective coding on the original corpus. Combined with the opinions and suggestions of experts in the field and the experience of relevant practitioners, an index system of factors affecting the promotion of prefabricated housing in Hainan Province was finally formed, including twenty main categories (F1~F20) and four core categories of economic factors (S1), policy factors (S2), market factors (S3), and technical factors (S4).
(2)
Based on the four-quadrant causal relationship diagram, six key factors affecting the promotion of prefabricated housing in Hainan Province were identified, namely F1 (imperfect standards and specifications), F2 (imperfect incentives), F9 (lack of motivation for corporate strategic transformation), F14 (insufficient market demand), and F17 (imperfect design standardization and modular system). In the process of promoting prefabricated housing in Hainan Province, these key factors should be focused on.
(3)
Based on the evolution path of the key influencing factor chain, six key influencing factor action paths were formed, including three basic paths (F1F17F14F1, F1F9F14F1, F14F9F2F14) and three complex paths (F1F17F9F14F1, F1F17F9F2F14F1, F1F9F2F14F1). As the action relationship becomes more complicated, the impact gradually increases. When formulating the promotion strategy of prefabricated housing in Hainan Province, we should not only focus on these key factors, but should also pay attention to the cross-coupling effect of multiple influencing links.
(4)
This study used a method combining BPNN and DEMATEL models to systematically analyze the factors affecting the promotion of prefabricated housing in Hainan Province, providing a new perspective and idea for the study of the factors affecting the promotion of prefabricated housing. However, its ability to capture complex cross-coupling effects in depth may be limited. Therefore, in the future, tools such as coupling coordination degree models can be used to further explore the interactive relationship and feedback mechanism between these factors, in order to provide more precise policy support for decision makers.
(5)
At the same time, this study focuses on the practical problems encountered in the promotion of prefabricated housing in Hainan Province, and cannot fully reflect the universality of the promotion of prefabricated housing across the country. In future research, more regions can be covered, considering the differences in the promotion of prefabricated housing in different geographical environments and economic backgrounds, and exploring the evolution of influencing factors in different regions.

Author Contributions

Conceptualization, H.L. and W.Y.; methodology, W.Y., L.F. and Q.S.; software, W.Y., L.F. and Q.S.; validation, W.Y., L.F. and Q.S.; formal analysis, W.Y., L.F. and Q.S.; investigation, W.Y., L.F. and Q.S.; resources, W.Y., L.F. and Q.S.; data curation, W.Y., L.F. and Q.S.; writing—original draft, W.Y., L.F. and Q.S.; writing—review and editing, W.Y., L.F. and Q.S.; supervision, H.L. and W.Y.; project administration, H.L. All authors have read and agreed to the published version of the manuscript.

Funding

This research received no external funding.

Institutional Review Board Statement

Not applicable.

Informed Consent Statement

Not applicable.

Data Availability Statement

The sample data are derived from research interviews conducted by our research team, and due to confidentiality reasons, the data cannot be disclosed.

Conflicts of Interest

The authors declare no conflicts of interest.

References

  1. Ding, L.Y. Improve the legislation of carbon peak and carbon neutrality as soon as possible to promote the green, low-carbon and healthy development of my country. China Surv. Des. 2021, 18–19. (In Chinese) [Google Scholar]
  2. Zhu, H.; Zhang, D.; Goh, H.H.; Wang, S.; Ahmad, T.; Mao, D.; Liu, T.; Zhao, H.; Wu, T. Future data center energy-conservation and emission-reduction technologies in the context of smart and low-carbon city construction. Sustain. Cities Soc. 2023, 89, 104322. [Google Scholar] [CrossRef]
  3. Zhu, M.; Wang, Y.; Liu, R.; Fan, L. Stackelberg game-based method towards carbon-economy equilibrium for the prefabricated construction supply planning: A case study from China. Sustain. Cities Soc. 2024, 106, 105356. [Google Scholar] [CrossRef]
  4. Hainan Free Trade Port vigorously promotes prefabricated buildings to promote the transformation and upgrading of the construction industry. Concrete 2021, 88.
  5. Teng, Y.; Li, K.; Pan, W.; Ng, T. Reducing building life cycle carbon emissions through prefabrication: Evidence from and gaps in empirical studies. Build. Environ. 2018, 132, 125–136. [Google Scholar] [CrossRef]
  6. Hao, J.L.; Cheng, B.; Lu, W.; Xu, J.; Wang, J.; Bu, W.; Guo, Z. Carbon emission reduction in prefabrication construction during materialization stage: A BIM-based life-cycle assessment approach. Sci. Total Environ. 2020, 723, 137870. [Google Scholar] [CrossRef] [PubMed]
  7. Liu, S.; Li, Z.; Teng, Y.; Dai, L. A dynamic simulation study on the sustainability of prefabricated buildings. Sustain. Cities Soc. 2022, 77, 103551. [Google Scholar] [CrossRef]
  8. Gan, X.; Chang, R.; Zuo, J.; Wen, T.; Zillante, G. Barriers to the transition towards off-site construction in China: An Interpretive structural modeling approach. J. Clean. Prod. 2018, 197, 8–18. [Google Scholar] [CrossRef]
  9. Wuni, I.Y.; Shen, G.Q. Holistic review and conceptual framework for the drivers of offsite construction: A total interpretive structural modelling approach. Buildings 2019, 9, 117. [Google Scholar] [CrossRef]
  10. Dang, P.; Niu, Z.; Gao, S.; Hou, L.; Zhang, G. Critical factors influencing the sustainable construction capability in prefabrication of Chinese construction enterprises. Sustainability 2020, 12, 8996. [Google Scholar] [CrossRef]
  11. Peng, J.; Hou, C.; Shen, L. Progressive collapse analysis of corner-supported composite modular buildings. J. Build. Eng. 2022, 48, 103977. [Google Scholar] [CrossRef]
  12. Wang, X.; Du, Q.; Lu, C.; Li, J. Exploration in carbon emission reduction effect of low-carbon practices in prefabricated building supply chain. J. Clean. Prod. 2022, 368, 133153. [Google Scholar] [CrossRef]
  13. Wang, Q.; Shen, C.; Guo, Z.; Zhu, K.; Zhang, J.; Huang, M. Research on the barriers and strategies to promote prefabricated buildings in China. Buildings 2023, 13, 1200. [Google Scholar] [CrossRef]
  14. Kuzu, A.C. Application of fuzzy DEMATEL approach in maritime transportation: A risk analysis of anchor loss. Ocean Eng. 2023, 273, 113786. [Google Scholar] [CrossRef]
  15. Fontela, E.; Gabus, A. DEMATEL: Progress achieved. Pergamon 1974, 6, 361–363. [Google Scholar] [CrossRef]
  16. Bai, C.; Sarkis, J.; Dou, Y. Constructing a process model for low-carbon supply chain cooperation practices based on the DEMATEL and the NK model. Supply Chain Manag. Int. J. 2017, 22, 237–257. [Google Scholar]
  17. Singh, P.K.; Sarkar, P. A framework based on fuzzy Delphi and DEMATEL for sustainable product development: A case of Indian automotive industry. J. Clean. Prod. 2020, 246, 118991. [Google Scholar] [CrossRef]
  18. Feng, C.; Ma, R. Identification of the factors that influence service innovation in manufacturing enterprises by using the fuzzy DEMATEL method. J. Clean. Prod. 2020, 253, 120002. [Google Scholar] [CrossRef]
  19. Lin, Q.; Yang, S.; Yang, R.; Wu, H. Transistor modeling based on LM-BPNN and CG-BPNN for the GaAs pHEMT. Int. J. Numer. Model. Electron. Netw. Devices Fields 2024, 37, e3268. [Google Scholar] [CrossRef]
  20. Fan, X.; Lv, S.; Xia, C.; Ge, D.; Liu, C.; Lu, W. Strength prediction of asphalt mixture under interactive conditions based on BPNN and SVM. Case Stud. Constr. Mater. 2024, 21, e03489. [Google Scholar] [CrossRef]
Figure 1. Analysis model of prefabricated housing promotion in Hainan Province based on BPNN and DEMATEL.
Applsci 15 01116 g001
Figure 2. The relationship between the key factors affecting the promotion of prefabricated housing.
Applsci 15 01116 g002
Figure 3. Causal relationship diagram of influencing factors of prefabricated housing promotion.
Applsci 15 01116 g003
Figure 4. The mutual influence relationship diagram of key factors in promoting prefabricated housing in Hainan Province.
Applsci 15 01116 g004
Figure 5. Composite path 4 evolution diagram.
Applsci 15 01116 g005
Figure 6. Composite path 5 evolution diagram.
Applsci 15 01116 g006
Figure 7. Composite path 6 evolution diagram.
Applsci 15 01116 g007
Table 1. Tags formed by open coding of the original corpus.
Source
Classification
Original CorpusOpen Coding–Labeling
Labeling Initial ConceptualizationConceptualization Categorization
Research
interviews
Interviewee
1
……Currently, the standards for prefabricated housing are incomplete, leaving many construction situations unaddressed. The existing specifications are too vague, causing construction issues, and lack clear instructions, making it hard to ensure quality and safety. Therefore, urgent improvement of standards is needed……KI0101 There are imperfections in the standards and specifications, KI0102 not all specifications are covered, KI0104 construction technology is difficult to guarantee
Interviewee
2
……I’m not familiar with prefabricated housing policies or this construction type. I live in a traditional cast-in-place house and don’t know the difference. I’m unsure if prefabricated housing is stronger or more comfortable. In short, I don’t know much about it……KI0201 Not understanding the policy of prefabricated housing, KI0202 uncertain product quality
⋯⋯⋯⋯⋯⋯
Policy
summary
Policy
1
At a press conference on Hainan’s policy for promoting high-quality green development of prefabricated buildings, Liu Lianwei emphasized the need for a technical standard system tailored to Hainan’s realities and characteristics, and called for a strict quality assurance system to ensure product reliability and safety……KII0101 gradually forms a standard system, KII0102 gradually strengthens technology, KII0103 establishes product standards
Policy
2
Hainan Province Green Building (Prefabricated Building) 14th Five-Year Plan (2021–2025): …At a press conference on Hainan’s prefabricated building policy, Liu Lianwei stressed the need for a tailored technical standard system and a strict quality assurance system to ensure product reliability and safety……KII0201 Inadequate technical supervision of components, KII0202 inadequate construction supervision, KII0203 lack of technical supervision
⋯⋯⋯⋯⋯⋯
Literature
Analysis
Reference
1
Prefabricated buildings face challenges like high costs and risk-averse enterprises. The government should offer stronger incentives, as current ones are underused due to financial burdens……KIII0101 Component production is immature, KIII0102 component cost is high, KIII0103 construction plan is immature
Reference
2
Factors affecting assembly progress include insufficient policy standards, low component design data conversion efficiency, unsynchronized data in the industrial chain, and poor collaboration due to design changes, hindering the promotion and application of prefabricated buildings……KIII0201 Policy standards need to be improved, KIII0202 component design efficiency is low, KIII0203 component design changes are difficult to coordinate
⋯⋯⋯⋯⋯⋯
Table 2. Open coding labels and axial coding.
Open Coding–LabelingOpen Coding–ConceptualizationAxial Coding–Categorization
KI0101 standard specifications are incomplete and missing, KI0102 specifications are not fully coveredH1 standard specification missingB1 Incomplete standards and specifications
KII0101 gradually forms a standard system, KII0103 establishes product standardsH2 lack of standard system
KIII0201 policy standards need to be improvedH3 policy needs to be improved
⋯⋯⋯⋯⋯⋯
Table 3. The index system formed by implementing selective coding in the main coding category.
Core Category
(First-Level Indicator Factor)
Main Category
(Secondary Indicator Factor)
Core Category
(First-Level Indicator Factor)
Main Category
(Secondary Indicator Factor)
Policy
factors
S1
F1 Imperfect standards and regulationsEconomic factors
S2
F2 Imperfect incentivesF6 The construction cost is too high
F3 Insufficient policy formulation and publicityF7 The production and transportation cost of PC components is high
F4 Insufficient policy supportF8 The initial investment in scientific research is too high
F5 Imperfect regulatory mechanisms
Market
factors
S3
F9 Lack of motivation for corporate strategic transformationTechnical factors
S4
F15 Insufficient experience in tropical prefabricated housing design
F10 Imperfect industrial chainF16 Insufficient application of information technology
F11 Low degree of coordination among participating entitiesF17 Ununified design product standards
F12 Consumers lack awareness of prefabricated housingF18 Enterprises lack innovation capabilities
F13 Low market recognition of prefabricated housingF19 Construction units lack professional construction equipment
F14 Insufficient market demandF20 Lack of professional and technical personnel related to prefabricated housing
Table 4. Basic information of the respondents.
RespondentsNumberPercentage
EducationDoctorate and above421.05%
Master’s degree842.11%
Bachelor’s degree631.58%
College degree and below15.26%
WorkplaceGovernment526.33%
Investment and development units421.05%
Design units315.79%
Construction units210.52%
Universities and research institutes315.79%
Prefabricated housing users210.52%
Years of working experienceMore than 10 years421.05%
8–10 years631.58%
5–8 years736.84%
2~5 years210.53%
Table 5. Direct correlation matrix of factors affecting the promotion of prefabricated housing in Hainan Province.
T20×20F1F2F3F4F5F6F7F8F9F10F11F12F13F14F15F16F17F18F19F20
F10.0004.5473.1302.3632.4101.3313.6522.4594.3823.3942.3171.4181.4974.3043.3011.6070.9761.3771.3311.339
F20.2200.0000.6880.5200.5300.2930.8030.5410.9640.7460.5100.3120.3290.9460.7260.3530.2150.3030.2930.294
F30.3201.4530.0000.7550.7700.4251.1670.7861.4001.0850.7400.4530.4781.3751.0550.5130.3120.4400.4250.428
F40.4231.9251.3250.0001.0200.5641.5451.0411.8551.4371.8210.6000.6341.8211.3970.6800.4130.5830.5640.567
F50.4151.8871.2990.9800.0000.5521.5151.0201.8181.4080.9620.5880.6211.7861.3700.0260.4050.5710.5520.556
F60.7513.4152.3511.7751.8100.0002.7421.8473.2912.5491.7401.0651.1243.2322.4791.2070.7331.0341.0001.006
F70.2741.2450.8570.6470.6600.3650.0000.6731.2000.9300.6350.3880.4101.1790.9040.4400.2670.3770.3650.367
F80.4071.8491.2730.9610.9800.5411.4850.0001.7821.3800.9420.5760.6091.7501.3420.6530.3970.5600.5410.544
F90.2281.0380.7140.5390.5500.3040.8330.5610.0000.7750.5290.3240.3420.9820.7530.3670.2230.3140.3040.306
F100.2951.3400.9220.6960.7100.3921.0760.7240.7240.0000.6830.4180.4411.2680.9730.4730.2870.4060.3920.394
F110.4321.9621.3511.0201.0400.5751.5761.0611.8911.4650.0000.6120.6461.8571.4250.6930.4210.5940.5750.578
F120.7053.2082.2081.6671.7000.9392.5761.7353.0912.3941.6350.0001.0563.0362.3291.1330.6880.9710.9390.944
F130.6683.0382.0911.5781.6100.8902.4391.6432.9272.2681.5480.9470.0002.8752.2051.0730.6520.9200.8900.894
F140.2321.0570.7270.5490.5600.3090.8480.5711.0180.7890.5380.3290.3480.0000.7670.3730.2270.3200.3090.311
F150.3031.3770.9480.7160.7300.4031.1060.7451.3271.0280.7020.4290.4531.3040.0000.4870.2960.4170.4030.406
F160.6222.8301.9481.4711.5000.8292.2731.5312.7272.1131.4420.8820.9322.6792.0550.0000.6070.8570.8290.833
F171.0254.6603.2082.4222.4701.3653.7422.5204.4913.4792.3751.4531.5344.4113.3841.6470.0001.4111.3651.372
F180.7263.3022.2731.7161.7500.9672.6521.7863.1822.4651.6831.0291.0873.1252.3971.1670.7090.0000.9670.972
F190.7513.4152.3511.7751.8101.0002.7421.8473.2912.5491.7401.0651.1243.2322.4791.2070.7331.0340.0001.006
F200.7473.3962.3381.7651.8000.9942.7271.8373.2732.5351.7311.0591.1183.2142.4661.2000.7291.0290.9940.000
Table 6. Comprehensive influence matrix of factors affecting the promotion of prefabricated housing in Hainan Province.
Y20×20F1F2F3F4F5F6F7F8F9F10F11F12F13F14F15F16F17F18F19F20
F10.0130.1520.1040.0790.0800.0440.1220.0820.1450.1130.0790.0470.0500.1440.1100.0530.0330.0460.0440.045
F20.0070.0130.0230.0170.0180.0100.0270.0180.0320.0250.0170.0100.0110.0320.0240.0120.0070.0100.0100.010
F30.0110.0490.0130.0250.0260.0140.0390.0260.0460.0360.0250.0150.0160.0460.0350.0170.0100.0150.0140.014
F40.0140.0650.0450.0140.0350.0190.0520.0350.0620.0490.0510.0200.0220.0620.0470.0230.0140.0200.0190.019
F50.0140.0620.0430.0320.0120.0180.0500.0330.0590.0460.0320.0190.0200.0580.0450.0090.0130.0190.0180.018
F60.0250.1140.0780.0590.0600.0130.0920.0620.1090.0850.0590.0360.0380.1080.0830.0400.0240.0350.0330.034
F70.0090.0420.0290.0220.0220.0120.0130.0220.0400.0310.0220.0130.0140.0390.0300.0140.0090.0130.0120.012
F80.0140.0620.0420.0320.0330.0180.0500.0130.0590.0460.0320.0190.0200.0580.0450.0210.0130.0190.0180.018
F90.0080.0350.0240.0180.0180.0100.0280.0190.0130.0260.0180.0110.0110.0330.0250.0120.0070.0100.0100.010
F100.0100.0440.0310.0230.0230.0130.0360.0240.0310.0130.0230.0140.0150.0420.0320.0150.0100.0130.0130.013
F110.0140.0660.0450.0340.0350.0190.0530.0350.0630.0490.0140.0200.0220.0620.0480.0230.0140.0200.0190.019
F120.0240.1070.0740.0560.0570.0310.0860.0580.1020.0800.0560.0130.0350.1010.0780.0370.0230.0320.0310.032
F130.0220.1010.0700.0530.0540.0300.0810.0550.0970.0760.0530.0320.0130.0960.0740.0350.0220.0310.0300.030
F140.0080.0350.0240.0180.0190.0100.0280.0190.0340.0260.0180.0110.0120.0130.0260.0120.0080.0110.0100.010
F150.0100.0460.0320.0240.0240.0130.0370.0250.0440.0340.0240.0140.0150.0440.0130.0160.0100.0140.0130.014
F160.0210.0940.0650.0490.0500.0280.0760.0510.0900.0710.0490.0290.0310.0890.0690.0120.0200.0290.0280.028
F170.0340.1560.1070.0810.0820.0460.1250.0840.1490.1160.0810.0490.0510.1470.1130.0540.0130.0470.0460.046
F180.0240.1100.0760.0570.0580.0320.0890.0600.1050.0820.0570.0340.0360.1040.0800.0380.0240.0130.0320.032
F190.0250.1140.0780.0590.0600.0330.0920.0620.1090.0850.0590.0360.0380.1080.0830.0400.0240.0350.0130.034
F200.0250.1130.0780.0590.0600.0330.0910.0610.1080.0850.0590.0350.0370.1070.0820.0390.0240.0340.0330.013
Table 7. DEMATEL calculation results of influencing factor evaluation indicators.
Influencing FactorsQiPiWiWi-SortRiRi-Sort
F11.58580.33161.917521.25422
F20.33291.57991.91293−1.247020
F30.49291.08121.574014−0.588314
F40.68800.81121.499217−0.123210
F50.62040.82781.448320−0.207412
F61.18600.44831.634370.73773
F70.41961.26471.68436−0.845217
F80.63280.84511.478019−0.212313
F90.34631.49681.84305−1.150519
F100.43741.17421.611710−0.736816
F110.67280.82611.498918−0.153311
F121.11270.47861.5913130.63407
F131.05270.50651.5592150.54628
F140.35291.49421.84714−1.141318
F150.46621.14151.607712−0.675315
F160.97940.52141.5008160.45809
F171.62580.32311.948911.30271
F181.14600.46441.6103110.68166
F191.18600.44831.634380.73774
F201.17930.45091.630290.72845
Table 8. Comprehensive ranking table of influencing factors.
Influencing FactorsWiRi D D -Sort
F11.91751.25421.28215
F21.9129−1.24702.28341
F31.5740−0.58830.593414
F41.4992−0.12321.28106
F51.4483−0.20740.486119
F61.63430.73771.16917
F71.6843−0.84521.063611
F81.4780−0.21230.523818
F91.8430−1.15051.53063
F101.6117−0.73680.574616
F111.4989−0.15330.546317
F121.59130.63401.12929
F131.55920.54621.099110
F141.8471−1.14131.29084
F151.6077−0.67531.16198
F161.50080.45800.327520
F171.94891.30271.91212
F181.61030.68160.777012
F191.63430.73770.717513
F201.63020.72840.578315
Table 9. Comprehensive influence matrix of key factors for promoting prefabricated housing in Hainan Province.
Y 5 × 5 F1F2F9F14F17
F10.0240.4020.3870.3800.086
F20.0190.0240.0850.0840.019
F90.0200.0920.0240.0870.020
F140.0210.0930.0900.0240.020
F170.0910.4120.3970.3900.024
Disclaimer/Publisher’s Note: The statements, opinions and data contained in all publications are solely those of the individual author(s) and contributor(s) and not of MDPI and/or the editor(s). MDPI and/or the editor(s) disclaim responsibility for any injury to people or property resulting from any ideas, methods, instructions or products referred to in the content.

