
Evaluation of Photovoltaic Inverters According to Output Current Distortion in a Steady-State and Maximum Power Point Tracking


Abstract
1. Introduction
2. Overview of the Relevant Standards
2.1. IEEE 1547-2018 Standard
2.2. IEC 61727:2004 Standard
2.3. EN 50530:2010 Standard
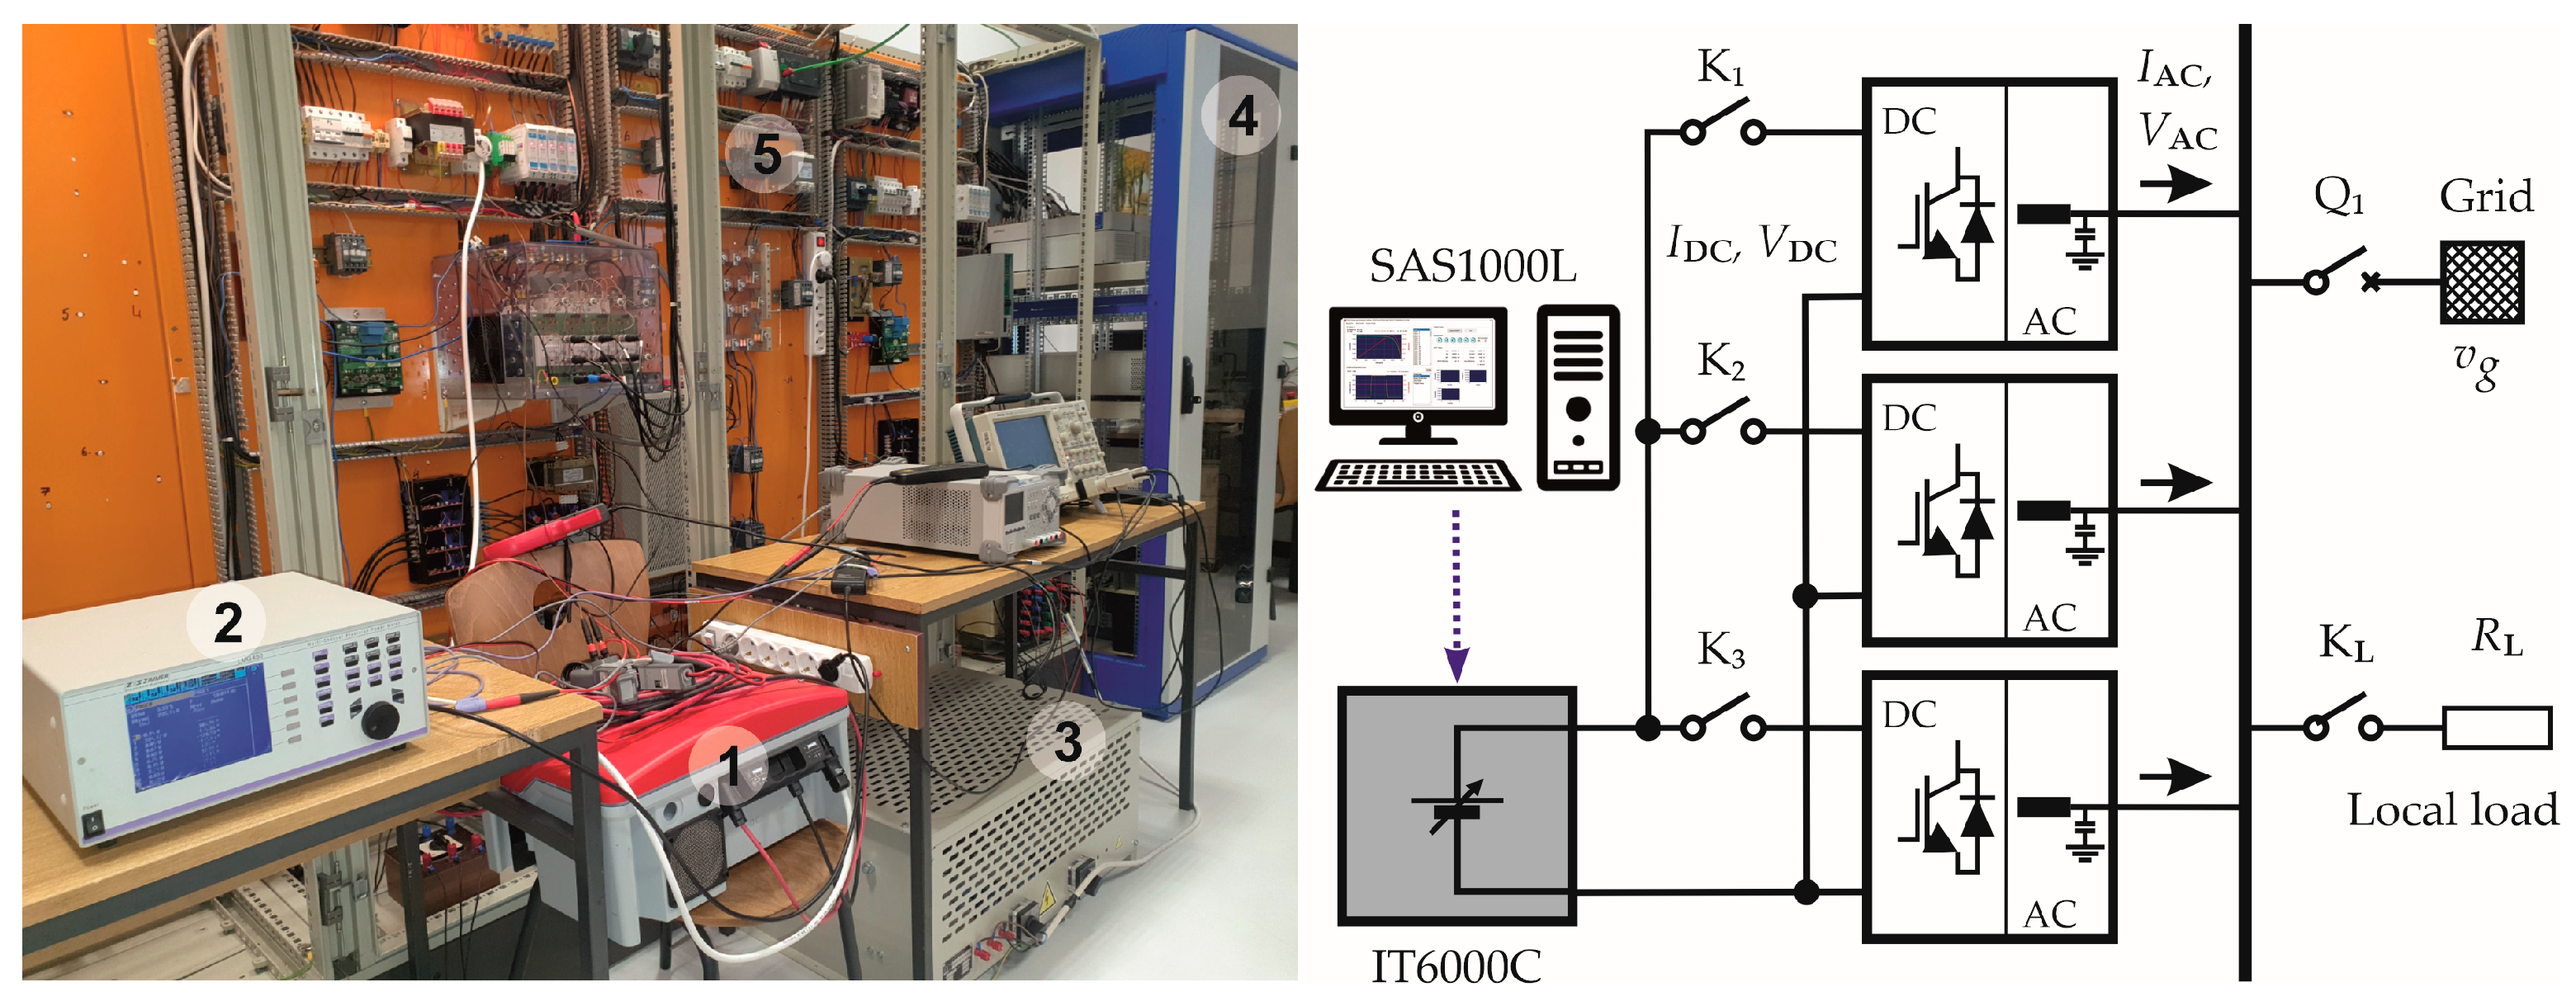
3. The Measurement Setup
4. Test Results
4.1. Output Current Distortion During Steady-State Operation at MPP
4.1.1. SOLIS S5-EH1P3.6K-l Steady-State Operation
4.1.2. SMA Sunny Boy SB 3300-11 Steady-State Operation
4.1.3. DIEHL Platinum 6300TLD-ENS1-DCT-UNI Steady-State Operation
4.2. Output Current Distortion During MPPT
4.2.1. SOLIS S5-EH1P3.6K-l-Based MPPT
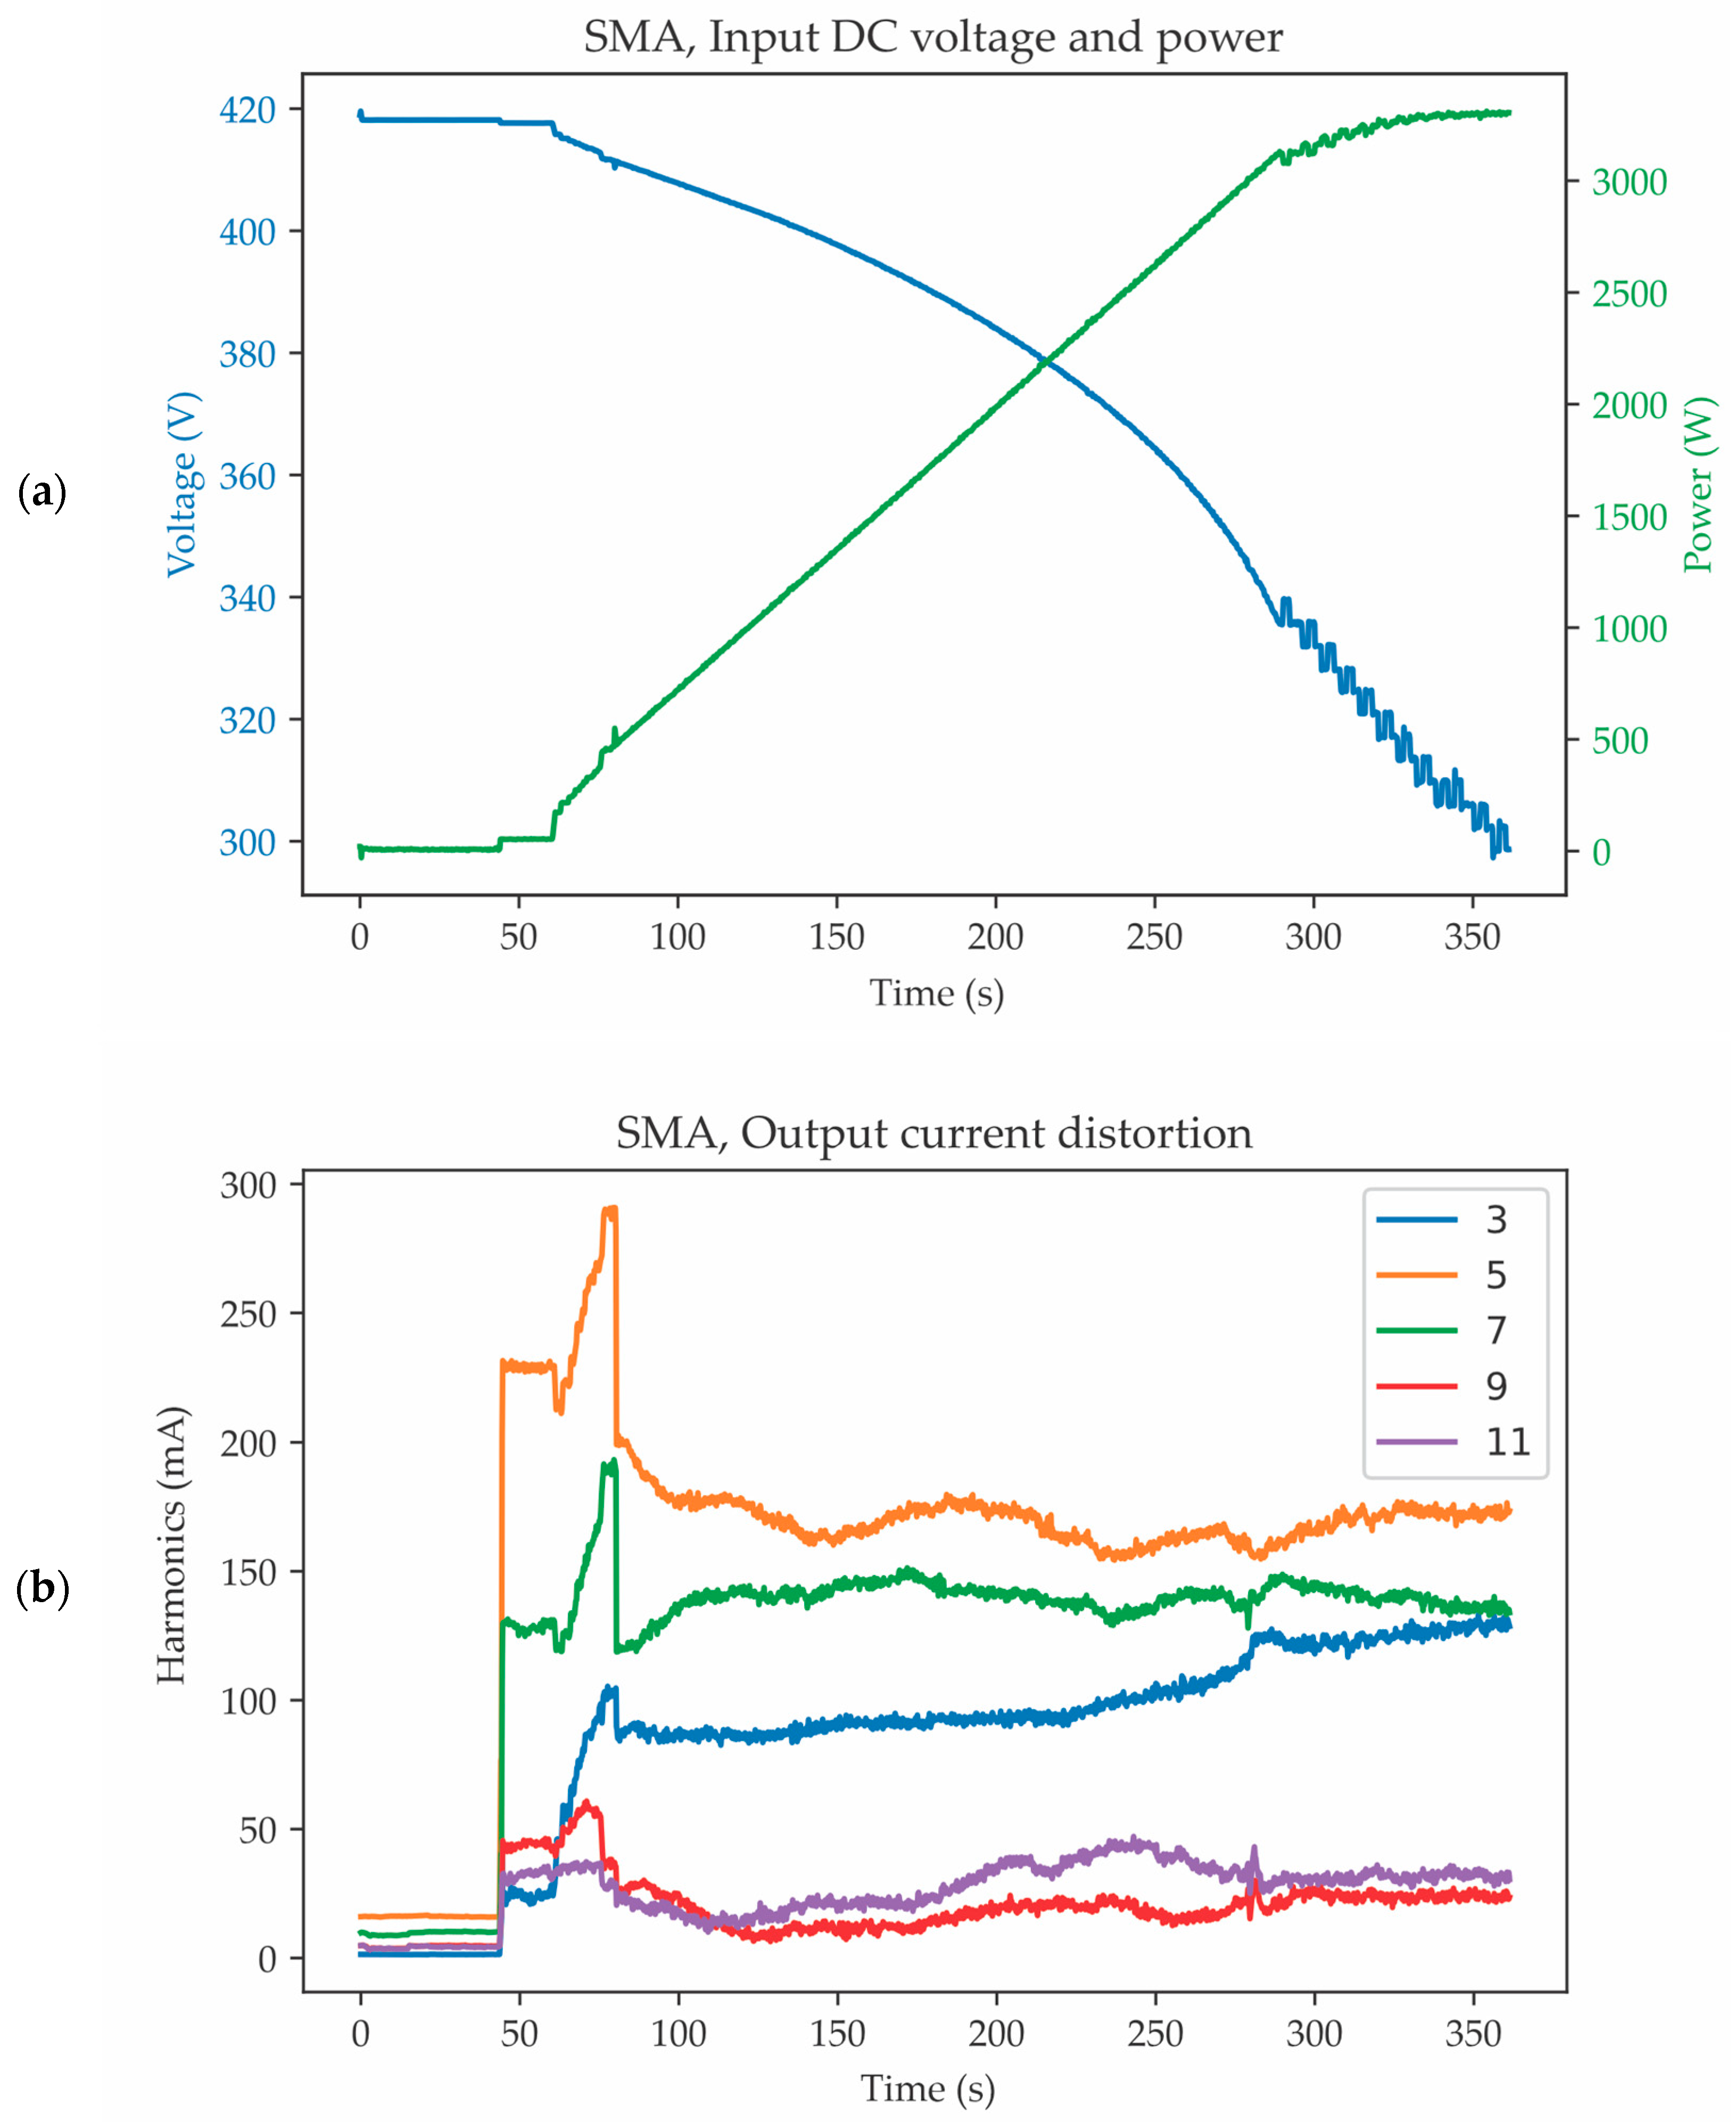
4.2.2. SMA Sunny Boy SB 3300-11-Based MPPT
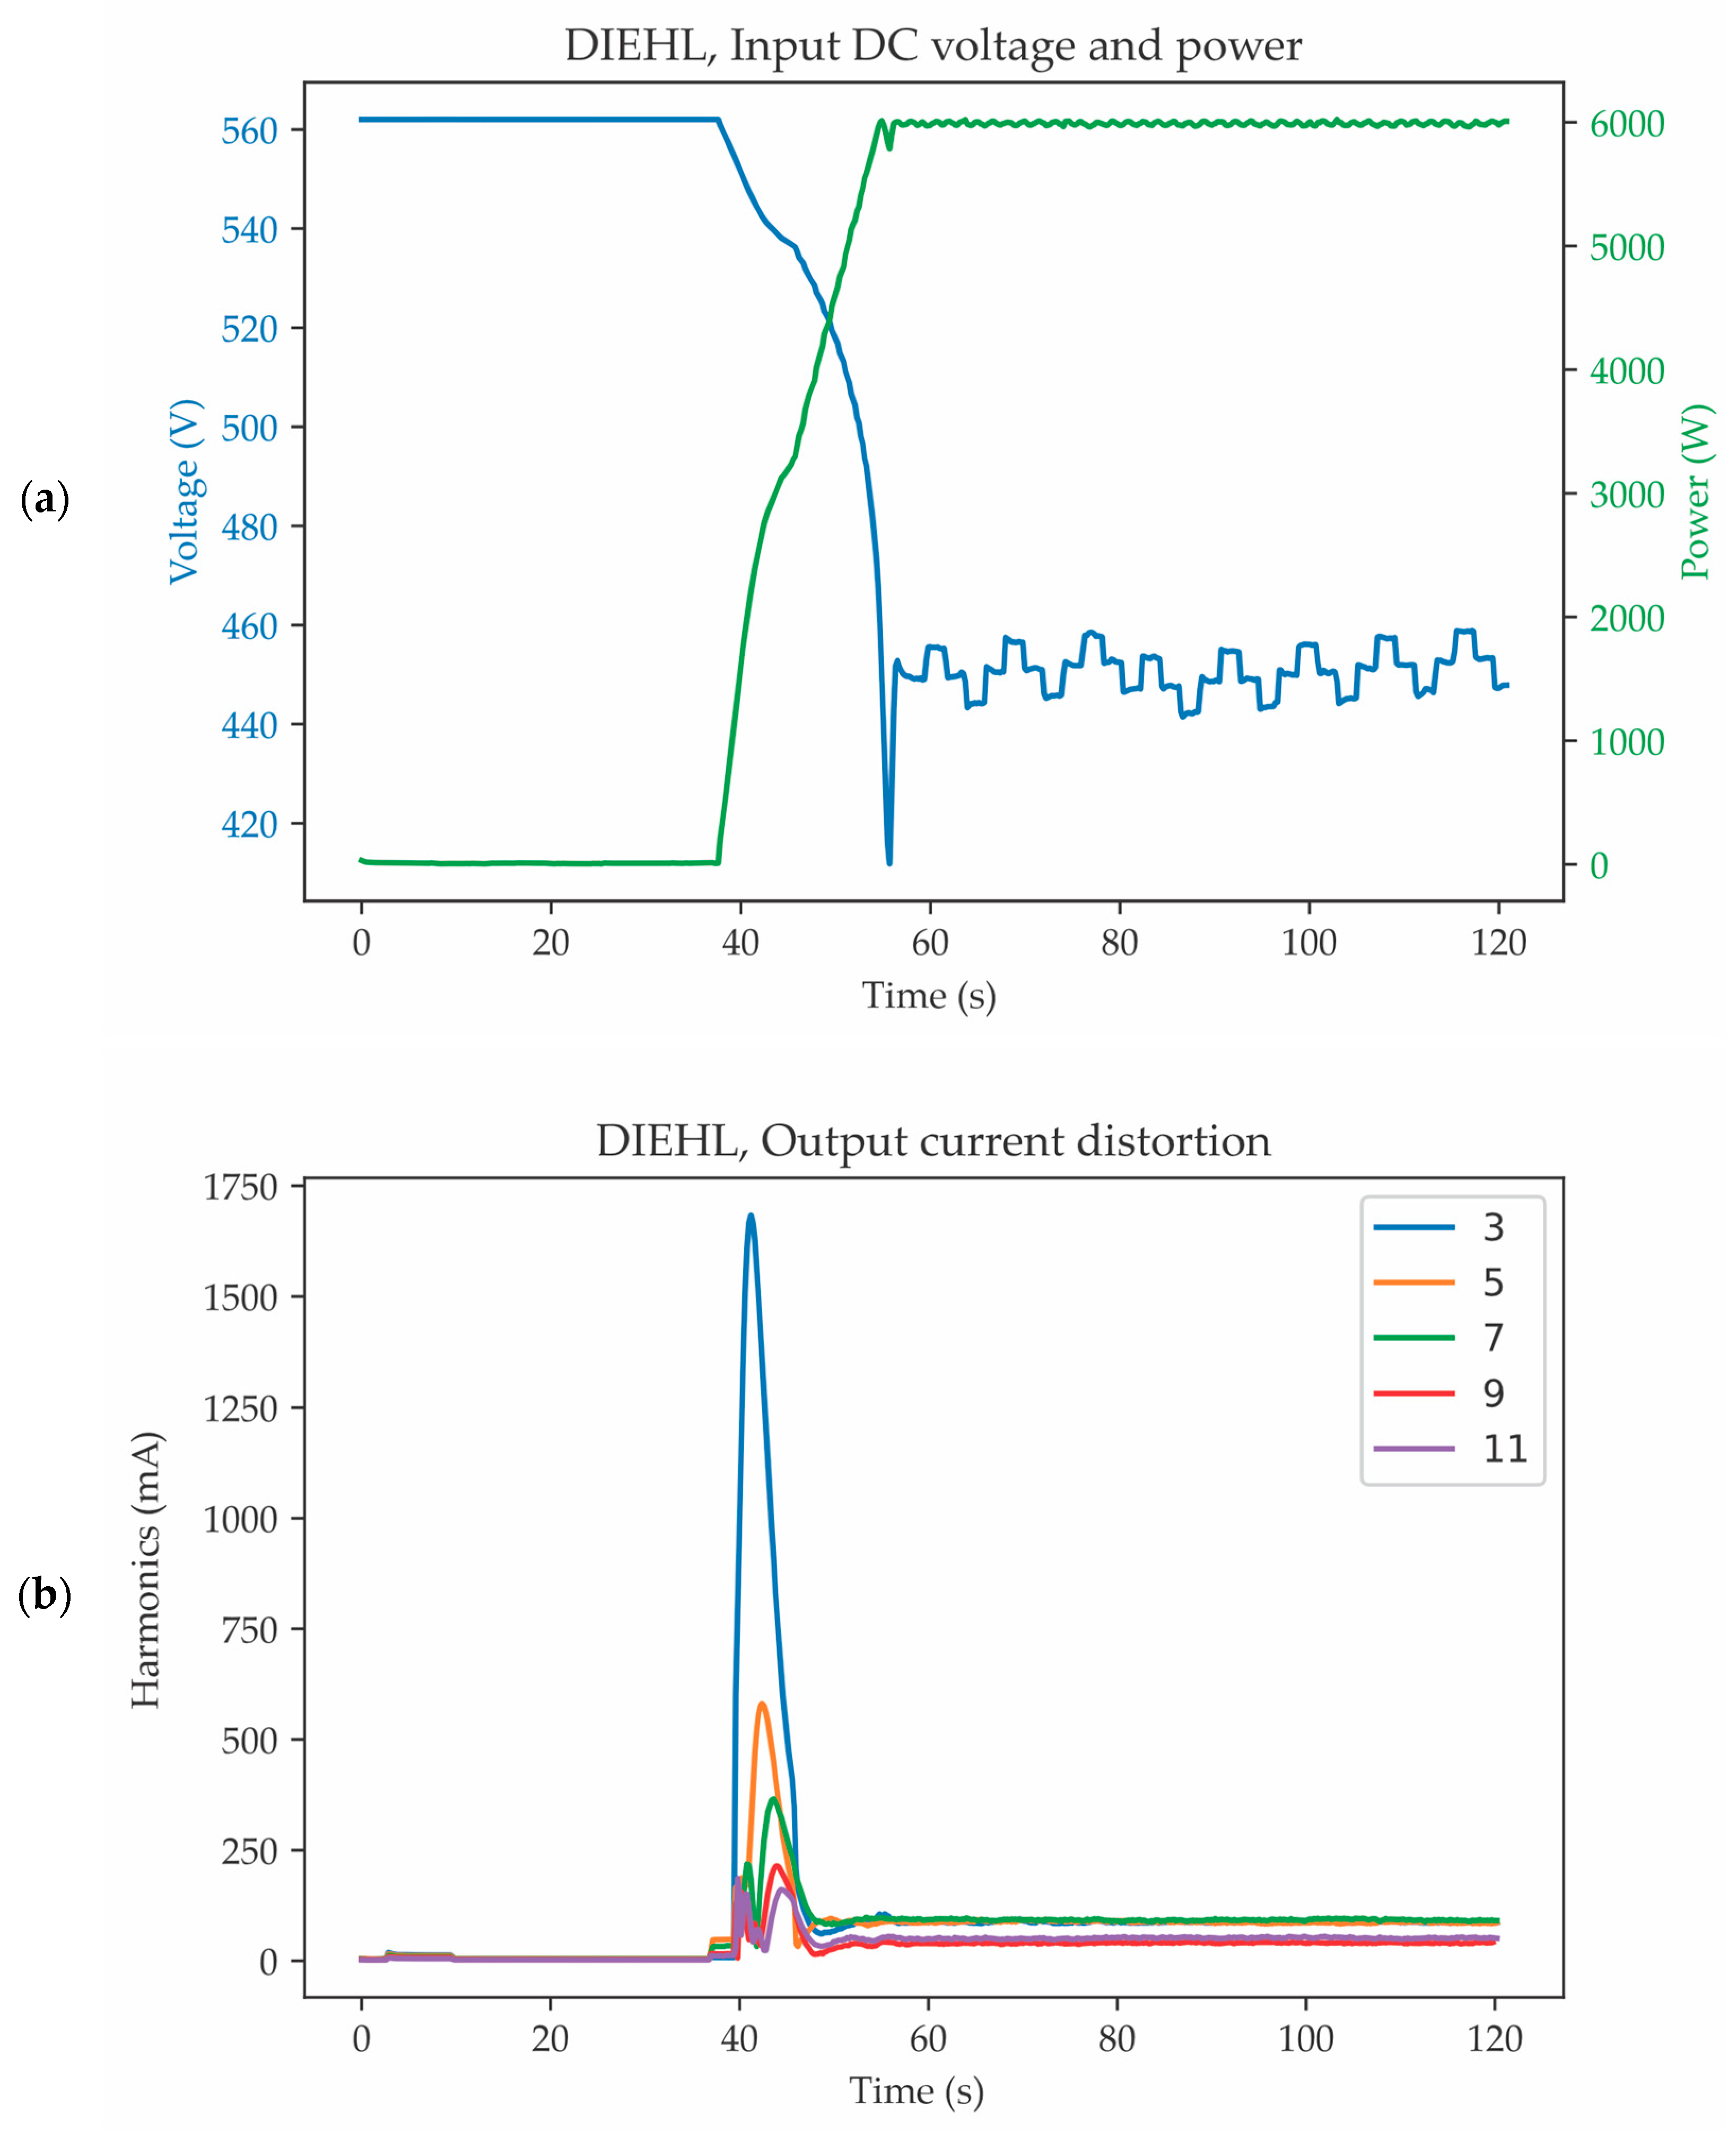
4.2.3. DIEHL Platinum 6300TLD-ENS1-DCT-UNI-Based MPPT
5. Discussion
6. Conclusions
Author Contributions
Funding
Institutional Review Board Statement
Informed Consent Statement
Data Availability Statement
Conflicts of Interest
References
- International Energy Agency. Renewables 2023: Analysis and Forecast to 2028; International Energy Agency: Paris, France, 2023; Available online: https://www.iea.org/reports/renewables-2023 (accessed on 18 December 2024).
- Eltawil, M.A.; Zhao, Z. MPPT Techniques for Photovoltaic Applications. Renew. Sustain. Energy Rev. 2013, 25, 793–813. [Google Scholar] [CrossRef]
- Hache, E.; Palle, A. Renewable Energy Source Integration into Power Networks, Research Trends and Policy Implications: A Bibliometric and Research Actors Survey Analysis. Energy Policy 2019, 124, 23–35. [Google Scholar] [CrossRef]
- Kamarzaman, N.A.; Tan, C.W. A Comprehensive Review of Maximum Power Point Tracking Algorithms for Photovoltaic Systems. Renew. Sustain. Energy Rev. 2014, 37, 585–598. [Google Scholar] [CrossRef]
- Verma, D.; Nema, S.; Shandilya, A.M.; Dash, S.K. Maximum Power Point Tracking (MPPT) Techniques: Recapitulation in Solar Photovoltaic Systems. Renew. Sustain. Energy Rev. 2016, 54, 1018–1034. [Google Scholar] [CrossRef]
- Hossain, M.A.; Pota, H.R.; Hossain, J.; Blaabjerg, F. Evolution of Microgrids with Converter-Interfaced Generations: Challenges and Opportunities. Int. J. Electr. Power Energy Syst. 2019, 109, 160–186. [Google Scholar] [CrossRef]
- Yaghoobi, J.; Alduraibi, A.; Martin, D.; Zare, F.; Eghbal, D.; Memisevic, R. Impact of High-Frequency Harmonics (0–9 kHz) Generated by Grid-Connected Inverters on Distribution Transformers. Int. J. Electr. Power Energy Syst. 2020, 122, 106177. [Google Scholar] [CrossRef]
- Anurangi, R.O.; Rodrigo, A.S.; Jayatunga, U. Effects of High Levels of Harmonic Penetration in Distribution Networks with Photovoltaic Inverters. In Proceedings of the 2017 IEEE International Conference on Industrial and Information Systems (ICIIS), Peradeniya, Sri Lanka, 15–16 December 2017; pp. 1–6. [Google Scholar] [CrossRef]
- Nicolae, P.-M.; Marinescu, R.-F.; Marinescu, D.-C.; Nicolae, M.-Ş.; Nicolae, I.-D. Harmonics Induced by Inverters from a Photovoltaic Plant in the Power Grid. In Proceedings of the 2018 IEEE International Symposium on Electromagnetic Compatibility and 2018 IEEE Asia-Pacific Symposium on Electromagnetic Compatibility (EMC/APEMC), Suntec City, Singapore, 14–18 May 2018; pp. 821–826. [Google Scholar] [CrossRef]
- Pereira, J.L.M.; Leal, A.F.R.; Almeida, G.O.d.; Tostes, M.E.d.L. Harmonic Effects Due to the High Penetration of Photovoltaic Generation into a Distribution System. Energies 2021, 14, 4021. [Google Scholar] [CrossRef]
- Naidu, T.A.; Ali Ahmed Albeshr, H.M.; Al-Sabounchi, A.; Sadanandan, S.K.; Ghaoud, T. A Study on Various Conditions Impacting the Harmonics at Point of Common Coupling in On-Grid Solar Photovoltaic Systems. Energies 2023, 16, 6398. [Google Scholar] [CrossRef]
- Peiris, K.; Elphick, S.; David, J.; Robinson, D. Impact of Multiple Grid-Connected Solar PV Inverters on Harmonics in the High-Frequency Range. Energies 2024, 17, 2639. [Google Scholar] [CrossRef]
- Alawasa, K.M.; Al-Badi, A.H. Investigation and Analysis of the Power Quality in an Academic Institution’s Electrical Distribution System. Energies 2024, 17, 3998. [Google Scholar] [CrossRef]
- Apse-Apsitis, P.; Krievs, O.; Avotins, A. Impact of Household PV Generation on the Voltage Quality in 0.4 kV Electric Grid—Case Study. Energies 2023, 16, 2554. [Google Scholar] [CrossRef]
- Hernández-Mayoral, E.; Jiménez-Román, C.R.; Enriquez-Santiago, J.A.; López-López, A.; González-Domínguez, R.A.; Ramírez-Torres, J.A.; Rodríguez-Romero, J.D.; Jaramillo, O.A. Power Quality Analysis of a Microgrid-Based on Renewable Energy Sources: A Simulation-Based Approach. Computation 2024, 12, 226. [Google Scholar] [CrossRef]
- Adak, S. Power Factor Analysis of Grid-Connected Solar Inverter under Different Irradiance Levels throughout the Day. Energies 2024, 17, 3632. [Google Scholar] [CrossRef]
- Mao, M.; Ni, X.; Xu, Z.; Sun, H.; Yin, C. A Comprehensive Analysis of the Influencing Factors of Interharmonics on a Distributed PV Grid-Connected Power Generation System. Energies 2024, 17, 5958. [Google Scholar] [CrossRef]
- Asma, R.; Zahzouh, Z.; Boulahchiche, S. Impact of Grid-Connected Photovoltaic System under Different Weather Conditions and Load Types. J. Appl. Eng. Sci. 2023, 21, 721–728. [Google Scholar] [CrossRef]
- Tamrakar, E.; Patel, R.N.; Kumar, A.; Sahu, A.; Singla, R. Experimental Investigation and Power Quality Analysis of Solar Micro-Inverter for Different Operating Conditions. E3S Web Conf. 2023, 405, 02024. [Google Scholar] [CrossRef]
- Chmielowiec, K.; Topolski, Ł.; Piszczek, A.; Rodziewicz, T.; Hanzelka, Z. Study on Energy Efficiency and Harmonic Emission of Photovoltaic Inverters. Energies 2022, 15, 2857. [Google Scholar] [CrossRef]
- Jaiswal, A.; Sachan, S.; Deb, S. A Novel Technique to Detect and Mitigate Harmonics during Islanding in Grid-Connected PV Systems. Energy Rep. 2024, 12, 3940–3956. [Google Scholar] [CrossRef]
- Gada, S.; Fekik, A.; Mahdal, M.; Vaidyanathan, S.; Maidi, A.; Bouhedda, A. Improving Power Quality in Grid-Connected Photovoltaic Systems: A Comparative Analysis of Model Predictive Control in Three-Level and Two-Level Inverters. Sensors 2023, 23, 7901. [Google Scholar] [CrossRef] [PubMed]
- Bandahalli Mallappa, P.K.; Garcia, H.M.; Quesada, G.V. Power Quality Enhancement in a Grid-Integrated Photovoltaic System Using Hybrid Techniques. Appl. Sci. 2021, 11, 10120. [Google Scholar] [CrossRef]
- Benabdelkader, A.; Draou, A.; AlKassem, A.; Toumi, T.; Denai, M.; Abdelkhalek, O.; Ben Slimene, M. Enhanced Power Quality in Single-Phase Grid-Connected Photovoltaic Systems: An Experimental Study. Energies 2023, 16, 4240. [Google Scholar] [CrossRef]
- Al-Shetwi, A.Q.; Hannan, M.A.; Jern, K.P.; Alkahtani, A.A.; PG Abas, A.E. Power quality assessment of grid-connected PV system in compliance with the recent integration requirements. Electronics 2020, 9, 366. [Google Scholar] [CrossRef]
- IEEE Std 1547-2018 (Revision of IEEE Std 1547-2003); IEEE Standard for Interconnection and Interoperability of Distributed Energy Resources with Associated Electric Power Systems Interfaces. IEEE: Piscataway, NJ, USA, 2018; pp. 1–138. [CrossRef]
- IEC 61727:2004; Photovoltaic (PV) Systems—Characteristics of the Utility Interface. International Electrotechnical Commission: Geneva, Switzerland, 2004.
- EN 50530:2010+A1:2013 (Amendment to EN 50530:2010); Overall Efficiency of Grid Connected Photovoltaic Inverters. European Committee for Electrotechnical Standardization; CENELEC: Brussels, Belgium, 2013; pp. 1–40.
- IEEE Std 519-2022 (Revision of IEEE Std 519-2014); IEEE Standard for Harmonic Control in Electric Power Systems. IEEE: Piscataway, NJ, USA, 2022; pp. 1–31. [CrossRef]
- IT6000C Bidirectional Programmable DC Power Supply. Available online: https://www.itechate.com/en/product/dc-power-supply/IT6000C.html (accessed on 19 December 2024).
- SAS1000 Solar Array Simulation Software. Available online: https://www.itechate.com/uploadfiles/catalogue/SAS1000-en.pdf (accessed on 19 December 2024).
- Dimitrijević, M.; Petronijević, M. The System for Distributed Energy Resources Testing According to the IEEE 1547-2018 Standard. COMPEL Int. J. Comput. Math. Electr. Electron. Eng. 2023, 42, 1019–1036. [Google Scholar] [CrossRef]
- SOLIS S5-EH1P3.6K-l. Available online: https://www.solisinverters.com/uk/energy_storage_inverter5/3_6k_s5_l_en.html (accessed on 19 December 2024).
- SMA Sunny Boy Operating Parameters. Available online: https://files.sma.de/downloads/SB_SMC_WB_Par-TB-TEN113160.pdf (accessed on 19 December 2024).
- PLATINUM® Inverter, Monitoring & Energy Management. Available online: http://www.avdira-solar.eu/pdf/diehl/en/diehl_catalogue_en.pdf (accessed on 19 December 2024).
- Sandelic, M.; Sangwongwanich, A.; Blaabjerg, F. Reliability evaluation of PV systems with integrated battery energy storage systems: DC-coupled and AC-coupled configurations. Electronics 2019, 8, 1059. [Google Scholar] [CrossRef]


| Odd Harmonic | % | Even Harmonic | % |
|---|---|---|---|
| DC | 0.5 | h = 2 | 1.0 |
| h < 11 | 4.0 | h = 4 | 2.0 |
| 11 ≤ h < 17 | 2.0 | h = 6 | 3.0 |
| 17 ≤ h < 23 | 1.5 | 8 ≤ h < 24 | 1.5 |
| 23 ≤ h < 35 | 0.6 | 24 ≤ h < 36 | 0.6 |
| 35 ≤ h < 50 | 0.3 | 36 ≤ h < 50 | 0.3 |
| Odd Harmonic | % | Even Harmonic | % |
|---|---|---|---|
| 3 < h < 9 | 4.0 | DC | 1.0 |
| 11 ≤ h < 15 | 2.0 | 2 < h < 8 | 1.0 |
| 17 ≤ h < 21 | 1.5 | 10 < h < 32 | 0.5 |
| 23 ≤ h < 33 | 0.6 |
| SOLIS | SMA | DIEHL | |
|---|---|---|---|
| Rated power (Pr) | 3.6 kVA | 3.3 kVA | 6 kVA |
| Rated current (Ir) | 15.6 A | 14.3 A | 26.1 A |
| Maximum MPP voltage (VMPP,max) | 300 V | 300 V | 450 V |
| Rated input voltage (VDC,r) | 250 V | 250 V | 425 V |
| Minimum MPP voltage (VMPP,min) | 200 V | 200 V | 400 V |
| Harmonic Order | VMPP,max | VDC,r | VMPP,min | ||||||||||||
|---|---|---|---|---|---|---|---|---|---|---|---|---|---|---|---|
| 100% | 75% | 50% | 25% | 5% | 100% | 75% | 50% | 25% | 5% | 100% | 75% | 50% | 25% | 5% | |
| TRD [%] | 3.59 | 3.53 | 3.65 | 3.83 | 3.88 | 3.69 | 3.50 | 3.58 | 3.84 | 3.90 | 3.65 | 3.50 | 3.70 | 3.92 | 3.97 |
| DC | 0.07 | 0.01 | 0.09 | 0.17 | 0.25 | 0.06 | 0.22 | 0.22 | 0.20 | 0.18 | 0.10 | 0.24 | 0.13 | 0.20 | 0.14 |
| 1 | 93.17 | 70.62 | 47.42 | 23.64 | 4.17 | 92.46 | 70.02 | 47.15 | 23.56 | 4.22 | 91.96 | 69.93 | 47.07 | 23.55 | 4.27 |
| 2 | 0.76 | 0.71 | 0.44 | 0.25 | 0.04 | 0.76 | 0.54 | 0.53 | 0.26 | 0.02 | 0.64 | 0.55 | 0.51 | 0.28 | 0.07 |
| 3 | 1.40 | 1.23 | 1.32 | 1.85 | 2.30 | 1.40 | 1.27 | 1.35 | 1.87 | 2.30 | 1.42 | 1.28 | 1.37 | 1.87 | 2.28 |
| 4 | 0.21 | 0.20 | 0.11 | 0.07 | 0.06 | 0.14 | 0.12 | 0.14 | 0.06 | 0.08 | 0.10 | 0.11 | 0.11 | 0.06 | 0.11 |
| 5 | 0.82 | 0.76 | 0.96 | 1.82 | 1.74 | 1.05 | 0.77 | 1.03 | 1.85 | 1.74 | 1.01 | 0.85 | 1.07 | 1.88 | 1.84 |
| 6 | 0.08 | 0.07 | 0.05 | 0.06 | 0.02 | 0.08 | 0.07 | 0.06 | 0.05 | 0.05 | 0.07 | 0.08 | 0.07 | 0.08 | 0.05 |
| 7 | 2.65 | 2.74 | 2.83 | 2.41 | 2.05 | 2.77 | 2.73 | 2.75 | 2.39 | 1.97 | 2.74 | 2.71 | 2.82 | 2.41 | 1.93 |
| 8 | 0.12 | 0.09 | 0.08 | 0.02 | 0.03 | 0.10 | 0.03 | 0.07 | 0.04 | 0.03 | 0.03 | 0.05 | 0.01 | 0.08 | 0.11 |
| 9 | 0.24 | 0.17 | 0.34 | 0.27 | 0.24 | 0.12 | 0.21 | 0.23 | 0.20 | 0.28 | 0.07 | 0.13 | 0.31 | 0.29 | 0.42 |
| 10 | 0.07 | 0.05 | 0.06 | 0.02 | 0.02 | 0.16 | 0.08 | 0.06 | 0.03 | 0.03 | 0.12 | 0.08 | 0.06 | 0.11 | 0.11 |
| 11 | 1.19 | 1.20 | 1.30 | 1.18 | 1.36 | 0.85 | 1.18 | 1.15 | 1.17 | 1.47 | 0.74 | 1.09 | 1.28 | 1.32 | 1.58 |
| 12 | 0.05 | 0.04 | 0.04 | 0.01 | 0.06 | 0.14 | 0.02 | 0.06 | 0.01 | 0.02 | 0.05 | 0.07 | 0.11 | 0.14 | 0.15 |
| 13 | 0.38 | 0.30 | 0.26 | 0.28 | 0.37 | 0.76 | 0.42 | 0.33 | 0.29 | 0.53 | 0.87 | 0.44 | 0.33 | 0.28 | 0.43 |
| 14 | 0.08 | 0.07 | 0.05 | 0.06 | 0.02 | 0.11 | 0.03 | 0.07 | 0.04 | 0.02 | 0.05 | 0.08 | 0.11 | 0.13 | 0.14 |
| 15 | 0.31 | 0.27 | 0.13 | 0.14 | 0.08 | 0.33 | 0.23 | 0.06 | 0.20 | 0.14 | 0.38 | 0.31 | 0.18 | 0.19 | 0.08 |
| 16 | 0.14 | 0.10 | 0.08 | 0.04 | 0.02 | 0.09 | 0.06 | 0.07 | 0.06 | 0.02 | 0.07 | 0.07 | 0.09 | 0.09 | 0.08 |
| 17 | 0.34 | 0.33 | 0.20 | 0.08 | 0.07 | 0.43 | 0.29 | 0.17 | 0.07 | 0.08 | 0.48 | 0.36 | 0.23 | 0.04 | 0.17 |
| 18 | 0.11 | 0.07 | 0.05 | 0.02 | 0.02 | 0.11 | 0.06 | 0.06 | 0.01 | 0.01 | 0.08 | 0.08 | 0.06 | 0.05 | 0.05 |
| 19 | 0.30 | 0.21 | 0.14 | 0.11 | 0.02 | 0.36 | 0.20 | 0.08 | 0.09 | 0.05 | 0.33 | 0.19 | 0.09 | 0.07 | 0.09 |
| 20 | 0.07 | 0.06 | 0.04 | 0.03 | 0.02 | 0.08 | 0.05 | 0.03 | 0.02 | 0.02 | 0.08 | 0.07 | 0.05 | 0.05 | 0.04 |
| 21 | 0.30 | 0.16 | 0.14 | 0.13 | 0.15 | 0.19 | 0.15 | 0.11 | 0.12 | 0.20 | 0.19 | 0.14 | 0.10 | 0.12 | 0.18 |
| 22 | 0.09 | 0.10 | 0.08 | 0.00 | 0.01 | 0.04 | 0.06 | 0.08 | 0.04 | 0.02 | 0.09 | 0.08 | 0.07 | 0.04 | 0.04 |
| 23 | 0.09 | 0.11 | 0.11 | 0.19 | 0.13 | 0.15 | 0.09 | 0.12 | 0.22 | 0.17 | 0.15 | 0.09 | 0.13 | 0.20 | 0.14 |
| 24 | 0.09 | 0.06 | 0.02 | 0.01 | 0.03 | 0.07 | 0.06 | 0.04 | 0.01 | 0.01 | 0.10 | 0.07 | 0.05 | 0.01 | 0.02 |
| 25 | 0.15 | 0.11 | 0.12 | 0.17 | 0.08 | 0.13 | 0.08 | 0.13 | 0.15 | 0.05 | 0.17 | 0.10 | 0.15 | 0.11 | 0.09 |
| 26 | 0.08 | 0.06 | 0.08 | 0.03 | 0.05 | 0.08 | 0.05 | 0.05 | 0.04 | 0.05 | 0.08 | 0.05 | 0.06 | 0.04 | 0.03 |
| 27 | 0.21 | 0.16 | 0.13 | 0.24 | 0.20 | 0.24 | 0.17 | 0.12 | 0.23 | 0.18 | 0.24 | 0.19 | 0.10 | 0.22 | 0.22 |
| 28 | 0.13 | 0.09 | 0.08 | 0.06 | 0.05 | 0.06 | 0.07 | 0.08 | 0.06 | 0.04 | 0.07 | 0.07 | 0.04 | 0.05 | 0.03 |
| 29 | 0.21 | 0.07 | 0.02 | 0.15 | 0.11 | 0.18 | 0.03 | 0.03 | 0.11 | 0.08 | 0.16 | 0.04 | 0.04 | 0.10 | 0.07 |
| 30 | 0.06 | 0.04 | 0.02 | 0.05 | 0.06 | 0.06 | 0.04 | 0.01 | 0.06 | 0.03 | 0.05 | 0.05 | 0.01 | 0.04 | 0.05 |
| 31 | 0.15 | 0.02 | 0.10 | 0.06 | 0.06 | 0.03 | 0.06 | 0.14 | 0.08 | 0.06 | 0.04 | 0.09 | 0.16 | 0.10 | 0.12 |
| 32 | 0.03 | 0.05 | 0.02 | 0.04 | 0.04 | 0.02 | 0.04 | 0.04 | 0.03 | 0.04 | 0.02 | 0.03 | 0.04 | 0.02 | 0.05 |
| 33 | 0.03 | 0.07 | 0.14 | 0.05 | 0.04 | 0.06 | 0.09 | 0.14 | 0.08 | 0.04 | 0.05 | 0.10 | 0.15 | 0.09 | 0.06 |
| 34 | 0.04 | 0.06 | 0.08 | 0.05 | 0.05 | 0.06 | 0.03 | 0.04 | 0.04 | 0.05 | 0.07 | 0.04 | 0.06 | 0.05 | 0.03 |
| 35 | 0.13 | 0.18 | 0.22 | 0.19 | 0.23 | 0.16 | 0.21 | 0.26 | 0.20 | 0.24 | 0.14 | 0.21 | 0.25 | 0.21 | 0.23 |
| 36 | 0.07 | 0.09 | 0.07 | 0.06 | 0.04 | 0.03 | 0.07 | 0.08 | 0.04 | 0.05 | 0.04 | 0.04 | 0.07 | 0.06 | 0.05 |
| 37 | 0.15 | 0.22 | 0.28 | 0.19 | 0.18 | 0.19 | 0.23 | 0.25 | 0.19 | 0.16 | 0.21 | 0.22 | 0.26 | 0.20 | 0.20 |
| 38 | 0.08 | 0.04 | 0.04 | 0.04 | 0.06 | 0.06 | 0.06 | 0.03 | 0.04 | 0.05 | 0.06 | 0.06 | 0.05 | 0.04 | 0.07 |
| 39 | 0.28 | 0.27 | 0.24 | 0.11 | 0.10 | 0.17 | 0.27 | 0.26 | 0.15 | 0.09 | 0.20 | 0.26 | 0.28 | 0.17 | 0.13 |
| 40 | 0.12 | 0.09 | 0.08 | 0.08 | 0.04 | 0.02 | 0.04 | 0.06 | 0.06 | 0.06 | 0.04 | 0.04 | 0.04 | 0.05 | 0.05 |
| 41 | 0.16 | 0.15 | 0.20 | 0.07 | 0.09 | 0.19 | 0.15 | 0.15 | 0.09 | 0.10 | 0.22 | 0.19 | 0.18 | 0.08 | 0.09 |
| 42 | 0.14 | 0.10 | 0.08 | 0.04 | 0.03 | 0.11 | 0.08 | 0.08 | 0.05 | 0.03 | 0.10 | 0.10 | 0.08 | 0.04 | 0.03 |
| 43 | 0.23 | 0.15 | 0.13 | 0.10 | 0.12 | 0.17 | 0.11 | 0.13 | 0.11 | 0.11 | 0.20 | 0.11 | 0.11 | 0.06 | 0.10 |
| 44 | 0.05 | 0.01 | 0.01 | 0.01 | 0.03 | 0.07 | 0.02 | 0.03 | 0.01 | 0.01 | 0.09 | 0.05 | 0.03 | 0.03 | 0.03 |
| 45 | 0.03 | 0.03 | 0.03 | 0.11 | 0.08 | 0.11 | 0.08 | 0.06 | 0.08 | 0.05 | 0.10 | 0.05 | 0.05 | 0.08 | 0.10 |
| 46 | 0.03 | 0.04 | 0.01 | 0.04 | 0.03 | 0.06 | 0.04 | 0.01 | 0.04 | 0.04 | 0.02 | 0.02 | 0.03 | 0.01 | 0.06 |
| 47 | 0.21 | 0.22 | 0.19 | 0.30 * | 0.30 * | 0.16 | 0.22 | 0.22 | 0.28 | 0.29 | 0.16 | 0.24 | 0.22 | 0.24 | 0.26 |
| 48 | 0.00 | 0.02 | 0.02 | 0.03 | 0.04 | 0.05 | 0.06 | 0.03 | 0.03 | 0.05 | 0.06 | 0.04 | 0.01 | 0.03 | 0.04 |
| 49 | 0.21 | 0.20 | 0.18 | 0.26 | 0.21 | 0.17 | 0.22 | 0.20 | 0.26 | 0.24 | 0.18 | 0.21 | 0.17 | 0.26 | 0.25 |
| 50 | 0.03 | 0.03 | 0.04 | 0.04 | 0.03 | 0.02 | 0.01 | 0.02 | 0.01 | 0.04 | 0.02 | 0.02 | 0.02 | 0.02 | 0.03 |
| Harmonic Order | VMPP,max | VDC,r | VMPP,min | ||||||||||||
|---|---|---|---|---|---|---|---|---|---|---|---|---|---|---|---|
| 100% | 75% | 50% | 25% | 5% | 100% | 75% | 50% | 25% | 5% | 100% | 75% | 50% | 25% | 5% | |
| TRD [%] | 1.81 | 1.62 | 1.75 | 1.64 | 1.74 | 1.89 | 1.64 | 1.58 | 1.42 | 1.75 | 1.84 | 1.63 | 1.50 | 1.47 | 1.79 |
| DC | 0.11 | 0.02 | 0.18 | 0.22 | 0.32 | 0.04 | 0.11 | 0.16 | 0.34 | 0.23 | 0.21 | 0.19 | 0.13 | 0.11 | 0.27 |
| 1 | 89.21 | 67.87 | 45.75 | 23.04 | 5.82 | 90.10 | 67.83 | 45.84 | 22.85 | 5.90 | 88.77 | 67.20 | 44.72 | 22.96 | 5.88 |
| 2 | 0.40 | 0.31 | 0.21 | 0.11 | 0.05 | 0.40 | 0.26 | 0.17 | 0.09 | 0.04 | 0.33 | 0.29 | 0.21 | 0.10 | 0.03 |
| 3 | 0.89 | 0.70 | 0.59 | 0.48 | 0.44 | 0.97 | 0.76 | 0.63 | 0.49 | 0.50 | 1.07 | 0.79 | 0.64 | 0.52 | 0.50 |
| 4 | 0.16 | 0.14 | 0.09 | 0.06 | 0.03 | 0.15 | 0.11 | 0.08 | 0.05 | 0.01 | 0.12 | 0.13 | 0.10 | 0.07 | 0.02 |
| 5 | 0.59 | 0.55 | 0.58 | 0.55 | 1.07 | 0.55 | 0.53 | 0.55 | 0.53 | 1.06 | 0.61 | 0.54 | 0.59 | 0.67 | 1.12 |
| 6 | 0.12 | 0.08 | 0.06 | 0.06 | 0.01 | 0.12 | 0.07 | 0.05 | 0.03 | 0.01 | 0.11 | 0.10 | 0.08 | 0.04 | 0.01 |
| 7 | 1.16 | 1.12 | 1.39 | 1.32 | 1.15 | 1.23 | 1.06 | 1.17 | 1.06 | 1.17 | 1.09 | 1.06 | 1.06 | 1.10 | 1.18 |
| 8 | 0.12 | 0.12 | 0.06 | 0.03 | 0.01 | 0.10 | 0.10 | 0.05 | 0.04 | 0.02 | 0.10 | 0.12 | 0.07 | 0.03 | 0.02 |
| 9 | 0.05 | 0.05 | 0.08 | 0.11 | 0.28 | 0.10 | 0.05 | 0.01 | 0.06 | 0.27 | 0.05 | 0.04 | 0.01 | 0.11 | 0.24 |
| 10 | 0.09 | 0.06 | 0.04 | 0.03 | 0.02 | 0.09 | 0.04 | 0.04 | 0.03 | 0.01 | 0.06 | 0.06 | 0.05 | 0.04 | 0.02 |
| 11 | 0.35 | 0.46 | 0.47 | 0.51 | 0.28 | 0.54 | 0.42 | 0.31 | 0.24 | 0.28 | 0.31 | 0.34 | 0.29 | 0.14 | 0.28 |
| 12 | 0.12 | 0.10 | 0.05 | 0.05 | 0.02 | 0.10 | 0.09 | 0.04 | 0.03 | 0.01 | 0.10 | 0.08 | 0.05 | 0.02 | 0.01 |
| 13 | 0.24 | 0.29 | 0.27 | 0.20 | 0.12 | 0.27 | 0.29 | 0.30 | 0.23 | 0.17 | 0.31 | 0.30 | 0.22 | 0.23 | 0.18 |
| 14 | 0.08 | 0.01 | 0.02 | 0.03 | 0.02 | 0.07 | 0.02 | 0.03 | 0.04 | 0.01 | 0.06 | 0.04 | 0.01 | 0.03 | 0.01 |
| 15 | 0.11 | 0.07 | 0.11 | 0.05 | 0.05 | 0.14 | 0.04 | 0.03 | 0.03 | 0.09 | 0.12 | 0.06 | 0.05 | 0.06 | 0.06 |
| 16 | 0.09 | 0.05 | 0.02 | 0.05 | 0.02 | 0.09 | 0.04 | 0.01 | 0.04 | 0.01 | 0.08 | 0.04 | 0.02 | 0.04 | 0.01 |
| 17 | 0.40 | 0.23 | 0.10 | 0.04 | 0.22 | 0.16 | 0.40 | 0.27 | 0.27 | 0.24 | 0.33 | 0.32 | 0.26 | 0.22 | 0.22 |
| 18 | 0.06 | 0.07 | 0.01 | 0.01 | 0.01 | 0.08 | 0.07 | 0.00 | 0.02 | 0.01 | 0.06 | 0.05 | 0.03 | 0.01 | 0.01 |
| 19 | 0.18 | 0.08 | 0.08 | 0.08 | 0.07 | 0.10 | 0.22 | 0.15 | 0.13 | 0.08 | 0.20 | 0.17 | 0.17 | 0.13 | 0.08 |
| 20 | 0.07 | 0.04 | 0.02 | 0.02 | 0.01 | 0.06 | 0.03 | 0.03 | 0.02 | 0.00 | 0.06 | 0.04 | 0.02 | 0.02 | 0.01 |
| 21 | 0.14 | 0.12 | 0.09 | 0.07 | 0.05 | 0.17 | 0.10 | 0.09 | 0.01 | 0.04 | 0.15 | 0.17 | 0.08 | 0.03 | 0.04 |
| 22 | 0.04 | 0.06 | 0.03 | 0.03 | 0.01 | 0.07 | 0.04 | 0.03 | 0.01 | 0.01 | 0.05 | 0.03 | 0.03 | 0.03 | 0.01 |
| 23 | 0.13 | 0.13 | 0.08 | 0.06 | 0.11 | 0.13 | 0.12 | 0.11 | 0.09 | 0.12 | 0.10 | 0.08 | 0.10 | 0.13 | 0.10 |
| 24 | 0.08 | 0.03 | 0.02 | 0.02 | 0.01 | 0.05 | 0.03 | 0.04 | 0.01 | 0.01 | 0.05 | 0.02 | 0.04 | 0.01 | 0.00 |
| 25 | 0.13 | 0.06 | 0.09 | 0.01 | 0.06 | 0.11 | 0.07 | 0.10 | 0.05 | 0.07 | 0.09 | 0.08 | 0.07 | 0.06 | 0.04 |
| 26 | 0.04 | 0.03 | 0.03 | 0.03 | 0.01 | 0.06 | 0.01 | 0.04 | 0.02 | 0.01 | 0.03 | 0.01 | 0.03 | 0.02 | 0.01 |
| 27 | 0.17 | 0.14 | 0.07 | 0.05 | 0.08 | 0.15 | 0.16 | 0.09 | 0.05 | 0.07 | 0.15 | 0.14 | 0.11 | 0.06 | 0.07 |
| 28 | 0.07 | 0.01 | 0.02 | 0.01 | 0.01 | 0.04 | 0.02 | 0.03 | 0.03 | 0.00 | 0.06 | 0.01 | 0.03 | 0.01 | 0.01 |
| 29 | 0.09 | 0.04 | 0.03 | 0.00 | 0.03 | 0.09 | 0.08 | 0.05 | 0.03 | 0.04 | 0.11 | 0.09 | 0.09 | 0.05 | 0.03 |
| 30 | 0.03 | 0.02 | 0.03 | 0.00 | 0.01 | 0.02 | 0.03 | 0.03 | 0.01 | 0.02 | 0.02 | 0.04 | 0.05 | 0.02 | 0.01 |
| 31 | 0.12 | 0.06 | 0.04 | 0.00 | 0.05 | 0.08 | 0.07 | 0.04 | 0.08 | 0.07 | 0.11 | 0.05 | 0.05 | 0.05 | 0.06 |
| 32 | 0.02 | 0.05 | 0.02 | 0.01 | 0.01 | 0.02 | 0.02 | 0.01 | 0.01 | 0.06 | 0.02 | 0.02 | 0.02 | 0.03 | 0.00 |
| 33 | 0.07 | 0.05 | 0.06 | 0.05 | 0.03 | 0.08 | 0.04 | 0.07 | 0.03 | 0.05 | 0.05 | 0.03 | 0.07 | 0.05 | 0.04 |
| 34 | 0.02 | 0.02 | 0.00 | 0.02 | 0.01 | 0.01 | 0.04 | 0.01 | 0.00 | 0.01 | 0.00 | 0.04 | 0.01 | 0.01 | 0.00 |
| 35 | 0.01 | 0.01 | 0.02 | 0.02 | 0.04 | 0.03 | 0.02 | 0.04 | 0.06 | 0.05 | 0.01 | 0.02 | 0.03 | 0.05 | 0.03 |
| 36 | 0.01 | 0.01 | 0.01 | 0.01 | 0.00 | 0.02 | 0.01 | 0.02 | 0.01 | 0.00 | 0.02 | 0.02 | 0.01 | 0.03 | 0.00 |
| 37 | 0.06 | 0.05 | 0.03 | 0.03 | 0.00 | 0.03 | 0.04 | 0.03 | 0.00 | 0.01 | 0.03 | 0.04 | 0.02 | 0.01 | 0.02 |
| 38 | 0.01 | 0.01 | 0.03 | 0.02 | 0.00 | 0.01 | 0.01 | 0.00 | 0.01 | 0.01 | 0.01 | 0.01 | 0.01 | 0.02 | 0.01 |
| 39 | 0.06 | 0.03 | 0.02 | 0.01 | 0.01 | 0.03 | 0.02 | 0.01 | 0.01 | 0.00 | 0.04 | 0.04 | 0.00 | 0.03 | 0.01 |
| 40 | 0.01 | 0.01 | 0.02 | 0.01 | 0.01 | 0.01 | 0.03 | 0.01 | 0.01 | 0.01 | 0.01 | 0.05 | 0.01 | 0.01 | 0.01 |
| 41 | 0.07 | 0.05 | 0.02 | 0.03 | 0.04 | 0.03 | 0.07 | 0.04 | 0.06 | 0.05 | 0.08 | 0.08 | 0.07 | 0.05 | 0.05 |
| 42 | 0.02 | 0.01 | 0.02 | 0.01 | 0.02 | 0.02 | 0.01 | 0.01 | 0.01 | 0.01 | 0.01 | 0.01 | 0.01 | 0.02 | 0.01 |
| 43 | 0.06 | 0.04 | 0.03 | 0.02 | 0.03 | 0.04 | 0.06 | 0.02 | 0.05 | 0.03 | 0.03 | 0.05 | 0.03 | 0.04 | 0.03 |
| 44 | 0.02 | 0.03 | 0.01 | 0.01 | 0.01 | 0.01 | 0.01 | 0.00 | 0.01 | 0.01 | 0.02 | 0.02 | 0.01 | 0.01 | 0.01 |
| 45 | 0.01 | 0.00 | 0.00 | 0.01 | 0.02 | 0.01 | 0.02 | 0.03 | 0.02 | 0.03 | 0.02 | 0.02 | 0.04 | 0.03 | 0.03 |
| 46 | 0.01 | 0.01 | 0.01 | 0.00 | 0.00 | 0.01 | 0.00 | 0.01 | 0.01 | 0.01 | 0.02 | 0.02 | 0.01 | 0.00 | 0.01 |
| 47 | 0.02 | 0.01 | 0.01 | 0.02 | 0.04 | 0.03 | 0.02 | 0.02 | 0.03 | 0.03 | 0.02 | 0.01 | 0.03 | 0.04 | 0.03 |
| 48 | 0.00 | 0.01 | 0.00 | 0.00 | 0.01 | 0.00 | 0.01 | 0.01 | 0.01 | 0.01 | 0.01 | 0.01 | 0.01 | 0.01 | 0.01 |
| 49 | 0.03 | 0.02 | 0.00 | 0.01 | 0.03 | 0.03 | 0.04 | 0.02 | 0.03 | 0.03 | 0.03 | 0.02 | 0.04 | 0.02 | 0.02 |
| 50 | 0.01 | 0.01 | 0.00 | 0.00 | 0.01 | 0.00 | 0.01 | 0.01 | 0.01 | 0.01 | 0.01 | 0.00 | 0.01 | 0.02 | 0.01 |
| Harmonic Order | VMPP,max | VDC,r | VMPP,min | ||||||||||||
|---|---|---|---|---|---|---|---|---|---|---|---|---|---|---|---|
| 100% | 75% | 50% | 25% | 5% | 100% | 75% | 50% | 25% | 5% | 100% | 75% | 50% | 25% | 5% | |
| TRD [%] | 1.08 | 0.87 | 0.67 | 6.27 * | 4.29 | 1.06 | 0.83 | 0.63 | 5.85 * | 3.76 | 1.07 | 0.87 | 0.66 | 6.28 * | 4.01 |
| DC | 0.09 | 0.14 | 0.16 | 0.22 | 0.21 | 0.06 | 0.11 | 0.15 | 0.18 | 0.18 | 0.08 | 0.15 | 0.15 | 0.17 | 0.22 |
| 1 | 91.30 | 69.57 | 47.31 | 24.01 | 5.61 | 91.00 | 69.52 | 46.85 | 23.95 | 4.91 | 90.88 | 69.54 | 47.18 | 24.02 | 5.29 |
| 2 | 0.13 | 0.13 | 0.10 | 0.03 | 0.02 | 0.14 | 0.14 | 0.09 | 0.02 | 0.06 | 0.16 | 0.14 | 0.11 | 0.01 | 0.02 |
| 3 | 0.51 | 0.34 | 0.18 | 5.88 * | 3.84 | 0.51 | 0.35 | 0.20 | 5.44 * | 3.36 | 0.53 | 0.35 | 0.19 | 5.90 * | 3.61 |
| 4 | 0.04 | 0.02 | 0.01 | 0.04 | 0.01 | 0.03 | 0.04 | 0.00 | 0.05 | 0.03 | 0.03 | 0.03 | 0.01 | 0.06 | 0.01 |
| 5 | 0.31 | 0.29 | 0.34 | 1.92 | 1.79 | 0.30 | 0.27 | 0.30 | 1.88 | 1.59 | 0.30 | 0.27 | 0.32 | 1.91 | 1.66 |
| 6 | 0.02 | 0.02 | 0.02 | 0.02 | 0.02 | 0.02 | 0.03 | 0.01 | 0.02 | 0.01 | 0.03 | 0.02 | 0.02 | 0.02 | 0.02 |
| 7 | 0.46 | 0.42 | 0.37 | 0.74 | 0.35 | 0.45 | 0.41 | 0.35 | 0.84 | 0.32 | 0.46 | 0.41 | 0.36 | 0.72 | 0.31 |
| 8 | 0.01 | 0.02 | 0.01 | 0.01 | 0.02 | 0.02 | 0.01 | 0.01 | 0.02 | 0.02 | 0.02 | 0.01 | 0.02 | 0.01 | 0.02 |
| 9 | 0.23 | 0.15 | 0.08 | 0.28 | 0.32 | 0.23 | 0.16 | 0.10 | 0.17 | 0.33 | 0.24 | 0.15 | 0.09 | 0.28 | 0.33 |
| 10 | 0.02 | 0.01 | 0.01 | 0.00 | 0.01 | 0.01 | 0.02 | 0.01 | 0.01 | 0.01 | 0.01 | 0.01 | 0.01 | 0.01 | 0.01 |
| 11 | 0.24 | 0.17 | 0.10 | 0.44 | 0.13 | 0.25 | 0.17 | 0.10 | 0.35 | 0.13 | 0.26 | 0.19 | 0.11 | 0.42 | 0.11 |
| 12 | 0.01 | 0.01 | 0.01 | 0.01 | 0.00 | 0.01 | 0.01 | 0.00 | 0.02 | 0.00 | 0.01 | 0.01 | 0.01 | 0.02 | 0.00 |
| 13 | 0.24 | 0.20 | 0.15 | 0.30 | 0.16 | 0.23 | 0.18 | 0.15 | 0.27 | 0.15 | 0.24 | 0.19 | 0.15 | 0.28 | 0.15 |
| 14 | 0.01 | 0.01 | 0.00 | 0.01 | 0.01 | 0.01 | 0.01 | 0.01 | 0.00 | 0.01 | 0.01 | 0.01 | 0.01 | 0.00 | 0.00 |
| 15 | 0.18 | 0.13 | 0.07 | 0.13 | 0.03 | 0.18 | 0.13 | 0.08 | 0.17 | 0.09 | 0.17 | 0.13 | 0.07 | 0.12 | 0.05 |
| 16 | 0.01 | 0.00 | 0.01 | 0.01 | 0.00 | 0.01 | 0.01 | 0.00 | 0.01 | 0.00 | 0.01 | 0.00 | 0.00 | 0.00 | 0.01 |
| 17 | 0.17 | 0.13 | 0.07 | 0.07 | 0.11 | 0.17 | 0.12 | 0.07 | 0.05 | 0.05 | 0.16 | 0.12 | 0.07 | 0.07 | 0.07 |
| 18 | 0.01 | 0.00 | 0.00 | 0.01 | 0.00 | 0.02 | 0.01 | 0.00 | 0.00 | 0.00 | 0.02 | 0.01 | 0.00 | 0.00 | 0.01 |
| 19 | 0.17 | 0.13 | 0.08 | 0.17 | 0.05 | 0.15 | 0.11 | 0.07 | 0.12 | 0.07 | 0.15 | 0.13 | 0.07 | 0.15 | 0.04 |
| 20 | 0.01 | 0.01 | 0.00 | 0.01 | 0.00 | 0.01 | 0.01 | 0.01 | 0.01 | 0.00 | 0.01 | 0.01 | 0.01 | 0.01 | 0.00 |
| 21 | 0.18 | 0.15 | 0.09 | 0.16 | 0.07 | 0.18 | 0.14 | 0.09 | 0.15 | 0.03 | 0.17 | 0.14 | 0.10 | 0.16 | 0.04 |
| 22 | 0.01 | 0.02 | 0.01 | 0.01 | 0.00 | 0.01 | 0.02 | 0.01 | 0.01 | 0.01 | 0.01 | 0.02 | 0.01 | 0.01 | 0.01 |
| 23 | 0.14 | 0.10 | 0.05 | 0.06 | 0.11 | 0.15 | 0.09 | 0.05 | 0.08 | 0.05 | 0.13 | 0.11 | 0.06 | 0.06 | 0.06 |
| 24 | 0.02 | 0.01 | 0.01 | 0.00 | 0.00 | 0.02 | 0.01 | 0.01 | 0.01 | 0.00 | 0.02 | 0.01 | 0.00 | 0.01 | 0.01 |
| 25 | 0.15 | 0.12 | 0.06 | 0.05 | 0.01 | 0.14 | 0.10 | 0.05 | 0.05 | 0.04 | 0.14 | 0.11 | 0.06 | 0.05 | 0.02 |
| 26 | 0.01 | 0.01 | 0.01 | 0.00 | 0.00 | 0.02 | 0.02 | 0.01 | 0.00 | 0.01 | 0.01 | 0.02 | 0.01 | 0.01 | 0.01 |
| 27 | 0.18 | 0.15 | 0.11 | 0.03 | 0.13 | 0.18 | 0.14 | 0.11 | 0.03 | 0.05 | 0.18 | 0.16 | 0.11 | 0.02 | 0.10 |
| 28 | 0.01 | 0.01 | 0.01 | 0.01 | 0.00 | 0.02 | 0.02 | 0.01 | 0.01 | 0.01 | 0.01 | 0.01 | 0.01 | 0.01 | 0.01 |
| 29 | 0.14 | 0.11 | 0.07 | 0.08 | 0.06 | 0.15 | 0.11 | 0.08 | 0.07 | 0.04 | 0.15 | 0.12 | 0.08 | 0.06 | 0.03 |
| 30 | 0.01 | 0.01 | 0.01 | 0.00 | 0.00 | 0.02 | 0.02 | 0.01 | 0.01 | 0.00 | 0.02 | 0.02 | 0.01 | 0.01 | 0.01 |
| 31 | 0.14 | 0.11 | 0.07 | 0.05 | 0.06 | 0.14 | 0.10 | 0.06 | 0.06 | 0.03 | 0.14 | 0.11 | 0.07 | 0.06 | 0.07 |
| 32 | 0.01 | 0.02 | 0.01 | 0.00 | 0.00 | 0.01 | 0.03 | 0.01 | 0.00 | 0.01 | 0.01 | 0.02 | 0.01 | 0.00 | 0.01 |
| 33 | 0.16 | 0.13 | 0.09 | 0.06 | 0.09 | 0.15 | 0.11 | 0.07 | 0.04 | 0.02 | 0.14 | 0.11 | 0.08 | 0.06 | 0.07 |
| 34 | 0.01 | 0.01 | 0.01 | 0.01 | 0.00 | 0.02 | 0.02 | 0.01 | 0.01 | 0.01 | 0.02 | 0.02 | 0.00 | 0.01 | 0.01 |
| 35 | 0.12 | 0.09 | 0.05 | 0.04 | 0.01 | 0.12 | 0.09 | 0.04 | 0.04 | 0.03 | 0.12 | 0.09 | 0.05 | 0.04 | 0.02 |
| 36 | 0.02 | 0.01 | 0.00 | 0.00 | 0.00 | 0.01 | 0.03 | 0.01 | 0.01 | 0.00 | 0.02 | 0.02 | 0.01 | 0.00 | 0.01 |
| 37 | 0.13 | 0.11 | 0.06 | 0.05 | 0.08 | 0.13 | 0.10 | 0.04 | 0.04 | 0.04 | 0.13 | 0.11 | 0.05 | 0.05 | 0.09 |
| 38 | 0.02 | 0.02 | 0.01 | 0.01 | 0.00 | 0.02 | 0.03 | 0.01 | 0.01 | 0.01 | 0.02 | 0.03 | 0.01 | 0.00 | 0.01 |
| 39 | 0.15 | 0.13 | 0.09 | 0.07 | 0.04 | 0.15 | 0.11 | 0.06 | 0.08 | 0.01 | 0.14 | 0.12 | 0.08 | 0.07 | 0.02 |
| 40 | 0.02 | 0.02 | 0.01 | 0.00 | 0.00 | 0.02 | 0.03 | 0.01 | 0.01 | 0.01 | 0.02 | 0.03 | 0.01 | 0.01 | 0.00 |
| 41 | 0.15 | 0.13 | 0.06 | 0.04 | 0.07 | 0.14 | 0.11 | 0.06 | 0.07 | 0.07 | 0.14 | 0.13 | 0.07 | 0.05 | 0.06 |
| 42 | 0.01 | 0.02 | 0.01 | 0.00 | 0.00 | 0.02 | 0.03 | 0.01 | 0.01 | 0.00 | 0.02 | 0.04 | 0.01 | 0.00 | 0.01 |
| 43 | 0.12 | 0.10 | 0.06 | 0.03 | 0.05 | 0.11 | 0.09 | 0.05 | 0.03 | 0.01 | 0.11 | 0.10 | 0.06 | 0.03 | 0.05 |
| 44 | 0.02 | 0.02 | 0.01 | 0.00 | 0.00 | 0.02 | 0.03 | 0.01 | 0.01 | 0.01 | 0.02 | 0.04 | 0.01 | 0.00 | 0.01 |
| 45 | 0.11 | 0.09 | 0.06 | 0.04 | 0.01 | 0.10 | 0.07 | 0.05 | 0.03 | 0.05 | 0.10 | 0.09 | 0.06 | 0.05 | 0.04 |
| 46 | 0.01 | 0.02 | 0.01 | 0.01 | 0.00 | 0.01 | 0.03 | 0.01 | 0.01 | 0.00 | 0.01 | 0.03 | 0.01 | 0.01 | 0.00 |
| 47 | 0.09 | 0.08 | 0.04 | 0.05 | 0.06 | 0.09 | 0.07 | 0.04 | 0.06 | 0.04 | 0.10 | 0.08 | 0.04 | 0.05 | 0.06 |
| 48 | 0.01 | 0.02 | 0.01 | 0.00 | 0.00 | 0.02 | 0.03 | 0.01 | 0.01 | 0.00 | 0.02 | 0.04 | 0.01 | 0.01 | 0.01 |
| 49 | 0.10 | 0.08 | 0.05 | 0.03 | 0.04 | 0.10 | 0.07 | 0.05 | 0.05 | 0.02 | 0.10 | 0.07 | 0.05 | 0.05 | 0.03 |
| 50 | 0.02 | 0.02 | 0.01 | 0.00 | 0.00 | 0.02 | 0.03 | 0.01 | 0.00 | 0.01 | 0.02 | 0.03 | 0.01 | 0.00 | 0.00 |
Disclaimer/Publisher’s Note: The statements, opinions and data contained in all publications are solely those of the individual author(s) and contributor(s) and not of MDPI and/or the editor(s). MDPI and/or the editor(s) disclaim responsibility for any injury to people or property resulting from any ideas, methods, instructions or products referred to in the content. |
© 2025 by the authors. Licensee MDPI, Basel, Switzerland. This article is an open access article distributed under the terms and conditions of the Creative Commons Attribution (CC BY) license (https://creativecommons.org/licenses/by/4.0/).
Share and Cite
Dimitrijević, M.; Petronijević, M.; Klimenta, D. Evaluation of Photovoltaic Inverters According to Output Current Distortion in a Steady-State and Maximum Power Point Tracking. Appl. Sci. 2025, 15, 1110. https://doi.org/10.3390/app15031110
Dimitrijević M, Petronijević M, Klimenta D. Evaluation of Photovoltaic Inverters According to Output Current Distortion in a Steady-State and Maximum Power Point Tracking. Applied Sciences. 2025; 15(3):1110. https://doi.org/10.3390/app15031110
Chicago/Turabian StyleDimitrijević, Marko, Milutin Petronijević, and Dardan Klimenta. 2025. "Evaluation of Photovoltaic Inverters According to Output Current Distortion in a Steady-State and Maximum Power Point Tracking" Applied Sciences 15, no. 3: 1110. https://doi.org/10.3390/app15031110
APA StyleDimitrijević, M., Petronijević, M., & Klimenta, D. (2025). Evaluation of Photovoltaic Inverters According to Output Current Distortion in a Steady-State and Maximum Power Point Tracking. Applied Sciences, 15(3), 1110. https://doi.org/10.3390/app15031110