
Effects of Long-Term Land Use Patterns on Labile Organic Carbon Fractions and Carbon Pool Management Index of Mollisols Humus Layers


Abstract
1. Introduction
2. Materials and Methods
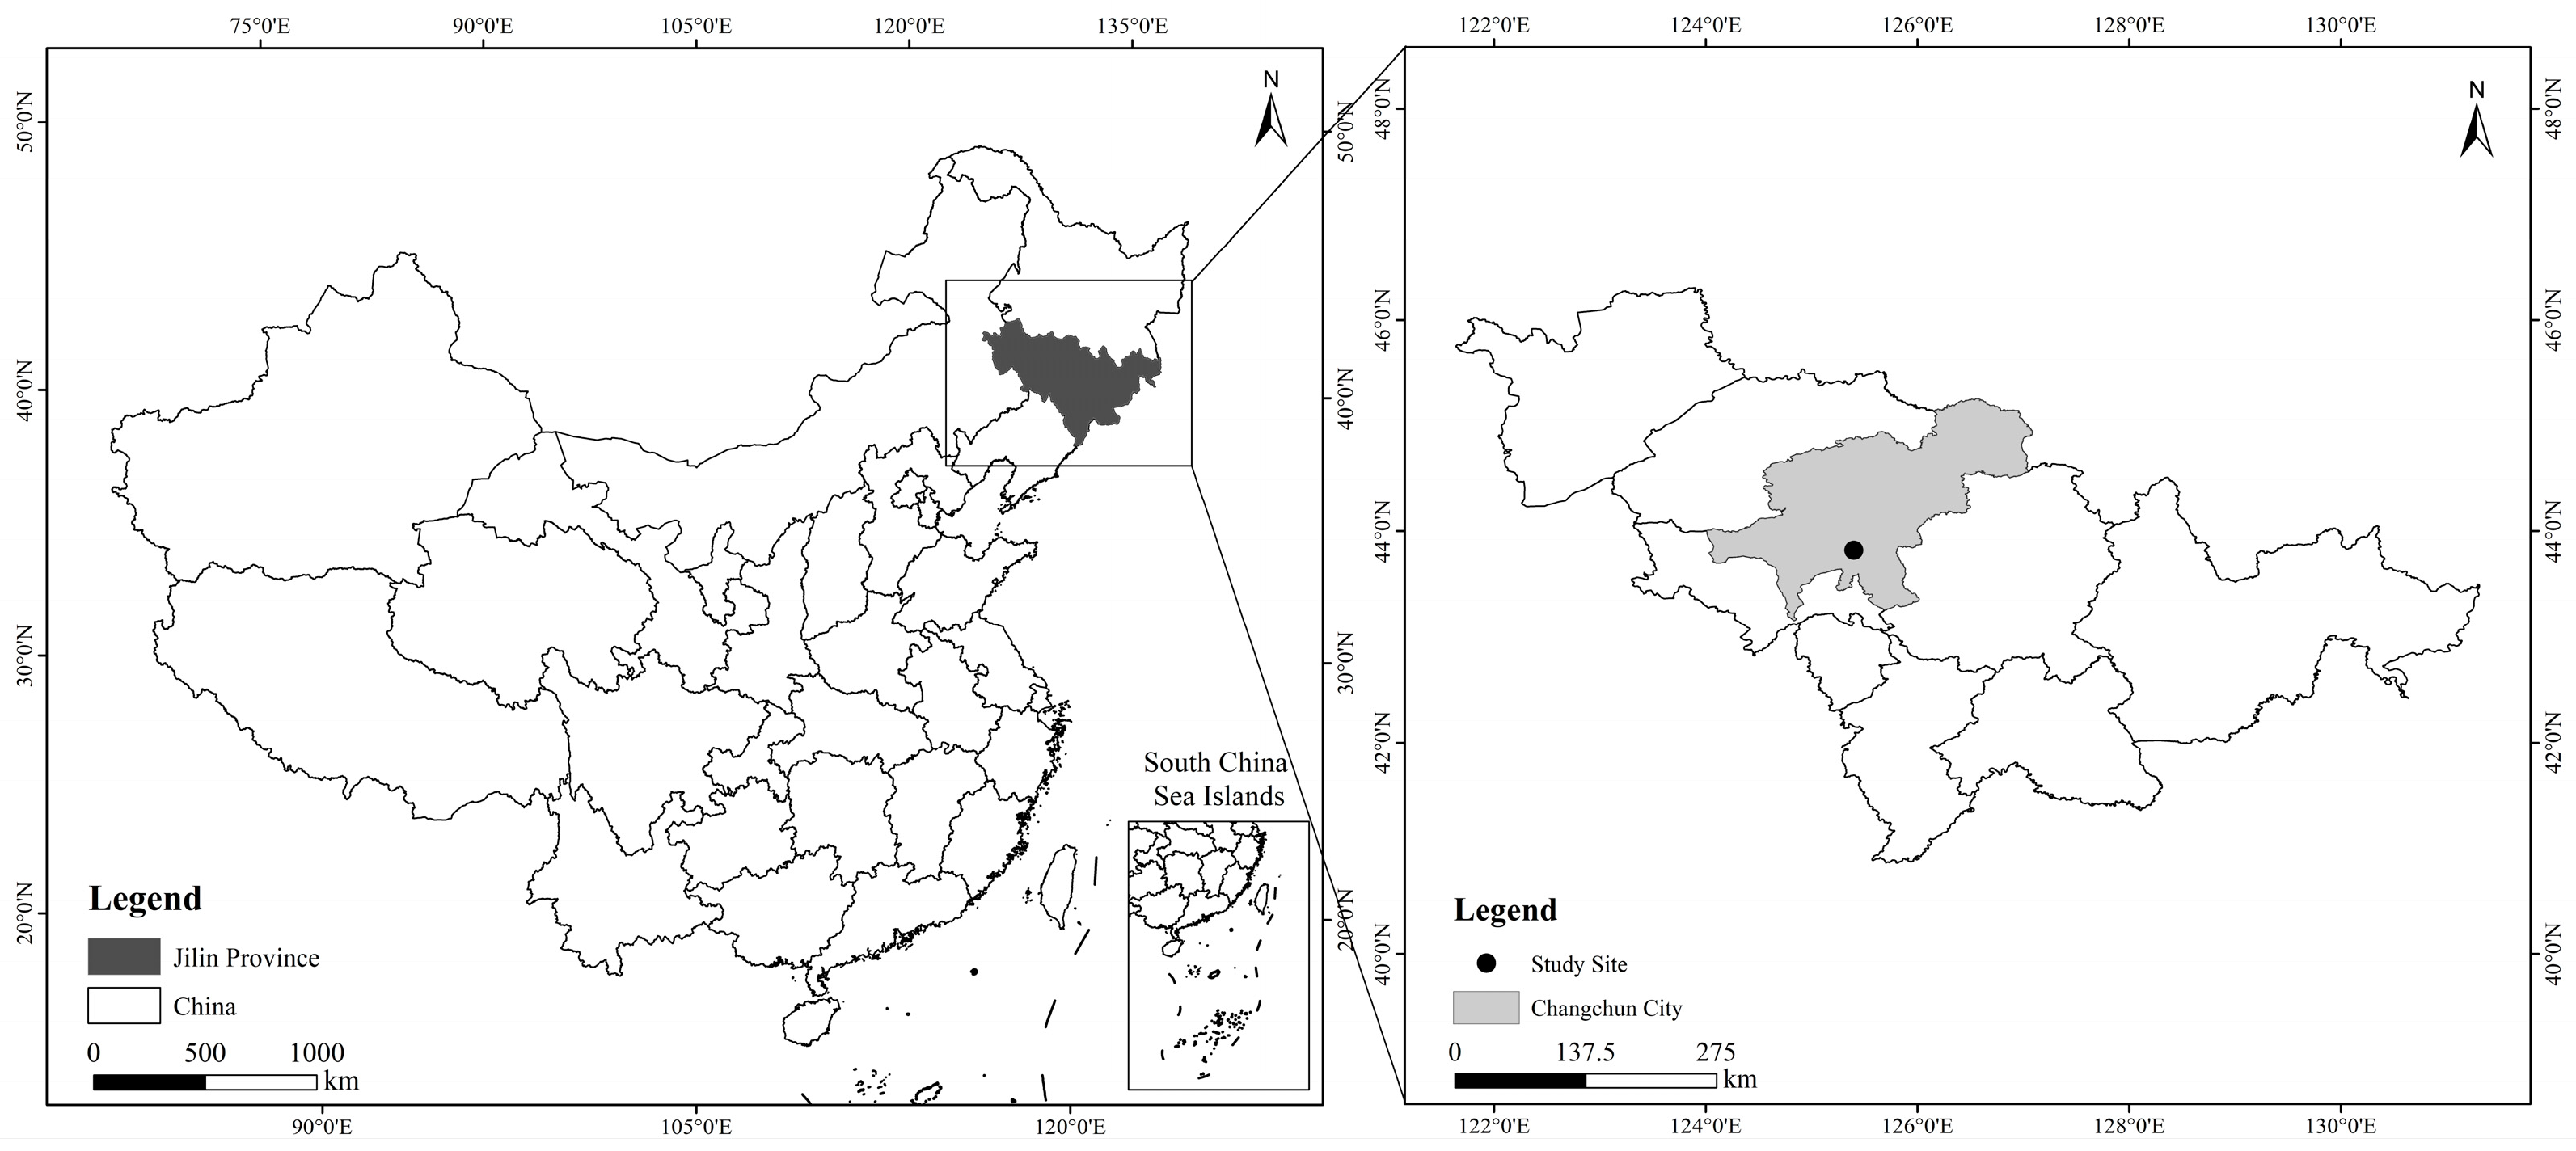
2.1. Site Description
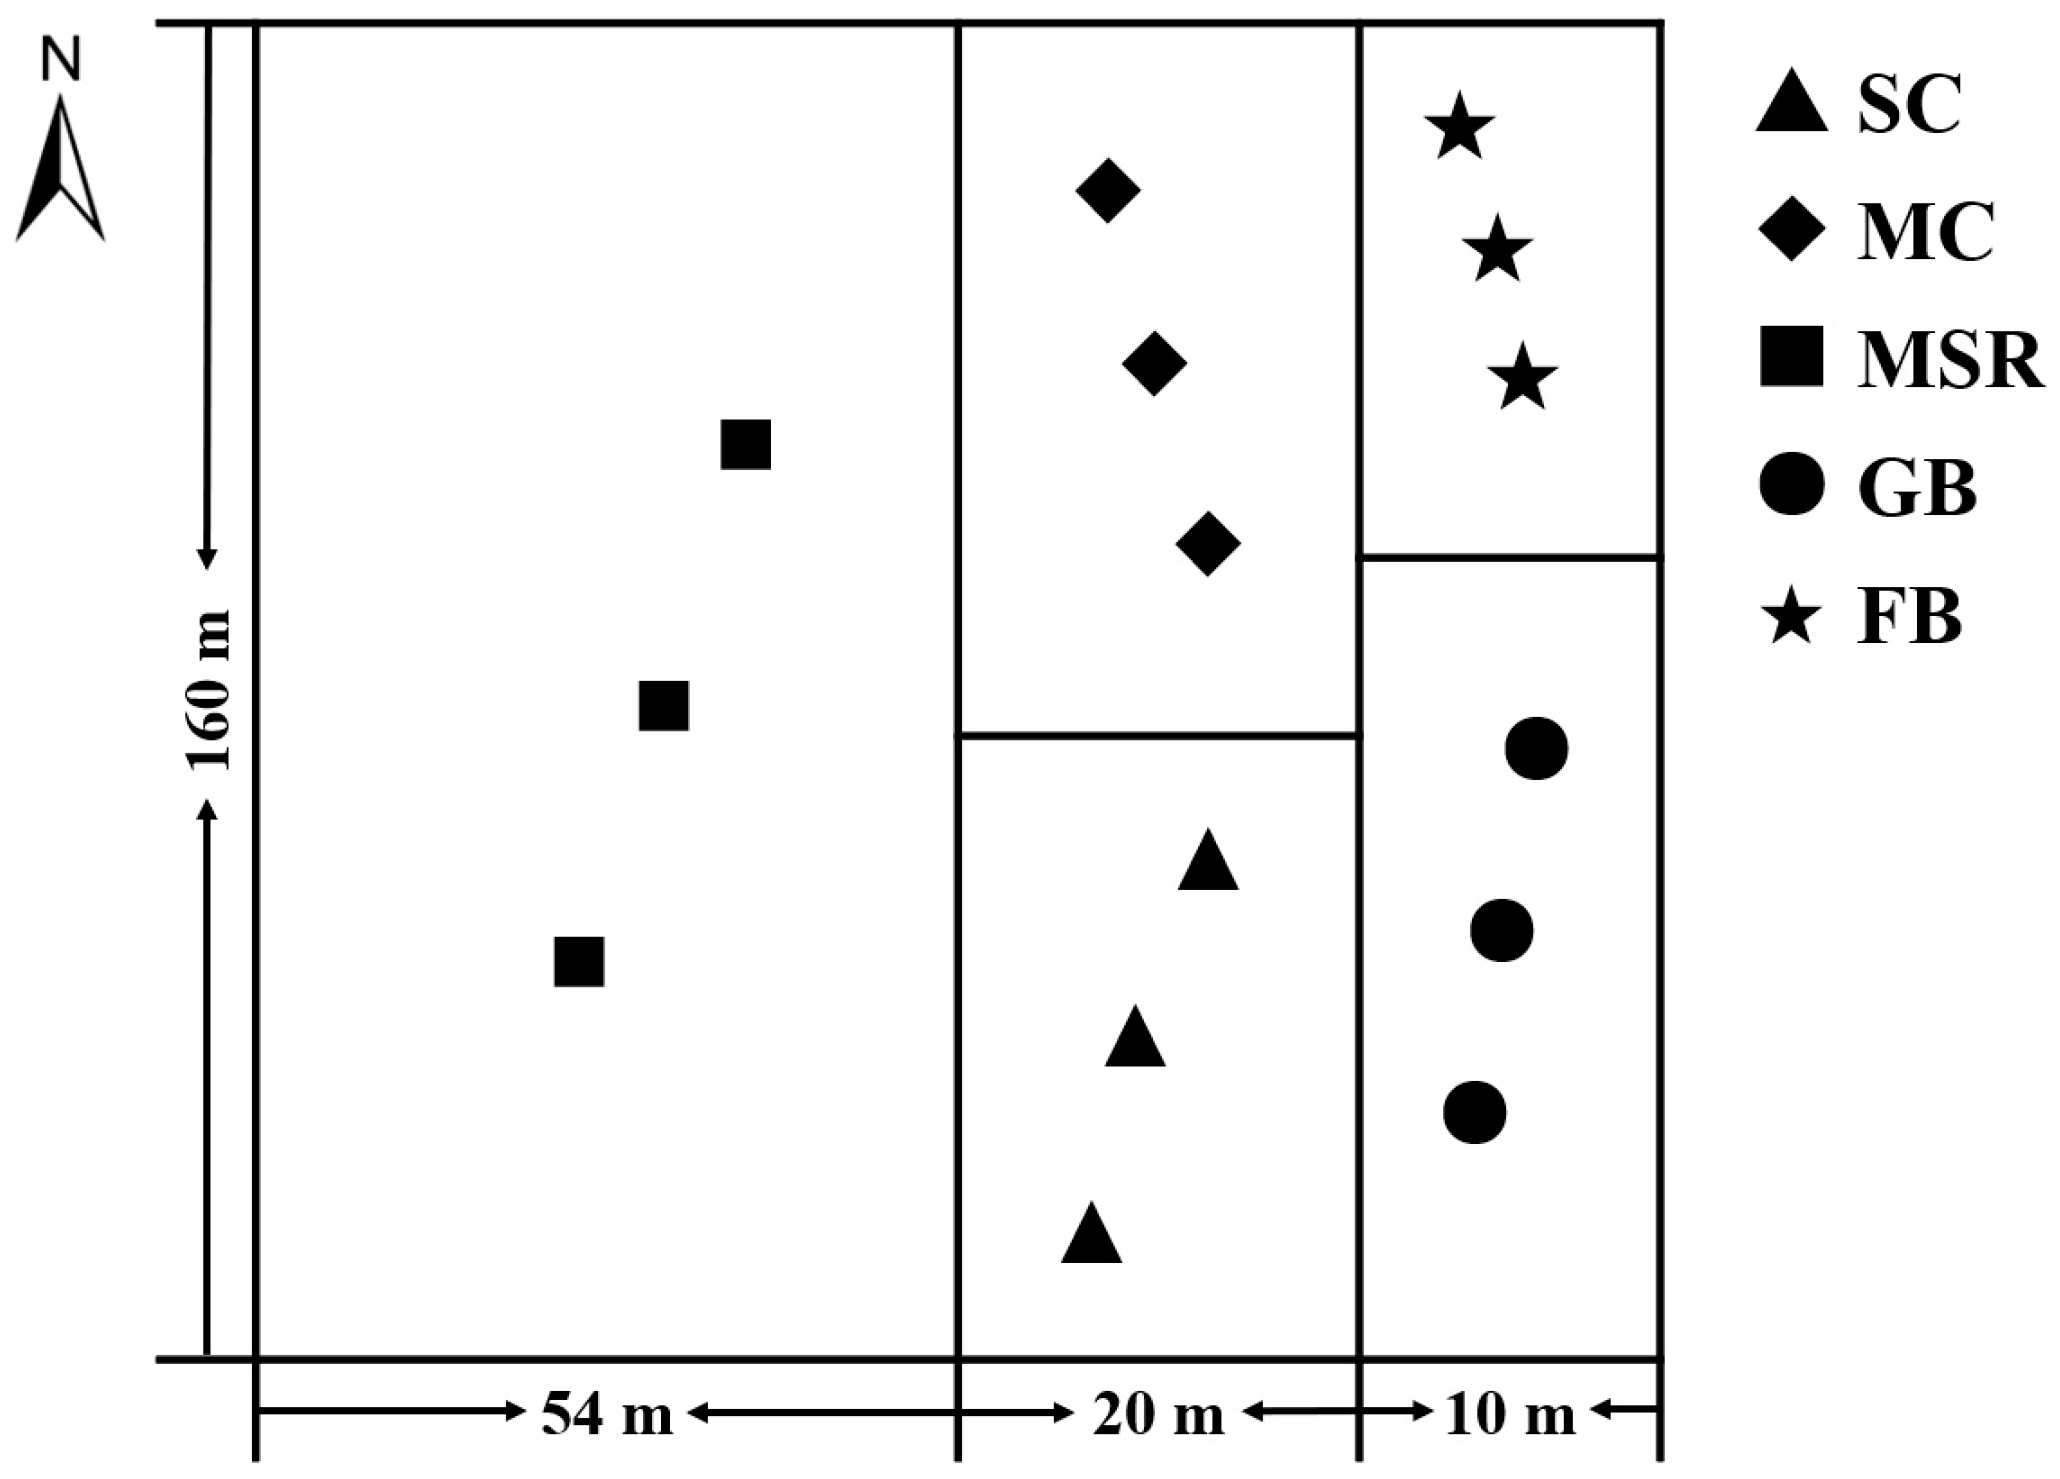
2.2. In Situ Experiment
2.3. Soil Sampling
2.4. Analysis Methods
2.5. Statistical Analyses
3. Results
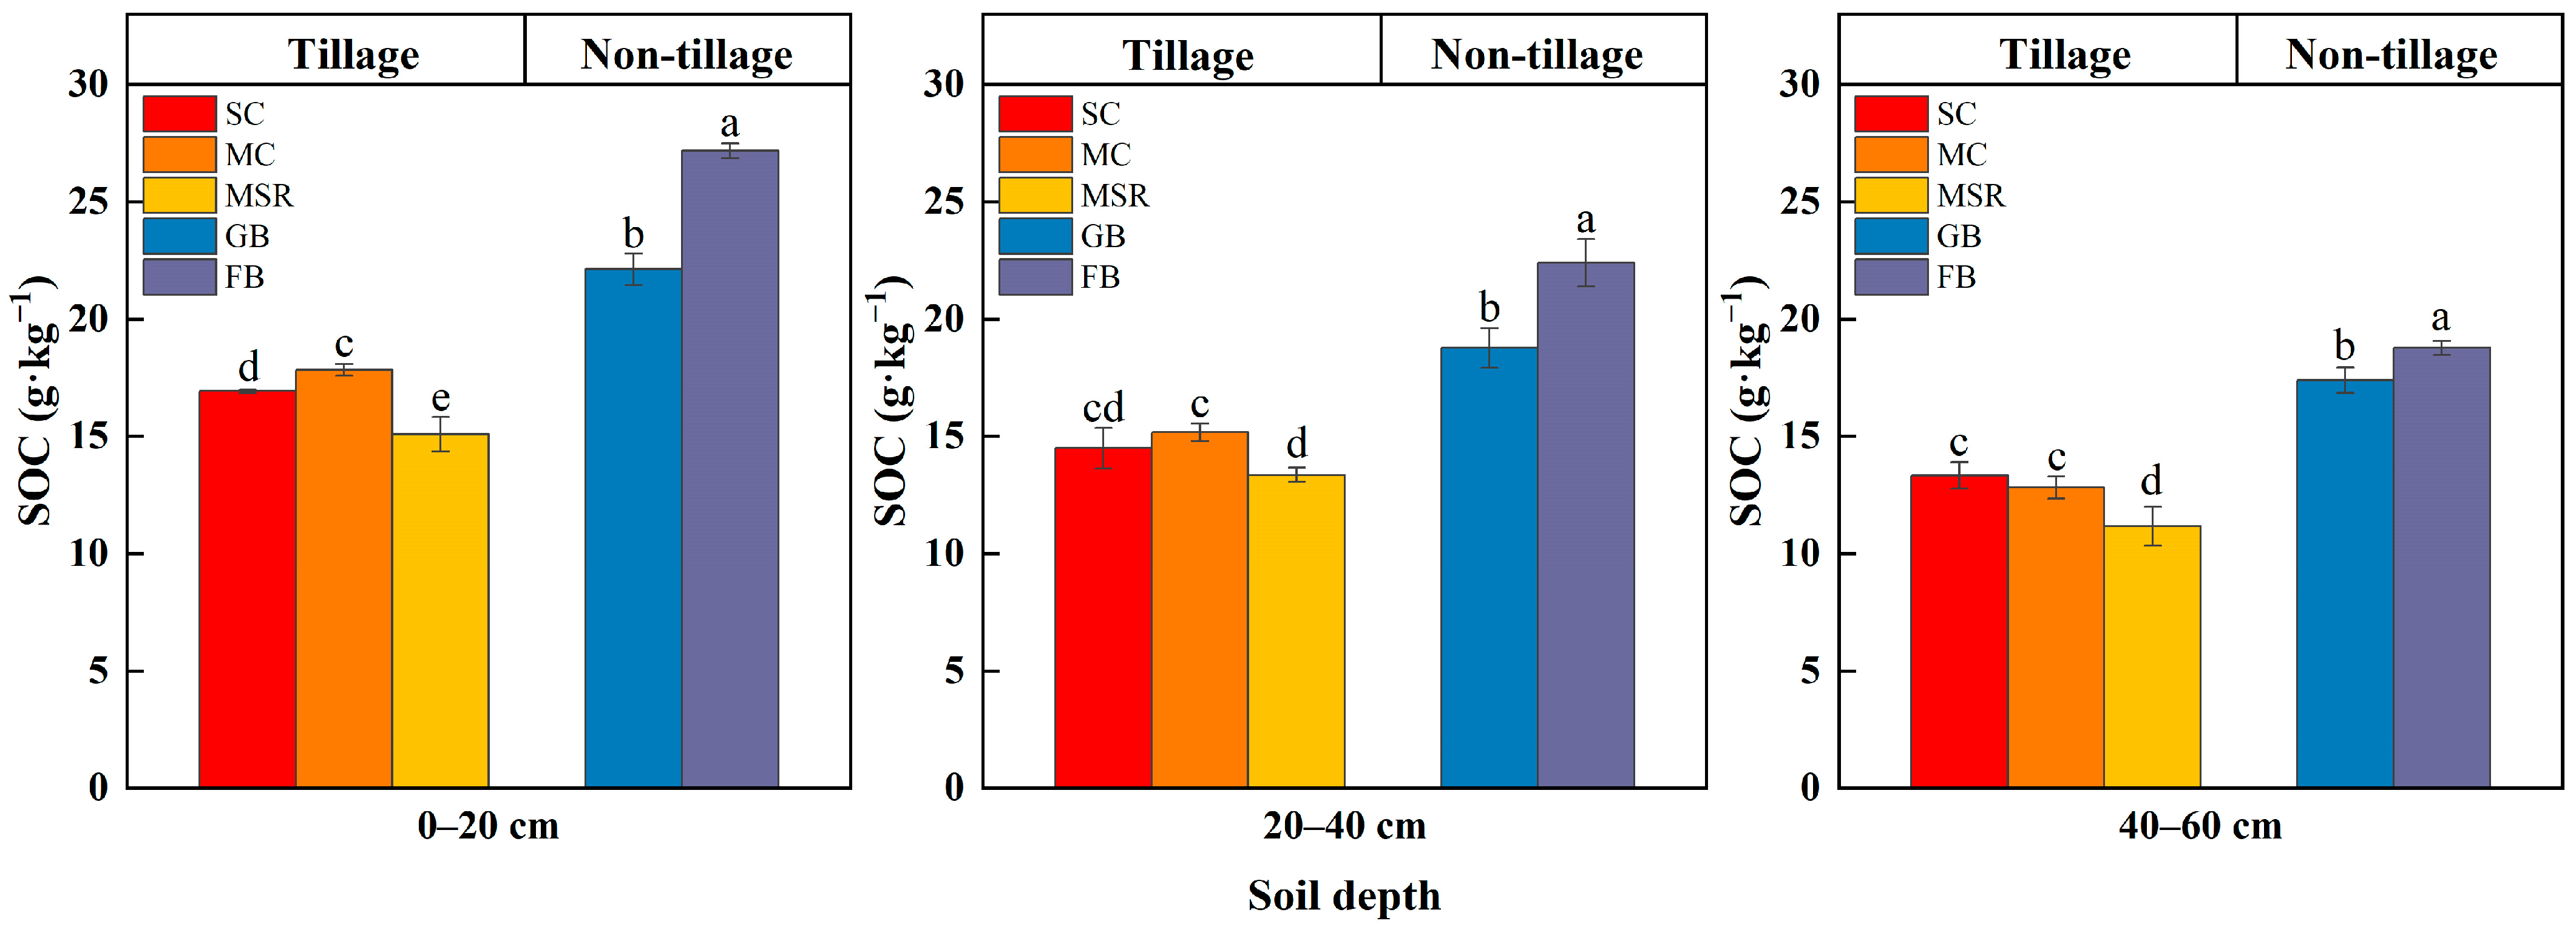
3.1. SOC Content
3.2. LOC Fractions
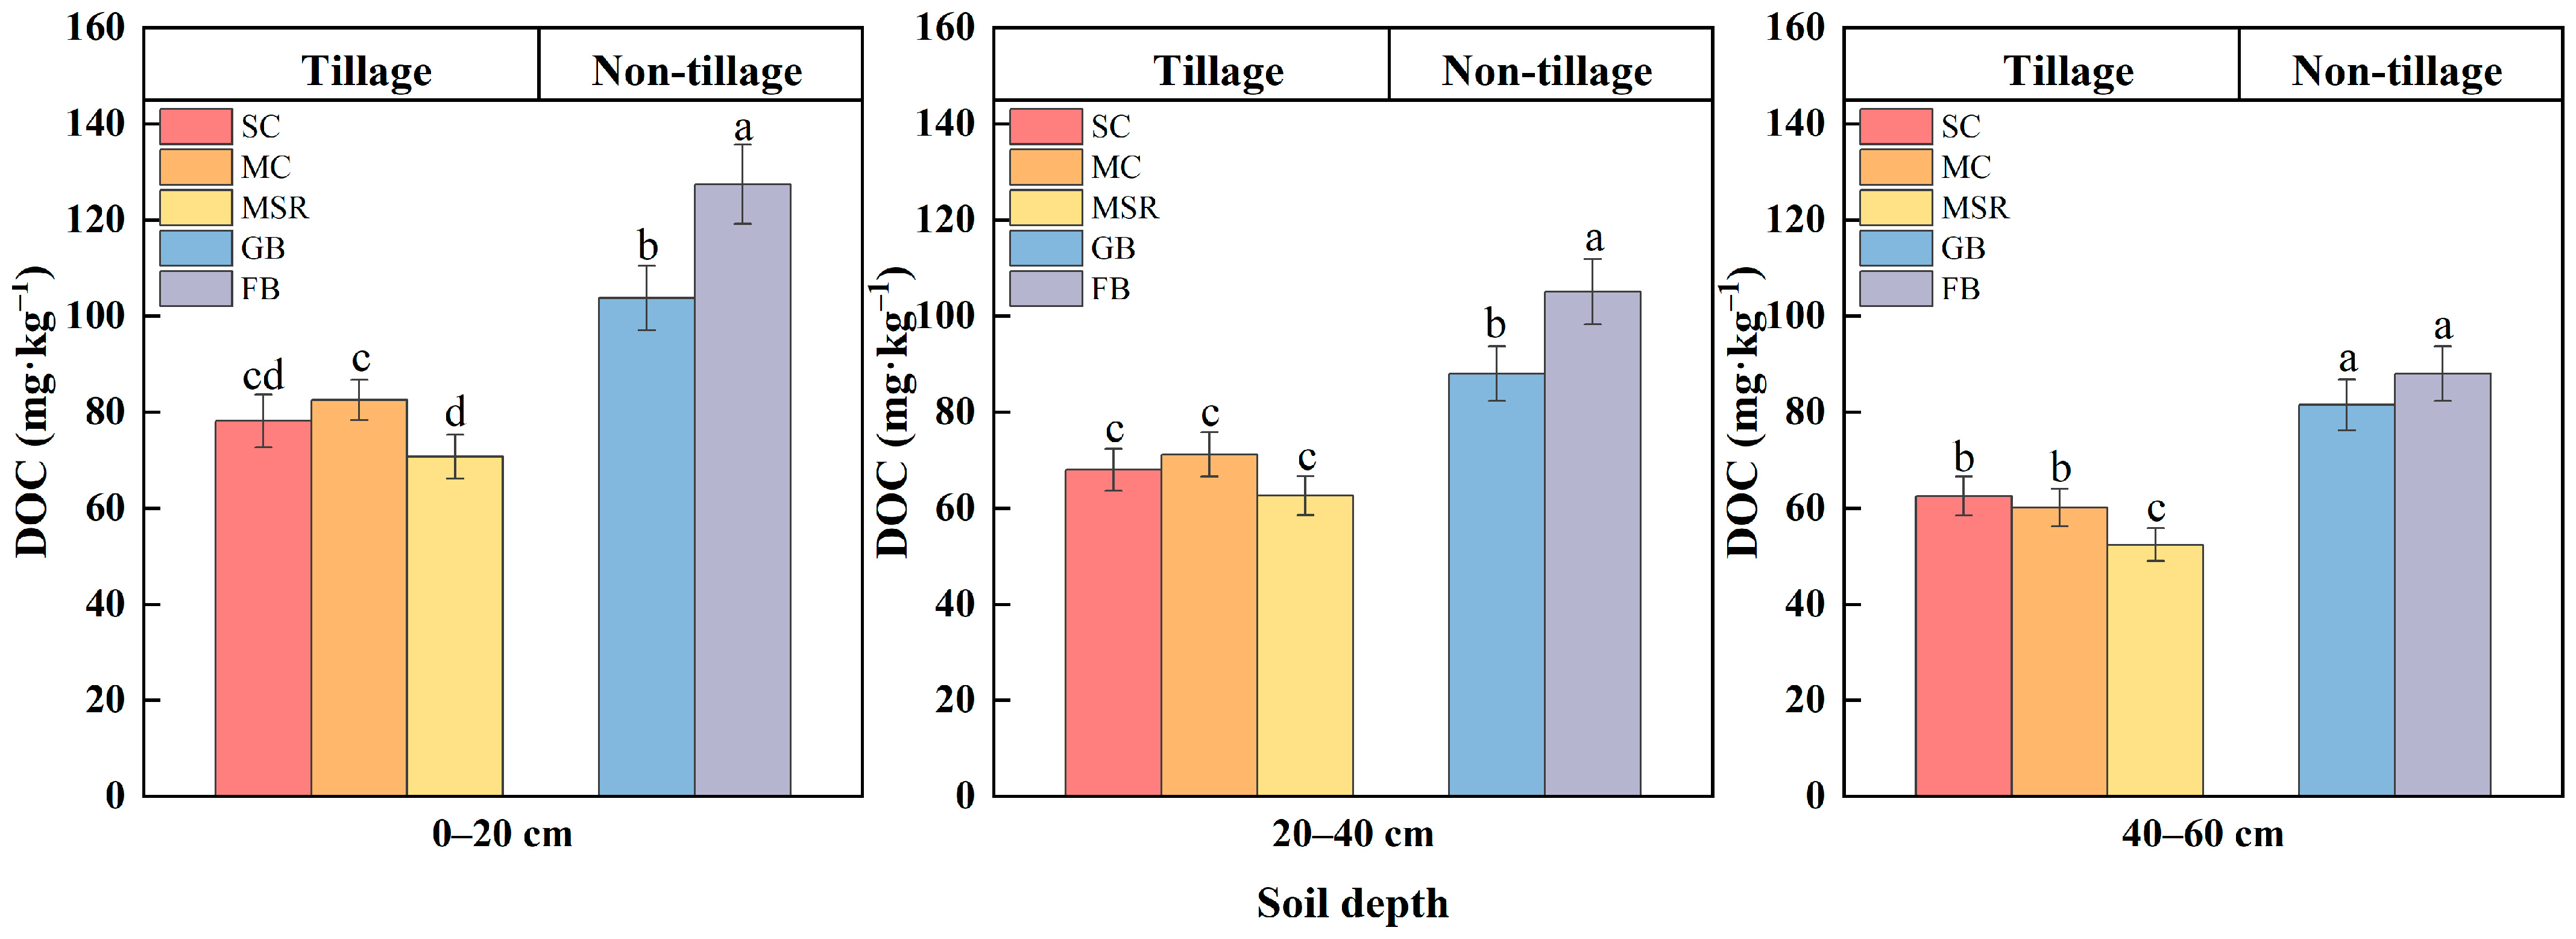
3.2.1. Changes in DOC
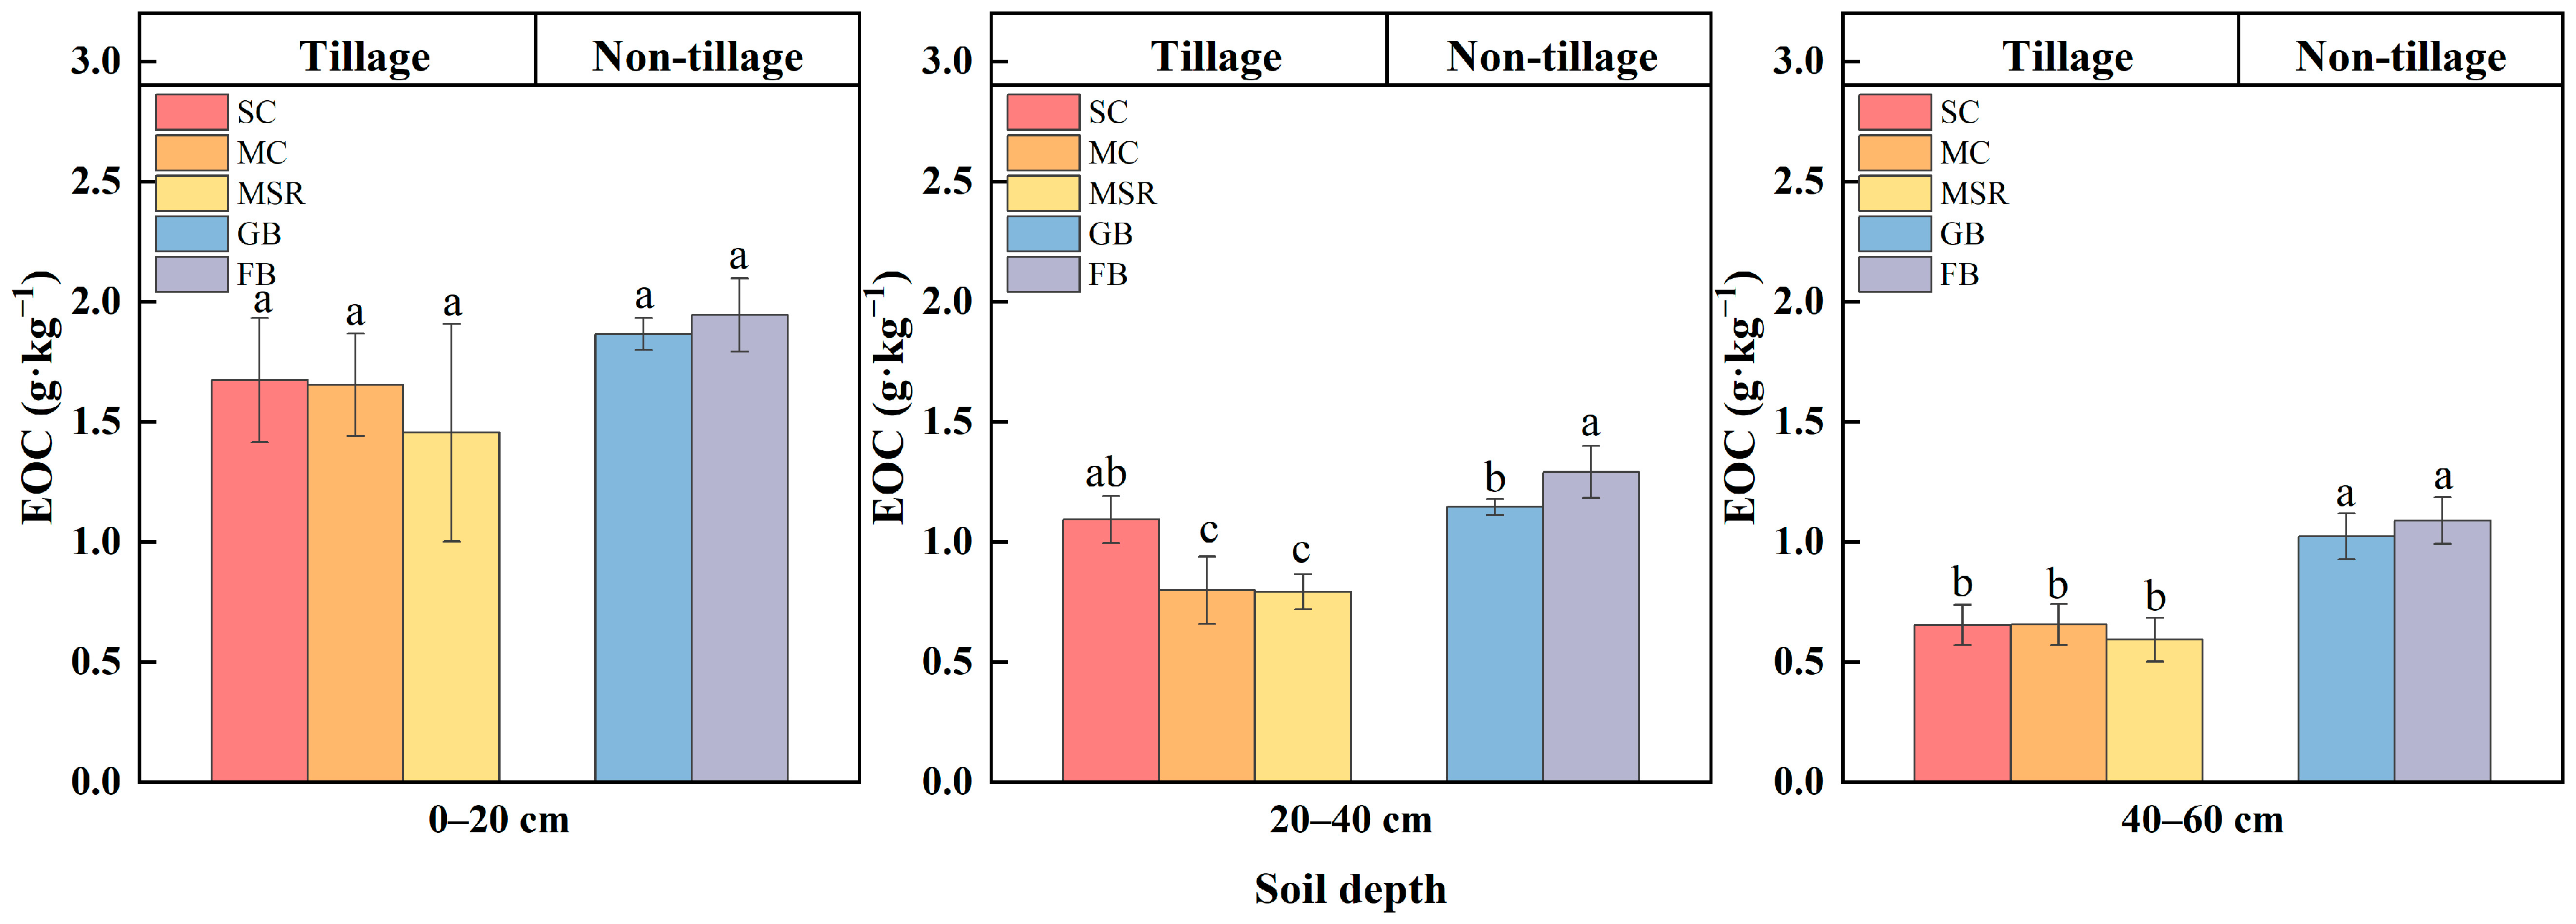
3.2.2. Changes in EOC
3.2.3. Changes in POC
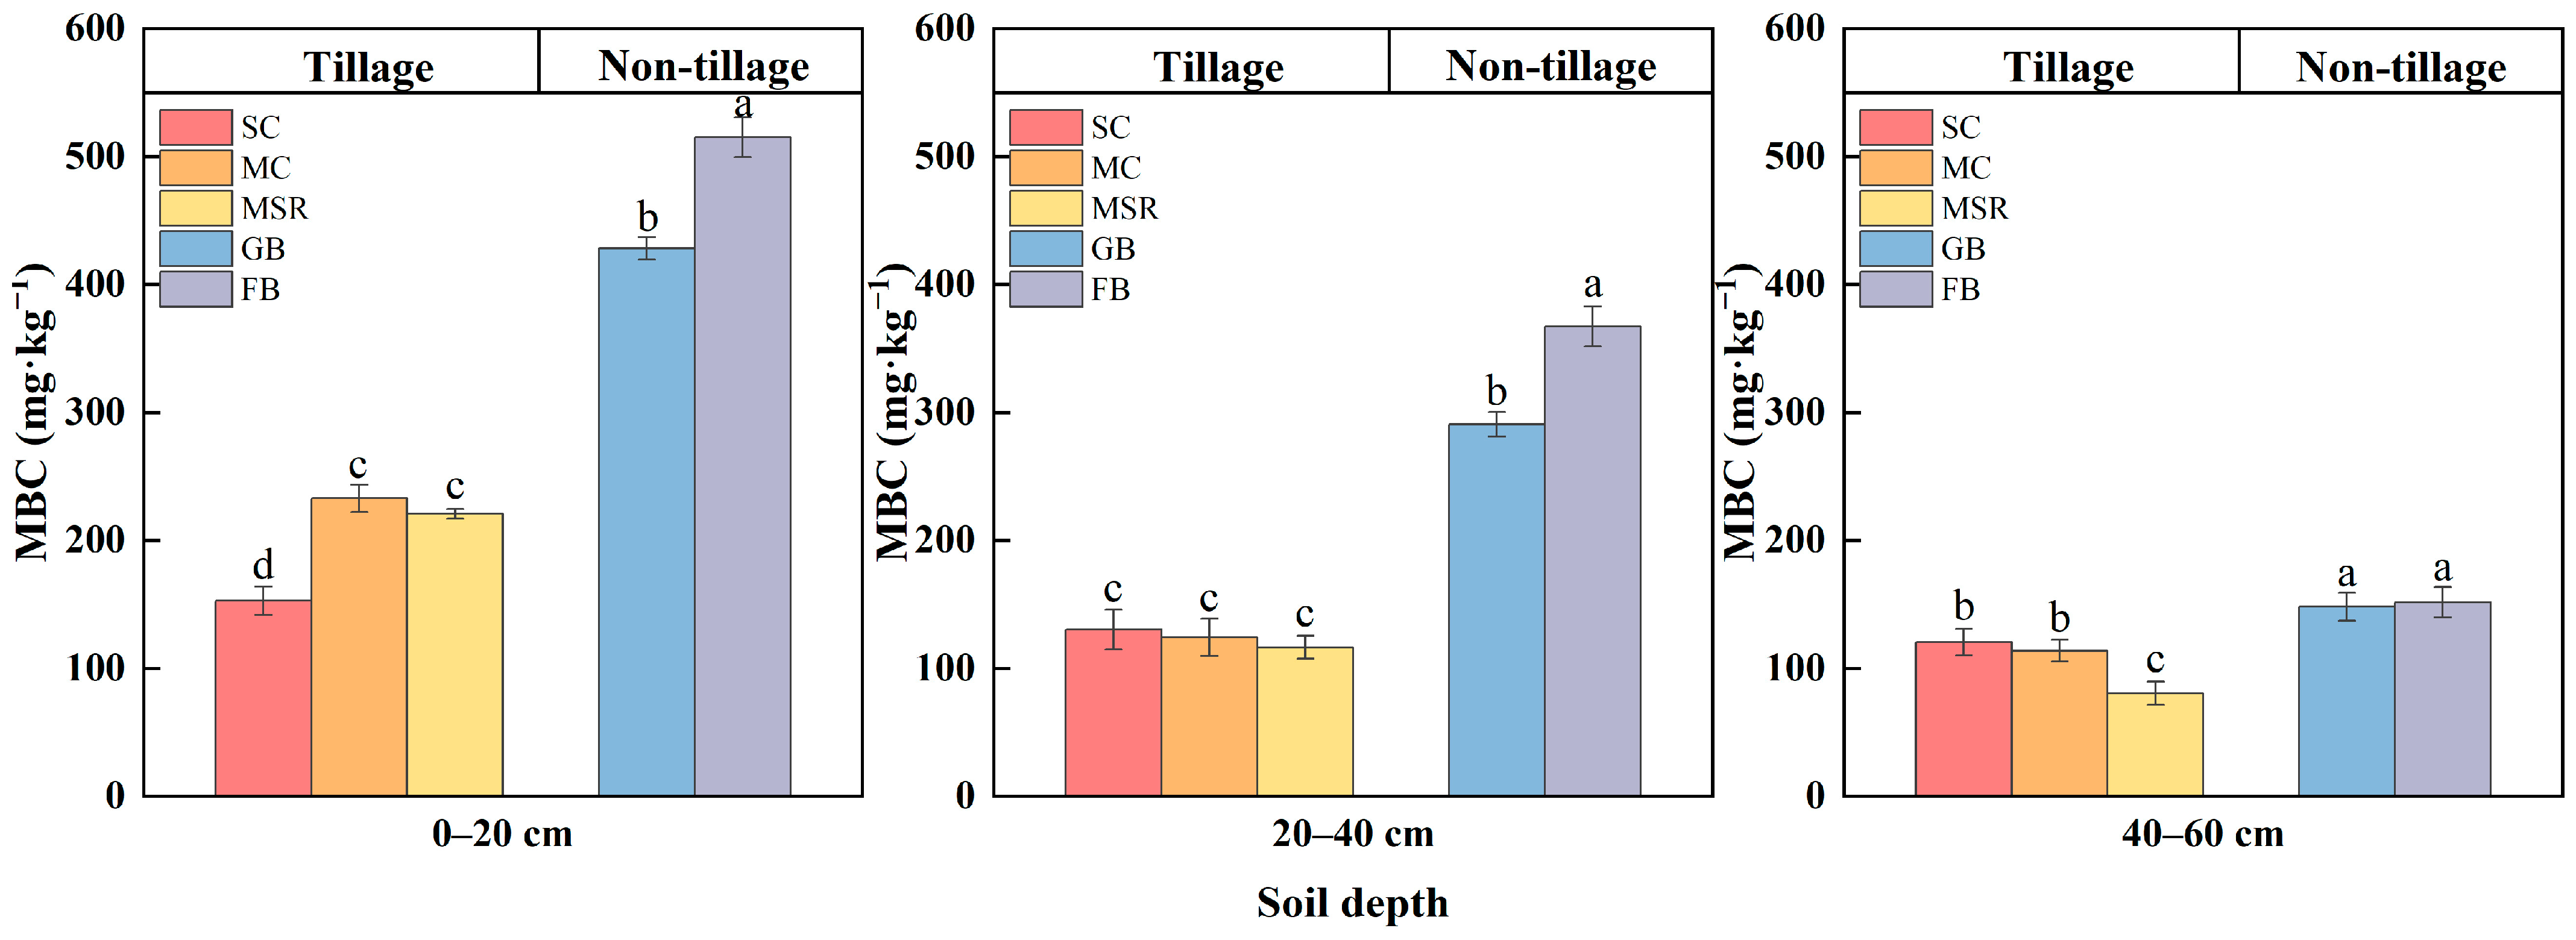
3.2.4. Changes in MBC
3.3. Proportions of LOC Fractions Under Different Land Use Patterns
3.4. Effects of Different Land Use Patterns on CMPI
3.5. Effects of Different Land Use Patterns on KOS
3.6. Correlation Between SOC Fractions and the Soil CPMI
4. Discussion
4.1. Effect of Different Land Use Patterns on SOC Distribution
4.2. Effect of Different Land Use Patterns on Soil LOC
4.3. Effects of Agricultural Land Use Change on SOC Stability and Soil Fertility
4.4. Characterization of Soil Quality by CMPI and Kos Under Different Land Use Patterns
5. Conclusions
Author Contributions
Funding
Institutional Review Board Statement
Informed Consent Statement
Data Availability Statement
Conflicts of Interest
References
- Lal, R. Global potential of soil carbon sequestration to mitigate the greenhouse effect. Crit. Rev. Plant Sci. 2003, 22, 151–184. [Google Scholar] [CrossRef]
- Batjes, N.H. Total carbon and nitrogen in the soils of the world. Eur. J. Soil Sci. 1996, 47, 151–163. [Google Scholar] [CrossRef]
- Friedlingstein, P.; O’Sullivan, M.; Jones, M.W.; Andrew, R.M.; Hauck, J.; Olsen, A.; Peters, G.P.; Peters, W.; Pongratz, J.; Sitch, S. Global carbon budget 2020. Earth Syst. Sci. Data Discuss. 2020, 2020, 1–3. [Google Scholar] [CrossRef]
- Kutsch, W.L.; Bahn, M.; Heinemeyer, A. Soil carbon relations: An overview. In Soil Carbon Dynamics; Cambridge University Press: Cambridge, UK, 2010. [Google Scholar]
- Beillouin, D.; Corbeels, M.; Demenois, J.; Berre, D.; Boyer, A.; Fallot, A.; Feder, F.; Cardinael, R. A global meta-analysis of soil organic carbon in the Anthropocene. Nat. Commun. 2023, 14, 3700. [Google Scholar] [CrossRef]
- Rumpel, C.; Amiraslani, F.; Chenu, C.; Garcia Cardenas, M.; Kaonga, M.; Koutika, L.-S.; Ladha, J.; Madari, B.; Shirato, Y.; Smith, P. The 4p1000 initiative: Opportunities, limitations and challenges for implementing soil organic carbon sequestration as a sustainable development strategy. Ambio 2020, 49, 350–360. [Google Scholar] [CrossRef]
- Amelung, W.; Bossio, D.; de Vries, W.; Kögel-Knabner, I.; Lehmann, J.; Amundson, R.; Bol, R.; Collins, C.; Lal, R.; Leifeld, J. Towards a global-scale soil climate mitigation strategy. Nat. Commun. 2020, 11, 5427. [Google Scholar] [CrossRef] [PubMed]
- Beillouin, D.; Cardinael, R.; Berre, D.; Boyer, A.; Corbeels, M.; Fallot, A.; Feder, F.; Demenois, J. A global overview of studies about land management, land-use change, and climate change effects on soil organic carbon. Glob. Change Biol. 2022, 28, 1690–1702. [Google Scholar] [CrossRef]
- Gunina, A.; Smith, A.R.; Kuzyakov, Y.; Jones, D.L. Microbial uptake and utilization of low molecular weight organic substrates in soil depend on carbon oxidation state. Biogeochemistry 2017, 133, 89–100. [Google Scholar] [CrossRef]
- Guimarães, D.V.; Gonzaga, M.I.S.; da Silva, T.O.; da Silva, T.L.; da Silva Dias, N.; Matias, M.I.S. Soil organic matter pools and carbon fractions in soil under different land uses. Soil Tillage Res. 2013, 126, 177–182. [Google Scholar] [CrossRef]
- Paul, E.A. The nature and dynamics of soil organic matter: Plant inputs, microbial transformations, and organic matter stabilization. Soil Biol. Biochem. 2016, 98, 109–126. [Google Scholar] [CrossRef]
- Wang, S.; Li, T.; Zheng, Z. Distribution of microbial biomass and activity within soil aggregates as affected by tea plantation age. Catena 2017, 153, 1–8. [Google Scholar] [CrossRef]
- Ge, J.; Wang, S.; Fan, J.; Gongadze, K.; Wu, L. Soil nutrients of different land-use types and topographic positions in the water-wind erosion crisscross region of China’s Loess Plateau. Catena 2020, 184, 104243. [Google Scholar] [CrossRef]
- Hu, J.; Wu, Q.; Chen, Z.; Cui, H.; Hu, Q. Effects of tillage years on soil organic carbon fractions in the Poyang Lake reclaimed paddy fields. J. Ecol. Rural Environ. 2018, 34, 240–246. [Google Scholar]
- Coulter, J.A.; Nafziger, E.D.; Wander, M.M. Soil organic matter response to cropping system and nitrogen fertilization. Agron. J. 2009, 101, 592–599. [Google Scholar] [CrossRef]
- Liu, M.-Y.; Chang, Q.-R.; Qi, Y.-B.; Liu, J.; Chen, T. Aggregation and soil organic carbon fractions under different land uses on the tableland of the Loess Plateau of China. Catena 2014, 115, 19–28. [Google Scholar] [CrossRef]
- Liu, M.; Ussiri, D.A.; Lal, R. Soil organic carbon and nitrogen fractions under different land uses and tillage practices. Commun. Soil Sci. Plant Anal. 2016, 47, 1528–1541. [Google Scholar] [CrossRef]
- Wang, T.; Kang, F.; Cheng, X.; Han, H.; Ji, W. Soil organic carbon and total nitrogen stocks under different land uses in a hilly ecological restoration area of North China. Soil Tillage Res. 2016, 163, 176–184. [Google Scholar] [CrossRef]
- Pathak, P.; Reddy, A. Vertical distribution analysis of soil organic carbon and total nitrogen in different land use patterns of an agro-organic farm. Trop. Ecol. 2021, 62, 386–397. [Google Scholar] [CrossRef]
- Zhao, Z.; Zhao, Z.; Fu, B.; Wang, J.; Tang, W. Characteristics of soil organic carbon fractions under different land use patterns in a tropical area. J. Soils Sediments 2021, 21, 689–697. [Google Scholar] [CrossRef]
- Xin, Z.; Qin, Y.; Yu, X. Spatial variability in soil organic carbon and its influencing factors in a hilly watershed of the Loess Plateau, China. Catena 2016, 137, 660–669. [Google Scholar] [CrossRef]
- Luo, Z.; Viscarra Rossel, R.A.; Shi, Z. Distinct controls over the temporal dynamics of soil carbon fractions after land use change. Glob. Change Biol. 2020, 26, 4614–4625. [Google Scholar] [CrossRef]
- Blair, G.J.; Lefroy, R.D.B.; Lisle, L. Soil carbon fractions based on their degree of oxidation, and the development of a carbon management index for agricultural systems. Aust. J. Agric. Res. 1995, 46, 1459–1466. [Google Scholar] [CrossRef]
- Huang, B.; Zhang, L.; Cao, Y.; Yang, Y.; Wang, P.; Li, Z.; Lin, Y. Effects of land-use type on soil organic carbon and carbon pool management index through arbuscular mycorrhizal fungi pathways. Glob. Ecol. Conserv. 2023, 43, e02432. [Google Scholar] [CrossRef]
- Zhang, X.; Xin, X.; Zhu, A.; Zhang, J.; Yang, W. Effects of tillage and residue managements on organic C accumulation and soil aggregation in a sandy loam soil of the North China Plain. Catena 2017, 156, 176–183. [Google Scholar] [CrossRef]
- Scherzinger, F.; Schädler, M.; Reitz, T.; Yin, R.; Auge, H.; Merbach, I.; Roscher, C.; Harpole, W.S.; Blagodatskaya, E.; Siebert, J. Sustainable land management enhances ecological and economic multifunctionality under ambient and future climate. Nat. Commun. 2024, 15, 4930. [Google Scholar] [CrossRef] [PubMed]
- Hu, J.; Wu, J.; Qu, X. Effects of organic wastes on labile organic carbon in semiarid soil under plastic mulched drip irrigation. Arch. Agron. Soil Sci. 2019, 65, 1873–1884. [Google Scholar] [CrossRef]
- Sharaf, A.; Wu, J.; Fan, W.; Hu, J.; Opoku-Kwanowaa, Y.; Abd El-Rahim, M.; Moussa, A.A. Changes in Soil Humic Acid Composition after Nine Years of Repeated Application of Organic Wastes in Black Soil: A Study Using Solid-State FT-IR and (13C-NMR) Analysis. Pol. J. Environ. Stud. 2021, 30, 5211–5223. [Google Scholar] [CrossRef] [PubMed]
- Bao, S. Soil Agrochemical Analysis; China Agriculture Press: Beijing, China, 2000. [Google Scholar]
- Jiang, P.K.; Xu, Q.F.; Xu, Z.H.; Cao, Z.H. Seasonal changes in soil labile organic carbon pools within a Phyllostachys praecox stand under high rate fertilization and winter mulch in subtropical China. For. Ecol. Manag. 2006, 236, 30–36. [Google Scholar] [CrossRef]
- Vance, E.D.; Brookes, P.C.; Jenkinson, D.S. An extraction method for measuring soil microbial biomass C. Soil Biol. Biochem. 1987, 19, 703–707. [Google Scholar] [CrossRef]
- Cambardella, C.A.; Elliott, E.T. Particulate Soil Organic-Matter Changes across a Grassland Cultivation Sequence. Soil Sci. Soc. Am. J. 1992, 56, 777–783. [Google Scholar] [CrossRef]
- Lambin, E.F.; Turner, B.L.; Geist, H.J.; Agbola, S.B.; Angelsen, A.; Bruce, J.W.; Coomes, O.T.; Dirzo, R.; Fischer, G.; Folke, C.; et al. The causes of land-use and land-cover change: Moving beyond the myths. Glob. Environ. Change 2001, 11, 261–269. [Google Scholar] [CrossRef]
- Paramesh, V.; Singh, S.K.; Mohekar, D.S.; Arunachalam, V.; Misra, S.D.; Jat, S.L.; Kumar, P.; Nath, A.J.; Kumar, N.; Mahajan, G.R. Impact of sustainable land-use management practices on soil carbon storage and soil quality in Goa State, India. Land Degrad. Dev. 2022, 33, 28–40. [Google Scholar] [CrossRef]
- Kooch, Y.; Ghorbanzadeh, N.; Francaviglia, R. Soil carbon stocks can be negatively affected by land use and climate change in natural ecosystems of semi-arid environment of Iran. Geoderma Reg. 2022, 31, e00591. [Google Scholar] [CrossRef]
- Ramesh, T.; Bolan, N.S.; Kirkham, M.B.; Wijesekara, H.; Kanchikerimath, M.; Rao, C.S.; Sandeep, S.; Rinklebe, J.; Ok, Y.S.; Choudhury, B.U. Soil organic carbon dynamics: Impact of land use changes and management practices: A review. Adv. Agron. 2019, 156, 1–107. [Google Scholar]
- Shi, P.; Zhang, Y.; Li, P.; Li, Z.; Yu, K.; Ren, Z.; Xu, G.; Cheng, S.; Wang, F.; Ma, Y. Distribution of soil organic carbon impacted by land-use changes in a hilly watershed of the Loess Plateau, China. Sci. Total Environ. 2019, 652, 505–512. [Google Scholar] [CrossRef]
- Zhou, M.; Liu, C.; Wang, J.; Meng, Q.; Yuan, Y.; Ma, X.; Liu, X.; Zhu, Y.; Ding, G.; Zhang, J. Soil aggregates stability and storage of soil organic carbon respond to cropping systems on Black Soils of Northeast China. Sci. Rep. 2020, 10, 265. [Google Scholar] [CrossRef] [PubMed]
- Jobbágy, E.G.; Jackson, R.B. The vertical distribution of soil organic carbon and its relation to climate and vegetation. Ecol. Appl. 2000, 10, 423–436. [Google Scholar] [CrossRef]
- Wang, Q.; Liu, J.; Wang, Y.; Guan, J.; Liu, Q.; Lv, D.-a. Land use effects on soil quality along a native wetland to cropland chronosequence. Eur. J. Soil Biol. 2012, 53, 114–120. [Google Scholar] [CrossRef]
- Xu, X.; Pei, J.; Xu, Y.; Wang, J. Soil organic carbon depletion in global Mollisols regions and restoration by management practices: A review. J. Soils Sediments 2020, 20, 1173–1181. [Google Scholar] [CrossRef]
- Wang, L.; Wang, X.; Kooch, Y.; Song, K.; Zheng, S.; Wu, D. Remote estimation of soil organic carbon under different land use types in agroecosystems of Eastern China. Catena 2023, 231, 107369. [Google Scholar] [CrossRef]
- Pan, Z.; Cai, X.; Bo, Y.; Guan, C.; Cai, L.; Haider, F.U.; Li, X.; Yu, H. Response of soil organic carbon and soil aggregate stability to changes in land use patterns on the Loess Plateau. Sci. Rep. 2024, 14, 31775. [Google Scholar] [CrossRef] [PubMed]
- Six, J.; Paustian, K. Aggregate-associated soil organic matter as an ecosystem property and a measurement tool. Soil Biol. Biochem. 2014, 68, A4–A9. [Google Scholar] [CrossRef]
- Mng’ong’o, M.; Munishi, L.K.; Blake, W.; Comber, S.; Hutchinson, T.H.; Ndakidemi, P.A. Soil fertility and land sustainability in Usangu Basin-Tanzania. Heliyon 2021, 7, e07745. [Google Scholar] [CrossRef] [PubMed]
- Yang, H.S. Resource management, soil fertility and sustainable crop production: Experiences of China. Agric. Ecosyst. Environ. 2006, 116, 27–33. [Google Scholar] [CrossRef]
- Fan, J.; McConkey, B.; Wang, H.; Janzen, H. Root distribution by depth for temperate agricultural crops. Field Crops Res. 2016, 189, 68–74. [Google Scholar] [CrossRef]
- Qin, H.; Liu, Y.; Chen, C.; Chen, A.; Liang, Y.; Cornell, C.R.; Guo, X.; Bai, E.; Hou, H.; Wang, D. Differential contribution of microbial and plant-derived organic matter to soil organic carbon sequestration over two decades of natural revegetation and cropping. Sci. Total Environ. 2024, 949, 174960. [Google Scholar] [CrossRef] [PubMed]
- Guan, Z.-H.; Jia, B.; Niu, Z.-q.; Mou, X.-M.; Chen, J.; Li, F.-C.; Wu, Y.-N.; Ning, S.; Yakov, K.; Li, X.G. Humidity controls soil organic carbon accrual in grassland on the Qinghai–Tibet Plateau. Soil Biol. Biochem. 2025, 201, 109655. [Google Scholar] [CrossRef]
- Hao, X.; You, M.; Han, X.; Li, H.; Zou, W.; Xing, B. Redistribution of Different Organic Carbon Fractions in the Soil Profile of a Typical Chinese Mollisol with Land-Use Change. Commun. Soil Sci. Plant Anal. 2017, 48, 2369–2380. [Google Scholar] [CrossRef]
- Cotrufo, M.; Peressotti, A.; Galdo, I.D.; Six, J. Assessing the Impact of Land-use on Soil C Sequestration by Means of Soil Organic Matter Fractionation and Stable C Isotopes. Glob. Change Biol. 2001, 9, 0106. [Google Scholar]
- Wu, F.; Xu, Z.; Yang, W. Carbon and nutrient transfer via above-and below-ground litter in forests. Forests 2022, 13, 2176. [Google Scholar] [CrossRef]
- Guo, L.B.; Gifford, R.M. Soil carbon stocks and land use change: A meta analysis. Glob. Change Biol. 2002, 8, 345–360. [Google Scholar] [CrossRef]
- Lei, X.; Shen, Y.; Zhao, J.; Huang, J.; Wang, H.; Yu, Y.; Xiao, C. Root exudates mediate the processes of soil organic carbon input and efflux. Plants 2023, 12, 630. [Google Scholar] [CrossRef] [PubMed]
- van den Berg, L.J.L.; Shotbolt, L.; Ashmore, M.R. Dissolved organic carbon (DOC) concentrations in UK soils and the influence of soil, vegetation type and seasonality. Sci. Total Environ. 2012, 427–428, 269–276. [Google Scholar] [CrossRef] [PubMed]
- Ren, T.; Ukalska-Jaruga, A.; Smreczak, B.; Cai, A. Dissolved organic carbon in cropland soils: A global meta-analysis of management effects. Agric. Ecosyst. Environ. 2024, 371, 109080. [Google Scholar] [CrossRef]
- Luo, Y.; Li, Q.; Shen, J.; Wang, C.; Li, B.; Yuan, S.; Zhao, B.; Li, H.; Zhao, J.; Guo, L.; et al. Effects of agricultural land use change on organic carbon and its labile fractions in the soil profile in an urban agricultural area. Land Degrad. Dev. 2019, 30, 1875–1885. [Google Scholar] [CrossRef]
- Liu, H.; Wu, Y.; Ai, Z.; Zhang, J.; Zhang, C.; Xue, S.; Liu, G. Effects of the interaction between temperature and revegetation on the microbial degradation of soil dissolved organic matter (DOM)—A DOM incubation experiment. Geoderma 2019, 337, 812–824. [Google Scholar] [CrossRef]
- Ma, L.; Lv, X.; Cao, N.; Wang, Z.; Zhou, Z.; Meng, Y. Alterations of soil labile organic carbon fractions and biological properties under different residue-management methods with equivalent carbon input. Appl. Soil Ecol. 2021, 161, 103821. [Google Scholar] [CrossRef]
- Bending, G.D.; Turner, M.K.; Rayns, F.; Marx, M.C.; Wood, M. Microbial and biochemical soil quality indicators and their potential for differentiating areas under contrasting agricultural management regimes. Soil Biol. Biochem. 2004, 36, 1785–1792. [Google Scholar] [CrossRef]
- López-Mondéjar, R.; Zühlke, D.; Becher, D.; Riedel, K.; Baldrian, P. Cellulose and hemicellulose decomposition by forest soil bacteria proceeds by the action of structurally variable enzymatic systems. Sci. Rep. 2016, 6, 25279. [Google Scholar] [CrossRef] [PubMed]
- Sowerby, A.; Emmett, B.A.; Williams, D.; Beier, C.; Evans, C.D. The response of dissolved organic carbon (DOC) and the ecosystem carbon balance to experimental drought in a temperate shrubland. Eur. J. Soil Sci. 2010, 61, 697–709. [Google Scholar] [CrossRef]
- Bongiorno, G.; Bünemann, E.K.; Oguejiofor, C.U.; Meier, J.; Gort, G.; Comans, R.; MäDer, P.; Brussaard, L.; Goede, R.D. Sensitivity of labile carbon fractions to tillage and organic matter management and their potential as comprehensive soil quality indicators across pedoclimatic conditions in Europe. Ecol. Indic. 2019, 99, 38–50. [Google Scholar] [CrossRef]
- Qiu, H.; Liu, J.; Li, L.; Liu, K.; He, X.; Su, Y. Assessing Nutrient Elements as Indicators for Soil Active Organic Carbon in Topsoil of Karst Areas. Pol. J. Environ. Stud. 2019, 28, 1325–1333. [Google Scholar] [CrossRef] [PubMed]
- Six, J.; Elliott, E.T.; Paustian, K. Aggregate and soil organic matter dynamics under conventional and no-tillage systems. Soil Sci. Soc. Am. J. 1999, 63, 1350–1358. [Google Scholar] [CrossRef]
- Guggenberger, G.; Kaiser, K. Dissolved organic matter in soil: Challenging the paradigm of sorptive preservation. Geoderma 2003, 113, 293–310. [Google Scholar] [CrossRef]
- Li, D.; Wen, L.; Zhang, W.; Yang, L.; Xiao, K. Afforestation effects on soil organic carbon and nitrogen pools modulated by lithology. For. Ecol. Manag. 2017, 400, 85–92. [Google Scholar] [CrossRef]
- Wu, J.; Zhang, H.; Pan, Y.; Cheng, X.; Zhang, K.; Liu, G. Particulate organic carbon is more sensitive to nitrogen addition than mineral-associated organic carbon: A meta-analysis. Soil Tillage Res. 2023, 232, 105770. [Google Scholar] [CrossRef]
- Zhao, Z.; Hao, B.; Zhang, X.; Zhang, J. Effects of residue incorporation and plant growth on soil labile organic carbon and microbial function and community composition under two soil moisture levels. Environ. Sci. Pollut. Res. 2017, 24, 18849–18859. [Google Scholar]
- Dang, R.; Liu, J.; Lichtfouse, E.; Zhou, L.; Zhou, M.; Xiao, L. Soil microbial carbon use efficiency and the constraints. Ann. Microbiol. 2024, 74, 37. [Google Scholar] [CrossRef]
- Leifeld, J.; Kögel-Knabner, I. Soil organic matter fractions as early indicators for carbon stock changes under different land-use? Geoderma 2005, 124, 143–155. [Google Scholar] [CrossRef]
- Zhang, L.; Chen, X.; Xu, Y.; Jin, M.; Ye, X.; Gao, H.; Chu, W.; Mao, J.; Thompson, M.L. Soil labile organic carbon fractions and soil enzyme activities after 10 years of continuous fertilization and wheat residue incorporation. Sci. Rep. 2020, 10, 11318. [Google Scholar] [CrossRef] [PubMed]
- Chen, R.; Senbayram, M.; Blagodatsky, S.; Myachina, O.; Dittert, K.; Lin, X.; Blagodatskaya, E.; Kuzyakov, Y. Soil C and N availability determine the priming effect: Microbial N mining and stoichiometric decomposition theories. Glob. Change Biol. 2014, 20, 2356–2367. [Google Scholar] [CrossRef] [PubMed]
- Li, S.; Zhang, S.; Pu, Y.; Li, T.; Xu, X.; Jia, Y.; Deng, O.; Gong, G. Dynamics of soil labile organic carbon fractions and C-cycle enzyme activities under straw mulch in Chengdu Plain. Soil Tillage Res. 2016, 155, 289–297. [Google Scholar] [CrossRef]
- Chen, X.; Xu, H.; Mustafa, A.; Huang, Q.; Liu, K.; Sun, N.; Xu, M. Differences of SOC storage and stability between soil layers influenced by long-term fertilization in a typical paddy soil of Southern China. Chem. Biol. Technol. Agric. 2023, 10, 97. [Google Scholar] [CrossRef]
- Zhang, S.; Zhou, X.; Chen, Y.; Du, F.; Zhu, B. Soil organic carbon fractions in China: Spatial distribution, drivers, and future changes. Sci. Total Environ. 2024, 919, 170890. [Google Scholar] [CrossRef] [PubMed]
- Hu, Y.; Ao, G.; Feng, J.; Chen, X.; Zhu, B. The patterns of forest soil particulate and mineral associated organic carbon characteristics with latitude and soil depth across eastern China. For. Ecosyst. 2024, 12, 100291. [Google Scholar] [CrossRef]
- Yan, Y.; Wang, C.; Zhang, J.; Sun, Y.; Xu, X.; Zhu, N.; Cai, Y.; Xu, D.; Wang, X.; Xin, X. Response of soil microbial biomass C, N, and P and microbial quotient to agriculture and agricultural abandonment in a meadow steppe of northeast China. Soil Tillage Res. 2022, 223, 105475. [Google Scholar] [CrossRef]
- Huang, R.; Lan, T.; Song, X.; Li, J.; Ling, J.; Deng, O.; Wang, C.; Gao, X.; Li, Q.; Tang, X. Soil labile organic carbon impacts C: N: P stoichiometry in urban park green spaces depending on vegetation types and time after planting. Appl. Soil Ecol. 2021, 163, 103926. [Google Scholar] [CrossRef]
- Vasenev, V.; Kuzyakov, Y. Urban soils as hot spots of anthropogenic carbon accumulation: Review of stocks, mechanisms and driving factors. Land Degrad. Dev. 2018, 29, 1607–1622. [Google Scholar] [CrossRef]
- Zhao, F.; Yang, G.; Han, X.; Feng, Y.; Ren, G. Stratification of Carbon Fractions and Carbon Management Index in Deep Soil Affected by the Grain-to-Green Program in China. PLoS ONE 2014, 9, e99657. [Google Scholar] [CrossRef] [PubMed]
- Zhang, L.; Sun, J.; Ren, C.; Han, X.; Yang, G.; Pang, G.; Bai, H.; Wang], J. Effect of Soil C, N and P Stoichiometry on Soil Organic C Fractions After Afforestation. Pedosphere 2017, 27, 705–713. [Google Scholar]
- Yang, H.; Wang, G.; Wang, J.; Xiao, Q.; Li, Z.; De Clerck, C.; Meersmans, J.; Colinet, G.; Zhang, W. No-tillage facilitates soil organic carbon sequestration by enhancing arbuscular mycorrhizal fungi-related soil proteins accumulation and aggregation. Catena 2024, 245, 108323. [Google Scholar] [CrossRef]
- Yang, X.; Wang, D.; Lan, Y.; Meng, J.; Jiang, L.; Sun, Q.; Cao, D.; Sun, Y.; Chen, W. Labile organic carbon fractions and carbon pool management index in a 3-year field study with biochar amendment. J. Soils Sediments 2018, 18, 1569–1578. [Google Scholar] [CrossRef]


| SOC (g·kg−1) | Total N (g·kg−1) | Total P (mg·kg−1) | Total K (g·kg−1) | pH |
|---|---|---|---|---|
| 16.8 | 1.29 | 1.05 | 2.39 | 6.6 |
| Soil Depth (cm) | Treatments | LOC/SOC | EOC/LOC | DOC/LOC | MBC/LOC | POC/LOC |
|---|---|---|---|---|---|---|
| 0–20 | SC | 25.05 ± 3.8 b | 39.47 ± 0.88 a | 1.86 ± 0.18 a | 3.64 ± 0.34 b | 55.03 ± 0.97 b |
| MC | 25.25 ± 2.09 b | 36.64 ± 1.15 a | 1.84 ± 0.09 a | 5.18 ± 0.28 a | 56.34 ± 0.79 b | |
| MSR | 37.76 ± 5.89 a | 25.19 ± 3.74 b | 1.26 ± 0.19 b | 3.95 ± 0.77 b | 69.6 ± 3.57 a | |
| GB | 37.36 ± 1.56 a | 22.59 ± 0.74 b | 1.25 ± 0.01 b | 5.19 ± 0.25 a | 70.96 ± 1 a | |
| FB | 31.9 ± 1.22 a | 22.4 ± 0.78 b | 1.47 ± 0.06 b | 5.94 ± 0.1 a | 70.18 ± 0.72 a | |
| 20–40 | SC | 23.33 ± 1.74 b | 32.4 ± 1.73 a | 2.02 ± 0.17 a | 3.85 ± 0.08 c | 61.74 ± 1.97 c |
| MC | 22.02 ± 2.13 b | 23.81 ± 2.08 b | 2.14 ± 0.1 a | 3.72 ± 0.12 c | 70.34 ± 2.11 b | |
| MSR | 29.77 ± 3.93 a | 20.04 ± 1.45 c | 1.59 ± 0.13 b | 2.94 ± 0.22 d | 75.43 ± 1.78 a | |
| GB | 33.26 ± 0.36 a | 18.36 ± 0.22 c | 1.41 ± 0.04 b | 4.66 ± 0.04 b | 75.57 ± 0.22 a | |
| FB | 31.87 ± 0.37 a | 18.06 ± 0.85 c | 1.47 ± 0.03 b | 5.14 ± 0.06 a | 75.33 ± 0.91 a | |
| 40–60 | SC | 20.92 ± 0.71 b | 23.41 ± 1.3 a | 2.24 ± 0.09 a | 4.32 ± 0.15 a | 70.03 ± 1.28 b |
| MC | 20.71 ± 1.43 b | 24.65 ± 0.93 a | 2.27 ± 0.06 a | 4.29 ± 0.1 a | 68.8 ± 0.82 b | |
| MSR | 30.63 ± 5.06 a | 17.51 ± 2.37 b | 1.56 ± 0.21 b | 2.38 ± 0.25 c | 78.56 ± 2.73 a | |
| GB | 31.66 ± 0.96 a | 18.54 ± 0.64 b | 1.48 ± 0.02 b | 2.69 ± 0.04 b | 77.29 ± 0.69 a | |
| FB | 33.42 ± 0.89 a | 17.34 ± 0.81 b | 1.4 ± 0.04 b | 2.42 ± 0.11 c | 78.84 ± 0.92 a |
| Depth (cm) | Treatments | Stable Carbon | CA | CAI | CPI | CPMI |
|---|---|---|---|---|---|---|
| Reference | 14.71 | 0.08 | ||||
| 0–20 | SC | 15.25 ± 0.20 d | 0.11 ± 0.02 a | 1.37 ± 0.23 a | 1.07 ± 0.00 d | 147.23 ± 24.89 a |
| MC | 16.18 ± 0.08 c | 0.10 ± 0.01 a | 1.28 ± 0.16 a | 1.13 ± 0.02 c | 144.45 ± 20.38 a | |
| MSR | 13.64 ± 0.44 e | 0.11 ± 0.03 a | 1.33 ± 0.40 a | 0.96 ± 0.05 e | 128.16 ± 44.03 a | |
| GB | 20.26 ± 0.62 b | 0.09 ± 0.00 a | 1.15 ± 0.02 a | 1.40 ± 0.04 b | 161.18 ± 5.89 a | |
| FB | 25.23 ± 0.24 a | 0.08 ± 0.01 a | 0.96 ± 0.07 a | 1.72 ± 0.02 a | 165.78 ± 13.81 a | |
| 20–40 | SC | 13.40 ± 0.78 cd | 0.08 ± 0.00 a | 1.02 ± 0.03 a | 0.92 ± 0.06 cd | 93.66 ± 8.58 a |
| MC | 14.38 ± 0.25 c | 0.06 ± 0.01 b | 0.69 ± 0.11 b | 0.96 ± 0.02 c | 66.82 ± 12.29 b | |
| MSR | 12.56 ± 0.24 d | 0.06 ± 0.00 b | 0.79 ± 0.06 b | 0.85 ± 0.02 d | 66.73 ± 6.46 b | |
| GB | 17.62 ± 0.81 b | 0.07 ± 0.00 b | 0.81 ± 0.02 b | 1.19 ± 0.05 b | 96.54 ± 2.70 a | |
| FB | 21.12 ± 0.89 a | 0.06 ± 0.00 b | 0.76 ± 0.03 b | 1.42 ± 0.06 a | 108.37 ± 9.39 a | |
| 40–60 | SC | 12.68 ± 0.49 c | 0.05 ± 0.00 b | 0.64 ± 0.06 b | 0.84 ± 0.04 c | 54.53 ± 7.19 b |
| MC | 12.16 ± 0.40 c | 0.05 ± 0.01 ab | 0.67 ± 0.07 ab | 0.81 ± 0.03 c | 54.75 ± 7.43 b | |
| MSR | 10.57 ± 0.74 d | 0.06 ± 0.00 ab | 0.70 ± 0.06 ab | 0.71 ± 0.05 d | 49.63 ± 7.85 b | |
| GB | 16.37 ± 0.45 b | 0.06 ± 0.00 a | 0.78 ± 0.05 a | 1.10 ± 0.03 b | 86.00 ± 8.40 a | |
| FB | 17.68 ± 0.20 a | 0.06 ± 0.00 a | 0.77 ± 0.06 a | 1.19 ± 0.02 a | 91.51 ± 8.56 a |
| Treatments | Depth (cm) | ||
|---|---|---|---|
| 0–20 | 20–40 | 40–60 | |
| SC | 9.29 ± 1.7 b | 12.27 ± 0.41 b | 19.51 ± 1.9 a |
| MC | 9.88 ± 1.18 b | 18.35 ± 3.12 a | 18.7 ± 1.94 ab |
| MSR | 9.9 ± 2.56 b | 15.92 ± 1.21 a | 17.97 ± 1.66 ab |
| GB | 10.86 ± 0.16 ab | 15.38 ± 0.34 a | 16.07 ± 1.04 b |
| FB | 13.03 ± 1.05 a | 16.4 ± 0.7 a | 16.3 ± 1.27 b |
Disclaimer/Publisher’s Note: The statements, opinions and data contained in all publications are solely those of the individual author(s) and contributor(s) and not of MDPI and/or the editor(s). MDPI and/or the editor(s) disclaim responsibility for any injury to people or property resulting from any ideas, methods, instructions or products referred to in the content. |
© 2025 by the authors. Licensee MDPI, Basel, Switzerland. This article is an open access article distributed under the terms and conditions of the Creative Commons Attribution (CC BY) license (https://creativecommons.org/licenses/by/4.0/).
Share and Cite
Duo, X.; Wu, J.; Cheng, W. Effects of Long-Term Land Use Patterns on Labile Organic Carbon Fractions and Carbon Pool Management Index of Mollisols Humus Layers. Appl. Sci. 2025, 15, 1006. https://doi.org/10.3390/app15031006
Duo X, Wu J, Cheng W. Effects of Long-Term Land Use Patterns on Labile Organic Carbon Fractions and Carbon Pool Management Index of Mollisols Humus Layers. Applied Sciences. 2025; 15(3):1006. https://doi.org/10.3390/app15031006
Chicago/Turabian StyleDuo, Xinqu, Jinggui Wu, and Wei Cheng. 2025. "Effects of Long-Term Land Use Patterns on Labile Organic Carbon Fractions and Carbon Pool Management Index of Mollisols Humus Layers" Applied Sciences 15, no. 3: 1006. https://doi.org/10.3390/app15031006
APA StyleDuo, X., Wu, J., & Cheng, W. (2025). Effects of Long-Term Land Use Patterns on Labile Organic Carbon Fractions and Carbon Pool Management Index of Mollisols Humus Layers. Applied Sciences, 15(3), 1006. https://doi.org/10.3390/app15031006