Article

Left Atrial Blood Flow Dynamics: Preliminary Observations Using HyperDoppler

1
Cardiology Unit, Ospedale “Buon Consiglio” Fatebenefratelli, 80123 Napoli, Italy
2
GLM Esaote Spa, 16152 Genova, Italy
3
Department of Engineering and Architecture, University of Trieste, 34127 Trieste, Italy
4
Department of Cardiac Thoracic Vascular Sciences and Public Health, University of Padova, 35128 Padova, Italy
5
Cardiology Unit, Ravenna33, 48124 Ravenna, Italy
*
Author to whom correspondence should be addressed.
Appl. Sci. 2025, 15(23), 12548; https://doi.org/10.3390/app152312548
Submission received: 22 September 2025 / Revised: 17 November 2025 / Accepted: 21 November 2025 / Published: 26 November 2025

Abstract

Background: Evaluation of blood flow dynamics within the left atrium (LA) using cardiac imaging techniques, such as four-dimensional (4D) flow magnetic resonance imaging (MRI) and contrast and non-contrast ultrasound, is an area of increasing interest, especially in patients with atrial fibrillation (AF). While 4D flow MRI and contrast ultrasound are limited in their application in routine clinical practice, non-contrast ultrasound techniques have the potential for extensive clinical application. However, there are no studies on LA flow dynamics evaluated using these latter techniques. Here we present the first application of HyperDoppler, a non-contrast color Doppler-based technique, to the assessment of LA flow dynamics in a case series. Methods: The transthoracic color Doppler modified apical 4-chamber view of a normal healthy subject and two patients with AF (one with persistent and the other with permanent AF) were analyzed using HyperDoppler. The resulting velocity vector map was visually examined frame-by-frame to describe LA flow dynamics. Results: In the healthy subject, HyperDoppler showed a LA flow behavior consistent with findings from the literature employing 4D flow MRI. In both patients with AF, HyperDoppler showed alterations of the LA flow dynamics pattern. Conclusions: Our preliminary observations suggest that HyperDoppler may be a valuable tool for characterizing physiological and pathological LA flow dynamics. Further studies are needed to confirm, explain and expand our initial findings.

1. Introduction

The assessment of intracardiac flow dynamics has gained increasing attention in recent years, specifically the application of this evaluation to patients with atrial fibrillation (AF) [1]. In these patients, abnormal blood flow dynamics within the fibrillating left atrium (LA) are thought to predispose to activation of the coagulation cascade, leading to local thrombus formation and a higher risk of cardioembolic stroke [2]. Thus, the possibility to evaluate non-invasively blood flow dynamics within the LA is an intriguing approach to a better definition of the thromboembolic risk, especially because current clinical risk scores, such as the CHA2DS2VASc, have only a moderate predictive power [3,4].
Four-dimensional (4D) flow magnetic resonance imaging (MRI) has provided valuable insights into LA flow dynamics, also in patients with AF [1]. However, clinical application of this technique is limited due to its high cost, technical complexity, and restricted availability. Ultrasound-based techniques are more accessible alternatives for assessing intracardiac flow dynamics. Their use, however, has been confined so far essentially to the left ventricle (LV) [5,6] and only rarely extended to the LA [7,8]. Moreover, ultrasound techniques have been generally coupled with contrast administration, which reduces their extensive applicability. Among the novel ultrasound modalities, HyperDoppler—a color Doppler-based technique—has shown the potential for visualizing intracardiac flow patterns using the transthoracic approach in an easy and reproducible way, without the use of contrast agents [9]. Here we present the first application of HyperDoppler to the assessment of LA flow dynamics in a case series, showing the potential of this technique for an extensive application in the clinical setting.

2. Methods

2.1. HyperDoppler Technique

HyperDoppler is an ultrasound technique that allows reconstruction of the two-dimensional velocity vector field of blood flow within the cardiac chambers on the basis of the color Doppler velocity data and fluid dynamics concepts. This technique derives from the original software distributed under the brand-name Omega-Flow [8,10,11] or HyperFlow [8,10,12,13] which was used to track contrast microbubbles.
A full description of the HyperDoppler technique has been provided elsewhere [9]. In brief, the method reconstructs the full two-dimensional velocity vector field in an echocardiographic imaging plane starting from the Doppler-measured velocity. Because in an apical view at transthoracic echocardiography only the longitudinal velocity component is directly available, the transverse component is computed by enforcing incompressible flow through the continuity equation. This yields an integral expression for transverse velocity but leaves an undetermined radial function and a potential discontinuous solution. To resolve these, the approach adds an irrotational (potential) flow to the Doppler field, ensuring mass conservation without explicit addition of vorticity or energy dissipation. This leads to a Poisson equation for the potential function. Solving this equation, performed efficiently in Cartesian coordinates using Fourier techniques, provides the correction needed to obtain the complete velocity field. Only the transverse velocity is adjusted, implicitly accounting for cross-plane flow, and the resulting solution is smooth and physically consistent.
It should be underlined that the reconstruction of the two-dimensional vector flow field from the one-dimensional color Doppler flow velocity information has been validated [14]. Thus, the reliability of the color Doppler-based approach to study intracardiac flow dynamics is not only theoretically sound but demonstrated, allowing practical application of the method as long as the echocardiographic apical approach is used.
The automatic output of the HyperDoppler algorithm consists of different maps and measures, including a velocity vector and a steady streaming flow field map [9]. On the velocity vector map, temporal variations in the orientation of the velocity vectors can be visually followed frame-by-frame. The steady streaming flow field represents the overall circulatory pattern during one heartbeat (heartbeat average). Using the steady streaming flow map, flow dynamics is shown in a single image on the basis of a color code: specifically, clockwise blood rotation is depicted in blue and counterclockwise rotation in red.
Scalar dimensionless measures related to intracardiac flow dynamics have been previously described for the LV [5,9]. These measures summarize vortex flow properties and are obtained from the steady streaming flow field image. On this single image, the extension of the net circulatory region during one heartbeat is evaluated, and the fundamental intraventricular vortex is defined as the compact region about the steady streaming vortex center, where the stream-function is larger than one-half of its peak value at the vortex center. The vortex properties of this net circulatory region are expressed by several measures. For this investigation, we limited vortex measures to vortex area, normalized with the LA area (in %), and vortex intensity, i.e., the integral of the vorticity inside the vortex, normalized with the total LA vorticity (in %). The vortex intensity is expressed as a negative number if vortex rotation is clockwise and as a positive number if counterclockwise.

2.2. Description of Study Subjects

The images of a normal healthy subject and two patients with AF, one with persistent AF and the other with permanent AF, were retrospectively analyzed for this report.
The normal subject was asymptomatic, with no cardiovascular risk factors and no history of cardiovascular disease or systemic disorders known to impact cardiac function. Physical cardiac examination was normal, as well as standard electrocardiogram (ECG) and echocardiography.
The two patients with AF were consecutively studied at the cardiology outpatient clinic. The first patient (patient A) was a 68-year-old male with a history of arterial hypertension and chronic obstructive pulmonary disease, a former smoker. He reported occasional episodes of palpitations. Physical examination revealed no signs of heart failure. The ECG showed persistent AF, ongoing for several months. At presentation, he was receiving pharmacological treatment with beta-blockers and a direct oral anticoagulant (DOAC). The second patient (patient B) was an 80-year-old female with a history of arterial hypertension and type 2 diabetes mellitus. She reported exertional dyspnea persisting for several months, classified as NYHA functional class II. The ECG revealed permanent AF, known for several years. Physical examination showed no signs of acute heart failure. Her pharmacological treatment included an ACE inhibitor, a beta-blocker, a DOAC, an SGLT2 inhibitor, a statin, and metformin.

2.3. Echocardiography

2.3.1. Image Acquisition

A comprehensive echocardiographic, Doppler, and color Doppler examination was performed using an echocardiography scanner equipped with a 1–5 MHz electronic phased-array transducer (MyLab X8, Esaote, Genova, Italy). Images were acquired with subjects in the left lateral decubitus position at hold end-expiration, and standard measurements were performed according to current recommendations of the American Society of Echocardiography/European Association of Cardiovascular Imaging [15]. The Mosteller formula for body surface area was used for indexation. Noninvasive blood pressure and heart rate were recorded at the time of the echocardiographic examination using the standard approach. For the HyperDoppler analysis, a modified color Doppler apical 4-chamber view was acquired in cineloop format, visualizing as much as possible one left pulmonary vein (LPV) and the right upper pulmonary vein (RUPV). Color Doppler frame rate was ≥21 fps and pulse repetition frequency 4.4 KHz.

2.3.2. HyperDoppler Image Analysis

HyperDoppler analysis was performed by expert readers, defined as physicians with profound knowledge of the principles and practice of the HyperDoppler technique and publications in the field [5,6,9]. Color Doppler cineloops were analyzed on board the echo scanner on images of a single cardiac cycle using the HyperDoppler software version F13. After retrieving one stored image cineloop, a region of interest was traced on the endocardial borders of the LA, including the entire LA cavity at end-systole. At the end of tracing, the mitral annular plane was automatically identified by the algorithm with a straight line. After the endocardial border identification, the vector velocity recovering algorithm was launched. Visual analysis of flow velocity vectors was directed at recognizing the presence of organized vortex structures in the LA during the different phases of the cardiac cycle: systole, early diastole, diastasis, late diastole. Quantitative analysis was directed at measuring LA vortex area and intensity.

3. Results

The main clinical and echocardiographic characteristics of the normal subject and the two patients with AF are shown in Table 1. In patient A, echocardiography revealed cardiac chambers of normal dimensions and preserved LV ejection fraction. No sign indicative of elevated LV filling pressures was detected. In patient B, echocardiography showed LA enlargement and a mild increase in pulmonary artery systolic pressure. LV ejection fraction was preserved.

3.1. HyperDoppler Findings

3.1.1. Healthy Subject

At the visual analysis of the velocity vector map (Figure 1A), an organized clockwise vortex flow within the LA was identified during LV systole. This flow structure remained stable until the early diastolic filling phase, when blood flow moved from the LA to the LV through the mitral valve. As diastasis progressed, a second clockwise vortex emerged. The steady streaming flow field map (Figure 1B) showed a dominant clockwise vortex (in blue) located within the LA. Quantitative analysis revealed a vortex area of 19.7%, while the corresponding vortex intensity was −22%.

3.1.2. AF Patients

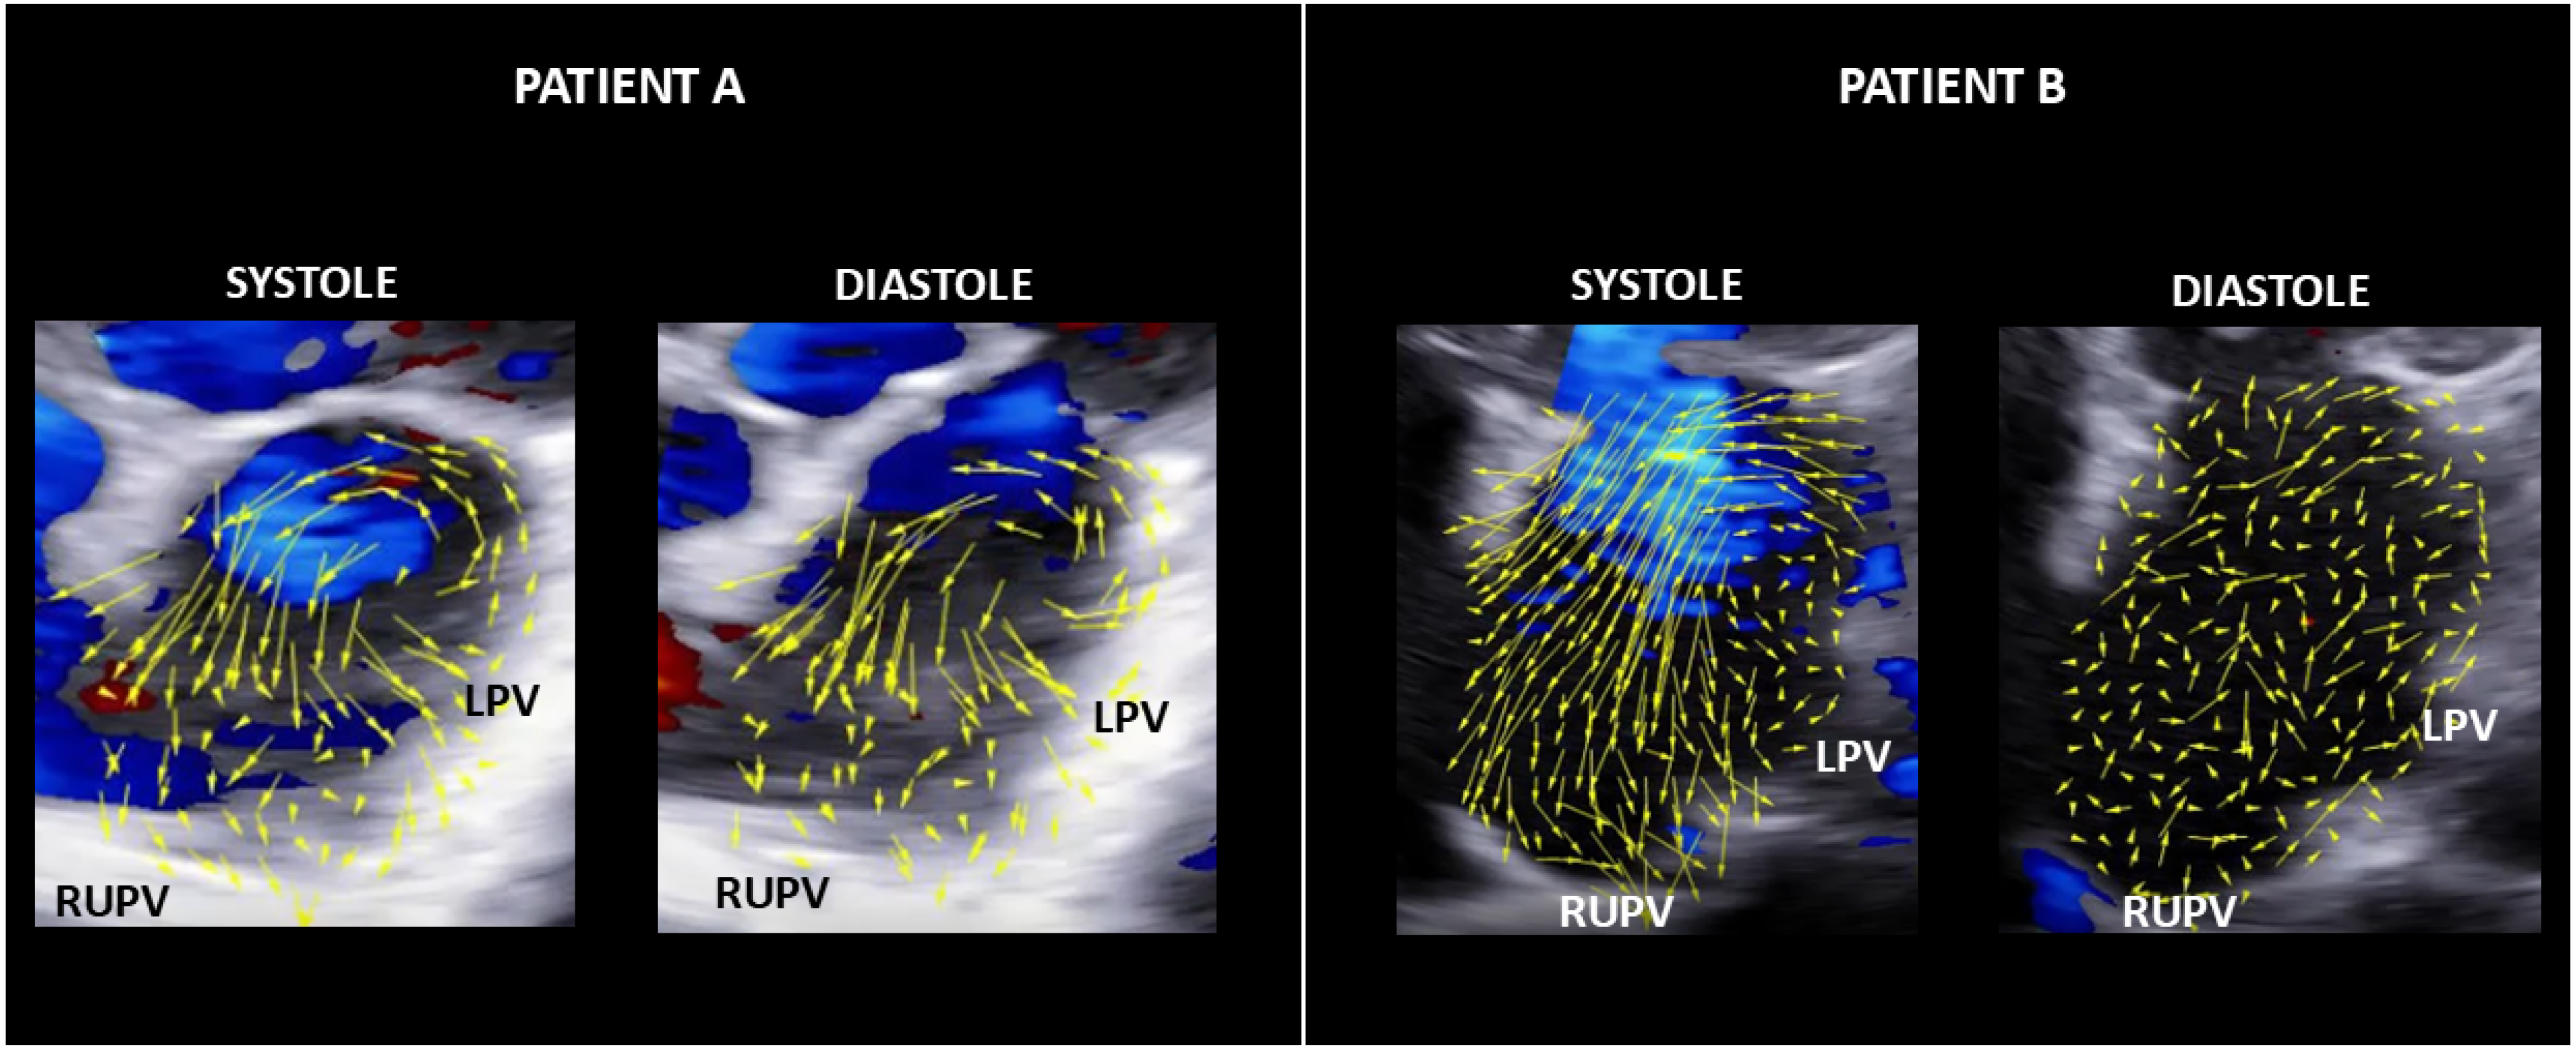
In both patients with AF, at the visual analysis of the velocity vector map, alterations of LA flow dynamics were noted. These included periods of counterclockwise rotation of the vortex structure, when recognizable, or complete disorganization of flow, especially during diastole (Figure 2). Quantitative analysis on the steady streaming flow map, although automatically provided by the algorithm, was not taken into consideration for these patients (see Section 4.4 below).

4. Discussion

Information relative to LA flow dynamics is scarce and can be derived from studies based on computational models [16,17], 4D flow MRI [18,19,20,21,22,23,24,25], and ultrasound techniques [7,8]. In the following discussion, the main findings of these studies are summarized to facilitate the interpretation of our observations.

4.1. Computational Models

In subjects with sinus rhythm, the pulmonary vein flow profile is characterized by four distinct waves: the first systolic wave (S1), generated by the LA relaxation following active contraction; the second systolic wave (S2), partially due to upstream wave propagation; the diastolic wave, which occurs during early LV filling and reflects suction of blood into the LA; and the end-diastole atrial reversal wave, caused by the LA contraction. During AF, the S1 wave and the atrial reversal wave disappear because atrial contraction is absent.
Feng et al. [17] in 2021 developed a complex computational model coupling the pulmonary circulation with the LA. According to this model, during the early systole, that is, at the time of the S1 flow wave, the flow jets originating from each pulmonary vein orifice meet in the LA and form an anticlockwise vortex. Similar patterns are observed during the S2 flow wave. However, differences exist in the arrival times of the S2 waves among the four veins, with the RUPV having the latest arrival time. In AF, comparable flow patterns are present during the S2 flow wave, but with a larger anticlockwise vortex.
These observations are fundamental because they explain the mechanism of LA vortex formation in relation to the pulmonary vein flow.

4.2. 4D-Flow MRI Studies

Kilner et al. [18] in 2000 studied a healthy 34-year-old man and reported that the intra-LA vortex exhibited counterclockwise rotation when viewed from the front.
Fyrenius et al. [19] in 2001 described blood flow dynamics within the LA in 11 healthy volunteers. They observed that the normal flow within the LA is vortical, organized in two temporally distinct vortices. The first vortical flow begins immediately before the LV systole and disappears with the onset of early diastole. During mid-diastole, a second LA vortex develops following peak early diastolic inflow. This mid-diastolic vortex is dissipated at the time of atrial contraction.
Föll et al. [20] in 2013 studied 24 healthy volunteers and found a vortical flow in the LA of all subjects. Systolic and diastolic vortical flow in the LA was evident in 92% of the young and 83% of the older volunteers. Most LA vortices were directed clockwise when viewed from the back.
Suwa et al. [21] in 2014 evaluated intra-LA flow dynamics in 32 patients with or without organic heart diseases and in 9 normal controls. The authors showed that all vortices developed during the LV late systole and early diastole and were directed counterclockwise when viewed from the subjects’ cranial side. Patients exhibiting vortices had fewer organic heart diseases and smaller LV and LA volumes.
Collectively, these studies demonstrate that flow in the normal LA is vortical. This pattern is observed across age groups, though it seems to occur slightly less frequently in older individuals.
AF has been associated with significant alterations in LA flow organization. Most studies in AF patients focused on blood flow velocities and vortex size within the LA. Fluckiger et al. [22] in 2013 observed that AF patients have a markedly lower mean blood flow velocity in the LA compared to subjects in sinus rhythm. Garcia et al. [23] in 2020 showed that, among patients with paroxysmal AF, LA vortex size has the potential to estimate thromboembolic risk, because larger vortices were associated with a lower prevalence of LA blood stasis.
Other studies focused on LA flow vorticity [24,25]. In particular, Spartera et al. [25] in 2023 reported that reduced LA flow vorticity was significantly and independently associated with embolic brain infarcts at brain MRI, even after adjustment for AF during MRI, history of AF, and other variables relative to LA function.

4.3. Ultrasound Evaluations

There is a paucity of studies examining blood flow dynamics in the LA using ultrasound.
Shibata et al. [7], in an animal experiment, used microbubble contrast agents and echocardiography under general anesthesia to visualize flow dynamics in the LA. When AF was present, the atrial vortices observed in sinus rhythm were obscured by an increased number of local eddies along the upper LPV.
Park et al. [8] applied two-dimensional transesophageal contrast echocardiography and particle image velocimetry to 35 patients in sinus rhythm and 30 with AF. In the control group, multiple and elliptical-shaped vortices were seen in the periphery of the LA. Vectors of these vortices were directed toward the atrioventricular inflow. In the AF group, a large, merged, and round-shaped vortex was observed in the center of the LA.
Although these contrast-based ultrasound studies cannot be considered conclusive, they show that physiological blood flow dynamics in the LA are altered during AF.

4.4. Current Observations

In this report we present the first application of HyperDoppler to the study of blood flow dynamics within the LA using transthoracic echocardiography without administration of contrast agents. We found that the LA flow dynamics pattern observed in the healthy subject using HyperDoppler (Figure 1) was consistent with findings from studies employing 4D flow MRI [19,21], showing that flow in the LA is organized in a main vortical structure during LV systole and diastasis. Also, in our healthy subject, we observed a clockwise rotation of the main LA vortex, which was quantified in terms of area and intensity.
Some considerations should be taken into account for a correct interpretation of our observations. First, when comparing echocardiography with 4D flow MRI regarding intra-atrial vortex flow direction, it should be noted that the perceived direction of vortex rotation depends on the viewing perspective, which in 4D flow MRI may be either anterior or posterior. Second, evaluation of vortex flow direction in the LA by transthoracic echocardiography requires a modified apical four-chamber view, rather than an apical long-axis view as used for the LV [9]. In fact, the LV view must include both the LV inflow and outflow tracts, whereas assessment of the LA requires visualization of the pulmonary veins. Third, because no established normal values exist for LA vortex area and intensity, our measurements in the healthy subject should be interpreted cautiously, serving only as exploratory evidence of the potential of HyperDoppler to quantify certain aspects of LA flow dynamics.
In both patients with AF, HyperDoppler showed alterations of the LA flow dynamics pattern, with periods of counterclockwise flow rotation or complete disorganization of flow dynamics (Figure 2). These findings confirm that blood flow dynamics are altered in patients with AF, as demonstrated by computational models [17], 4D flow MRI [22,23,24,25] and contrast ultrasound studies [7,8], all of which have reported multiple abnormalities in blood flow behavior within the LA.
In our two patients with AF, the effects of different anatomical and functional factors, such as LA size and mechanical function, on alterations in blood flow dynamics could not be evaluated and remain to be clarified. Finally, in this report, we did not measure the HyperDoppler vortex area and intensity in the AF patients because, as noted above, normal reference values for these measures are currently unknown.

4.5. Study Limitations

Our study has some limitations. First, although the HyperDoppler technique allows a quantitative evaluation of intracardiac flow dynamics using multiple measures, in this preliminary report, we decided to focus mostly on a qualitative visual assessment, both in the healthy subject and in patients with AF. Second, anatomical variants relative to the number and ostia of pulmonary veins have been described in normal subjects [26], but the effect of these anatomical variants on LA flow dynamics is unclear and was not taken into account in our case series. Third, the study of LA flow dynamics using a two-dimensional echocardiographic approach can be limited by the three-dimensional nature of flow within the LA. Finally, the HyperDoppler algorithm applied to the LA was originally developed for the study of the LV [9]. Whether specific refinements of the HyperDoppler algorithm are needed for the LA application remains to be determined.

5. Conclusions

Our preliminary observations suggest that HyperDoppler may be a valuable tool for characterizing physiological and pathological LA flow dynamics, providing a different way to evaluate LA function with respect to current assessments [27]. Further studies are needed to confirm, explain, and expand our observations in a wide number of normal subjects and AF patients, and also to establish their clinical relevance.

Author Contributions

Conceptualization, V.S.; methodology, V.S. and D.M.; software, G.P.; formal analysis, V.S. and D.M.; investigation, vs. and V.M.; resources, M.M.; writing—original draft preparation, V.S.; writing—review and editing, D.M., V.M., and G.P.; supervision, D.M. All authors have read and agreed to the published version of the manuscript.

Funding

This research received no external funding.

Institutional Review Board Statement

Ethical review and approval were waived due to the retrospective case report nature of this article.

Informed Consent Statement

Informed consent was obtained from all subjects involved in the study.

Data Availability Statement

The original contributions presented in this study are included in the article. Further inquiries can be directed to the corresponding author.

Conflicts of Interest

Marco Maglione is an Esaote employee engineer. The company had no role in study design, data collection, interpretation, or the decision to submit the work for publication.

Abbreviations

The following abbreviations are used in this manuscript:
AFatrial fibrillation
LAleft atrium
LPVleft pulmonary vein
LVleft ventricle
MRImagnetic resonance imaging
RUPVright upper pulmonary vein

References

  1. Sekine, T.; Nakaza, M.; Matsumoto, M.; Ando, T.; Inoue, T.; Sakamoto, S.-I.; Maruyama, M.; Obara, M.; Leonowicz, O.; Usuda, J.; et al. 4D flow MR imaging of the left atrium: What is non-physiological blood flow in the cardiac system? Magn. Reson. Med. Sci. 2022, 21, 293–308. [Google Scholar] [CrossRef]
  2. Watson, T.; Shantsila, E.; Lip, G.Y. Mechanisms of thrombogenesis in atrial fibrillation: Virchow’s triad revisited. Lancet 2009, 373, 155–166. [Google Scholar] [CrossRef] [PubMed]
  3. Lip, G.Y.; Nieuwlaat, R.; Pisters, R.; Lane, D.A.; Crijns, H.J.G.M. Refining clinical risk stratification for predicting stroke and thromboembolism in atrial fibrillation using a novel risk factor-based approach: The Euro Heart Survey on Atrial Fibrillation. Chest 2010, 137, 263–272. [Google Scholar] [CrossRef] [PubMed]
  4. Melgaard, L.; Gorst-Rasmussen, A.; Lane, D.A.; Rasmussen, L.H.; Larsen, T.B.; Lip, G.Y.H. Assessment of the CHA2DS2-VASc score in predicting ischemic stroke, thromboembolism, and death in patients with heart failure with and without atrial fibrillation. JAMA 2015, 314, 1030–1038. [Google Scholar] [CrossRef] [PubMed]
  5. Mele, D.; Smarrazzo, V.; Pedrizzetti, G.; Capasso, F.; Pepe, M.; Severino, S.; Luisi, G.A.; Maglione, M.; Ferrari, R. Intracardiac Flow Analysis: Techniques and Potential Clinical Applications. J. Am. Soc. Echocardiogr. 2019, 32, 319–332. [Google Scholar] [CrossRef]
  6. Serio, L.; Beccari, R.; Nistri, S.; Cecchetto, A.; Pedrizzetti, G.; Mele, D. Intracardiac flow dynamics in mitral regurgitation: State of the art. Eur. Heart J. Imaging Methods Pract. 2025, 3, qyaf022. [Google Scholar] [CrossRef]
  7. Shibata, M.; Yambe, T.; Funamoto, K.; Hayase, T. Intra-left Atrial Flow Changes During the Start of Atrial Fibrillation. Heart Lung Circ. 2013, 22, S184. [Google Scholar] [CrossRef]
  8. Park, K.H.; Son, J.W.; Park, W.J.; Lee, S.H.; Kim, U.; Park, J.S.; Shin, D.G.; Kim, Y.J.; Choi, J.H.; Houle, H.; et al. Characterization of the left atrial vortex flow by two-dimensional transesophageal contrast echocardiography using particle image velocimetry. Ultrasound Med. Biol. 2013, 39, 62–71. [Google Scholar] [CrossRef]
  9. Fiorencis, A.; Pepe, M.; Smarrazzo, V.; Martini, M.; Severino, S.; Pergola, V.; Evangelista, M.; Incarnato, P.; Previtero, M.; Maglione, M.; et al. Noninvasive Evaluation of Intraventricular Flow Dynamics by the HyperDoppler Technique: First Application to Normal Subjects, Athletes, and Patients with Heart Failure. J. Clin. Med. 2022, 11, 2216. [Google Scholar] [CrossRef]
  10. Hong, G.R.; Pedrizzetti, G.; Tonti, G.; Li, P.; Wei, Z.; Kim, J.K.; Bawela, A.; Liu, S.; Chung, N.; Houle, H.; et al. Characterization and Quantification of Vortex Flow in the Human Left Ventricle by Contrast Echocardiography Using Vector Particle Image Velocimetry. JACC Cardiov Imaging 2008, 1, 705–717. [Google Scholar] [CrossRef]
  11. Kheradvar, A.; Houle, H.; Pedrizzetti, G.; Tonti, G.; Belcik, T.; Ashraf, M.; Lindner, J.; Gharib, M.; Sahn, D. Echographic Particle Image Velocimetry: A novel technique for quantification of left ventricular blood vorticity pattern. J. Am. Soc. Echocardiogr. 2010, 23, 86–94. [Google Scholar] [CrossRef]
  12. Cimino, S.; Pedrizzetti, G.; Tonti, G.; Canali, E.; Petronilli, V.; De Luca, L.; Iacoboni, C.; Agati, L. In vivo analysis of intraventricular fluid dynamics in healthy hearts. Eur. J. Mech. B/Fluids 2012, 35, 40–46. [Google Scholar] [CrossRef]
  13. Pedrizzetti, G.; Martiniello, A.R.; Bianchi, V.; D'Onofrio, A.; Caso, P.; Tonti, G. Changes in electrical activation modify the direction of left ventricular flow momentum: Novel observations using Echocardiographic Particle Image Velocimetry. Eur. Heart J. Cardiovasc. Imaging 2016, 17, 203–209. [Google Scholar] [CrossRef] [PubMed]
  14. Uejima, T.; Koike, A.; Sawada, H.; Aizawa, T.; Ohtsuki, S.; Tanaka, M.; Furukawa, T.; Fraser, A.G. A new echocardiographic method for identifying vortex flow in the left ventricle: Numerical validation. Ultrasound Med. Biol. 2010, 36, 772–788. [Google Scholar] [CrossRef] [PubMed]
  15. Lang, R.M.; Badano, L.P.; Mor-Avi, V.; Afilalo, J.; Armstrong, A.; Ernande, L.; Flachskampf, F.A.; Foster, E.; Goldstein, S.A.; Kuznetsova, T.; et al. Recommendations for cardiac chamber quantification by echocardiography in adults: An update from the American Society of Echocardiography and the European Association of Cardiovascular Imaging. J. Am. Soc. Echocardiogr. 2015, 28, 1–39. [Google Scholar] [CrossRef]
  16. Vedula, V.; George, R.; Younes, L.; Mittal, R. Hemodynamics in the left atrium and its effect on ventricular flow patterns. J. Biomech. Eng. 2015, 137, 111003. [Google Scholar] [CrossRef]
  17. Feng, L.; Gao, H.; Qi, N.; Danton, M.; Hill, N.A.; Luo, X. Fluid–structure interaction in a fully coupled three-dimensional mitral–atrium–pulmonary model. Biomech. Model. Mechanobiol. 2021, 20, 1267–1295. [Google Scholar] [CrossRef]
  18. Kilner, P.J.; Yang, G.-Z.; Wilkes, A.J.; Mohiaddin, R.H.; Firmin, D.N.; Yacoub, M.H. Asymmetric redirection of flow through the heart. Nature 2000, 404, 759–761. [Google Scholar] [CrossRef]
  19. Fyrenius, A.; Wigström, L.; Ebbers, T.; Karlsson, M.; Engvall, J.; Bolger, A.F. Three dimensional flow in the human left atrium. Heart 2001, 86, 448–455. [Google Scholar] [CrossRef]
  20. Föll, D.; Taeger, S.; Bode, C.; Jung, B.; Markl, M. Age gender, blood pressure, and ventricular geometry influence normal 3D blood flow characteristics in the left heart. Eur. Heart J. Cardiovasc. Imaging 2013, 14, 366–373. [Google Scholar] [CrossRef]
  21. Suwa, K.; Saitoh, T.; Takehara, Y.; Sano, M.; Nobuhara, M.; Saotome, M.; Urushida, T.; Katoh, H.; Satoh, H.; Sugiyama, M.; et al. Characteristics of Intra-Left Atrial Flow Dynamics and Factors Affecting Formation of the Vortex Flow: Analysis with Phase-Resolved 3-Dimensional Cine Phase Contrast Magnetic Resonance Imaging. Circ. J. 2014, 79, 144–152. [Google Scholar] [CrossRef]
  22. Fluckiger, J.U.; Goldberger, J.J.; Lee, D.C.; Ng, J.; Lee, R.; Goyal, A.; Markl, M. Left Atrial Flow Velocity Distribution and Flow Coherence Using Four-Dimensional FLOW MRI: A Pilot Study Investigating the Impact of Age and Pre- and Postintervention Atrial Fibrillation on Atrial Hemodynamics. J. Magn. Reson. Imaging 2013, 38, 580–587. [Google Scholar] [CrossRef]
  23. Garcia, J.; Sheitt, H.; Bristow, M.S.; Lydell, C.; Howarth, A.G.; Heydari, B.; Prato, F.S.; Drangova, M.; Thornhill, R.E.; Nery, P.; et al. Left atrial vortex size and velocity distributions by 4D flow MRI in patients with paroxysmal atrial fibrillation: Associations with age and CHA2 DS2-VASc risk score. J. Magn. Reson. Imaging 2020, 51, 871–884. [Google Scholar] [CrossRef] [PubMed]
  24. Spartera, M.; Pessoa-Amorim, G.; Stracquadanio, A.; Von Ende, A.; Fletcher, A.; Manley, P.; Neubauer, S.; Ferreira, V.M.; Casadei, B.; Hess, A.T.; et al. Left atrial 4D flow cardiovascular magnetic resonance: A reproducibility study in sinus rhythm and atrial fibrillation. Cardiovasc. Magn. Reson. 2021, 23, 29. [Google Scholar] [CrossRef] [PubMed]
  25. Spartera, M.; Stracquadanio, A.; Pessoa-Amorim, G.; Harston, G.; Mazzucco, S.; Young, V.; Von Ende, A.; Hess, A.T.; Ferreira, V.M.; Kennedy, J.; et al. Reduced Left Atrial Rotational Flow Is Independently Associated with Embolic Brain Infarcts. JACC Cardiovasc. Imaging 2023, 16, 1149–1159. [Google Scholar] [CrossRef] [PubMed]
  26. Pandey, N.N.; Taxak, A.; Kumar, S. Normal pulmonary venous anatomy and non-anomalous variations demonstrated on CT angiography: What the radiologist needs to know? Br. J. Radiol. 2020, 93, 20200595. [Google Scholar] [CrossRef]
  27. Mangia, M.; D’Andrea, E.; Cecchetto, A.; Beccari, R.; Mele, D.; Nistri, S. Current and Clinically Relevant Echocardiographic Parameters to Analyze Left Atrial Function. J. Cardiovasc. Dev. Dis. 2024, 11, 241. [Google Scholar] [CrossRef]
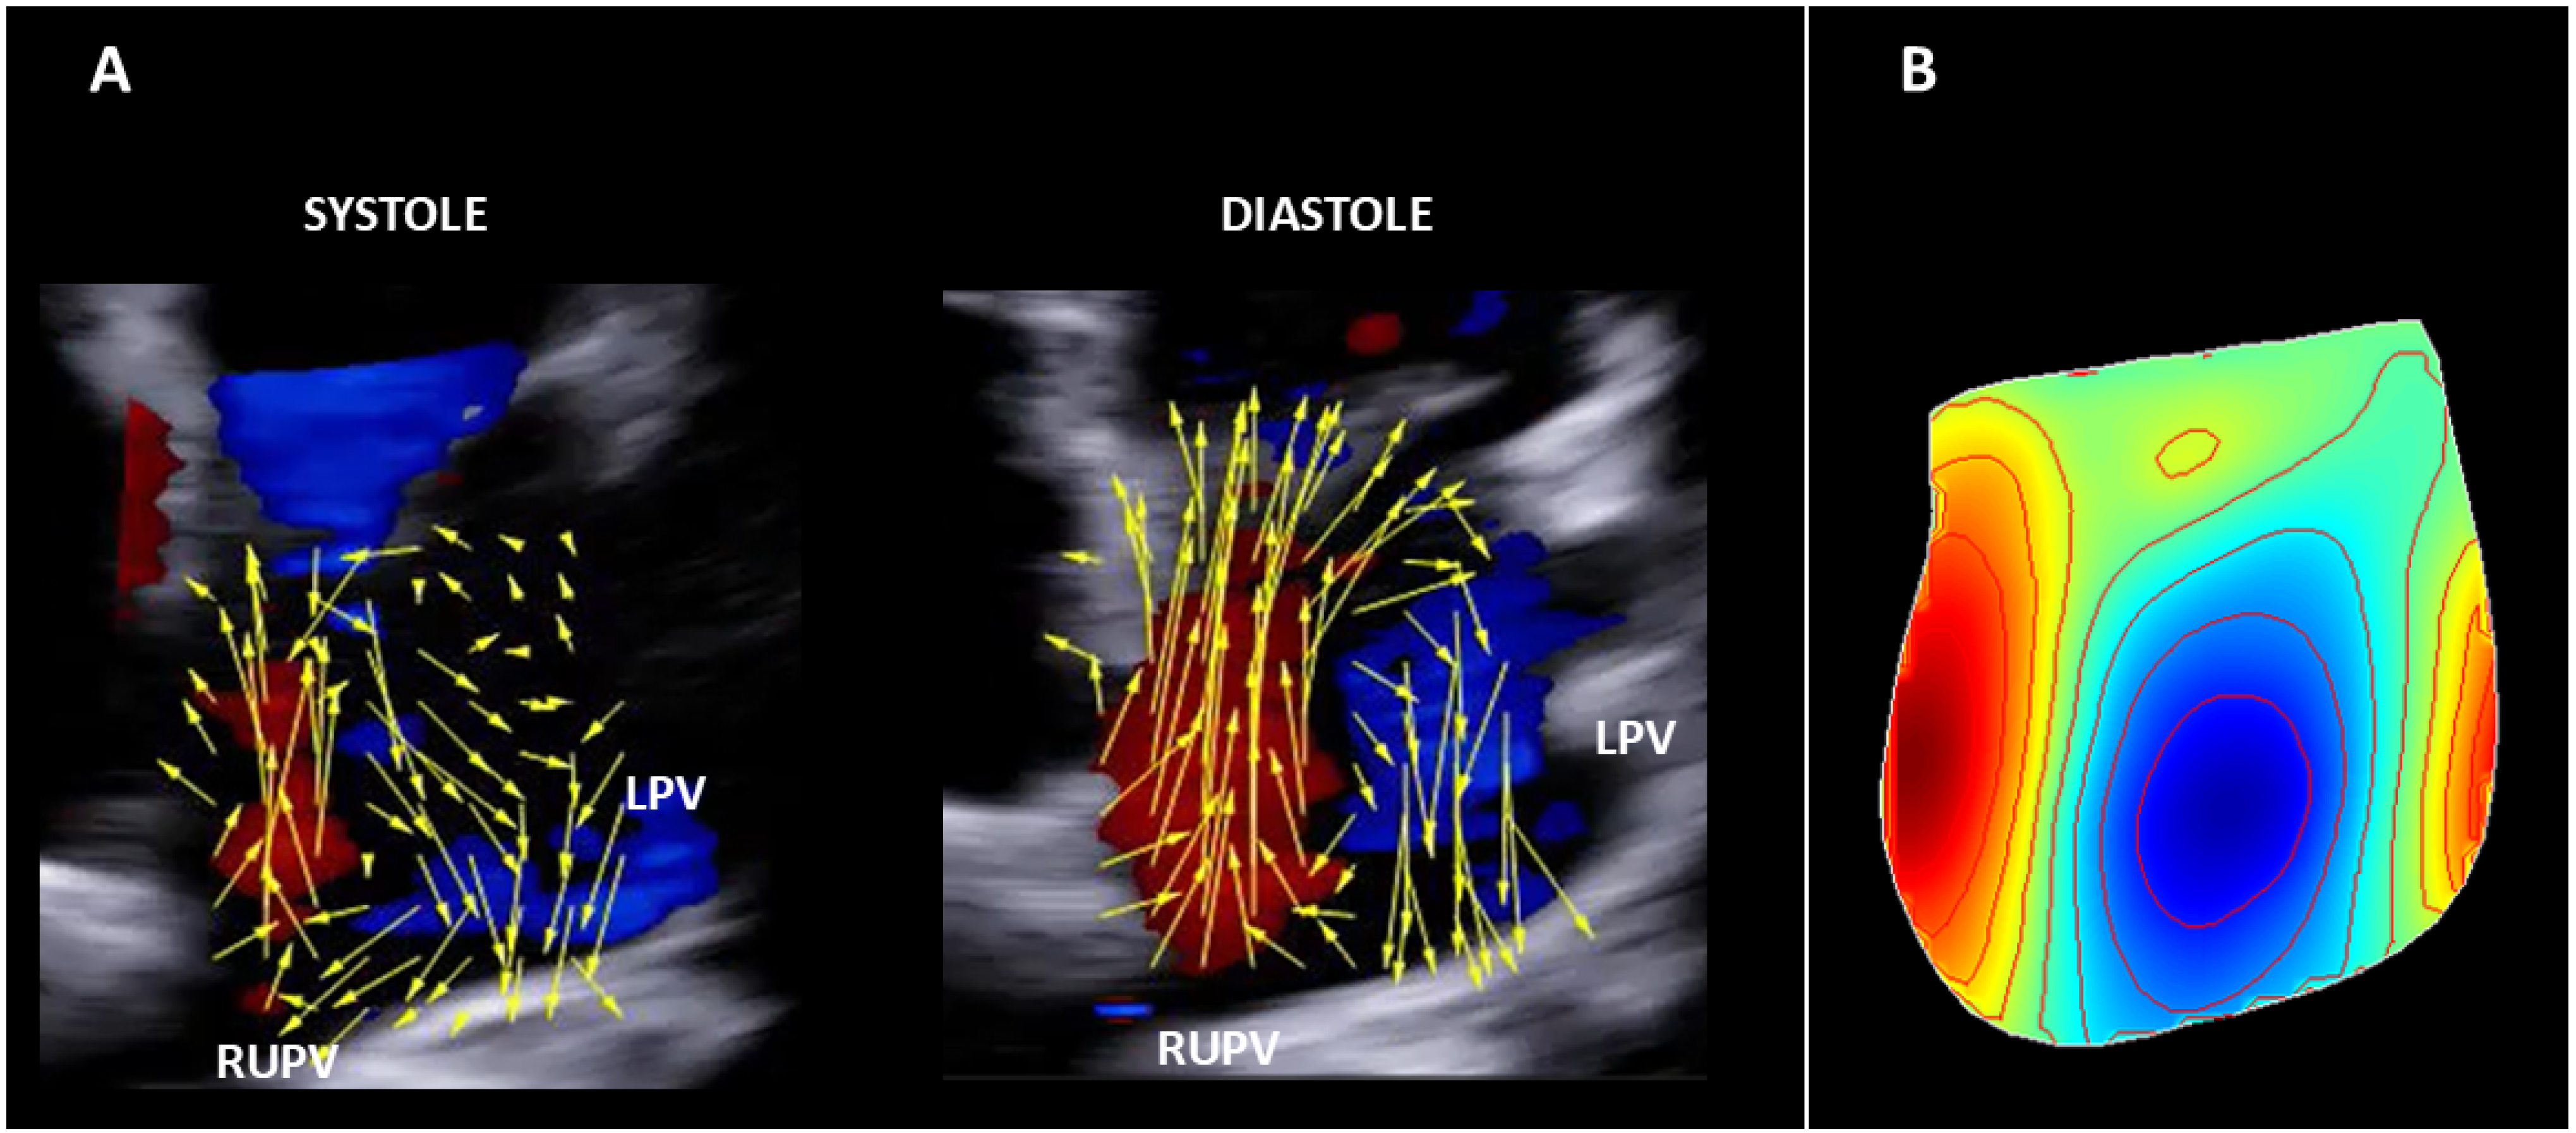
Figure 1. (A) Flow velocity vector map showing a clockwise rotating vortex in the left atrium in a normal subject in sinus rhythm. (B) Left atrial steady-streaming flow map of one heartbeat obtained in the same subject. Clockwise blood rotation is depicted in blue. LPV, left pulmonary vein. RUPV, right upper pulmonary vein.
Applsci 15 12548 g001
Figure 2. Flow velocity vector map in patients A and B during atrial fibrillation. In both patients, alterations of the left atrial flow dynamics were noted, including periods of counterclockwise rotation of the vortex structure. In patient B a total disorganization of flow was observed during diastole. LPV, left pulmonary vein. RUPV, right upper pulmonary vein.
Applsci 15 12548 g002
Table 1. Characteristics of the normal subject and patients with atrial fibrillation.
Normal SubjectPatient APatient B
Age (years)396880
SexMaleMaleFemale
Heart Rate (bpm)757090
BSA (m2)1.901.801.97
Cardiac rhythmSR AFAF
SBP (mmHg)120110120
DBP (mmHg)706070
LV EDD (mm)403838
LVMI (g/m2)457468
EDVI (mL/m2)494245
LV EF (%)616563
LAVI (mL/m2)203056
PASP (mmHg)233036
TAPSE (mm)272119
AF, Atrial Fibrillation. BSA, Body Surface Area. DBP, Diastolic Blood Pressure. EDVI, End Diastolic Volume Indexed. LAVI, Left Atrium Volume Indexed. LV EDD, Left Ventricular End Diastolic Diameter. LV EF, Left Ventricular Ejection Fraction. LVMI, Left Ventricular Mass Indexed. PASP, Pulmonary Artery Systolic Pressure. SBP, Systolic Blood Pressure. SR, Sinus Rhythm. TAPSE, Tricuspid Annular Plane Systolic Excursion.
Disclaimer/Publisher’s Note: The statements, opinions and data contained in all publications are solely those of the individual author(s) and contributor(s) and not of MDPI and/or the editor(s). MDPI and/or the editor(s) disclaim responsibility for any injury to people or property resulting from any ideas, methods, instructions or products referred to in the content.