Article

Stability Analysis of Surface Facilities in Underground Mining and the Cumulative Impact of Adjacent Mining Activities

Information Institute of the Ministry of Emergency Management, Beijing 100029, China
*
Author to whom correspondence should be addressed.
Appl. Sci. 2025, 15(23), 12424; https://doi.org/10.3390/app152312424 (registering DOI)
Submission received: 25 September 2025 / Revised: 19 November 2025 / Accepted: 19 November 2025 / Published: 23 November 2025
(This article belongs to the Special Issue Rock Mechanics and Mining Engineering)

Abstract

Underground mining often causes surface displacement and deformation above and around mined-out areas, and mining-induced subsidence has become a growing concern for ground stability worldwide. Given the proximity between the studied mine and a neighboring operation, potential mutual influences during extraction were examined to ensure the safety of surface structures. This study analyzes the stability of the overlying strata by combining theoretical prediction and numerical simulation, considering the cumulative effects of adjacent mining activities. The main findings are as follows: (1) The probability integration method was used to predict surface deformation and subsidence caused by underground mining, providing deformation data for the 4# shaft, 4# return air shaft, 5# return air shaft, and surrounding ground surface. (2) A three-dimensional geomechanical model was built using FLAC3D finite-difference software based on actual topographical and geological data to assess the impact of mining on overburden stability. Results show that the surrounding rock remained primarily in the elastic stage, with a maximum surface subsidence of 47.7 mm, confirming the structural stability of the 4# and 5# shafts. (3) Analyzing stress redistribution during deep ore extraction in both mining zones reveals that stress disturbances were mainly confined to the excavation areas, with a maximum local stress concentration of 83.34 MPa at stope corners. The combined mining activities resulted in an overall subsidence of approximately 48.7 mm, which decreased gradually outward from the center. This research presents an integrated theoretical and numerical framework that combines probability integration theory with FLAC3D simulation to assess the cumulative deformation and stress interactions of neighboring underground mines. The proposed method offers a practical and transferable tool for evaluating regional mine stability and surface deformation risks in multi-mine districts.

1. Introduction

The development of mineral resources, as an essential support for the modern industrial system, not only promotes social and economic growth but also brings complex geological environmental issues. Underground mining activities disrupt the original stress balance of rock masses, triggering movement of the overlying strata and surface deformation (subsidence), which, in severe cases, may lead to the destruction of surface buildings and damage to infrastructure [1,2,3,4]. Especially when adjacent mining activities occur in the mining area, the overlapping spatial and temporal effects of multiple mining sources will further exacerbate the accumulation of rock mass damage, threatening the safety of surface facilities. Therefore, analyzing the impact of underground mining on the overlying strata is crucial to ensure the safe operation of underground mines.
In terms of the surface deformation induced by mining, the current research methods [5,6] for overlying strata subsidence mainly include three categories: theoretical studies, numerical simulations, and field observations. In terms of theoretical research, scholars both domestically and internationally have developed empirical prediction formulas for key parameters, such as the layer movement angle and maximum subsidence, based on classical mechanical models, including the probability integration method [7,8], key layer theory, and elastic thin plate theory. Guo et al. [9] constructed a surface residual subsidence prediction model based on the spatial distribution and morphological characteristics of the mined-out area, using probability integration theory, providing decision-making support for the development of surface resources in abandoned mined-out areas. Guo et al. [10] systematically analyzed the transmission process of overburden rock destruction under high-intensity mining and proposed a calculation model for the overburden destruction height based on the stability of the key layer. Ding et al. [11] conducted a study on the surface movement patterns, deformation mechanisms, and trend predictions for shallow mining at Jing’erquan, combining engineering practice and theoretical analysis. They validated the applicability of the random medium theory under complex geological conditions. Huang [12] established a mechanical model for the subsidence of overlying strata in the mining area using the Navier method and studied the effects of factors such as the aspect ratio of the mining area, mining depth, and rock elastic modulus on the maximum subsidence. Zhang [13], based on elastic thin plate theory and combining random medium theory, established a surface subsidence prediction model.
With the advancement of numerical computing technology, geotechnical engineering software such as FLAC3D and UDEC, by constructing real geological and mechanical models, can simulate the entire process of mining disturbance, including the development of fractures in the overlying rock, stress redistribution, and surface deformation (subsidence). Zhang et al. [14] used UDEC to simulate the mining of the −130 m horizontal ore body in the eastern area of Jinshandian Iron Mine and the −270 m roof caving project, analyzing the surface movement and deformation patterns caused by the two operations. Dong et al. [15] used 3DEC to analyze the effects of excavation stage, lateral pressure coefficient, and joint dip angle on rock layer movement and surface subsidence patterns during deep ore body caving method mining. Lv et al. [16] used polynomial fitting, gray model, time series AR model, and BP neural network model to predict the mining subsidence trend of Linglong Gold Mine in Shandong and verified the effectiveness of each model in predicting surface dynamic movement. Shi et al. [17], addressing surface deformation issues during coal seam mining, optimized the mining plan using numerical simulation and probability integration method to control deformation effectively. He et al. [18] used COMSOL Multiphysics software to establish a mined-out area morphology evolution and surface subsidence prediction model, studying the evolution law of mined-out area morphology distribution and surface subsidence after shallow ore body mining. Mohammadali Sepehri [19] established a full three-dimensional elastoplastic finite element (FE) model to predict the surface subsidence caused by underground mining activities at the Diavik Diamond Mine. Zhao et al. [20] used 3DMine and FLAC3D to establish a three-dimensional numerical model for the Hongling lead–zinc mine, analyzing the underground mining process and the mechanism of surface subsidence in the mining area. Li et al. [21] adopted the FLAC3D to study the surface subsidence of the Pulang Copper Mine and then predicted the development trends of the crack. The literature review of subsidence prediction methods has expanded in recent years, with modern studies emphasizing multi-factor and multi-source modeling frameworks. Recent findings indicate that subsidence behavior may be strongly affected by hydro-geological processes such as groundwater withdrawal and loose-layer compression [22]. In large metal-mine districts, horizontal displacement differences and structural interface movement have also been shown to dominate crack development and surface deformation [21]. Moreover, investigations under super-thick and weakly cemented overburden demonstrate that subsidence basin development is highly dependent on mining depth and geological conditions, requiring prediction models beyond traditional empirical criteria [23]. Similarly, recent studies [18] presented refined numerical simulations validated by field observations.
To monitor the dynamic surface deformation caused by underground mining, many scholars have used various monitoring technologies for surface deformation analysis. Xia et al. [24] used ultra-deep borehole extensometers to monitor the deformation of deep rock masses in the eastern area of Jinshandian Iron Mine and combined GPS, horizontal monitoring technology, and three-dimensional laser scanning system (Leica HDS 880) surface deformation monitoring results to study the surface movement mechanism of deep rock masses caused by underground mining. The study revealed that the main deformation of the overburden develops gradually from the lower part to the upper part. Chrzanowsk [25] used GPS to monitor surface subsidence caused by underground mining in a mining area in Canada and established a surface subsidence prediction model for salt rock mining. Finnie [26] used electronic sensors for deformation monitoring, observing the movement of overlying rock layers and surface deformation during ore body mining.
Most previous investigations have examined subsidence from a single underground operation. In contrast, this study establishes a combined theoretical and numerical framework for analyzing adjacent mine coupling, enabling the quantitative evaluation of overlapping stress fields and cumulative surface deformation between neighboring mines. This study takes a typical metal mine as the engineering background and employs a combination of theoretical calculations and three-dimensional numerical simulation methods. The main tasks are as follows: use the probability integration method to predict the movement and deformation of the 4# shaft, 4# return air shaft, 5# return air shaft, and surrounding surface in the mining area; use FLAC finite difference software to reveal the failure patterns of overburden and surface building settlement characteristics in both individual and adjacent mining areas. Ultimately, this research supports the analysis of surface subsidence patterns and the stability of surface structures during underground mining.

2. Introduction to the Mine

2.1. Overview of the Mining Area and Mining Methods

Mine A is located in the hilly region of southwestern China, where the strata are mainly composed of carbonate and siliceous sedimentary rocks. The ore belt strikes northwest, and faults are well developed within the mining area. The dominant faults strike northwest, dipping northeast at an angle of 20–30°. The surrounding rocks are primarily composed of limestone and other siliceous formations. Several underground metal mines are distributed nearby. Mine B, located south of Mine A, lies at a similar mining depth and under comparable geological conditions, forming a typical adjacent-mining scenario, which makes it an ideal case for this study.
Mine A employs the filling mining method, which includes the low-segment filling method, post-mining backfilling after stope excavation, and the upward horizontal layered filling method. Mining follows a three-step sequence involving ore rooms, pillars, and inter-area pillars. The ore body is divided into seven mining areas, each approximately 90–100 m wide, separated by 20-m inter-area pillars oriented along the north–south exploration line. Within each mining area, the ore rooms and pillars are arranged along the ore-body strike, with widths of 15–25 m, lengths of 80–100 m, and heights of 12–50 m.
The spatial relationship between Mine A and Mine B, as well as the layout of mining areas and monitoring stations, is illustrated in Figure 1, where a scale bar (0–500 m) and north arrow are included for reference.

2.2. Physical and Mechanical Parameters of Rock Mass

2.2.1. Physical and Mechanical Parameters of Rock

The surrounding rocks of the ore bodies 94, 95, 96, and the branch are mudstone, calcareous mudstone, and shale. The ore body is mainly hosted in siliceous rocks, with local layers of mudstone and shale interspersed within the ore body. Table 1 presents the physical and mechanical parameters of the ore body and rock samples in the mining area. The uniaxial compressive strength of the ore samples is highest at 129.55 MPa, with a tensile strength of 12.09 MPa. The uniaxial compressive strength of deep siliceous rocks is relatively low at 84.11 MPa, with a tensile strength of 6.42 MPa. The tensile strength of wide-band limestone is the weakest at 3.47 MPa. The uniaxial compressive strength of the ore body and rock is generally high, while the tensile strength varies significantly with lithology, ranging from 3.47 MPa to 12.09 MPa.
The overall uniaxial compressive strength and elastic modulus of the small-lentil limestone, wide-band limestone, and ore specimens in the mining area are relatively high, with the average compressive strength exceeding 120 MPa, and a significant positive correlation between the data. The average tensile strength of the specimens exceeds 8 MPa; however, there is a noticeable variation in tensile strength with changes in lithology. The strength difference in siliceous rocks between deep and shallow areas is significant, with a greater influence of burial depth. The deep rock masses are more fractured and have poorer integrity. The uniaxial compressive strength of shallow siliceous rock is 124.28 MPa, and the tensile strength is 8.31 MPa. The uniaxial compressive strength of deep rock samples is 84.11 MPa, representing a 32.3% decrease compared to that of shallow rocks. The tensile strength is 6.42 MPa, a 22.7% decrease compared to shallow rocks.

2.2.2. Engineering Rock Mass Parameters

Based on the physical and mechanical properties obtained from laboratory tests, a comprehensive analysis of the rock mass mechanical parameters for the mining area was conducted using the rock mass mechanical reduction analysis method, along with rock mass parameters from surrounding mining areas and field conditions. The recommended values for the strength parameters of the major host rock masses were obtained, as shown in Table 2.

3. Theoretical Analysis of the Impact of Underground Mining on Surface

In underground mining, ore body extraction causes surface subsidence and deformation due to the formation of voids after mining, which leads to bending and sinking of the surrounding rock and overlying strata as they lose support. When the mining influence reaches the surface, it forms a subsidence zone. The surface movement (subsidence, horizontal displacement) and deformation (inclination, curvature, horizontal deformation) in the subsidence zone induce movement and deformation of buildings, eventually leading to disasters. Extensive research has been conducted by scholars both domestically and internationally on surface subsidence caused by mining. Various methods have been proposed to predict the magnitude and extent of surface subsidence, including empirical formulas, theoretical models, influence function methods, and profile function methods [7,8].

3.1. Prediction Methods for Surface Movement and Deformation Induced by Ore Body Extraction

3.1.1. Subsidence Expression for Points on the Surface

In the two-dimensional case, the expression for the surface subsidence basin induced by mining is:
W x ( x , z ) = 1 r e π x 2 r 2 = p ( x , z )
where r is the main influence radius.
From the independence of probabilities, the probability of subsidence should be the product of the probabilities of different directions. That is, the expression for the surface subsidence basin induced by the extraction of a 1 × 1 × 1 unit is:
W e ( x , y , z ) = 1 r 2 e π ( x 2 + y ) 2 r 2
Assuming that the rock mass is extracted at a depth of H, with a volume of d s × d t × d m , the surface subsidence induced by mining is:
d W = 1 r 2 e π r 2 x s 2 + y t 2 d s d t d m
Assuming the maximum surface subsidence is W0, then we have:
W ( x , y ) = W 0 s 0 s 0 t 0 t 0 1 r 2 e π r 2 x s 2 + y t 2 d s d t d m = 1 W 0 W 0 ( x ) W 0 ( y )
where W0 is the maximum subsidence value; W 0 ( x ) is the maximum subsidence value along the strike of the main fault plane; W 0 ( y ) is the maximum subsidence value along the dip of the main fault plane.

3.1.2. Inclination Expression for Points on the Surface

There is a point A on the plane with coordinates (x, y), and the inclination in any direction is:
i ( x , y ) ϕ = d W ( x , y ) d ϕ = W ( x , y ) x cos ϕ + W ( x , y ) y sin ϕ = 1 W 0 i 0 ( x ) W 0 ( y ) cos ϕ + i 0 ( y ) W 0 ( x ) sin ϕ
where i 0 ( x ) is the maximum inclination along the strike; i 0 ( y ) is the maximum inclination along the dip.

3.1.3. Curvature Expression for Points on the Surface

The curvature K(x, y, φ) of point A(x, y) along the direction is the derivative of the inclination i(x, y) in the direction, then we have:
K ( x , y ) ϕ = i ( x , y ) ϕ x cos ϕ + i ( x , y ) ϕ y sin ϕ
According to the inclination formula, Equation (6) can be simplified as:
K ( x , y ) ϕ = 1 W 0 K 0 ( x ) W 0 ( y ) cos 2 ϕ + K 0 ( y ) W 0 ( x ) sin 2 ϕ + i 0 ( x ) i 0 ( y ) sin 2 ϕ
where K 0 ( x ) is the maximum curvature along the strike; K 0 ( y ) is the maximum curvature along the dip.

3.1.4. Horizontal Displacement Expression for Points on the Surface

Horizontal displacement is proportional to inclination, hence the following equation:
U ( x , y ) ϕ i ( x , y ) = b r
The horizontal displacement formula is:
U ( x , y ) ϕ = 1 W 0 U 0 ( x ) W 0 ( y ) cos ϕ + U 0 ( y ) W 0 ( x ) sin ϕ
where U 0 ( x ) is the maximum horizontal displacement along the strike; U 0 ( y ) is the maximum horizontal displacement along the dip.

3.1.5. Horizontal Deformation Expression for Points on the Surface

ε ( x , y ) ϕ = U ( x , y ) ϕ x cos ϕ + U ( x , y ) ϕ y sin ϕ
Therefore, the horizontal deformation is:
ε ( x , y ) ϕ = 1 W 0 ε 0 ( x ) W 0 ( y ) cos 2 ϕ + ε 0 ( y ) W 0 ( x ) sin 2 ϕ + U 0 ( x ) i 0 ( y ) + U 0 ( y ) i 0 ( x ) sin ϕ cos ϕ
where ε 0 ( x ) is the maximum horizontal deformation along the strike; ε 0 ( y ) is the maximum horizontal deformation along the dip.

3.2. Analysis of Surface Movement and Deformation Induced by Ore Body Extraction

In this study, the 4# Shaft, 4# return air shaft, and 5# return air shaft within the mining area were selected as research objects (the mining area plan is shown in Figure 1), and the impact of underground mining on surface buildings was analyzed. The 4# Shaft is affected by the 96# main vein ore body, the 5# return air shaft is affected by the 94# main vein ore body, and the 4# return air shaft is affected by the 95# main vein ore body. The influence of different ore body extractions on surface buildings was considered separately in the surface subsidence calculation, assuming that all ore bodies are thoroughly mined and the voids are filled. Table 3 shows the scale, dimensions, and distance from surface buildings for the major ore bodies in the mining area.
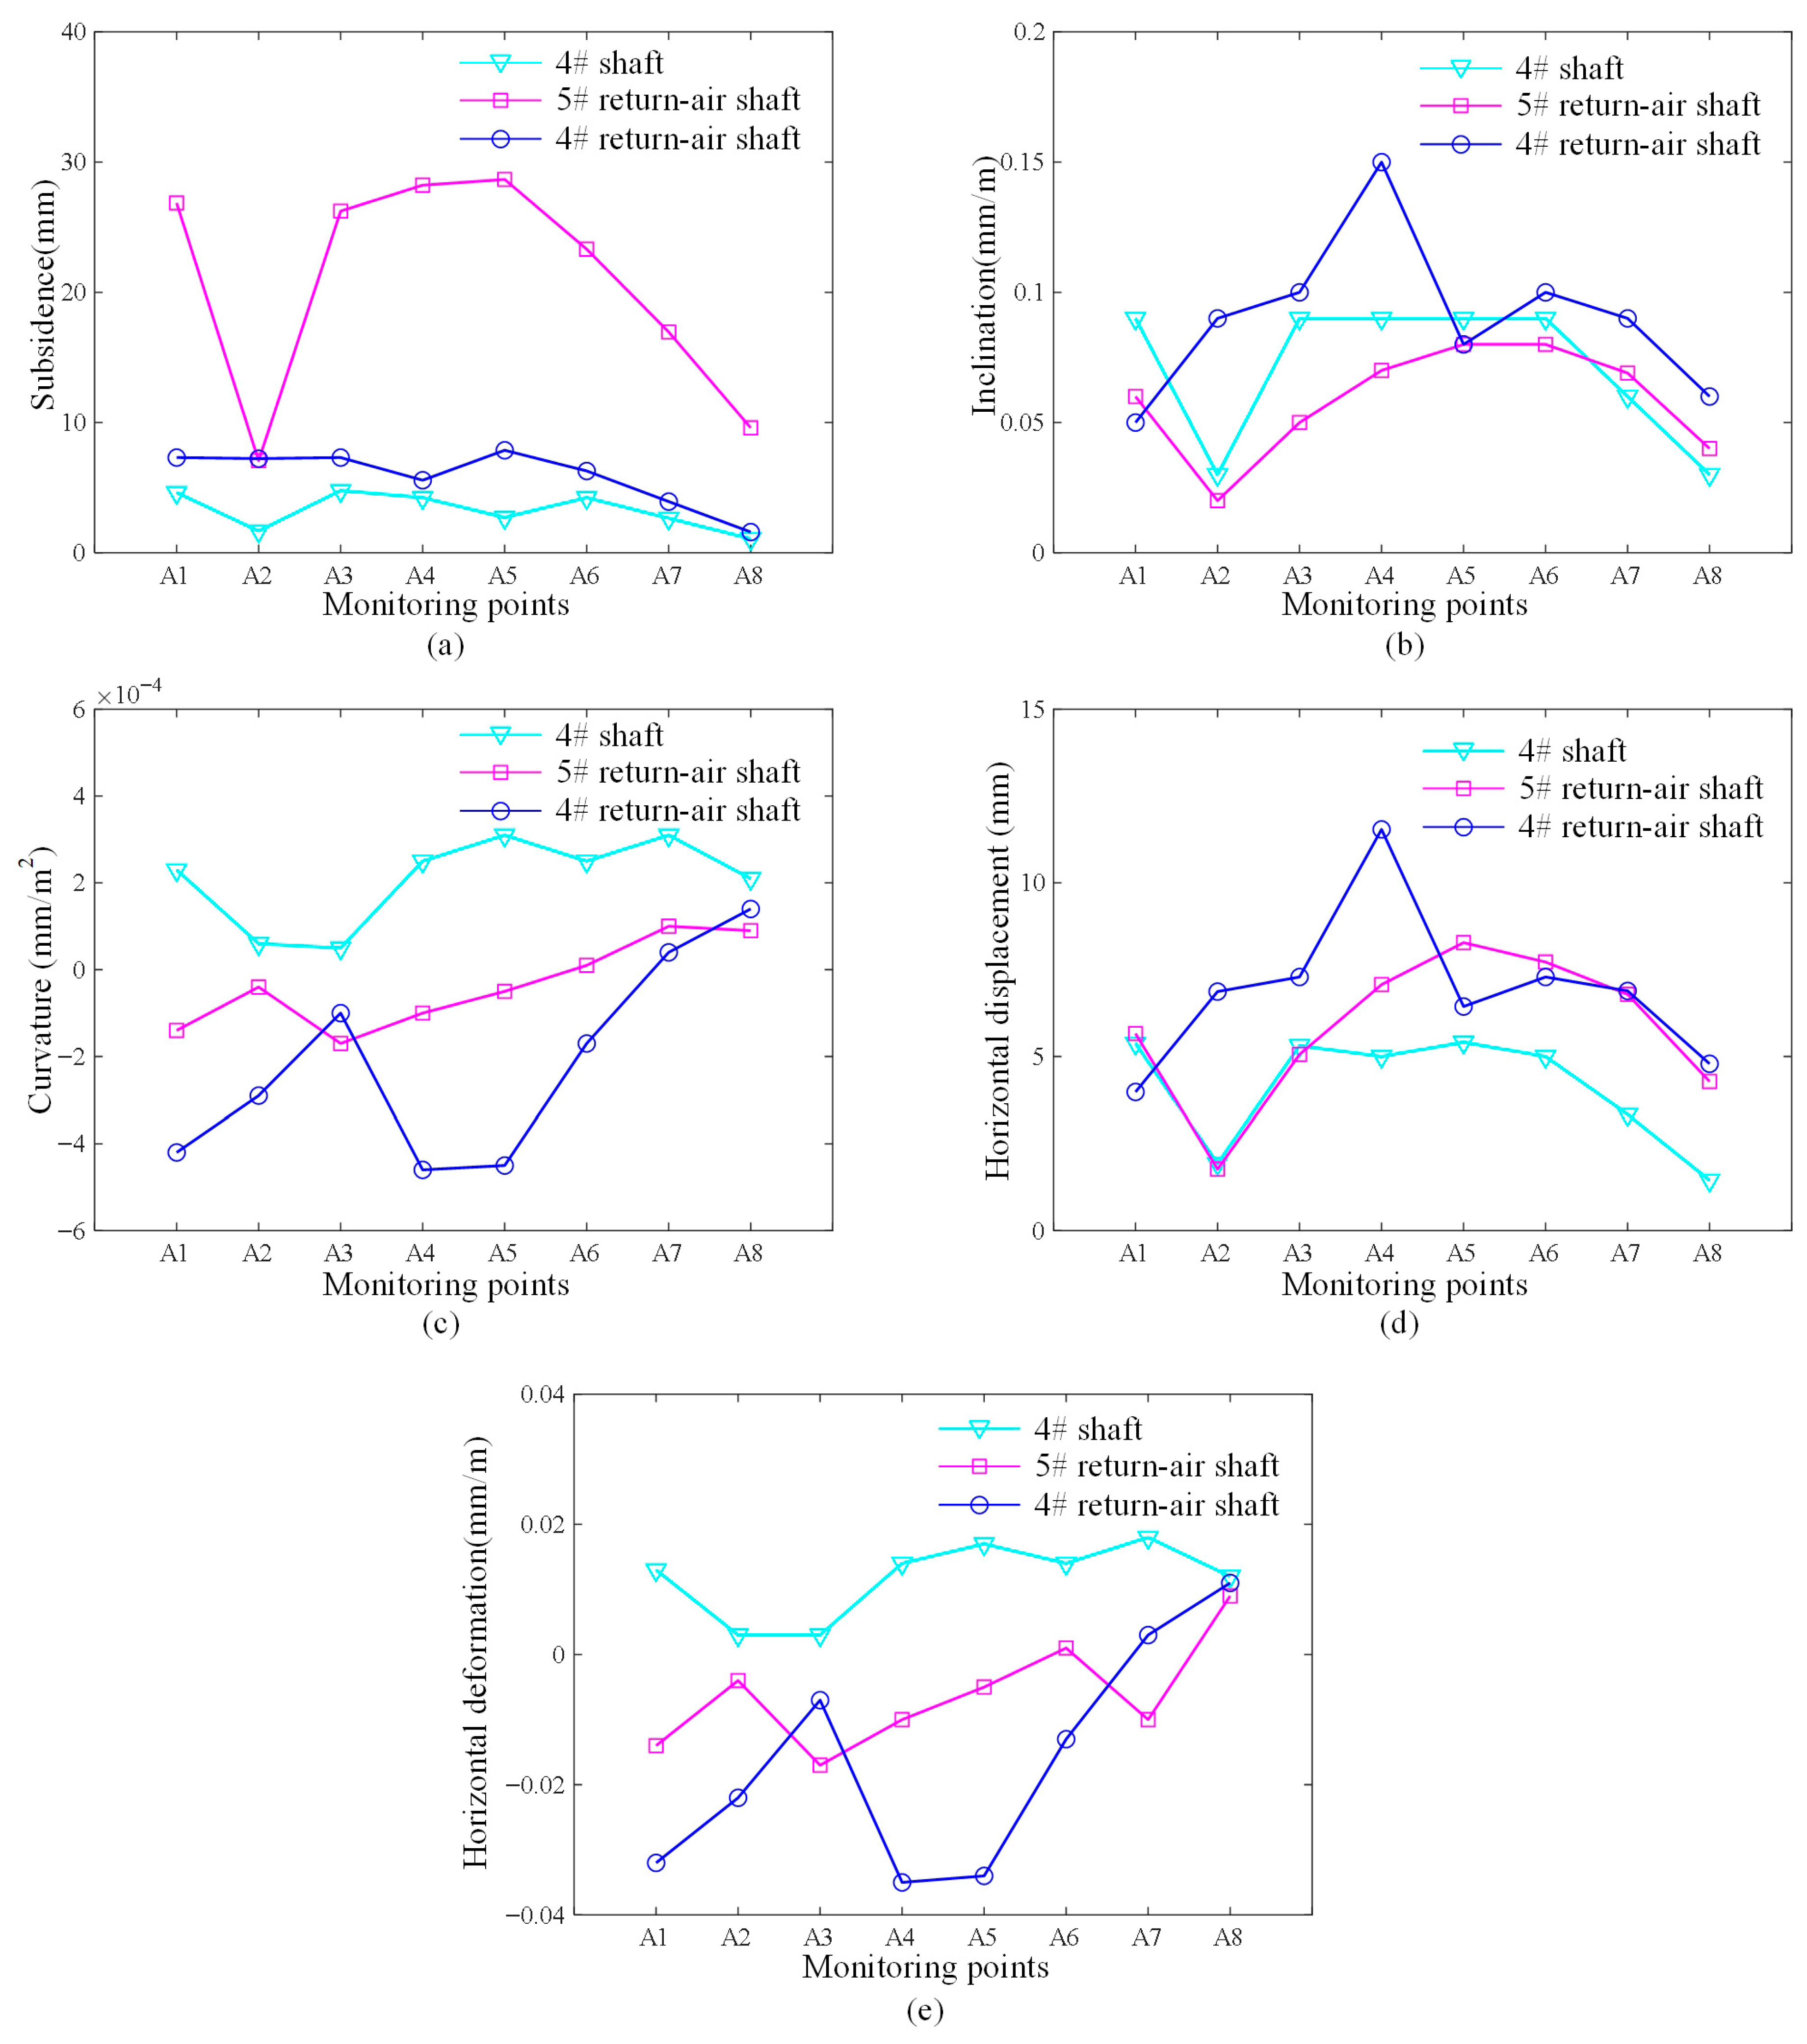
Based on the ore body extraction surface movement and deformation prediction methods, the impact of different ore bodies on surface movement and deformation was calculated. The movement and deformation results for the 4# Shaft, 5# return air shaft, 4# return air shaft, and surface building monitoring points were obtained. Additionally, the movement and deformation values for surface monitoring points at 50 m intervals along the ore body strike range (i.e., A1 to A8 points) were calculated and analyzed (the monitoring points for 4# return air shaft are shown in Figure 2).
Based on the probability integration theory method, and using the surface movement and deformation prediction method for gently inclined ore body extraction, the movement and deformation results for the 4# Shaft, 4# return air shaft, 5# return air shaft, and monitoring points within the ore body strike range were obtained, as shown in Table 4.
The maximum inclination value i = 0.15 mm/m is much smaller than the standard allowable inclination value i = 3 mm/m. Additionally, the maximum horizontal deformation ε = −0.035 mm/m and curvature K = 0.31 × 10⁻³ mm/m are both less than the maximum allowable curvature value K = 0.2 mm/m and horizontal deformation ε = 2 mm/m specified in the standards. A comprehensive analysis of the surface displacement results indicates that underground mining has a minimal impact on the 4# Shaft, 5# return air shaft, and 4# return air shaft.
Figure 3a shows the impact of different ore body extractions on surface monitoring point subsidence. The subsidence at monitoring points around the 4# Shaft ranges from 1.07 mm to 4.77 mm. The surface subsidence at monitoring points around the 5# vertical shaft is smallest at 7.07 mm, with a maximum of 28.67 mm. Although the scale of the 96# ore body corresponding to the 4# Shaft is relatively large, it is far from the 4# Shaft, so its impact on the surface subsidence at the 4# Shaft site is limited, resulting in relatively small surface subsidence.
Figure 3b shows the calculation results of surface monitoring point inclination under the influence of different ore body extractions. The inclination at all vertical shafts is relatively small under the influence of ore body extraction. The maximum inclination value is found at monitoring point A4 in the 4# return air shaft, with a value of 0.15 mm/m. The inclination values of other monitoring points are all less than 0.1 mm/m.
Figure 3c shows the curvature calculation results of different monitoring points. The curvature fluctuations at various monitoring points are not large, with a variation range from −0.00046 mm/m2 to 0.00031 mm/m2. The subsidence curve at surface monitoring points around the 4# Shaft is predominantly convex, while the subsidence curve at surface monitoring points around the 4# return air shaft is predominantly concave.
Figure 3d shows the horizontal displacement data for different monitoring points. Horizontal displacement is proportional to inclination, and its variation trend is generally consistent with the inclination trend of the monitoring points. The range of horizontal displacement is from 1.45 mm to 11.54 mm.
Figure 3e shows the magnitude of horizontal deformation at different monitoring points. Horizontal deformation at monitoring points around different shafts varies between −0.035 mm/m and 0.018 mm/m. The horizontal deformation at monitoring points around the 4# Shaft is positive, indicating tensile deformation. The monitoring points around the 5# return air shaft and 4# return air shaft mainly show compressive deformation, with only a few points exhibiting tensile deformation.

4. Numerical Simulation of the Impact of Underground Mining on Surface Facilities

This study utilizes the three-dimensional finite difference calculation software FLAC3D, developed by Itasca Consulting Group Inc. (Minneapolis, USA), for numerical simulations. FLAC3D employs an explicit algorithm to obtain the time-step solution of all motion equations in the model, enabling the tracking of progressive material failure and collapse, which is crucial for this study. Furthermore, the program allows the input of various material types and enables changes to material parameters in specific regions during the calculation process, enhancing the program’s flexibility and greatly facilitating computational handling. The geological engineering objects in this study are primarily igneous and metamorphic rocks, which are elastoplastic materials. Therefore, the Mohr-Coulomb yield criterion is used in the calculation.
f s = σ 1 σ 3 1 + sin φ 1 sin φ 2 c 1 + sin φ 1 sin φ
where σ 1 and σ 3 represent the maximum and minimum principal stresses, respectively. c and φ represent the material’s cohesion and friction angle, respectively. When f s > 0, the material will undergo shear failure. After the material reaches its yield limit, it undergoes plastic deformation at a constant stress level. In the tensile stress state, if the tensile stress exceeds the material’s tensile strength, the material will fail.

4.1. Simulation Model

Through 3Dmine-Midas GTS NX-FLAC3D coupled modeling, necessary simplifications were made based on the core issues. In selecting the boundary range for the calculation model, care was taken to avoid wasting computational time due to a range that was too large, while ensuring that the range was not too small to reflect the results accurately. By performing trial calculations on the model boundary range and analyzing the results until the boundary range showed no significant sensitivity, the appropriate boundary range was selected as the basis for model construction in this paper. The model was then used to analyze surface subsidence patterns by constructing initial rock stress, excavating the mining area, and backfilling it.
The computational model dimensions are 3025 m × 4626 m × 1592 m. To ensure numerical reliability and computational efficiency, we performed a mesh sensitivity and boundary independence assessment before the main simulation. The mining area and the surrounding rock were discretized with different mesh densities according to their distance from the excavation zone. Within the mining region, a refined mesh with a grid size of 8 m was used to capture detailed stress and deformation evolution. In contrast, the outer surrounding rock was modeled with coarser meshes (40–80 m) to improve calculation speed without compromising accuracy. The total model consisted of 1,228,538 elements and 213,784 nodes. The numerical model was built in FLAC3D to simulate the behavior of the strata during extraction. The base boundary was fixed in all directions, whereas lateral boundaries were restricted horizontally but allowed vertical movement. Rock mass parameters (Table 2) were obtained from surrounding mining areas and field conditions.
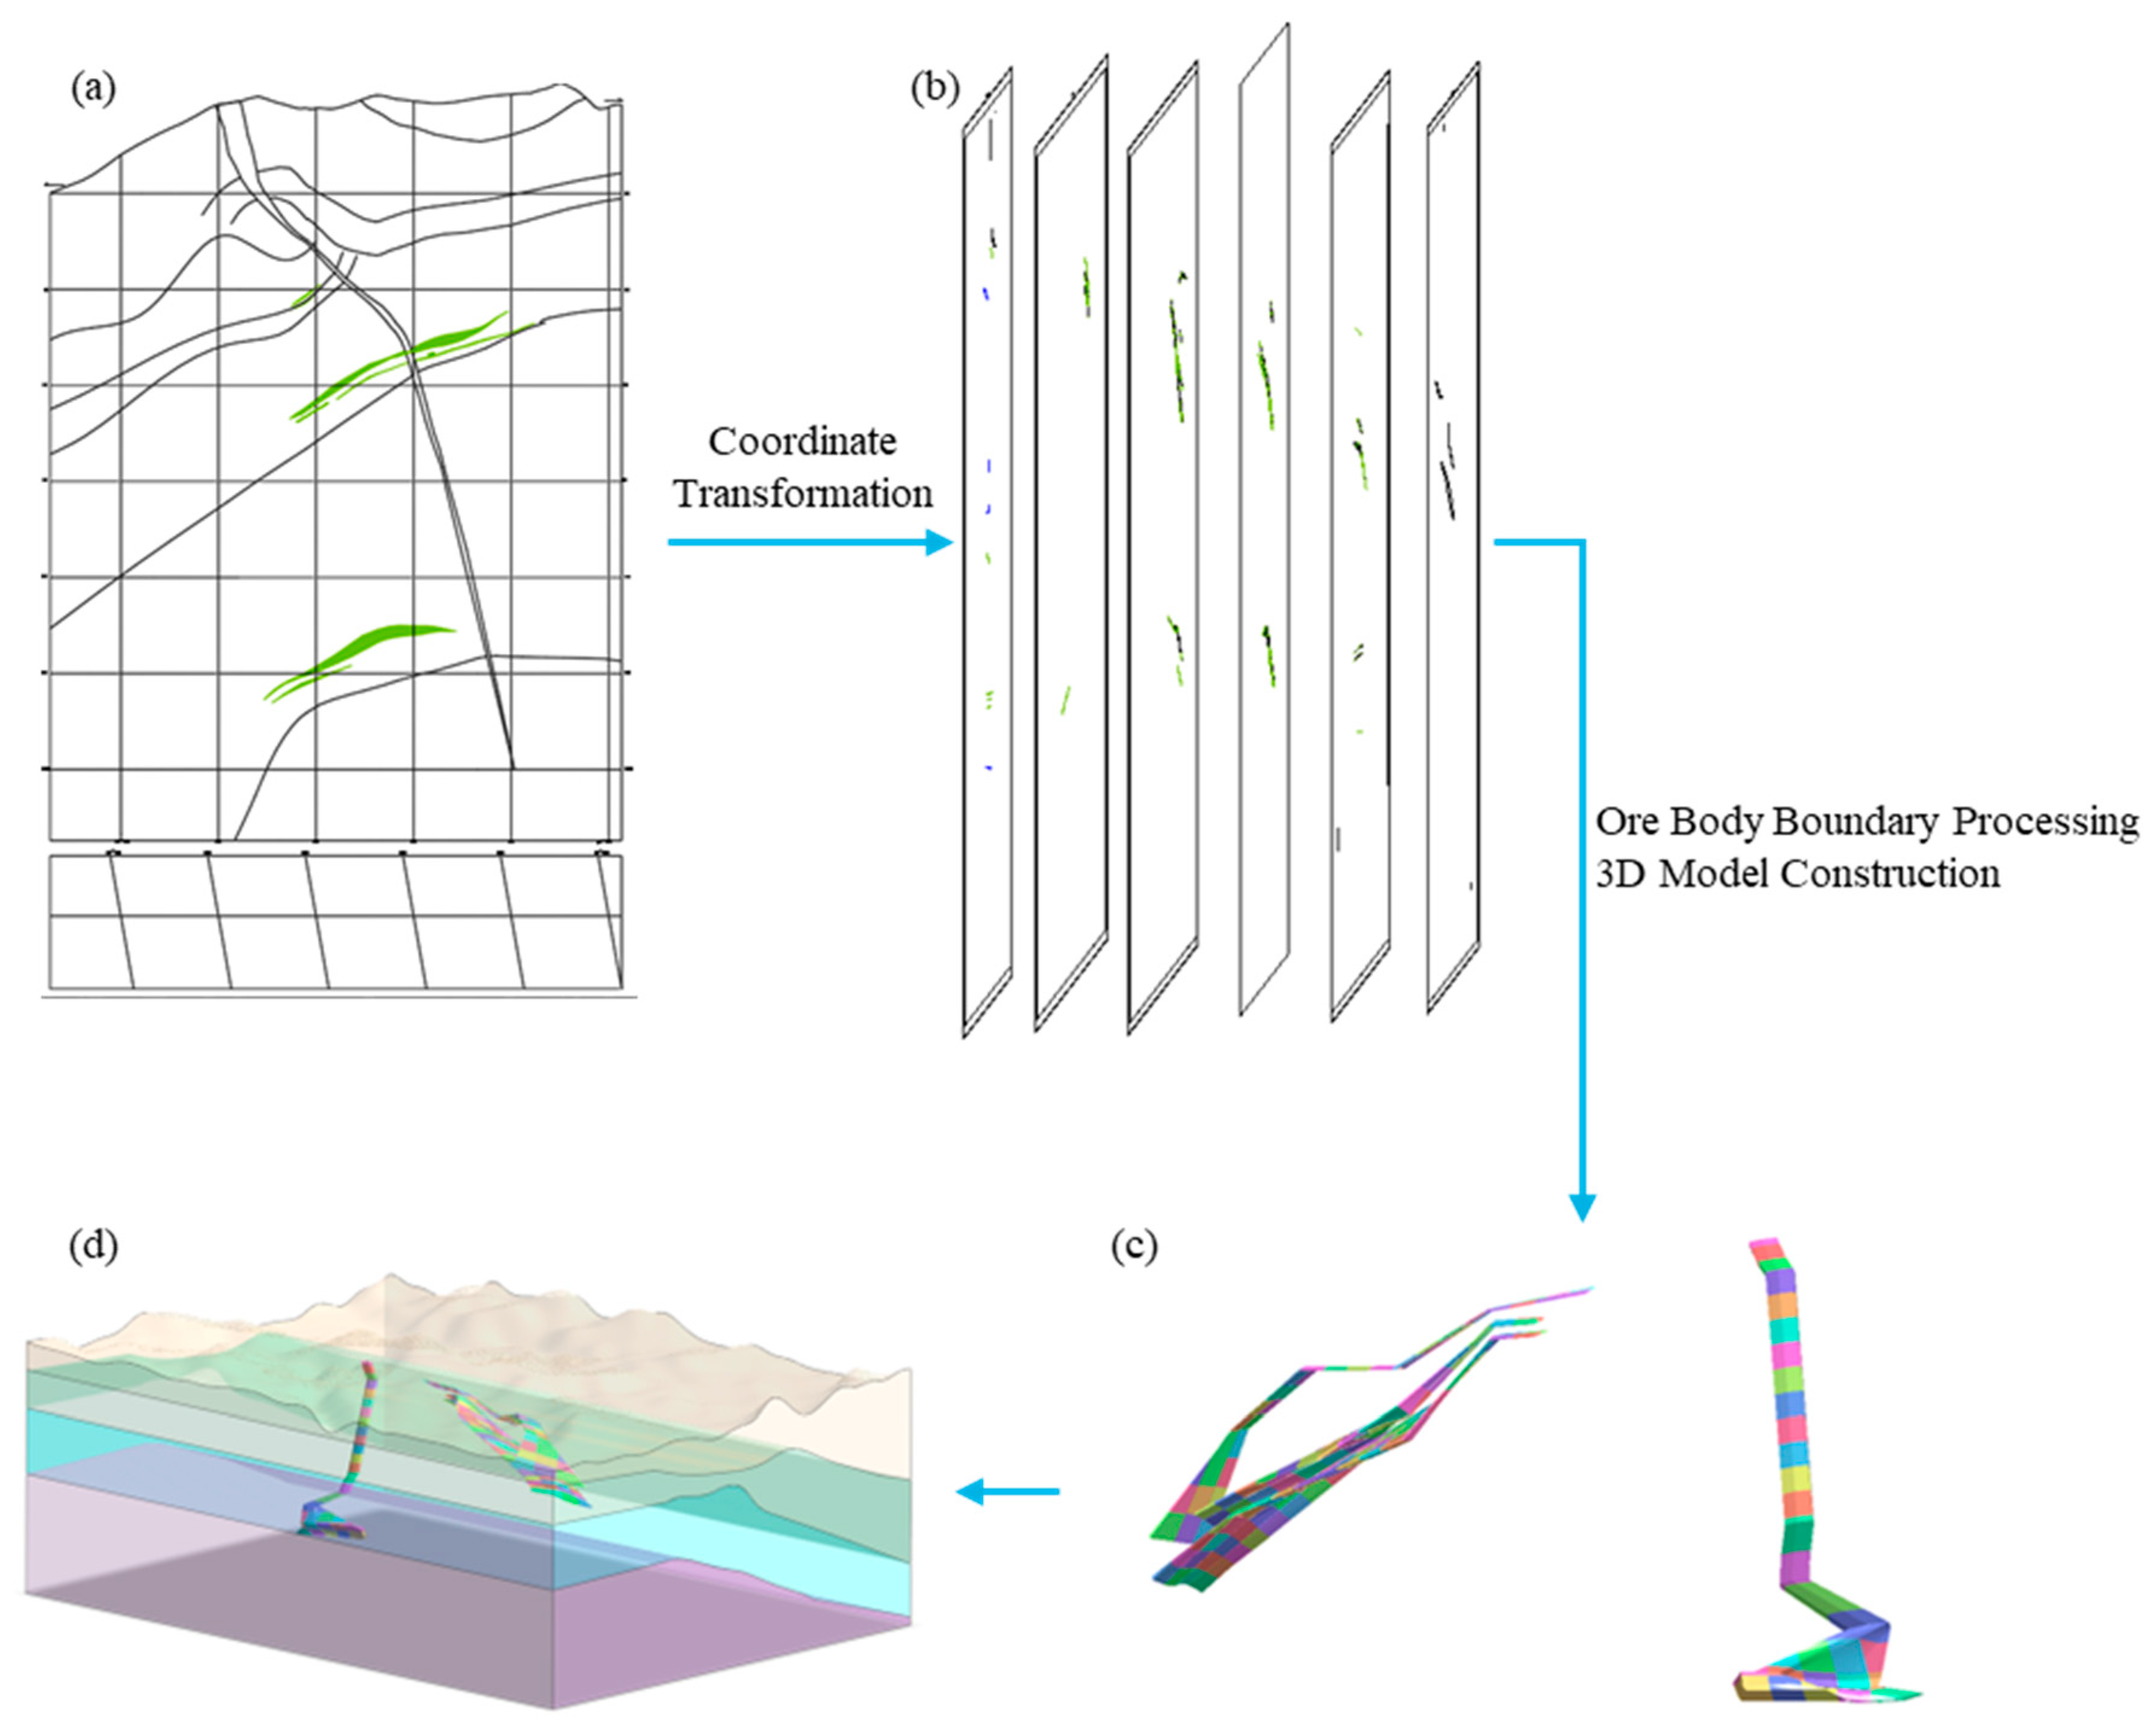
The process of establishing the three-dimensional engineering mechanical model is as follows: First, simplify the CAD profile map, remove redundant information, and extract the ore body and stratigraphic information. The processed result is shown in Figure 4a. The profile map file is imported into the MIDAS GTS NX software, and by adjusting the coordinate area and sample point count, a surface is generated (see Figure 4b). The ore body boundary lines are processed by removing any line segments other than the ore body boundary, resulting in a smooth, closed ore body boundary line for model construction. Subsequently, in 3DMine, the boundary lines of adjacent ore bodies are connected to form a three-dimensional ore body model, and open line segments at the ends are closed to obtain the preliminary ore body model (see Figure 4c), finally constructing the three-dimensional geological mechanical model (see Figure 4d).
First, the stress field under the initial stress environment of the original mined-out area is applied. Mining is then carried out within the mining area, and the voids are filled. The stability of the overlying surrounding rock and its impact on the surface are analyzed. Additionally, the mutual impact of the mining in adjacent mining areas on the surrounding rock stability of the mining face and surface buildings (or structures) is analyzed.

4.2. Excavation Method

In this simulation study, the ore body is extracted in a single excavation according to the volume of the mining chambers in the mining plan. The size of the single excavation ore body is 70 m * 50 m * ore body thickness. After excavation, paste filling is performed after one-third of the total iteration steps.

4.3. Analysis of the Impact of Underground Mining on Surface Deformation

Underground mining typically causes stress changes in the ground layers, affecting the overlying strata, including deformation, cracking, and surface subsidence. The stability of the overlying strata directly impacts the safety of the mine, as well as the integrity and safety of surface facilities.

4.3.1. Analysis of the Impact of Underground Mining on Surface

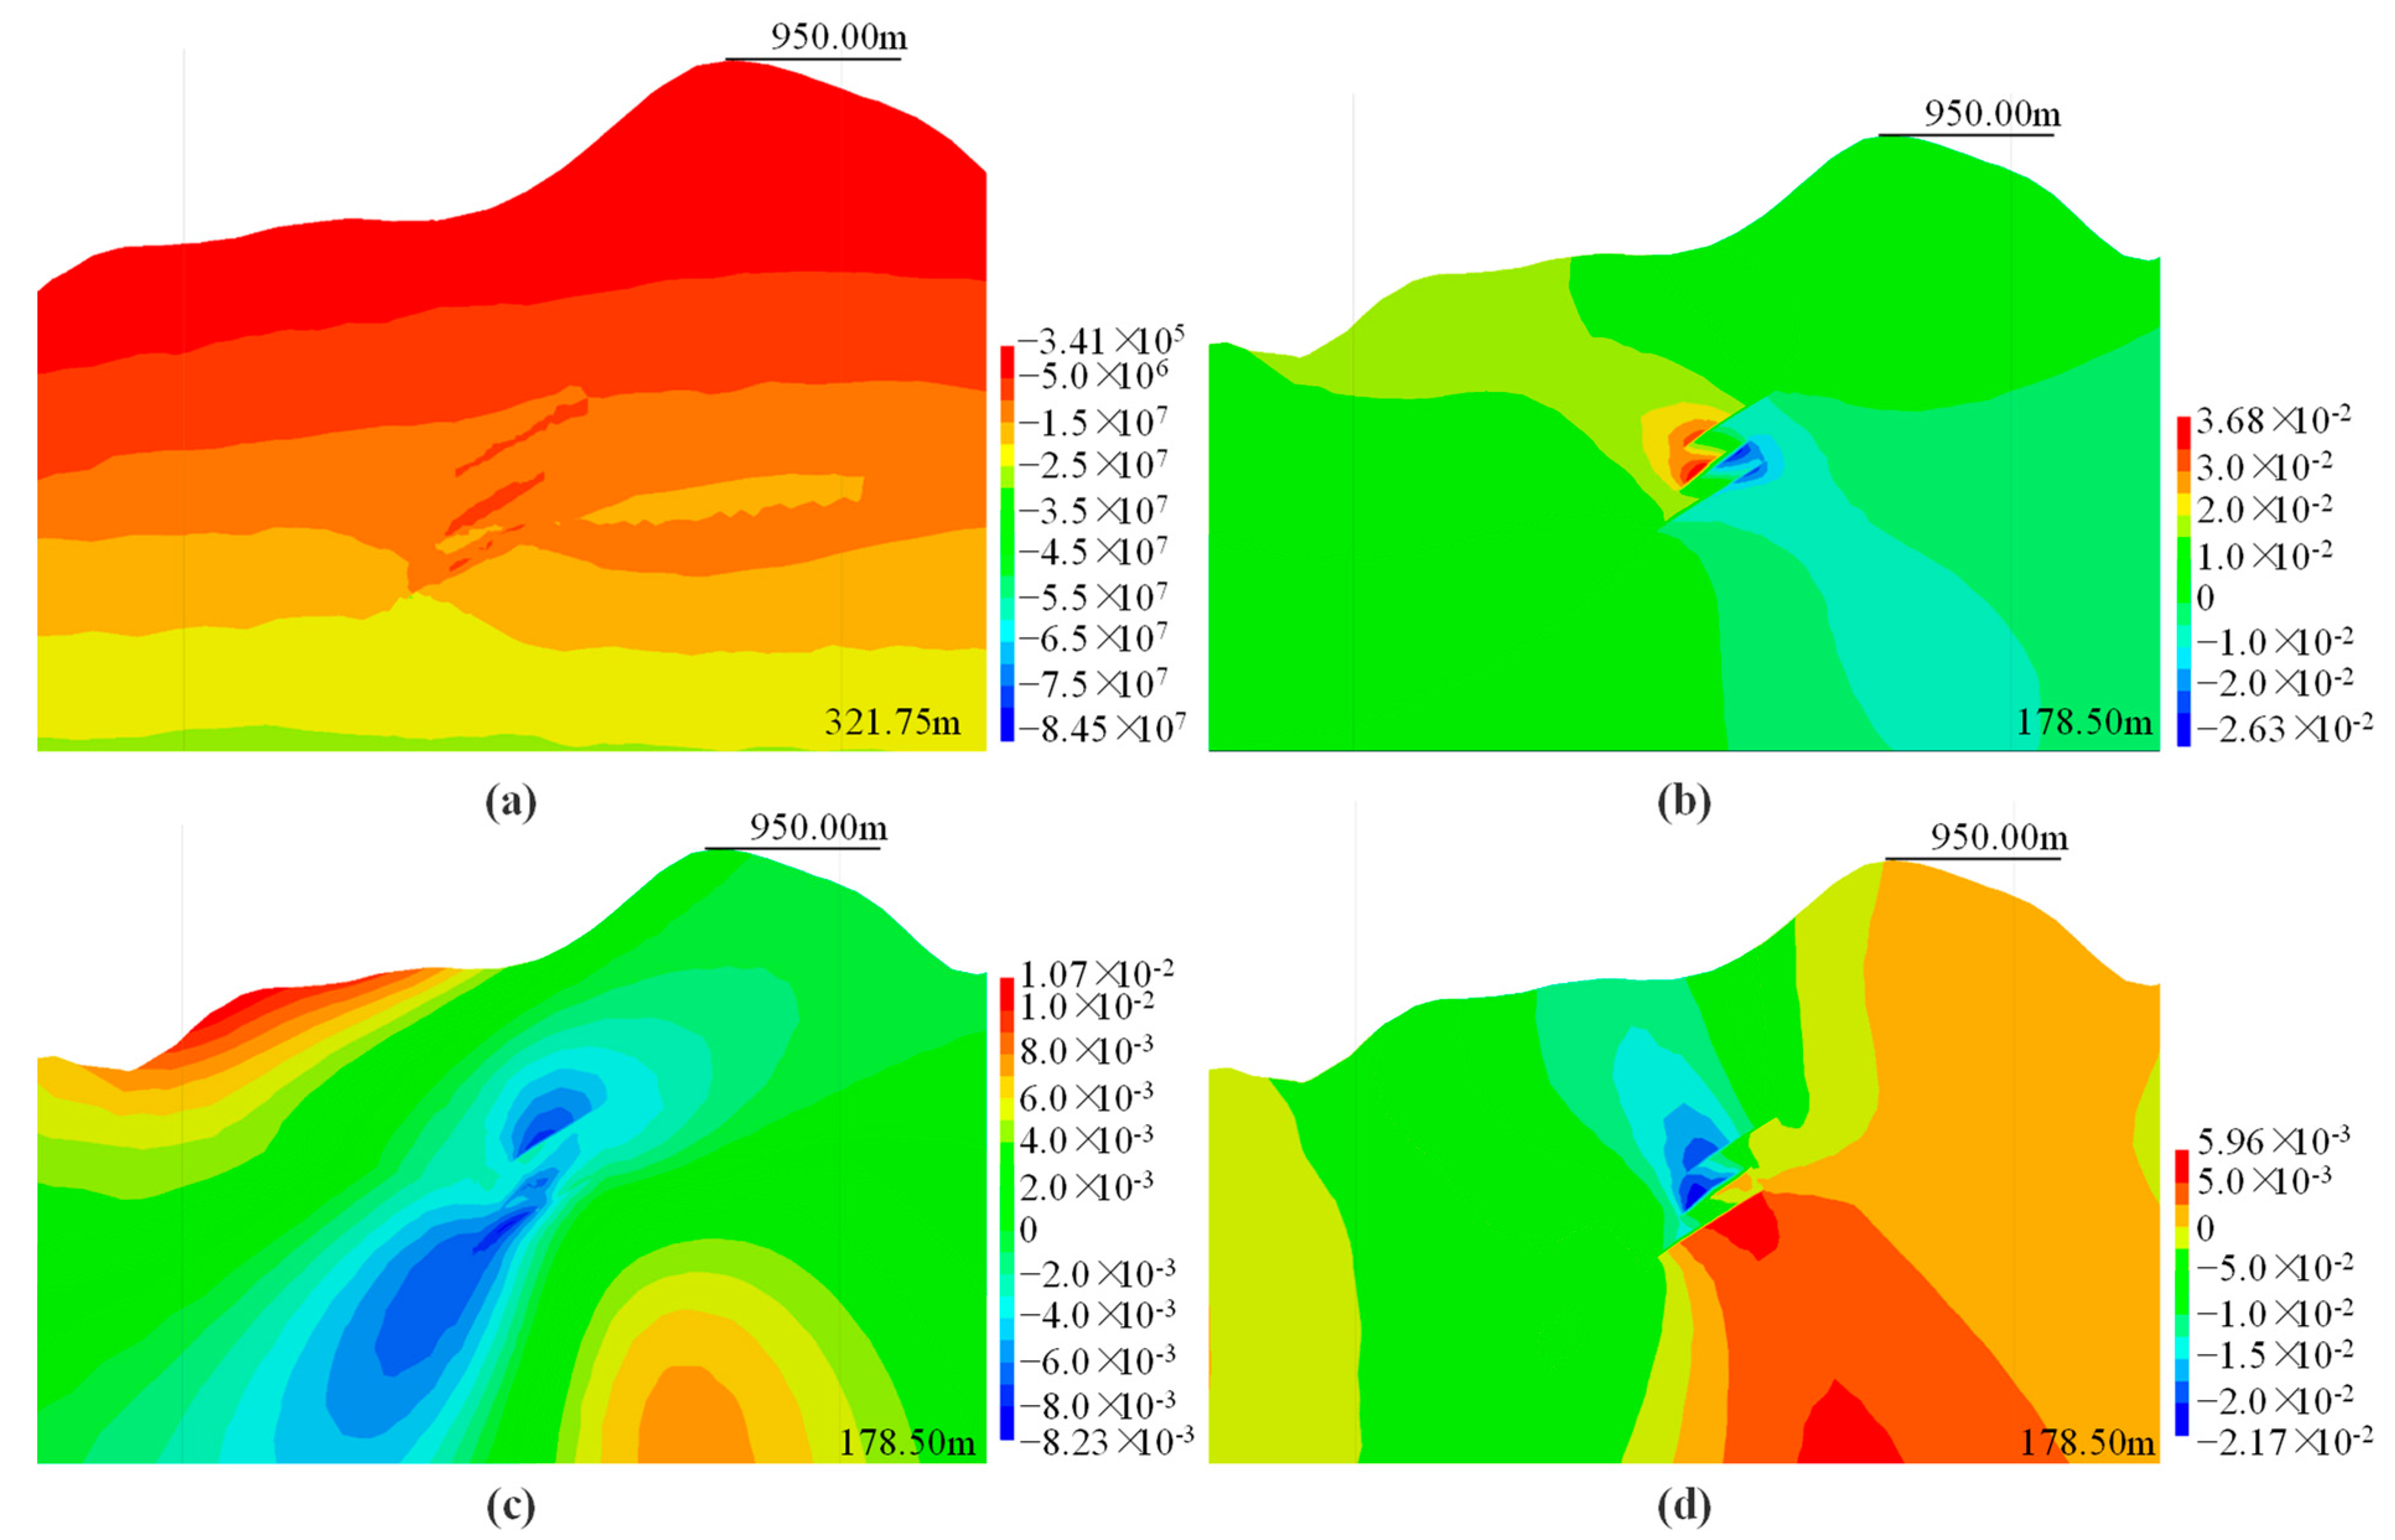
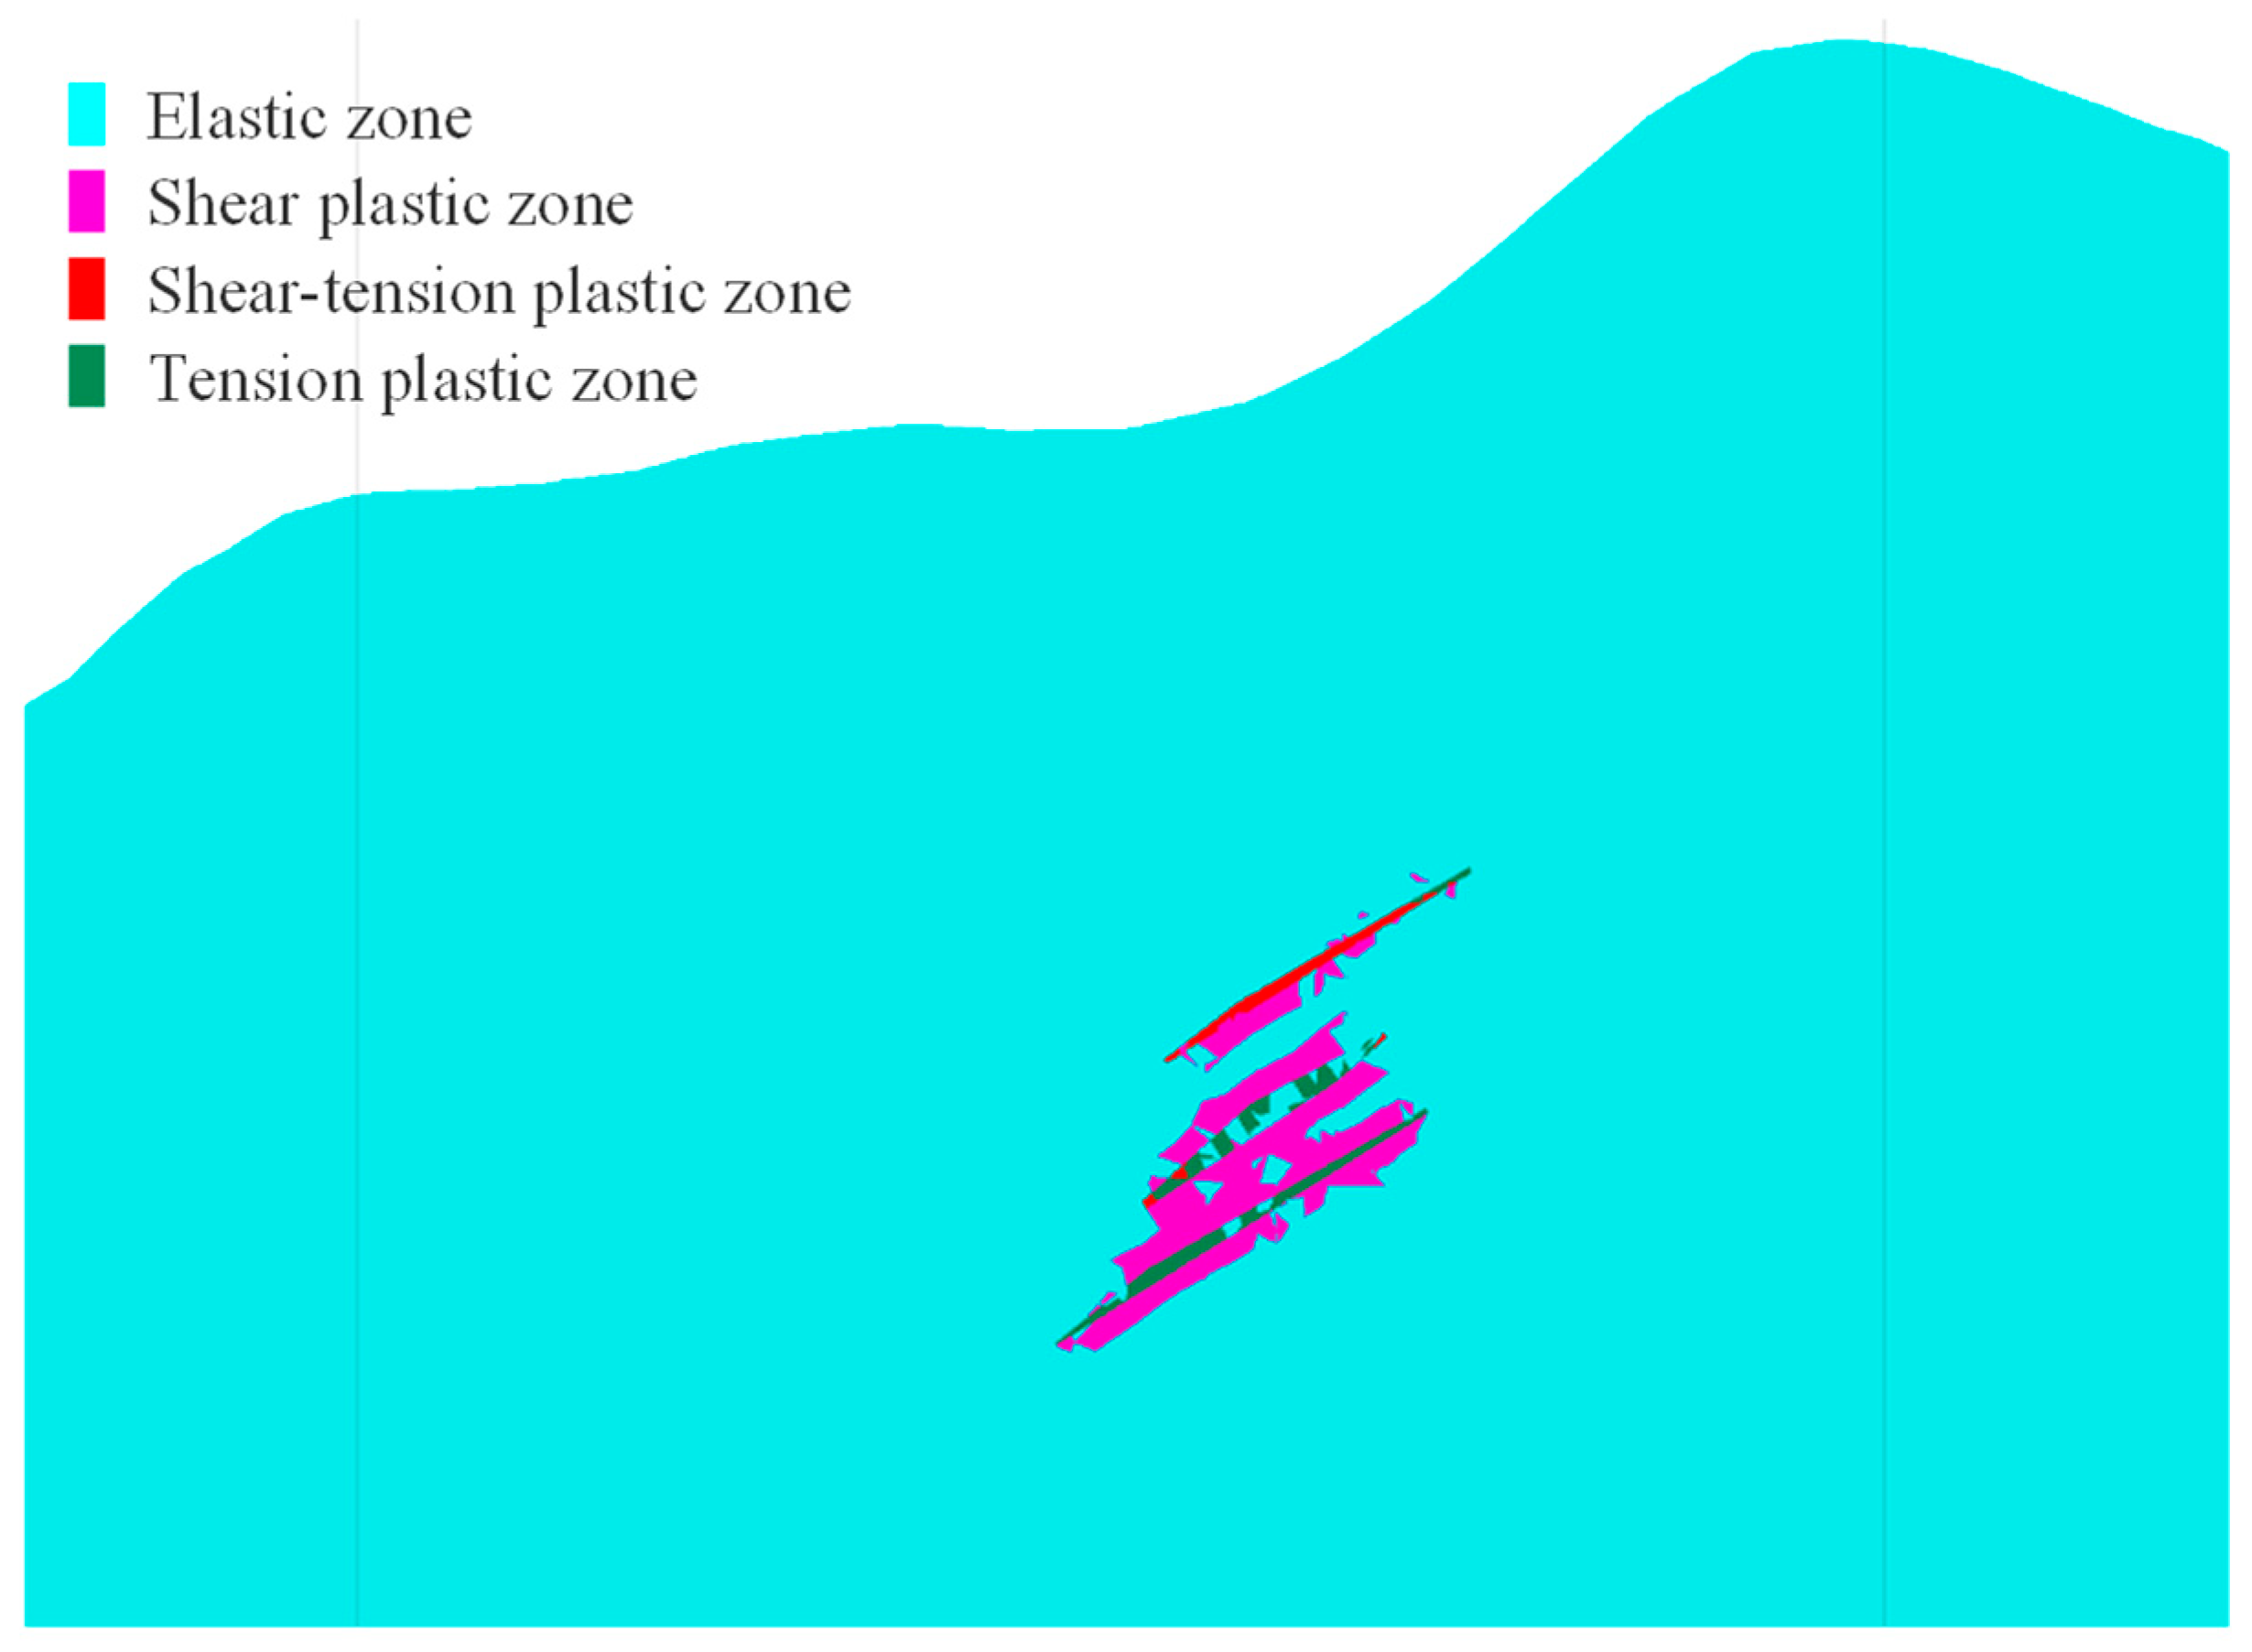
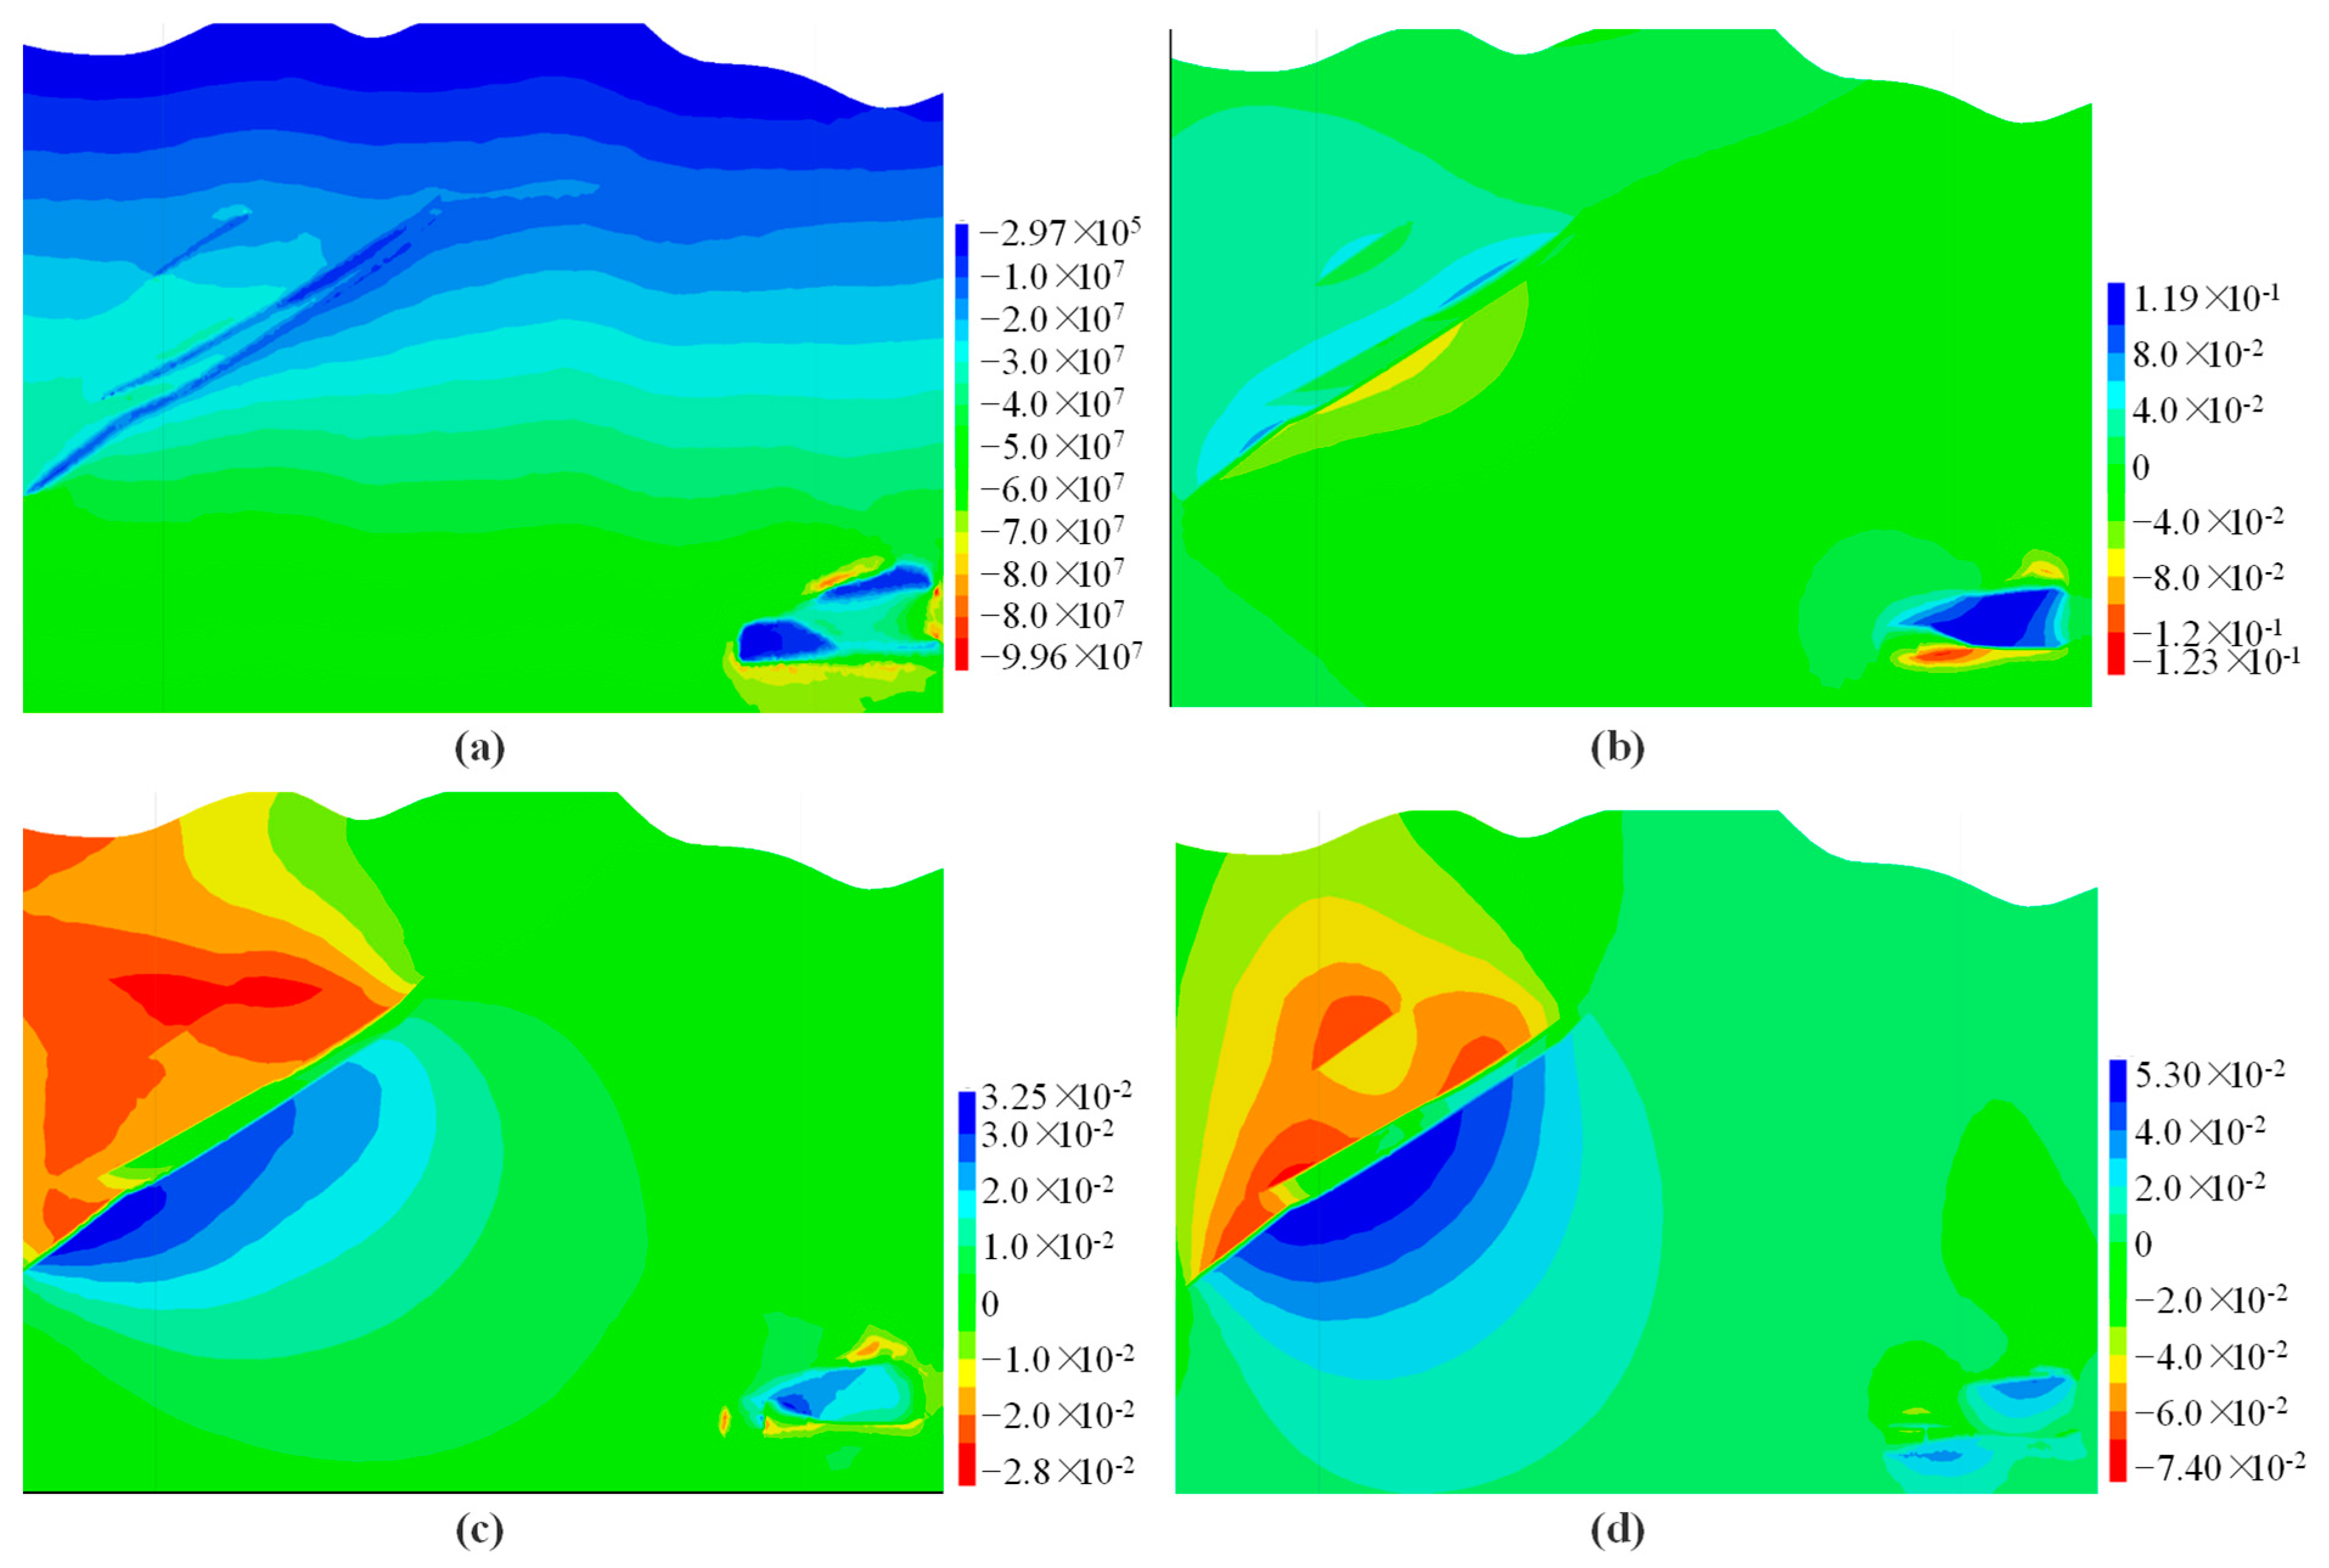
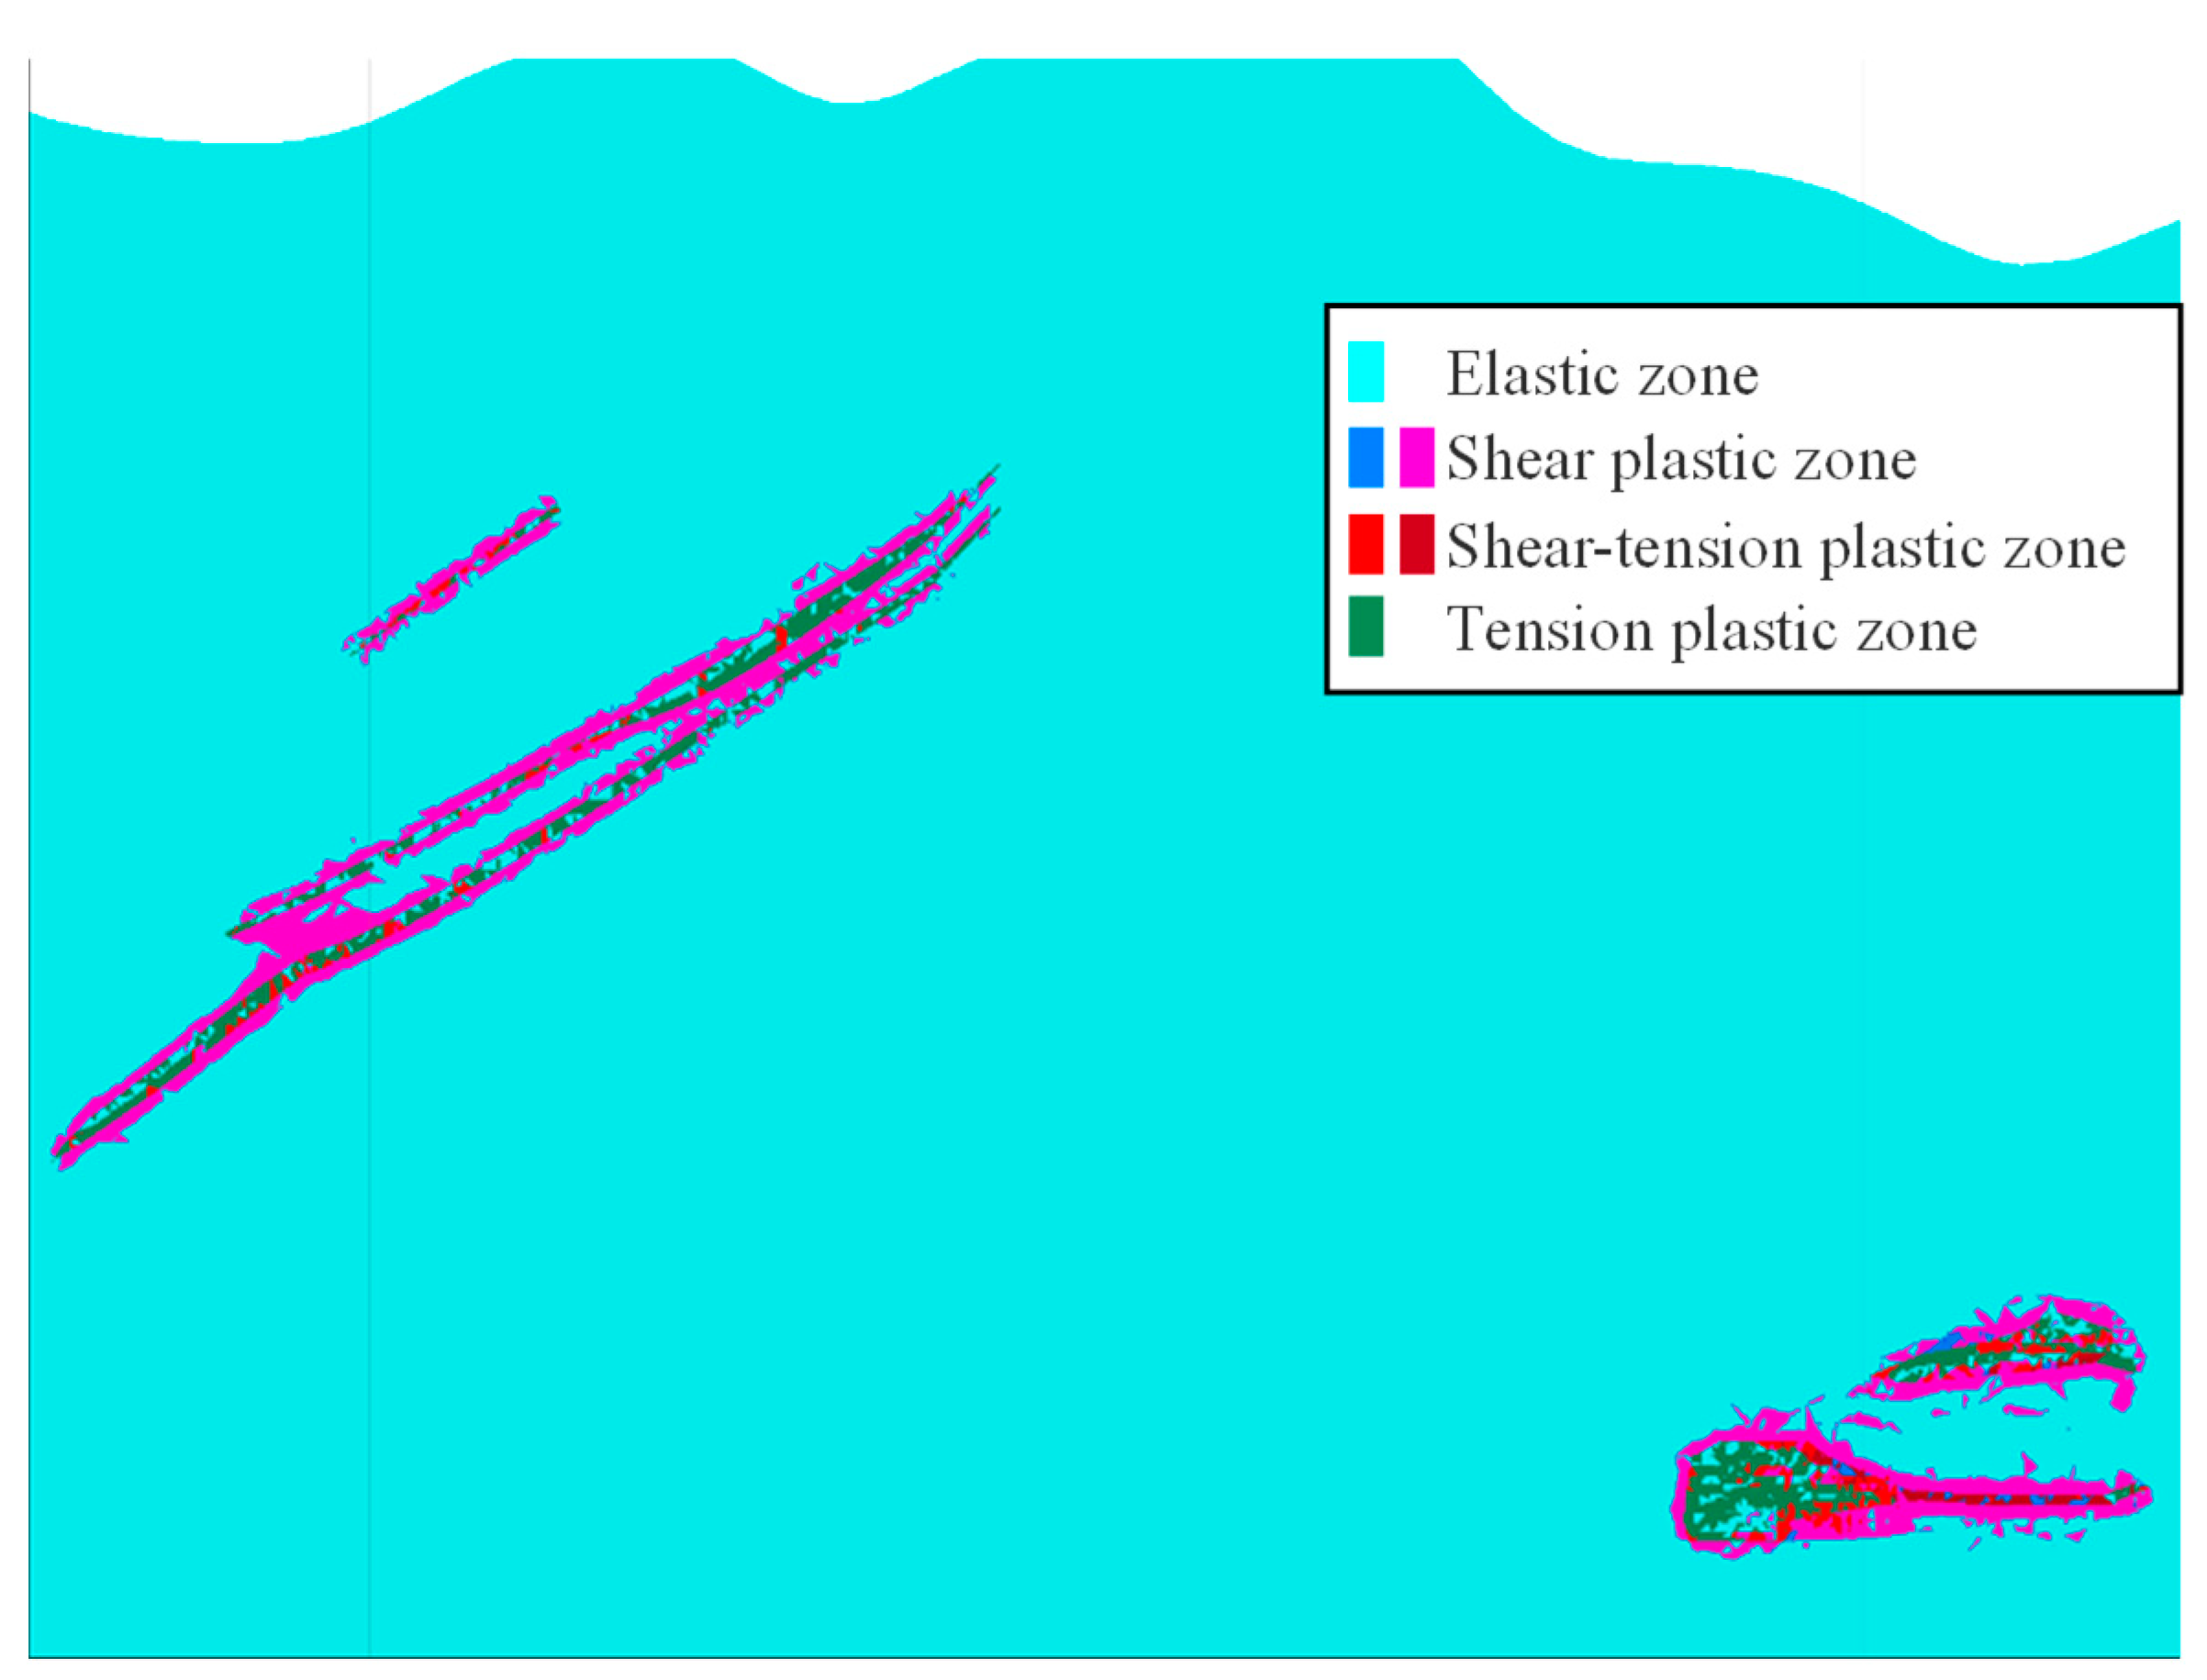
Figure 5 shows the maximum principal stress cloud map and displacement cloud map for the main cross-sections of the overlying strata. The simulation results show that the maximum principal stress in the rock mass is generally compressive stress, with stress concentration occurring at the corners of the mined-out area and at the roof and floor. The displacement in the Z direction generally shows subsidence at the top and uplift at the bottom, with a maximum subsidence value of 21.7 mm. Figure 6 is the cloud map of the plastic zone of the overlying strata under underground mining. The surrounding rock mass of the mining area is mostly in the elastic stage, with only a small amount of rock mass undergoing plastic deformation and failure, predominantly through shear failure.

4.3.2. Analysis of the Impact of Underground Ore Body Extraction on 4# Shaft

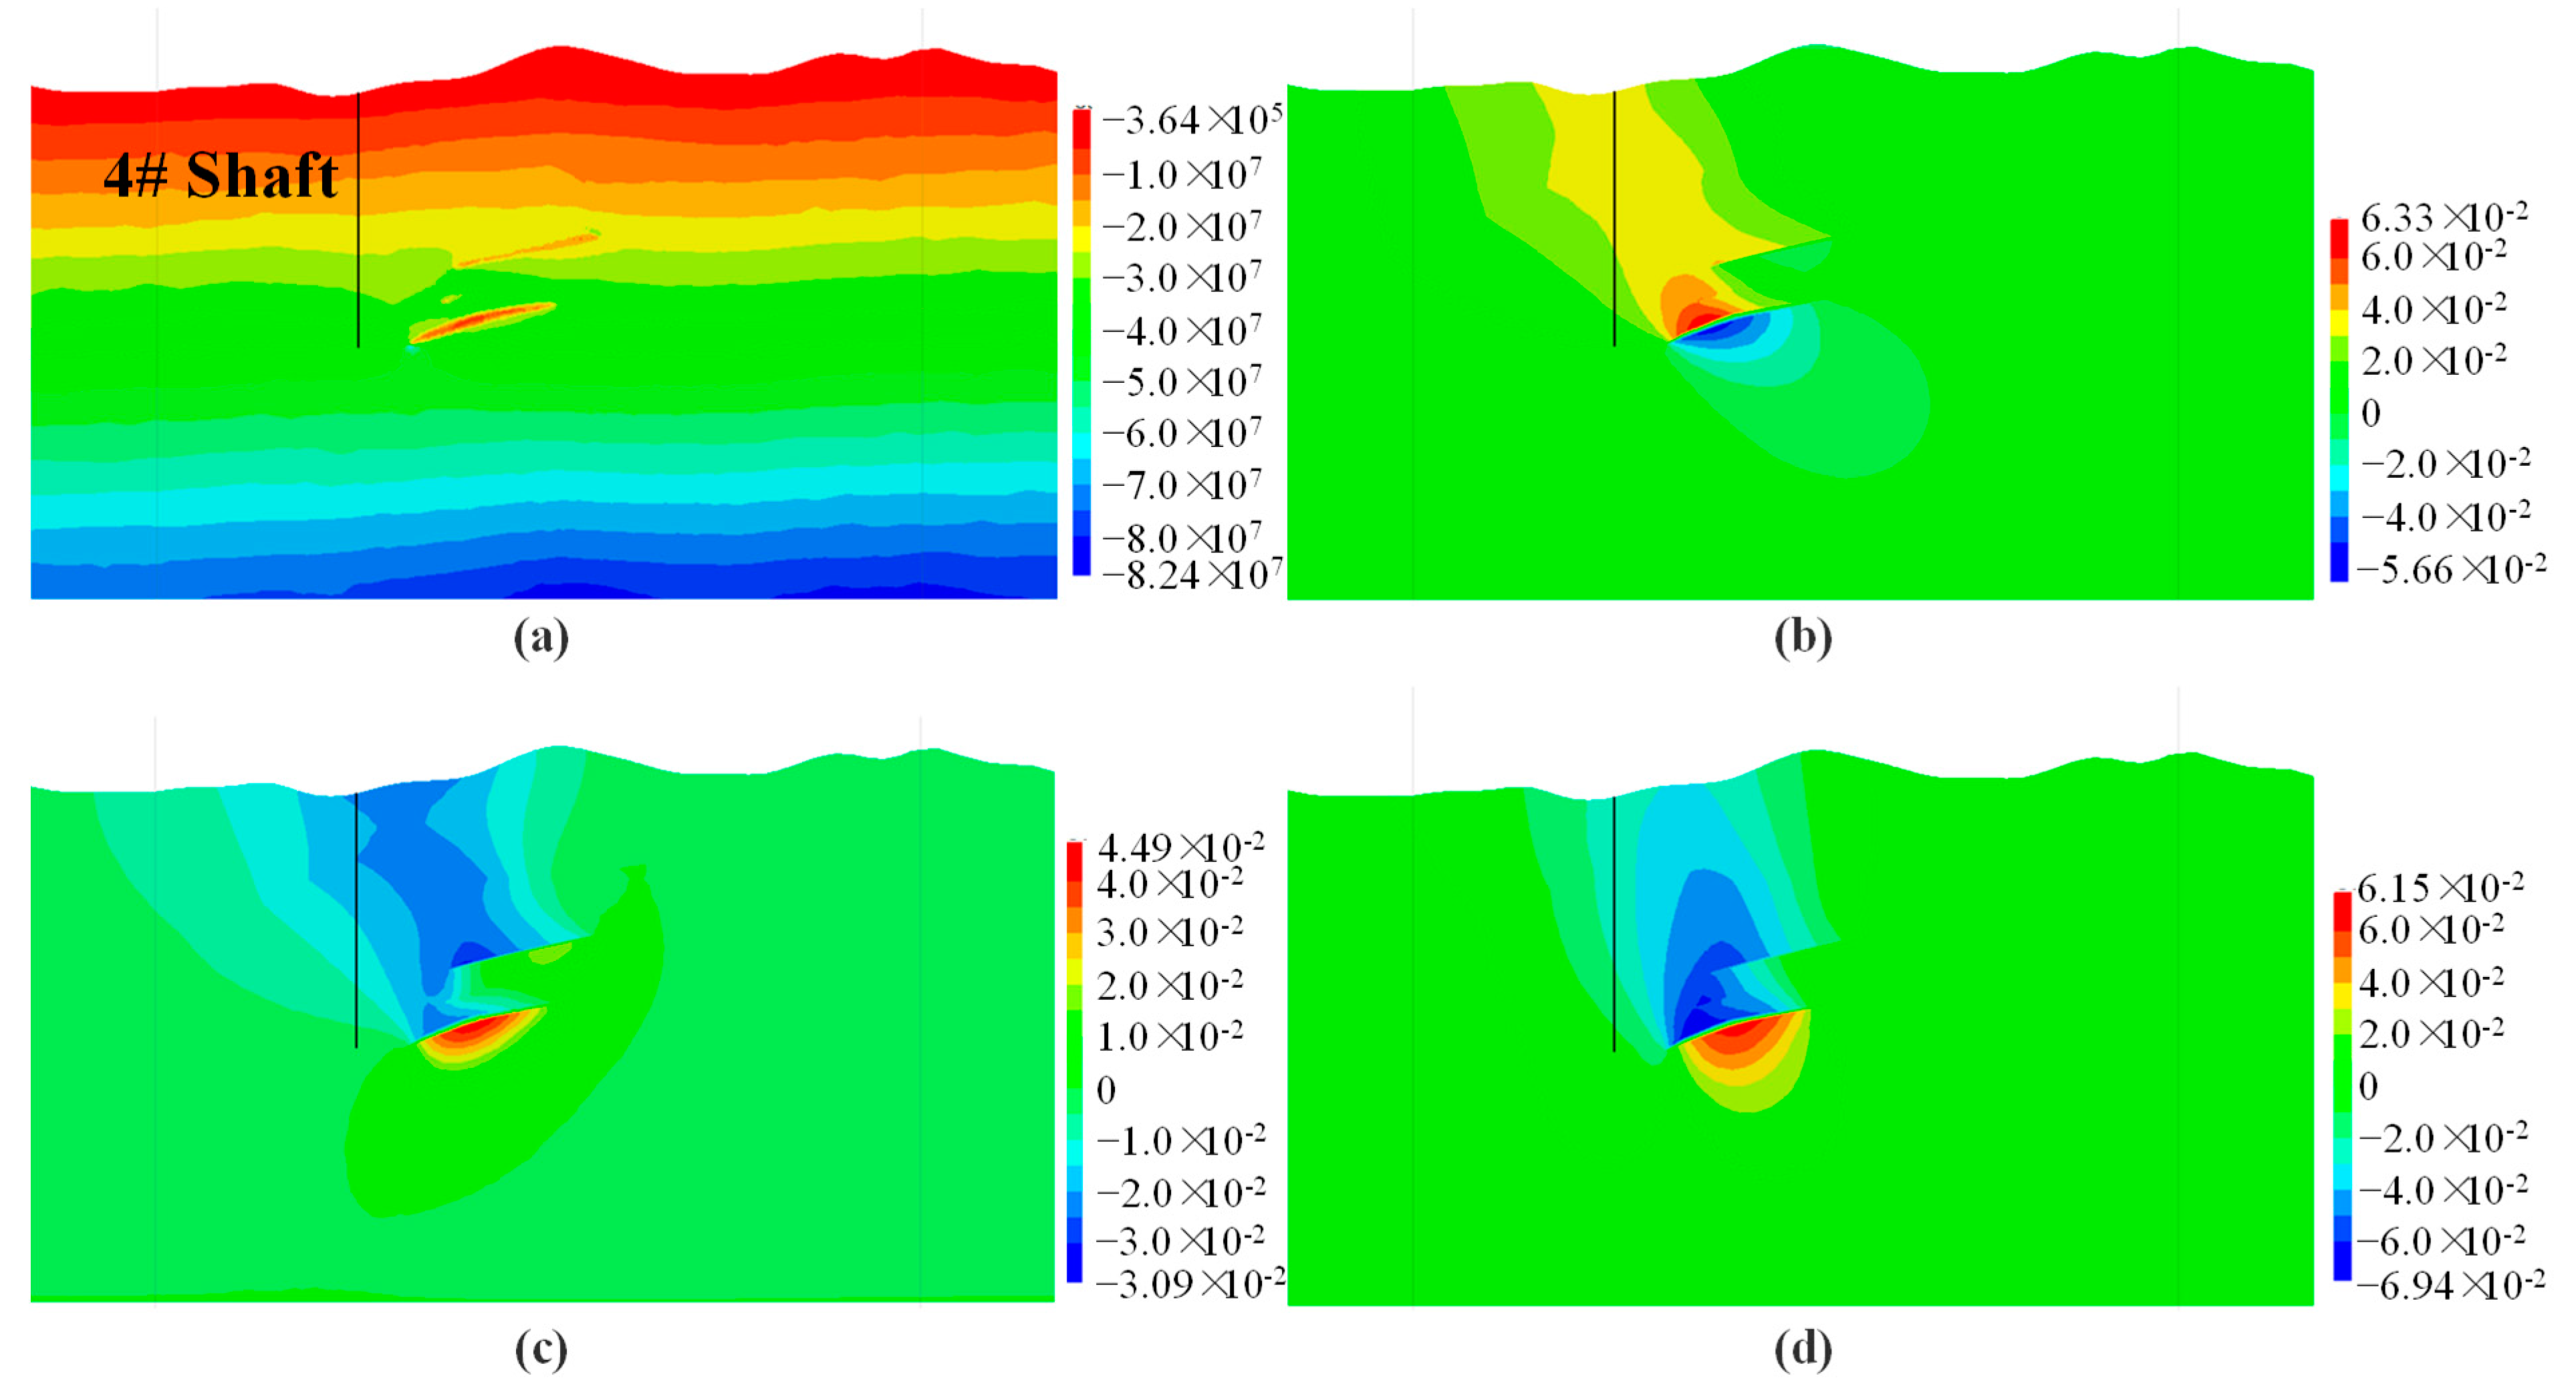
Figure 7 shows the maximum principal stress profile cloud map and displacement profile cloud map for the impact of underground mining on the surrounding rock of the 4# Shaft. The results show that the maximum principal stress in the surrounding rock of the 4# Shaft is generally compressive stress, with no stress concentration observed in the shaft surrounding rock. The maximum displacement in the Z direction occurs at the bottom of the shaft, near the mining area, with a maximum value of 14 mm. Figure 8 is the plastic zone cloud map of the surrounding rock of the 4# Shaft under underground mining. The surrounding rock mass is predominantly in the elastic stage, and without considering joint and fissure conditions, no large-scale deformation or failure in the mining area is observed.
Table 5 compares the results of the 4# Shaft movement from numerical simulations with the theoretical calculation results. The movement deformation results from numerical calculations and theoretical analysis of the 4# Shaft are quite consistent, further proving the stability of the 4# Shaft.

4.3.3. Analysis of the Impact of Underground Mining on 5# Return Air Shaft

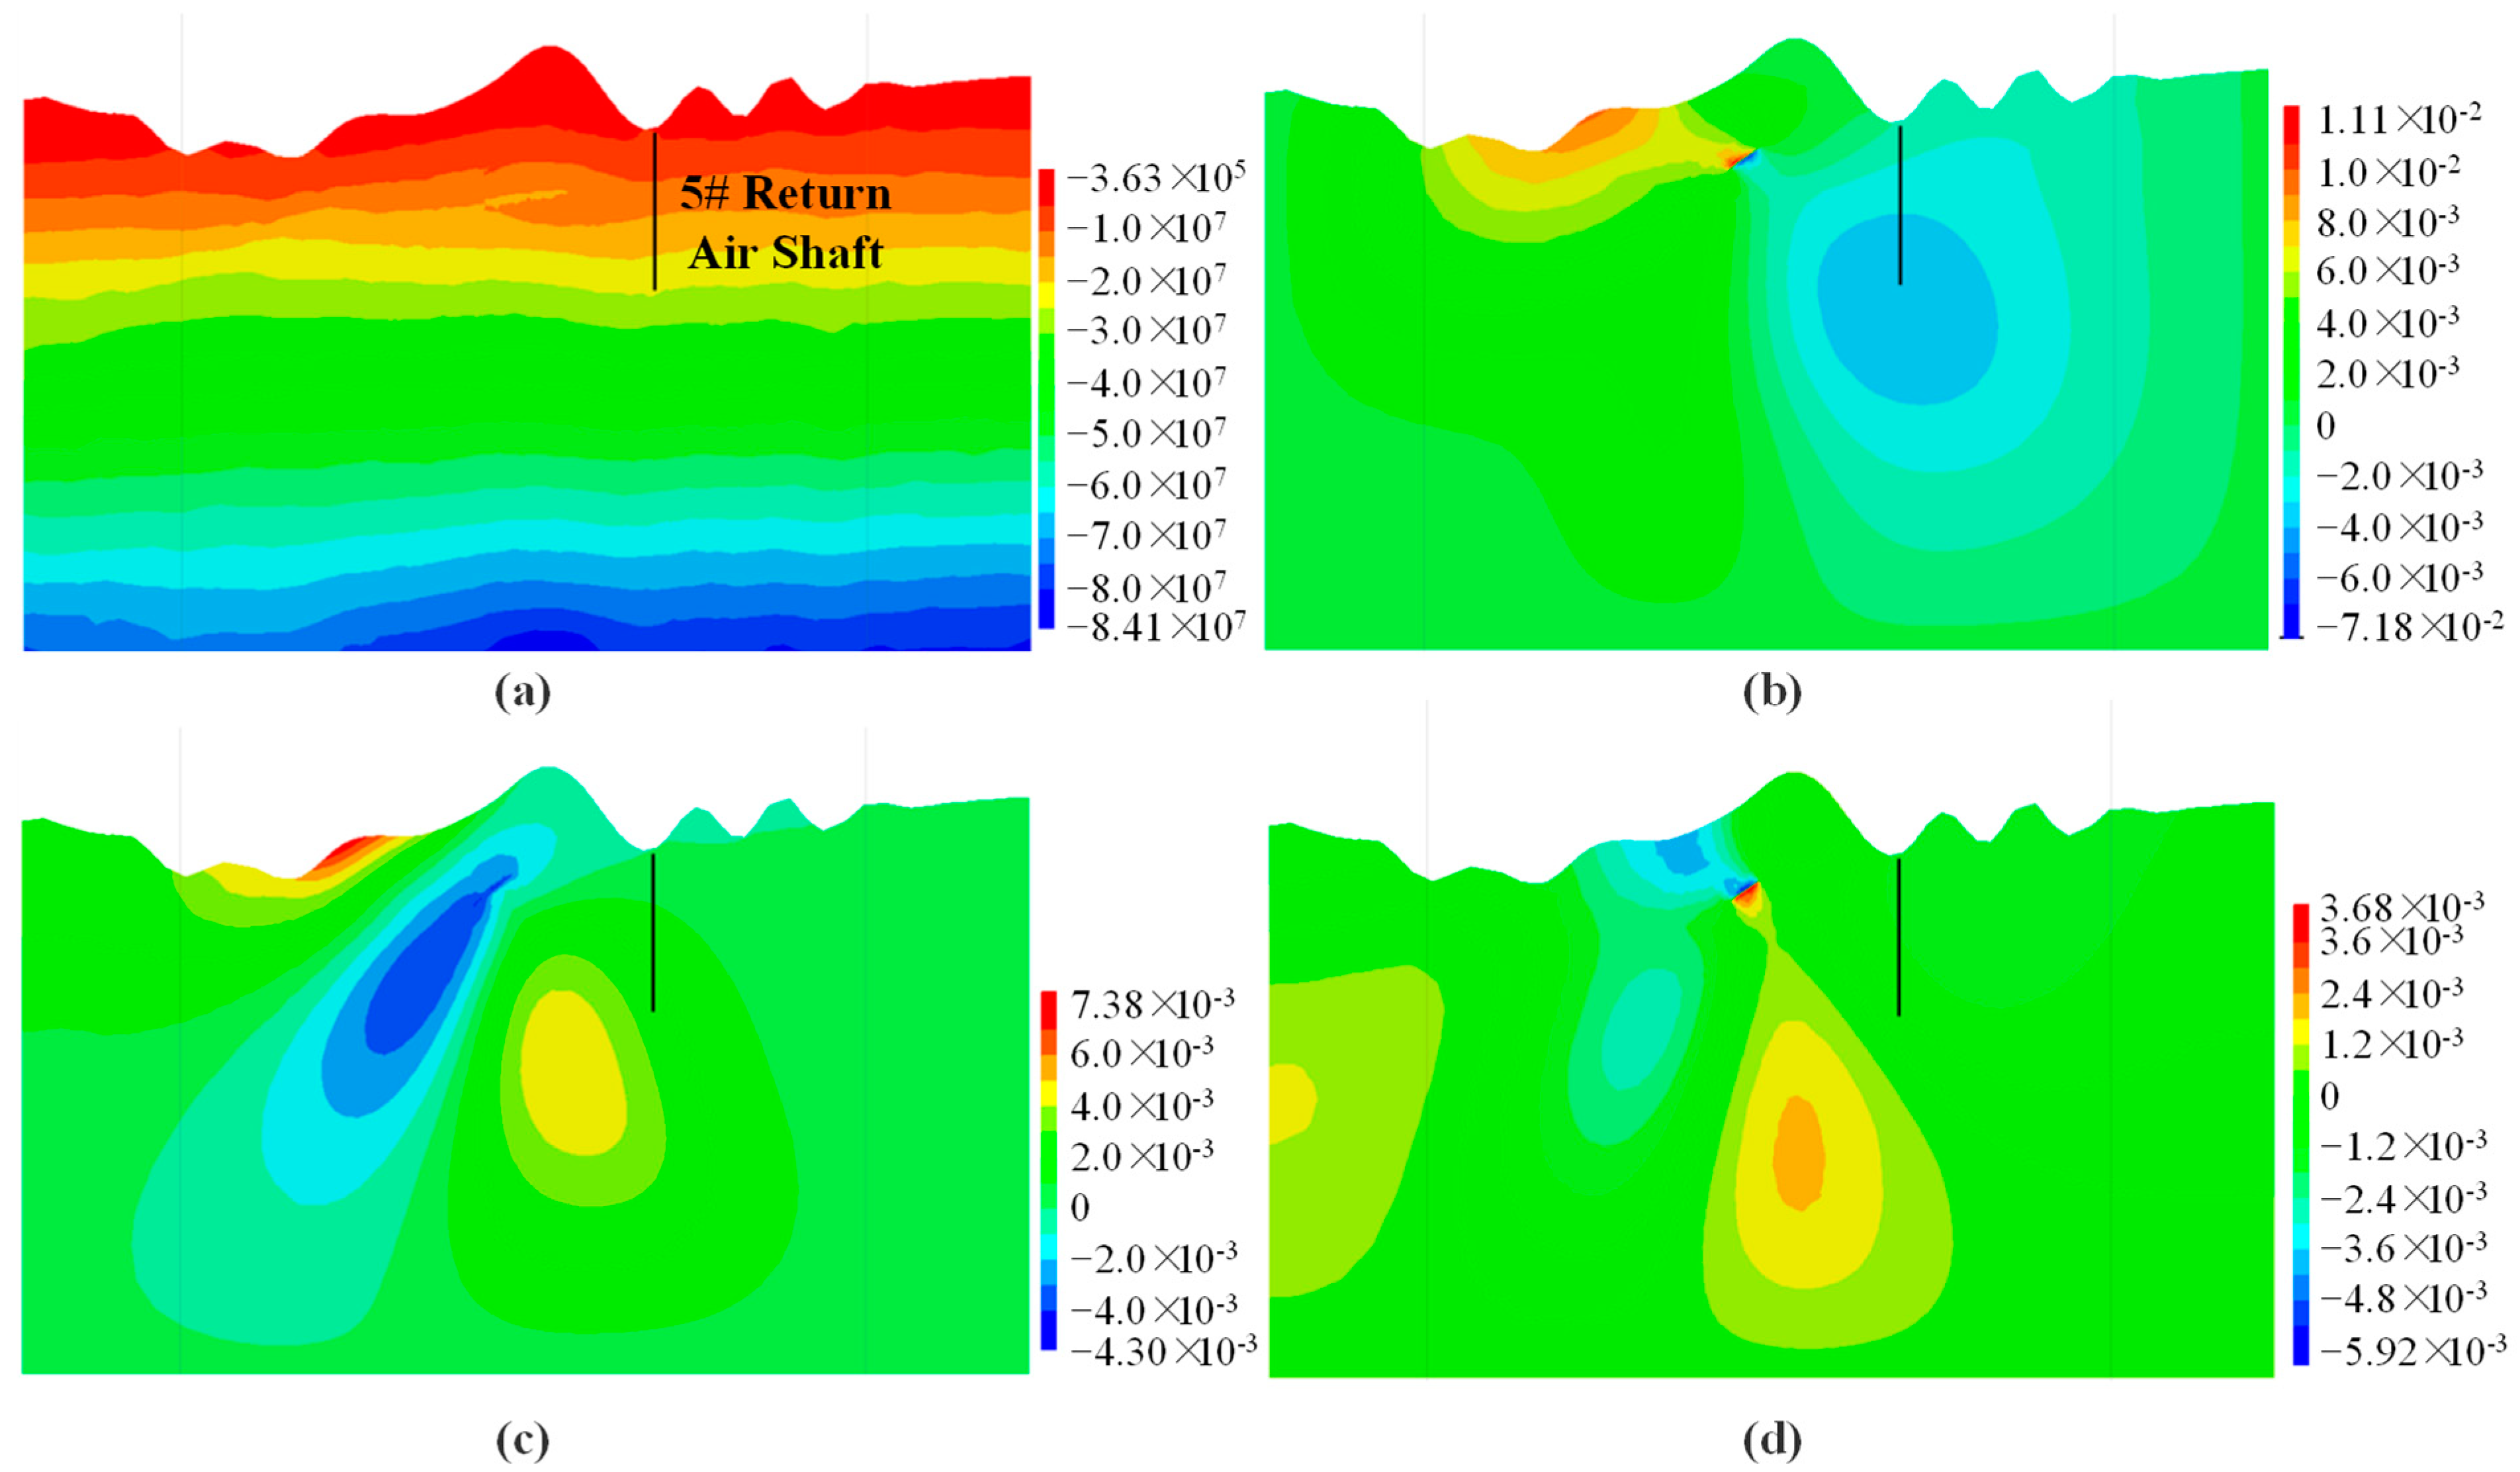
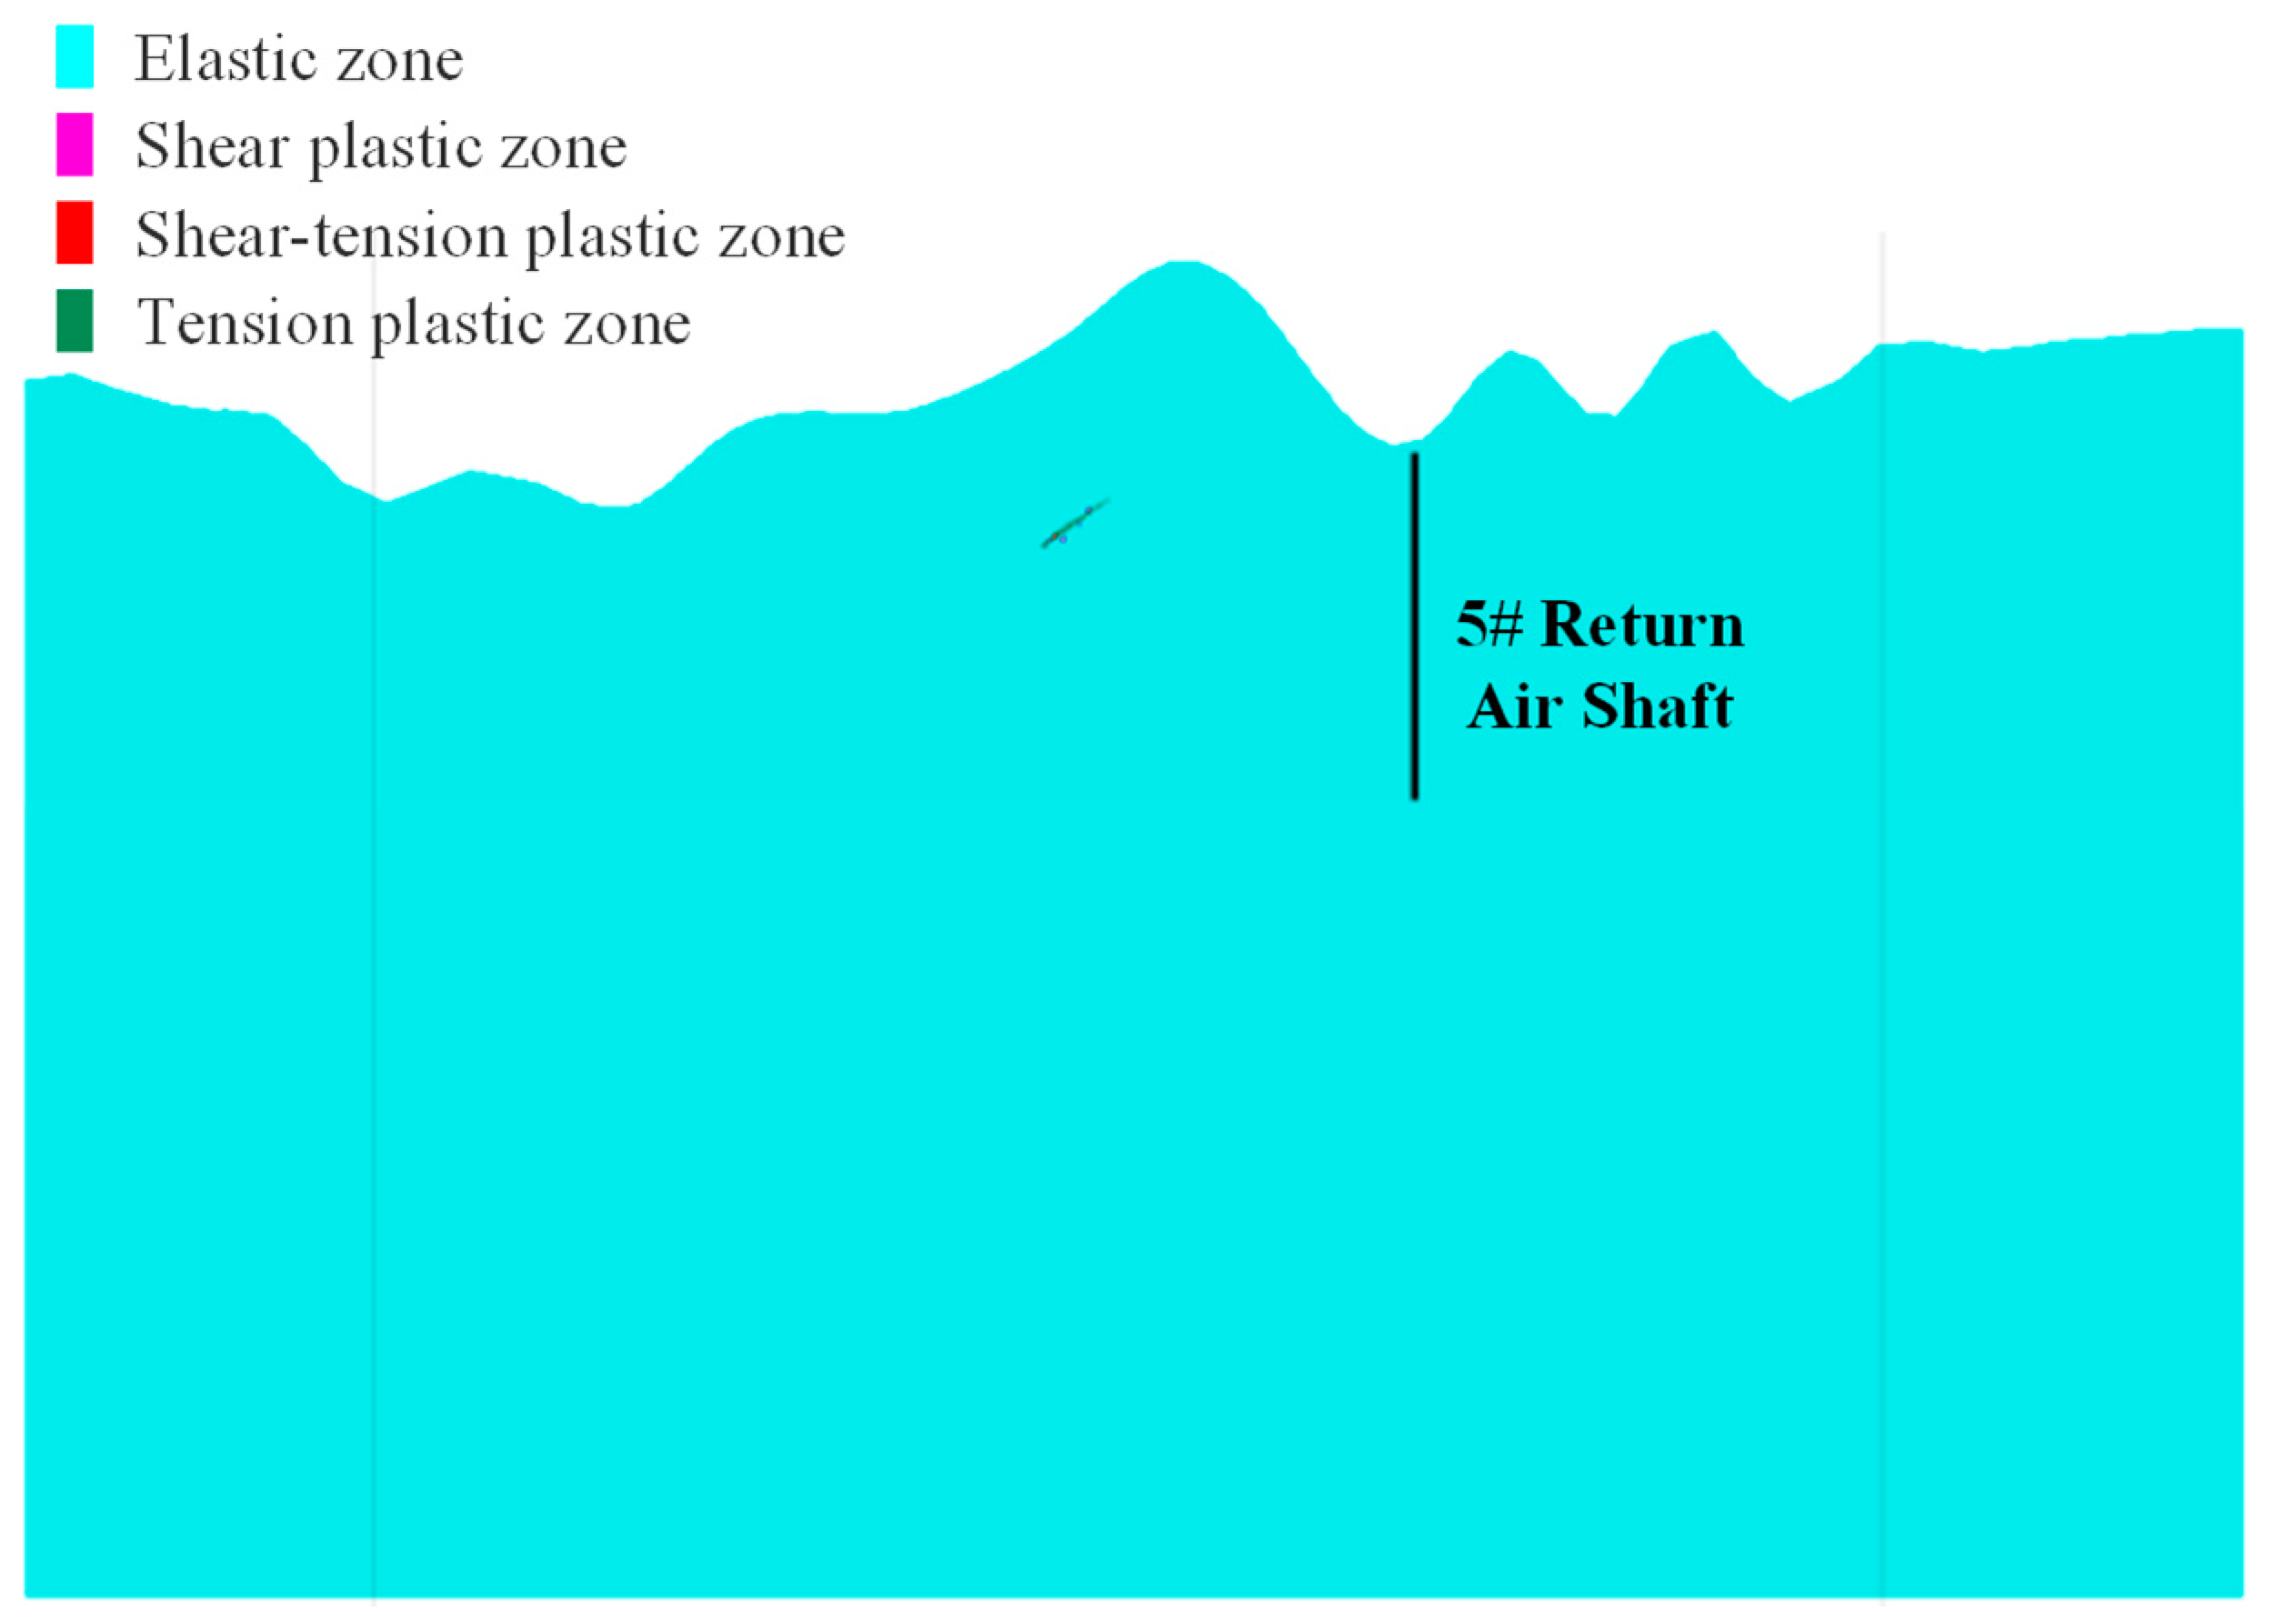
Figure 9 shows the principal maximum stress profile cloud map and displacement profile cloud map for the overlying strata of the 5# return air shaft under underground mining. The numerical simulation results indicate that the maximum principal stress in the surrounding rock of the 5# return air shaft is generally a compressive stress, with no stress concentration observed in the surrounding rock of the shaft. The maximum displacement in the Z direction occurs at the bottom of the shaft near the mining area, with a maximum value of 1.78 mm. Figure 10 is the plastic zone cloud map of the surrounding rock of the 5# return air shaft under underground mining. The surrounding rock mass is generally in the elastic stage, with few areas experiencing plastic failure.
Table 6 compares the results of the 5# return air shaft movement from numerical simulations with the theoretical calculation results. The horizontal deformation in the numerical calculation is one order of magnitude smaller than that in the theoretical calculation, while other parameters are relatively consistent.

4.3.4. Surface Displacement Analysis

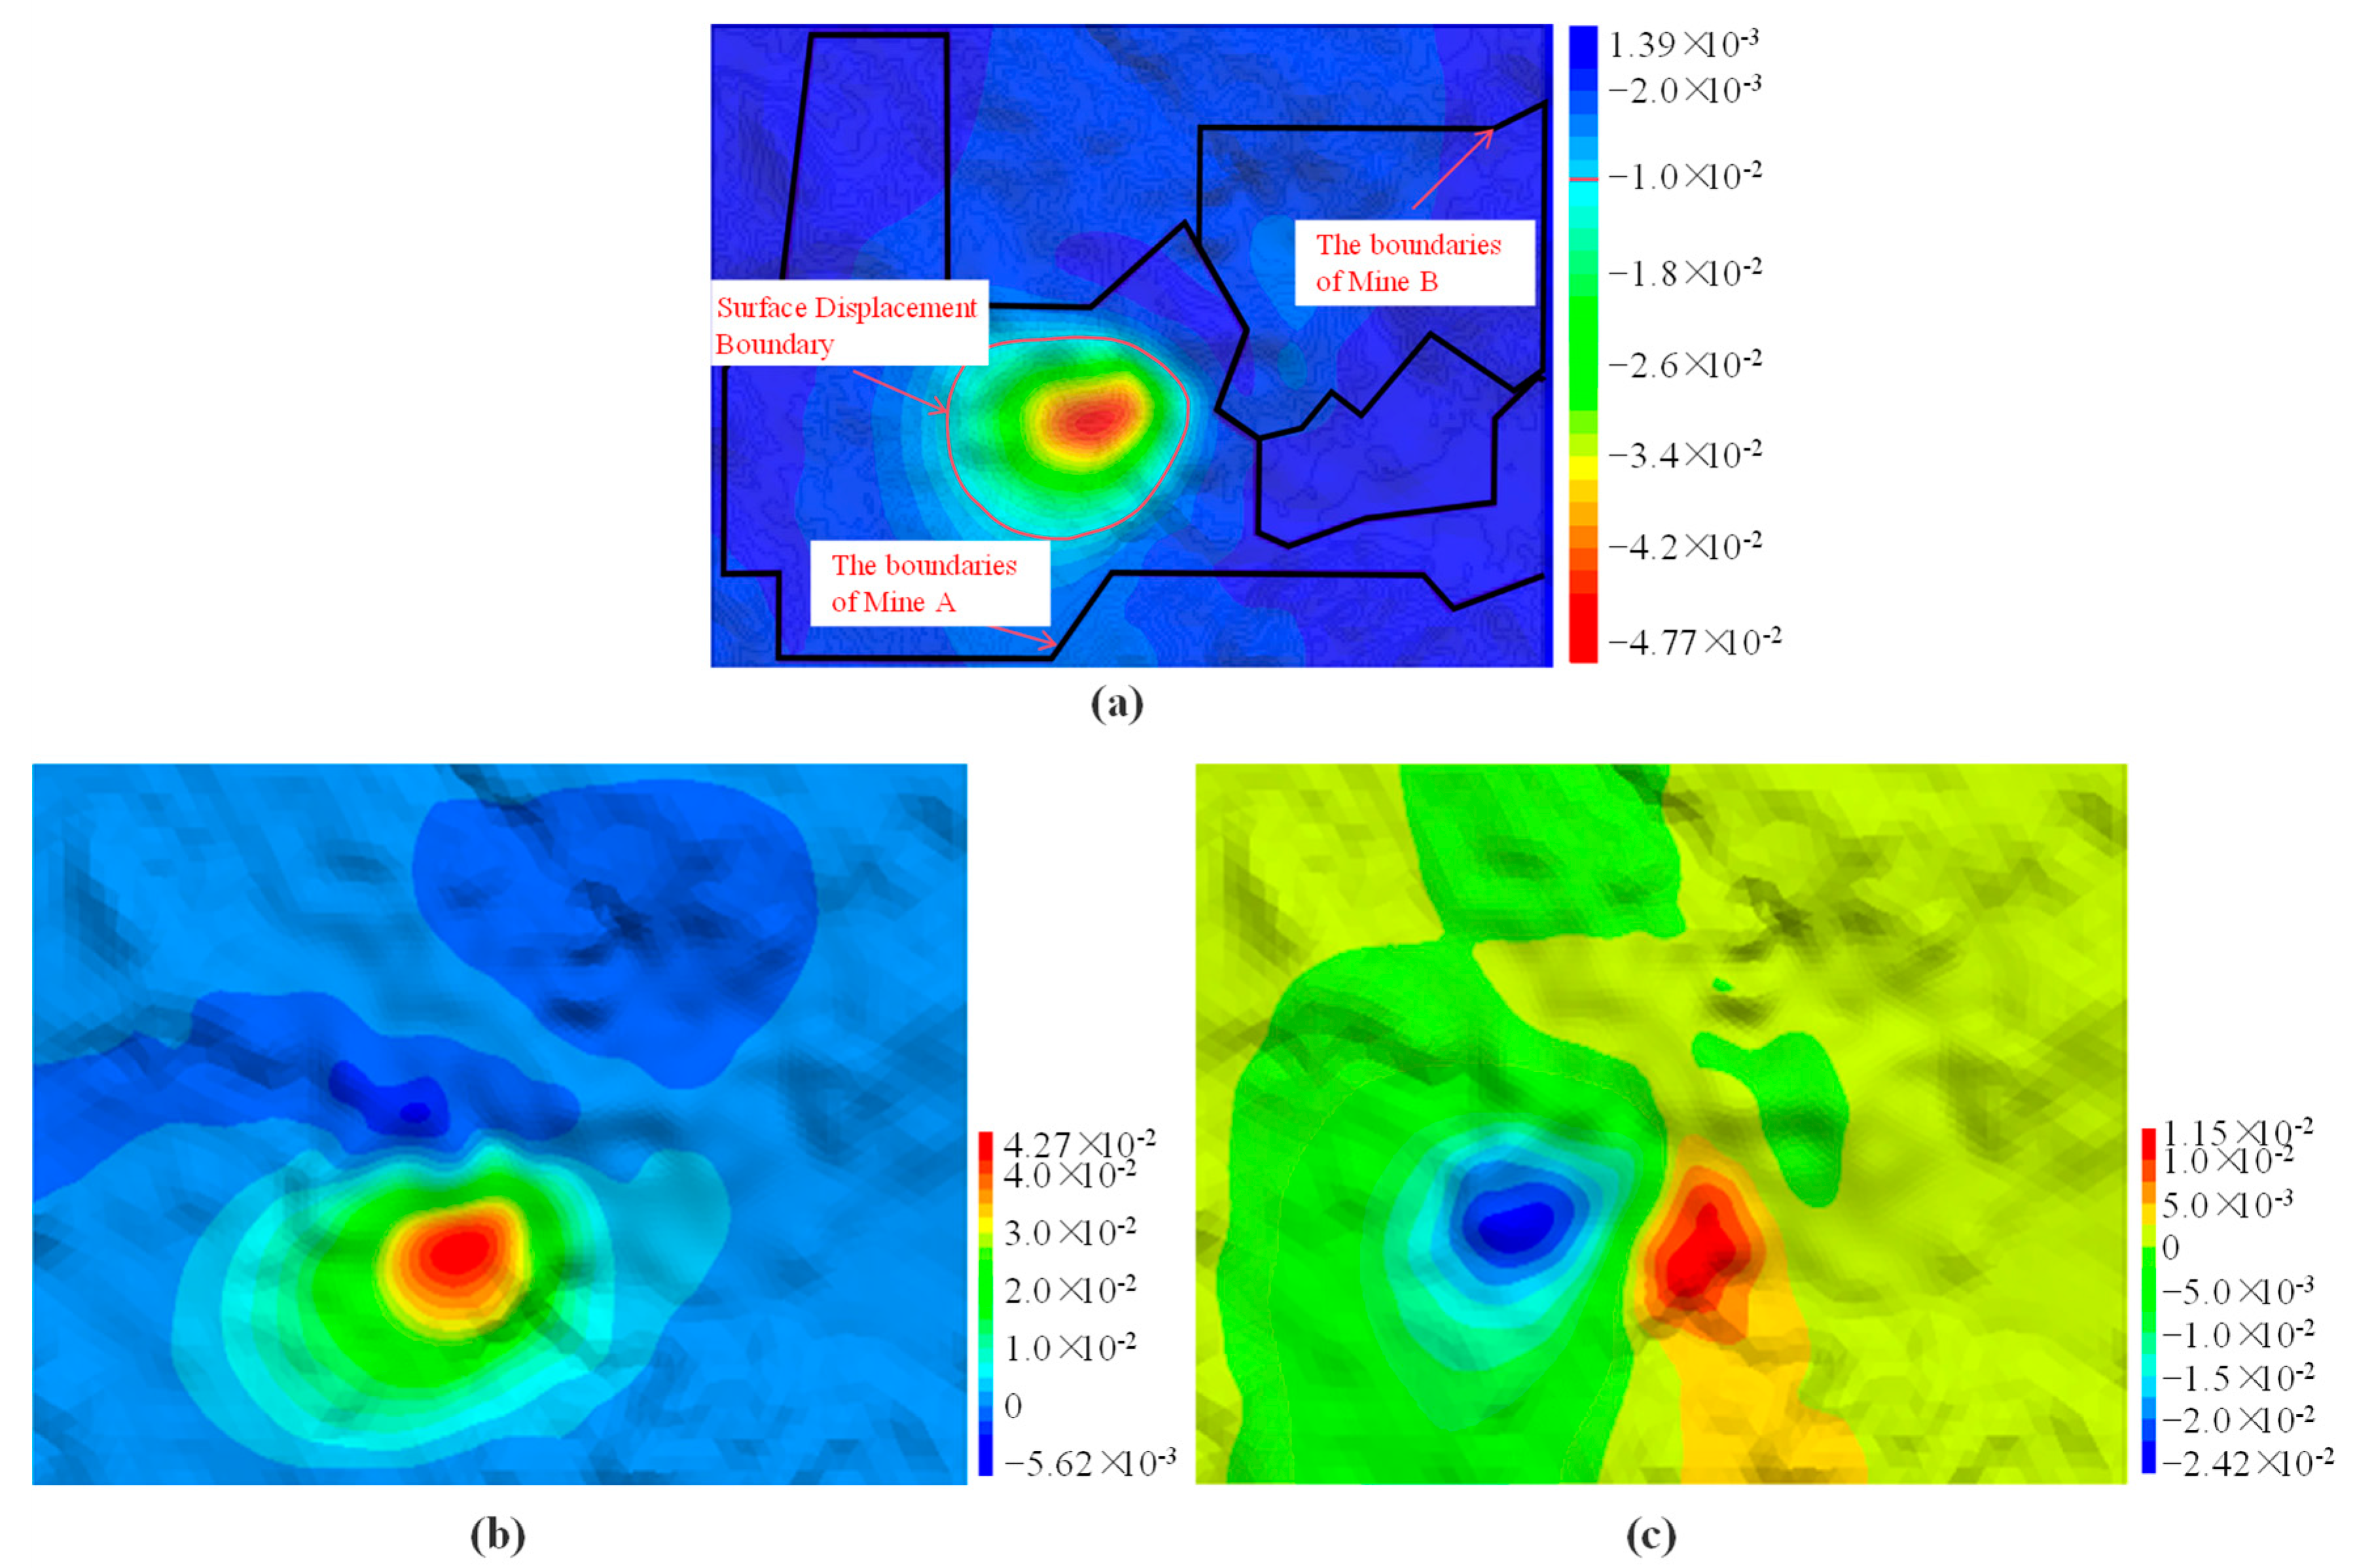
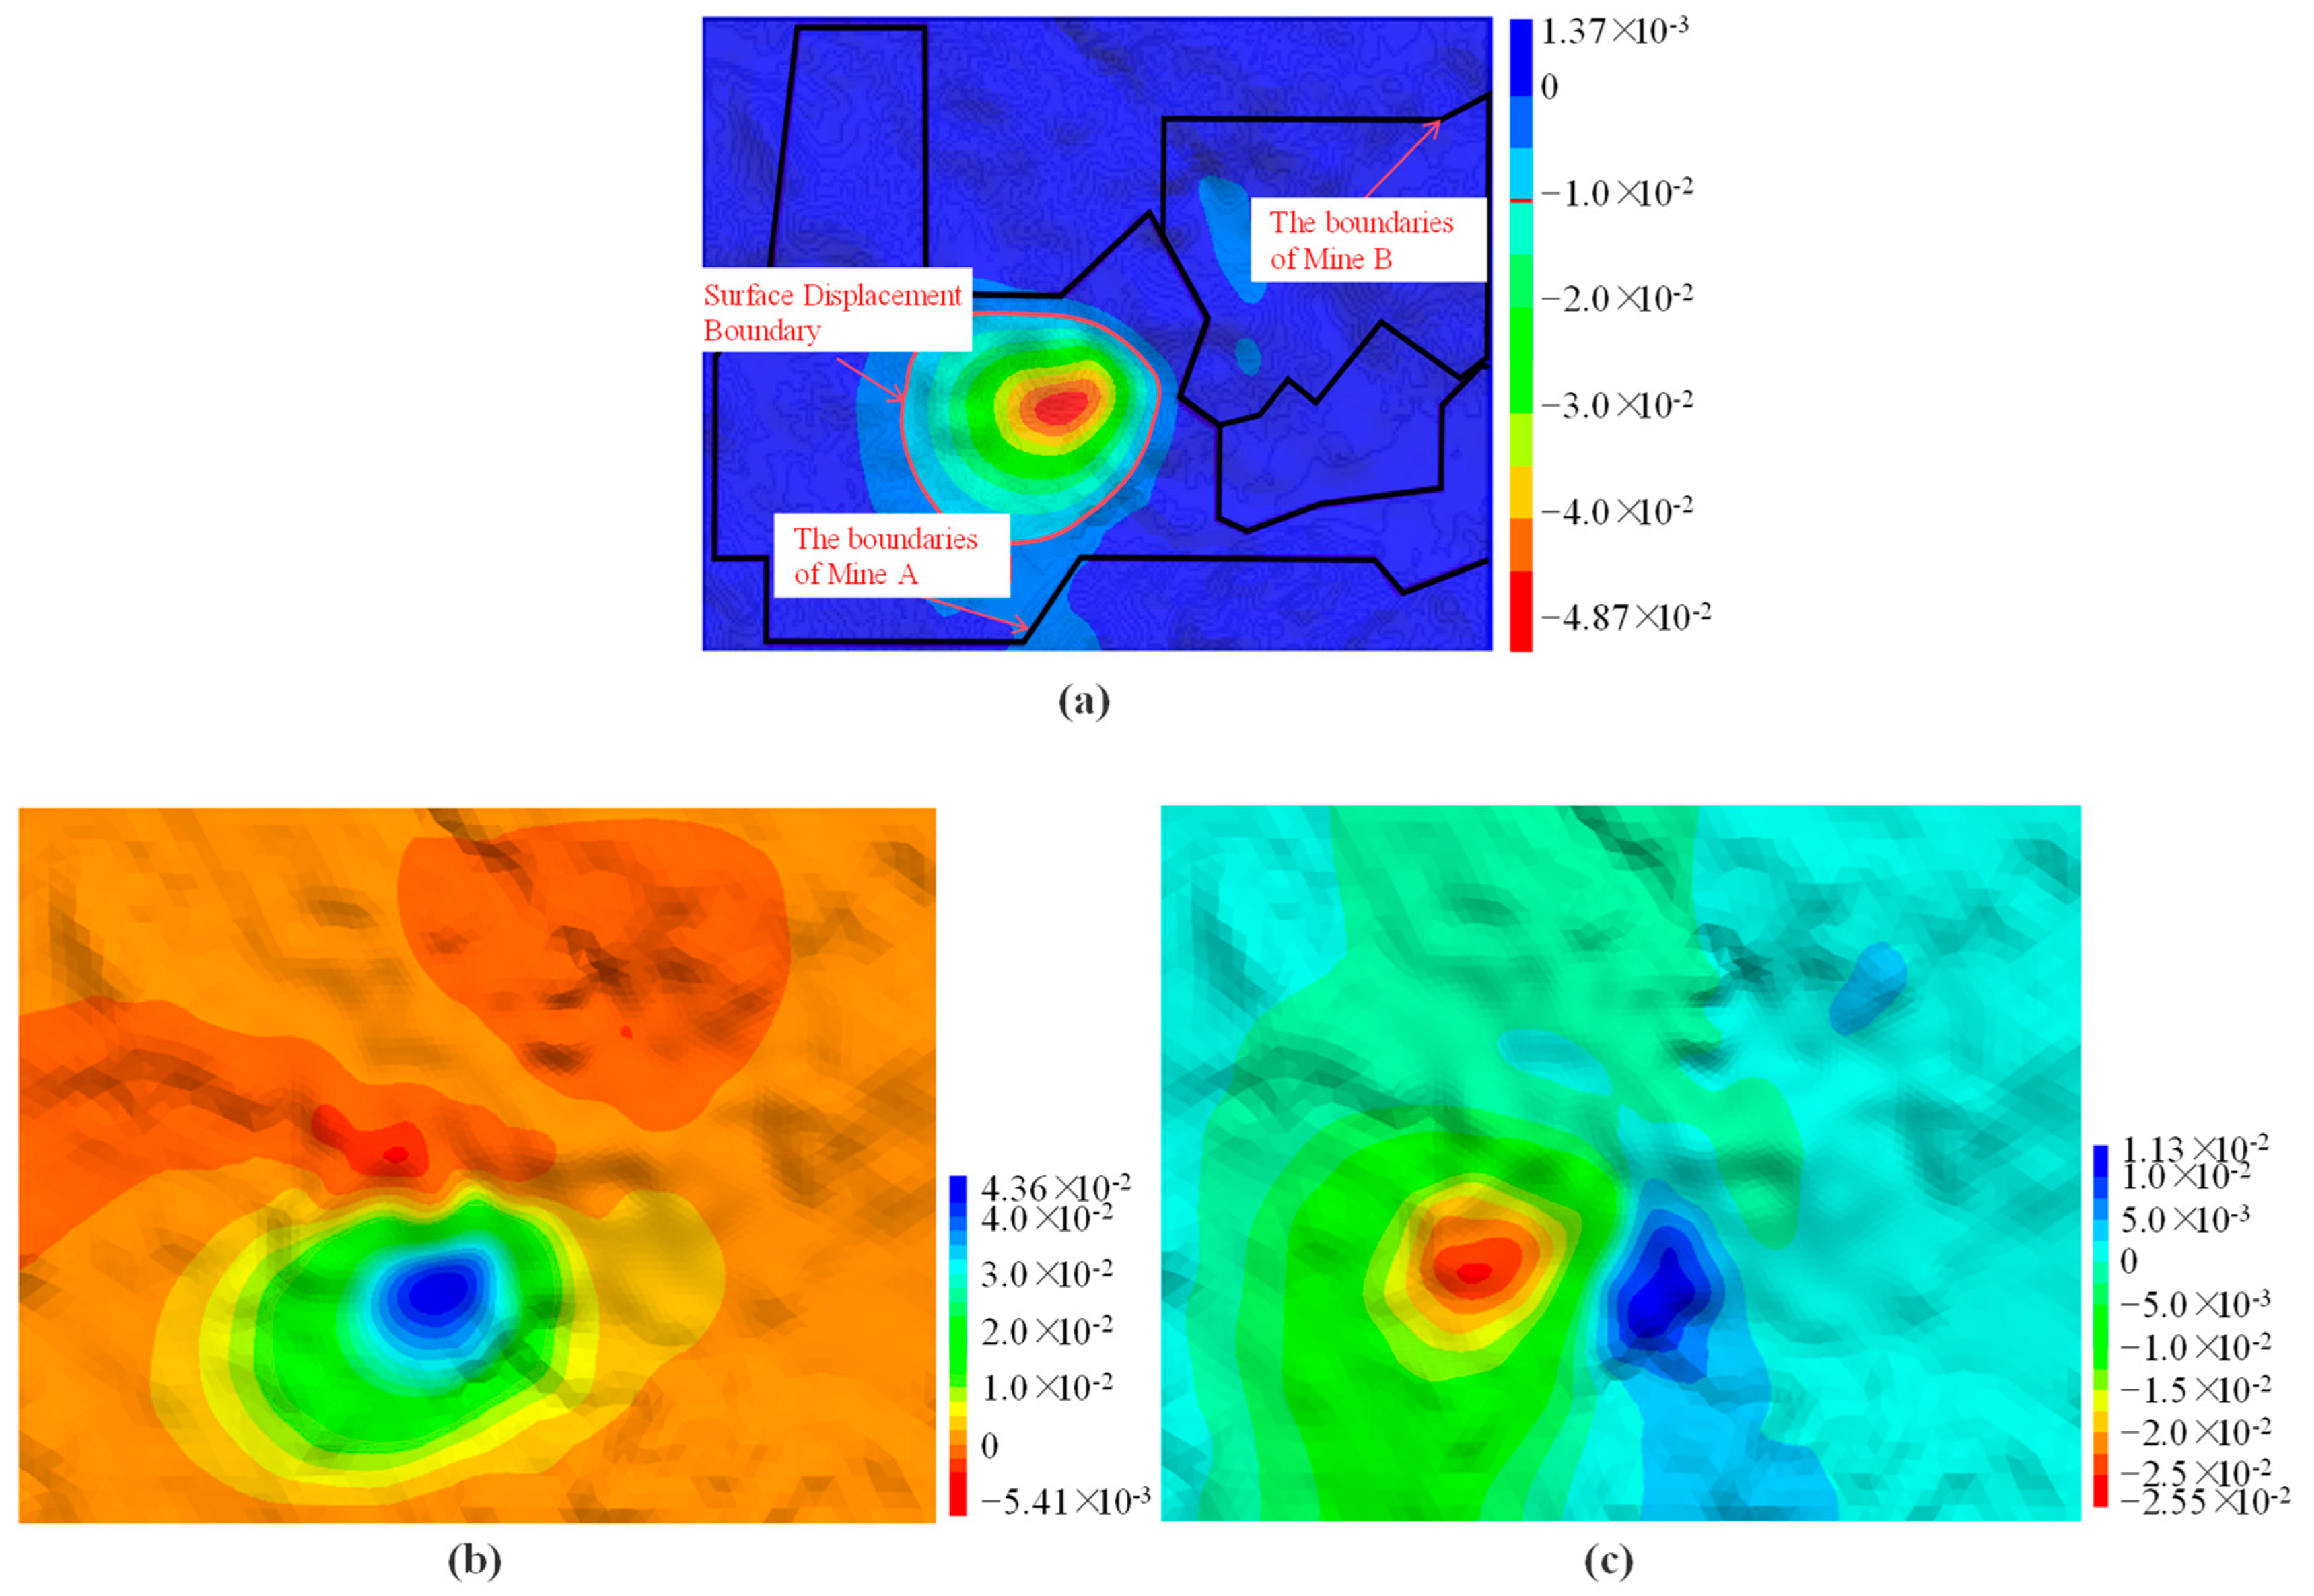
Figure 11a is a schematic map of the surface subsidence range, with the maximum subsidence displacement of approximately 47.7 mm. The surface subsidence gradually decreases from the center outward. In accordance with recent Chinese mining-subsidence studies [27,28], the 10 mm vertical-subsidence contour is commonly adopted to delineate the influence boundary of mining-induced deformation, beyond which surface displacement is considered negligible. The surface displacement deformation is defined within a boundary of 10 mm surface subsidence. The area inside the red line in the figure represents the boundary of surface displacement. The location of Mine B is outside the surface displacement boundary of Mine A, thus it can be assumed that Mine A extraction has little effect on the upper mining area of Mine B. After the ore body extraction in Mine A, the maximum horizontal displacement in the X direction is 42.7 mm (see Figure 11b), and the maximum horizontal displacement in the Y direction is 24.2 mm (see Figure 11c).
Overall, under the influence of ore body excavation in the mining area, the overlying strata and 4# Shaft are in a stable state. The maximum principal stress field generally conforms to the uniform distribution of the original rock stress. The surrounding rock in the mined-out area has undergone some plastic deformation in the past mining process and is now tending toward stability.

5. Analysis of the Impact of Underground Mining in Adjacent Mining Areas on Overlying Rock Mass and Surface Deformation

5.1. Analysis of the Impact of Underground Mining in Adjacent Mining Areas on Overlying Rock Mass

Figure 12 shows the cloud map of the impact of combined ore body extraction from adjacent mining areas on the surface. The results show that after the complete extraction of both mining areas, the maximum value of stress concentration occurs at the stope corners, with a maximum value of 83.34 MPa. However, the stress disturbance range from the mining activities is confined to the area surrounding the excavation zone, with the stress field evenly distributed between the mining areas. The elastic and plastic deformation ranges during the mining process in both mining areas are confined to the area around the ore body, and they do not affect the mining activities of each other (Figure 13).

5.2. Analysis of the Mutual Impact of Underground Mining in Adjacent Mining Areas on the Surface

Figure 14a is a schematic map of the surface subsidence range resulting from underground mining in both mining areas. The maximum subsidence displacement is approximately 48.7 mm, and the surface subsidence gradually decreases outward. A surface subsidence of 10 mm is defined as the boundary for surface displacement deformation, and the location of Mine B is outside the surface displacement boundary of Mine A. Therefore, it can be assumed that the ore bodies of Mines A and B do not have a significant mutual influence during the mining process. Figure 14 shows the surface horizontal displacement cloud map after mining. The maximum horizontal displacement in the X direction (Figure 14b) is 43.5 mm, and the maximum horizontal displacement in the Y direction (Figure 14c) is 25.5 mm.
Unlike most previous studies that focused on subsidence induced by a single mine, this research develops a unified analytical framework for evaluating the coupled effects of adjacent underground mining operations. By integrating probability integration theory with FLAC3D numerical simulation, the framework enables a quantitative assessment of inter-mine stress interactions and cumulative surface deformation. This combined approach provides a scientific basis for determining safe spacing between neighboring mines and for protecting surface structures in multi-mine districts.
Although the present study is based on a specific case involving Mines A and B, the proposed theoretical–numerical framework can be readily generalized to other underground metal-mining operations with similar geological and structural settings. The close agreement between theoretical predictions and FLAC3D simulation results verifies the reliability and representativeness of the proposed methodology. Consequently, other mines operating under comparable conditions may adopt this framework to evaluate deformation interactions and to establish safe separation distances.

6. Conclusions

This study investigated the effects of underground ore-body extraction on surface subsidence and the stability of overlying strata, integrating theoretical prediction and numerical simulation to assess both individual and combined mining influences.
(1) The probability integration method was used to predict surface deformation and subsidence induced by underground mining, obtaining deformation parameters for the 4# shaft, 4# return-air shaft, 5# return-air shaft, and the surrounding ground surface. The predicted deformation characteristics, including subsidence, inclination, curvature, and horizontal strain, reflected the overall distribution of mining-induced surface movement.
(2) A three-dimensional geomechanical model was established using FLAC3D finite-difference software based on actual geological and topographic data. The simulation results showed that the surrounding rock mass remained predominantly in the elastic stage with minor localized plastic deformation, indicating a favorable stability condition. The maximum surface subsidence reached 47.7 mm, and the simulated deformation of the 4# and 5# shafts was consistent with theoretical predictions, confirming the reliability of both the model and the analytical framework.
(3) A combined mining analysis demonstrated that the stress disturbance caused by deep ore extraction was confined to the excavation zones, and the stress field between the two mines remained uniformly distributed. A maximum stress concentration of 83.34 MPa occurred near the stope corners, while the cumulative surface subsidence reached approximately 48.7 mm, gradually decreasing outward. These results confirm that the deformation caused by both mines remains within the permissible safety range (10 mm influence boundary) defined by current national mining regulations.
To further ensure long-term stability, optimizing mining parameters and enhancing surface-monitoring systems are recommended. Future studies should focus on deep-mining ground-pressure effects and on the development of coordinated control strategies for high-stress zones near stopes and pit peripheries. Although this research relied on specific geomechanical parameters and idealized geological conditions, the close agreement between theoretical and numerical results verifies the applicability and transferability of the proposed framework for evaluating multi-source mining-induced deformation in other underground metal-mining districts.

Author Contributions

Conceptualization, L.X.; Funding acquisition, G.Z. and L.X.; Investigation, Z.L. and Y.G.; Methodology, Y.G. and Y.Y.; Resources, L.X.; Software, Y.G. and Y.Y.; Writing—original draft, G.Z. and L.X.; Writing—review & editing, Z.L. and Y.Y. All authors have read and agreed to the published version of the manuscript.

Funding

This research is funded by the S&T Innovation and Development Project of Information Institution of Ministry of Emergency Management (grant number 2024502 & 2023501) and Key Science and Technology Project of Ministry of Emergency Management of the People’s Republic of China (grant number 2024EMST080801).

Data Availability Statement

The data presented in this study are available on request from the corresponding author.

Conflicts of Interest

The authors declare no conflicts of interest.

References

  1. Bazaluk, O.; Petlovanyi, M.; Zubko, S.; Lozynskyi, V.; Sai, K. Instability Assessment of Hanging Wall Rocks during Underground Mining of Iron Ores. Minerals 2021, 11, 858. [Google Scholar] [CrossRef]
  2. Azaryan, A.A.; Batareyev, A.S.; Karamanits, F.I.; Kolosov, B.A.; Morkun, V.S. Ways to Reduce Ore Losses and Dilution in Iron Ore Underground Mining in Kryvbass. Sci. Innov. 2018, 14, 17–24. [Google Scholar] [CrossRef]
  3. Syvyj, M.J.; Ivanov, Y.A.; Panteleeva, N.B.; Varakuta, O.M. The Problem of Rational Use of Mineral Resources and Mining Waste in the Context of Sustainable Development of Regions. IOP Conf. Ser. Earth Environ. Sci. 2023, 1254, 012134. [Google Scholar] [CrossRef]
  4. Bazaluk, O.; Petlovanyi, M.; Sai, K.; Chebanov, M.; Lozynskyi, V. Comprehensive Assessment of the Earth’s Surface State Disturbed by Mining and Ways to Improve the Situation: Case Study of Kryvyi Rih Iron-Ore Basin, Ukraine. Front. Environ. Sci. 2024, 12, 1480344. [Google Scholar] [CrossRef]
  5. Cao, S.; Song, W.; Deng, D.; Lei, Y.; Lan, J. Numerical Simulation of Land Subsidence and Verification of Its Character for an Iron Mine Using Sublevel Caving. Int. J. Min. Sci. Technol. 2016, 26, 327–332. [Google Scholar] [CrossRef]
  6. Woo, K.S.; Eberhardt, E.; Elmo, D.; Stead, D. Empirical Investigation and Characterization of Surface Subsidence Related to Block Cave Mining. Int. J. Rock Mech. Min. Sci. 2013, 61, 31–42. [Google Scholar] [CrossRef]
  7. Li, P.; Li, Y.; Li, Q.; Cao, Z.; Wang, L. A Novel Analytical Model of Mining Subsidence Considering Time Effect Based on the Probability Integral Theory. Sustainability 2022, 14, 14443. [Google Scholar] [CrossRef]
  8. Jin, C.; Zhao, F.; Liu, L.; Shangguan, S.; Zhang, B.; Zhang, X. Subsidence of Strata Overlying Salt Mines: A Case Study in Northern. Environ. Earth Sci. 2022, 81, 334. [Google Scholar] [CrossRef]
  9. Guo, Q.; Meng, X.; Li, Y.; Lv, X.; Liu, C. A Prediction Model for the Surface Residual Subsidence in an Abandoned Goaf for Sustainable Development of Resource-Exhausted Cities. J. Clean. Prod. 2021, 279, 123803. [Google Scholar] [CrossRef]
  10. Guo, W.; Bai, E.; Zhao, G. Current Status and Progress on Overburden and Surface Damage and Prevention Technology of High-Intensity Mining. Meitan Xuebao J. China Coal Soc. 2020, 45, 509–523. [Google Scholar] [CrossRef]
  11. Ding, K.; Ma, F.; Zhao, H.; Guo, J.; Zhu, J.; Jiang, H. Analysis on the Surface Deformation in Jingerquan Mine. J. Eng. Geol. 2016, 24, 392–399. [Google Scholar]
  12. Huang, G. Study on Overlying Strata Stability and Surface Subsidence with Effect of Backfilling Method in Luohe Underground Mine; University of Science and Technology Beijing: Beijing, China, 2016. [Google Scholar]
  13. Zhang, G. Mechanism and Application of the Ground Subsidence of Soft Rock; Graduate School of China Coal Research Institute: Beijing, China, 2016. [Google Scholar]
  14. Guoquan, Z.; Jianlong, S.; Mingwei, S.; Feng, H. Study on the Surface Subsidence Rule in Roof Caving under Complex Conditions Based on UDEC. Met. MINE 2012, 6, 32–35. [Google Scholar]
  15. Longbin, D.; Shaoquan, W.; Changyu, J.; Zhaosheng, L.; Yu, Z. Numerical Simulation of Factors Affecting Strata Movement Caused by Caving Method. Met. Mine 2015, 44, 40–44. [Google Scholar]
  16. Junen, L.; Zhenhua, G.; Jie, Z. Dynamic Prediction of Mining Subsidence in Ling Long Mine. Mine Surv. 2018, 46, 2–6. [Google Scholar]
  17. Shi, Y.; Zhao, M.; Hao, J. Study on Numerical Models in Predicting Surface Deformation Caused by Underground Coal Mining. Geotech. Geol. Eng. 2021, 39, 4457–4473. [Google Scholar] [CrossRef]
  18. He, L.; Wu, D.; Ma, L. Numerical Simulation and Verification of Goaf Morphology Evolution and Surface Subsidence in a Mine. Eng. Fail. Anal. 2023, 144, 106918. [Google Scholar] [CrossRef]
  19. Sepehri, M.; Apel, D.B.; Hall, R.A. Prediction of Mining-Induced Surface Subsidence and Ground Movements at a Canadian Diamond Mine Using an Elastoplastic Finite Element Model. Int. J. Rock Mech. Min. Sci. 2017, 100, 73–82. [Google Scholar] [CrossRef]
  20. Zhao, Y.; Zhao, X.; Dai, J.; Yu, W. Analysis of the Surface Subsidence Induced by Mining Near-Surface Thick Lead-Zinc Deposit Based on Numerical Simulation. Processes 2021, 9, 717. [Google Scholar] [CrossRef]
  21. Li, Z.; Hou, K.; Li, T.; Tang, J.; Lu, G. Numerical Simulation of Surface Subsidence and Fracture Evolution Caused by Pulang Copper Mine Mining. Appl. Sci. 2024, 14, 2416. [Google Scholar] [CrossRef]
  22. Tiwari, P.; Rupesh, R.; Sharma, S.P.; Ciazela, J. Dynamics of Saltwater Intrusion in a Heterogeneous Coastal Environment: Experimental, DC Resistivity, and Numerical Modeling Approaches. Water 2024, 16, 1950. [Google Scholar] [CrossRef]
  23. Gong, Y.; Guo, G.; Wang, L.; Zhang, G.; Zhang, G.; Fang, Z. Numerical Study on the Surface Movement Regularity of Deep Mining Underlying the Super-Thick and Weak Cementation Overburden: A Case Study in Western China. Sustainablity 2022, 14, 1855. [Google Scholar] [CrossRef]
  24. Xia, K.; Chen, C.; Deng, Y.; Xiao, G.; Zheng, Y.; Liu, X.; Fu, H.; Song, X.; Chen, L. In Situ Monitoring and Analysis of the Mining-Induced Deep Ground Movement in a Metal Mine. Int. J. Rock Mech. Min. Sci. 2018, 109, 32–51. [Google Scholar] [CrossRef]
  25. Chrzanowski, A.; Monahan, C.; Roulston, B.; Szostak-Chrzanowski, A. Integrated Monitoring and Modelling of Ground Subsidence in Potash Mines. Int. J. Rock Mech. Min. Sci. 1997, 34, 55.e1–55.e16. [Google Scholar] [CrossRef]
  26. Finnie, G.J. Using Neural Networks to Discriminate between Genuine and Spurious Seismic Events in Mines. Pure Appl. Geophys. 1999, 154, 41–56. [Google Scholar] [CrossRef]
  27. Wang, L.; Teng, C.; Jiang, K.; Jiang, C.; Zhu, S. D-InSAR Monitoring Method of Mining Subsidence Based on Boltzmann and Its Application in Building Mining Damage Assessment. KSCE J. Civ. Eng. 2022, 26, 353–370. [Google Scholar] [CrossRef]
  28. Luan, Y.; Liang, Y.; Ji, Z.; Yu, J. Monitoring and Analysis of Surface Subsidence Caused by SBAS-InSAR Technology. Coal Sci. Technol. 2020, 48, 198–204. [Google Scholar]
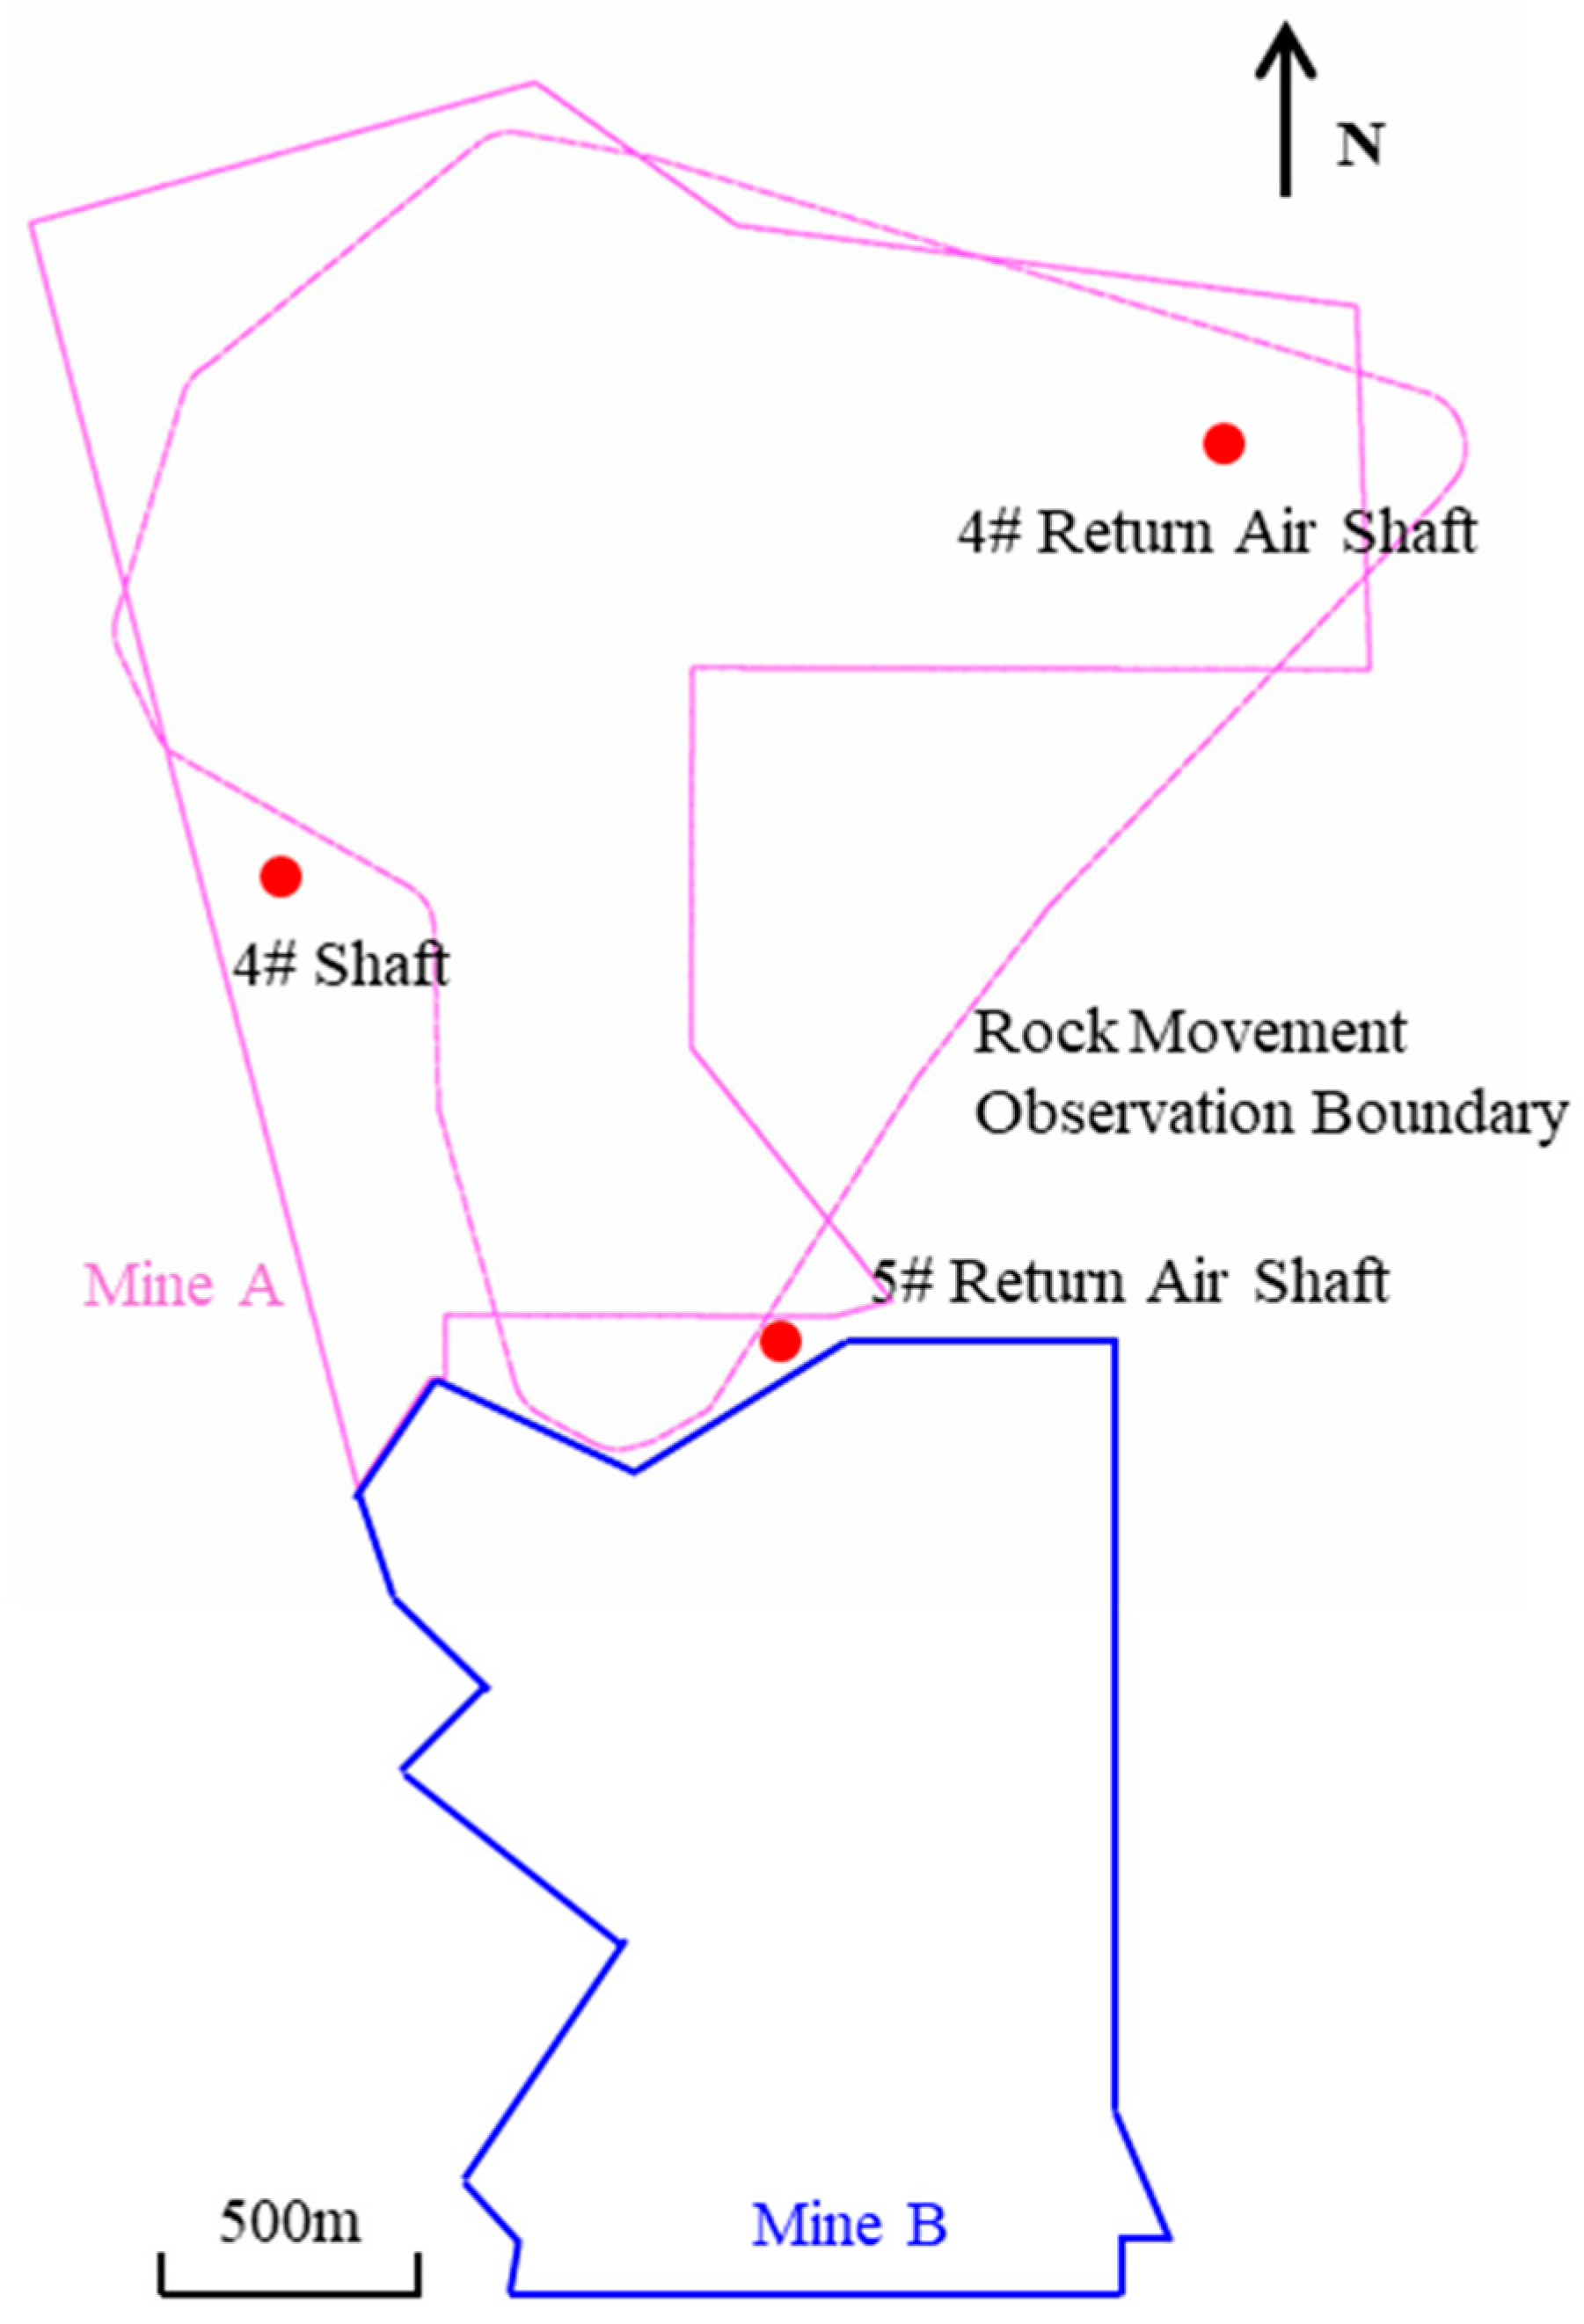
Figure 1. Mine plan showing the locations of Mine A and Mine B and their spatial relationship.
Applsci 15 12424 g001
Figure 2. Schematic Diagram of Surface Movement and Deformation Calculation for 4# Return Air Shaft.
Applsci 15 12424 g002
Figure 3. Impact of Ore Body Extraction on Surface Monitoring Point Deformation and Movement. The horizontal axis represents the monitoring points A1 to A8. The maximum deformation standards specified in the regulation are: inclination ≤ 3.0 mm/m, curvature ≤ 0.2 × 10⁻³/m, and horizontal deformation ≤ 2.0 mm/m. (a) Subsidence (b) Inclination (c) Curvature (d) Horizontal displacement (e) Horizontal Deformation.
Applsci 15 12424 g003
Figure 4. The Process of Establishing the Three-Dimensional Engineering Mechanical Model. (a) Sectional View of the Copper Pit Deposit along Exploration Line 27; (b) Final Orebody Sectional Line; (c) Three-Dimensional Solid Geological Mechanics Model; (d) Preliminary Model of the Ore Body.
Applsci 15 12424 g004
Figure 5. Principal Stress and Displacement Cloud Maps of Overlying Strata under Underground Mining (a) Maximum Principal Stress Cloud Map; (b) X-direction Displacement Cloud Map; (c) Y-direction Displacement Cloud Map; (d) Vertical Displacement Cloud Map.
Applsci 15 12424 g005
Figure 6. Plastic Zone Cloud Map of Overlying Strata under Underground Mining.
Applsci 15 12424 g006
Figure 7. Principal Stress and Displacement Cloud Maps of 4# Shaft Surrounding Rock under Ore Body Underground Mining (a) Maximum Principal Stress Cloud Map; (b) X-direction Displacement Cloud Map; (c) Y-direction Displacement Cloud Map; (d) Vertical Displacement Cloud Map.
Applsci 15 12424 g007
Figure 8. Plastic Zone Cloud Map of 4# Shaft Surrounding Rock under Underground Mining.
Applsci 15 12424 g008
Figure 9. Principal Stress and Displacement Cloud Maps of 5# Return Air Shaft Surrounding Rock under Ore Body Underground Mining (a) Maximum Principal Stress Cloud Map; (b) X-direction Displacement Cloud Map; (c) Y-direction Displacement Cloud Map; (d) Vertical Displacement Cloud Map.
Applsci 15 12424 g009
Figure 10. Plastic Zone Cloud Map of 5# Return Air Shaft Surrounding Rock under Underground Mining.
Applsci 15 12424 g010
Figure 11. Surface Displacement Cloud Map of Mine A under Ore Body Extraction (a) Vertical Displacement (b) X-direction; (c) Y-direction.
Applsci 15 12424 g011
Figure 12. Cloud Map of the Impact of Combined Ore Body Extraction from Adjacent Mining Areas on the Surface (a) Maximum Principal Stress Cloud Map; (b) X-direction Displacement Cloud Map; (c) Y-direction Displacement Cloud Map; (d) Vertical Displacement Cloud Map.
Applsci 15 12424 g012
Figure 13. Plastic Zone Cloud Map of the Impact of Combined Ore Body Extraction from Adjacent Mining Areas on the Surface.
Applsci 15 12424 g013
Figure 14. Surface Displacement Cloud Maps of Combined Ore Body Extraction from Adjacent Mining Areas (a) Vertical Displacement (b) X-direction; (c) Y-direction.
Applsci 15 12424 g014
Table 1. Physical and Mechanical Properties of Rock Samples.
Rock Sample TypeAverage ValueInternal Friction Angle/°Cohesion
/MPa
Uniaxial Compressive Strength
/MPa
Tensile Strength
/MPa
Elastic Modulus
/GPa
Poisson’s Ratio
Shallow Siliceous Rock124.288.3133.8570.22336.6016.07
Small Pebble Limestone118.945.2334.5770.31339.7812.47
Deep Siliceous Rock84.116.4230.9990.22735.4611.62
Wide Strip Limestone129.553.4737.3780.25742.8510.60
Ore191.3712.0937.9340.29937.0724.05
Tailings Cemented Fill1.690.521.6700.13619.170.47
Table 2. Comprehensive Values of Engineering Rock Mass Mechanical Parameters.
LithologyElastic Modulus (GPa)Poisson’s RatioUnit Weight (t/m3)Cohesion (MPa)Internal Friction Angle
(°)
Tensile Strength (MPa)
Mudstone6.300.302.631.17321.12
Small Pebble Limestone27.200.262.661.90401.59
Wide Strip Limestone27.500.292.712.74432.39
Siliceous Rock28.500.242.682.50422.10
Reef Limestone11.640.2327.024.729.51.20
Ore Body19.760.142.802.45432.4
Fill Material0.880.282.260.17320.18
Table 3. Ore Body Size.
IDOre BodyDip Angle/°DepthDistance to Buildings/mRemarks
Strike Length/mDip Length/mOre Body Thickness/mLower Boundary/mUpper Boundary/mAverage/m
9411796372.15234172103131935# Return Air Shaft
958003943.61235482714102004# Return Air Shaft
969925193.98237573265418004# Shaft
Table 4. Calculation Results of Surface Building and Monitoring Point Movement and Deformation within the Ore Body Strike Boundary.
Surface Structure Expected Displacement DeformationSubsidence, W (mm)Inclination, i (mm/m)Curvature, K (mm/m2)Horizontal Displacement, U (mm)Horizontal Deformation, ε (mm/m)
4# Shaft2.710.090.00035.410.017
Monitoring Points within the Ore Body Strike RangeA14.620.090.000235.380.013
A21.670.030.000061.930.003
A34.770.090.000055.310.003
A44.230.090.000255.000.014
A52.710.090.000315.410.017
A64.230.090.000255.000.014
A72.650.060.000313.340.018
A81.070.030.000211.450.012
5# Return Air Shaft16.950.070.00016.79−0.01
Monitoring Points within the Ore Body Strike RangeA126.860.06−0.000145.66−0.014
A27.070.02−0.000041.77−0.004
A326.240.05−0.000175.06−0.017
A428.230.07−0.000107.07−0.010
A528.670.08−0.000058.28−0.005
A623.310.080.000017.720.001
A716.950.070.00016.79−0.01
A89.590.040.000094.280.009
4# Return Air Shaft7.310.08−0.000256.44−0.03
Monitoring Points within the Ore Body Strike RangeA17.310.05−0.000423.98−0.032
A27.230.09−0.000296.87−0.022
A37.310.10−0.000107.29−0.007
A45.570.15−0.0004611.54−0.035
A57.870.08−0.000456.44−0.034
A66.280.10−0.000177.29−0.013
A73.930.090.000046.890.003
A81.590.060.000144.790.011
Note: The sign convention for inclination: positive for movement towards the strike direction, negative for movement in the opposite direction; the sign convention for curvature: convex upward on the surface subsidence curve is positive, concave downward is negative; positive horizontal deformation indicates tensile deformation, negative value indicates compressive deformation; the sign convention for horizontal displacement: positive for movement towards the strike direction, negative for movement in the opposite direction.
Table 5. 4# Shaft Movement Deformation Results.
Surface Structure Expected Displacement DeformationInclination i (mm/m)Curvature K
(mm/m2)
Horizontal Deformation εx
(mm/m)
Horizontal Deformation εy
(mm/m)
Horizontal Deformation ε
(mm/m)
Numerical Calculation0.0270.00010.00830.0080.011
Theoretical Analysis0.090.0003--0.017
Error Comparison70%66.6%--35.3%
Table 6. 5# Return Air Shaft Movement Deformation Analysis.
Surface Structure Expected Displacement DeformationInclination
i (mm/m)
Curvature K
(mm/m2)
Horizontal Deformation εx
(mm/m)
Horizontal Deformation εy
(mm/m)
Horizontal Deformation ε
(mm/m)
Numerical Calculation0.0450.000220.0010.0010.0014
Theoretical Analysis0.090.0003--0.017
Error Comparison50%26.7%--91.8%
Disclaimer/Publisher’s Note: The statements, opinions and data contained in all publications are solely those of the individual author(s) and contributor(s) and not of MDPI and/or the editor(s). MDPI and/or the editor(s) disclaim responsibility for any injury to people or property resulting from any ideas, methods, instructions or products referred to in the content.