Article

Assessment Methodology for Treatment Fluid Efficiency in Modifying Filtration Properties of Porous Rocks

Oil and Gas Institute—National Research Institute, 25A Lubicz Str., 31-503 Krakow, Poland
*
Author to whom correspondence should be addressed.
Appl. Sci. 2025, 15(23), 12415; https://doi.org/10.3390/app152312415 (registering DOI)
Submission received: 2 October 2025 / Revised: 1 November 2025 / Accepted: 20 November 2025 / Published: 23 November 2025

Abstract

One of the main application areas for treatments modifying the filtration properties of porous rocks, besides improving the sealing of landfills, reducing water hazards in mine workings, and eliminating water permeability in geoengineering works, is hydrocarbon exploitation. Among the available solutions, chemical methods are considered most effective, using treatment fluids injected into water-bearing layers. The decision to perform a modification treatment using a particular treatment fluid must, in each case, be preceded by a laboratory simulation of its technological effectiveness. This article presents research aimed at developing a methodology for reliable evaluation of treatment fluids used to modify the filtration properties of porous rocks. In addition to standard flood tests, additional methods were applied, notably X-ray computed tomography, which enabled non-destructive visualization of gel barriers in rock pores. Microscopic analysis of thin sections also supported pore space characterization. Research conducted on sandstone samples with the Multizol treatment fluid, developed at the Oil and Gas Institute—National Research Institute, confirmed the outcomes of flood tests and Residual Resistance Factor (FRR) calculations. Integration of all the results enhanced the reliability of the effectiveness assessment, which may be crucial for optimizing performed treatments, especially under the variable geological conditions and petrophysical parameters of rocks of the near-wellbore zone.

1. Introduction

The modification of filtration properties is most commonly applied to porous rocks [1]. Reducing the inflow or modifying the flow paths of reservoir fluids (water) into oil or gas production wells [2,3], improving the sealing of landfills [4], reducing water hazards in mine workings [5,6], or eliminating water permeability in geoengineering works are some of the various applications of these treatments [7,8].
One of the main issues accompanying the exploitation of oil and gas reservoirs is the inflow of reservoir water into production wells. This issue is prevalent, especially in the late phase of production, but can also occur in early stages [9,10]. Among chemical methods designed to counteract water inflow through selective injection of treatment fluids into the near-wellbore zone pore space, these techniques occupy a significant position [11,12]. In these cases, it is unnecessary to use mechanical isolation techniques to separate water-bearing layers, as the treatment fluid can be injected into the entire perforated interval. Treatment fluids meeting these criteria include, among others, RPM (Relative Permeability Modification) and DPR (Disproportionate Permeability Reduction) systems, which have been used since the early 1980s; after injection, these fluids adsorb on the reservoir rock, leading to a significant and selective reduction in the permeability of the water-bearing layers [13,14]. Another type of system that selectively modifies the filtration properties of porous rocks includes emulsion-based fluids. The first concepts developed date back to the 1990s and were based on the injection of macroemulsions—typically of a relatively high viscosity—into the pore space of the near-wellbore zone. However, these systems demonstrated low effectiveness, with the barriers exhibiting limited strength [15,16]. This work laid the foundation for subsequent research in which silicone-based microemulsions, after mixing with reservoir water, transformed into macroemulsions [17,18]. The method relies on phase inversion, i.e., the transition of a microemulsion (a micro-heterogeneous system) into a macroemulsion (a macro-heterogeneous system) upon a change in the ratio of the organic to aqueous phase. Further studies, initially conducted by German researchers at Clausthal University of Technology and later in cooperation with specialists from the University of Miskolc in Hungary, confirmed the occurrence of phase inversion within the pore space of near-wellbore rocks upon contact of the injected microemulsion with reservoir water [17,19]. These developments ultimately led to field applications in gas reservoirs in Hungary [20,21,22,23]. This technology differs significantly from RPM and DPR systems, enabling more extensive reservoir intervention and the formation of durable gel barriers with extended wellbore coverage, which restrict reservoir water inflow without reducing hydrocarbon production. The micellar treatment fluid is injected into the entire reservoir interval, both gas layers and water-bearing layers, but the gel barrier is formed primarily within the water-bearing zone. Analysis of extensive rheological and core flood test results on Fontainebleau sandstone samples revealed that optimal gelation occurs at water contents between 20% and 40%. Rheological tests demonstrated that system viscosity increases dramatically during phase inversion, by up to three orders of magnitude. A key limitation of these fluids is their limited salinity tolerance, which is typically below 1.5% [19,23]. To expand the application of micellar treatment fluids to Polish conditions, the Oil and Gas Institute—National Research Institute developed fluids capable of gelling in contact with brine of a salinity exceeding 15% [24].
Prior investigations conducted in the Department of Petroleum Engineering at the Oil and Gas Institute demonstrated the high effectiveness of Multizol micellar treatment fluid in controlling formation water inflow (5% NaCl) into producing gas wells. These findings are confirmed by the results of flood tests conducted on porous rock samples and artificial packs built from glass beads/quartz sand mixtures. For both types of gas layer models, there was no reduction in filtration properties (FRR coefficient close to 1), attributed mainly to a suitably low value of irreducible brine saturation matching reservoir conditions. Analysis of data for water-bearing layer models reveals effective modification (reduction) of filtration properties, particularly in rock sample studies (FRR coefficient in the range of 15 to 20). Results for the artificial packs similarly indicate reduced filtration properties following treatment with the injection fluid, with values slightly lower than those observed in porous rock samples (FRR = 10) [25]. Core flood tests, as reported in reference [24], were conducted on porous rock samples to assess the effectiveness of filtration property modification using the RWP factor, which quantifies the percentage reduction in fluid flow rate relative to pre-treatment baseline conditions. The results indicate no impairment of filtration properties in the gas zone (RWP: 66.7–80.0%) and a near-complete blockage of water flow in the water zone (RWP: ~0%), demonstrating the high effectiveness of Multizol micellar treatment fluid in contact with the formation water (15% NaCl).
This publication reports the results of work aimed at expanding the research methodology for a complete and reliable technological effectiveness assessment of treatment fluids for modifying the filtration properties of porous rocks. The work was based on laboratory flood tests conducted on sandstone core samples characterized by mercury porosimetry (MICP). To verify the results, additional studies were carried out, namely X-ray computed tomography (µCT) and microscopic analysis of polished thin sections. This research continues previous laboratory investigations into the effectiveness of treatments modifying the filtration properties of porous rocks, conducted within the Department of Petroleum Engineering at the Oil and Gas Institute—National Research Institute.

2. Methods

To fully assess the technological effectiveness of treatment fluids and increase the reliability of reported results, a research plan was devised, as diagrammed in Figure 1.
The starting point of the conducted research was core flood tests, representing the most commonly used laboratory method aimed at characterizing the course and evaluating the effectiveness of filtration property modification treatments. The tests were performed on porous rock samples using TEMCO research equipment, enabling flow tests to be conducted under simulated reservoir conditions [26]. The key component of the apparatus was a multi-tap core holder equipped with a pressure sensor system positioned along the core’s circumference, which allowed the determination of zones (I–IV) and the pressure drop values (ΔPI–ΔPIV) across the fluid flowing through the pore space. Based on this, it was possible to determine the filtration properties of the sample along its longitudinal axis. A complete description of the measurement apparatus is available in the publication [25]. Measurements of effective permeability for gas and absolute permeability for brine were performed under similar conditions. A constant pressure drop of approximately 0.017 MPa/cm (2.5 psi/cm) across the sample was maintained, determining the gas/brine injection rate. The uncertainty of the permeability measurement results was estimated based on the accuracy class of the key elements of the apparatus and, based on this, may range within ±0.25 mD. At each stage (permeability measurements and treatment fluid injection), a constant confining pressure of approximately 10 MPa (~1500 psi), corresponding to overburden pressure, was maintained. All measurements were conducted at 25 °C using a 15% NaCl brine solution. The degree of filtration property modification was determined by the FRR (Residual Resistance Factor) as defined in [10,27,28]:
FRR = k0/kk [-]
where
k0—permeability coefficient measured prior treatment fluid injection;
kk—permeability coefficient measured after treatment fluid injection.
Depending on the simulation scenario, FRR was based on the following:
  • Effective permeability for gas, as a simulation of changes in the gas zone (porous rock samples marked as RG);
  • Absolute permeability for brine, as a simulation of changes in the water-bearing zone (porous rock samples marked as RW).
The main experimental block of the expanded methodology—and also the verification tool for flood test data—was the set of supplementary investigations. The most critical among them were X-ray computed tomography and microscopy of polished thin sections. During core selection, mercury porosimetry was performed for some samples. A detailed description of the experimental methodology is presented further in this publication.
The adopted methodology may be further enhanced through numerical modeling to assess how permeability modification in the near-wellbore zone affects reservoir water inflow into production wells. Three-dimensional geological modeling that integrates structural and lithofacies models as well as spatial distributions of petrophysical parameters enables the visualization of the geological environment [29]. When combined with dynamic modeling of reservoir fluid flow within the geological medium, such visualized data can serve as a useful tool in assessing the effectiveness of impermeable isolation barriers [30]. It is important that the data obtained from these simulations (dynamic simulations) allow for further advancement of analytical studies and the recognition of mechanisms governing the processes involved [31,32,33,34].

2.1. X-Ray Computed Tomography

X-ray computed tomography represents an example of non-destructive testing methods, whose appearance was a significant event in the scientific world. Its original application was in medicine, where it was used to reconstruct internal properties of objects in two- and three-dimensional scales. Currently, X-ray computed tomography, both at macro and micro scales, is used in many other fields of science [35,36,37].
The use of X-ray computed tomography in geology first took place in 1974 [38]. Initially, it served mainly for visualization of geological structures; over time, possibilities for performing various calculations based on obtained images were also developed [39]. One field in which X-ray computed tomography is particularly utilized is petrophysics. Adaptation of microtomography (µCT) methods for rock sample characterization provides the possibility of obtaining complete information concerning both the skeleton of porous material (rock sample) and the pore space itself. Appropriate processing of three-dimensional images enables obtaining data on porosity, number, and length of pore channels; their connections, directions, and structure of pore networks; and the influence of these features on rock permeability [40,41]. Over the years, numerous studies have also been conducted regarding transport and flow through pore spaces of immiscible fluids—i.e., crude oil or reservoir water [42]. X-ray computed tomography results enable, among others, monitoring the course of injection processes and efficiency of formation fluid displacement, as well as using artificial porous media built from glass packs [43]. Another research area is the assessment of near-wellbore zone damage—based on X-ray computed tomography, it was possible to obtain information about decreased or increased rock permeability in the immediate vicinity of wellbores [44]. The discussed method has also been adopted in drilling technology, specifically for characterization of cement slurry structure [45]. The literature data cited above clearly indicate the wide application of X-ray computed tomography methods in scientific research. Further development of tomography, as well as increasingly new areas and methods of its utilization, will undoubtedly contribute to expanding knowledge in the broadly understood fields of geology and drilling.
This research utilized two tomographic systems housed in the Department of Well Logging Geophysics at the Oil and Gas Institute—National Research Institute: the Geotek RXCT X-ray tomograph (Geotek Limited, Canterbury, UK) [46], optimized for core analysis, and the Benchtop CT160Xi microtomography system (Nikon Metrology, Tokyo, Japan; manufactured in Tring, UK) [35]. Measurement parameters for RXCT and Benchtop CT160Xi were as follows: voxel size: 27 µm and 18 µm; tube voltage: 130 kV and 140 kV; filters: copper (0.25 mm diameter) and copper (0.5 mm diameter); and segmentation method (both equipment): binarization along image boundaries. ImageJ (Fiji v.2.9.0) and Avizo 3DPro v.2022.1 (Thermo Fisher Scientific, Waltham, MA, USA) software were used for processing and presentation of research results. Based on obtained data, for each sample, it is possible to perform quantitative characterization consisting of dividing objects/subgroups into seven classes according to their volume. The unit of class volume is voxel; each class consists of groups of connected pores, which are not communicating with pore groups of other classes [35].

2.2. Microscopic Image Analysis

Microscopic image analysis is a source of various types of data, including real sizes, shapes, and pore size distributions. This study can account for the occurrence of interlayers, laminations, or other “disturbances” occurring in the rock [47,48].
Microscopic analysis was conducted on polished thin sections using a Zeiss Axio Imager M2 microscope (Carl Zeiss MicroImaging GmbH, Göttingen, Germany) equipped with a digital camera connected to a computer and a motorized stage. Essential for proper measurement execution is appropriate preparation of the porous rock sample. This involves impregnation with blue dye-colored resin under vacuum, followed by heating at temperatures from 60 °C to 70 °C. Such preparation ensures no interference with the structure and texture of the rock sample and allows for more complete identification of open porosity.

3. Materials

During preliminary laboratory work, 10 cores (porous rock samples) were prepared and characterized in terms of basic petrophysical parameters. The results of five selected samples are presented in Table 1. The data below indicate mostly similar values of determined parameters. Values for the absolute permeability of gas (technical nitrogen) range from 14.21 (sample RG1) to 56.36 mD (sample RW1), pore volume variability ranges from 11.23 (sample RW2) to 13.69 cm3 (sample RW1), and porosity ranges from 18.11 (sample RG1) to 20.15% (sample RW1).
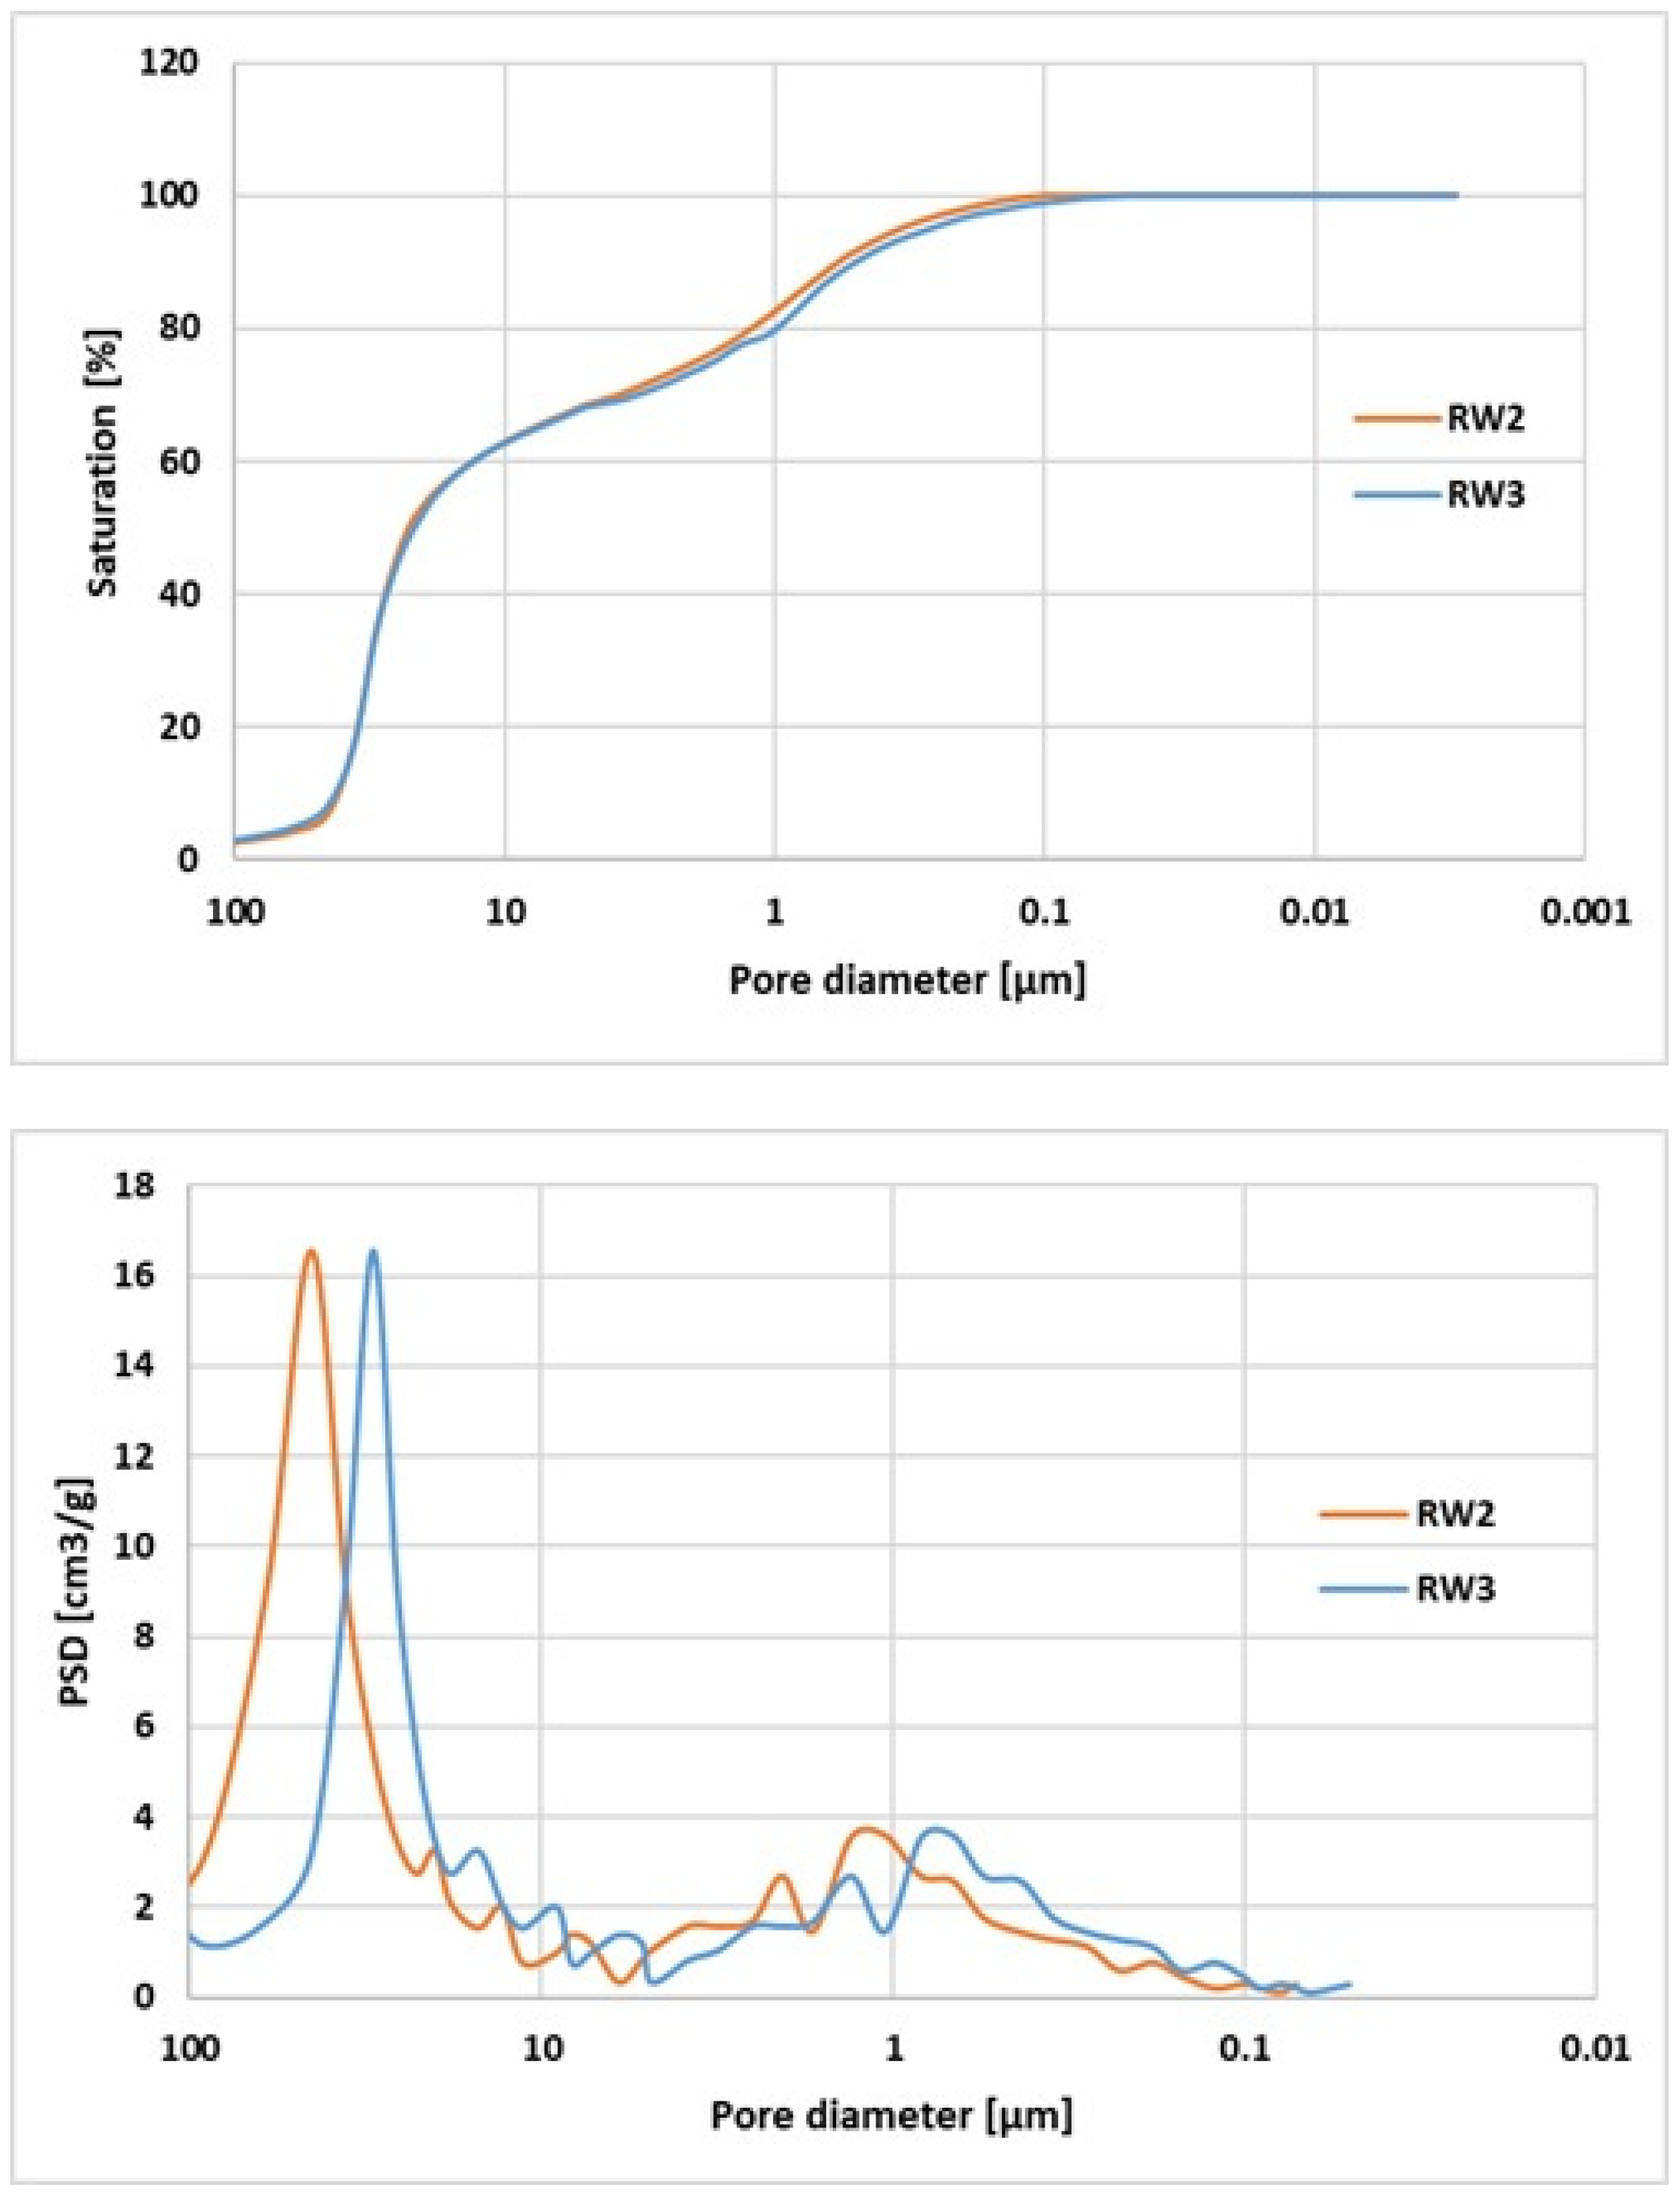
One of the most useful and commonly applied methods for characterizing porous materials is mercury porosimetry (MICP), whose results combined with data obtained from helium pycnometry provide a range of information about the internal structure of porous media [49]. The aforementioned analyses were performed for two samples—RW2 and RW3, with the results summarized in Table 2. The basic purpose of the conducted work was the characterization of pore space in both samples and the assessment of their similarity degree. This information was important for further planned work on the studied samples—performing comparative computed tomography and analysis/confirmation of filtration property modification degree in comparison with flood test results. Among the determined parameters, the most important is effective porosity, which determines the number of pores participating in reservoir fluid flow through pore space [50], amounting to 19.20% (sample RW2) and 19.75% (sample RW3). The second important set of information is the percentage pore distribution [50]—in both cases, the pore system is dominated by megapores [>10 µm], which constitute 62.18% (sample RW2) and 62.0% (sample RW3). The mercury saturation curves of pore space and pore diameter distribution curves presented in Figure 2 additionally confirm very similar pore space development in both samples.
In the research, a 15% sodium chloride (NaCl) solution was used as the reservoir water, for which the density and dynamic viscosity were determined (Table 3) at a temperature of 25 °C.
The micellar treatment fluid used in the studies, Multizol, was developed at the Oil and Gas Institute—National Research Institute. Similarly to reservoir fluids, its density (0.84 g/cm3) and dynamic viscosity (6.1 cP) were determined at a 25 °C measurement temperature. The fluid is characterized by the ability to form a microemulsion in situ with reservoir water and gel, blocking water inflow. The fluid formulation consists of dispersions of amphiphilic surfactants, which exhibit characteristic molecular self-organization behavior, forming multi-molecular aggregates—micelles [25,51,52].

4. Results

Studies evaluating the effectiveness of micellar treatment fluid for selective blocking of reservoir water inflow to gas wells were conducted on rock cores (R) simulating fluid injection treatment to both the gas layer (RG) and water-bearing layer (RW). The results are summarized in Table 4.
Analysis of data from the gas layer (samples RG1 and RG2) shows no indication of changes (reductions) in their filtration properties. The obtained FRR coefficient values for individual zones are close to unity, ranging from 1.25 (zone II) to 1.37 (zone III) for sample RG1, and from 1.15 (zone I) to 1.28 (zone IV) for sample RG2. The coefficients for the whole samples are also low, measured at 1.32 and 1.24, respectively. In these cases, the irreducible saturation with reservoir water was 9.14% and 10.72%, which played a decisive role in the successful test outcomes. The relationship between the saturation level and FRR coefficient (for both the entire sample and individual sections) indicates, as confirmed by flood test results reported in other studies [25], that the higher the irreducible saturation of brine, the higher the FRR coefficient for the entire sample, and the greater the extent of filtration property changes in individual zones. Treatment simulations in layers with reservoir water inflow to the well were performed on three samples. The results confirm a modification (reduction) of filtration properties. This effect is especially pronounced for sample RW3, where the FRR coefficient rises sharply across zones I to III: 2.65, 14.73, and 38.91, respectively. The overall FRR coefficient for this sample is also high at 15.46. During the simulation for this sample, near-wellbore zone cleaning was applied by injecting a small volume of nitrogen before the treatment fluid. This process aimed to dry (clean) the pore space in zone III (and subsequent zones) to allow the treatment fluid to penetrate deeper into the sample without premature gelation. Sample RW1, similar to RW3, has a high overall FRR coefficient of 11.69. However, its zone-wise distribution varies, ranging from 1.03 in zone I to 13.67 in zone IV. The sample with the smallest filtration property changes following treatment is RW2. For this sample, the FRR coefficient ranges from 0.97 in zone I to 26.64 in zone III, with a total value of 9.55 for the whole sample. The filtration properties of RW1 and RW2, without the nitrogen drying treatment, showed significant reductions only in the terminal zones (III and IV for RW1 and III for RW2)—the treatment fluid reached a stable gel state over a much shorter distance.

4.1. X-Ray Computed Tomography

Within supplementary studies (X-ray computed tomography), two samples (RW2 and RW3) simulating a filtration property modification treatment in the water-bearing zone were analyzed. Figure 3 presents the results of this analysis for sample RW2. In this case, the scan was performed on a specific section of the core—approximately 4 cm from its right end, i.e., from the treatment fluid injection side. The scan location was selected to precisely determine changes in the pore space of the sample, related to its filling and, consequently, the blocking of brine flow through the gel formed from the injected treatment fluid. Analysis of the left image, corresponding to pore distribution in the sample before treatment fluid injection, indicates homogeneous pore space development. After treatment fluid injection and re-scanning of the sample, a modified pore space image was obtained (upper right corner of the sample image), which is interpreted as pore filling by gel within the indicated part of the core—right figure. X-ray computed tomography results for the entire RW3 sample are presented in Figure 4. In this case, the pore space distribution is also characterized by relative homogeneity (left figure). Treatment fluid injection and the formation of a gel insulating barrier (within the right end of the sample) were confirmed by the reduced number of pores identified in the tomographic image (right figure).
The results of volumetric pore classification (changes in volumetric share of determined classes) conducted before and after treatment fluid injection into the sample pore space are summarized in Table 5. Their analysis, in both cases, indicates an increase in the percentage share of pores in classes I-III (positive ∆%) and a decrease in classes IV and V (negative ∆%). These changes (classes I-III) can be interpreted as gel blocking of pores that were originally classified into different groups. This affects their volume reduction, translating into increased observation in repeated X-ray studies of smaller voids. Changes in classes IV and V result from (most likely) their greater filling by gel, caused by easier penetration by treatment fluid.
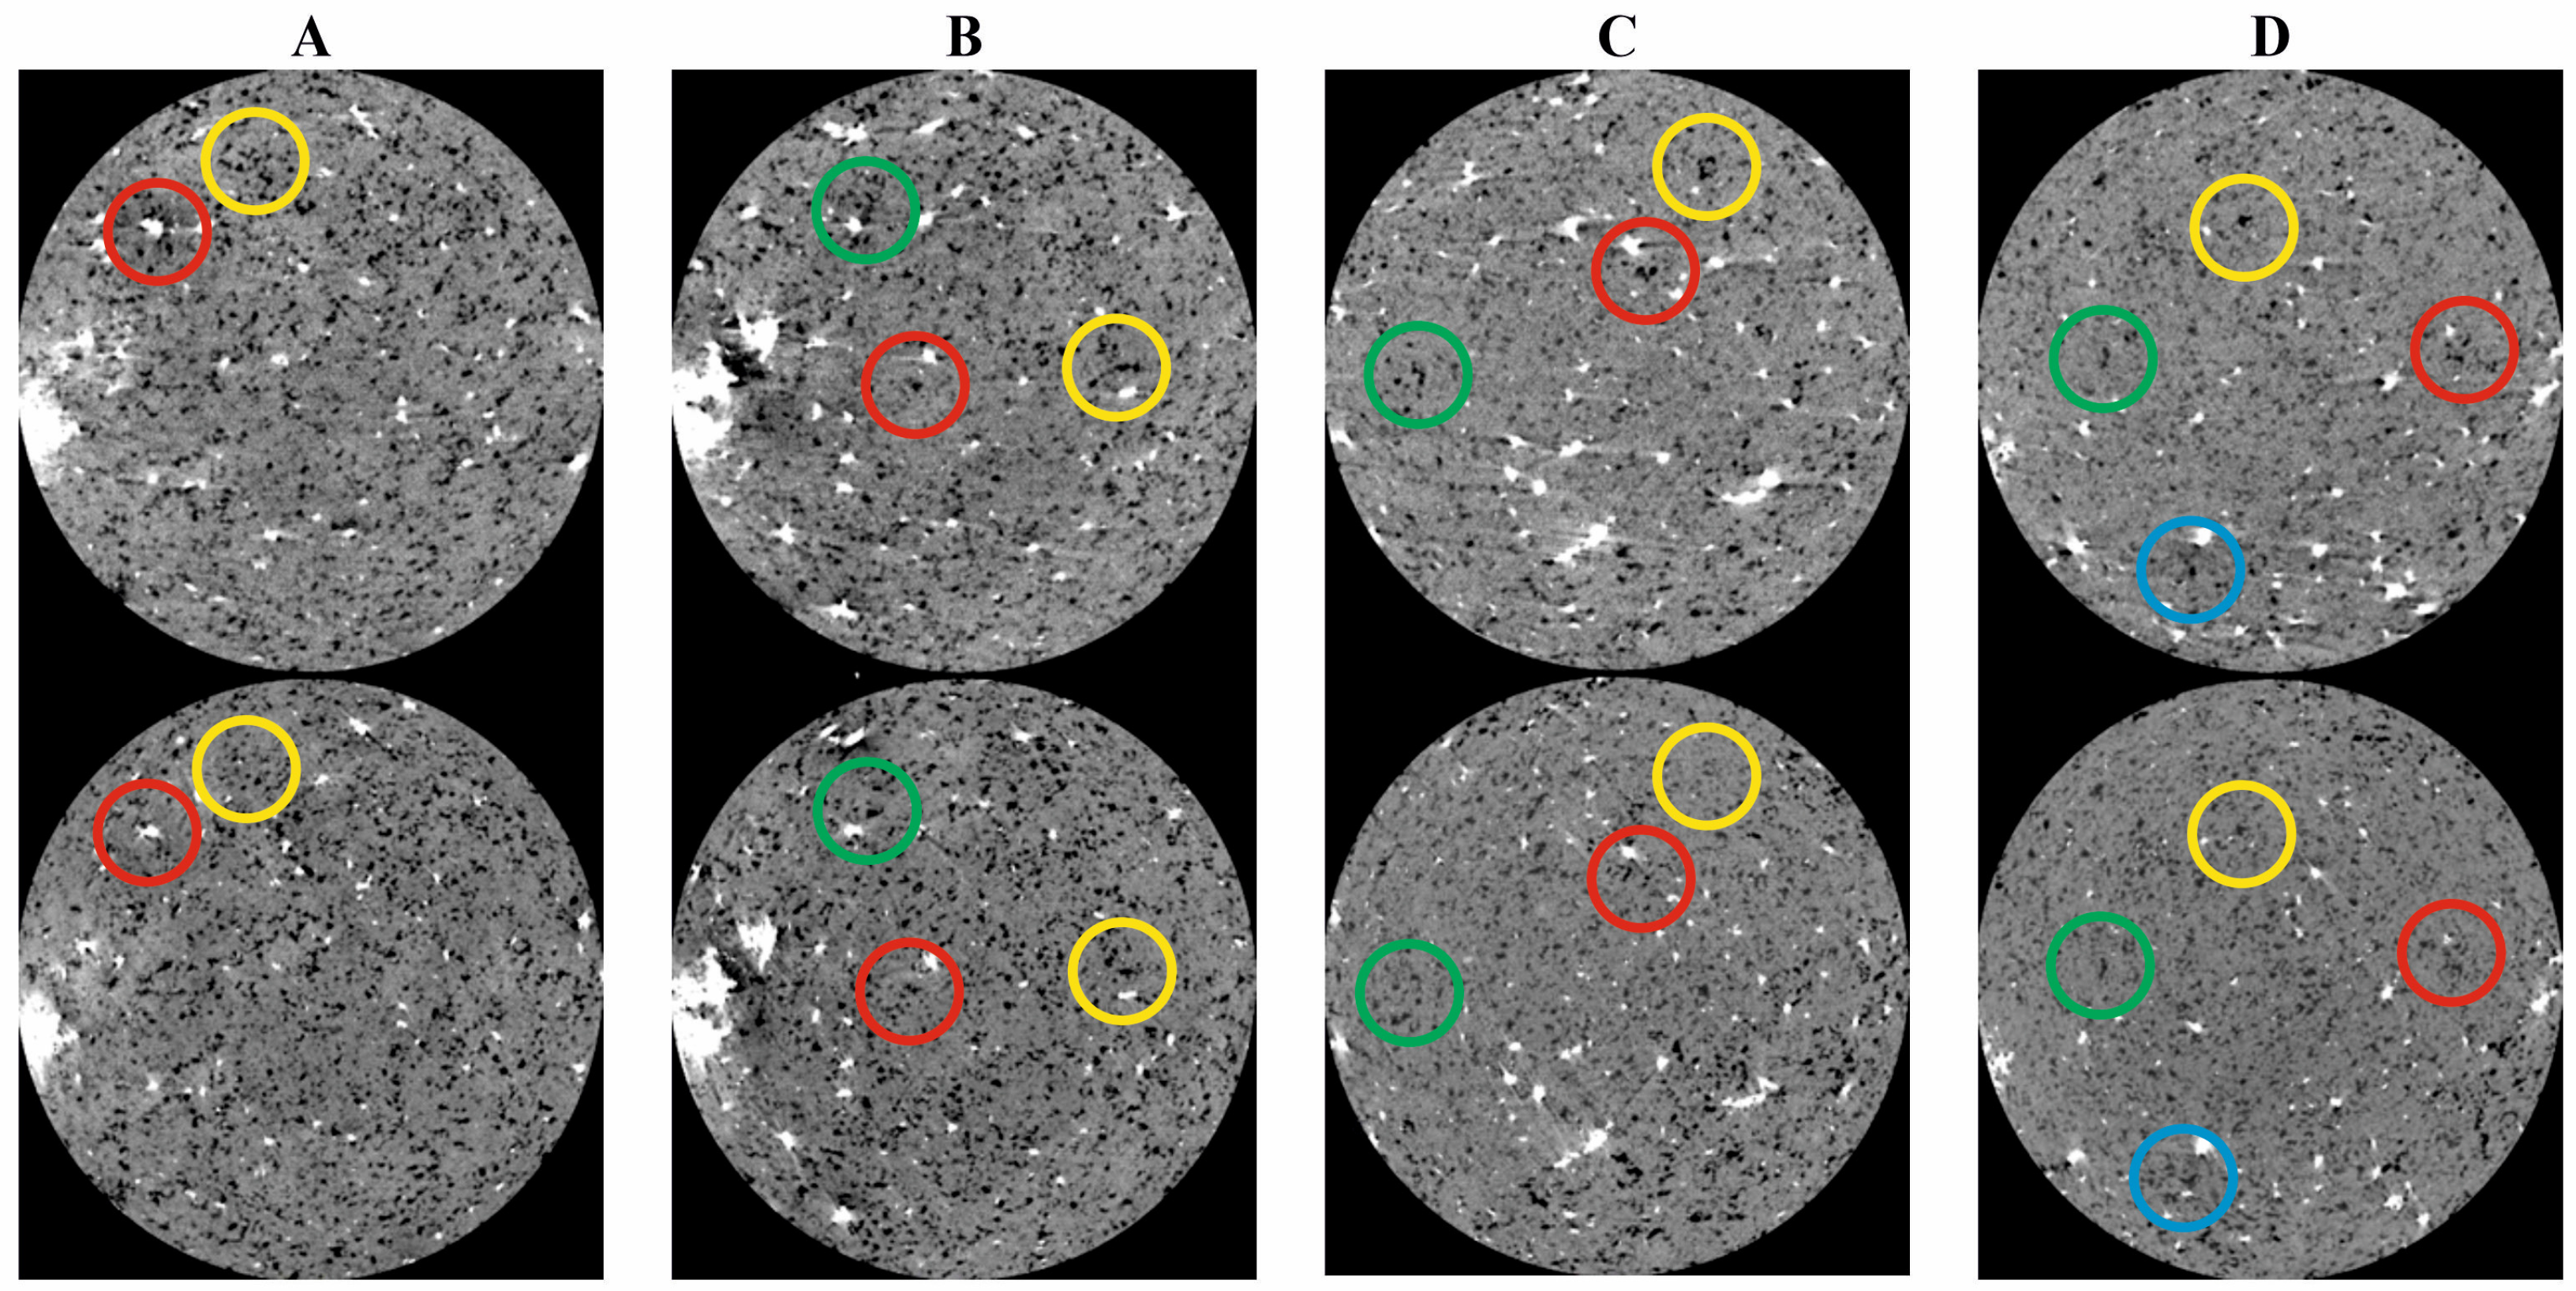
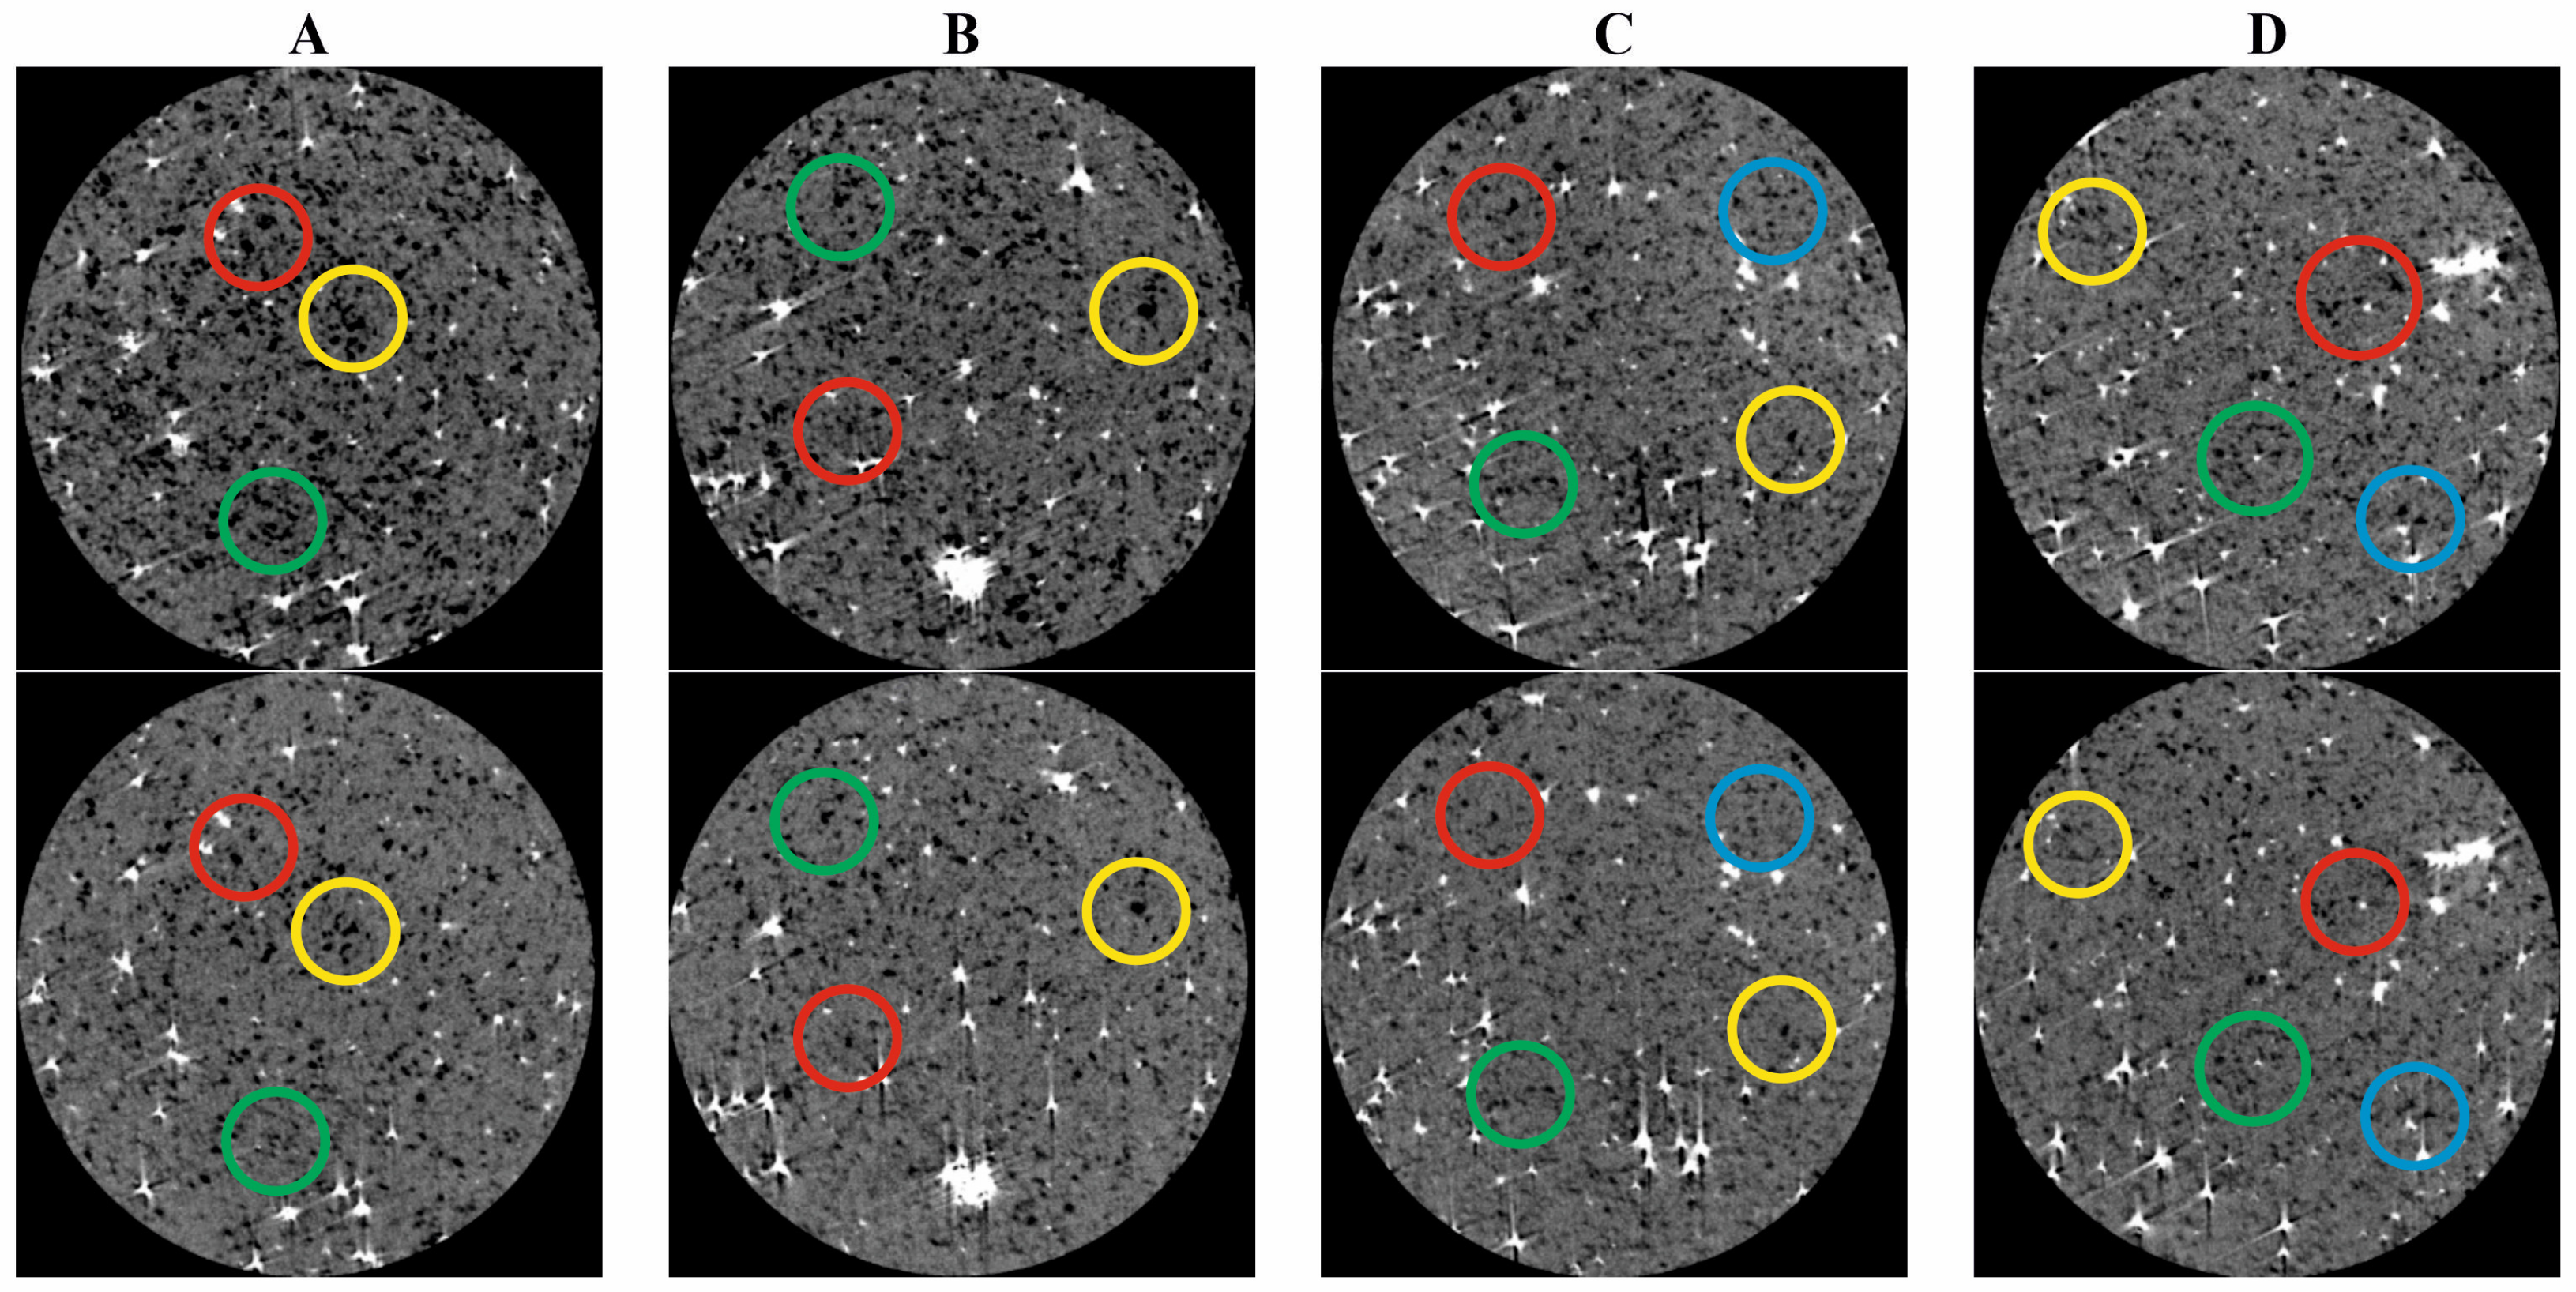
Tomographic images in Figure 5 and Figure 6 were used to create spatial pore distributions. Each pair of images represents a different sample fragment, marked as A, B, C, and D in Figure 3 and Figure 4. In the case of sample RW2 (Figure 5), images marked as “A” characterize the initial sample section from the left side (brine injection direction), and “D” from the right side (treatment fluid injection direction). Direct analysis of the following images confirms earlier conclusions regarding pore space changes; sample porosity decreases as a result of treatment fluid injection. Upper images represent pore distribution in a “clean” sample saturated with brine. Pore share (black areas) slightly changes (decreases) from image “A” to “D”—from the left to right side of the sample. The results of the tomographic study performed after fluid injection (lower images) indicate an increase in this tendency—examples of changes in pore space are marked with colored circles. Images in pairs “A” and “B” do not differ much from each other. Gel blocking of pore space occurs in sample A, to a small extent, in the IV quadrant of the core image. In the B images, the differences occur over a larger area, mainly in the I and IV quadrants. In the case of set “C,” a decrease in the black color share (pores) in the sample image can be observed over a much larger area; only the II quadrant is characterized by unchanged pore space. The greatest changes, i.e., the fewest identified pores, can be observed in set “D”, where only a small part of quadrant II is unchanged.
Analysis of the images compiled in Figure 6 enables a more detailed interpretation of pore space changes in sample RW3. The upper images show the pore distribution in individual core zones before treatment fluid injection. The sample porosity is highest from the brine injection side (left side, set “A”). As movement occurs along the longitudinal axis, the pore share decreases (right side, set “D”). Treatment fluid injected into the pore space, as a result of a reaction with reservoir water, transitioned to gel—affecting the change in the recorded tomographic image. Analysis of the lower images indicates a porosity decrease in each sample area represented by individual tomographic images. The left end area of the sample (A) is characterized by the highest porosity; the changes in pore distribution involve mainly smaller pores all over the cross-section of the sample. In the set of images “B”, the nature of the changes was similar; a reduction in pore size involves smaller pores—larger pores have been built up but flow through them was not possible. Differences between images in set “C” point to a reduction in pores on a larger scale; the porosity of the sample after the treatment fluid injection was visibly reduced. The right end of the sample—set “D”—has the lowest number of identified pores. This reduction in pore size occurs all over the cross-section.

4.2. Microscopic Image Analysis

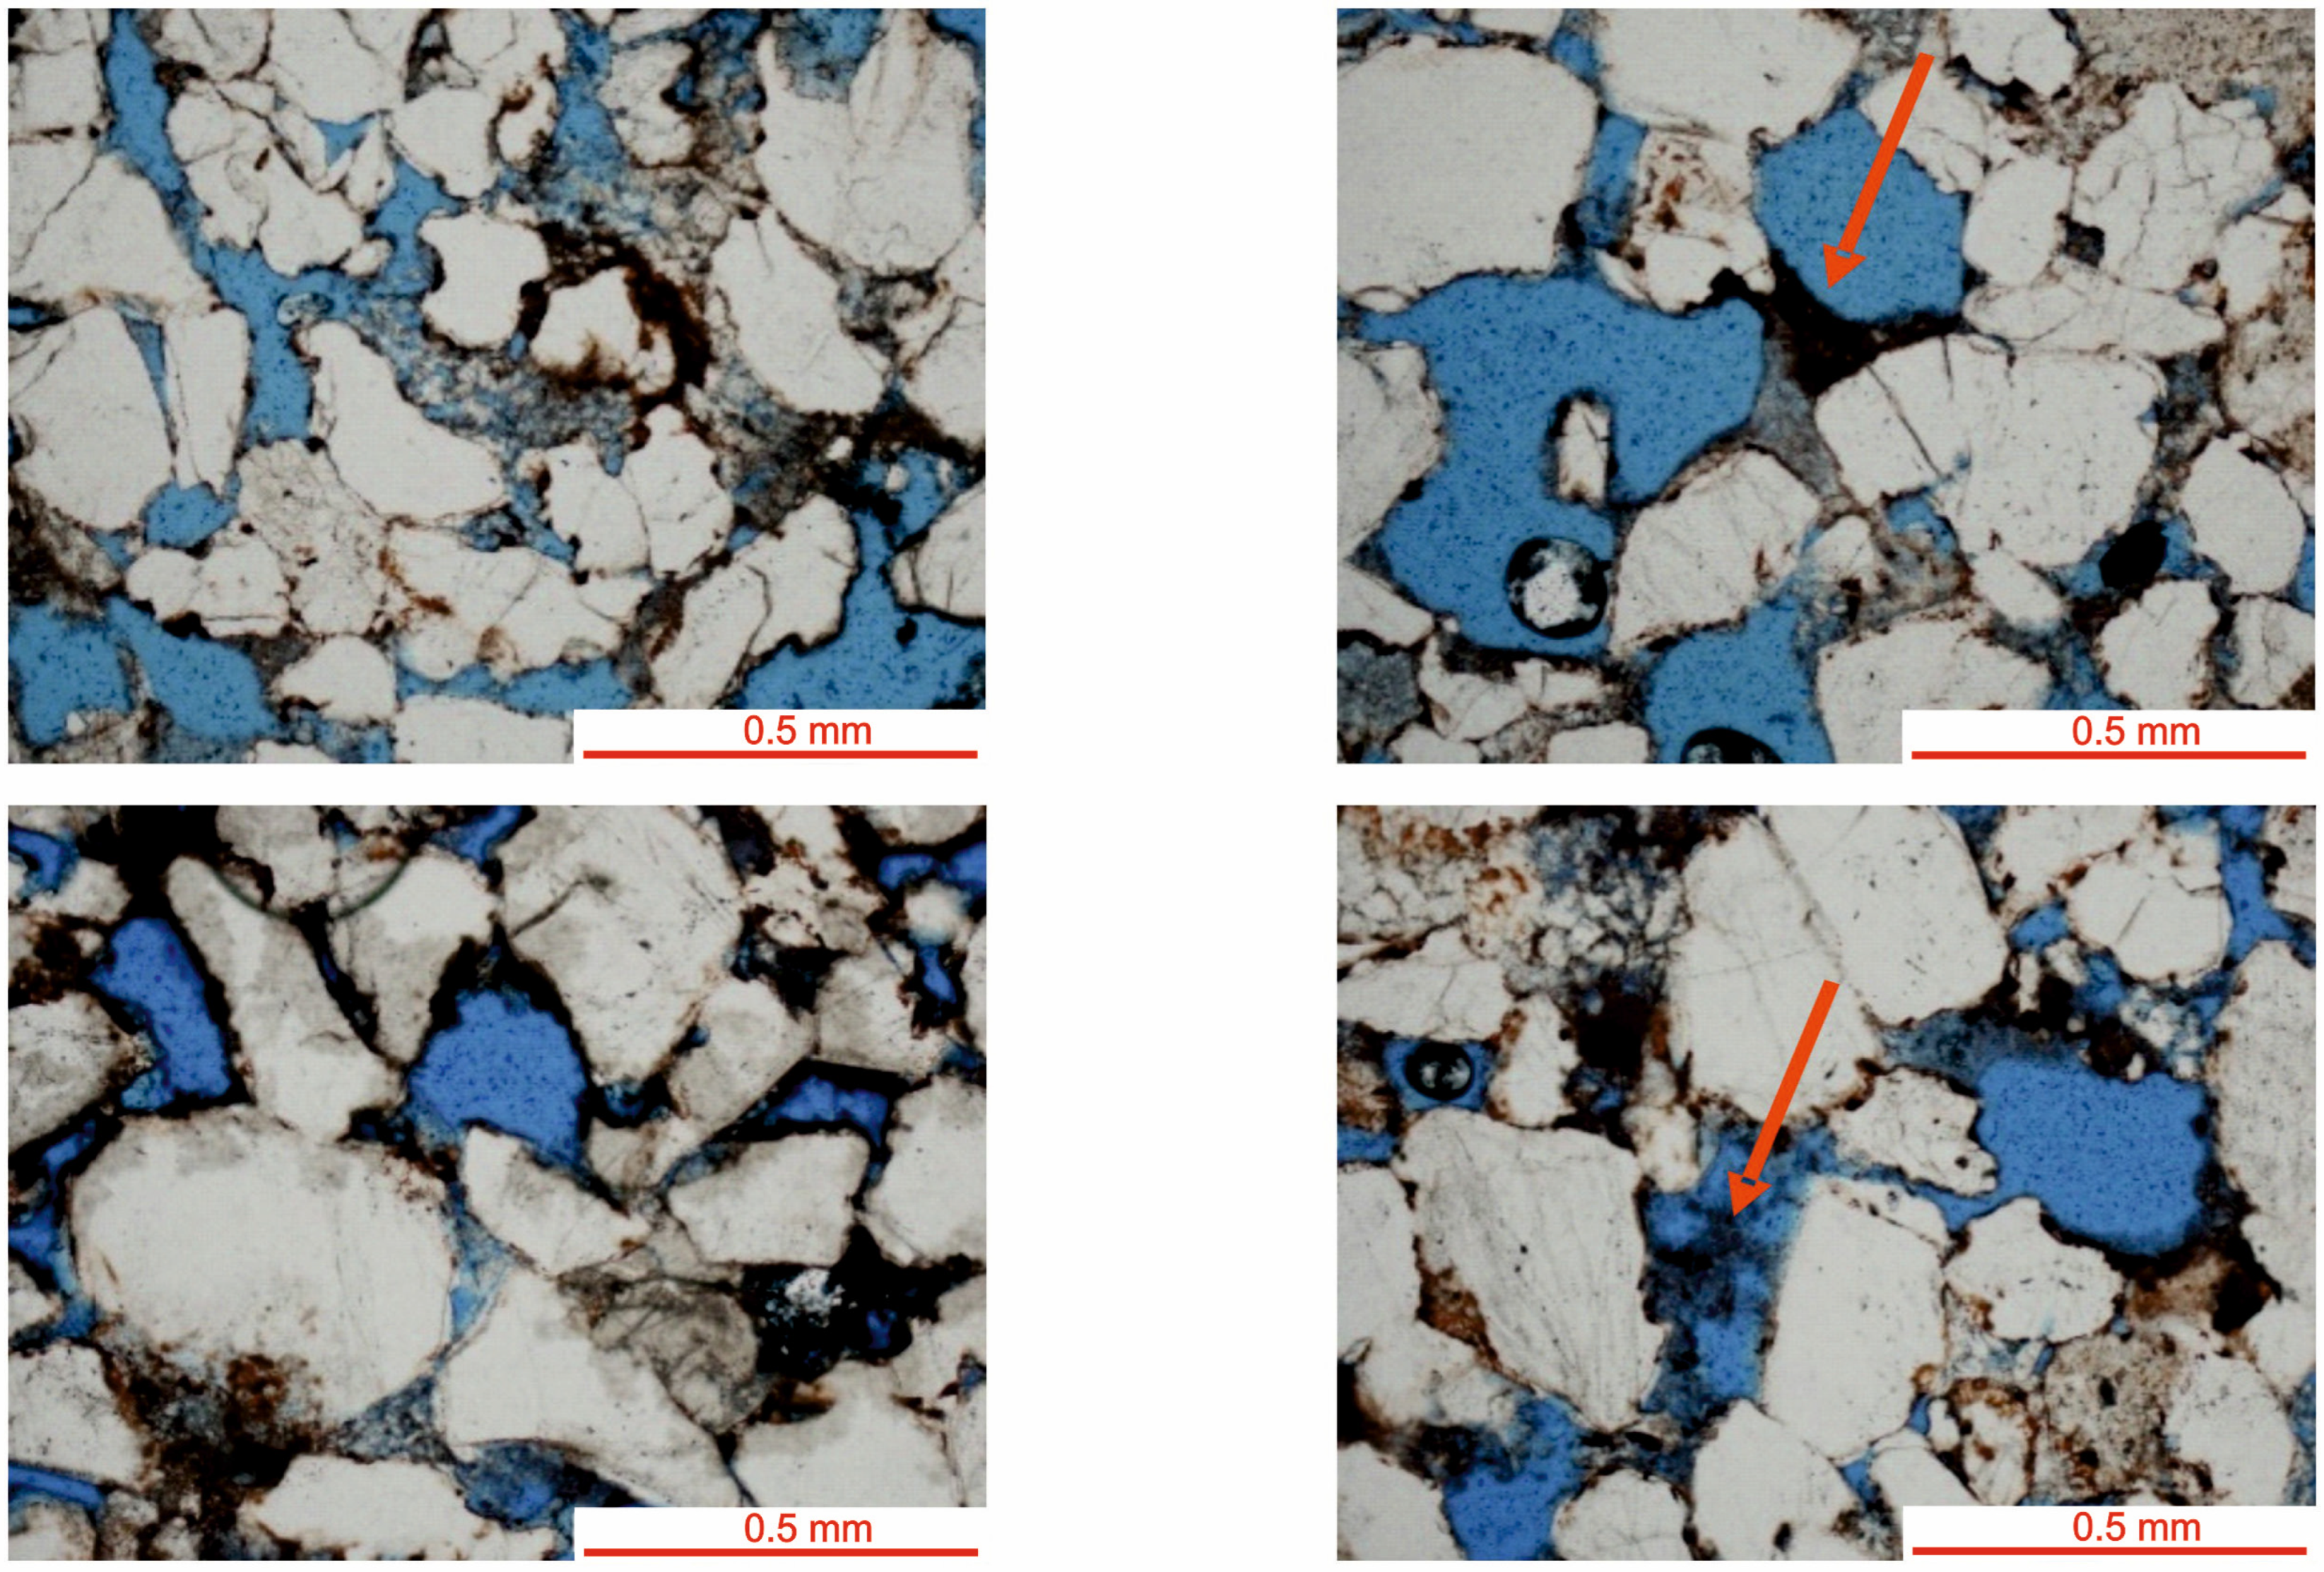
Microscopic analysis of polished thin sections was performed as a complementary confirmation of the flood test and X-ray computed tomography results. For each core sample (RW2 and RW3), two thin sections were sectioned from both sample ends—specifically from the brine injection and treatment fluid injection inlets—to evaluate pore space alterations caused by the gel blockage.
Analysis of the results compiled in Figure 7 (sample RW2) and Figure 8 (sample RW3) indicates that, in both cases, from the brine injection side, “clean” pore space can be observed, as well as iron hydroxide rims and blocking or “lining” of the pore space by these hydroxides. From the treatment fluid injection side, no influence of formed gel on skeleton grains was observed. Visible in the analyzed images are gel remnants colored by iron hydroxides (marked with arrows), which form bridges between grains and limit flow between them. Within the aforementioned “bridges,” no mineral fragments are visible, indicating that these are probably dried gel fragments (thin section preparation methodology requires sample saturation in a vacuum with colored resin and heating at a temperature of approximately 60–70 °C). The bridges observed in the sample pore space are probably pores that are entirely blocked (or their major part), and their current state and appearance is an effect of thin section preparation.

5. Conclusions

The research work conducted aimed to develop a measurement methodology to enable the assessment of the technological effectiveness of micellar treatment fluids used in treatments modifying the filtration properties of porous rocks. The presented research findings from flood tests, X-ray computed tomography, and microscopic image analysis confirm the validity of the adopted methodology. The integration of the obtained data clearly demonstrates that the approach to evaluating the degree, extent, and location of the gel insulating barrier formation is accurate. The studies carried out underscore the complexity of the issue of reservoir water inflow into production wells and highlight the continual need to seek optimal solutions.
Results from the simulation of filtration property modification treatments in the gas layer, based on the determined FRR coefficient values, indicate no gel insulating barrier formation within the pore space. Conversely, coefficient values determined for the water-bearing layer indicate a significant reduction in filtration properties. The obtained results cannot be directly compared with the results of previously conducted studies due to differences in the mineralization of the formation water used (5% NaCl) and the adopted coefficient for determining the degree of filtration property modification (RWP). Nevertheless, assuming the same mechanism of gel insulating barrier formation in the pore space of near-wellbore zone rocks resulting from the injection of Multizol treatment fluid, it should be accepted that the results presented in this article confirm the effective modification of filtration properties at elevated formation water mineralization up to 15% NaCl.
The conducted simulation of pore space drying with nitrogen, corresponding to near-wellbore zone cleaning, confirms (based on flow tests and analysis of tomographic images) an increase in the capability of injecting treatment fluid into further parts of the reservoir and an increase in the effectiveness of the formed gel insulating barrier for blocking water flow. FRR coefficient values determined for the two analyzed samples (RW2 and RW3), possibly with similar filtration parameters, indicate higher filtration property modification (reduction) by approximately one third. In order to conduct a more complete analysis of the effect of pore space drying with nitrogen on the sample, comparative studies on identical, preferably artificial, porous media are necessary.
Confirmation of the above results is provided by the interpretation of X-ray computed tomography data and microscopic analysis of polished thin sections. In the case of the first investigative method employed, the obtained results revealed changes in the pore space image as a result of gel insulating barrier formation. This is evident both in the tomographic images and in the distribution of pores across specific volumetric classes. In the case of the microscopic analysis of thin sections, which was conducted on sample fragments obtained from two ends of each core, the results indicate a “clean” pore space on the brine injection side with the occurrence of iron hydroxide rims occluding individual pores. The microscopic image of the pore space appears differently on the treatment fluid injection side, where the presence of residual gel forming “bridges” between grains was demonstrated, which affects the limitation of fluid flow capability. The presented investigative methods (supplementary methods to flow tests) fully confirm the location and extent of gel insulating barriers formed in the pore space of the analyzed porous rock samples.
The results of this study fully justify using flood tests as the primary component of the research methodology to evaluate the technological effectiveness of treatment fluids in modifying the filtration properties of porous rocks. Supplementary analyses, i.e., X-ray computed tomography and microscopic image analysis, corroborate this conclusion and suggest the potential for broadening the scope of information obtainable through these investigative techniques.

Author Contributions

Conceptualization, M.M., S.F., R.C.-S. and G.L.; methodology, M.M., S.F., R.C.-S. and G.L.; investigation, M.M. and G.L.; writing—original draft preparation, M.M., S.F., R.C.-S. and G.L.; writing—review and editing, M.M., R.C.-S. and G.L.; visualization, M.M. and G.L.; supervision, M.M.; project administration, M.M. All authors have read and agreed to the published version of the manuscript.

Funding

This research was carried out as part of the project “ Rozwój metodyki badawczej oceny skuteczności technologicznej cieczy zabiegowych w modyfikacji właściwości filtracyjnych skał porowatych”, which is funded by the Polish Ministry of Science and Higher Education, Grant No. DK-4100-9/2023.

Institutional Review Board Statement

Not applicable.

Informed Consent Statement

Not applicable.

Data Availability Statement

The original contributions presented in the study are included in the article, further inquiries can be directed to the corresponding author.

Acknowledgments

The authors would like to express their gratitude to the Polish Ministry of Science and Higher Education for funding this research.

Conflicts of Interest

The authors declare no conflicts of interest.

References

  1. Cicha-Szot, R.; Falkowicz, S. Wpływ modyfikatora na właściwości wiskoelastyczne żeli krzemianowych. Naft.-Gaz 2010, 12, 1102–1108. [Google Scholar]
  2. Dai, C.; You, Q.; Zhao, M.; Zhao, G.; Zhao, F. Profile control and flooding of water injection wells. In Principles of Enhanced Oil Recovery; Springer Nature: Singapore, 2023; pp. 49–78. [Google Scholar] [CrossRef]
  3. Ma, W.; Li, Y.; Liu, P.; Liu, Z.; Song, T. Progress of research into preformed particle gels for profile control and water shutoff techniques. Gels 2024, 10, 372. [Google Scholar] [CrossRef]
  4. Falkowicz, S.; Cicha-Szot, R. Iniekcyjna technologia tworzenia horyzontalnych barier izolacyjnych: Z laboratorium do warstwy wodonośnej. Górnictwo Odkryw. 2018, 59, 85–91. [Google Scholar]
  5. Karpiński, M.; Batko, R.; Kmiecik, E.; Tomaszewska, B.; Zdechlik, R. Czasowa zmienność wielkości dopływu wód dołowych do wyrobisk górniczych. Tech. Poszuk. Geol. Geoterm. Zrównoważony Rozw. 2017, 1, 49–60. [Google Scholar]
  6. Przybyłek, J. Aktualne problemy odwadniania złóż węgla brunatnego w Wielkopolsce. Górnictwo Odkryw. 2018, 2, 5–14. [Google Scholar]
  7. Słowikowski, D. Likwidacja przebić hydraulicznych w podłożu gruntowym: Praktyczne doświadczenia z realizacji. GDMT Geoinżynieria Drog. Mosty Tunele 2013, 4, 50–54. [Google Scholar]
  8. Izak, P.; Wójcik, Ł.; Słowikowski, D. Reologia zawiesin spoiw uszczelniających. Mater. Ceram. 2015, 67, 158–163. [Google Scholar]
  9. Lubaś, J.; Stopa, J.; Wojnicki, M. Możliwości zastosowania zaawansowanych metod wspomagania wydobycia ropy naftowej ze złóż dojrzałych. Nafta-Gaz 2019, 75, 24–28. [Google Scholar] [CrossRef]
  10. Seright, R.; Brattekås, B. Water shutoff and conformance improvement: An introduction. Pet. Sci. 2021, 18, 450–478. [Google Scholar] [CrossRef]
  11. Botermans, C.W.; Dalrymple, E.D.; Dahl, J.; Smith, D. Chemical systems for water and gas control: Terminology, evaluation methods, candidate selection, and expectations. In Proceedings of the SPE International Symposium on Oilfield Chemistry, Houston, TX, USA, 13–16 February 2001. [Google Scholar] [CrossRef]
  12. Guo, P.; Tian, Z.; Zhou, R.; Chen, F.; Du, J.; Wang, Z.; Hu, S. Chemical water shutoff agents and their plugging mechanism for gas reservoirs: A review and prospects. J. Nat. Gas Sci. Eng. 2022, 104, 104658. [Google Scholar] [CrossRef]
  13. Falkowicz, S.; Dubiel, S.; Cicha-Szot, R. Problemy ograniczania dopływu wody do odwiertów wydobywczych gazowych i ropnych. Gospod. Surowcami Miner. 2012, 28, 125–136. [Google Scholar]
  14. Grattoni, C.A.; Jing, X.D.; Zimmerman, R.W. Disproportionate permeability reduction when a silicate gel is formed in-situ to control water production. In Proceedings of the SPE Latin American and Caribbean Petroleum Engineering Conference, Buenos Aires, Argentina, 25–28 March 2001. [Google Scholar] [CrossRef]
  15. Romero, L.; Ziritt, J.; Marin, A.; Rojas, F.; Mogollon, J.; Paz, F. Plugging of high permeability—Fractured zones using emulsions. In Proceedings of the SPE/DOE Improved Oil Recovery Symposium, Tulsa, OK, USA, 21–24 April 1996. [Google Scholar] [CrossRef]
  16. Sobanova, O.B.; Fridman, G.B.; Arefyev, Y.N. Laboratory and oil field testing for application of compositions including hydrocarbons and surfactants for restricting water influx into producing wells. In Proceedings of the 7th European Symposium on IOR, Moscow, Russia, 5–7 July 1993; pp. 207–215. [Google Scholar]
  17. Lakatos, I.; Tóth, J.; Bauer, K.; Lakatos-Szabó, J.; Palásthy, G.; Wöltje, H. Comparative study of different silicone compounds as candidates for restriction of water production in gas wells. In Proceedings of the International Symposium on Oilfield Chemistry, Houston, TX, USA, 5–7 February 2003. [Google Scholar] [CrossRef]
  18. Pusch, G.; Meyn, R.; Burger, W.; Geck, M. Method for Stabilizing the Gas Flow in Water-Bearing Natural Gas Deposits of Reservoirs. Patent 6.206.102 B1, 27 March 2001. [Google Scholar]
  19. Lakatos, I.; Szentes, G.; Toro, M.; Karaffa, Z.; Vago, A. Mitigation of formation damage caused by chemical overdosing in water shut-off treatments. In Proceedings of the SPE International Conference and Exhibition on Formation Damage Control, Lafayette, LA, USA, 19–21 February 2020. [Google Scholar] [CrossRef]
  20. Lakatos, I.; Lakatos-Szabó, J.; Bódi, T.; Vágó, Á. New alternatives of water shutoff treatments: Application of water sensitive metastable systems. In Proceedings of the SPE International Symposium and Exhibition on Formation Damage Control, Lafayette, LA, USA, 13–15 February 2008. [Google Scholar] [CrossRef]
  21. Lakatos, I.J.; Lakatos-Szabo, J.; Szentes, G.; Vadaszi, M. Mitigation of formation damage caused by macromolecular materials using ‘liquid’ polymers. In Proceedings of the SPE European Formation Damage Conference & Exhibition, Noordwijk, The Netherlands, 5–7 June 2013. [Google Scholar] [CrossRef]
  22. Lakatos, I.; Lakatos-Szabo, J.; Szentes, G.; Vago, A. Restriction of water production in gas wells by induced phase inversion: Field case studies. In Proceedings of the SPE International Symposium and Exhibition on Formation Damage Control, Lafayette, LA, USA, 26–28 February 2014. [Google Scholar] [CrossRef]
  23. Lakatos, I.; Szentes, G.; Vago, A.; Karaffa, Z. Application of nanoparticle aided silicate reservoir conformance control method at the Algyo field, Hungary: Fundamentals and case histories. In Proceedings of the Abu Dhabi International Petroleum Exhibition and Conference, Abu Dhabi, United Arab Emirates, 13–16 November 2017. [Google Scholar] [CrossRef]
  24. Falkowicz, S.; Stanik, W.; Czupski, M.; Majkrzak, M. Technologia kontroli produkcji wody w odwiertach gazowych wraz z pozabiegową procedurą stymulacji produkcji. Wiadomości Naft. I Gazow. 2025, 9, 4–11. [Google Scholar]
  25. Majkrzak, M.; Falkowicz, S.; Stanik, W. Modification of filtration properties of porous media using Multizol micellar treatment fluid. Naft.-Gaz 2023, 9, 567–575. [Google Scholar] [CrossRef]
  26. Kruczek, J.; Such, P. Pomiary przepuszczalności fazowej i matematyczna ekstrapolacja otrzymanych wyników. Przegląd Geol. 1995, 43, 291–294. [Google Scholar]
  27. Knobloch, L.O.; Hincapie, R.E.; Födisch, H.; Ganzer, L. Qualitative and quantitative evaluation of permeability changes during EOR polymer flooding using micromodels. World J. Eng. Technol. 2018, 6, 332–349. [Google Scholar] [CrossRef]
  28. Shi, L.; Ye, Z.Y.; Zhang, Z.; Zhou, C.; Zhu, S.; Guo, Z. Necessity and feasibility of improving the residual resistance factor of polymer flooding in heavy oil reservoirs. Pet. Sci. 2010, 7, 251–256. [Google Scholar] [CrossRef]
  29. Sowiżdżał, K. Analiza niepewności wyników obliczeń zasobów węglowodorów metodą objętościową, w oparciu o statyczny, przestrzenny model złoża. Naft.-Gaz 2009, 65, 934–941. [Google Scholar]
  30. Alfarge, D.K.; Wei, M.; Bai, B. Numerical simulation study of factors affecting relative permeability modification for water-shutoff treatments. Fuel 2017, 207, 226–239. [Google Scholar] [CrossRef]
  31. Łętkowski, P. Automatyczna kalibracja symulacyjnego modelu złożowego w bliskim otoczeniu odwiertu. Naft.-Gaz 2011, 67, 163–170. [Google Scholar]
  32. Civan, F. Reservoir Formation Damage, 3rd ed.; Gulf Publishing Company: Houston, TX, USA, 2015; pp. 1–1024. [Google Scholar]
  33. Brian, R.S.; Hisham, K.B.M. Numerical approach for enhanced oil recovery with surfactant flooding using STARS (CMG). Int. J. Pet. Petrochem. Eng. 2017, 3, 4. [Google Scholar] [CrossRef]
  34. He, W.; Liu, Z. Numerical simulation of formation damage by drilling fluid in low permeability sandstone reservoirs. J. Pet. Explor. Prod. 2021, 11, 1865–1871. [Google Scholar] [CrossRef]
  35. Dohnalik, M. Zwiększenie Możliwości Wyznaczania Parametrów Zbiornikowych Skał z Wykorzystaniem Rentgenowskiej Mikrotomografii Komputerowej. Ph.D. Thesis, AGH University of Science and Technology, Kraków, Poland, 2013. [Google Scholar]
  36. Wu, J.; Gong, W.; Wang, Q.; He, Y.; Guo, J.; Bao, Y.; Shao, S.; Li, R. Dynamic characterization of microscopic pore structure in medium-high permeability sandstones during waterflooding. Nanomaterials 2025, 15, 747. [Google Scholar] [CrossRef] [PubMed]
  37. Stock, S.R. MicroComputed Tomography: Methodology and Applications; CRC Press: Boca Raton, FL, USA, 2009; pp. 1–348. [Google Scholar]
  38. Fourie, S. The cranial morphology of Thriaxodon liorhinus Seeley. Ann. S. Afr. Mus. 1974, 65, 337–400. [Google Scholar]
  39. Drabik, K.; Przelaskowska, A.; Skupio, R.; Kubik, B. Obrazowanie przestrzeni porowej skał o zróżnicowanej litologii metodą tomografii komputerowej. Naft.-Gaz 2022, 10, 713–719. [Google Scholar] [CrossRef]
  40. Krakowska, P.; Dohnalik, M.; Jarzyna, J.; Wawrzyniak-Guz, K. Computed X-ray microtomography as the useful tool in petrophysics: A case study of tight carbonates Modryn formation from Poland. J. Nat. Gas Sci. Eng. 2016, 31, 67–75. [Google Scholar] [CrossRef]
  41. Wang, B.; Guo, L.; Luo, X.; Jiang, Y.; Li, Q.; Xie, J. Identification and extraction of cementation patterns in sand modified by MICP: New insights at the pore scale. PLoS ONE 2024, 19, e0296437. [Google Scholar] [CrossRef]
  42. Akin, S.; Schembre, J.M.; Bhat, S.K.; Kovscek, A.R. Spontaneous imbibition characteristics of diatomite. J. Pet. Sci. Eng. 2000, 25, 149–165. [Google Scholar] [CrossRef]
  43. Iglauer, S.; Rahman, T.; Sarmadivaleh, M.; Al-Hinai, A.; Fernø, M.A.; Lebedev, M. Influence of wettability on residual gas trapping and enhanced oil recovery in three-phase flow: A pore-scale analysis by use of microcomputed tomography. SPE J. 2016, 21, 1916–1929. [Google Scholar] [CrossRef]
  44. Orlov, M.S.; Roschin, P.V.; Struchkov, I.A.; Litvin, V.T. The application of X-ray micro computed tomography (Micro-CT) of core sample for estimation of physicochemical treatment efficiency. In Proceedings of the SPE Russian Petroleum Technology Conference, Moscow, Russia, 26–28 October 2015. [Google Scholar] [CrossRef]
  45. Bentz, D.P.; Quenard, D.; Kunzel, H.M.; Baruchel, J.; Peyrin, F.; Martys, N.S.; Garboczi, E.J. Microstructure and transport properties of porous building materials. II: Three-dimensional X-ray tomographic studies. Mater. Struct. 2000, 33, 147–153. [Google Scholar] [CrossRef]
  46. Geotek. RXCT Rotary and Medical CT Scanner Systems. Available online: https://www.geotek.co.uk (accessed on 21 August 2025).
  47. Tadeusiewicz, R.; Korohoda, P. Komputerowa Analiza i Przetwarzanie Obrazu; Wydawnictwo Fundacji Postępu Komunikacji: Kraków, Poland, 1997; pp. 1–444. [Google Scholar]
  48. Leśniak, G. Zastosowanie komputerowej analizy obrazu w badaniach petrofizycznych. Przegląd Geol. 1999, 47, 895–900. [Google Scholar]
  49. Tiab, D.; Donaldson, E.C. Petrophysics: Theory and Practice of Measuring Reservoir Rock and Fluid Transport Properties, 4th ed.; Gulf Professional Publishing: Oxford, UK, 2016; pp. 1–894. [Google Scholar]
  50. Dolson, J. Understanding Oil and Gas Shows and Seals in the Search for Hydrocarbons; Springer: Cham, Switzerland, 2016; pp. 1–486. [Google Scholar] [CrossRef]
  51. Majkrzak, M. Ocena selektywnej redukcji właściwości filtracyjnych skał porowatych w zabiegach ograniczania produkcji wody w odwiertach. Naft.-Gaz 2022, 4, 259–268. [Google Scholar] [CrossRef]
  52. Stanik, W.; Falkowicz, S.; Majkrzak, M.; Konieczny, R.; Cicha-Szot, R.; Czupski, M. Kompozycja Surfaktantów Przeznaczona do Ograniczania Produkcji Wody w Odwiertach Gazowych; Oil and Gas Institute—National Research Institute: Krakow, Poland, 2023; p. 445682. [Google Scholar]
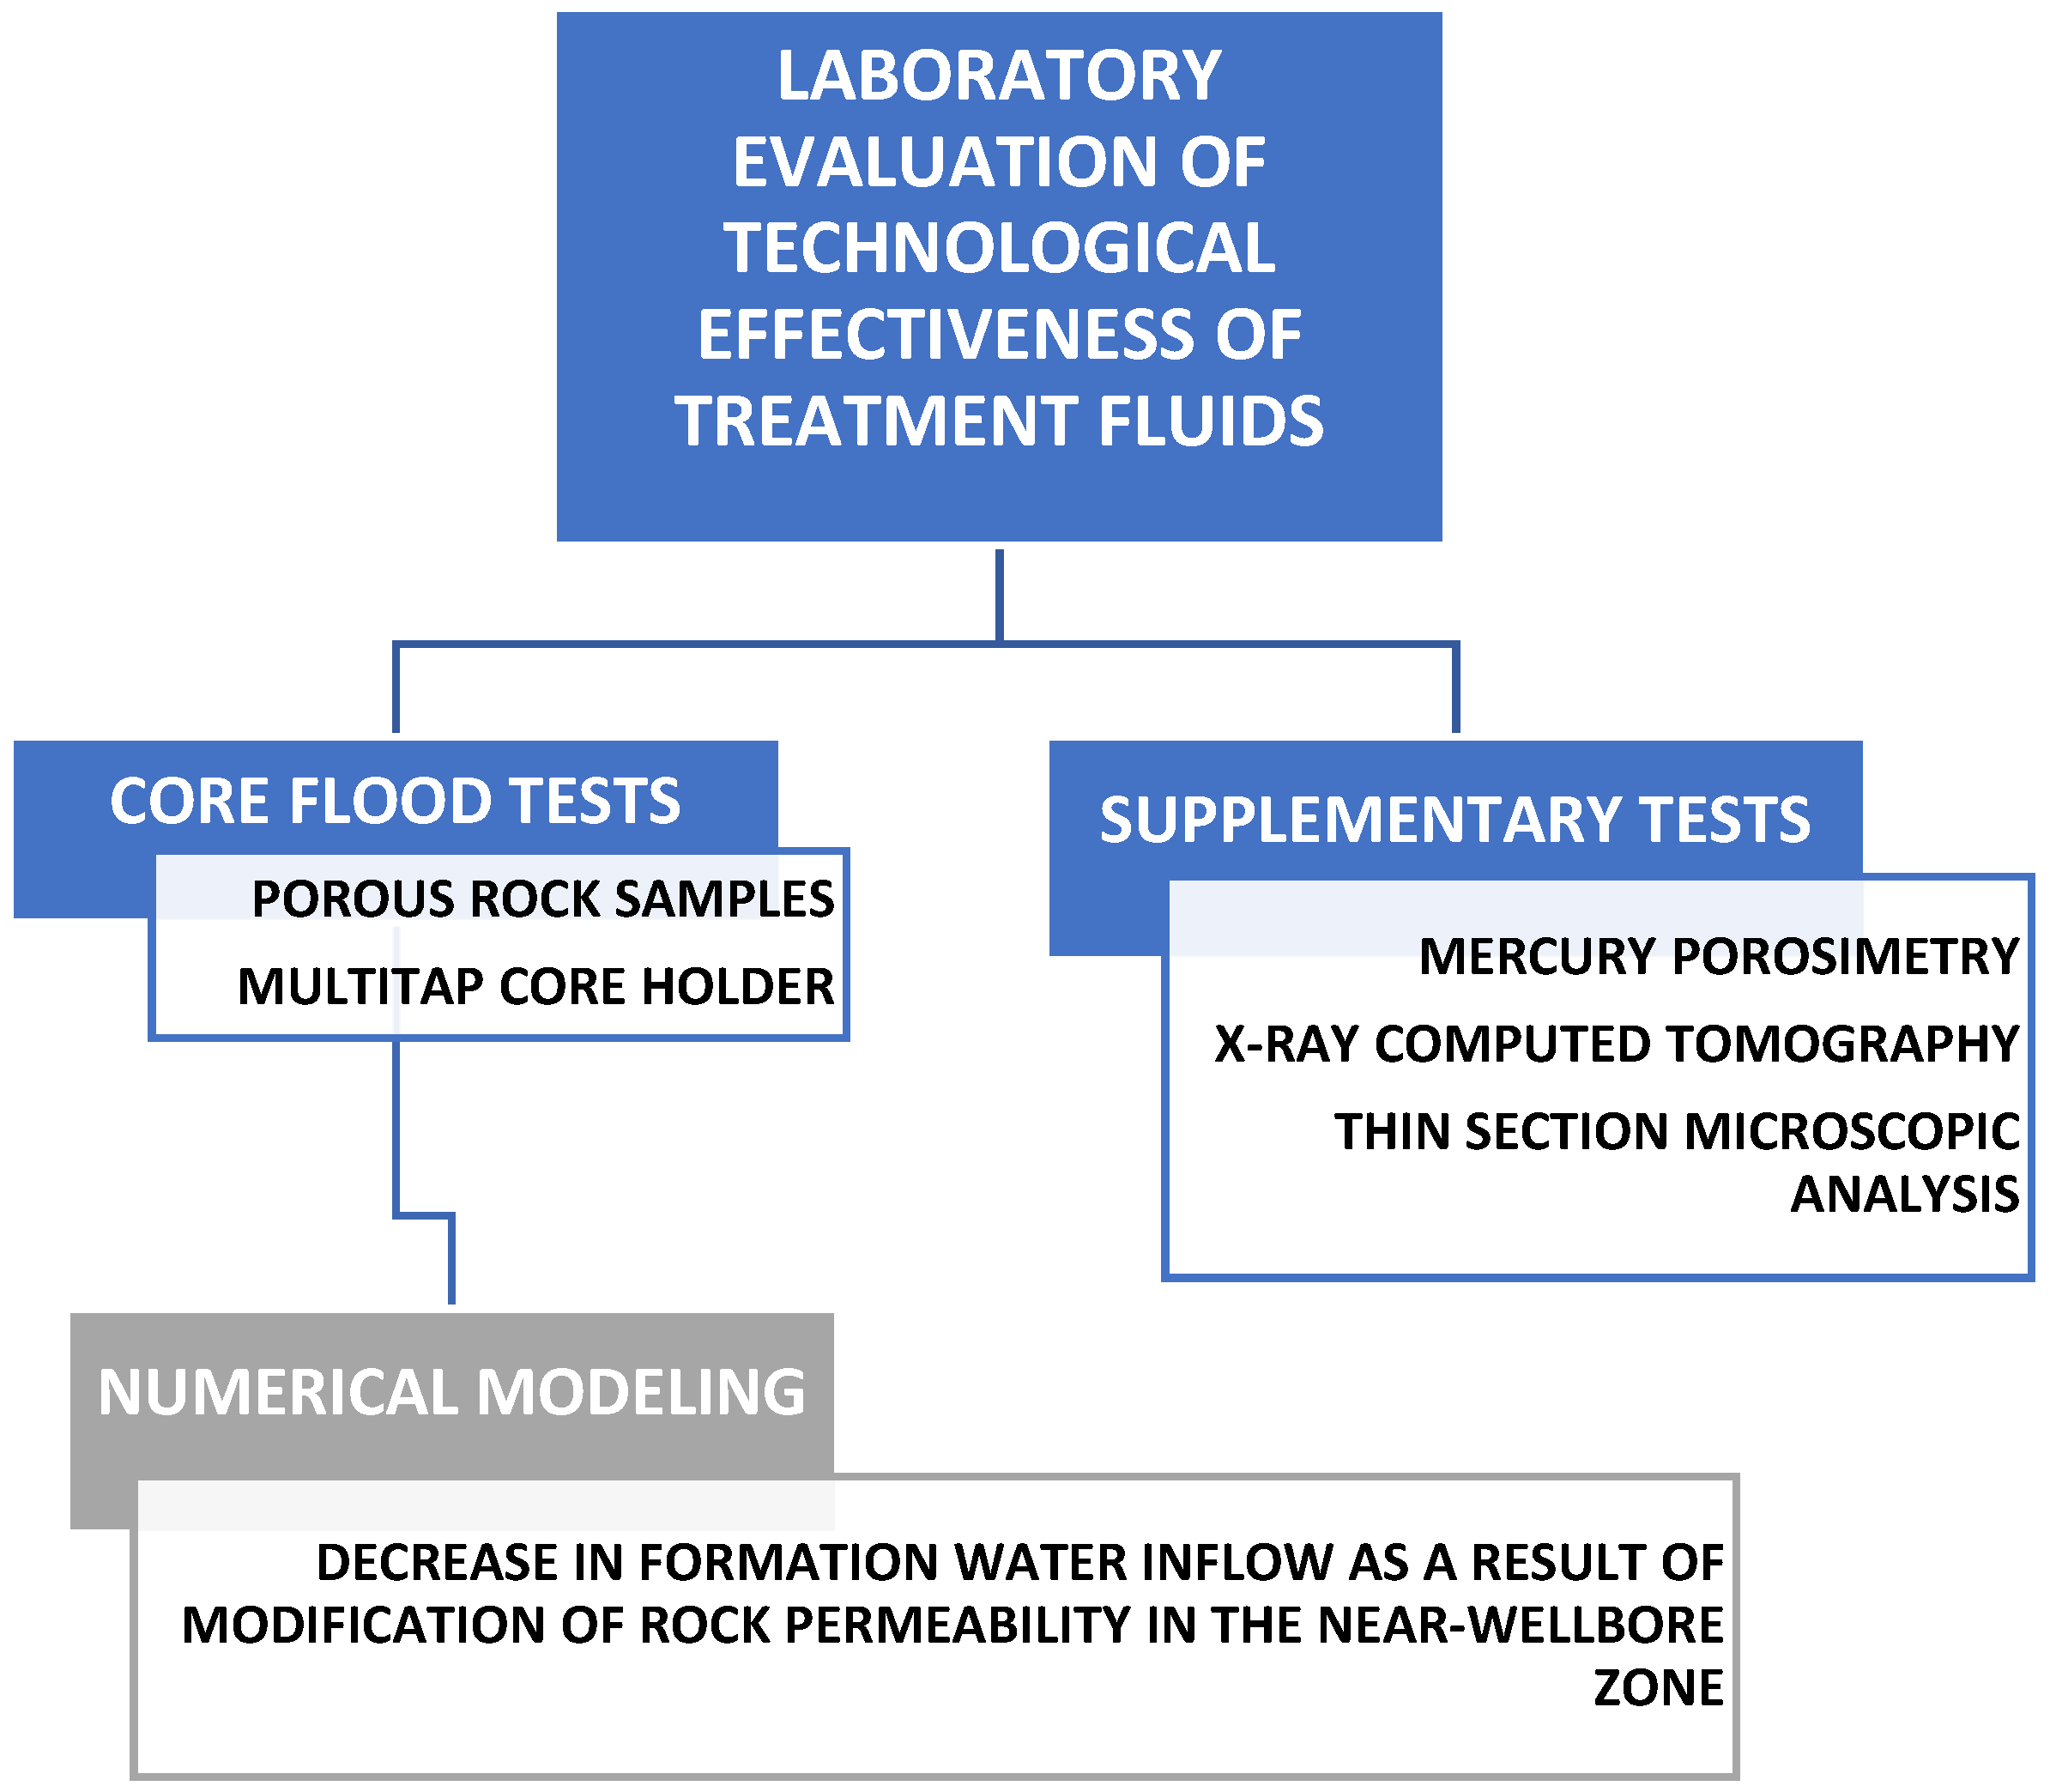
Figure 1. Laboratory research plan for assessing the technological effectiveness of treatment fluids.
Applsci 15 12415 g001
Figure 2. Mercury saturation curves of pore space (upper figure) and pore diameter distribution curves of analyzed samples (bottom figure).
Applsci 15 12415 g002
Figure 3. Pore visualization (shown in violet) in sample RW2 before (left figure) and after treatment fluid injection (right figure).
Applsci 15 12415 g003
Figure 4. Pore visualization (shown in violet) in sample RW3 before (left figure) and after treatment fluid injection (right figure).
Applsci 15 12415 g004
Figure 5. Tomographic image of sample RW2 before (upper images) and after treatment fluid injection (bottom images)—comparison of XY cross-sections (examples of changes in pore space marked with colored circles).
Applsci 15 12415 g005
Figure 6. Tomographic image of sample RW3 before (upper images) and after treatment fluid injection (bottom images)—comparison of XY cross-sections (examples of changes in pore space marked with colored circles).
Applsci 15 12415 g006
Figure 7. Microphotographs of thin section (sample RW2) made from brine injection side—clean pores (left side)—and from treatment fluid injection side—unblocked pores (right side). Arrow indicates gel remnants colored with iron hydroxides.
Applsci 15 12415 g007
Figure 8. Microphotographs of thin section (sample RW3) made from brine injection side—clean pores—with Fe hydroxides rims visible on part of grains, part of pores lined with iron hydroxides (left side). From treatment fluid injection side (right side) —pores lined with gel and blocked channels between pores.
Applsci 15 12415 g008
Table 1. Summary of basic petrophysical parameters of porous rock samples.
No.Diameter
[cm]
Length
[cm]
Absolute Permeability for Gas [mD]Pore
Volume [cm3]
Porosity [%]
RG12.5712.7014.2111.9318.11
RG22.5612.2322.6712.0419.41
RW12.5813.0056.3613.6920.15
RW22.5811.7340.8611.2318.31
RW32.5811.8738.3611.7218.89
Table 2. Results of pore space analysis by mercury porosimetry (MICP) and density studies (helium pycnometry).
ParameterNo.
RW2RW3
Total helium porosity [%]22.9421.79
Effective porosity [%]19.2019.75
Skeletal density [g/cm3]2.682.71
Bulk density [g/cm3]2.072.12
Skeletal density from MICP [g/cm3]2.562.64
Entry pressure [psi]1.231.23
Entry diameter [µm]150.00150.00
Threshold diameter [µm]45.0045.00
Mean diameter [µm]1.731.32
Specific surface area [m2/g]0.210.28
mega [>10 µm]62.1862.00
macro [10–2 µm]12.2411.01
meso [2–0.5 µm]17.1316.85
micro [0.5–0.1 µm]8.419.06
nano [<0.1 µm]0.041.09
k_Swanson [mD]529.05529.17
Table 3. Reservoir fluid characterization.
Measurement Temperature [°C]Density [g/cm3]Dynamic
Viscosity [cP]
15% NaCl251.111.24
Table 4. FRR coefficient values in consecutive zones and entire length of porous rock samples.
No.FRR Coefficient [-] in Consecutive Sample ZonesIrreducible Saturation for Brine Swi [%]FRR Coefficient [-] for Entire Sample
IIIIIIIV
RG11.351.251.371.339.141.32
RG21.151.211.221.2810.721.24
RW11.031.2628.1213.6710011.69
RW20.971.0026.64-1009.55
RW32.6514.7338.91-10015.46
Table 5. Volumetric pore classification before and after treatment fluid injection into pore space of samples—changes in class volume fraction.
No. ClassesVolume Fraction Before the Injection of the Treatment Fluid [%]Volume Fraction After the Injection of the Treatment Fluid [%]∆ [%]
RW2
I0.60.30.3
II5.43.32.1
III31.321.79.6
IV60.663.2−2.6
V2.111.5−9.4
VI000
VII000
RW3
I1.40.60.8
II16.310.26.1
III56.347.88.5
IV25.340.6−15.3
V0.60.8−0.2
VI000
VII000
Disclaimer/Publisher’s Note: The statements, opinions and data contained in all publications are solely those of the individual author(s) and contributor(s) and not of MDPI and/or the editor(s). MDPI and/or the editor(s) disclaim responsibility for any injury to people or property resulting from any ideas, methods, instructions or products referred to in the content.