Article

Investigating the Potential Molecular Mechanisms of Mogroside V on Glucose Homeostasis by Transcriptome Profiling of Adult Mouse Hypothalamic Cells

1
Department of Basic Sciences, Faculty of Veterinary Medicine, University of Agriculture in Krakow, Redzina 1c, 30-248 Krakow, Poland
2
Laboratory of Recombinant Proteins Production, Faculty of Veterinary Medicine, University of Agriculture in Kraków, Rędzina 1C, 30-248 Krakow, Poland
3
Department of Animal Molecular Biology, National Research Institute of Animal Production, Krakowska 1, 32-083 Balice, Poland
*
Author to whom correspondence should be addressed.
Appl. Sci. 2025, 15(23), 12391; https://doi.org/10.3390/app152312391
Submission received: 16 October 2025 / Revised: 13 November 2025 / Accepted: 18 November 2025 / Published: 21 November 2025

Abstract

Background: Mogroside V (MV), a natural sweetener extracted from monk fruit, has recently attracted growing interest due to its anti-inflammatory, antioxidant, and glucose metabolism-modulating properties. However, the transcriptomic effects of MV, especially in the context of glucose conditions, remain largely unexplored. This study aims to elucidate the impact of different MV concentrations on gene expression in hypothalamic neuronal cells under both normal and high glucose environments. Methods: Adult mouse hypothalamus neuronal cells were cultured under normal and high glucose conditions and treated with three MV concentrations (15 µM, 60 µM, and 160 µM). RNA sequencing was performed to assess transcriptomic changes. Differential gene expression analysis and functional pathway enrichment were conducted to identify biological processes and signaling pathways influenced by MV. Results: MV induced differential expression of up to 103 genes, depending on the dose and glucose context. Pathway analysis revealed activation of Notch and FoxO signaling, both implicated in glucose regulation, as well as the AMPK signaling pathway, which is critical for cellular energy homeostasis. MV also enriched pathways related to oxidative stress, aligning with its proposed antioxidant effects. Importantly, dose-dependent transcriptomic responses were observed under normal glucose conditions, but these effects were attenuated in high glucose settings, suggesting context-specific efficacy. Conclusions: MV exerts a dose-dependent influence on gene expression in hypothalamic neurons, particularly in pathways linked to glucose metabolism and oxidative stress. These findings underscore its potential as a metabolic modulator, warranting further investigation in animal models to assess its therapeutic relevance.

1. Introduction

Mogroside V (MV) is a compound extracted from the fruits of Siraitia grosvenorii, commonly known as monk fruit. Historically, it has been utilized as a natural sweetener due to its remarkable sweetening potency, estimated to be 465 to 563 times stronger than sucrose [1]. It also appears to be nontoxic even in very high concentrations [2]. Nowadays, MV is becoming a substance of considerable attention for its potential therapeutic properties, including anti-inflammatory, antioxidant, and antidiabetic effects [3]. Moreover, it has shown promise in the management and prevention of obesity and diabetes [1]. Since obesity and diabetes are serious problems both in modern societies and animal husbandry, the use of MV to alleviate their symptoms could be possible, especially since it has a sweet taste and negligible caloric content. Nevertheless, the precise mechanisms underlying the pharmacological actions of MV still remain largely unexplored. Therefore, determining the spectrum of its effects on the transcriptome seems to be an essential scientific task in elucidating the safety of its consumption and the mechanisms of MV action in glycaemia and related diseases. In addition, transcriptome analysis can provide valuable insight into gene expression patterns and regulatory mechanisms in response to various stimuli, including exposure to different concentrations of MV.
Currently, we have various models expressing key feeding-related neuropeptides from both embryonic- and adult-derived primary hypothalamic cultures [4,5]. The adult-derived mHypoA-2/12 cell lines express specific neuropeptides (NPY, AgRP) and receptors (NPY Y1R, NPY Y5R, melanocortin 3 receptor (MC3R), insulin receptor (IR), leptin receptor (Lep-R), ghrelin receptor (GHSR), glucagon-like peptide receptor type 1 and 2 (GLP-1R, GLP-2R) and respond to hormonal stimulation, making them functional models to study mechanisms underlying feeding or metabolic disorders [4,5].
Until now, there has been little or no research regarding how MV can affect the transcriptome. In response to this, the main objective of this research was to determine the effect of different concentrations of MV on the transcriptional activity of mHypoA-2/12 neuron cell lines in relation to normal and high glucose conditions. Concentrations of MV applied within this study were chosen based on the studies of other authors, with the highest dose chosen deliberately as higher [6,7,8].

2. Materials and Methods

2.1. Cell Culture and Treatments

The mHypoA-2/12 cells (Clu177, Cedarlane, Burlington, ON, Canada) were cultured in Dulbecco’s Modified Eagle’s Medium (DMEM; Gibco—Thermo Fisher Scientific, Waltham, MA, USA) containing glucose at either 5.5 mM (normal glucose; NG) or 25 mM (high glucose; HG), in standard conditions of a humidified atmosphere at 37 °C and 5% CO2. Both media were supplemented with 1 mM sodium pyruvate, 2 mM L-glutamine, 1% Gibco™ Antibiotic-Antimycotic (10,000 units/mL of penicillin, 10,000 μg/mL of streptomycin, and 25 μg/mL of Gibco Amphotericin B, Thermo Fisher Scientific, USA), and 10% fetal bovine serum (FBS, Gibco, Thermo Fisher Scientific, USA). Briefly, the cells were plated in 24-well culture plates at a density of 1.5 × 10⁵ cells/well, maintained at 37 °C and 5% CO2. Cells were exposed to MV (15, 60, and 160 µM) for 24 h either in NG or HG DMEM (n = 3 for each concentration). MV was suspended in DMSO and diluted to a final concentration in DMEM (final DMSO concentration of 0.1% in assay media). The vehicle control was 0.1% DMSO in the DMEM. The mHypoA-2/12 hypothalamic neuronal cell line serves as a reliable in vitro model for studying mechanisms relevant to diabetic neuropathy and metabolic regulation [9].

2.2. Cellular Tests

Cell viability and caspase activity were assessed following MV treatment at 15 μM, 60 μM, and 160 μM. The concentrations of MV used in this study were selected based on previously published reports demonstrating that MV exhibits metabolic, antioxidant, and cytoprotective activity across the 10–200 μM range while maintaining a favorable safety profile. Recent reviews and pharmacological studies confirm that MV is considered safe, including its FDA GRAS designation, and show biological activity within similar micromolar concentrations. Furthermore, MV demonstrates enzymatic inhibitory activity in the low-to-mid micromolar range (Ki ≈ 46 μM), supporting the relevance of the concentrations applied here [2].
Cell viability assays were performed using the RealTime-Glo™ MT Cell Viability Assay according to the manufacturer’s protocol (Promega, Madison, WI, USA). The luminescent ATP-based method is a well-established indicator of cell viability and proliferation [10]. After mHypoA-2/12 cells had been exposed to MV for 24 h in either NG or HG, they were reseeded in white-walled 96-well plates at a density of 4000 cells/well. Cells were allowed to attach overnight. For time-zero measurements, cells were incubated with RealTime-Glo™ MT Cell Viability reagent for 20 min at 37 °C, and luminescence intensity was determined on a TECAN Infinite M200 PRO microplate reader (TECAN, Männedorf, Switzerland).
Caspase 3/7 activity was determined according to the manufacturer’s protocol (Promega, USA). Caspase 3/7 activity reflects the activation of key apoptotic enzymes involved in cell death signaling [11]. Briefly, mHypoA-2/12 cells (15 × 103 cells per well) were cultured in a 96-well white plate and exposed to MV for 24 h in either NG or HG conditions. Cells treated with 5 μM of staurosporine (0.1% final DMSO; Merck, Rahway, NJ, USA) for 24 h were used as a positive control. For the assay, Caspase-Glo 3/7 reagent was added to all the wells in a 1:1 ratio, and after shaking at room temperature for 30 min, the lysates were analyzed with the luminometer (Infinite M200 PRO, TECAN, Switzerland). All statistical differences were calculated using the Mann–Whitney U test using R software v4.5.1 [12], treating values as significantly different when p was <0.05.

2.3. Isolation of RNA, Preparation of Libraries, and Sequencing

After the treatment of cells with various concentrations of MV (obtained from Merck supplier), cells were trypsinized and centrifuged, and the pellets were used for RNA isolation. Total RNA was isolated using a standard TRI Reagent™ Solution (Thermo Fisher Scientific) procedure and evaluated for quality using the TapeStation 4150 System (Agilent, Santa Clara, CA, USA), followed by a library preparation process with the QuantSeq 3′ mRNA-Seq Library Prep Kit FWD (Lexogen, Vienna, Austria)—all according to the manufacturer’s protocols. Then, the libraries were commercially sequenced in a 2 × 150 PE run at the OMRF Clinical Genomics Center (CGC) (Oklahoma City, OK, USA). After read trimming according to Lexogen guidelines, single-end 75 bp reads were used for further analysis.

2.4. Bioinformatic Analysis

The obtained raw reads were checked for quality using FastQC (version 0.11.7) software and then trimmed using Flexbar software (version 3.5.0) [13] following the criteria: minimal read length set to 36; minimum quality threshold set to 20 Phred quality; removal of adapter content; trimming read one to 75 bp; and removal of read two. The next step was to map the filtered reads to the mouse genome (GRCm39) using STAR software (version 2.7.10) with default parameters [14] and then count the mapped reads with HTSeq-count software ([15], version 2.02) within genes based on annotations obtained from the Ensembl GTF file (version 110). Differential expression analysis was performed with the use of Deseq2 software [16] v3.16, with adjusted p-value < 0.1 chosen as cut-off for differentially expressed genes (DEG).
The detected DEGs were treated as input for pathway analysis, which was maintained using KOBAS-i software (version 3.0) [17] and QIAGEN IPA (QIAGEN Inc., Venlo, The Netherlands, https://digitalinsights.qiagen.com/IPA, accessed on 3 June 2025) based on the KEGG and GO databases. To conduct gene enrichment analysis, the overrepresentation method was used, and only pathways with a corrected p-value below 0.05 were selected for further examination. Raw sequencing reads and the results used for Deseq2 analysis were submitted to the GEO repository under the GSE275887 entry.

2.5. qPCR Validation

DEGs were tested using RT-qPCR to verify the reliability of the analysis. For this purpose, cDNA was synthesized using 500 ng of RNA and the qScript Ultra SuperMix (QuantaBio, Beverly, MA, USA), following the manufacturer’s protocol. RT-qPCR was performed with the AmpliQ 5 × HOT EvaGreen® qPCR Mix Plus (ROX) kit (Novazym, Poznan, Poland) and primers for mRNA sequences spanning two adjacent exons. Each sample was run in triplicate using Quant Studio 7 Flex (Thermo Fisher Scientific). The relative expression levels of each gene were calculated using the comparative Ct (ΔΔCt) method [18]. Standardization was performed based on HPRT/PPIA as the internal control. Correlation coefficients between NGS results and qPCR were calculated with the use of the Pearson correlation method provided in R software [12].

3. Results

3.1. Effect of MV on mHypoA-2/12 Cell Viability and Apoptosis

The RealTime-Glo™ MT Cell Viability Assay was performed to evaluate mHypoA-2/12 cell viability alterations in cells treated with MV for 24 h under different glucose conditions (NG vs. HG). Data revealed that the cell viability increased by 26.7% at NG or 19.8% at HG (p < 0.05, Figure 1) when the concentration of MV was 15 µM, respectively. As indicated in Figure 1, MV at higher doses (60 µM or 160 µM) did not significantly affect mHypoA-2/12 cell viability either under NG or HG conditions.
The cell-based homogeneous caspase-glo assay kit was employed to assess the effect of MV on the activities of the two key caspases of apoptosis (caspase-3/7). Exposure to high glucose conditions for 24 h did not significantly change mHypoA-2/12 cellular caspase 3/7 activities.
Low dose of MV administration (15 µM) did not significantly change caspase 3/7 activity under either NG or HG conditions. However, higher concentrations of MV supplementation, both 60 and 160 µM, significantly change the activity of caspase 3/7 in both NG and HG (p < 0.05, Figure 1).

3.2. Sequencing Read Statistics

The 3′mRNA-Seq libraries were prepared for 24 samples, which were further assigned to two distinct experiments, denoted as experiments NG and HG. Within each experiment, all samples were categorized into four study groups: a Control group and a low, medium, and high dose of MV supplementation. In total, the sequencing process yielded from 6.6 M to 14.4 M of raw reads per sample, with a mean of 7.7 M. Notably, approximately 73.7% of the filtered reads were uniquely aligned to the reference genome, with 73.6% of these uniquely aligned reads successfully attributed to gene thresholds derived from the Ensembl annotation file (version 110). Comprehensive information about the sequencing reads and mapping statistics is provided in Table 1.

3.3. The Effect of MV Supplementation on Transcriptome

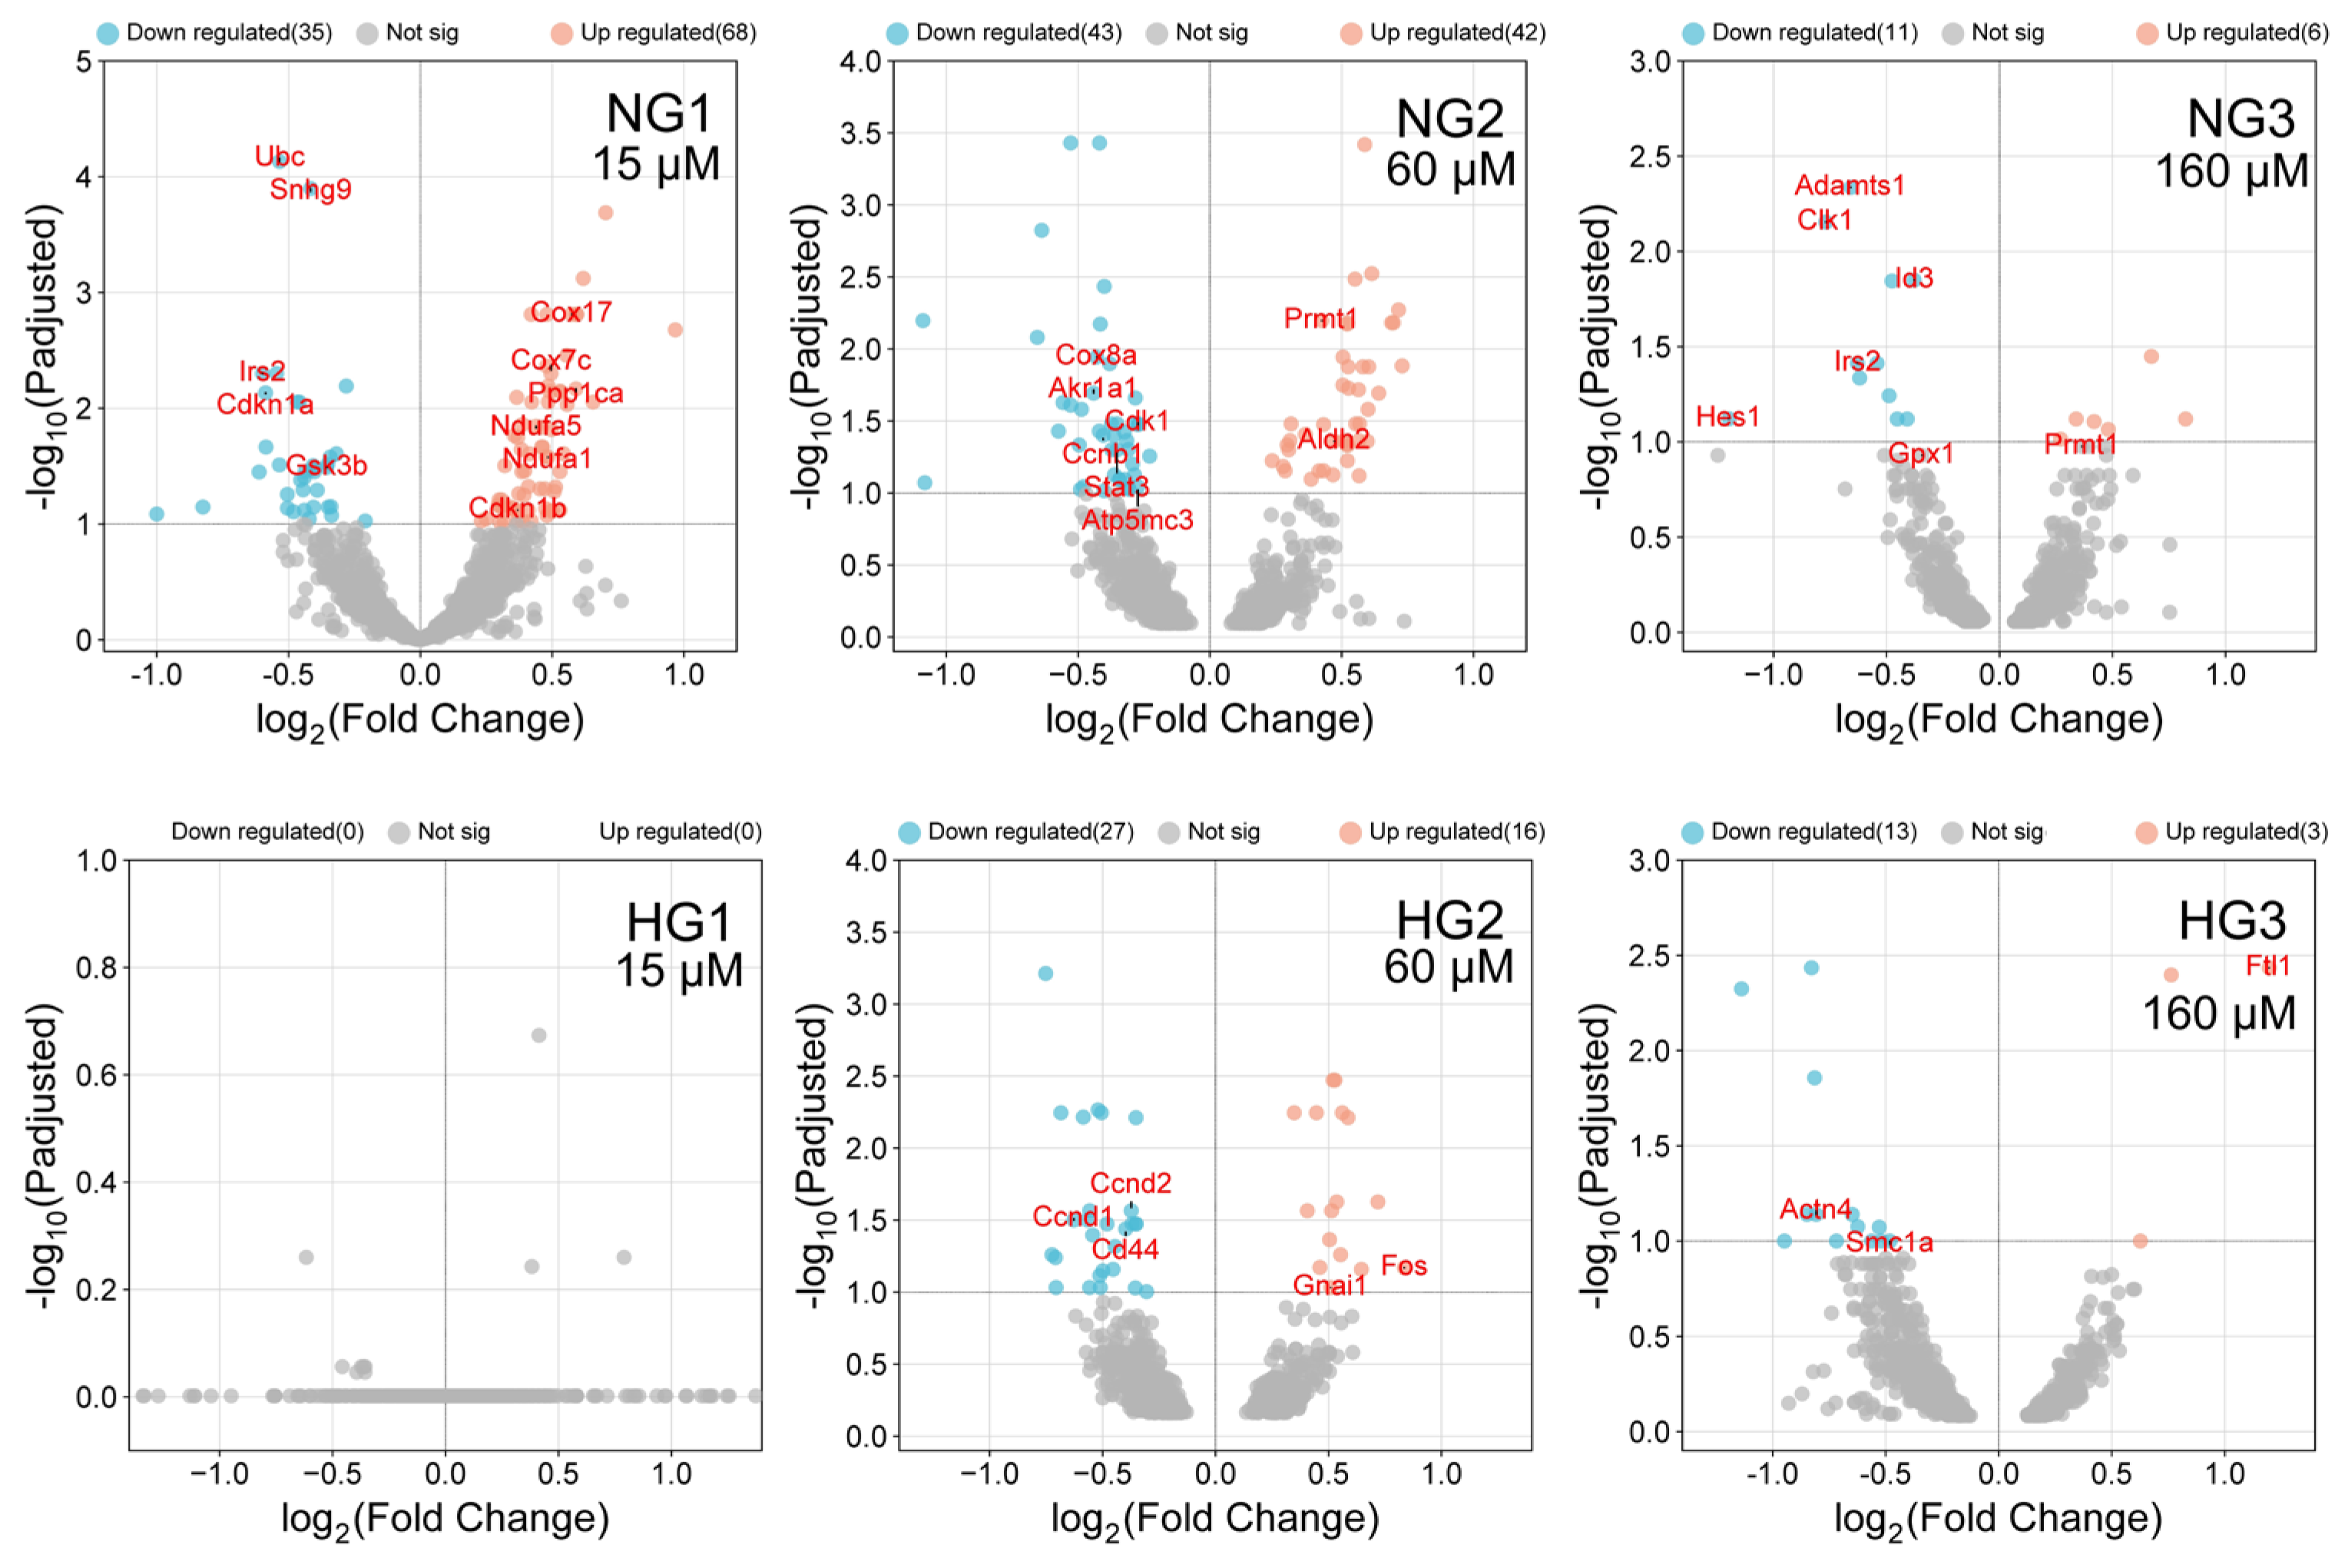
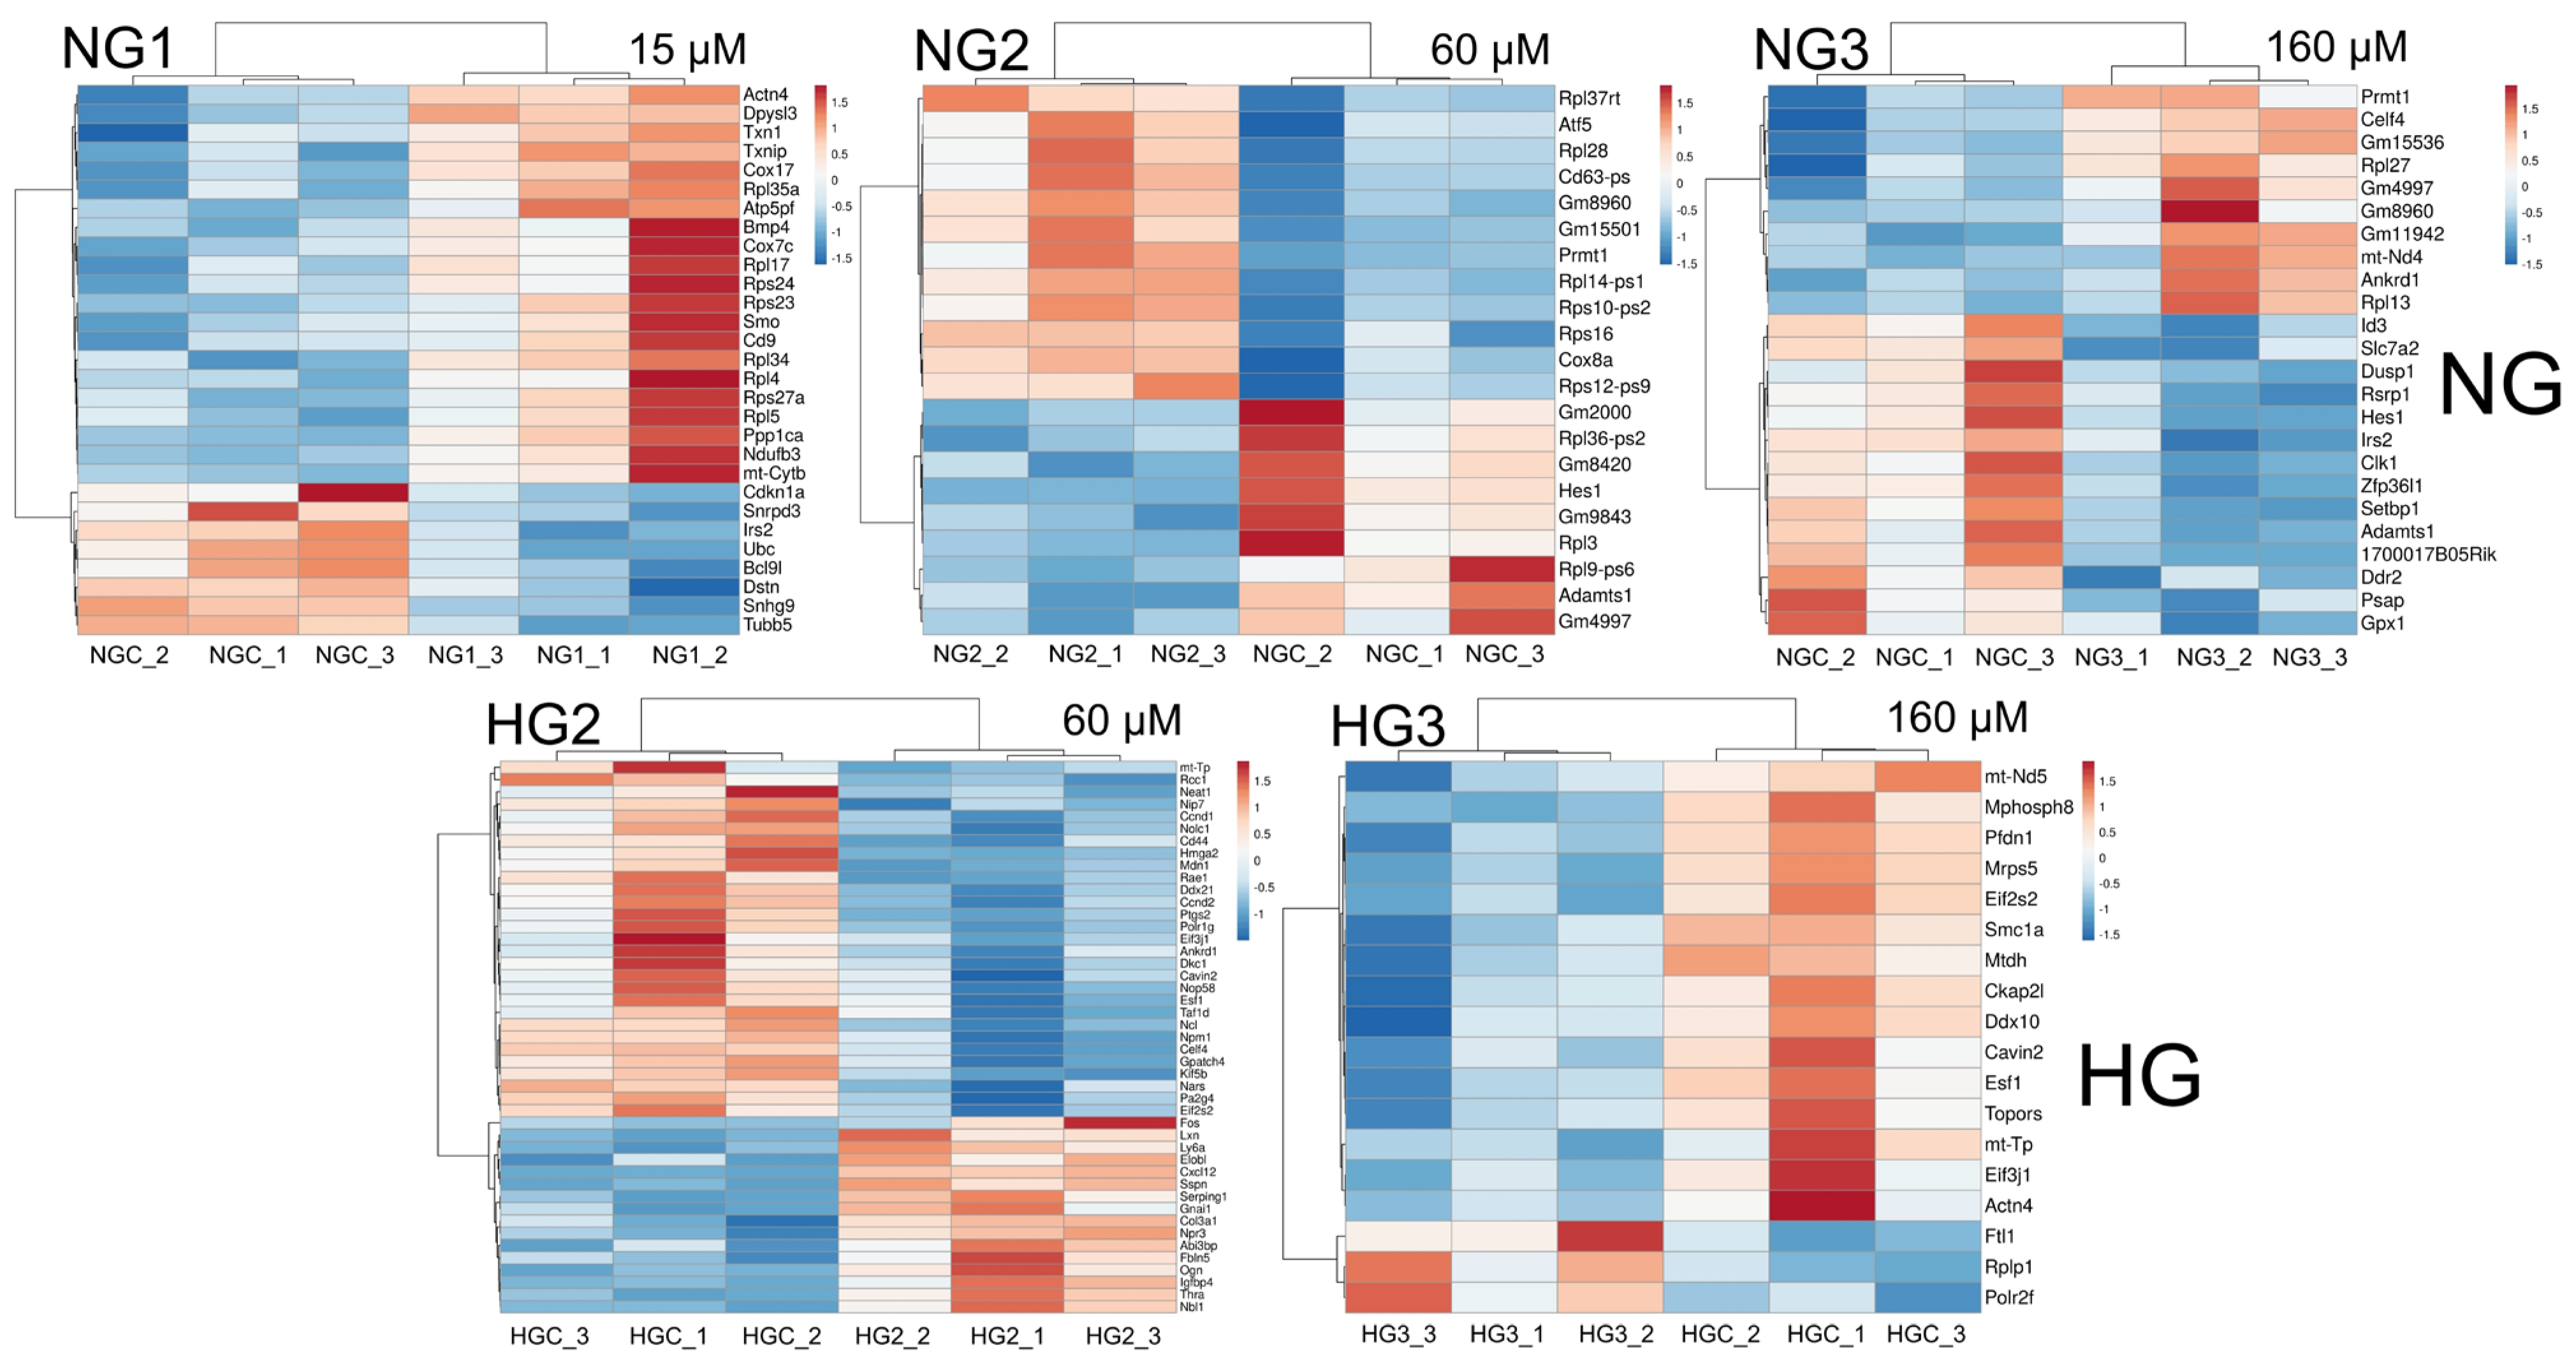
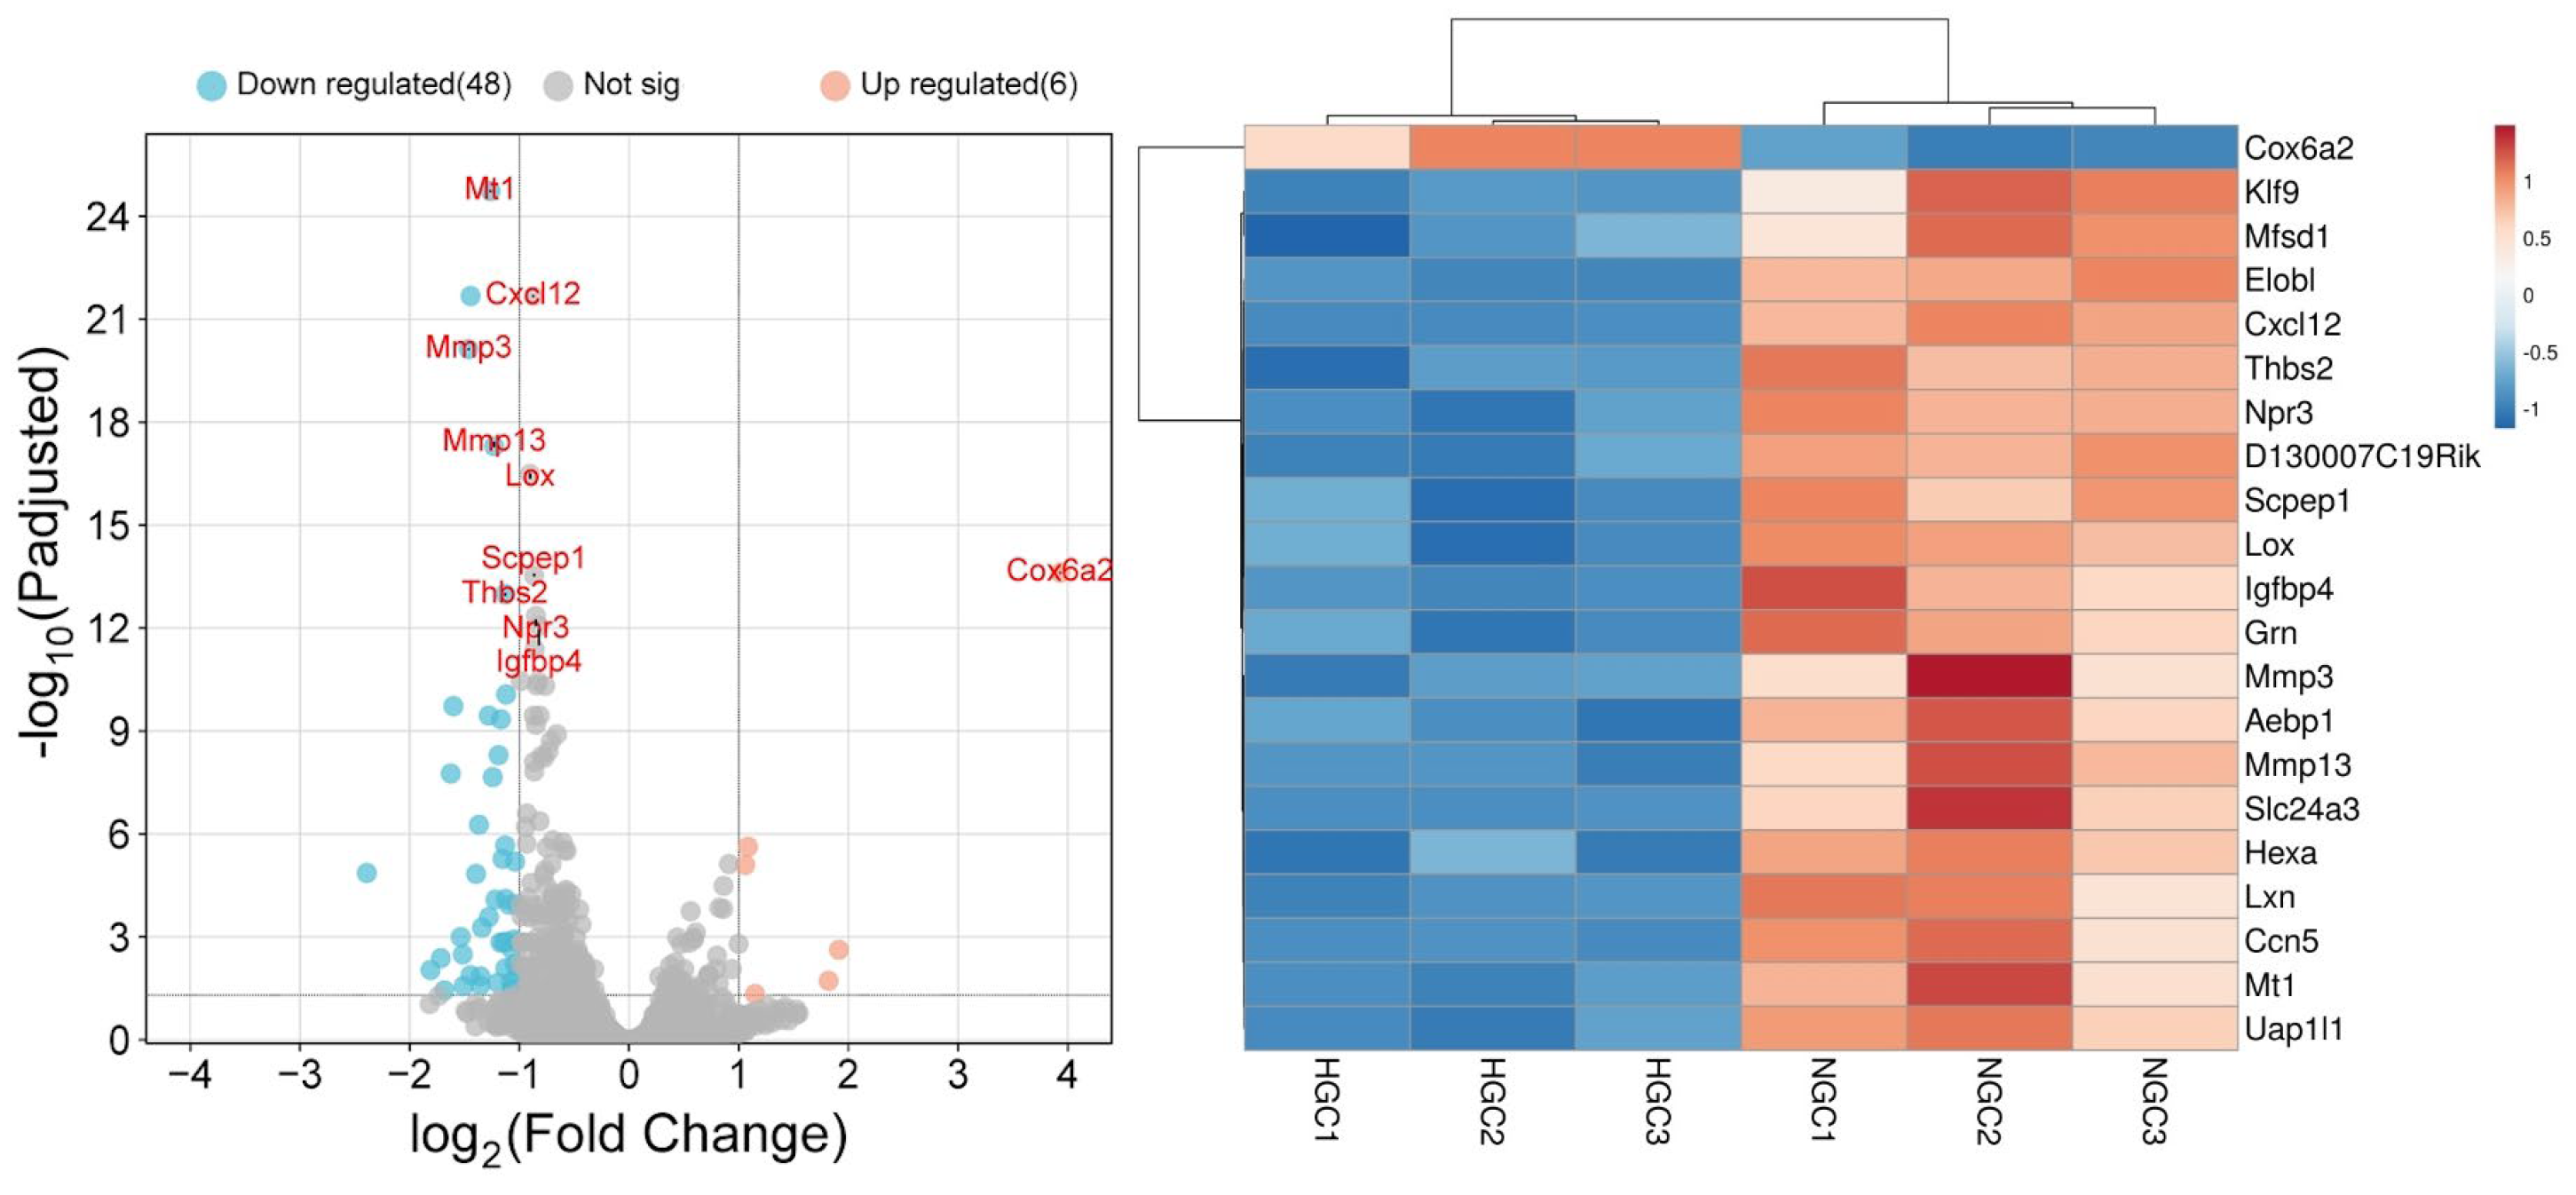
Our analysis revealed significant alterations in gene expression profiles upon MV treatment. Except for the HG1 analysis, a range of 18 to 103 genes exhibited differential expression with notably higher numbers in NG experiment groups. Figure 2 and Figure 3 visualize the distribution of differentially expressed genes based on fold change and statistical significance for all experimental groups. Figure 4 depicts differentially expressed genes when comparing control groups exposed to normal and high glucose concentrations in the medium. Further details regarding gene expression in all comparisons can be found in Supplementary File S1.
Pathway analysis was maintained with the use of QIAGEN IPA and KOBAS-i software and revealed from 20 to 48 pathways significantly modulated by MV. Among the enriched pathways (FDR < 0.1), there were, e.g., insulin resistance pathway, FoxO signaling pathway, insulin signaling pathway, the notch signaling pathway, the TGF-beta signaling pathway, type II diabetes mellitus, and the AMKP signaling pathway. The detailed information regarding the enriched pathways is presented in Supplementary File S2.
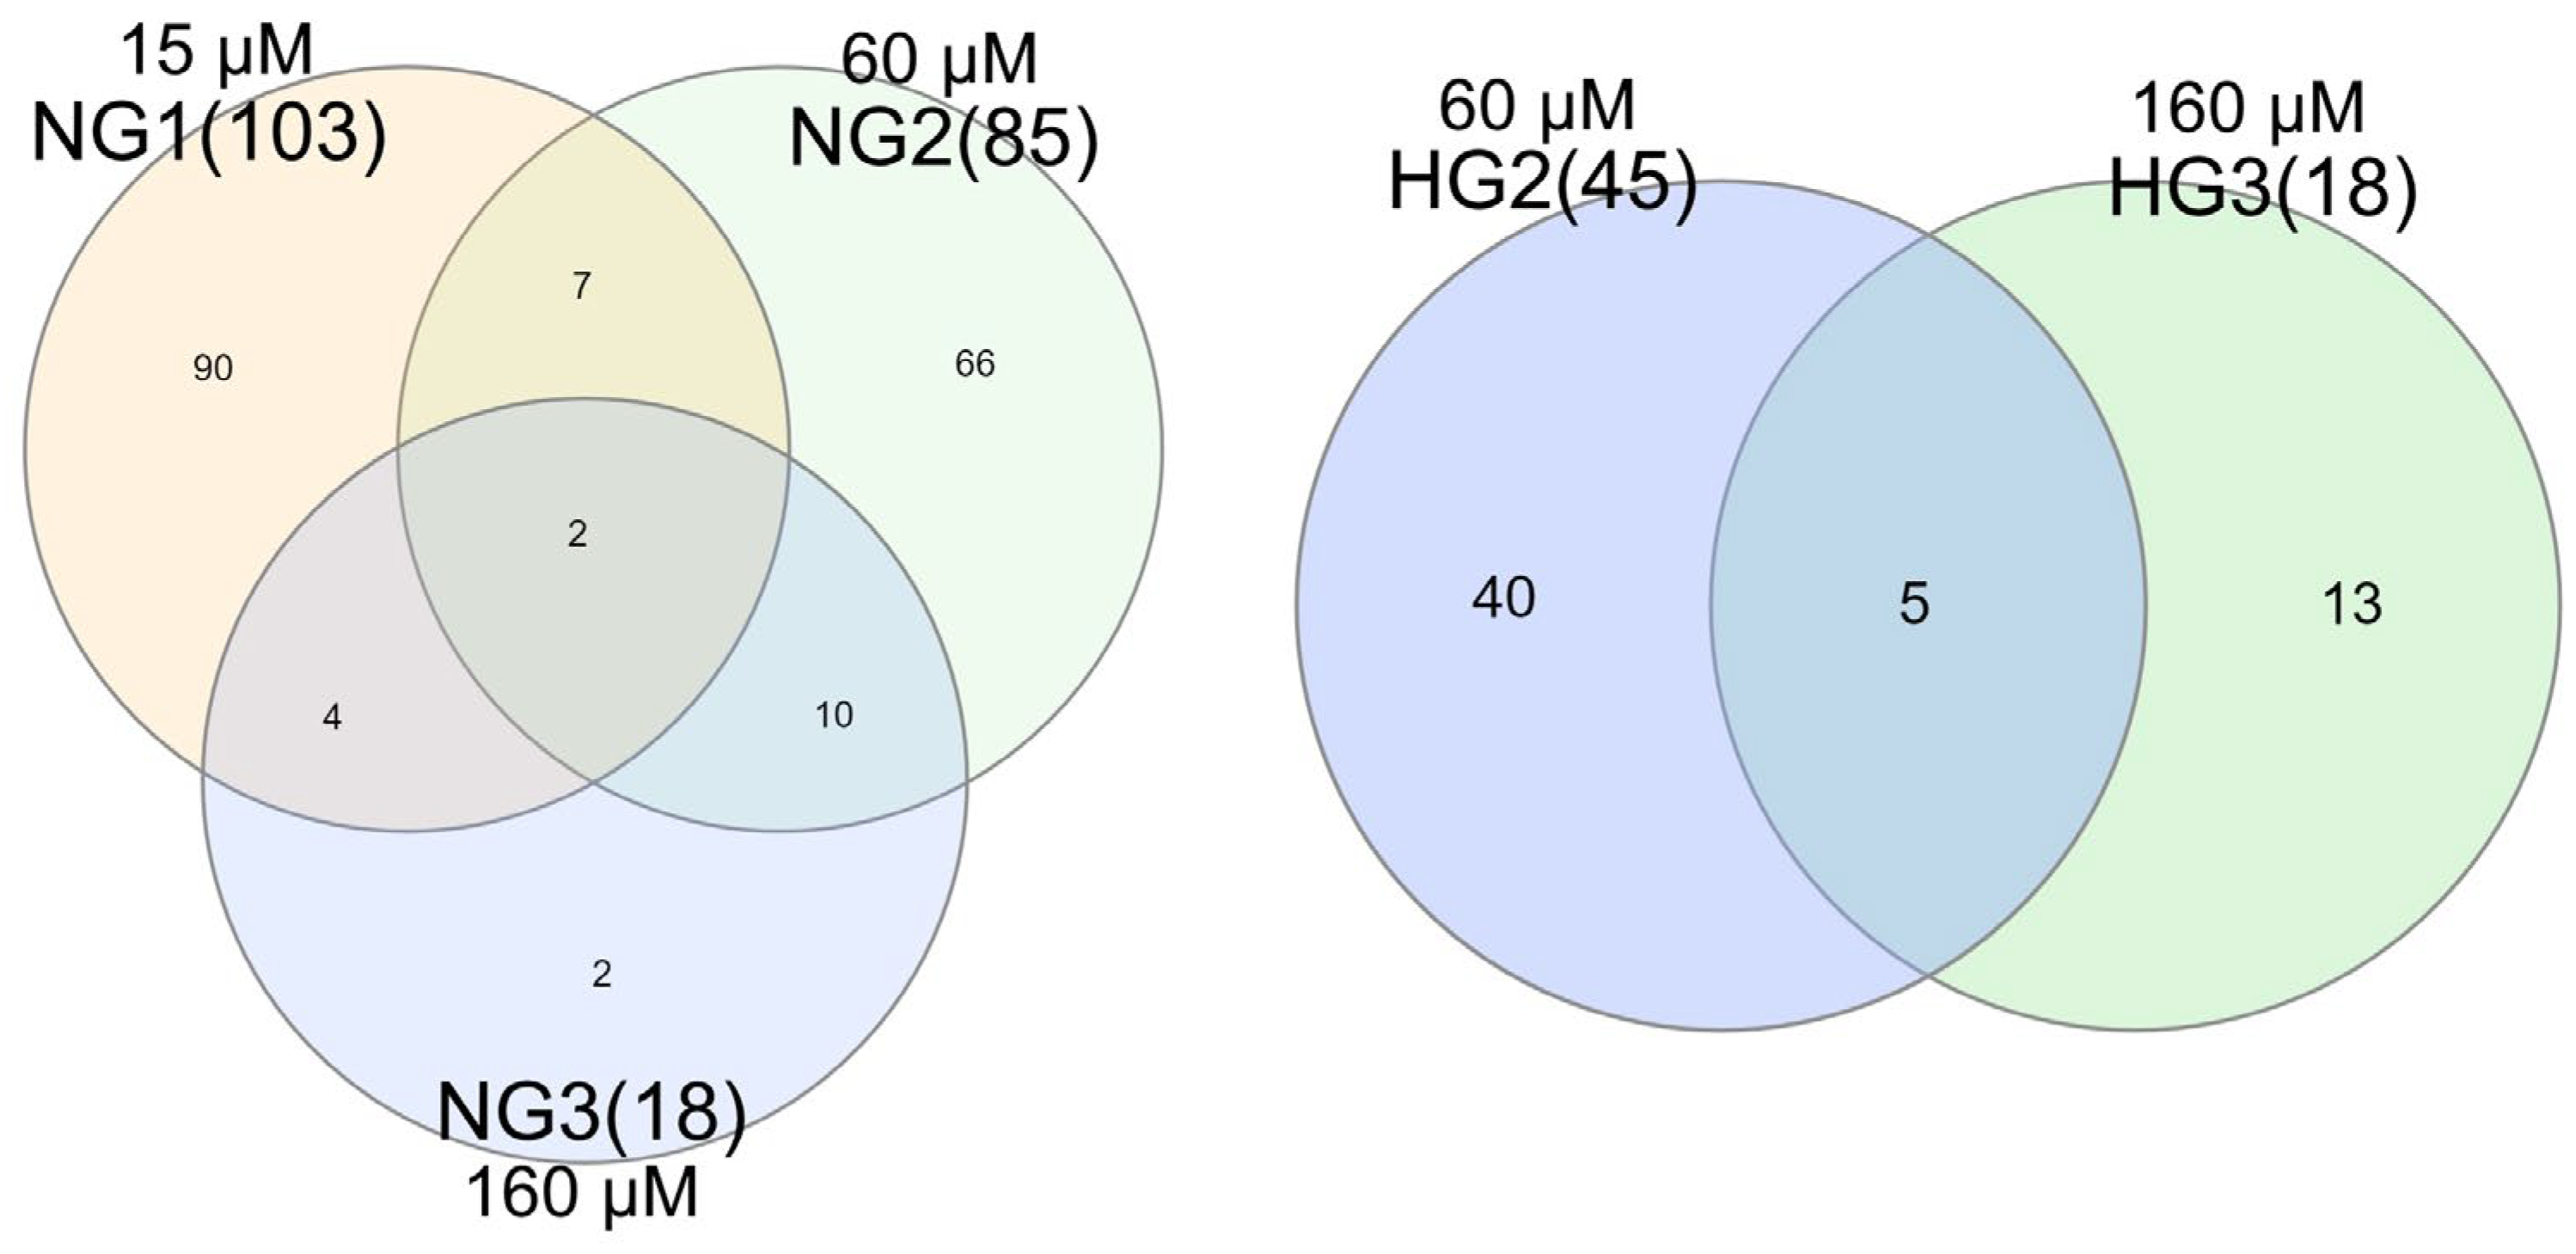
In addition, a number of DEGs were common between specific comparisons (Figure 5). To be exact, Irs2, a key component of the insulin signaling pathway involved in glucose metabolism and energy homeostasis, was identified in both the N1 and N3 analyses. It also indicated a statistical trend in N2; however, it was not significant. Between the N2 and N3 groups, six common genes (Id3, Adamts1, Gm4997, GM8960, Hes1, Prmt1) were identified that were associated with pathways related to glucose metabolism, such as the TGF-beta signaling pathway, glucagon signaling pathway, and FoxO signaling pathway. The complete list of identified pathways for genes common for all N experiments is provided in Table 2. When comparing the H2 and H3 analyses, five common genes were identified, mt-Tp, Eif2s2, Eif3j1, Cavin2, and Esf1, related to pathways such as metabolism of proteins, translation, and RNA transport.

3.4. Results of qPCR Validation

For qPCR validation, 7 differentially expressed genes were selected based on their fold change magnitude, biological relevance, and statistical significance in the RNA-Seq data. The selected genes include a range of upregulated and downregulated targets, ensuring a representative sample of the transcriptomic changes detected. The qPCR validation was performed using specific primers for each of the 7 selected genes. The relative expression levels were normalized to the internal controls HPRT and PPIA. The results presented in Table 3 show mostly moderate and strong Pearson correlation coefficients for all 7 genes used in the qPCR validation, comparing their expression levels with RNA-Seq results. Additional information regarding qPCR validation can be found in Supplementary File S3.

4. Discussion

In recent years MV has gained lots of attention because of its potential health benefits, such as reported anti-inflammatory and antioxidant properties or its relation to glucose metabolism [1,18,19]. Understanding how MV affects the transcriptome is a key challenge for unraveling its mechanisms of action and future potential therapeutic application. As far as we know, this is the first, or one of the first studies, that describes the effects of various dosages of MV supplementation on the transcriptome in cells subjected to normal and high glucose levels in the medium.
In the literature, mogrosides were shown to modulate blood glucose by inhibiting hyperglycaemia and were found beneficial in the prevention of diabetic complications related to hyperlipidemia in mice with induced diabetes [20,21]. Zhou et al. [22] in the in vitro model presented that MV may have a stimulating effect on insulin secretion, thus supported the findings that MV may provide a positive effect in diabetes. Our results can potentially support this finding, in which we observed significantly enriched Notch signaling pathway in both the NG2 and NG3 analyses related with a decreased expression of Hes1 gene after MV supplementation. In recent research by Eom et al. [23], it was shown that inhibition of the Notch signaling pathway can decrease insulin secretion. In addition to this, both the Notch signaling pathway and the FoxO signaling pathway, also significantly enriched in our study for NG2 and NG3, can be related with insulin sensitivity [24].
Some researchers, while studying antioxidant properties of mogrosides on pancreatic B cells, suggested that mogrosides may have an effect on genes regulating glucose metabolism; however, no explanation of the mechanisms behind this phenomenon were shown [25]. Although the precise role of mogrosides in glucose homeostasis remains largely unknown, a recent study showed that the AMPK-activating effect of mogrosides has been confirmed in vitro [26]. It is widely known that the activated AMPK demonstrates dual function on cell metabolism, inhibiting anabolic pathways to minimize ATP consumption (lipid and sterol syntheses, glycogen synthesis) and promoting catabolic pathways to replenish ATP (autophagy, glucose uptake and utilization, mitochondrial biogenesis, lipid utilization) [27]. Liu et al. [26] showed significant activation of AMPK in mogroside—supplemented diabetic mice. Mogroside stimulated the phosphorylation of AMPKα and acetyl-CoA carboxylase and caused a significant decrease in the fatty acid synthase level in mouse livers. This finding was also noted in our study, in which we observed enriched AMPK signaling pathway related to Irs2 gene in NG1, NG3, and Ccdn1 in the H2 analysis. The Irs2 gene acts as a key mediator in the insulin signaling pathway, and its deficiency may cause diabetes or other metabolic disorders [28]. Ccdn1 encodes cyclin D1, which is primarily known for its cell cycle regulation; however, recent research suggests its important role in glucose metabolism. The inhibition of this gene led to improved glucose tolerance and insulin sensitivity in mice [29]. In addition, when analyzing DEGs that were common in the N experiments, we observed a lot of significantly enriched pathways that were directly or indirectly associated with glucose metabolism, insulin resistance, or diabetes mellitus. An example of these can be the FoxO signaling pathway, which plays a crucial role in gluconeogenesis [30], or the TGF-beta signaling pathway, which is known for its function in the regulation of glucose metabolism and insulin sensitivity [31]. Altogether, this supports the finding that MV supplementation can be associated with glucose metabolism.
MV has also demonstrated protective antioxidant and anti-inflammatory activities in various cell and animal models in previous studies. In the research of Mo et al. [32], MV was shown to reduce H2O2-induced oxidative stress and increase the antioxidant activity of skin fibroblasts, showing the promising usage of MV as an ingredient in anti-aging cosmetic products. Xu et al. [25] found that mogrosides reduce oxidative stress induced by palmitic acid and proposed that it may be related to the FoxO signaling pathway. Moreover, they proposed that mogrosides could potentially exert their antioxidant properties by diminishing intracellular reactive oxygen species (ROS) levels and modulating the expression of genes associated with glucose metabolism. These observations directly link to the results of our study in which we observed significantly enriched FoxO signaling pathway in NG1 and NG3 and also observed significant changes in genes related to glucose metabolism. In addition, a number of significantly enriched pathways related to oxidative stress were demonstrated in our results. One of these is oxidative phosphorylation identified in NG1 and NG2, which can influence cellular redox balance and oxidative stress. Another interesting pathway altered by MV in NG1 can be the NOD-like receptor signaling pathway, which is linked with the regulation of inflammation and cancer [33]. Other researchers have highlighted the significant involvement of NOD-like receptors in innate immunity and inflammatory diseases. Thus, the identification of this pathway in our results further corroborates the documented activities of Mogroside V [34].
An additional significantly enriched pathway observed in NG2 and NG3, which may provide insights into the mechanism of MV action, is the Fanconi anemia pathway. Fanconi anemia in humans is associated with high oxidative stress and metabolic syndrome, which is manifested with diabetes and other abnormalities of glucose metabolism [35]. There is evidence suggesting that reactive oxygen species (ROS) can contribute to insulin resistance, as demonstrated by Jie et al. [36] and Li et al. [37] in the context of Fanconi anemia. Given that MV exhibits antioxidant properties and modulates glucose metabolism and insulin secretion, the observation of the Fanconi anemia pathway may contribute to its potential in alleviating oxidative stress and insulin-related metabolic dysfunctions.
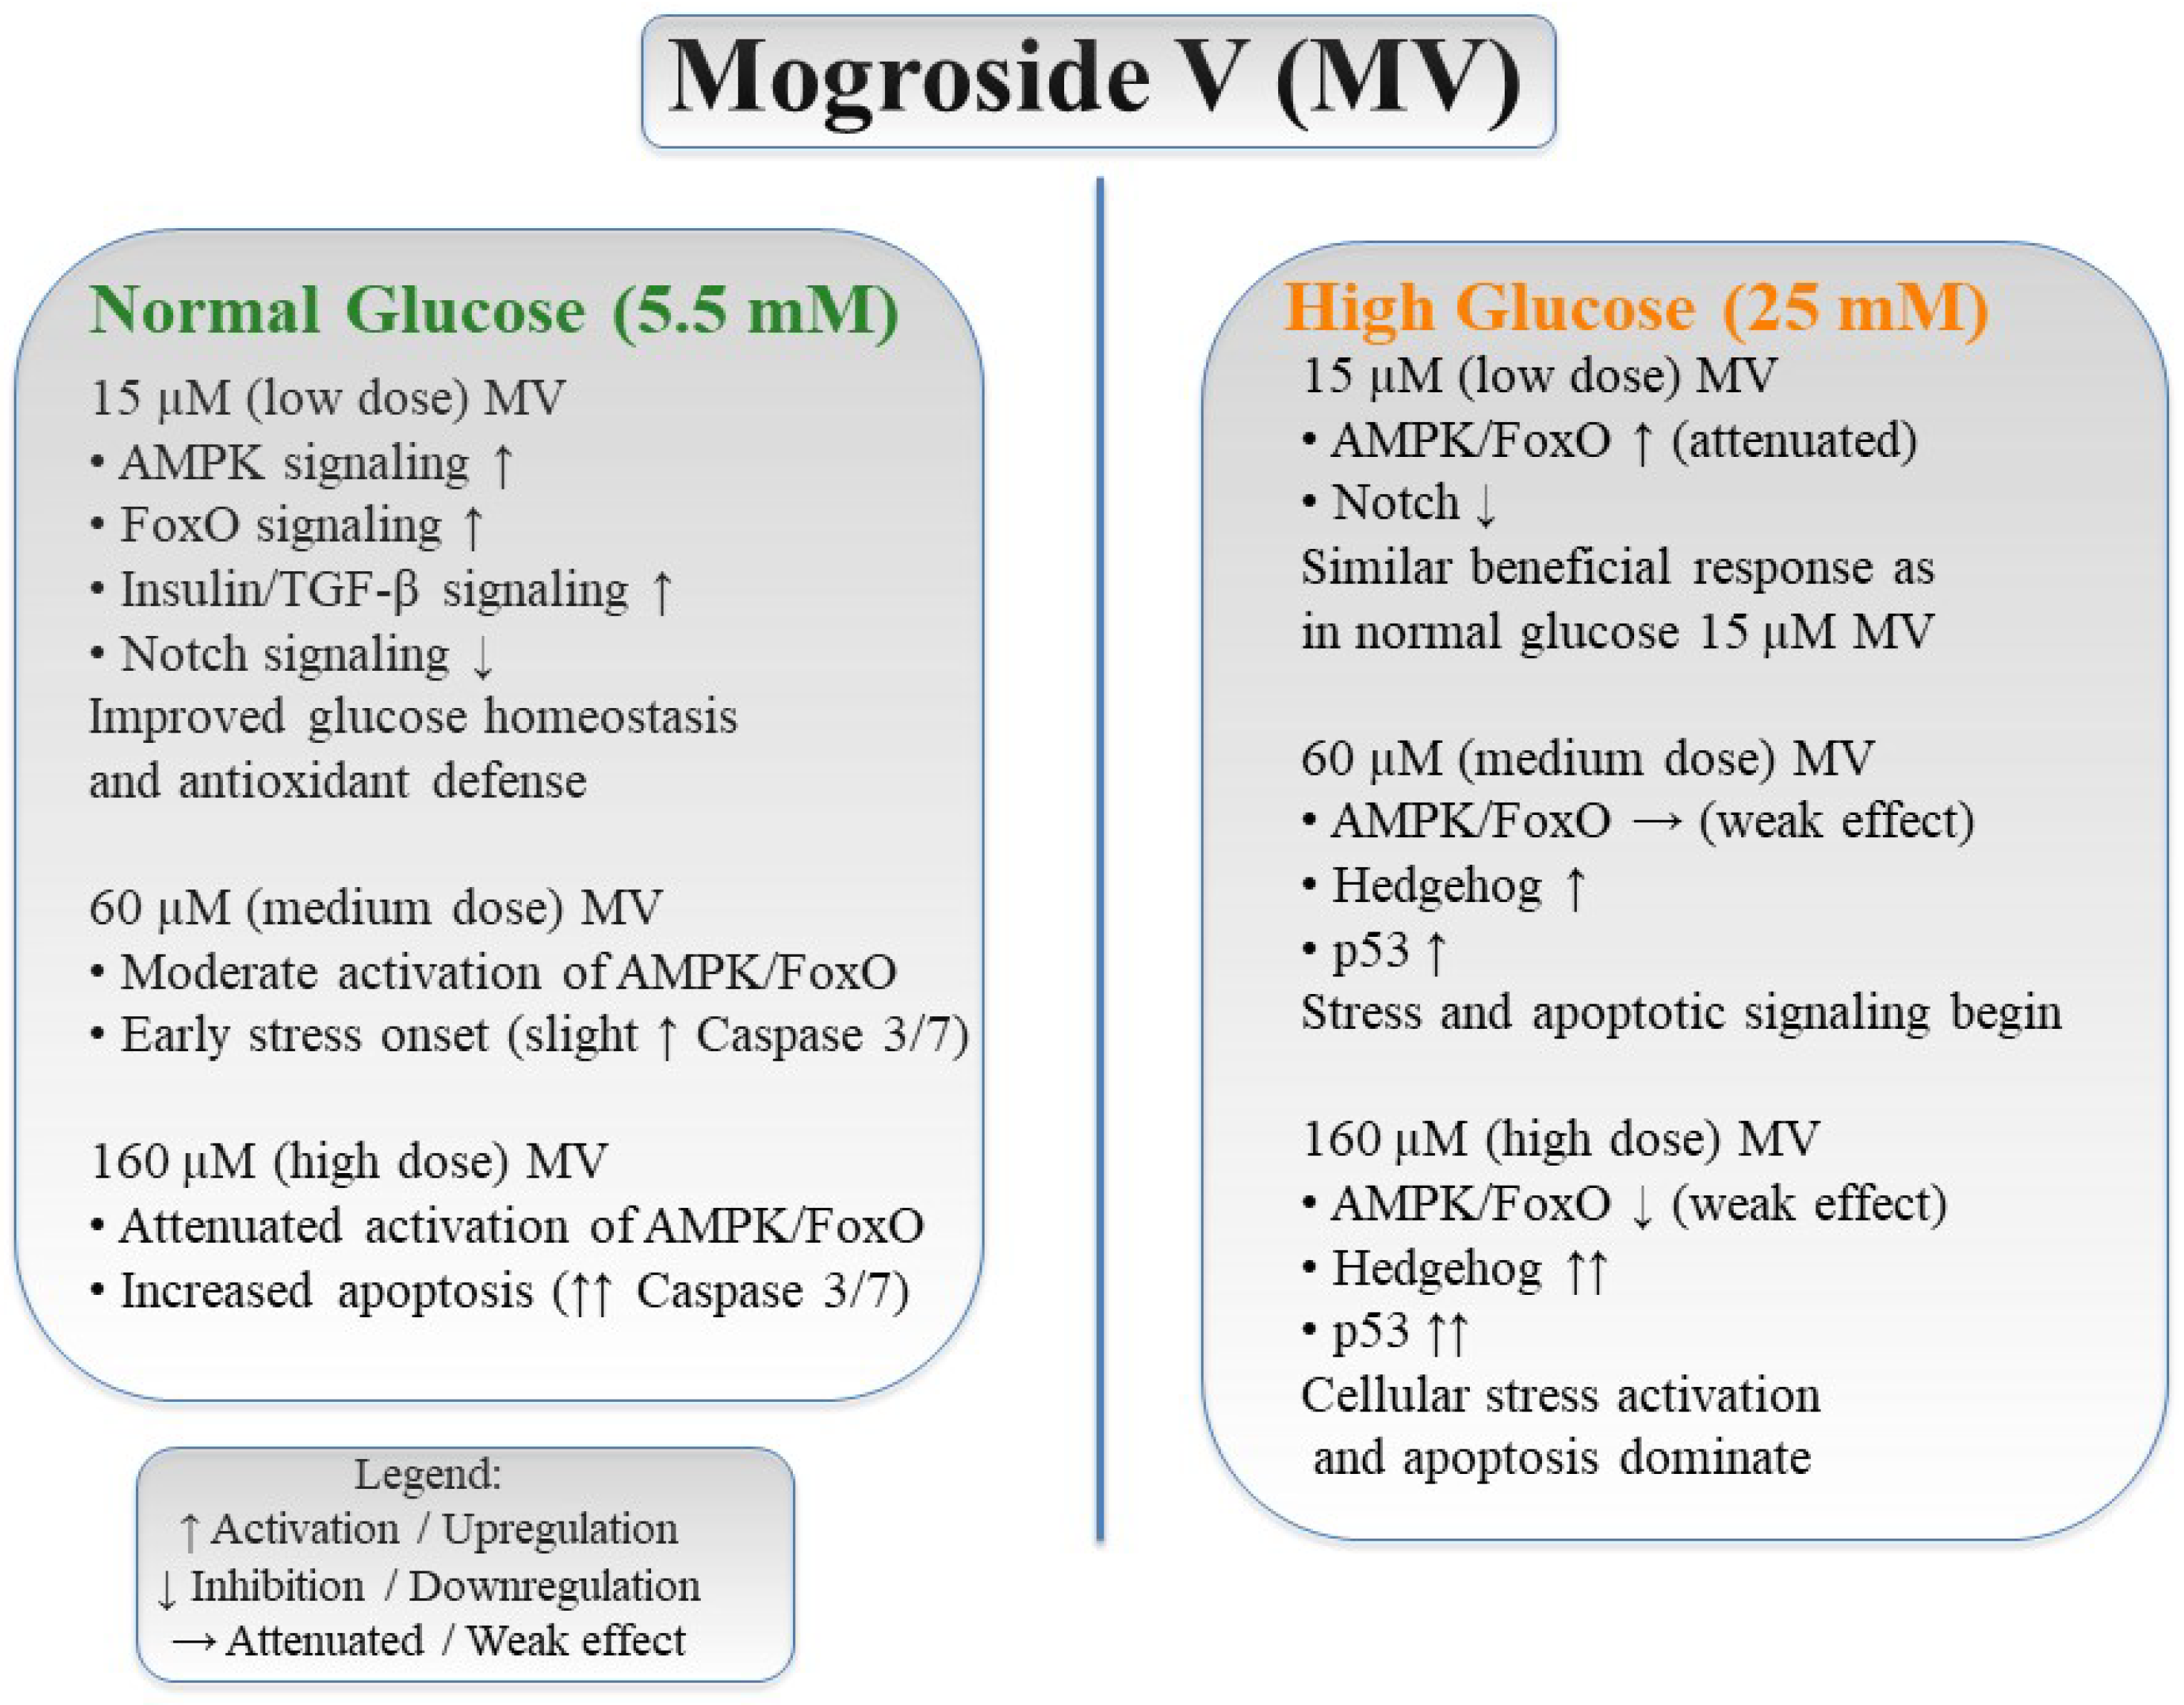
It is noteworthy that the observed modulatory effects of MV on glucose metabolism, as proposed in our results, discernible solely under conditions where glucose levels in the medium are within normal ranges, yet tend to diminish notably in the presence of elevated glucose concentrations. Specifically, under HG1 treatment, no significantly enriched pathways related to glucose metabolism were identified, while HG3 analysis did not demonstrate any such associations. In contrast, HG2 treatment yielded a noteworthy number of pathways, including the Hedgehog signaling pathway, which is known to be activated in hyperglycemia. This pathway not only plays an important role in lipid metabolism but also insulin sensitivity, inflammatory response, and diabetes-related complications [38]. Moreover, the p53 pathway, which is related to the regulation of glucose transporters, glycolysis, and apoptosis, was also altered by genes significant in HG2. Notably, dysregulation of p53 activity has been linked to various metabolic disorders such as diabetes and obesity [39]. These findings suggest that MV may retain its glucose metabolism-modulating properties even under high glucose conditions in the medium; however, this effect appears to be contingent upon specific dose-dependent conditions and disappears when low and high doses of MV are administered. It is noteworthy that when comparing the control groups from the NG and HG treatments, several pathways associated with glucose metabolism were identified. Among these were the mTOR, FoxO, and PPAR signaling pathways—pathways that were also modulated by MV administration. It is possible that in the HG1 treatment, the influence of elevated glucose levels in the medium may have overshadowed the impact of a low MV dosage, resulting in no differentially expressed genes. However, a 60 µM dose of MV clearly demonstrates its effect on metabolic processes related to glucose metabolism. Furthermore, in HG3, we identified several pathways associated with cell death, including necroptosis and ferroptosis. These findings suggest that high concentration of MV in the presence of elevated glucose levels in the medium may potentially induce cell lethality. To visually summarize the dose- and glucose-dependent effects of Mogroside V observed in our experiments, we provide an integrative schematic outlining the key molecular responses under NG and HG conditions (Figure 6).
It is noteworthy to mention that when comparing the control groups of both experiments, which differed in the concentration of glucose in the medium, we observed a substantial number of pathways associated with glucose metabolism and inflammation. Among these, the PI3K-Akt signaling pathway is particularly significant, as it is directly involved in enhancing glucose uptake and utilization through insulin signaling [40]. Furthermore, the TNFα signaling pathway was identified, which primarily induces insulin resistance and disrupts glucose homeostasis through inflammation [41]. Additionally, the IL-17 signaling pathway was observed, which may influence glucose metabolism indirectly by promoting inflammatory responses that can impair insulin sensitivity and glucose regulation [42]. Overall, several significantly enriched pathways related to glucose metabolism were identified, highlighting the critical role that glucose concentration in the medium plays in influencing gene expression.
The present transcriptomic data indicate that MV modulates several signaling cascades, including the AMPK, FoxO, and Notch pathways, which are known to interact in the hypothalamic regulation of energy and glucose metabolism [2,16]. AMPK acts as a key metabolic sensor that promotes ATP homeostasis by stimulating catabolic processes. Activation of AMPK can phosphorylate and activate FoxO transcription factors, leading to the upregulation of genes involved in antioxidant defense and autophagy. Notably, FoxO proteins can also regulate components of the Notch pathway, suggesting cross-talk that integrates cellular energy status with neurogenic and metabolic processes. The observed upregulation of AMPK-related genes and modulation of FoxO and Notch signaling by MV indicates a coordinated regulatory mechanism whereby MV enhances hypothalamic resilience to metabolic stress and supports neuronal glucose sensing.
Additionally, a notably higher number of genes exhibited differential expression in the NG experiments collectively, with 103 genes for NG1, 85 for NG2, and 18 for NG3, compared to the HG experiments, where no DEGs were observed for HG1, 45 for HG2, and 18 for HG3. This pattern highlights the glucose-dependent effects of MV. In NG, even small concentrations of MV appeared to modulate numerous genes, while in HG, low-dose MV did not alter gene expression. Unexpectedly, although 15 µM MV increased cell viability in both NG and HG conditions, RNA-seq analysis revealed no differentially expressed genes and no activation of caspase 3/7. This suggests that MV may act through post-transcriptional or metabolic mechanisms. Under NG, this may involve enhanced mitochondrial efficiency, while in HG, MV may buffer glucose-induced stress. These effects appear to support cellular function without requiring large transcriptional responses. At higher concentrations (60 and 160 µM), MV did not further improve viability but induced caspase activation and transcriptomic changes, consistent with early stress responses. The identification of pathways related to necroptosis and ferroptosis, despite stable viability in the RealTime-Glo™ MT Cell Viability Assay, suggests possible cytotoxic effects. Shared DEGs across concentrations were analyzed as an exploratory approach to identify candidate genes and pathways consistently responsive to MV. These results provide insight into MV’s dose-dependent actions and support further investigation into its antidiabetic potential.

5. Conclusions

In conclusion, MV emerges as a promising natural compound with significant therapeutic potential. Its effects encompass modulation of glucose metabolism, as well as anti-inflammatory and antioxidant properties, achieved through the modifications of pathways such as, among others, the FoxO, TGF-beta, Notch, AMPK, and insulin signaling pathways. In particular, MV’s potential in modulation of glucose levels and insulin secretion highlights its significance in the management of glucose metabolic disorders such as metabolic syndrome or diabetes. The used RNA-Seq method confirmed that the identified DEGs and pathways are indeed related to the proposed properties of MV; however, since our results are based only on adult hypothalamic mouse neuron cell lines, there is a need for justification on an animal model. Interestingly, the obtained results were mostly associated with glucose metabolism for treatments with normal levels of glucose levels in the medium and mostly disappeared in the presence of high glucose levels. Thus, further research into the molecular mechanisms underlying MV’s actions is undoubtedly necessary.

6. Limitations of the Study

This study was conducted using a single cell line and a relatively limited sample size. There is a clear need to extend this research to an animal model. In addition, the findings reported here have not been validated at the protein level. Functional assays related to glucose metabolism, such as measurements of glucose uptake, ATP levels, or AMPK activation, were not included in the current study. These experiments are planned as part of our follow-up research to validate the transcriptomic predictions at the functional level.

Supplementary Materials

The following supporting information can be downloaded at: https://www.mdpi.com/article/10.3390/app152312391/s1. Supplementary File S1. Differential Expression Results: Complete RNA-seq differential gene expression table, including gene IDs, fold changes, statistical values, adjusted p-values, and normalized counts for all replicates. Supplementary File S2. Pathway Enrichment Analysis: KEGG/functional enrichment results for differentially expressed genes, listing enriched pathways, significance values, and contributing genes. Supplementary File S3. Primer Sequences: List of forward and reverse primer sequences used for PCR/qPCR validation of selected genes.

Author Contributions

Conceptualization, T.S. and A.G.; methodology, T.S.; software, T.S.; validation, I.J., E.O. and E.S.-G.; formal analysis, T.S.; investigation, T.S.; resources, I.J.; data curation, T.S.; writing—original draft preparation, T.S.; writing—review and editing, A.G., E.O.; visualization, T.S.; supervision, A.G.; project administration, A.G.; funding acquisition, A.G. All authors have read and agreed to the published version of the manuscript.

Funding

All funding was financed through the University of Agriculture in Krakow’s own resources.

Institutional Review Board Statement

Not applicable.

Informed Consent Statement

Not applicable.

Data Availability Statement

Raw sequencing reads and the results used for Deseq2 analysis were submitted to GEO repository under the GSE275887 entry.

Conflicts of Interest

The authors declare that they have no known competing financial interests or personal relationships that could have appeared to influence the work reported in this paper.

Abbreviations

MV—mogroside V; NG represents normal glucose levels in medium. NG1 refers to 15 µM of mogroside V administration, NG2 to 60 µM, and NG3 to 160 µM; HG represents high glucose levels in medium. HG1 refers to 15 µM of mogroside V administration, HG2 to 60 µM, and HG3 to 160 µM.

References

  1. Wang, S.; Cui, K.; Liu, J.; Hu, J.; Yan, K.; Xiao, P.; Lu, Y.; Yang, X.; Liang, X. Mogroside-rich extract from Siraitia grosvenorii fruits ameliorates high-fat diet-induced obesity associated with the modulation of gut microbiota in mice. Frontiers 2022, 9, 870394. [Google Scholar] [CrossRef]
  2. Zhang, J.; Li, X.; Chen, Y.; Wang, H.; Liu, Z. Mogroside V: A Review of Its Structure, Synthesis, Pharmacokinetics, and Toxicity. Arch. Pharm. 2025, 358, e2400398. [Google Scholar] [CrossRef]
  3. Wu, J.; Jian, Y.; Wang, H.; Huang, H.; Gong, L.; Liu, G.; Yang, Y.; Wang, W. A review of the phytochemistry and pharmacology of the fruit of Siraitia grosvenorii (Swingle): A traditional Chinese medicinal food. Molecules 2022, 27, 6618. [Google Scholar] [CrossRef] [PubMed]
  4. Dalvi, P.S.; Nazarians-Armavil, A.; Tung, S.; Belsham, D.D. Immortalized neurons for the study of hypothalamic function. Am. J. Physiol. Regul. Integr. Comp. Physiol. 2011, 300, 1030–1052. [Google Scholar] [CrossRef] [PubMed]
  5. Dalvi, P.S.; Loganathan, N.; McIlwraith, E.K.; Tran, A.; Belsham, D.D. Chapter 2—Hypothalamic Cell Models, 2nd ed.; Academic Press: Cambridge, MA, USA, 2021; pp. 27–77. [Google Scholar]
  6. Nie, J.; Sui, L.; Zhang, H.; Zhang, H.; Yan, K.; Yang, X.; Lu, S.; Lu, K.; Liang, X. Mogroside V protects porcine oocytes from in vitro ageing by reducing oxidative stress through SIRT1 upregulation. Aging 2019, 11, 8362–8373. [Google Scholar] [CrossRef] [PubMed]
  7. Luo, H.; Peng, C.; Xu, X.; Peng, Y.; Shi, F.; Li, Q.; Dong, J.; Chen, M. The Protective Effects of Mogroside V Against Neuronal Damages by Attenuating Mitochondrial Dysfunction via Upregulating Sirtuin3. Mol. Neurobiol. 2022, 59, 2068–2084. [Google Scholar] [CrossRef]
  8. Tang, Q.; Qiu, R.; Guo, M.; Wang, L.; Zhang, Y.; Chen, Y.; Cheng, Y. Mogroside V and mogrol: Unveiling the neuroprotective and metabolic regulatory roles of Siraitia grosvenorii in Parkinson’s disease. Front. Pharmacol. 2024, 15, 1413520. [Google Scholar] [CrossRef]
  9. Sullivan, K.A.; Hayes, J.M.; Wiggin, T.D.; Backus, C.; Oh, S.S.; Lentz, S.I.; Brosius, F.; Feldman, E.L. Mouse models of diabetic neuropathy. Neurobiol. Dis. 2007, 28, 276–285. [Google Scholar] [CrossRef]
  10. Crouch, S.P.M.; Kozlowski, R.; Slater, K.J.; Fletcher, J. The use of ATP bioluminescence as a measure of cell proliferation and cytotoxicity. J. Immunol. Methods 1993, 160, 81–88. [Google Scholar] [CrossRef]
  11. Thornberry, N.A.; Lazebnik, Y. Caspases: Enemies within. Science 1998, 281, 1312–1316. [Google Scholar] [CrossRef]
  12. R Core Team. R: A Language and Environment for Statistical Computing, version 2024, 4.3.2.; R Foundation for Statistical Computing: Vienna, Austria, 2024. [Google Scholar]
  13. Dodt, M.; Roehr, J.T.; Ahmed, R.; Dieterich, C. FLEXBAR-Flexible barcode and adapter processing for next-generation sequencing platforms. Biology 2012, 1, 895–905. [Google Scholar] [CrossRef]
  14. Dobin, A.; Davis, C.A.; Schlesinger, F.; Drenkow, J.; Zaleski, C.; Jha, S.; Batut, P.; Chaisson, M.; Gingeras, T.R. STAR: Ultrafast universal RNA-seq aligner. Bioinformatics 2013, 29, 15–21. [Google Scholar] [CrossRef]
  15. Anders, S.; Pyl, P.T.; Huber, W. HTSeq—A Python framework to work with high-throughput sequencing data. Bioinformatics 2015, 31, 166–169. [Google Scholar] [CrossRef]
  16. Love, M.I.; Huber, W.; Anders, S. Moderated estimation of fold change and dispersion for RNA-seq data with DESeq2. Genome Biol. 2014, 15, 550. [Google Scholar] [CrossRef]
  17. Bu, D.; Luo, H.; Huo, P.; Wang, Z.; Zhang, S.; He, Z.; Wu, Y.; Zhao, L.; Liu, J.; Guo, J.; et al. KOBAS-i: Intelligent prioritization and exploratory visualization of biological functions for gene enrichment analysis. Nucleic Acids Res. 2021, 49, 317–325. [Google Scholar] [CrossRef] [PubMed]
  18. Livak, K.J.; Schmittgen, T.D. Analysis of relative gene expression data using real-time quantitative PCR and the 2−ΔΔCt method. Methods 2001, 25, 402–408. [Google Scholar] [CrossRef] [PubMed]
  19. Lu, R.; Hu, J.; Liu, X.; Yu, L.; Hu, J.; Jiang, H.; Liu, S.; Li, M.; He, J.; Yang, X.; et al. Mogroside-rich extract from Siraitia grosvenorii fruits protects against heat stress-induced intestinal damage by ameliorating oxidative stress and inflammation in mice. Food Funct. 2023, 14, 1238–1247. [Google Scholar] [CrossRef]
  20. Liu, H.; Wang, C.; Qi, X.; Zou, J.; Sun, Z. Antiglycation and antioxidant activities of mogroside extract from Siraitia grosvenorii (Swingle) fruits. J. Food Sci. Technol. 2018, 55, 1880–1888. [Google Scholar] [CrossRef]
  21. Qi, X.Y.; Chen, W.J.; Zhang, L.Q.; Xie, B.J. Mogrosides extract from Siraitia grosvenori scavenges free radicals in vitro and lowers oxidative stress, serum glucose, and lipid levels in alloxan-induced diabetic mice. Nutr. Res. 2008, 28, 278–284. [Google Scholar] [CrossRef] [PubMed]
  22. Zhou, Y.; Zheng, Y.; Ebersole, J.; Huang, C.F. Insulin secretion stimulating effects of Mogroside V and fruit extract of luo han kuo (Siraitia grosvenori Swingle) fruit extract. Yao Xue Xue Bao 2009, 44, 1252–1257. [Google Scholar]
  23. Eom, Y.S.; Gwon, A.R.; Kwak, K.M.; Youn, J.Y.; Park, H.; Kim, K.W.; Kim, B.J. Notch1 has an important role in β-cell mass determination and development of diabetes. Diabetes Metab. J. 2021, 45, 86–96. [Google Scholar] [CrossRef] [PubMed]
  24. Pajvani, U.B.; Shawber, C.J.; Samuel, V.T.; Birkenfeld, A.L.; Shulman, G.I.; Kitajewski, J.; Accili, D. Inhibition of Notch signaling ameliorates insulin resistance in a FoxO1-dependent manner. Nat. Med. 2011, 17, 961–967. [Google Scholar] [CrossRef]
  25. Xu, Q.; Chen, S.Y.; Deng, L.D.; Feng, L.P.; Huang, L.Z.; Yu, R.R. Antioxidant effect of mogrosides against oxidative stress induced by palmitic acid in mouse insulinoma NIT-1 cells. Braz. J. Med. Biol. Res. 2013, 46, 949–955. [Google Scholar] [CrossRef] [PubMed]
  26. Liu, L.; Zheng, W.; Wang, C.; Qi, J.; Li, H. Mogroside V protects against hepatic steatosis in mice on a high-fat diet and LO2 cells treated with free fatty acids via AMPK activation. Evid. Based Complement Altern. Med. 2020, 2020, 7826874. [Google Scholar] [CrossRef]
  27. Lin, S.C.; Hardie, D.G. AMPK: Sensing glucose as well as cellular energy status. Cell Metab. 2018, 27, 299–313. [Google Scholar] [CrossRef]
  28. Griffeth, R.J.; Carretero, J.; Burks, D.J. Insulin receptor substrate 2 is required for testicular development. PLoS ONE 2013, 8, e62103. [Google Scholar] [CrossRef] [PubMed]
  29. Bhalla, K.; Liu, W.J.; Thompson, K.; Anders, L.; Devarakonda, S.; Dewi, R.; Buckley, S.; Hwang, B.J.; Polster, B.; Dorsey, S.G.; et al. Cyclin D1 represses gluconeogenesis via inhibition of the transcriptional coactivator PGC1α. Diabetes 2014, 63, 3266–3278. [Google Scholar] [CrossRef]
  30. Salih, D.A.; Brunet, A. FoxO transcription factors in the maintenance of cellular homeostasis during aging. Curr. Opin. Cell Biol. 2008, 20, 126–136. [Google Scholar] [CrossRef]
  31. Liu, H.; Chen, Y.G. The interplay between TGF-β signaling and cell metabolism. Front. Cell Dev. Biol. 2022, 10, 846723. [Google Scholar] [CrossRef]
  32. Mo, Q.; Fu, H.; Zhao, D.; Zhang, J.; Wang, C.; Wang, D.; Li, M. Protective effects of Mogroside V on oxidative stress induced by H2O2 in skin fibroblasts. Drug Des. Dev. Ther. 2021, 15, 4901–4909. [Google Scholar] [CrossRef]
  33. Saxena, M.; Yeretssian, G. NOD-like receptors: Master regulators of inflammation and cancer. Front. Immunol. 2014, 14, 327. [Google Scholar] [CrossRef]
  34. Chen, G.; Shaw, M.H.; Kim, Y.G.; Nuñez, G. NOD-like receptors: Role in innate immunity and inflammatory disease. Annu. Rev. Pathol. 2009, 4, 365–398. [Google Scholar] [CrossRef]
  35. Elder, D.A.; D’Alessio, D.A.; Eyal, O.; Mueller, R.; Smith, F.O.; Kansra, A.R.; Rose, S.R. Abnormalities in glucose tolerance are common in children with Fanconi anemia and associated with impaired insulin secretion. Pediatr. Blood Cancer 2008, 51, 256–260. [Google Scholar] [CrossRef]
  36. Noda, T.; Takahashi, A.; Kondo, N.; Mori, E.; Okamoto, N.; Nakagawa, Y.; Ohnishi, K.; Zdzienicka, M.Z.; Thompson, L.H.; Helleday, T.; et al. Repair pathways independent of the Fanconi anemia nuclear core complex play a predominant role in mitigating formaldehyde-induced DNA damage. Biochem. Biophys. Res. Commun. 2011, 404, 206–210. [Google Scholar] [CrossRef] [PubMed]
  37. Li, J.; Sipple, J.; Maynard, S.; Mehta, P.A.; Rose, S.R.; Davies, S.M.; Pang, Q. Fanconi anemia links reactive oxygen species to insulin resistance and obesity. Antioxid. Redox Signal. 2012, 17, 1083–1098. [Google Scholar] [CrossRef]
  38. Benchoula, K.; Parhar, I.S.; Wong, E.H. The crosstalk of hedgehog, PI3K and Wnt pathways in diabetes. Arch. Biochem. Biophys. 2021, 15, 108743. [Google Scholar] [CrossRef] [PubMed]
  39. Kung, C.P.; Murphy, M.E. The role of the p53 tumor suppressor in metabolism and diabetes. J. Endocrinol. 2016, 231, 61–75. [Google Scholar] [CrossRef] [PubMed]
  40. Manning, B.D.; Toker, A. AKT/PKB signaling: Navigating the network. Cell 2017, 169, 381–405. [Google Scholar] [CrossRef]
  41. Hotamisligil, G.S. Inflammation and metabolic disorders. Nature 2006, 444, 860–867. [Google Scholar] [CrossRef]
  42. Korn, T.; Bettelli, E.; Oukka, M.; Kuchroo, V.K. IL-17 and Th17 cells. Annu. Rev. Immunol. 2009, 27, 485–517. [Google Scholar] [CrossRef]
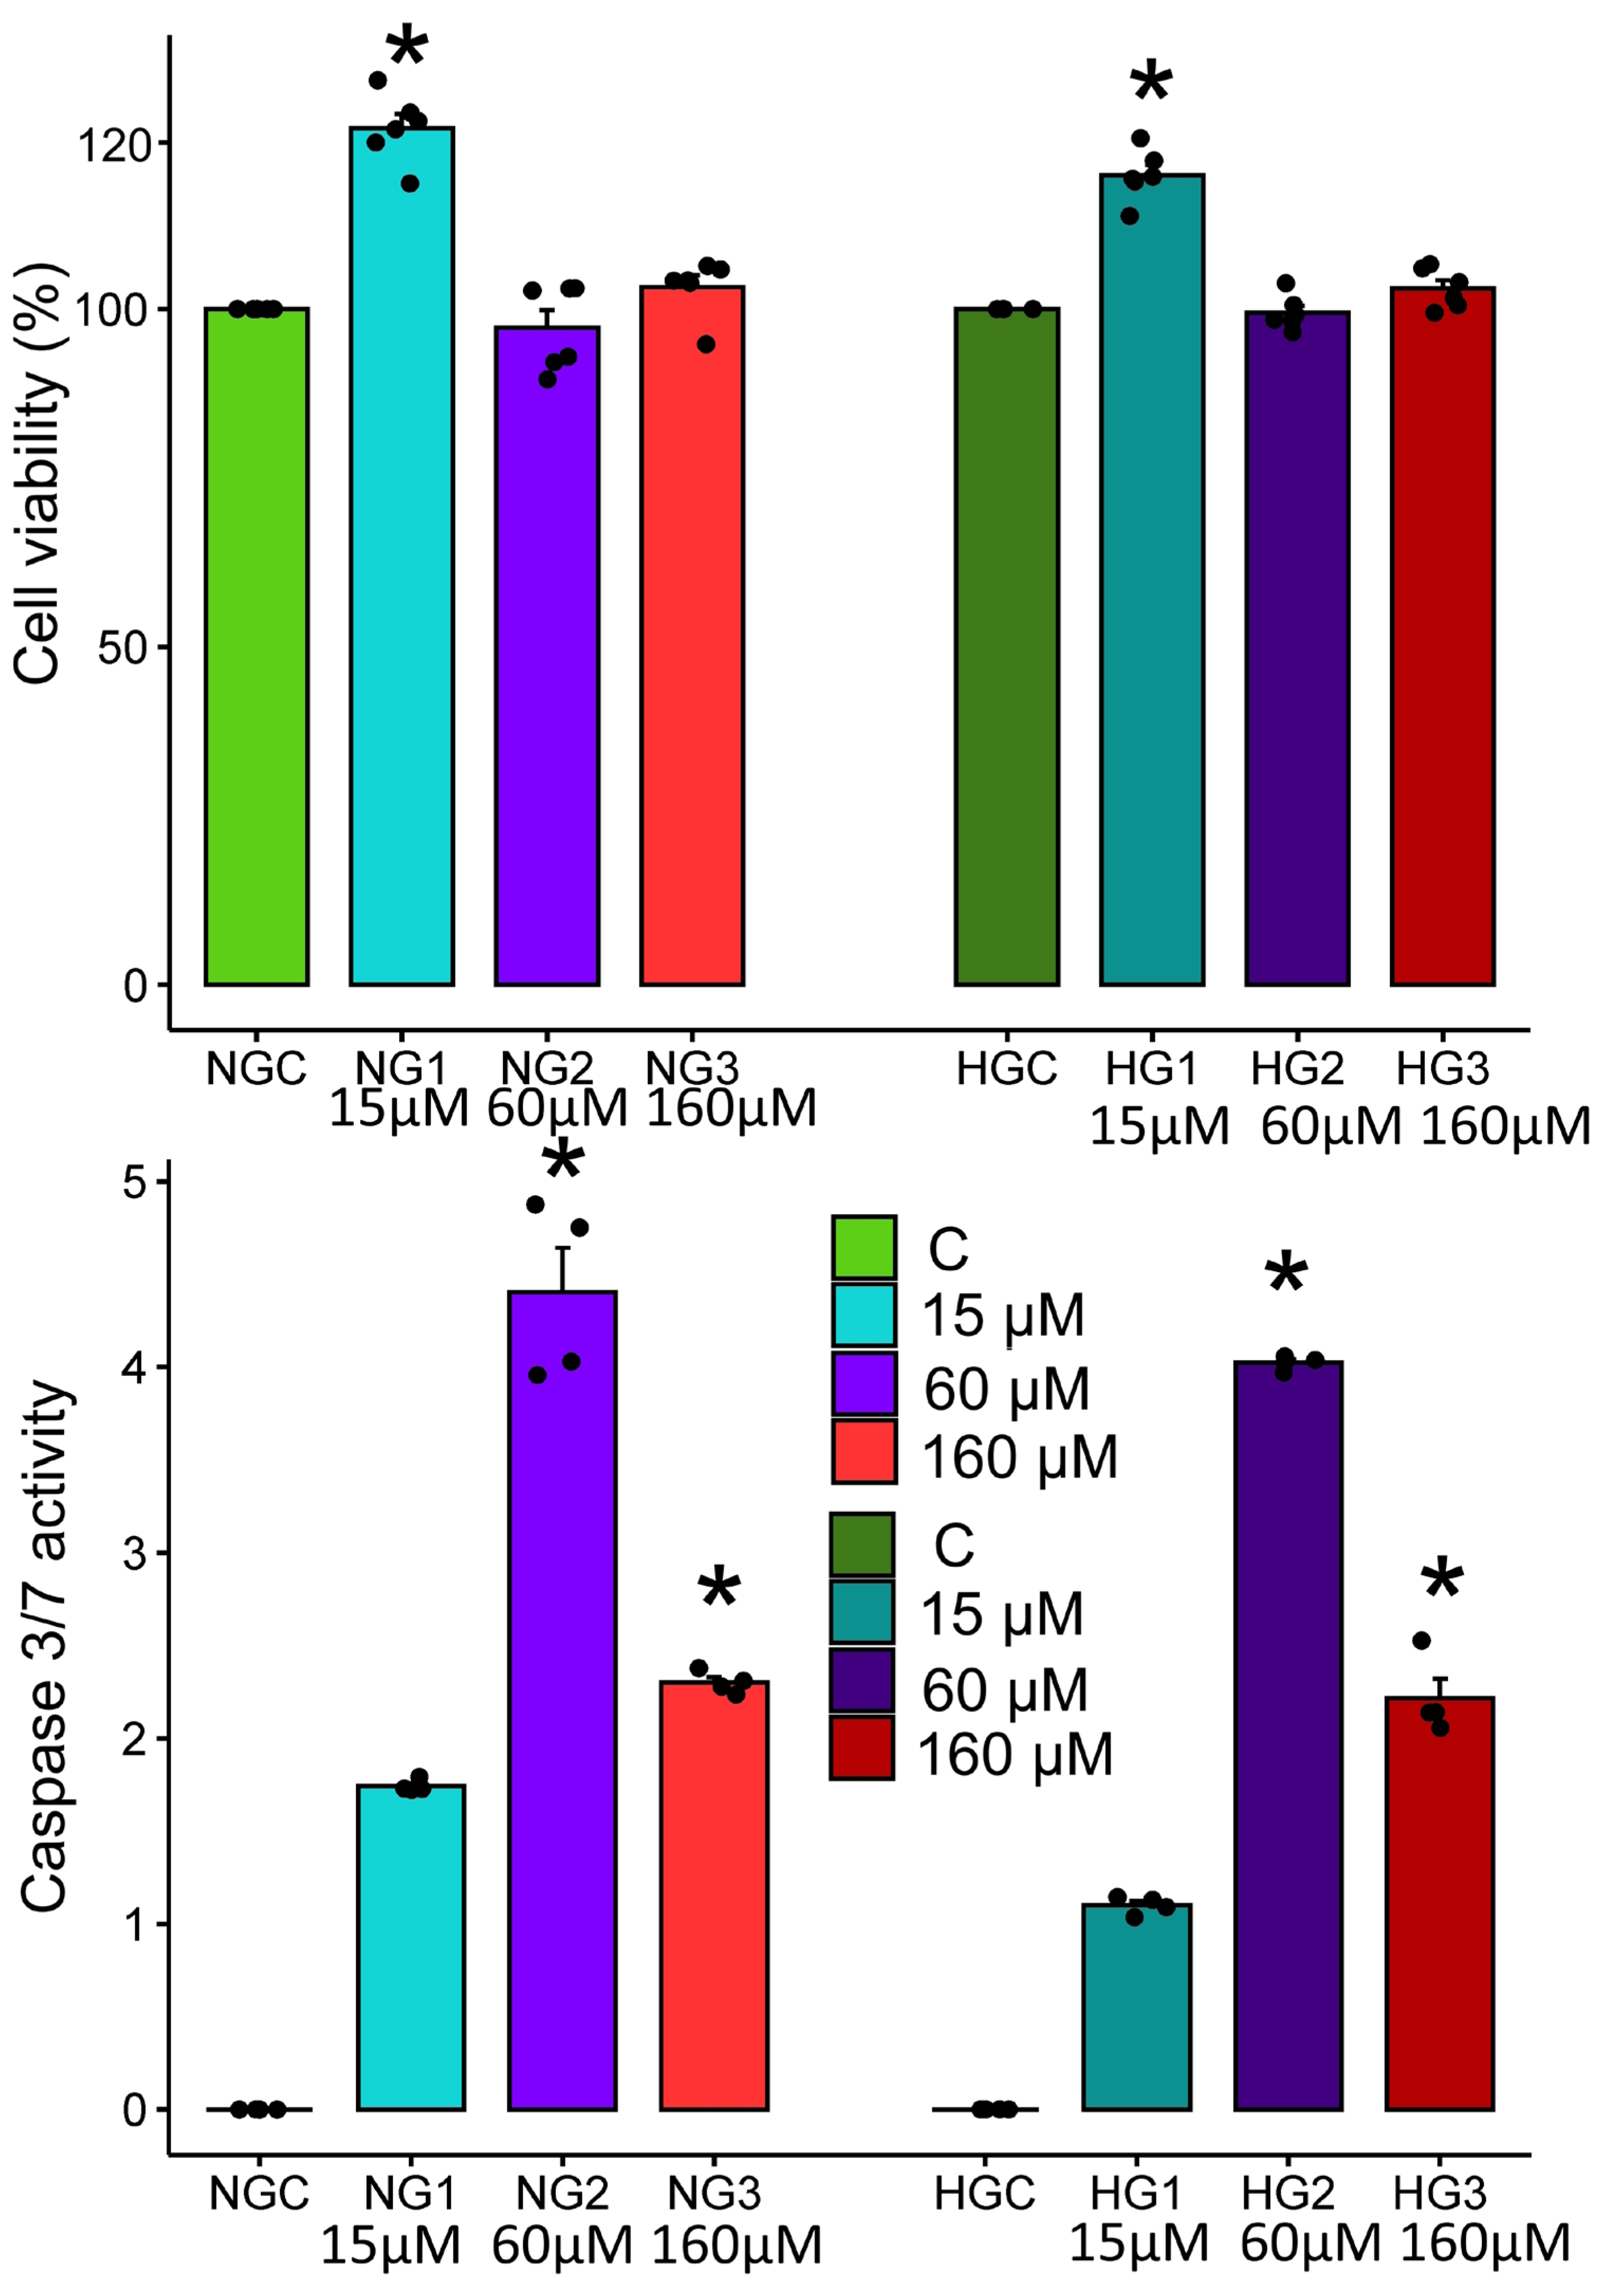
Figure 1. Bar lots representing cell viability and caspase 3/7 activity in all experimental groups. NG represents normal glucose levels in medium, and HG represents high glucose in medium. 1–3 represent different concentrations of MV supplementation. Star (*) represents a statistical difference observed between studied groups with p value set to <0.05. The number of replicates within each group is set to six.
Applsci 15 12391 g001
Figure 2. Volcano plots showing differentially expressed genes in all six experimental groups relative to control cells (vehicle). NG represents normal glucose levels in medium, and HG represents high glucose in medium. 1–3 represent different concentrations of MV supplementation. The number of replicates within each group is set to three.
Applsci 15 12391 g002
Figure 3. Heatmap illustrating the expression pattern alterations relative to control cells of differentially expressed genes across five experimental groups. NG- represents normal glucose levels in medium, HG- high glucose in medium. 1–3 represent different concentrations of MV supplementation. The number of replicates within each group is set to three.
Applsci 15 12391 g003
Figure 4. Volcano and heatmap plots depicting differentially expressed genes between control groups exposed to normal and high glucose concentrations in the medium.
Applsci 15 12391 g004
Figure 5. Venn diagram showing common genes altered in both experiments by MV treatment. NG represents normal glucose levels in medium, and HG represents high glucose in medium. 1–3 represents different concentrations of MV supplementation. The numbers in bracket represent the number of genes.
Applsci 15 12391 g005
Figure 6. Schematic summary of the dose-dependent effects of Mogroside V (MV) under normal glucose (NG, 5.5 mM) and high glucose (HG, 25 mM) conditions. The diagram illustrates activation or attenuation of AMPK/FoxO signaling, modulation of the Notch and TGF-β pathways, induction of stress markers, and the onset of apoptosis across low (15 µM), medium (60 µM), and high (160 µM) MV concentrations.
Applsci 15 12391 g006
Table 1. Detailed information regarding sequencing reads and mapping statistics for all analyzed samples.
SampleNumber of Raw ReadsNumber of Filtered ReadsNumber of Uniquely Mapped ReadsPercent of Uniquely Mapped ReadsNumber of Assigned Reads to the Gene Annotation FilePercent Assigned Reads to Gene Annotation File
NGC_17,024,1946,819,6065,101,21474.803,786,27174.22
NGC_28,064,3567,829,4725,763,14573.604,222,35473.26
NGC_36,610,4566,417,9184,721,76073.573,508,02174.29
NG1_16,876,9126,676,6145,061,38975.803,677,09772.64
NG1_26,924,6266,722,9385,076,60575.513,876,93176.36
NG1_36,990,7536,787,1394,886,01971.983,646,90974.63
NG2_16,754,9846,558,2374,753,47172.483,396,24971.44
NG2_27,561,1277,340,9005,355,40672.953,915,05973.10
NG2_36,702,7216,507,4964,524,97269.533,272,67172.32
NG3_17,640,7737,418,2265,270,04071.043,852,72073.10
NG3_26,626,9766,433,9574,821,76574.943,636,60975.42
NG3_36,938,4896,736,3974,954,26773.543,660,05773.87
HGC_19,654,2909,373,0977,044,55175.155,210,19873.96
HGC_27,772,9867,546,5885,702,37975.564,206,60773.76
HGC_38,127,2207,890,5055,740,30272.744,221,39973.53
HG1_16,986,6426,783,1485,061,89474.623,757,01074.22
HG1_26,788,4996,590,7764,858,01373.703,539,76072.86
HG1_38,389,5408,145,1845,936,04972.874,216,85071.03
HG2_11,475,43971,432,46571,063,100574.217,773,07473.11
HG2_27,232,6147,021,9555,292,16675.363,895,99173.61
HG2_37,055,4366,849,9384,994,35272.913,623,59372.55
HG3_17,576,4447,355,7715,409,03873.533,945,48172.94
HG3_27,931,3277,700,3175,879,74976.354,310,44673.31
HG3_37,103,6746,896,7714,917,02771.293,792,92677.13
Table 2. A complete list of significantly enriched pathways identified using genes altered by MV in N comparisons.
PathwayCommon Between AnalysisCorrected p-Value
Type II diabetes mellitusNG1/NG30.004
Regulation of lipolysis in adipocytesNG1/NG30.004
Adipocytokine signaling pathwayNG1/NG30.004
Longevity regulating pathwayNG1/NG30.004
Insulin resistanceNG1/NG30.004
AMPK signaling pathwayNG1/NG30.004
Autophagy—animalNG1/NG30.004
FoxO signaling pathwayNG1/NG30.004
Insulin signaling pathwayNG1/NG30.004
Non-alcoholic fatty liver disease (NAFLD)NG1/NG30.004
cGMP-PKG signaling pathwayNG1/NG30.005
MicroRNAs in cancerNG1/NG30.007
Maturity onset diabetes of the youngNG2/NG30.011
Notch signaling pathwayNG2/NG30.014
Fanconi anemia pathwayNG2/NG30.014
TGF-beta signaling pathwayNG2/NG30.021
Glucagon signaling pathwayNG2/NG30.022
FoxO signaling pathwayNG2/NG30.026
Signaling pathways regulating pluripotency of stem cellsNG2/NG30.027
Breast cancerNG2/NG30.028
Table 3. Pearson correlation coefficient for seven genes used for qPCR validation with RNAseq expression level results.
GeneInternal Control
HPRTPPIA
Ndufb30.30270.4912
Irs20.94050.7628
Adamts10.68810.7063
Serping10.69080.5787
Abi3bp0.85140.7253
Eif3j10.69430.7301
Cavin20.67670.7764
Disclaimer/Publisher’s Note: The statements, opinions and data contained in all publications are solely those of the individual author(s) and contributor(s) and not of MDPI and/or the editor(s). MDPI and/or the editor(s) disclaim responsibility for any injury to people or property resulting from any ideas, methods, instructions or products referred to in the content.