Article

The Impact of Air Velocity on the Formation of Methane Concentration Fields in Excavated Workings

1
Faculty of Mining, Safety Engineering and Industrial Automation, Silesian University of Technology, Akademicka 2, 44-100 Gliwice, Poland
2
Faculty of Mining, Ecology, Process Control and Geotechnologies, Technical University of Košice, Park Komenského 19, 042 00 Košice, Slovakia
*
Author to whom correspondence should be addressed.
Appl. Sci. 2025, 15(23), 12352; https://doi.org/10.3390/app152312352
Submission received: 23 October 2025 / Revised: 18 November 2025 / Accepted: 20 November 2025 / Published: 21 November 2025

Abstract

The article addresses a significant aspect of ventilation in excavated workings with the influx of hazardous gases. The selection of appropriate ventilation affects worker safety and helps avoid localized accumulation of gases at dangerous concentrations. Polish mining regulations allow methane accumulation in roadways of up to 3%, which provides a safety margin relative to the methane explosibility limits of 5–15% CH4. The methane concentrations obtained in the study ranged from 0.3% to 1.39%. The presented studies focused on the impact of air velocity on the formation of methane concentration fields. For this purpose, a numerical model was created based on an underground measurement results obtained in the active roadway with confirmed methane influx. The analysis of methane concentration distribution in the excavation was conducted using Ansys Fluent 2024 R1 for three different air velocities in the whirl flow airduct. It was shown that within 30 m from the face, the methane–air mixture is heterogeneous. Beyond this distance, it becomes a homogeneous mixture, regardless of the air velocity supplied by the auxiliary ventilation. Additionally, the occurrence of air recirculation was observed, resulting from the typical arrangement of equipment in the excavation space. The presence of elevated methane concentrations in the zone between the whirl flow airduct and the adjacent excavation floor is a notable phenomenon.

1. Introduction

Underground mining operations are accompanied by numerous natural hazards; gas hazard is one among them [1,2]. With the increasing depth of underground workings, the intensity of this hazard also increases [3]. To mitigate this risk, appropriate ventilation of the workings is crucial.
In hard coal mines, forced ventilation is the most commonly used ventilation method. It is based on an airway and a fan placed in the airflow stream.
One of the ways to mitigate the gas hazard is the use of a whirl flow airduct [4], which, over the final 30 m of the workings, creates an airflow that circulates around the perimeter of the excavation and is directed toward the face of the mine. The use of such devices was also described in the work of Huiuk et al. [5]. In Poland, whirl flow airducts are manufactured by the company SIGMA (Knurów, Poland) [6].
Methane plays a significant role among the gases flowing from the rock mass into mining workings [7,8]. When mixed with mine air, it forms a dangerous, flammable, and potentially explosive mixture [9]. Explosions of methane–air mixtures have often been the cause of mining disasters, leading to death and disability among underground mine workers [10,11]. For the safety of miners, it is essential to have information on the formation of methane concentrations in the mine atmosphere, which can be obtained through gas monitoring [12,13,14,15,16,17], as well as determined using calculations and numerical simulations [18,19,20,21]. Daloğlu et al. [22] focused on CFD modeling of air velocity and dust concentration in a coal-mine roadway. He demonstrated that air velocity has a significant influence on both dust levels in the working and on the development of methane concentrations. Chen D. et al. [18] used CFD to determine the optimal amount of air in mine workings ventilated in a “U” system under significant methane hazard conditions. Additionally, in [23], there are the results of studies on the distance at which a homogeneous methane–air mixture is formed at the intersection of a wall working and an overlying gallery, with the inclusion of a fresh air bypass. The authors of [24] used CFD to analyze the influence of air velocity (0.5–4.0 m/s) on methane stratification in underground mines. They demonstrated that at an air velocity of 4.0 m/s, the length of the methane layer is significantly reduced to a safe level of approximately 1 m. Authors [25] also applied numerical computing to investigate the impact of methane concentration in underground workings on the extent of the methane–air explosion zone. The authors of [26] presented a comprehensive approach combining regression modeling, CFD analysis, and Design of Experiments (DOE). They highlighted the feasibility of using multidirectional research methods when analyzing issues related to fluid flow. In [27], an interesting integration of 3D scanning techniques with CFD was presented for the purpose of optimizing ventilation in underground mines.
The article [28] demonstrates another CFD study into the topic. The authors study the effect of the position of a mining machine on the formation of high methane concentration zones. The use of the Monte Carlo method and CFD modeling to determine the amount of methane emissions into the mine workings and estimate the distribution of methane concentrations therein was presented in article [29]. The effect of mixing two air streams—one flowing from a mined gallery containing 10% methane, and the other with no methane—on the formation of methane concentrations was the subject of work [30]. The formation of methane concentration fields, depending on the length of the overlapping zone, was presented by Obracaj D. et al. [4]. The same article also showed the presence of air vortices in the overlapping zone. Research presented in article [31] demonstrated that when using ventilation with a bypass, there are zones of elevated methane concentrations for specific cross-sections of the gallery. In the article, Wesołowski et al. [32] presented the results of numerical modeling of methane inflow into a roadway, depending on the position of the methane-bearing seam relative to that roadway. In article [22], the authors presented the results of using CFD to analyze methane concentration and air velocity in a development heading ventilated with auxiliary ventilation in an underground coal mine. However, these studies did not account for the use of a whirl flow airduct in the work.
The aim of the research presented in this article was to determine the distance from the face of the excavated roadway at which a homogeneous methane–air mixture is formed. This issue is crucial from a safety perspective, as local occurrences of high methane concentrations can lead to ignition and/or explosion of the gas. In the case of low variability in methane inflow into the excavation space, one of the key parameters affecting its effective dilution is the amount of air supplied to the face through the ventilation duct. Therefore, as part of a multi-variant analysis, the distribution of methane concentrations across the cross-section of the excavation was examined by adjusting the air velocity in the ventilation duct. Previous studies by other authors did not indicate that the section of a roadway located between the coal face and the whirl flow airduct is characterized by elevated methane concentrations compared to the rest of the roadway. This is a very important finding, as it enables improvements in the safety of mine crews and helps prevent the formation of explosive methane accumulations.

2. Methods

2.1. The Site

For the study, a currently excavated roadway in a coal mine with recorded methane inflow at the heading was selected. The heading was equipped with an R-150 roadheader (FAMUR, Katowice, Poland), a UO-630 dust collector (WIROMAG sp z o.o., Lubomino, Poland), a WIR-700P whirl flow air-duct (WIROMAG sp. z o.o., Lubomino, Poland) with a ventilation duct, and telemetry gas monitoring sensors. The key parameters relevant to the simulation setup are presented in Table 1.
Figure 1 presents a schematic diagram of a roadway excavation carried out using a roadheader. The length of the roadheader is 8 m. Above the roadheader, a 27.5 m-long exhaust system in the form of a flexible ventilation duct was installed to continuously capture dust-laden air generated during the excavation process. The exhaust system was connected to a dust collection unit located further in the roadway.
In order to efficiently ventilate and mix the methane emitted with the incoming air, the excavation was equipped with 10 m-long whirl flow airducts placed on the floor of the excavation, with their outlet located 4 m from the face of the working. The whirl flow air duct was permanently connected to the ventilation duct supplying air to the face of the worker. The roadway was shotcrete with sprayed concrete, which blocked the inflow of gases from the surrounding rock mass into the working. Methane inflow was determined based on readings from methane meters. The technical specifications of the methane meters are presented below. All sensors were located 0.1 m from the roof of the roadway. The first sensor was positioned 1 m from the face of the development heading. The second sensor was located 15 m from the face, and the third sensor was placed above the dust collector, at a distance of 27 m from the face.
  • Methane Meter MM4
  • Measurement range: 0–100% CH4 in two subranges:
    • 0–5% CH4—pellistor sensor
    • 5–100% CH4—thermoconductometric sensor
  • Measurement error:
    • ±0.1% CH4 for concentrations of 0–2% CH4
    • ±5% of the reading for concentrations of 2–5% CH4
    • ±3% CH4 for concentrations of 5–60% CH4
    • ±5% of the reading for concentrations of 60–100% CH4
    • Sampling frequency: 5 s
According to Polish mining regulations, the minimum air velocity in excavated roadways in methane-prone seams is 0.3 m/s. The regulations also require that if the CH4 concentration exceeds 3%, the crew must be withdrawn from the roadway [33].

2.2. Numerical Model

The ANSYS software (2024 R1) was used for simulation studies on the distribution of methane concentrations in the methane heading.
The main simplifications included: reducing the length of the analyzed excavation to the final 400 m, assuming a horizontal layout, omitting the support frames, and schematically representing the roadheader while maintaining its overall dimensions. Additionally, selected structural details of the ventilation duct and dust collector were simplified.
The primary solver settings are summarized in Table 2. Based on the technical documentation of the excavation and measurements, two inflows were incorporated into the model:
-
inlet_duct—the airflow located in the whirl flow airduct at the model’s boundary, supplying air to the face of the working; the inflow velocity was the subject of the analysis,
-
inlet_methane—methane inflow from the face of the working, based on actual observations, covering 80% of the cross-sectional area of the excavation; velocity inlet—0.00494 m/s (based on measurement data), CH4—100%.
The measurements indicated that the methane inflow from the side walls of the excavation and the transported spoil had a minimal effect, and as a result, they were excluded from the model.
A fan with a constant static pressure of 1520 Pa, as per the dust collector’s technical specifications, was located at the midpoint of the dust collector duct, while an outlet was placed at the end of the excavation. The GWE 630B/18.5 fan (WIROMAG sp z o.o., Lubomino, Poland), which is part of the UO-630 dust collector, has a constant static pressure of 1520 Pa when operating in conjunction with the dust collector.
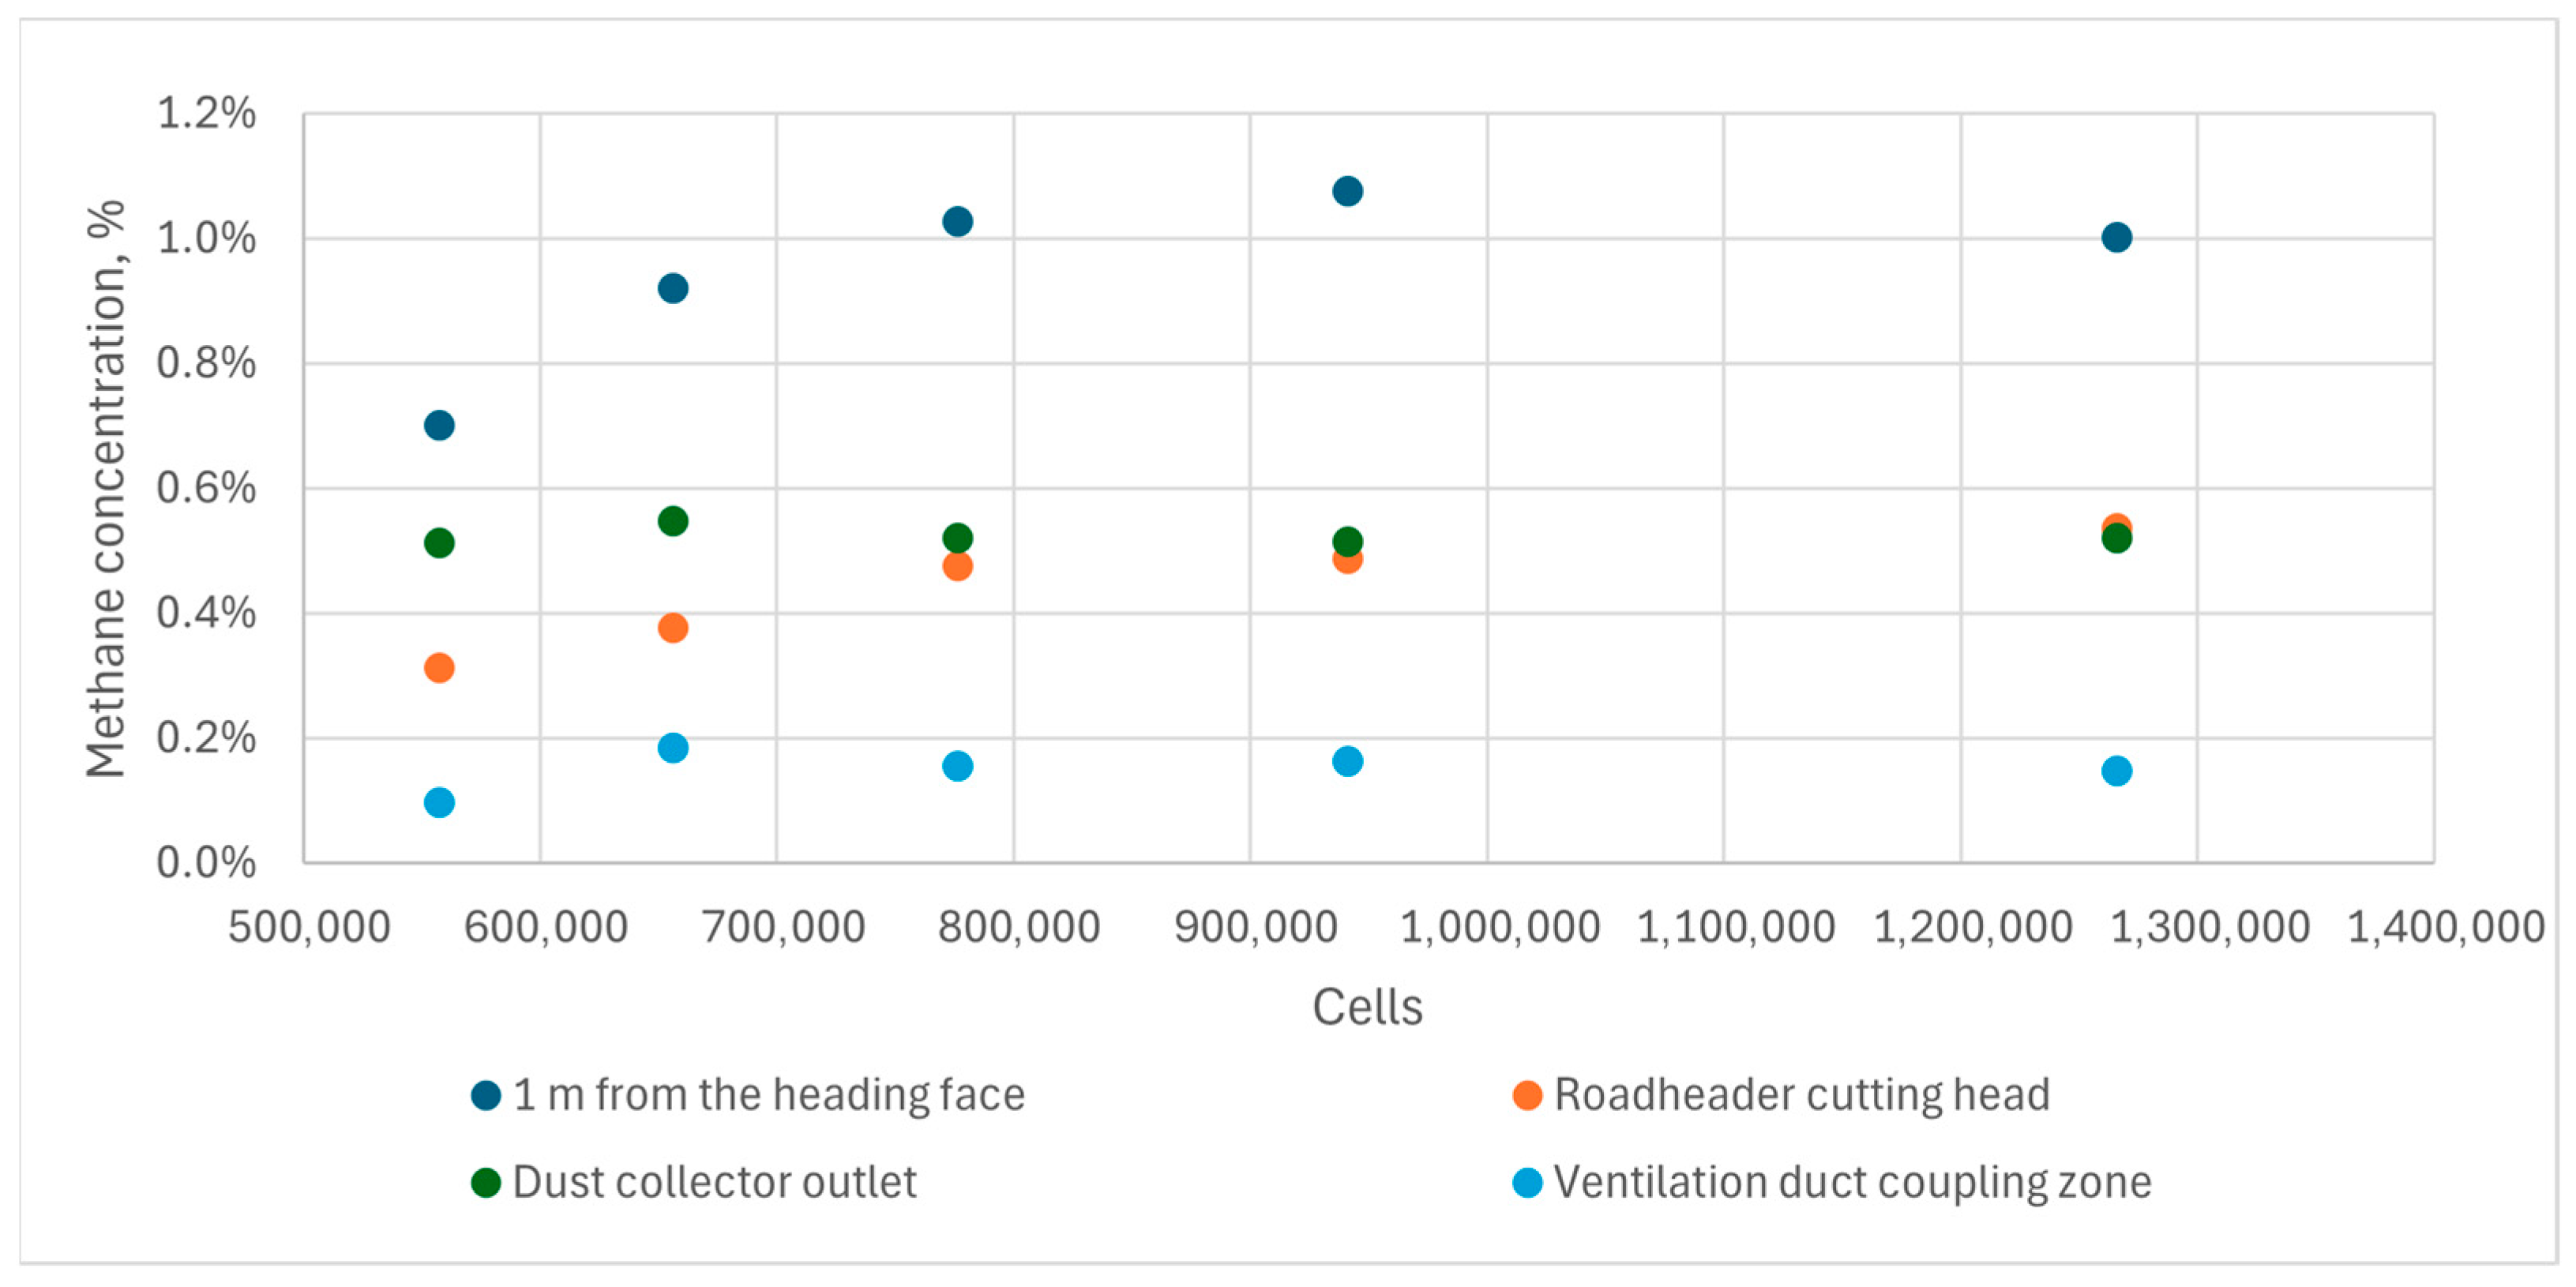
Before proceeding to the variant analysis of the model, a mesh independence study and validation of the results against data obtained from real measurements were conducted (Table 3, Figure 2).
A test was also conducted for the k-omega turbulence model, and its result did not significantly differ from the simulations performed using the k-epsilon model.
It was found that the simulation results did not undergo significant changes after refining the mesh in variants 3 and beyond. The values of the analyzed concentrations reached stable values. Based on this, it was concluded that the third mesh variant (polyhedra, 776,439 cells) provides sufficient accuracy of results within an acceptable computation time, meeting the requirements of the mesh independence test.

3. Results and Discussion

To assess the impact of air velocity on the formation of methane concentration fields in the roadway workings, three computational variants were performed. The variants differed in the set air velocities in the ventilation duct supplying air to the face of the worker. The air velocities in the respective variants were 4.72 m/s, 7.60 m/s, and 15.74 m/s.

3.1. Variant I—Analysis for a Velocity of 4.72 m/s

In this variant, the inlet air velocity to the ventilation duct was set at 4.72 m/s, which corresponds to an air velocity of 0.3 m/s in the excavation. This value was adopted based on Polish mining regulations for the minimum air velocity in roadway workings within methane fields. For these assumptions, the minimum methane concentrations at the adopted cross-sections (1 m, 5 m, 10 m, 15 m, 20 m, 25 m, 30 m, 35 m) in the excavation were as follows: 0.38%, 0.28%, 0.10%, 0.41%, 0.48%, 0.54%, 0.61%, and 0.67%, while the maximum methane concentrations were 1.39%, 0.67%, 0.71%, 0.71%, 0.71%, 0.71%, 0.79%, and 0.72%, respectively. The average concentration at the adopted cross-sections was 0.61%, 0.49%, 0.42%, 0.53%, 0.60%, 0.63%, 0.66%, and 0.70%, respectively.
The lowest single concentrations of methane were observed at the 5 m and 10 m cross-sections. This is due to the influx of air without methane from the outlet of the whirl flow airduct directed toward the face of the excavation. This airflow direction creates areas with reduced methane concentrations at these specific cross-sections.
The decrease in maximum methane concentrations between the first and second cross-sections is due to the influx of air without methane from the whirl flow airduct. In subsequent cross-sections (from 10 m to 35 m), the decreasing range of methane concentrations indicates an increasingly better mixing of methane with the air. The higher maximum methane concentration at the 30 m cross-section is due to the influx of air with an elevated methane concentration from the dust collector. The influence of the air flowing out of the dust collector on the methane concentration distribution fades at the 35 m section of the excavation (35 m cross-section).
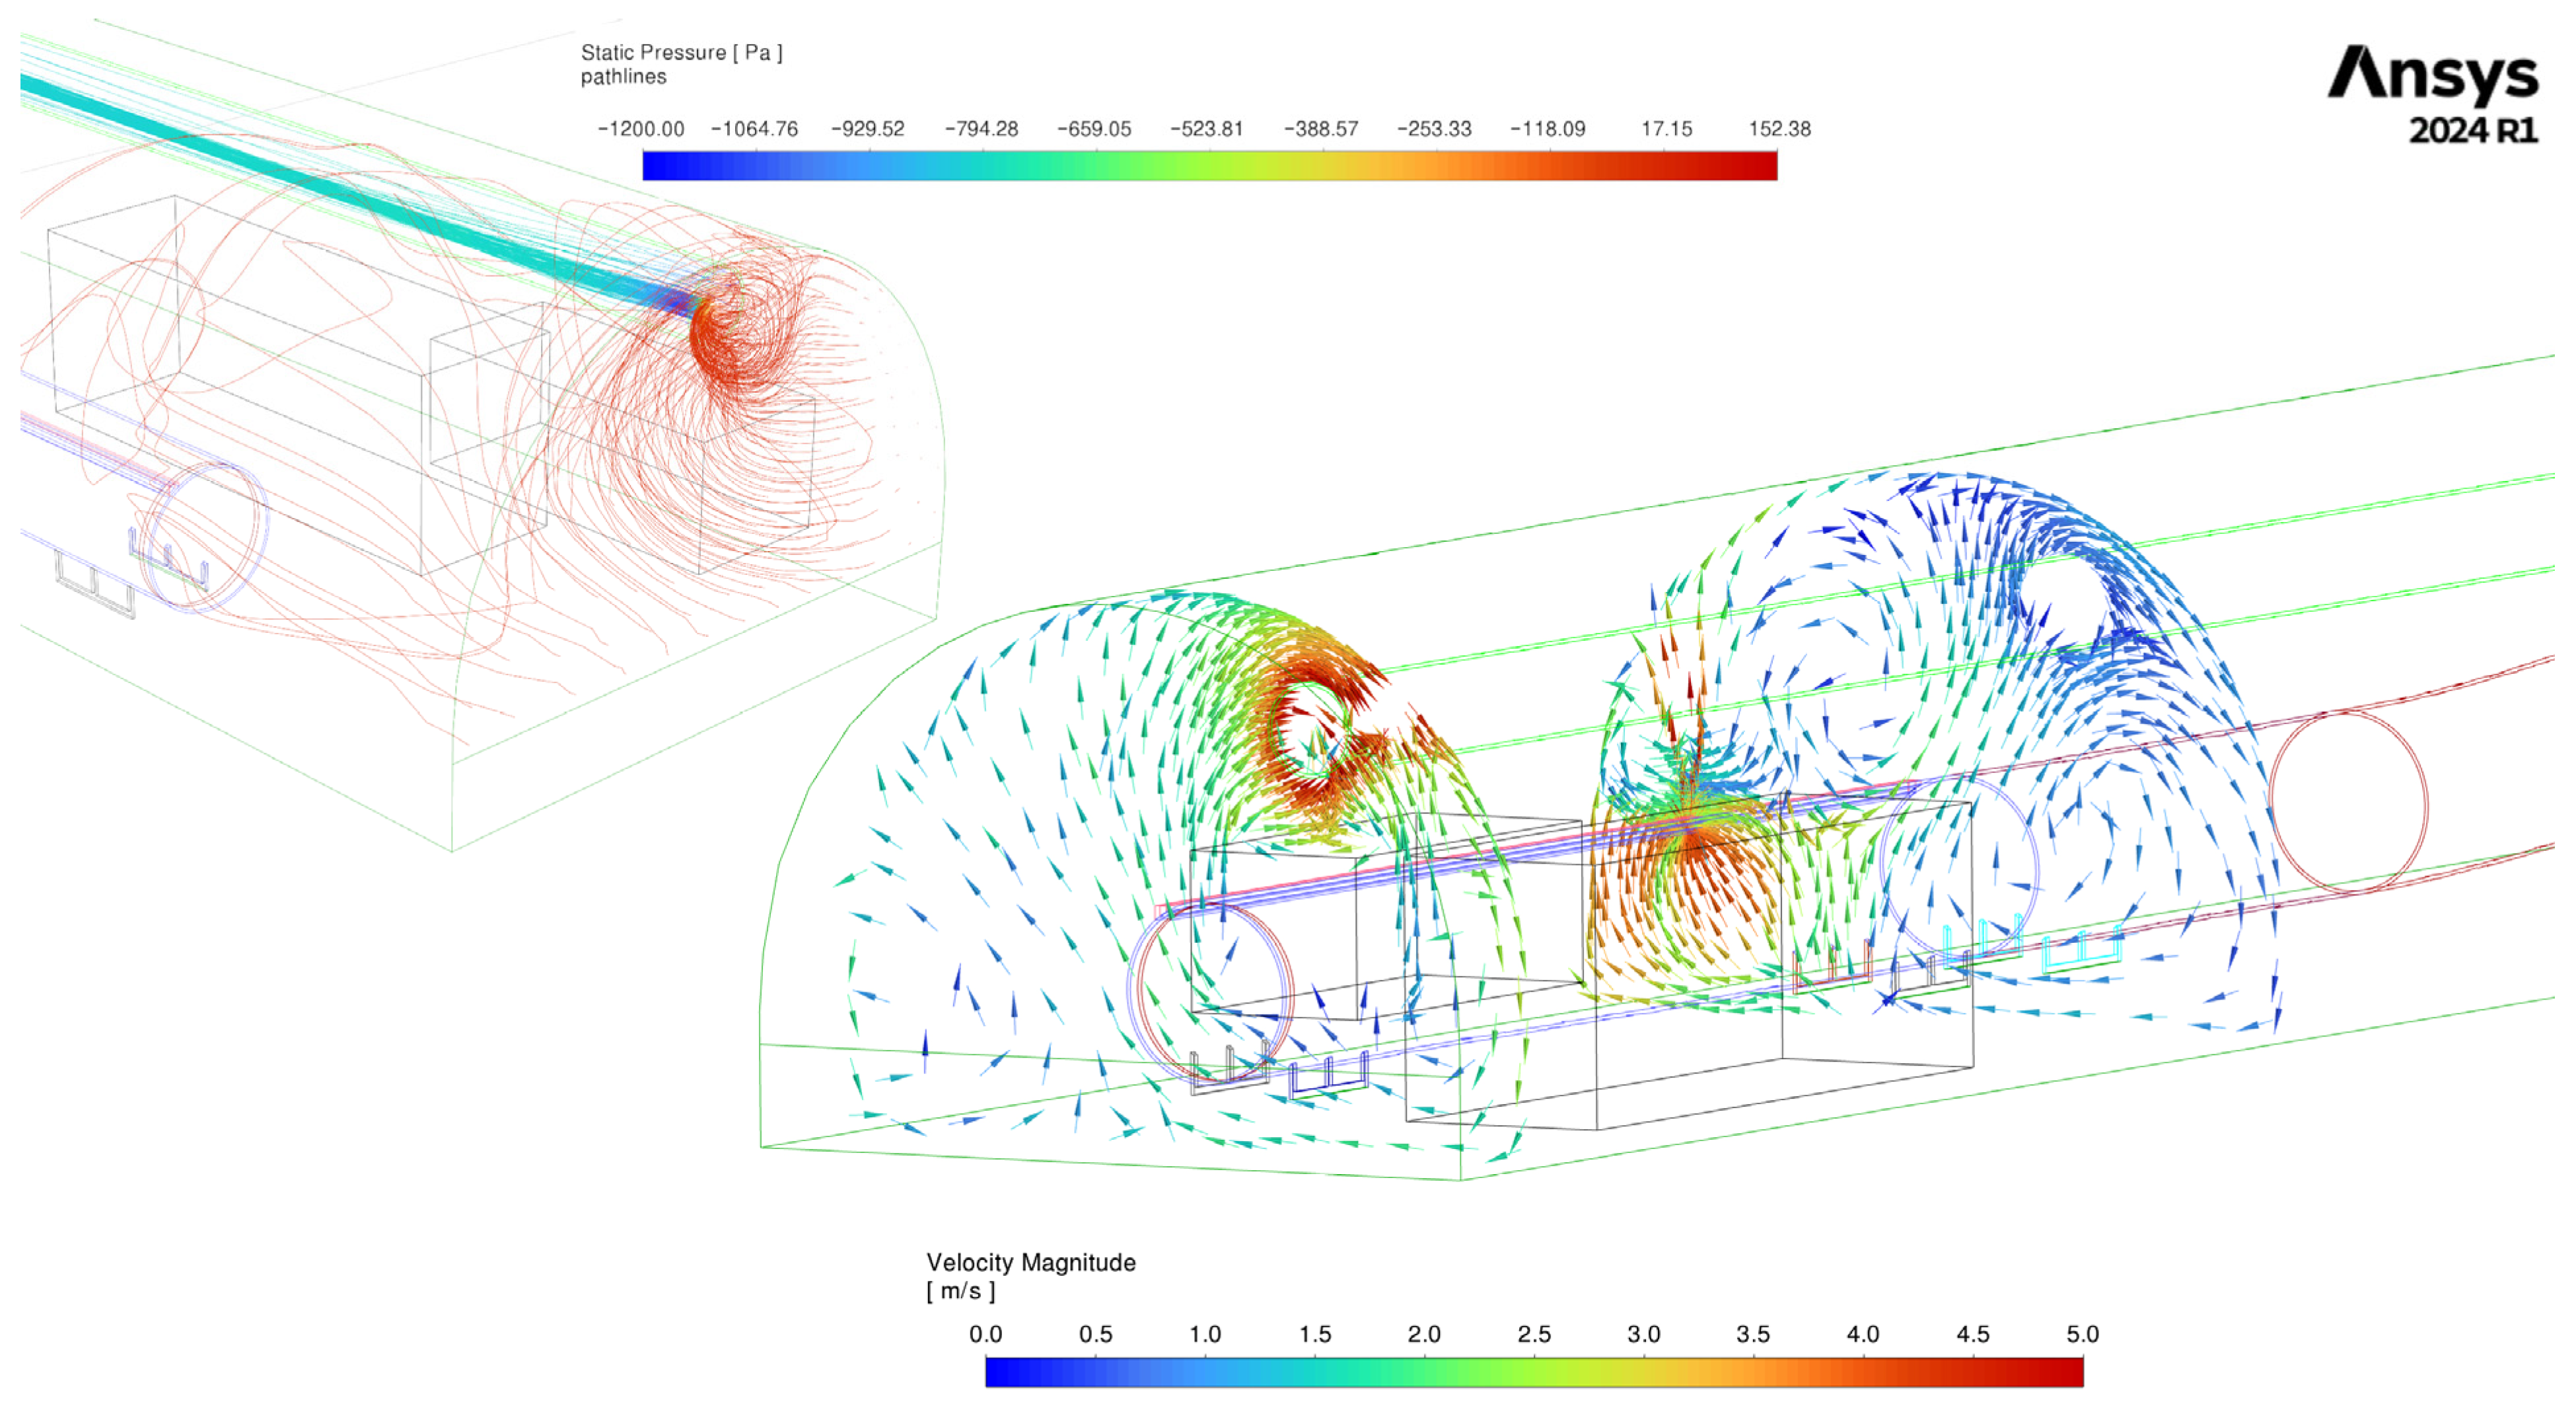
The airflow from the whirl flow airduct causes a blockage of the air flowing parallel to the axis of the excavation in its central part. This is due to the creation of an air curtain by the whirl flow airduct, which hinders the methane from reaching the left side of the excavation. The air stream flowing out of the whirl flow airduct distorts the airspeed field, generating maximum airspeeds in the part of the excavation between the sidewall and the ventilation duct supplying air to the face (main duct) (Figure 3, 15 m cross-section).
A portion of the air flowing out of the whirl flow airduct moves toward the face of the worker (due to the vacuum created by the fan installed in the dust collector system), carrying some of the methane flowing from the surrounding rock mass into the face of the excavation (Figure 3). This air is then directed in large quantities between the main duct and the sidewall of the excavation.
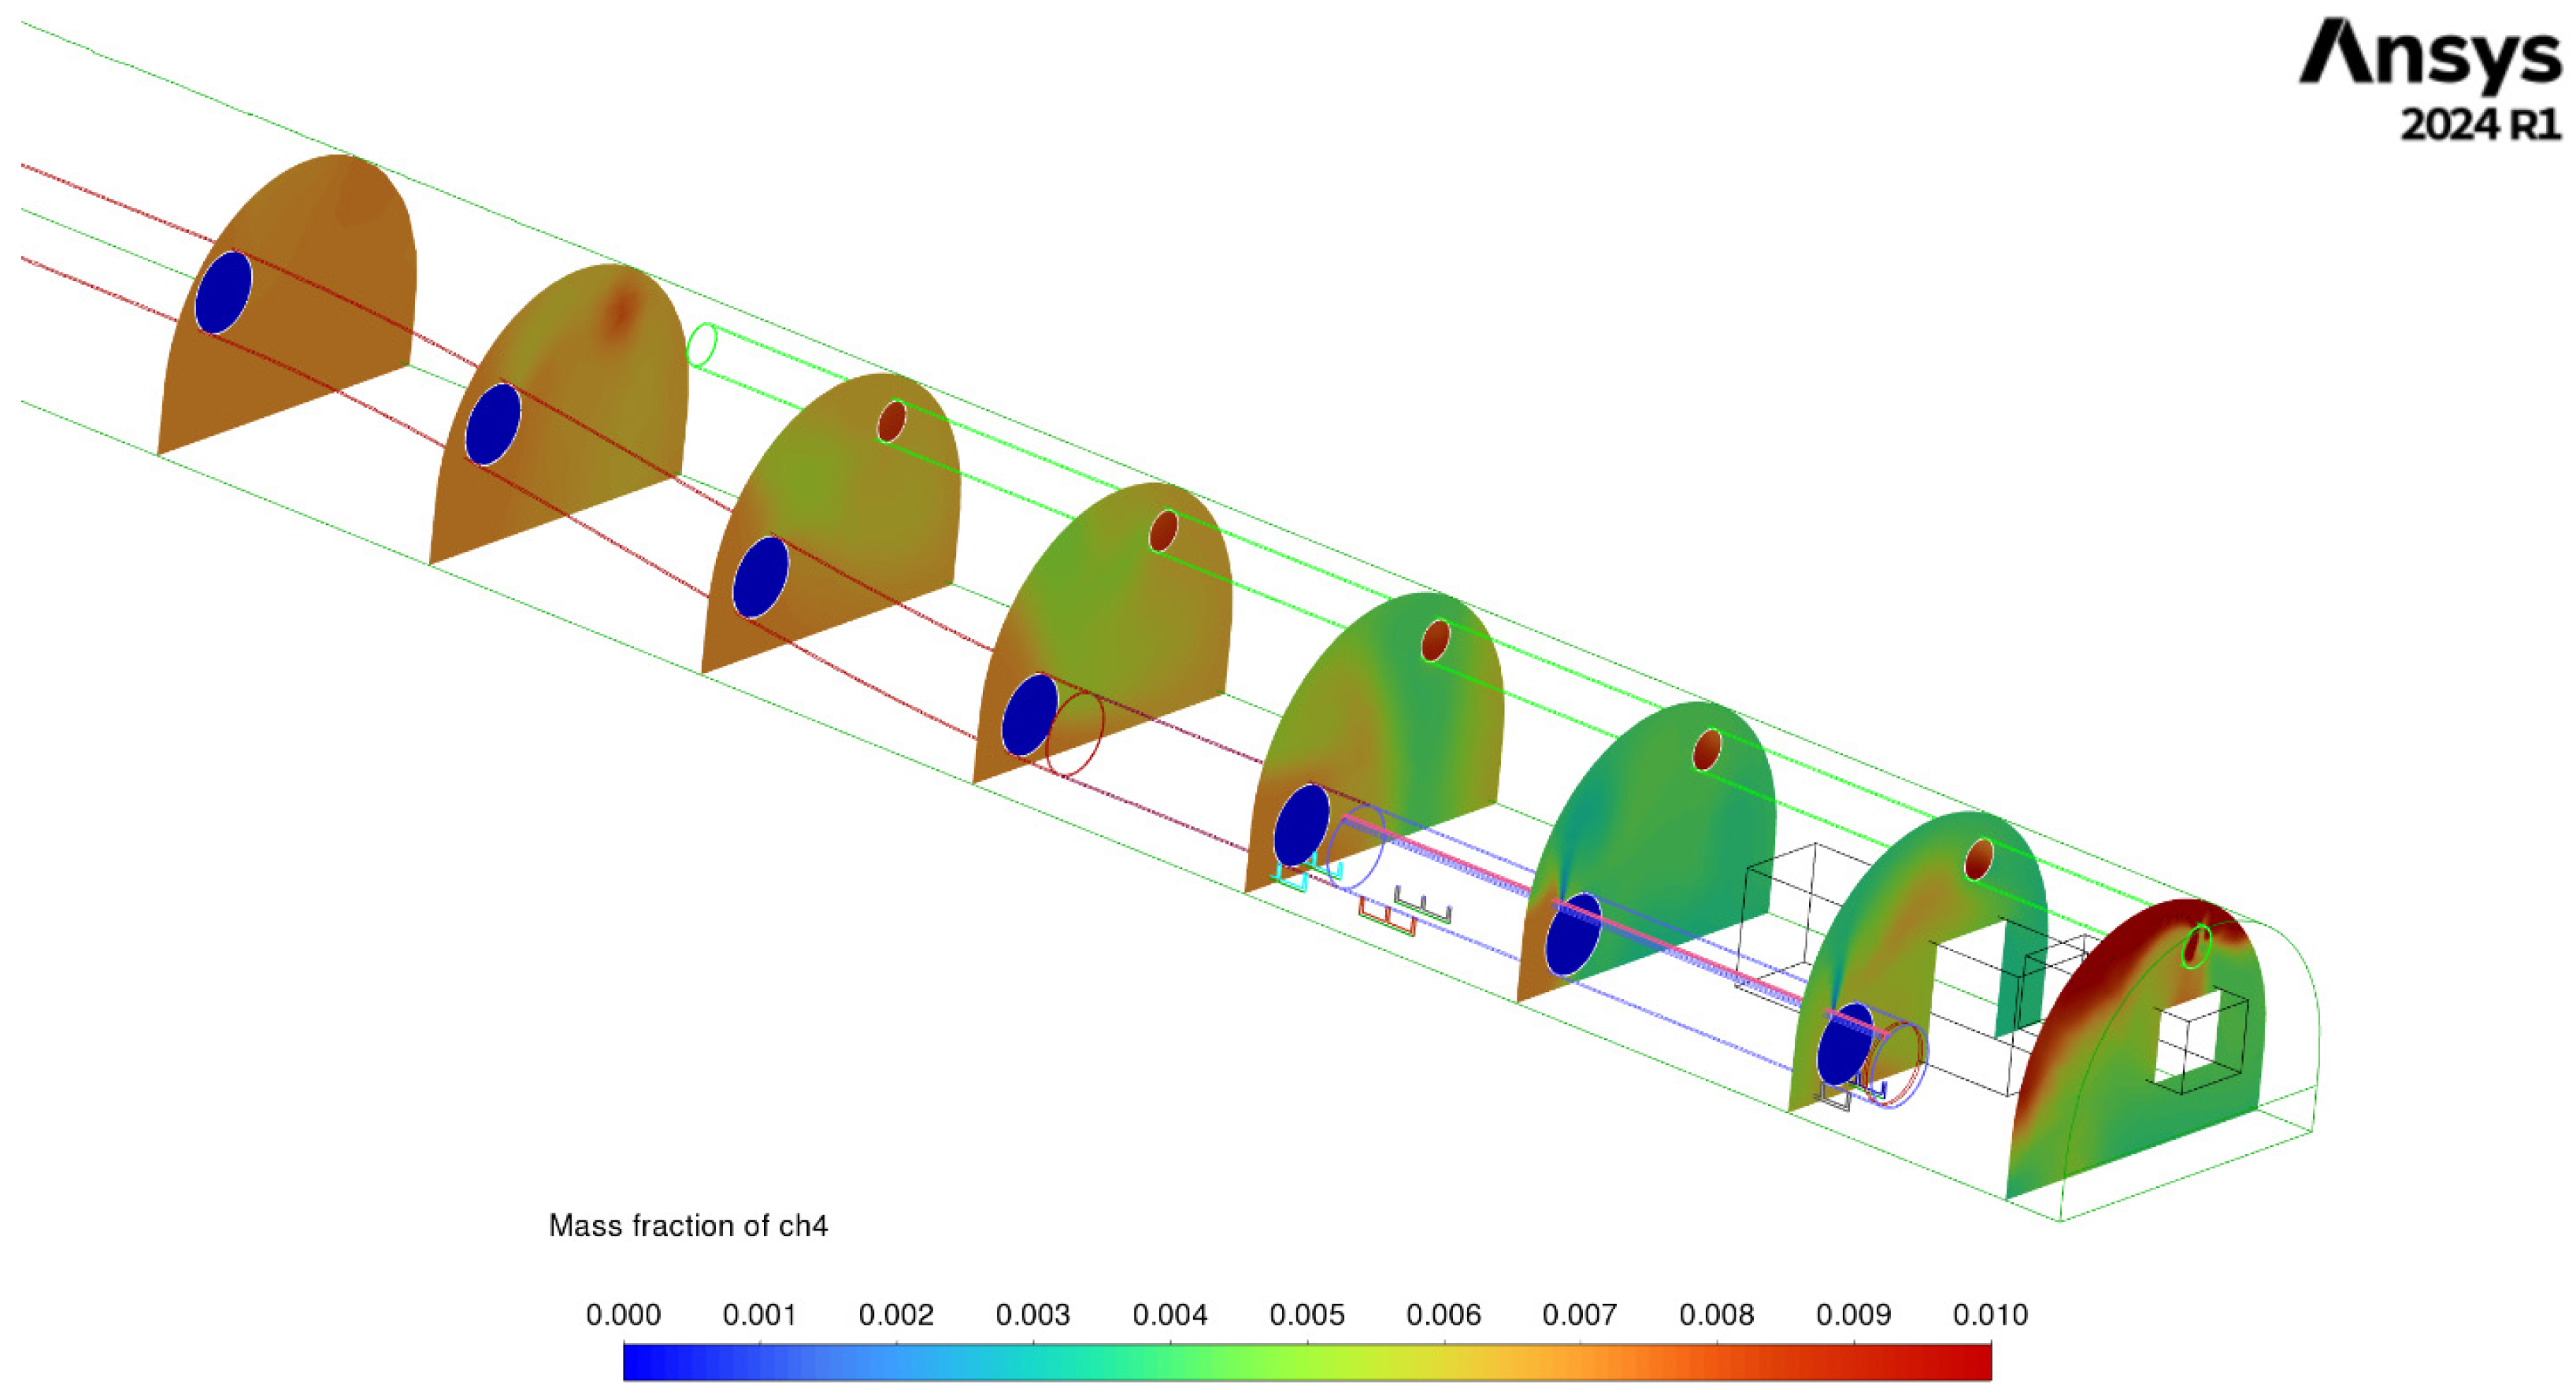
From the 15 m cross-section to the 35 m cross-section, where the whirl flow airduct no longer influences the airflow from the face, the area of elevated methane concentrations begins to expand (Figure 4, cross-sections from 15 m). The effect of the expansion of the high methane concentration field in subsequent cross-sections is an increase in the average methane concentration.
Analyzing the cross-sections in order from the face, the following observations can be made:
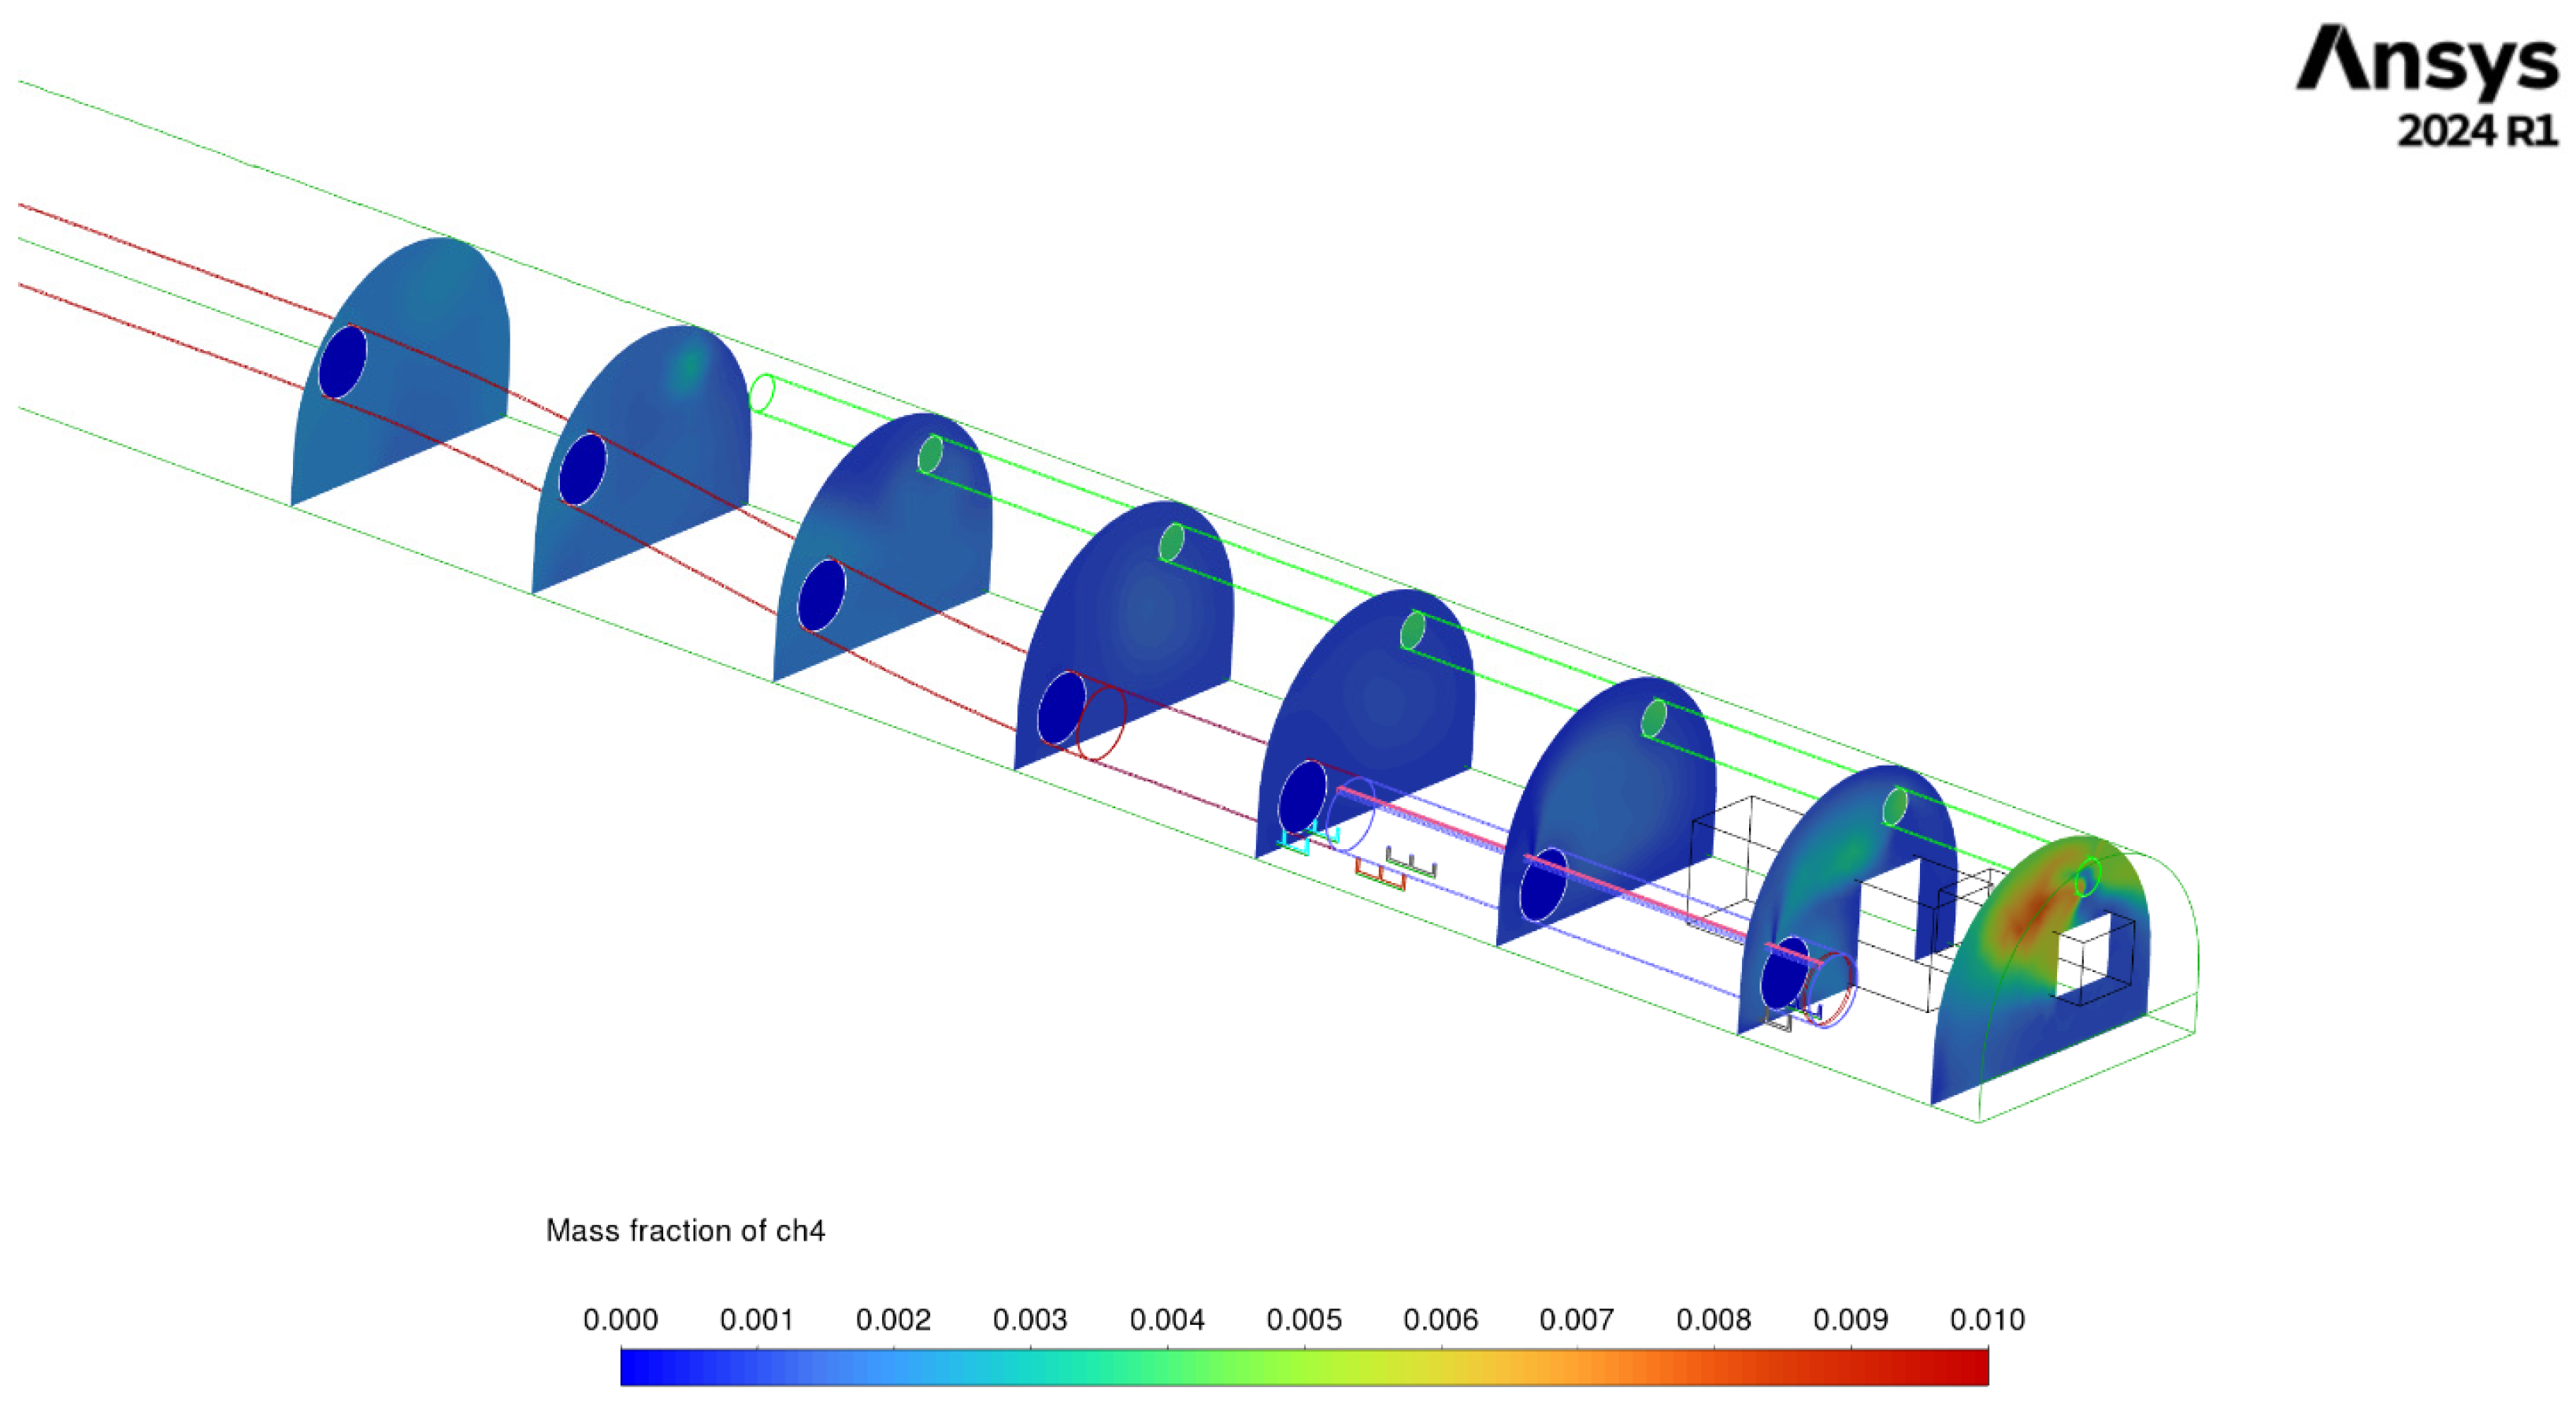
At the 1 m cross-section of the excavation, the highest methane concentrations, exceeding 1%, are located under the roof and near the right sidewall, where the duct is installed. The methane flowing from the coal seam is partially drawn toward the dust collector duct located 1 m above the roadheader head (Figure 4).
At the 5 m and 10 m cross-sections, the effect of the whirl flow air duct is visible. A stream of air without methane is observed flowing from the duct slit, which first reduces the methane concentration under the roof of the excavation (compared to the 1 m cross-section).
It is worth noting that methane is directed by the air stream between the roadheader shield and the whirl flow airduct (5 m cross-section). However, this phenomenon is not observed at the 10 m cross-section, as methane is diluted by the air stream flowing from the whirl flow airduct.
From the 15 m cross-section onward, the methane concentration field becomes increasingly homogeneous—the variance in subsequent cross-sections clearly decreases (15 m cross-section variance = 8.73 × 10⁻⁷; 20 m cross-section variance = 3.52 × 10⁻⁷; 25 m cross-section variance = 1.99 × 10⁻⁷; 30 m cross-section variance = 1.08 × 10⁻⁷; and 35 m cross-section variance = 4.54 × 10⁻⁹).

3.2. Variant II—Analysis for a Velocity of 7.60 m/s

In this variant, an inlet air velocity of 7.60 m/s was assumed for the ventilation duct, which corresponds to an air velocity of 0.5 m/s within the excavation. This value was chosen as a typical speed for roadway workings in Polish coal mines. An air velocity of 0.5 m/s is commonly encountered in mining practice; moreover, it is reflected in mining regulations [33] concerning the supply of air to the face in descending roadways, which must be ventilated at a minimum velocity of 0.5 m/s. Based on these assumptions, the minimum methane concentration at the selected cross-sections (1 m, 5 m, 10 m, 15 m, 20 m, 25 m, 30 m, 35 m) in the excavation was as follows: 0.04%, 0.03%, 0.01%, 0.07%, 0.09%, 0.20%, 0.33%, and 0.42%. The maximum methane concentrations were 1.08%, 0.15%, 0.15%, 0.20%, 0.30%, 0.46%, 0.49%, and 0.46%. The average methane concentration at the selected cross-sections was as follows: 0.28%, 0.07%, 0.09%, 0.13%, 0.18%, 0.34%, 0.42%, and 0.44%.
At this inlet air velocity, the lowest single methane concentrations were also observed at the 5 m and 10 m cross-sections, which is due to the outflow of air without methane from the gap of the whirl flow airduct.
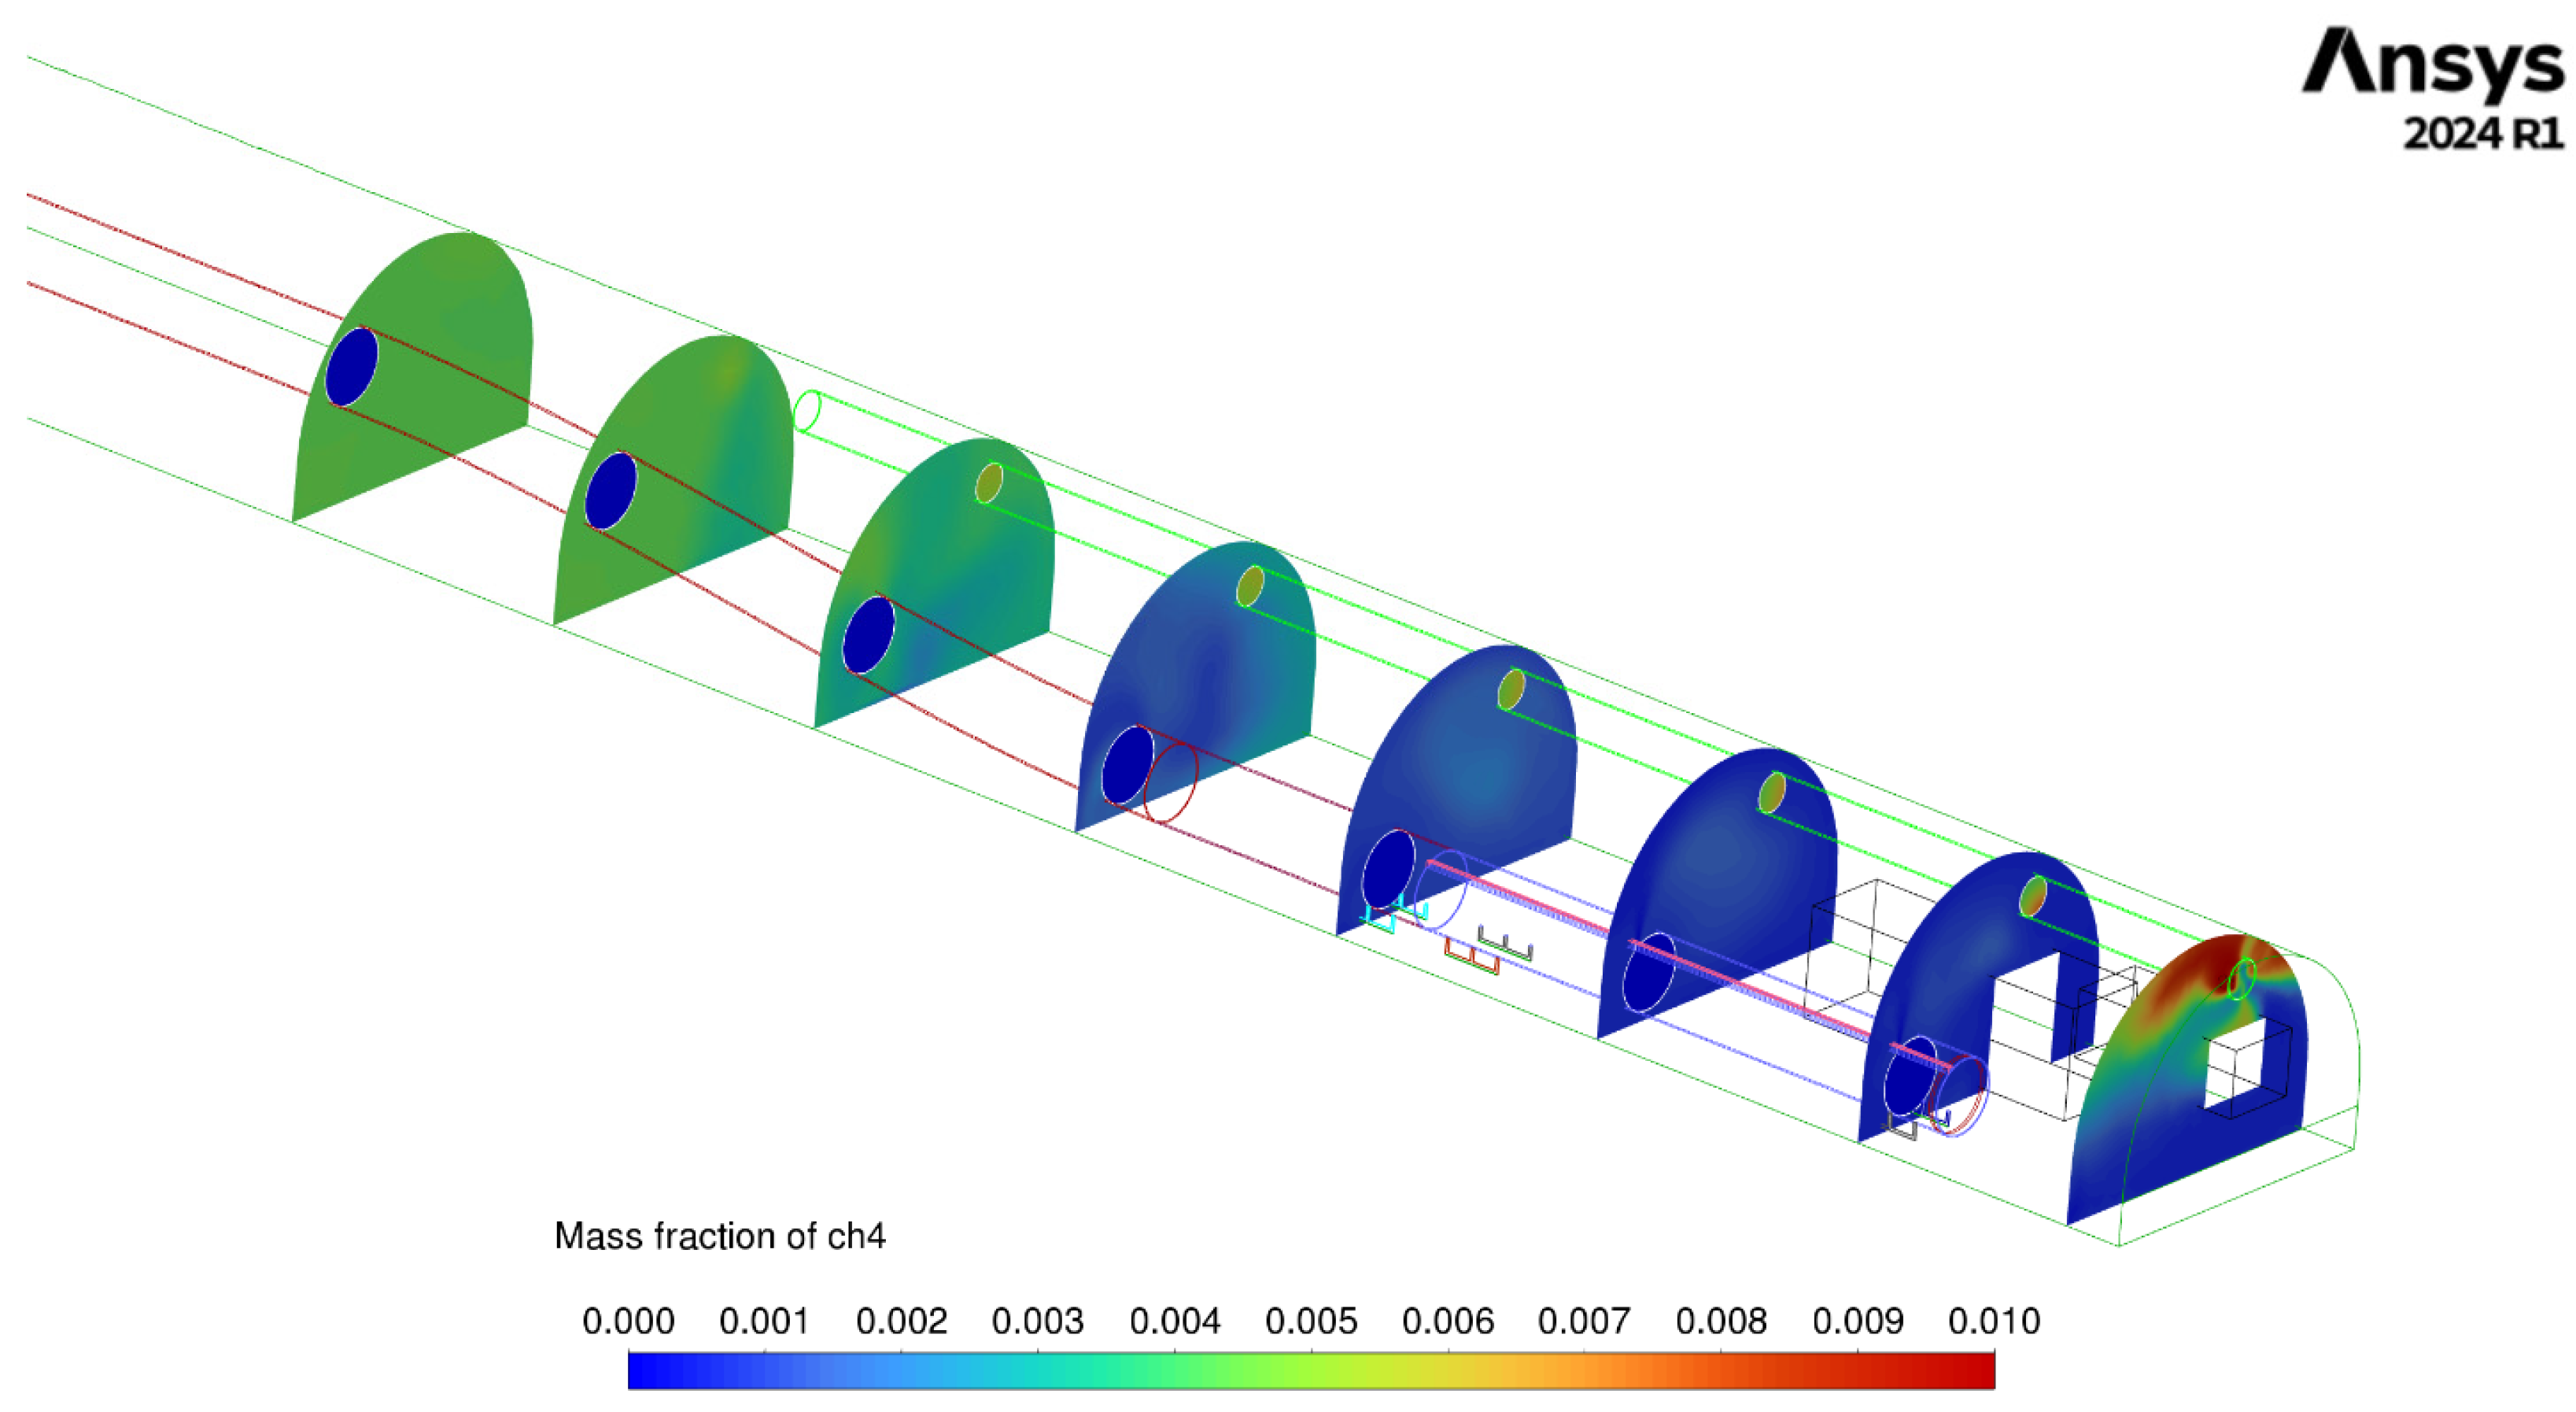
Analyzing the subsequent cross-sections in order from the face (Figure 5), the following observations can be made:
At the 1 m cross-section of the excavation, the highest methane concentrations, reaching 1.08%, are located under the roof and in the central part of the excavation. The dust collector, similar to the previous variant, draws air from the face of the excavation as well as partially from the excavation between the 1 m and 5 m cross-sections, according to the negative pressure created by the dust collector’s fan.
At the 5 m and 10 m cross-sections of the excavation, the effect of the whirl flow airduct is visible. Air without methane can be seen flowing from its slit, which initially reduces the methane concentration under the roof of the excavation. This effect is particularly noticeable at the 5 m cross-section. The highest methane concentrations at the 5 m cross-section occur in the central part of the excavation.
At the 10 m cross-section, an elevated methane concentration in the central part of the excavation is visible. However, compared to the 5 m cross-section, methane is more evenly distributed with the air.
Between the 10 m and 15 m cross-sections, methane concentrations slightly increase, which is linked to the end of the direct influence of the air stream exiting the whirl flow airduct (the slit of the whirl flow airduct ends at the 14 m cross-section of the excavation).
At the 20 m cross-section, a slightly higher methane concentration zone is observed near the sidewall from the direction of the dust collector.
Additionally, this variant revealed a phenomenon of methane concentration increase at the 25 m cross-section. The velocity field analysis showed a small recirculation of methane-laden air toward the face, which is caused by the change in the vertical position of the main duct along the axis of the excavation (Figure 6). This creates an obstruction to the air flow toward the excavation exit, resulting in a local change in its direction.
At the 30 m cross-section, a slight effect of air, along with methane, flowing out of the dust collector duct, is noticeable under the roof of the excavation. At the 35 m cross-section, the mixture becomes almost homogeneous, but the average methane concentration in the entire cross-section of the excavation is still elevated compared to the 20 m cross-section. This is due to the methane inflow from the dust collector duct.

3.3. Variant III—Analysis for a Velocity of 15.74 m/s

In this variant, an inlet air velocity of 15.74 m/s was assumed for the ventilation duct, which corresponds to an air velocity of 1.0 m/s within the excavation. This value was chosen as a speed close to the maximum velocities typically encountered in roadway workings of Polish coal mines. Based on these assumptions, the minimum methane concentration at the selected cross-sections (1 m, 5 m, 10 m, 15 m, 20 m, 25 m, 30 m, 35 m) (Figure 7). in the excavation was as follows: 0.10%, 0.08%, 0.04%, 0.09%, 0.09%, 0.10%, 0.11%, and 0.16%. The maximum methane concentrations were 0.78%, 0.35%, 0.18%, 0.12%, 0.15%, 0.21%, 0.30%, and 0.23%. The average methane concentration at the selected cross-sections was as follows: 0.31%, 0.16%, 0.12%, 0.10%, 0.11%, 0.16%, 0.17%, and 0.20%.
At this inlet air velocity to the whirl flow airduct, the lowest point methane concentrations were also observed at the 5 m and 10 m cross-sections, which is due to the outflow of air without methane from the slit of the whirl flow airduct.
Analyzing the subsequent cross-sections in order from the face, the following observations can be made:
At the 1 m cross-section of the excavation, the highest methane concentrations reach 0.78%. They are located under the roof of the excavation in its central part. Methane entering from the coal seam is largely drawn by the dust collector duct.
At the 5 m and 10 m cross-sections of the excavation, the effect of the whirl flow airduct is visible, similar to the one described in earlier variants. It is worth noting that from the 15 m to the 35 m cross-sections, the methane concentration field is almost homogeneous. Only at the 30 m and 35 m cross-sections is the methane concentration slightly elevated due to the outflow of methane–air mixture from the dust collector. The air recirculation mentioned in Section 3.2 is also present in this variant, but due to the low methane concentrations at the cross-sections of the excavation, it is not very noticeable in Figure 6. The lowest methane concentration specified in mining regulations [33] is 0.75% CH4 and applies to ventilation shafts. In roadways, this concentration is 1%. The average methane concentrations in this variant ranged from 0.1% to 0.31%. The differences in average methane concentrations reach only parts of a percent, which is negligible in mining practice.
It can be observed that the minimum concentrations at sections 1–10 m may be higher than in Variant II, despite the higher air velocity in the roadway. This is influenced by the capacity of the dust collector, which is limited by the fan installed in it. Consequently, with the increase in air velocity in the roadway in Variant III (compared to Variant II), the dust collector is unable to handle the additional air. Therefore, the methane concentration at 5 m and 10 m is higher in Variant III due to the increased division of air between the face airflow and the airflow through the dust collector.

3.4. Comparative Analysis of Variants

To assess the influence of air velocity in the ventilation duct on the spatial distribution of methane concentration within the excavation, the simulation results were analyzed using selected statistical descriptors (Table 4, Figure 8).
Based on the distribution of minimal methane concentrations (Figure 8a), common observations can be made for all analyzed variants. From 1 m to 10 m, the values of the minimal methane concentration decrease. The main cause of this phenomenon is the outflow of air without methane from the gap of the whirl flow airduct, combined with the impact of the dust collector’s fan pressure. Beyond 10 m from the face of the heading, an increase in minimal methane concentrations can be observed. This indicates an increasing degree of mixing of methane with air for subsequent cross-sectional profiles in the excavation. Additionally, in the first three sections, it was noted that the values of the minimal methane concentrations in variant III exceed those obtained for variant II. This is caused by the limited (constant) capacity of the dust collector. Variant III is characterized by the highest air velocity exiting the ventilation duct, which leads to the appearance of air volumes at the face of the heading that significantly exceed the performance capacity of the dust collector. This influences the higher share of methane being carried out of the excavation beyond the dust collector.
For the maximum methane concentrations (Figure 8b), a substantial decrease in methane concentration is observed between the 1 m and 5 m sections in each variant. This is due to the impact of the dust collector in the area near the face of the heading. From 25 m onwards, an increase in methane concentration can be observed, associated with the inflow of a methane–air mixture from the dust collector’s outlet and partial recirculation described in Section 3.2. Similarly, as in the case of minimal methane concentrations, higher maximum concentrations were recorded for variant III at the 5 m and 10 m sections compared to variant II.
Upon analyzing the range variability of methane concentration across successive cross-sections (Figure 8c), it is evident that the distribution trend exhibits a decreasing pattern, except for the 10 m distance in Variant I. This phenomenon can be attributed to the displacement of high methane concentrations to the region behind the whirl flow airduct (Figure 4), while simultaneously causing a reduction in methane concentrations at the airduct’s outlet. This phenomenon is also visible in Figure 8a. An important observation is that the distribution of methane concentrations at the last two cross-sections (30 m and 35 m) is identical, indicating no influence of air velocity on the homogeneity of the mixture.
Figure 8d illustrates the decrease in mean methane concentrations at the outlet section of the whirl flow airduct, alongside the increase in mean methane concentrations at the subsequent cross-sections of the excavation. Notably, the influence of air velocity in the ventilation duct on the average methane concentrations at the final cross-sections of the excavation is evident.

4. Conclusions

The subject of the presented study was the analysis of the impact of air velocity on the formation of methane concentration fields in tunnel excavations. CFD-based model studies were conducted using an existing underground excavation. The analysis of the obtained results led to the following conclusions:
  • For the variant with the lowest air velocity, a zone of elevated methane concentration was observed in the space between the whirl flow airduct and the adjacent wall of the excavation (10 m cross-section). Local methane accumulations are a significant safety issue for the crew. In variants II and III, due to the high air velocity, this phenomenon is not noticeable in the diagrams.
  • As the air velocity in the ventilation duct increases, along with a constant dust collector throughput, the volumetric airflow directed from the face into the excavation space increases. As a result, the proportion of methane flowing in the excavation relative to the dust collector increases. This increase corresponds to the air velocity supplied by the duct. This is visible in cross-sections located behind the dust collector inlet (5 m and 10 m cross-sections). The authors of the publication plan to continue research in this area.
  • A small recirculation of air–methane mixture was observed in the zone of the dust collector outlet toward the face. This phenomenon is most visible in variant II. The cause of the recirculation is the change in the height of the duct’s position in the mixing zone of the two airflow streams from the dust collector and the excavation.
  • The conducted analysis showed no impact of air velocity on the homogeneity of the mixture beyond 30 m from the face of the excavation. This conclusion is also confirmed by the obtained values of methane concentration variance.
The authors intend to conduct further studies considering roadways with variable geometry, diverse machinery equipment, and a methane inflow to the roadway that is both variable and time-dependent.

Author Contributions

Conceptualization, A.P.N., D.M. and G.P.; Methodology, A.P.N., D.M. and G.P.; Validation, A.P.N., D.M. and G.P.; Formal analysis, A.P.N., D.M. and G.P.; Investigation, A.P.N., D.M., G.P., Z.R., P.W., N.K. and M.Š.; Resources, A.P.N. and D.M.; Writing—Original Draft, A.P.N., D.M. and G.P.; Writing—Review and Editing, A.P.N., G.P., Z.R., P.W. and N.K.; Visualization, A.P.N., D.M. and G.P. All authors have read and agreed to the published version of the manuscript.

Funding

This research did not receive any specific grant from funding agencies in the public, commercial, or not-for-profit sectors.

Institutional Review Board Statement

Not applicable.

Informed Consent Statement

Not applicable.

Data Availability Statement

The data presented in this study are available on request from the corresponding author. The data are not publicly available due to a privacy agreement signed with the mining company.

Conflicts of Interest

The authors declare no conflicts of interest.

References

  1. Ji, Z.M.; Chen, Z.J.; Pan, J.N.; Niu, Q.H. A novel method for estimating methane emissions from underground coal mines: The Yanma coal mine, China. Atmos. Environ. 2017, 170, 96–107. [Google Scholar] [CrossRef]
  2. Roshchanka, V.; Evans, M.; Ruiz, F.; Kholod, N. A strategic approach to selecting policy mechanisms for addressing coal mine methane emissions: A case study on Kazakhstan. Environ. Sci. Policy 2017, 78, 185–192. [Google Scholar] [CrossRef]
  3. Ghorbani, Y.; Nwaila, G.T.; Zhang, S.E.; Bourdeau, J.E.; Cánovas, M.; Arzua, J.; Nikadat, N. Moving towards deep underground mineral resources: Drivers, challenges and potential solutions. Resour. Policy 2023, 80, 103222. [Google Scholar] [CrossRef]
  4. Obracaj, D.; Korzec, M.; Deszcz, P. Study on methane distribution in the face zone of the fully mechanized roadway with overlap auxiliary ventilation system. Energies 2021, 14, 6379. [Google Scholar] [CrossRef]
  5. Huiuk, Y.; Kim, M.; Lee, D.; Park, J. Applications of computational fluid dynamics for mine ventilation in mineral development. Energies 2022, 15, 8405. [Google Scholar] [CrossRef]
  6. Whirl Flow Air Duct LW-SIGMA 800. Available online: https://www.sigmasa.pl/en/offer/mining/ventilation-and-dedusting-systems/whirl-flow-air-duct-lw-sigma-800 (accessed on 13 November 2025).
  7. Liu, Z.; Zhong, Q.; Lu, Y. Study on the propagation characteristics of methane-air explosion under the promotion of crushed gangue. Sci. Rep. 2024, 14, 2087. [Google Scholar] [CrossRef]
  8. Kundu, S.; Zanganeh, J.; Moghtaderi, B. A review on understanding explosions from methane–air mixture. J. Loss Prev. Process Ind. 2016, 40, 507–523. [Google Scholar] [CrossRef]
  9. Rao, S.; Mishra, D.P.; Mishra, A. Methane migration and explosive fringe localisation in retreating longwall panel under varied ventilation scenarios: A numerical simulation approach. Environ. Sci. Pollut. Res. 2023, 30, 66705–66729. [Google Scholar] [CrossRef]
  10. Brune, J.F.; Grubb, J.W.; Bogin, G.E.; Marts, J.A.; Gilmore, R.C.; Saki, S.A. Lessons learned from research about methane explosive gas zones in coal mine gobs. Int. J. Min. Miner. Eng. 2016, 7, 155–169. [Google Scholar] [CrossRef]
  11. Trzop, K.; Palka, D.; Szurgacz, D.; Sobik, L. Preventive measures to minimize natural hazards in the Polish underground mining industry. In IOP Conference Series: Earth and Environmental Science; IOP Publishing: Bristol, UK, 2021; Volume 684, p. 012009. [Google Scholar]
  12. Szlązak, N.; Obracaj, D.; Borowski, M.; Swolkień, J.; Korzec, M. Monitoring and controlling methane hazard in excavations in hard coal mines. AGH J. Min. Geoengin. 2013, 37, 105–116. [Google Scholar] [CrossRef]
  13. Ostrogórski, P.; Skotniczny, P.; Pucka, M. Measurements of the methane concentration along the longwall excavations and longwall. Arch. Min. Sci. 2022, 67, 195–204. [Google Scholar]
  14. Ostrogórski, P.; Skotniczny, P. Methane emission measurements along underground galleries of coal mine. Arch. Min. Sci. 2024, 68, 107–114. [Google Scholar] [CrossRef]
  15. Sidorenko, S.; Trushnikov, V.; Sidorenko, A. Methane emission estimation tools as a basis for sustainable underground mining of gas-bearing coal seams. Sustainability 2024, 6, 3457. [Google Scholar] [CrossRef]
  16. Gong, W.; Hu, J.; Wang, Z.; Wei, Y.; Li, Y.; Zhang, T.; Zhang, Q.; Liu, T.; Ning, Y.; Zhang, W.; et al. Recent advances in laser gas sensors for applications to safety monitoring in intelligent coal mines. Front. Phys. 2022, 10, 1058475. [Google Scholar] [CrossRef]
  17. Wu, X.; Cui, J.; Tong, R.; Li, Q. Research on methane measurement and interference factors in coal mines. Sensors 2022, 22, 5608. [Google Scholar] [CrossRef]
  18. Chen, D.; Xie, J.; Wang, Y.; Sun, X.; Du, H.; Li, G. CFD modeling of optimal airflow rates for safe production in isolated mining faces with high methane concentration and coal spontaneous combustion. J. Clean. Prod. 2023, 423, 138835. [Google Scholar] [CrossRef]
  19. Nemati-karaviq, R.; Abdollahisharif, J.; Abbasalizadeh, M.; Gilani, S.O. Investigation of Methane Recovery in Coal Mines During Ventilation Operations Through CFD Simulation. Geotech. Geol. Eng. 2024, 42, 6549–6559. [Google Scholar] [CrossRef]
  20. Palka, D. Modeling and simulation of the methane risk in the mining production process. Multidiscip. Asp. Prod. Eng. 2021, 4, 1–13. [Google Scholar] [CrossRef]
  21. Torno, S.; Toraño, J. Methane Emission Outbursts in the Mine Face of Two Galleries: Computational Fluid Dynamics Analysis and On-Site Calibration. Energies 2023, 16, 7298. [Google Scholar] [CrossRef]
  22. Daloğlu, G.; Önder, M.; Parra, T. Modeling of methane and air velocity behavior in an auxiliary ventilated coal heading. Arch. Min. Sci. 2021, 66, 69–84. [Google Scholar]
  23. Niewiadomski, A.; Badura, H.; Ivanova, T.N.; Repko, A.; Yury, N.R. Analysis of methane concentration distribution at U-ventilated longwall outlet-case study. New Trends Prod. Eng. 2020, 3, 149–168. [Google Scholar] [CrossRef]
  24. Kumar, P.; Mishra, D.P.; Panigrahi, D.C.; Sahu, P. Numerical studies of ventilation effect on methane layering behaviour in underground coal mines. Curr. Sci. 2017, 112, 1873–1881. [Google Scholar] [CrossRef]
  25. Juganda, A.; Strebinger, C.; Brune, J.F.; Bogin, G.E., Jr. Computational fluid dynamics modeling of a methane gas explosion in a full-scale, underground longwall coal mine. Min. Metall. Explor. 2022, 39, 897–916. [Google Scholar] [CrossRef]
  26. Arrieta-Gomez, M.; Vélez-García, S.; Zuluaga, D.H.; Tejada, J.C.; Sanin-Villa, D. Efficiency optimization of a hybrid Savonius-Darrieus hydrokinetic turbine via regression modeling and CFD-based design of experiments. Results Eng. 2025, 27, 105751. [Google Scholar] [CrossRef]
  27. Trybała, P.; Rigon, S.; Remondino, F.; Banasiewicz, A.; Wróblewski, A.; Macek, A.; Kujawa, P.; Romańczukiewicz, K.; Redondo, C.; Espada, F. Optimizing Mining Ventilation Using 3D Technologies. Int. Arch. Photogramm. Remote Sens. Spat. Inf. Sci. 2024, 48, 427–434. [Google Scholar] [CrossRef]
  28. Demirkan, D.C.; Duzgun, H.S.; Juganda, A.; Brune, J.; Bogin, G. Real-time methane prediction in underground longwall coal mining using AI. Energies 2022, 15, 6486. [Google Scholar] [CrossRef]
  29. Rahimi, S.; Ataee-pour, M.; Madani, H. CFD modeling of impact of gas content uncertainty on methane distribution in underground coal mine roadways. J. Min. Environ. 2022, 13, 493–502. [Google Scholar]
  30. Wrona, P.; Różański, Z.; Pach, G.; Domagała, L. The application of a jet fan for the control of air and methane streams mixing at the excavations cross-the results of numerical simulation. Manag. Syst. Prod. Eng. 2016, 23, 156–162. [Google Scholar] [CrossRef]
  31. Cao, Z.; Liu, X. Study on the characteristics of flow field and gas migration in gas tunnels. In IOP Conference Series: Materials Science and Engineering; IOP Publishing: Bristol, UK, 2020; Volume 741, p. 012039. [Google Scholar]
  32. Wesołowski, M.; Badura, H.; Kołodziejczyk, P.; Bańka, P. Numeryczna symulacja wypływu metanu do wyrobiska korytarzowego. Syst. Wspomagania Inżynierii Prod. 2018, 7, 443–456. [Google Scholar]
  33. Regulation of the Polish Minister of Energy on Detailed Requirements for the Operation of Underground Mining Plants Dated 23 November 2016. (Dz.U. z 2017 r. poz. 1118). Available online: https://isap.sejm.gov.pl/isap.nsf/DocDetails.xsp?id=WDU20170001118 (accessed on 12 October 2025).
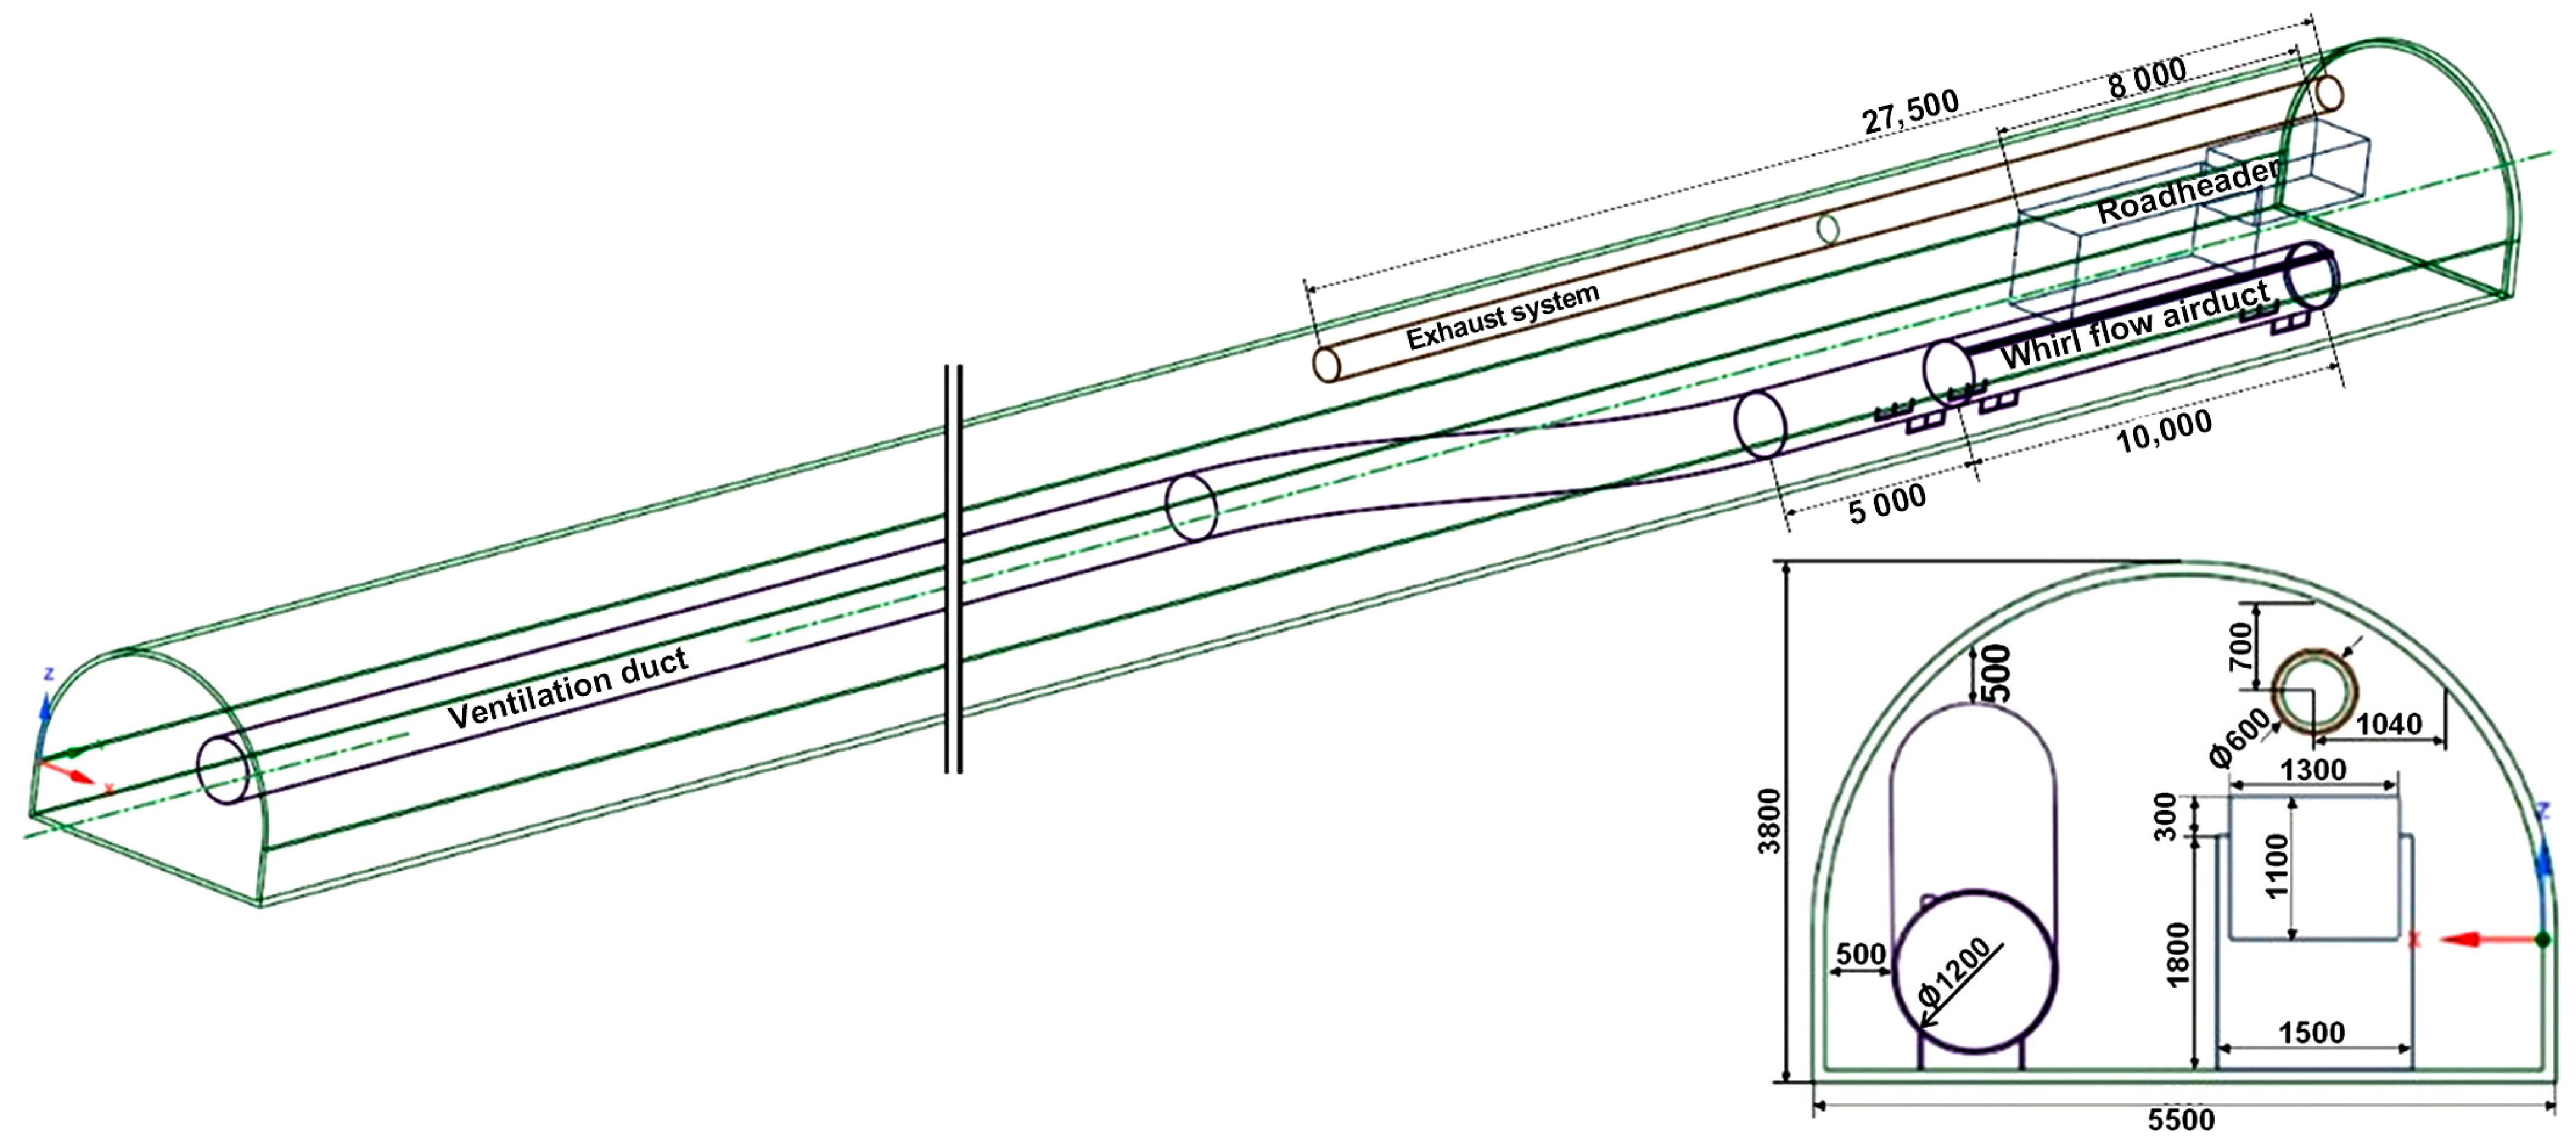
Figure 1. Geometrical model of a roadway excavation.
Applsci 15 12352 g001
Figure 2. Modeled methane concentrations at actual sensor locations for five analyzed mesh densities.
Applsci 15 12352 g002
Figure 3. Velocity field distribution at the heading.
Applsci 15 12352 g003
Figure 4. Methane concentration distribution at the heading for variant I.
Applsci 15 12352 g004
Figure 5. Methane concentration distribution at the heading for variant II.
Applsci 15 12352 g005
Figure 6. Recirculation of methane-laden air toward the face.
Applsci 15 12352 g006
Figure 7. Methane concentration distribution at the heading for variant III.
Applsci 15 12352 g007
Figure 8. Changes in the values of selected statistical descriptors for the analyzed cross-sections in the selected variants: (a) minimum methane concentration, (b) maximum methane concentration, (c) methane concentration range, (d) mean methane concentration.
Applsci 15 12352 g008
Table 1. Summary of selected parameters of the excavated roadway.
ParameterValue
Cross-sectional area of the excavation17.80 m2
Excavation length1430 m
Portion of the cross-section composed of coal80%
Air density in the excavation1.31 kg/m3
Ventilation duct diameter1.20 m
Ventilation duct efficiency87%
Dust collector fan airflow rate360 m3/min
Absolute methane inflow to the excavation2.90 m3/min
Table 2. Primary solver settings.
SolverPressure-Based
time discretizationsteady state
sub-modelsturbulent flow RANS (SST k-epsilon turbulence mode), species transport (methane–air mixture)
computational schemecoupled
scheme of the analysisall sub-models as second-order
Table 3. Skewness, orthogonal quality, and modeled methane concentrations at sensor locations.
No.
of Cells
Orthogonal
Quality
SkewnessMethane Concentration at Sensor Locations
1 m from the
Heading Face
Roadheader Cutting HeadDust
Collector Outlet
Ventilation Duct
Coupling Zone
557,6930.165840.834160.70%0.31%0.51%0.10%
656,3380.1515330.848470.92%0.38%0.55%0.18%
776,4390.168340.831661.03%0.48%0.52%0.16%
941,3170.167490.832511.08%0.49%0.51%0.16%
1,265,9460.166370.833631.00%0.54%0.52%0.15%
Table 4. Descriptors of methane concentration distribution in relation to air velocity in the ventilation duct.
Cross-
Section
Variants of Air
Velocity
Methane Concentration, %
MinMaxValue RangeArithmetic MeanMedianVar
[-]
1 mV10.381.391.010.610.505.86 × 10−6
V20.041.081.040.280.167.30 × 10−6
V30.100.780.680.310.233.97 × 10−6
5 mV10.280.670.390.490.508.26 × 10−7
V20.030.150.120.070.065.70 × 10−8
V30.080.350.270.160.154.31 × 10−7
10 mV10.100.710.610.420.406.67 × 10−7
V20.010.150.140.090.088.56 × 10−8
V30.040.180.140.120.121.08 × 10−7
15 mV10.410.710.300.530.538.73 × 10−7
V20.070.200.140.130.128.69 × 10−8
V30.090.120.030.100.107.91 × 10−9
20 mV10.480.710.230.600.603.52 × 10−7
V20.090.300.210.180.163.68 × 10−7
V30.090.150.060.110.112.34 × 10−8
25 mV10.540.710.170.630.631.99 × 10−7
V20.200.460.260.340.352.14 × 10−7
V30.100.210.110.160.179.43 × 10−8
30 m V10.610.790.180.660.661.08 × 10−7
V20.330.490.160.420.431.06 × 10−7
V30.110.300.190.170.172.22 × 10−7
35 mV10.670.720.050.700.704.54 × 10−9
V20.420.460.040.440.443.15 × 10−9
V30.160.230.070.200.201.77 × 10−8
Disclaimer/Publisher’s Note: The statements, opinions and data contained in all publications are solely those of the individual author(s) and contributor(s) and not of MDPI and/or the editor(s). MDPI and/or the editor(s) disclaim responsibility for any injury to people or property resulting from any ideas, methods, instructions or products referred to in the content.