Article

Classification of Hydrothermal Alteration Types from Thin-Section Images Using Deep Convolutional Neural Networks

1
The Graduate School of Natural and Applied Sciences, Sivas Cumhuriyet University, 58140 Sivas, Türkiye
2
Department of Software Engineering, Faculty of Engineering, Sivas Cumhuriyet University, 58140 Sivas, Türkiye
3
Department of Geological Engineering, Faculty of Engineering, Sivas Cumhuriyet University, 58140 Sivas, Türkiye
*
Author to whom correspondence should be addressed.
Appl. Sci. 2025, 15(22), 12274; https://doi.org/10.3390/app152212274
Submission received: 15 October 2025 / Revised: 17 November 2025 / Accepted: 18 November 2025 / Published: 19 November 2025

Abstract

Hydrothermal alteration processes, including silicification, sericitization, carbonatization, chloritization, and epidotization, serve as critical indicators in the exploration of precious metal deposits. The identification of these alterations traditionally relies on expert petrographic analysis of thin sections, a method that is time-intensive and prone to subjective interpretation. Although the automated classification of rock types from thin section images using machine learning (ML) and deep learning (DL) techniques has gained increasing attention, the classification of specific hydrothermal alteration types remains underexplored. This study evaluates the performance of four deep convolutional neural network (CNN) architectures—DenseNet121, ResNet50, VGG16, and InceptionV3—for classifying these five alteration types from thin section images. A new dataset comprising 5000 high-resolution thin section images (1000 per alteration type) was developed and used to train and evaluate the models under four optimization algorithms: Adam, RMSprop, SGD, and Adadelta. Among these, the DenseNet121 model achieved the highest performance, attaining accuracy and F1-score values of 1.00 with both RMSprop and Adam optimizers, while the InceptionV3 model recorded the shortest training time at 662 s. The results demonstrate that CNN-based approaches can effectively automate the classification of hydrothermal alteration types, offering a fast, consistent, and objective alternative to traditional methods. This study highlights the potential of deep learning techniques to enhance geological exploration through the accurate and efficient identification of hydrothermal alteration minerals.

1. Introduction

Hydrothermal alteration refers to the mineralogical, chemical, and textural transformations that occur within host rocks due to their interaction with ore-forming hot aqueous solutions [1]. This process is a key geological phenomenon in the exploration of precious minerals. Hydrothermal deposits, particularly those rich in precious metals such as gold, lead, zinc, copper, and tin, play a vital role in national economic development. To ensure the continued production of these metals, the exploration of new deposits has become increasingly important. It is therefore necessary to identify sources of base and precious metallic minerals located at depths within the Earth’s crust. Epidotization, chloritization, carbonatization, sericitization, and silicification are among the most common prevalent alteration types, especially in mineral deposits formed through porphyry Cu-Au, vein-type, and skarn-related hydrothermal systems [2] (Figure 1). The identification and classification of rock types is a fundamental step in geological investigations, typically conducted by expert geologists through the analysis of the mineral composition and texture under a polarizing microscope using petrographic thin sections [3]. Identifying the microscopic features in thin sections prepared from altered rock samples requires advanced expertise and experience, similar to the challenges encountered in unaltered rock classification. Recent advances in computer technology have enabled researchers to automate rock type identification and classification using thin section images, highlighting the potential for achieving similar success in the analysis of thin sections containing hydrothermal alteration minerals.
Machine learning (ML) [4,5,6,7,8,9,10,11] and deep learning (DL) [12,13,14,15,16,17,18,19,20,21,22,23,24,25,26,27,28,29,30] approaches have been increasingly applied in geological studies, particularly for the analysis of microscopic imagery data and geochemical datasets. Traditional ML methods [4,5,6,7,8,9,10,11] have yielded promising results in various rock classification and characterization tasks, including predicting rock types and alteration facies from petrophysical or geochemical data [4,5], unsupervised characterization of hydrothermal alterations [8], and the automation of petrographic analyses such as point counting and segmentation [7,10]. Hybrid approaches, such as combining convolutional neural network (CNN) extracted features with Support Vector Machines (SVMs) [9], have also been utilized for thin section classification. Despite these successes, CNN-based DL techniques [12,13,14,15,16,17,18,19,20,21,22,23,24,25,26,27,28,29,30] have demonstrated superior performance in feature extraction and classification, especially when applied to high-resolution, texture-rich image datasets [18]. This DL paradigm has rapidly expanded beyond early neural network applications for mineral identification [21,22] to encompass a broad range of tasks, including full-image classification of petrographic sections [12,18,27] and rock types [29,30]; granular analysis through segmentation [16,20,23] and object detection [17,19]; the development of advanced architectures incorporating attention mechanisms [15]; and the application of methodologies such as transfer learning [25,28] and Explainable AI (XAI) [26]. Building on these advancements, automated rock image classification has been increasingly adopted in established CNN architectures such as VGG16 [31], ResNet50 [32], DenseNet121 [33], and InceptionV3 [34], which have shown high accuracy in both macroscopic hand-specimen and microscopic thin-section image classification tasks.
However, most existing studies have primarily focused on mineral composition and general rock classification, with limited attention to mineral textures and structural features. Hydrothermal alteration minerals exhibit highly complex and heterogeneous textures due to the intense physicochemical degradation of primary rock-forming minerals, posing additional challenges for automated classification. To address these challenges, the present study employs VGG16, ResNet50, DenseNet121, and InceptionV3 architectures to classify hydrothermal alteration types in petrographic thin sections, aiming to capture both compositional and textural features with high precision and generalizability. Furthermore, this study systematically evaluates these architectures with four distinct optimization algorithms (SGD, Adam, RMSprop, and Adadelta) to identify the most effective model-optimizer configuration for this specific geological task.
These architectures were selected for their proven ability to extract multi-scale spatial and textural features from image data. In particular, DenseNet121 and ResNet50 enhance fine-grained texture recognition through deep feature propagation and reuse [35,36]; VGG16 offers a stable and interpretable baseline [12]; and InceptionV3 effectively captures multi-scale mineralogical patterns through its parallel convolutional filters [37].

2. Materials and Methods

2.1. Hydrothermal Alteration Types

In this study, the five most observed hydrothermal alteration types, epidotization, chloritization, carbonatization, sericitization, and silicification were examined based on their distinct microscopic characteristics. These alteration types represent the initial indicators in the exploration of precious metallic deposits such as porphyry Cu-Au, vein-type, and skarn-type deposits, which host economically significant reserves. Epidotization, which is likely of hydrothermal origin, involves the formation of epidote (or zoisite) or the transformation of aluminum-bearing ferromagnesian silicates into epidote within the rock. Carbonatization results in the formation of carbonate minerals. Chloritization leads to the transformation of ferromagnesian silicates, particularly those containing aluminum, into chlorite, or the formation of chlorite within the rock; this alteration is commonly observed in aphanitic rocks of intermediate to mafic composition. Sericitization refers to the partial or complete alteration of feldspars into sericite minerals. Finally, silicification is the process by which rocks become enriched in silica, driven by the introduction of silica-rich magmatic hydrothermal fluids, resulting in a silica-saturated state.

2.2. Preparation and Acquisition of the Thin Section Image Dataset
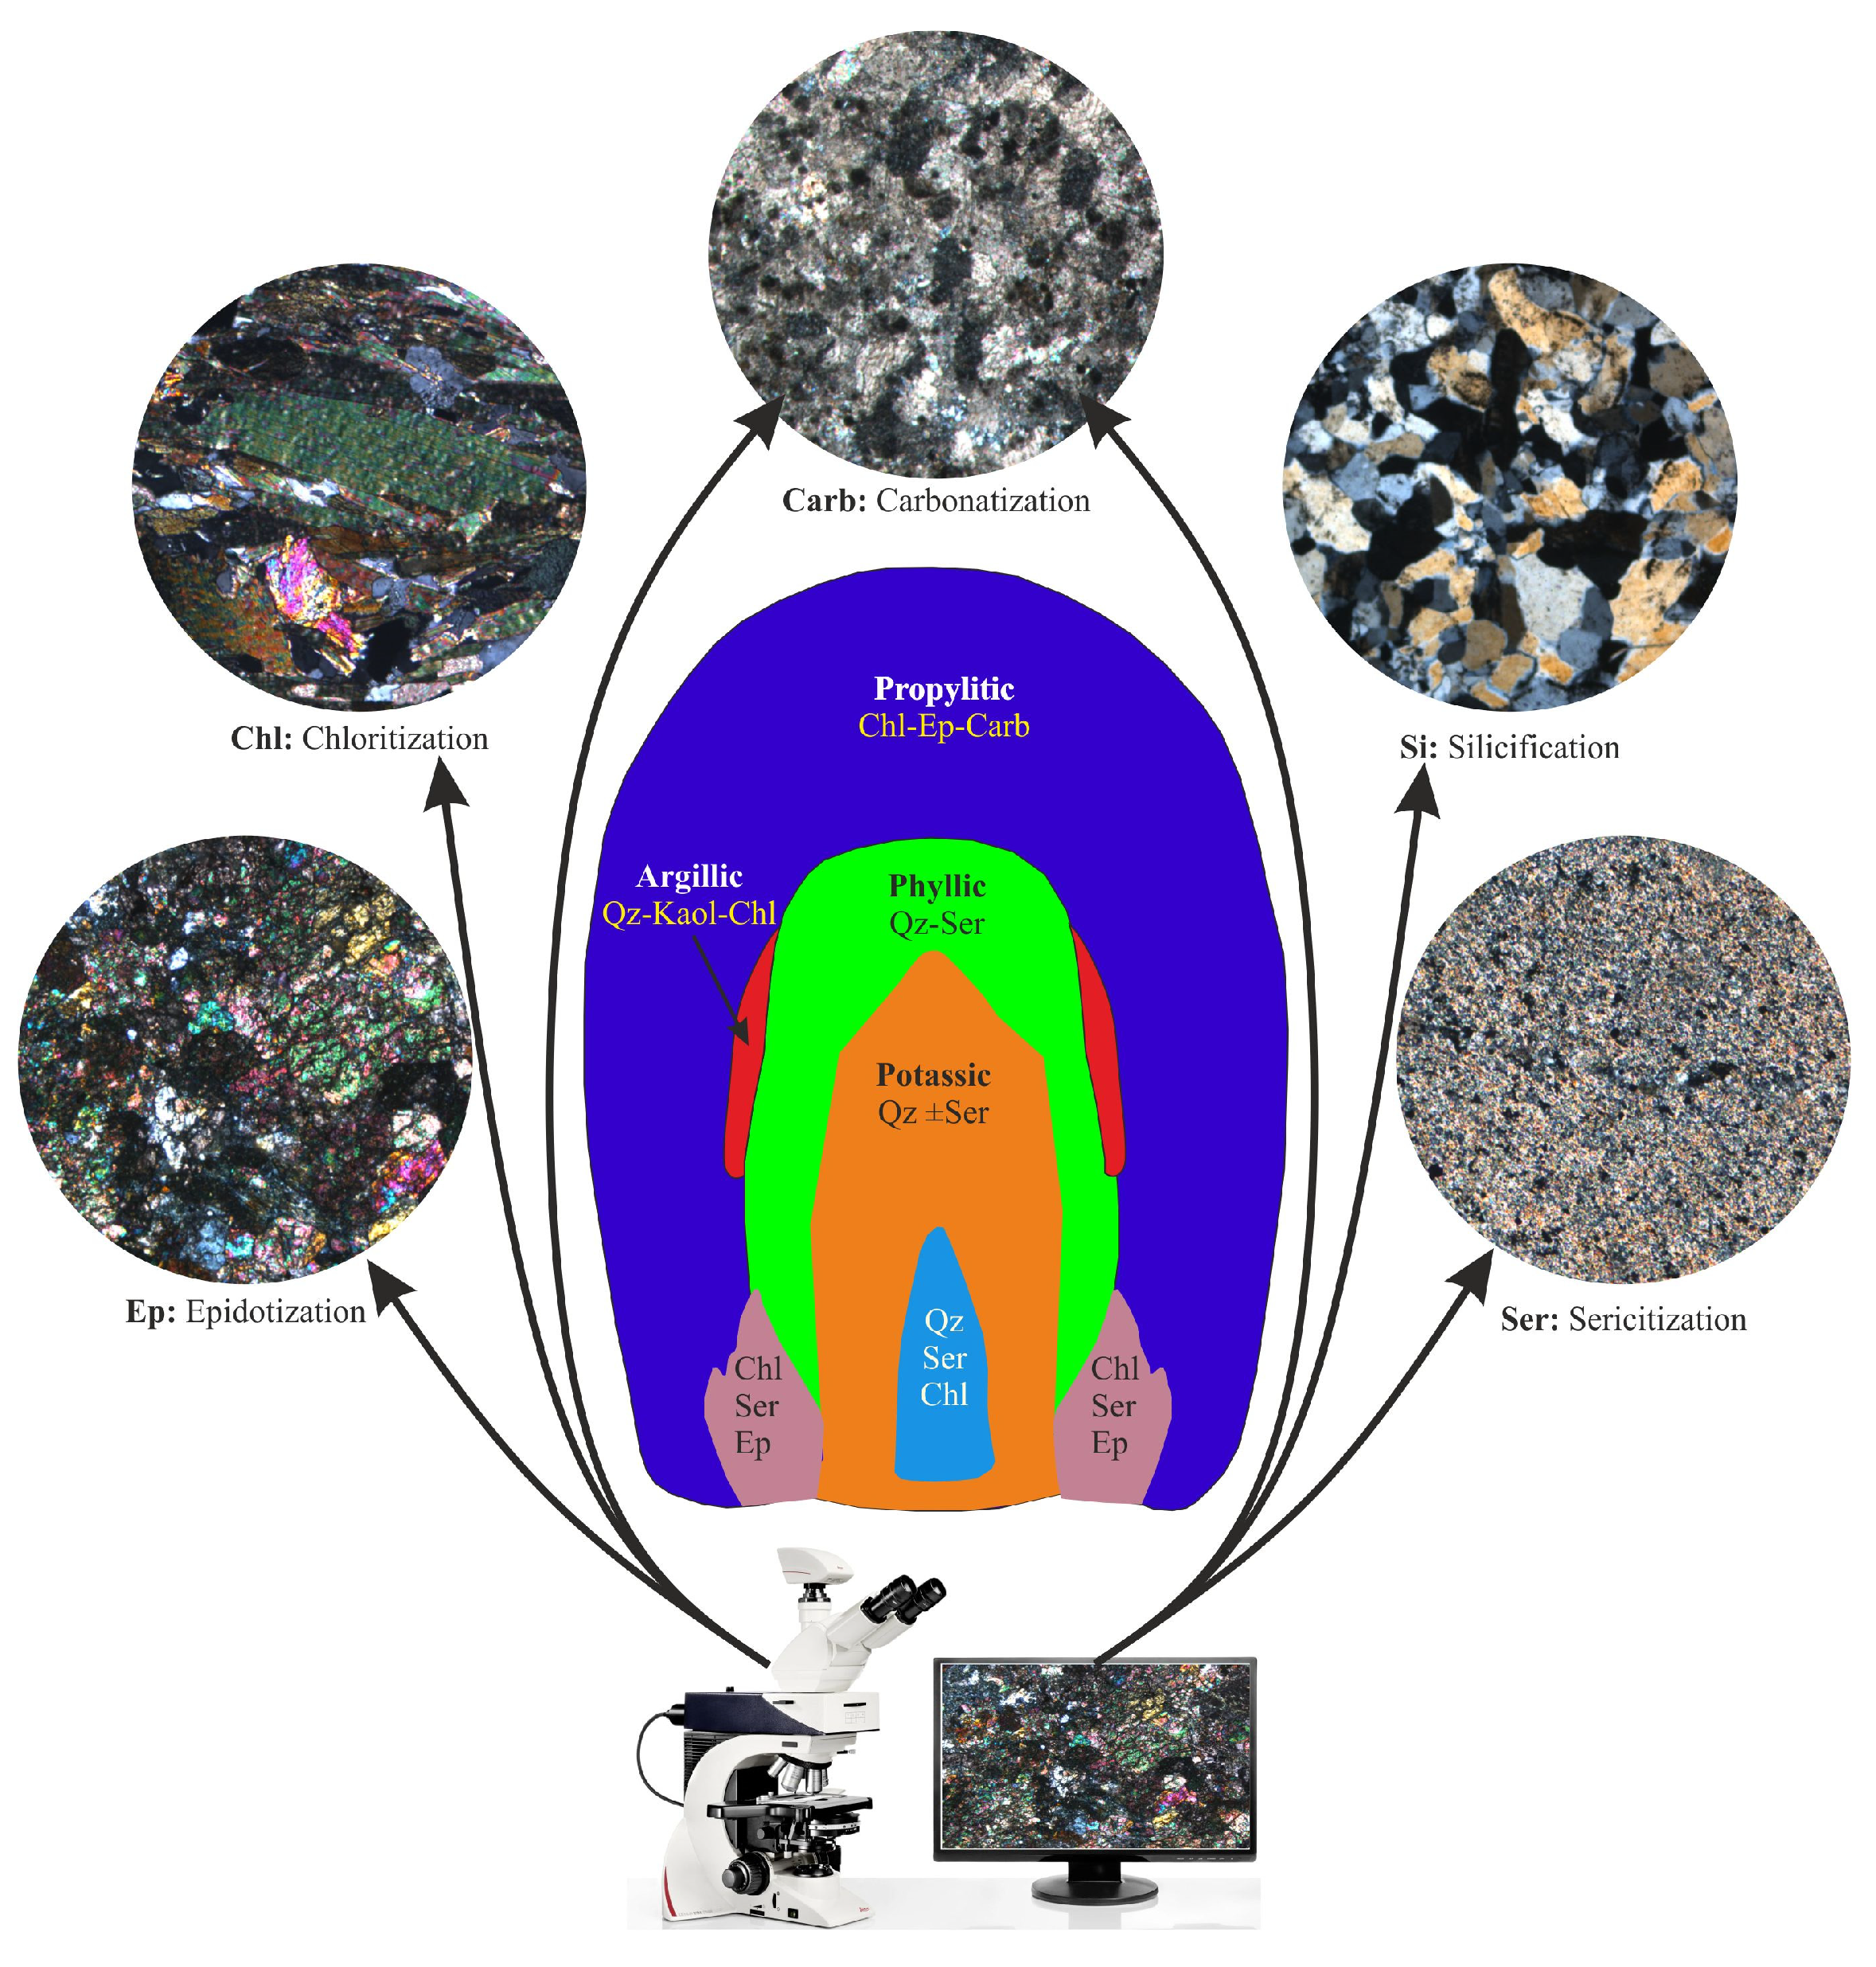
The thin section samples representing the alteration types used in this study were obtained from regions in Turkey where ore deposits associated with granitoid and volcanic rocks are observed. Microscopic examinations conducted on thin sections prepared from altered samples were primarily based on representative samples from porphyry Cu-Au deposits associated with granitoids [38], as well as from vein- and skarn-type Pb-Zn deposits associated with granitoids and volcanics [39,40,41] in Central Anatolia.
Thin section samples used for mineralogical and petrographic analysis were initially cut to dimensions of approximately 30 × 50 × 1 mm using a precision stone-cutting machine, allowing them to be mounted onto standard glass slides. The sample surfaces were polished with silicon carbide powders of varying grain sizes (220 to 1200 µm), then affixed to one polished surface of the slide. The opposite surface was subsequently ground down to a final thickness of ~0.03 mm. A coverslip was applied to complete the preparation process. To ensure consistency in image quality and eliminate potential variability arising from differences in section thickness or preparation materials, all thin section samples were prepared by the same technician using identical equipment at the Thin Section Laboratory of the Faculty of Engineering, Sivas Cumhuriyet University.
Following preparation, thin section images were acquired using a Leica DM 2500 polarized microscope under cross-polarized illumination with a 10× objective lens. Illumination intensity, exposure time, and white balance settings were kept constant throughout the imaging process to maintain uniformity across the dataset.
A total of 5000 high-resolution micrographs (1728 × 1296 pixels) were collected from over 500 distinct thin sections, with multiple fields of different view captured per section. The dataset includes 1000 images for each of the five hydrothermal alteration types, representing diverse mineralogical textures and spatial distributions. This image collection forms the basis for the classification analysis performed using deep convolutional neural networks and transfer learning techniques (Figure 1).
Figure 1. Thin section images of hydrothermal alteration types and the microscope system used for data capture (porphyry model after [42]).
Applsci 15 12274 g001

2.3. Deep Convolutional Neural Networks

2.3.1. DenseNet121

The Dense Convolutional Network (DenseNet) is one of the DL architecture notable for its dense connectivity. In DenseNet, each layer is directly connected to every other layer in a feedforward manner. Unlike traditional L-layer convolutional networks, which have L connections, DenseNet features (L × (L + 1))/2 forward connections, enhancing data transfer efficiency across the network [33]. Each layer uses the feature maps generated by all previous layers as input, which are then passed on to the next layers. The DenseNet121 architecture begins with a Conv (7 × 7) convolutional layer, followed by four dense blocks, and concludes with a fully connected layer for classification. The entire network consists of 121 layers, with the four dense blocks containing 6, 12, 24, and 16 convolutional layers, respectively. Each convolutional block within the dense blocks contains Conv (1 × 1) and Conv (3 × 3) layers. Additionally, transitions between dense blocks incorporate Conv (1 × 1) and Average Pooling (2 × 2) layers, along with Batch Normalization and ReLU activation functions. The architecture of the DenseNet121 network is shown in Figure 2.

2.3.2. ResNet50

The Residual Network (ResNet) is an enhanced version of the CNN architecture, designed to mitigate the problem of vanishing gradients that arises as network depth increases [32]. In conventional deep networks, it was observed that as network depth grows, the training accuracy first saturates and then degrades rapidly. To mitigate this, ResNet introduces “skip connections” that allow the signal to bypass one or more layers. In this framework, the output of a convolutional block, F ( x ) is combined with the block’s original input, x , through an element-wise addition. This fundamental concept of residual learning is shown in Figure 3.
In this figure, x is the input vector, while F ( x ) is the residual mapping learned by the weight layers. The block’s final output, F x + x , is derived from the element-wise sum. This structure enables gradients to flow more easily to earlier layers during backpropagation, allowing for the effective training of deeper networks.
The ResNet50 architecture consists of five main stages. The initial convolutional layer consists of Conv (7 × 7) convolution block. The subsequent four layers contain 3, 4, 6, and 3 convolutional blocks, respectively, with each block incorporating Conv (1 × 1), Conv (3 × 3), and Conv (1 × 1) layers in that order. The final layer of ResNet50 features a fully connected layer for classification, consistent with the architecture of many transfer learning models [32]. The overall architecture of the RestNet50 network is shown in Figure 4.

2.3.3. VGG16

VGG, introduced by the Visual Geometry Group (VGG) in 2014 is a deep convolutional neural network that won the ImageNet Challenge in image classification tasks [31]. The structure of VGG16 consists of 16 weight layers, including 13 convolutional layers and 3 fully connected layers. The convolutional layers are arranged in blocks, and each convolution block uses of small 3 × 3 convolutional filters exclusively, with a stride and padding of 1, which enables the depth of the network while maintaining computational efficiency. The pooling layers use a 2 × 2 kernel with a stride of 2, which reduces the dimensions of the feature maps. After the final convolutional block, the network transitions to 3 fully connected layers at the end having 4096, 4096, and 1000 units, respectively. These layers are followed by a Softmax layer for classification. The architecture of the VGG16 network is shown in Figure 5.

2.3.4. InceptionV3

InceptionV1 (GoogLeNet) was first introduced in 2014, featuring an architecture that significantly reduced the number of parameters while enabling the network to process features at multiple scales [43]. InceptionV3 is an improved version with a deeper architecture and advanced techniques like factorized and asymmetric convolutions, batch normalization, and label smoothing. These innovations made it more computationally efficient and capable of achieving higher accuracy on large datasets. InceptionV3 is a 48-layer deep model that maintains high accuracy on large datasets like ImageNet while being more computationally efficient than earlier Inception versions and conventional CNN architectures. The network architecture is primarily composed of stacked Inception modules of varying filter sizes, along with pooling layers for dimensionality reduction and a final fully connected layer for classification [43]. The InceptionV3 network structure is shown in Figure 6.

2.4. Performance Analysis

DL algorithms used for classification are evaluated using various metrics to assess their predictive accuracy and reliability. Accuracy, a basic measure of success, indicates the proportion of correct classifications made by the model [44,45]. However, it is not sufficient and can be misleading, especially in unbalanced datasets. In such cases, precision and recall metrics become crucial. Precision measures the proportion of true positive predictions among all positive predictions made by the model, while recall quantifies the proportion of actual positives that were correctly identified [44,46]. The F1 score, a harmonic mean of precision and recall, provides a balanced assessment of model success [44,47]. The confusion matrix illustrates the distribution of correct and incorrect classifications, offering a more detailed analysis of the model’s performance [47,48]. These metrics are valuable in evaluating and optimizing the performance of classification models for real-world applications.
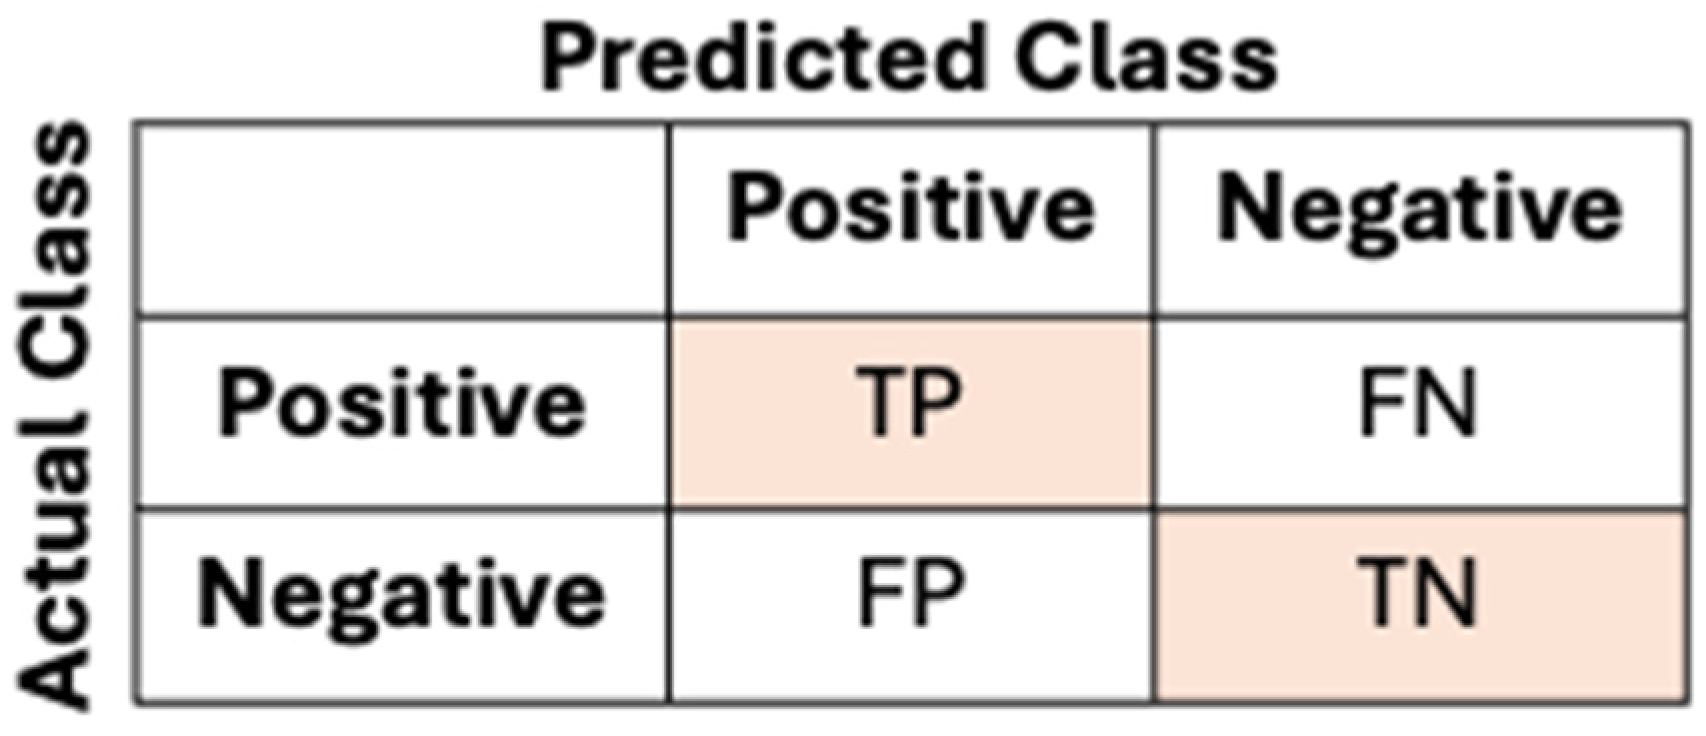
The confusion matrix consists of rows and columns. Typically, the rows represent the actual classes, while the columns represent the predicted classes. An example of a confusion matrix structure is shown in Figure 7. In this table, correctly classified positive and negative values are denoted by TP and TN, respectively, while incorrectly classified positive and negative values are denoted by FP and FN, respectively [47,48].
The classification success of Deep Convolutional Neural Networks was evaluated using four metrics: Accuracy (Equation (1)), Precision (Equation (2)), Recall (Equation (3)), and F1-score (Equation (4)) [14,49]. The relationships between these metrics are provided in the following equations:
A c c u r a c y = T P i + T N i T P i + T N i + F P i + F N i ,
P r e c i s i o n ( p ) i = T P i T P i + F P i ,
R e c a l l r i = T P i T P i + F N i ,
F 1 - score = 2 × p i × r i p i + r i ,
Here, i is the class label. Therefore, TPi represents TP for the i-th class, while FPi and FNi correspond to FP and FN for the i-th class, respectively. In a multi-class classification problem, overall accuracy is calculated by dividing the total number of correctly classified samples by the total number of samples across all classes as shown in (Equation (5)), where n is the number of classes, and TPi represents the correct predictions for each class [14,49].
A c c u r a c y 1 n T P i T o t a l   N u m b e r   o f   S a m p l e s

3. Results and Discussions

In this study, we used four distinct deep convolutional neural networks to classify thin section images of hydrothermal alteration types. Each network was trained and tested using our dataset consisting of 5000 images collected from more than 500 distinct thin sections. The dataset was divided into three subsets: 70% for training (3500 images), 10% for validation (500 images), and 20% for testing (1000 images). All images were resized to 216 × 162 pixels prior to input.
All experiments were implemented in Python 3.10 using the TensorFlow framework. The models were trained on a Windows-based workstation equipped with an Intel Core i7 CPU, an NVIDIA GeForce RTX 3060 (16GB) GPU. To ensure consistency across architectures, all four CNNs were fine-tuned using ImageNet pre-trained weights. Each model shared an identical custom classification head, consisting of a Flatten layer, followed by Batch Normalization, a Dense layer (1024 neurons, ReLU activation, L2 regularization = 1 × 10⁻⁵), a Dropout layer (0.25 rate), a second Batch Normalization layer, and a final Dense output layer (5 neurons, Softmax activation, L2 = 1 × 10⁻⁵).
To prevent overfitting and improve generalization, several regularization and optimization techniques were applied. Data augmentation enhanced training diversity, while Dropout and L2 weight decay reduced overfitting in the dense layers. The training process was monitored using Early Stopping and adaptive learning-rate scheduling, which halted training once validation performance stabilized. This transfer learning approach ensured that lower-level convolutional filters captured transferable spatial and textural features, while higher-level layers were adapted to the domain-specific mineralogical textures of the alteration zones. The close alignment between training, validation, and test accuracies indicated that the models learned generalized patterns rather than memorizing the training data.
The networks were trained using four different optimizers to assess their impact on performance: SGD with a learning rate of 0.0001, Adam with a learning rate of 0.0001, RMSprop with a learning rate of 0.00002, and Adadelta with a learning rate of 1.0. Each model-optimizer pair was trained five times independently for 30 epochs with a batch size of 25. The classification performance of each trial was systematically recorded and compared to determine the most effective configuration.

3.1. DenseNet121

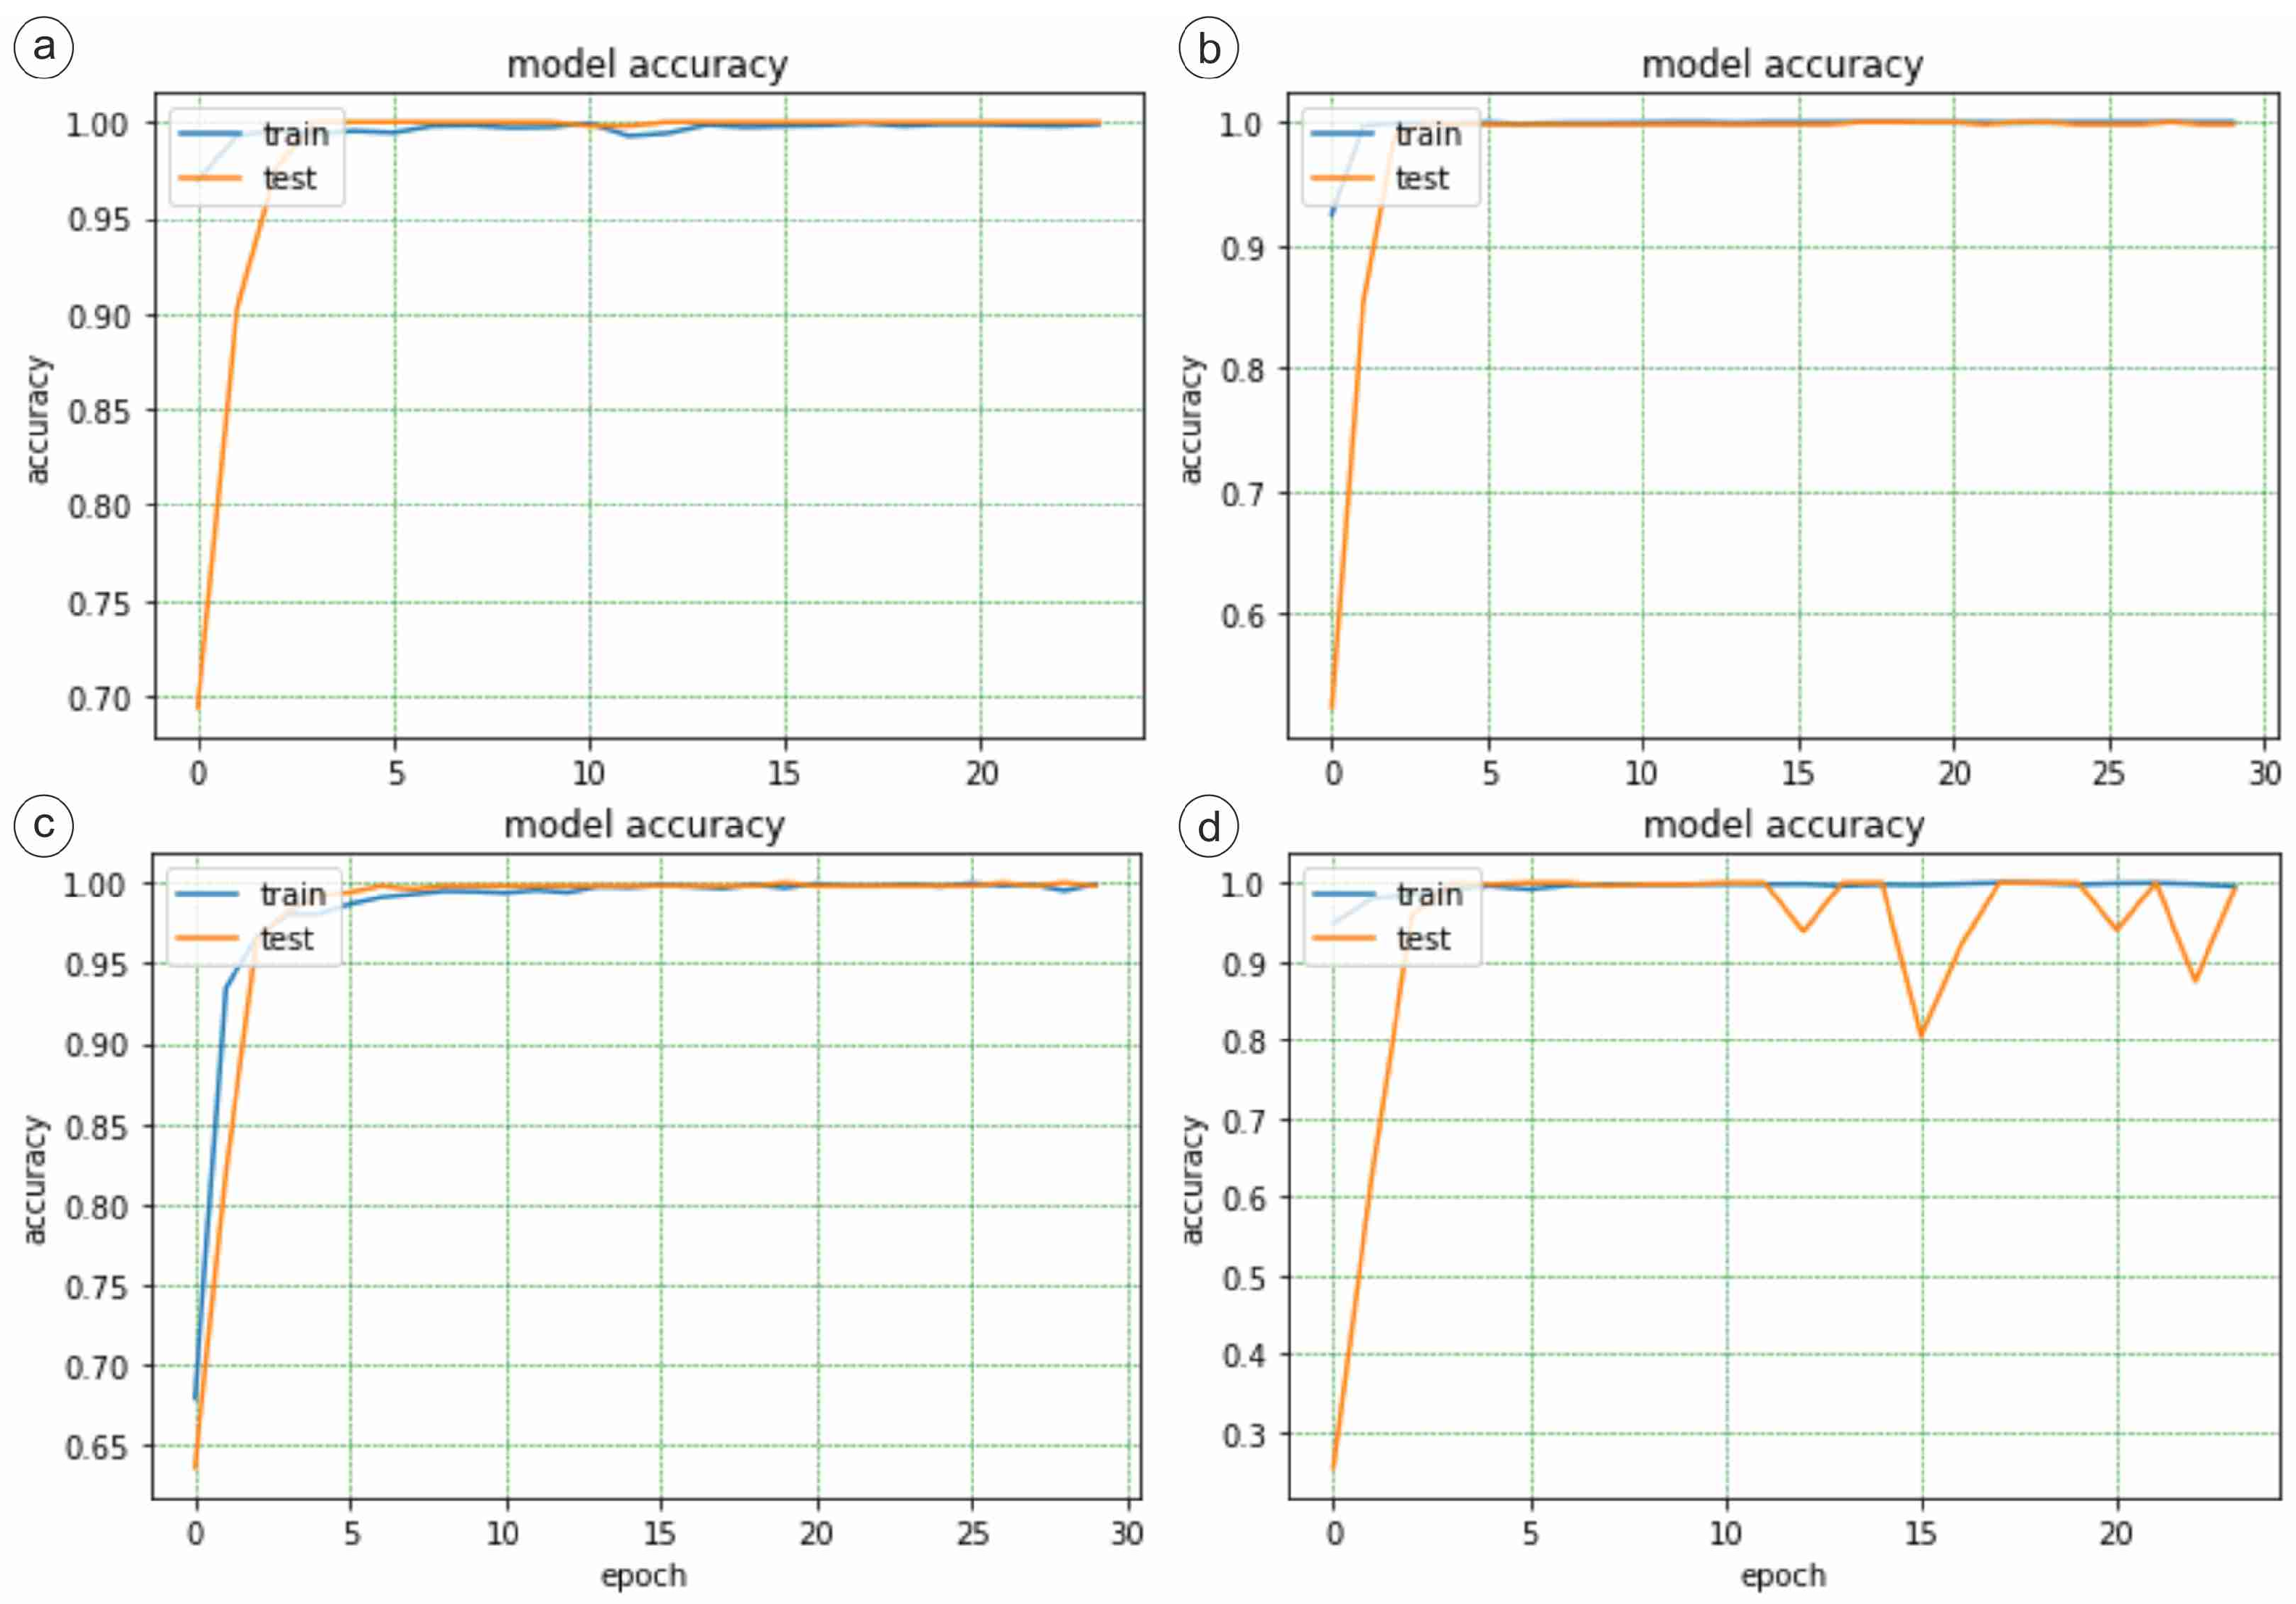
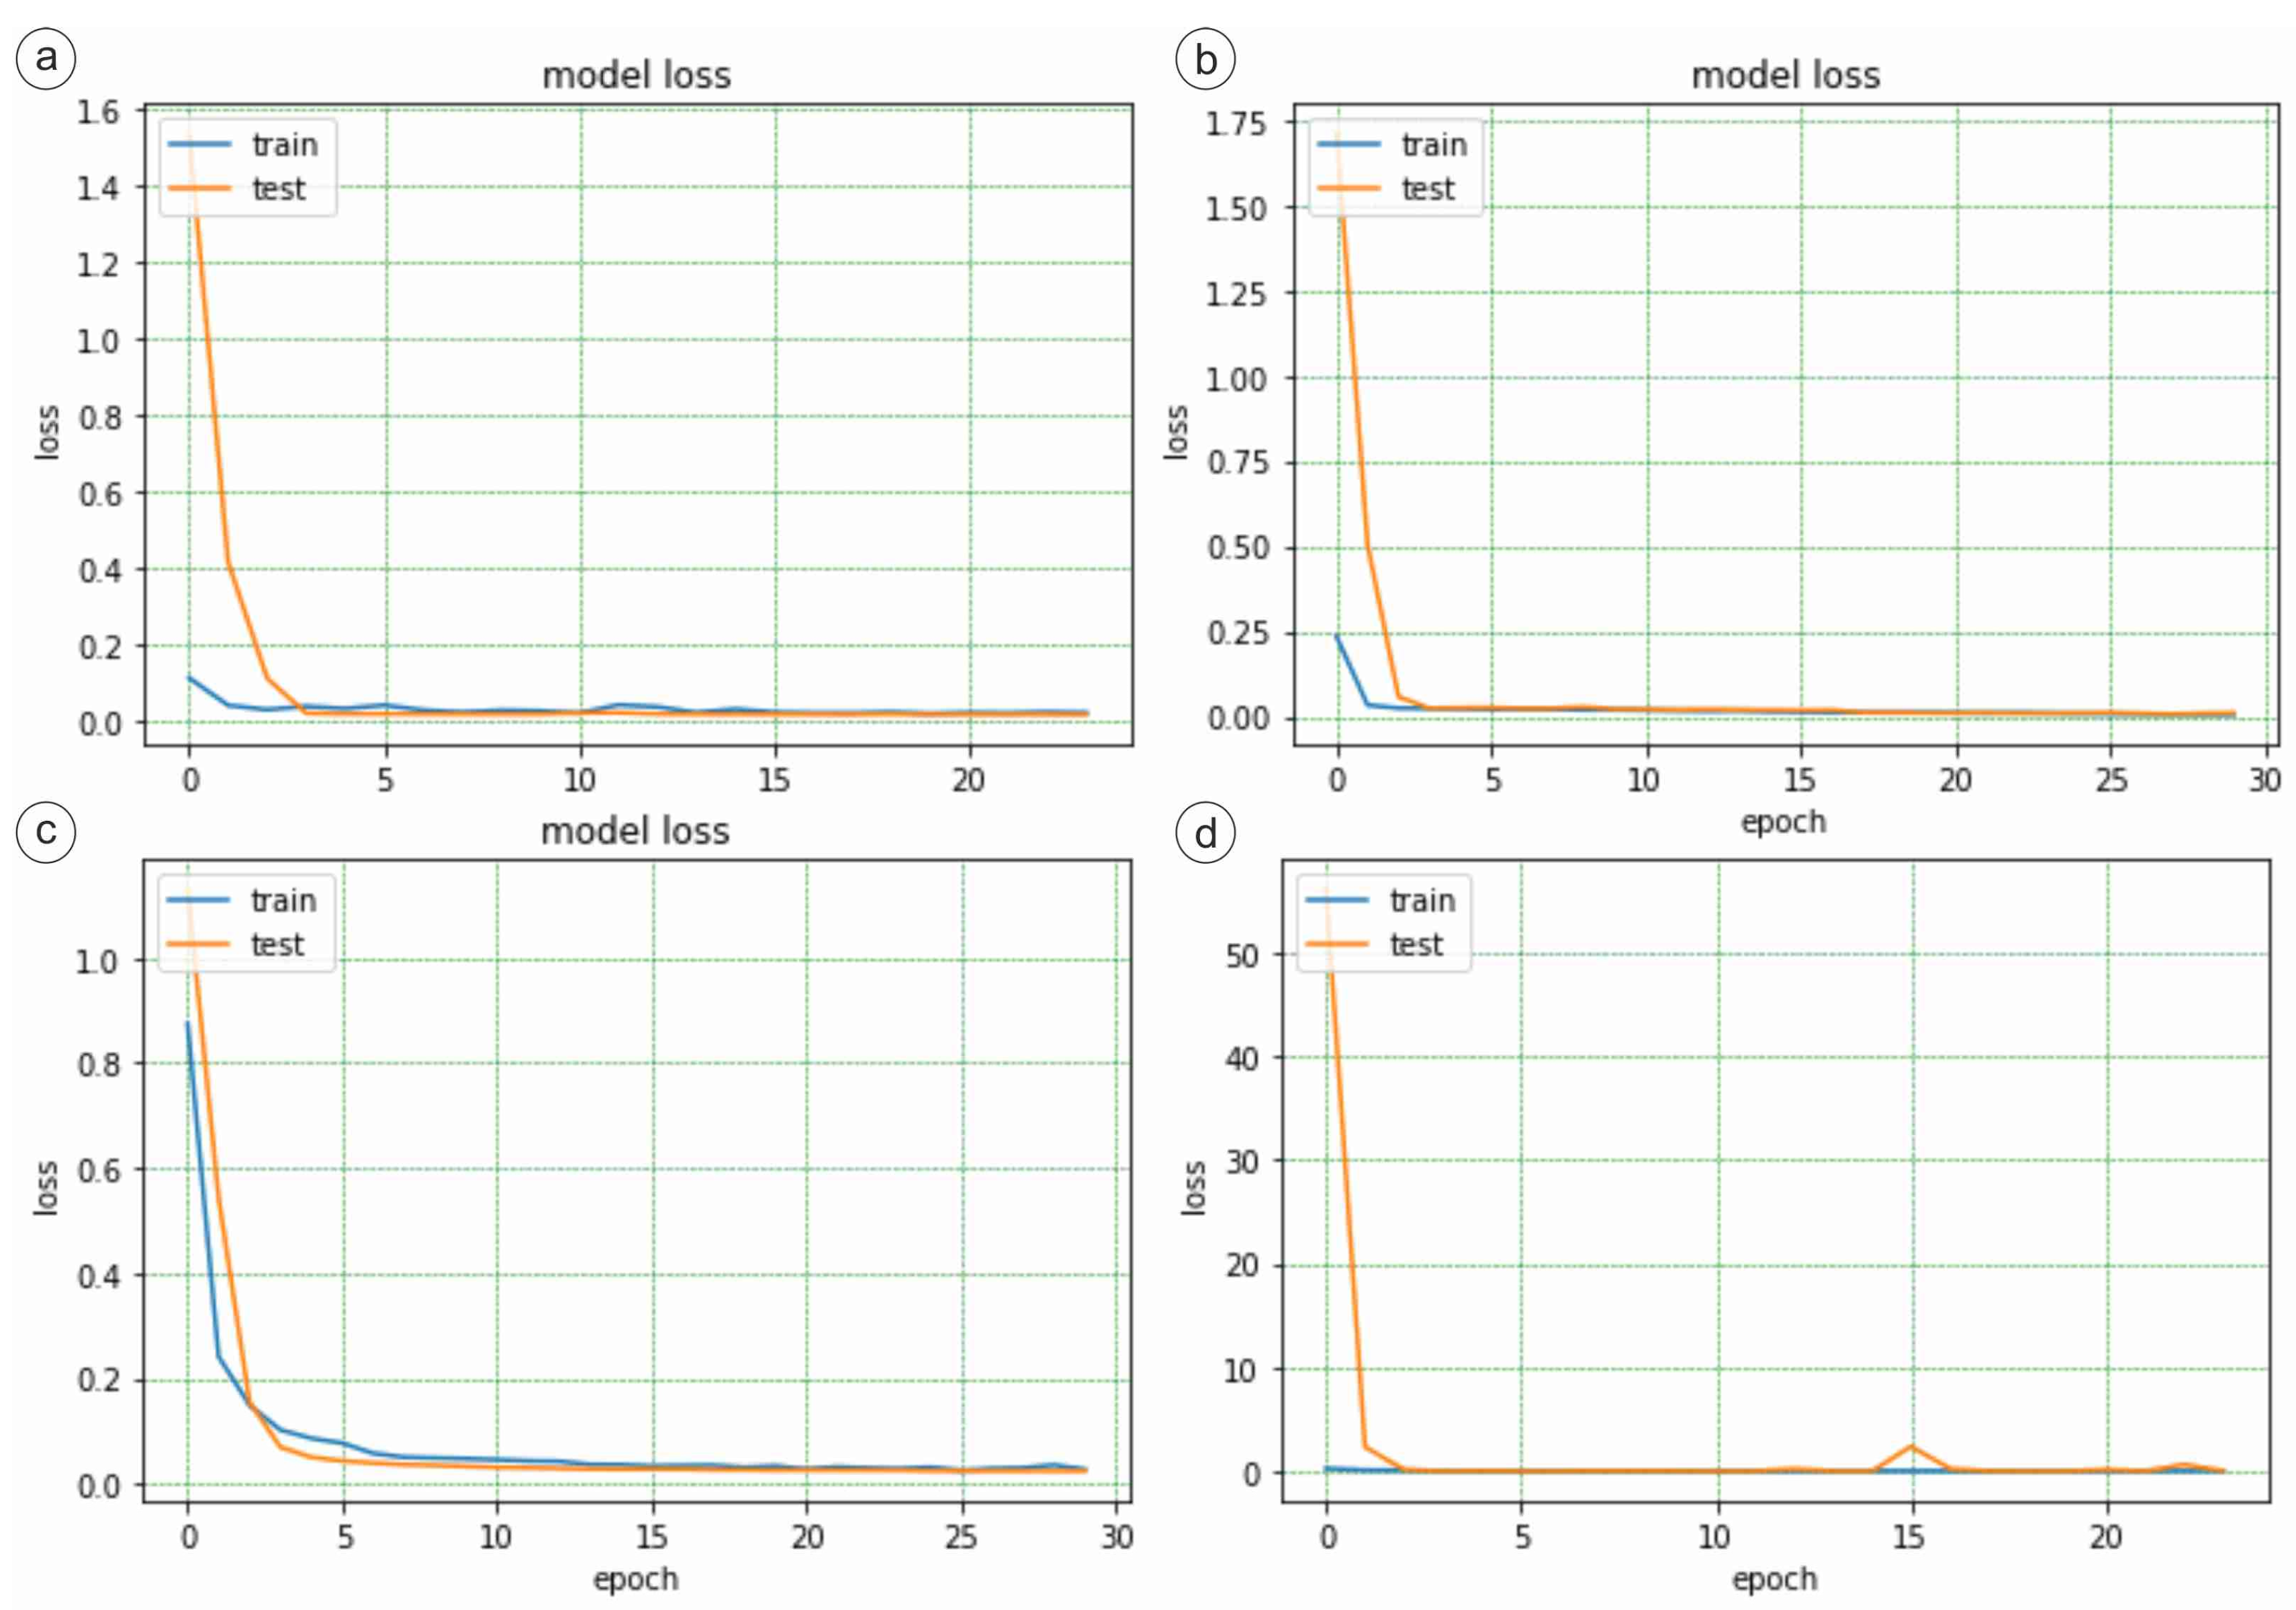
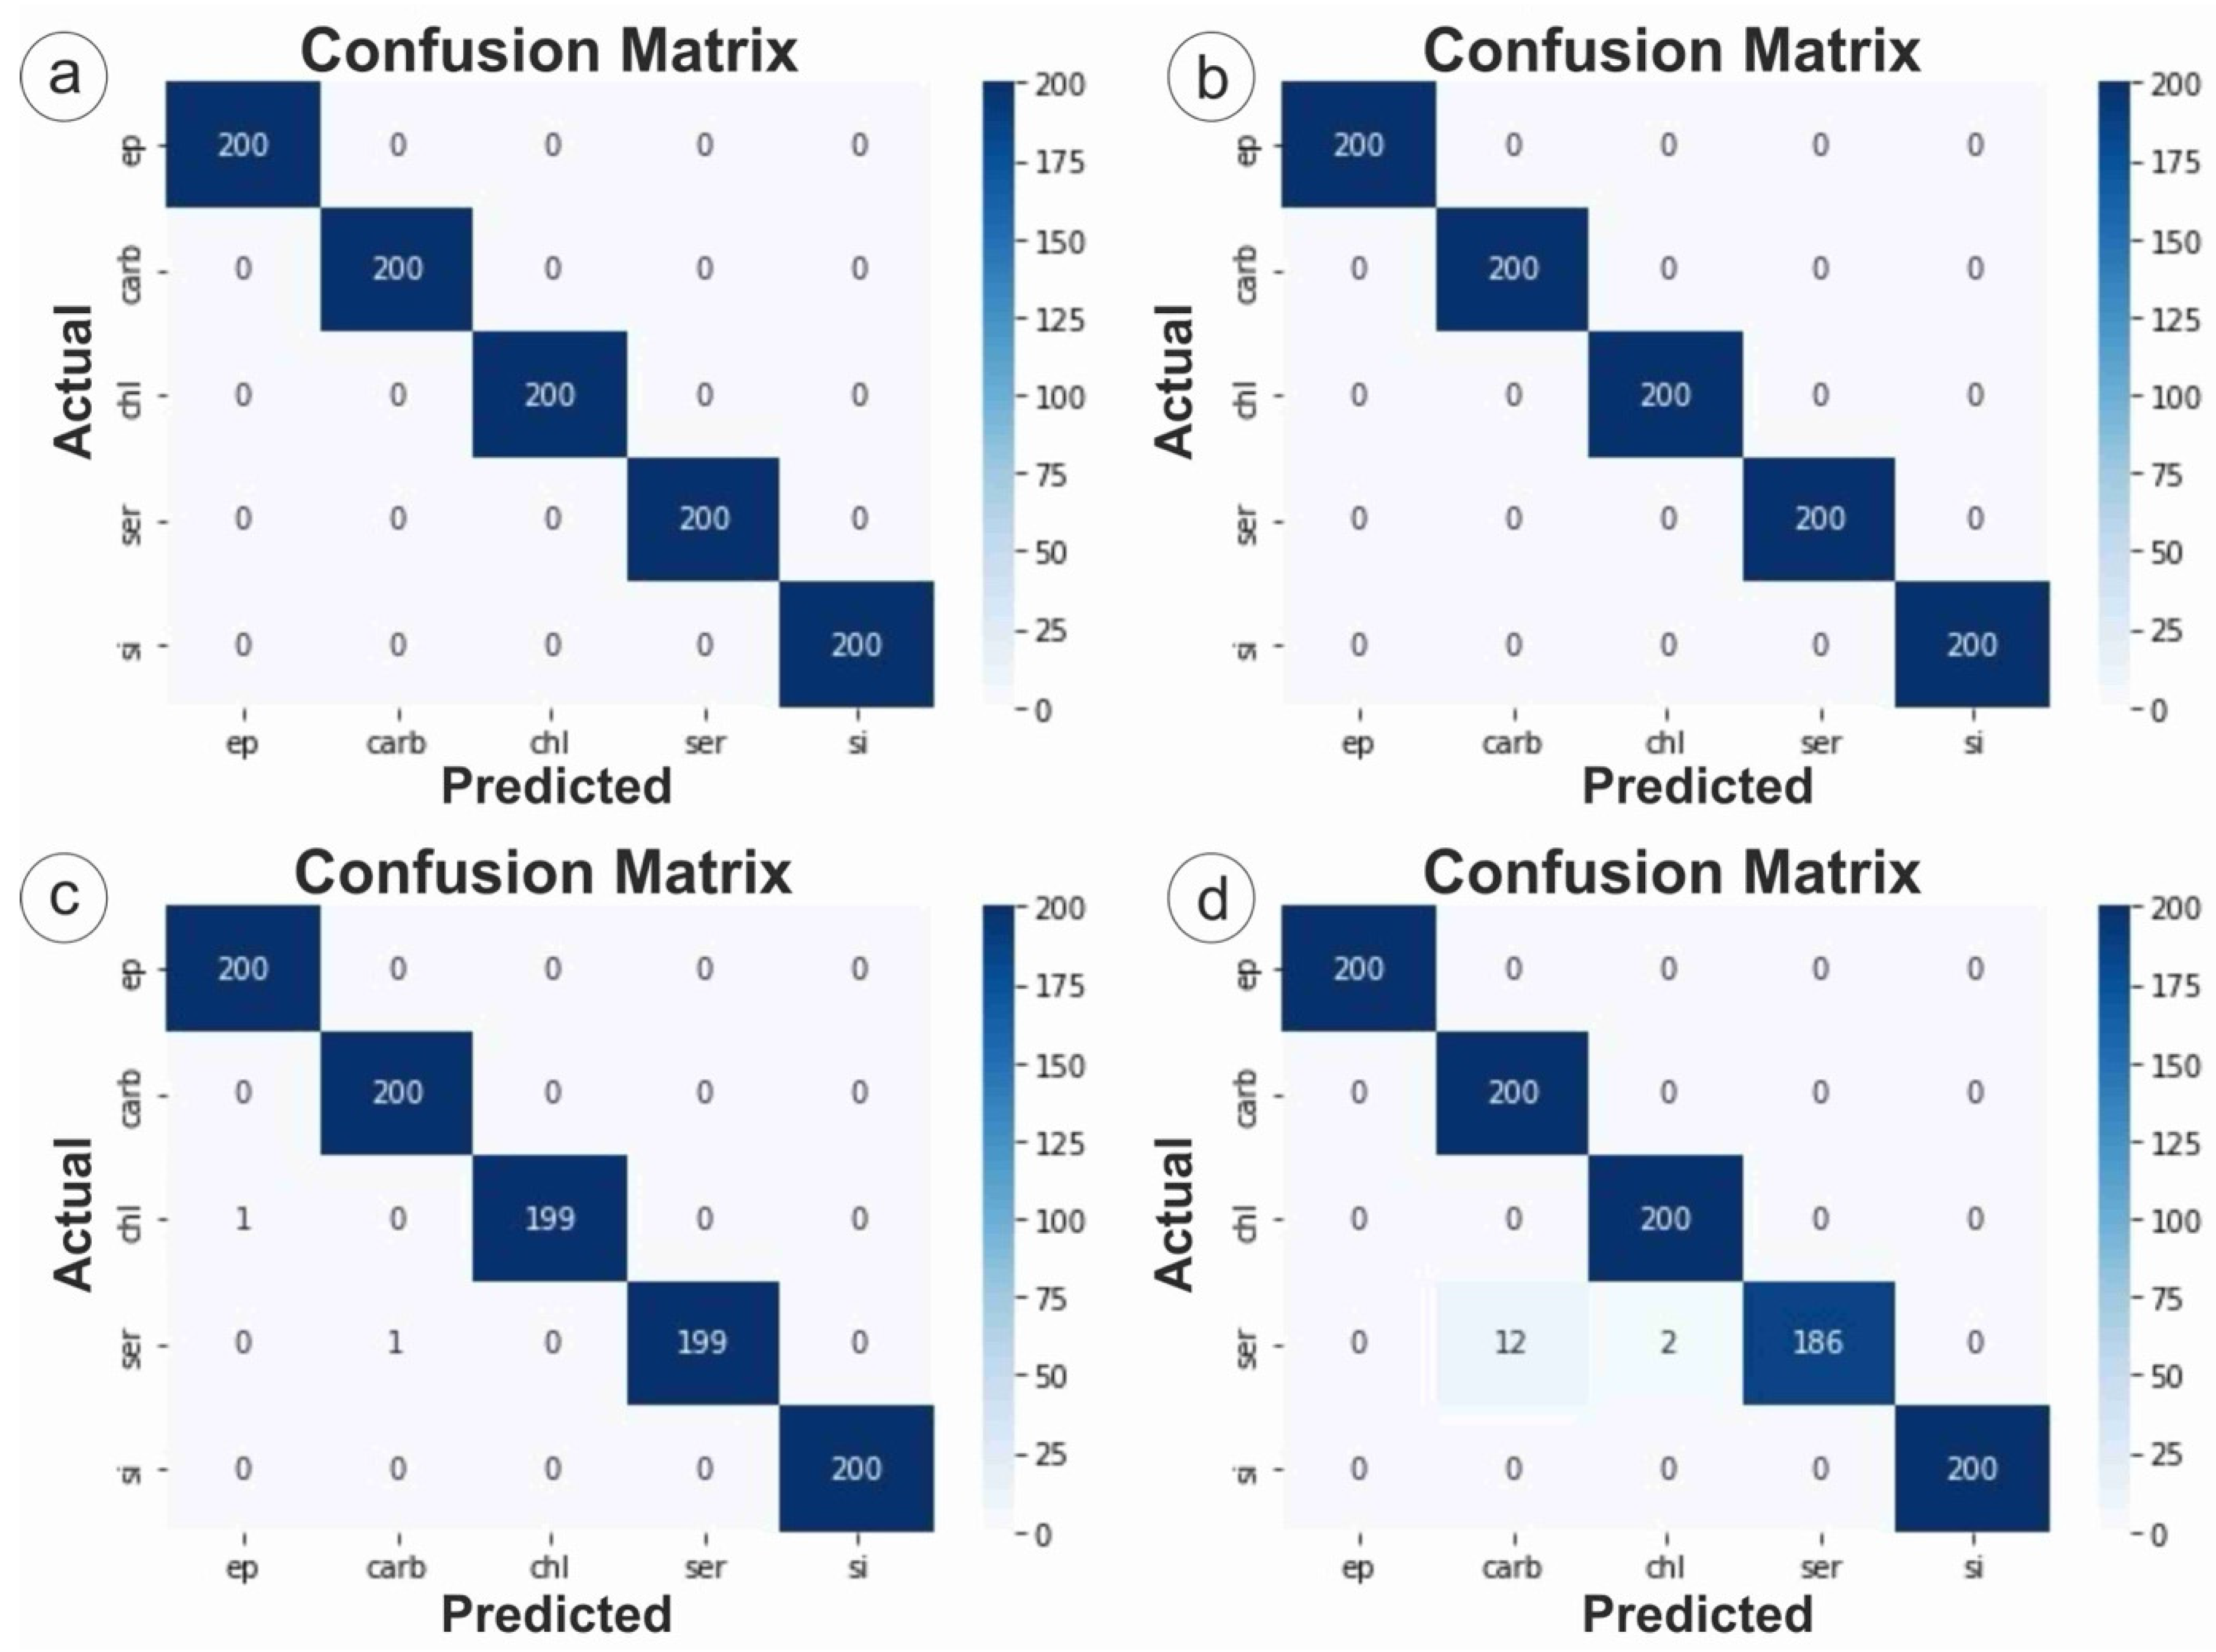
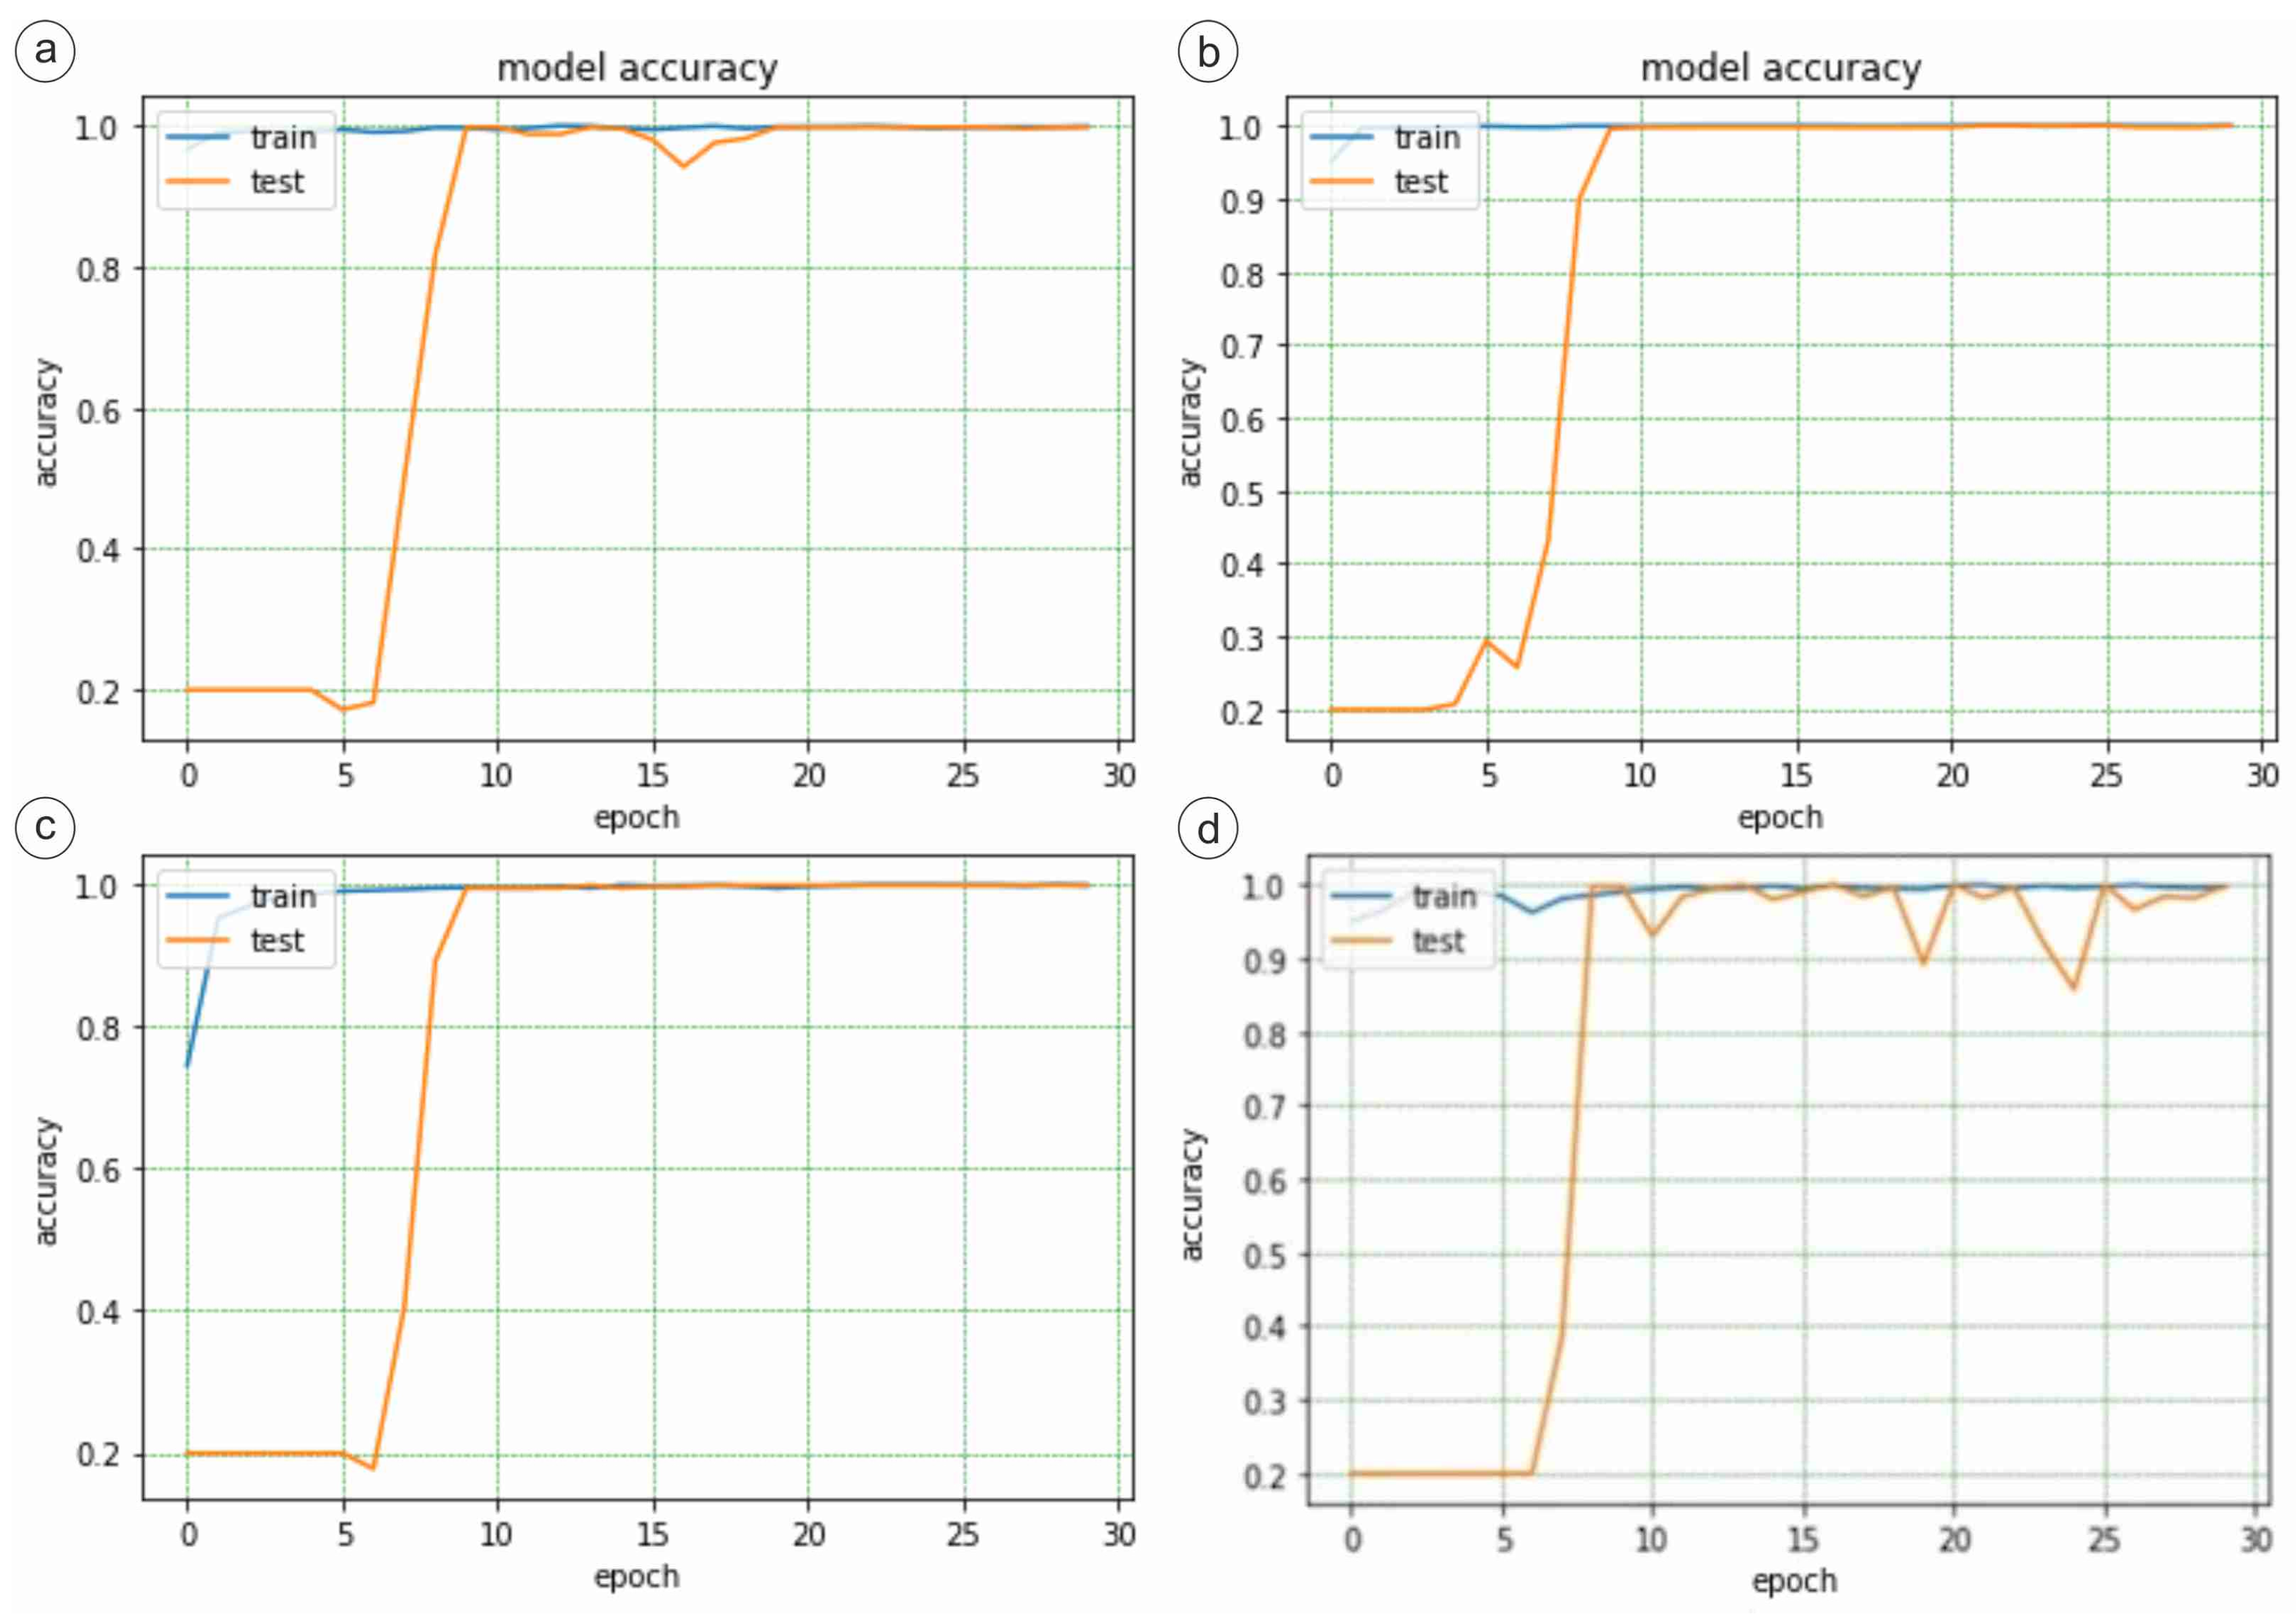
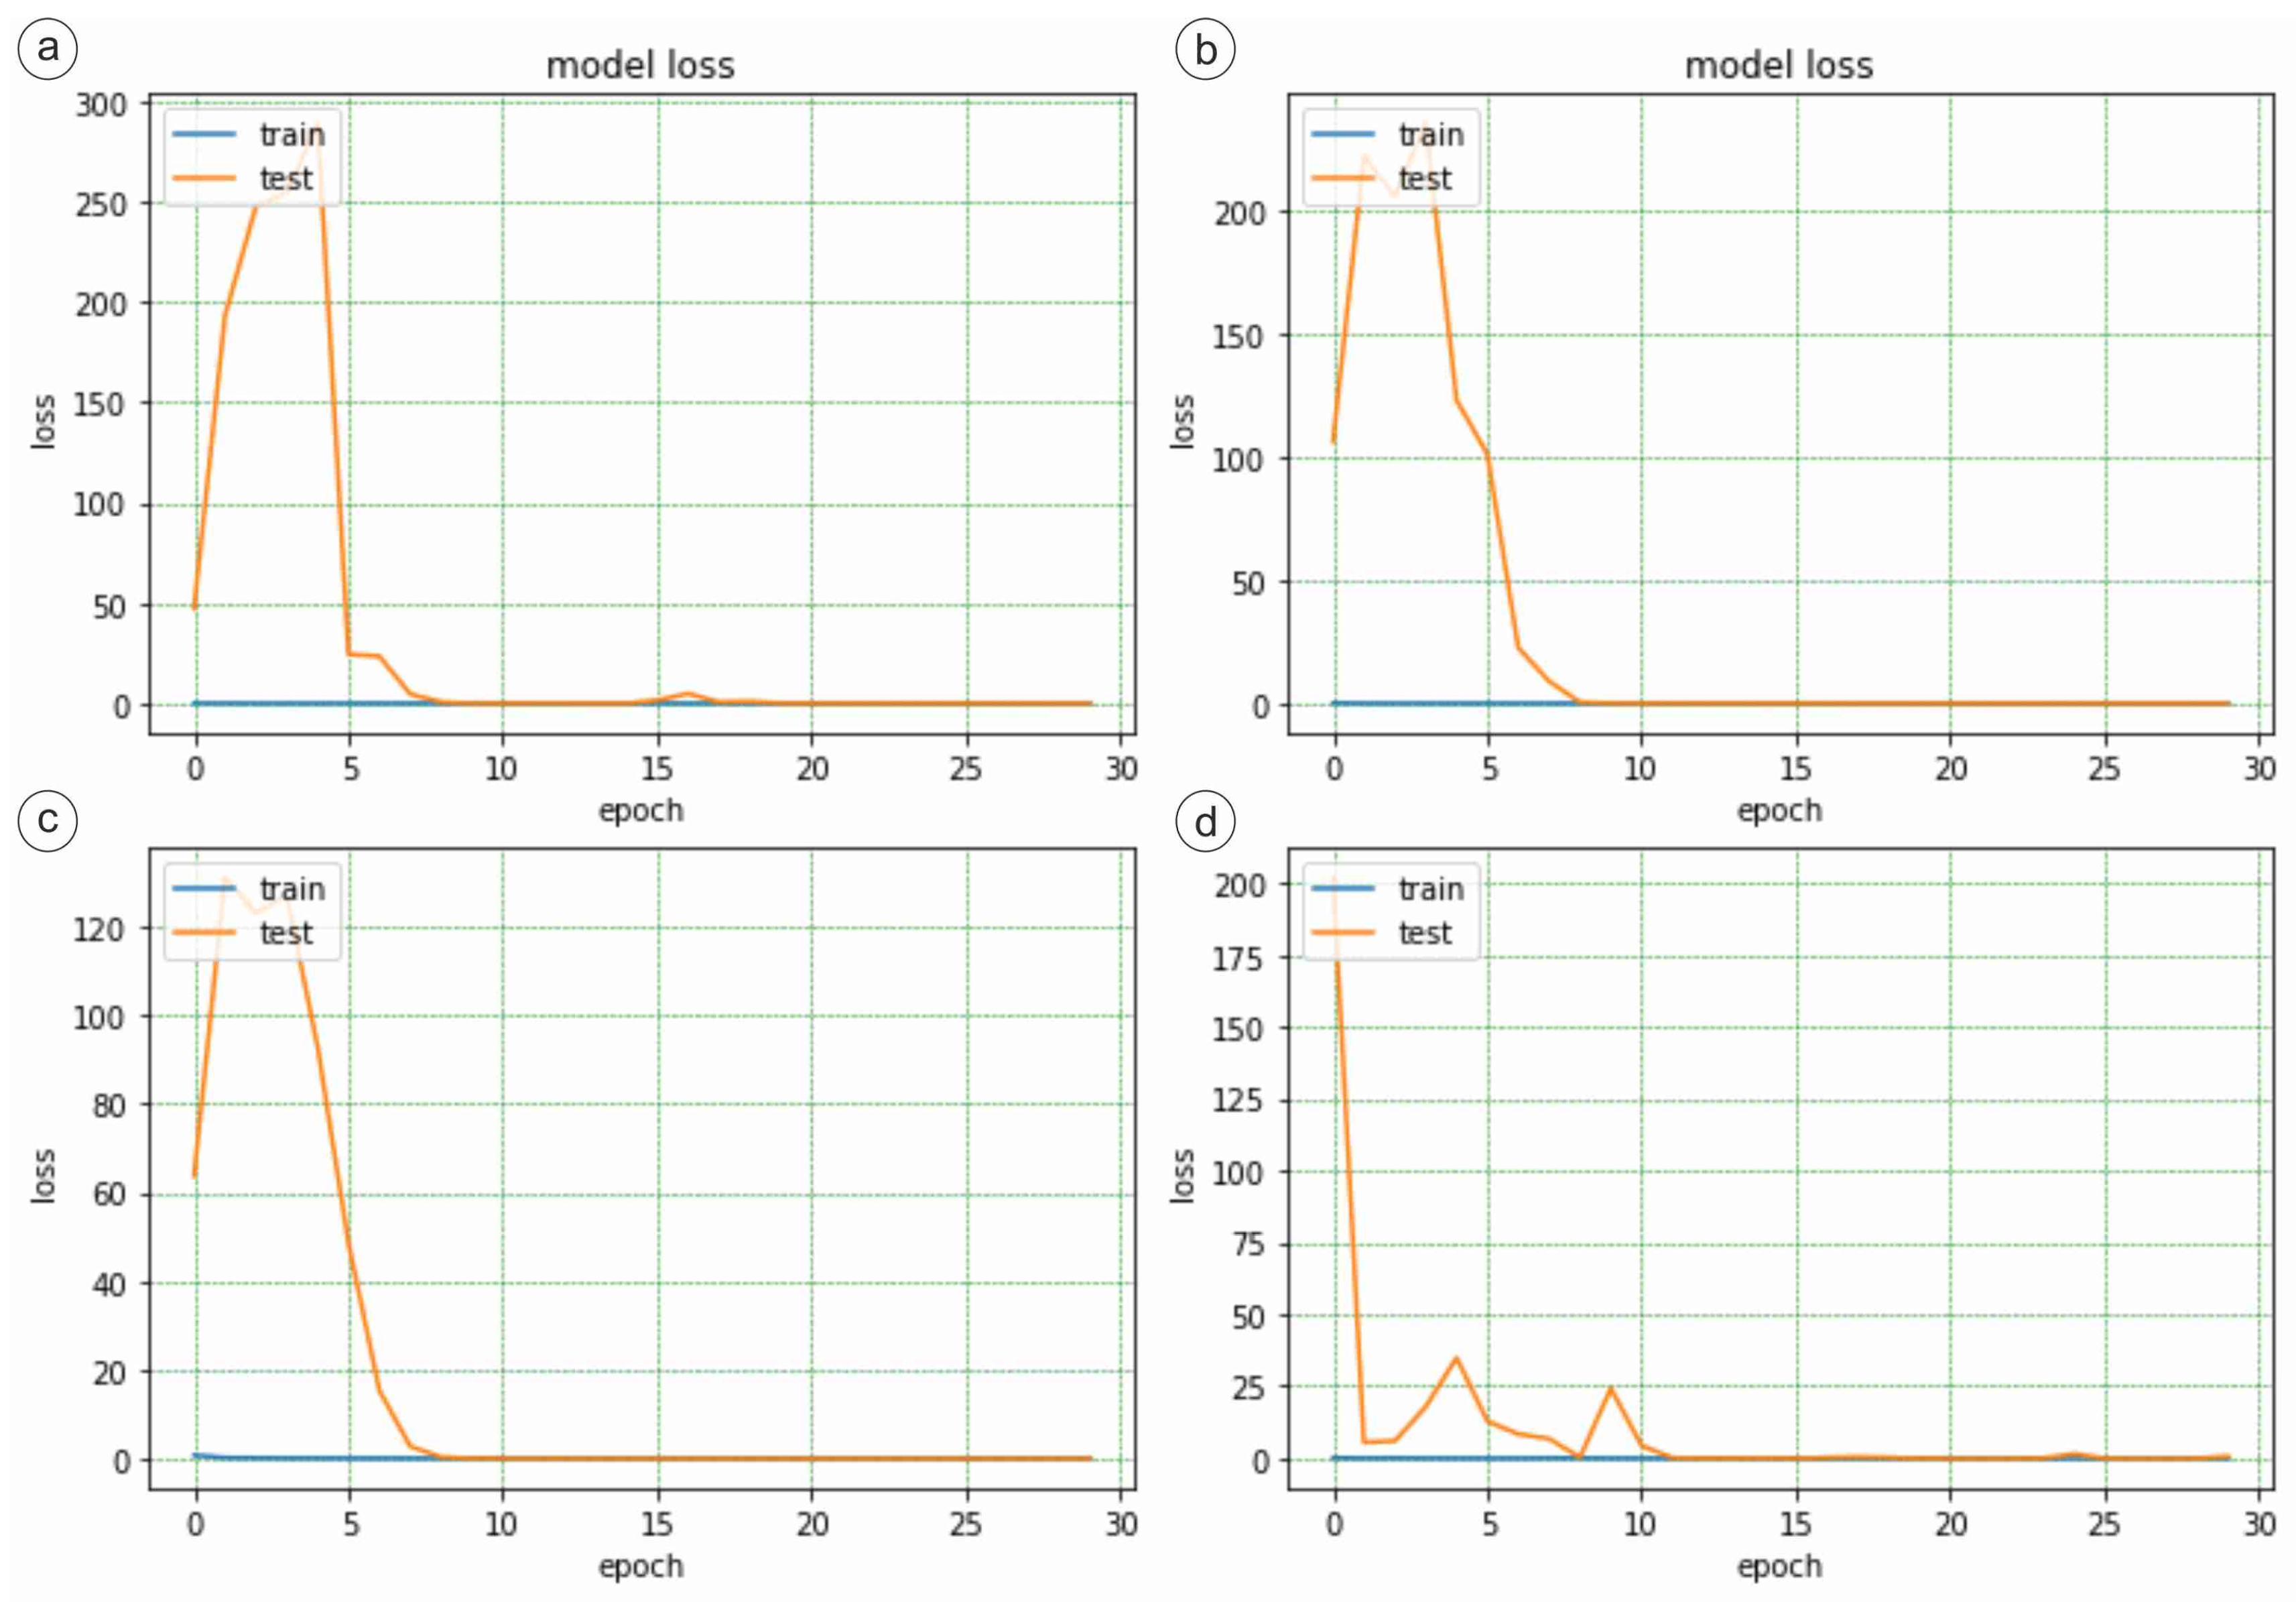
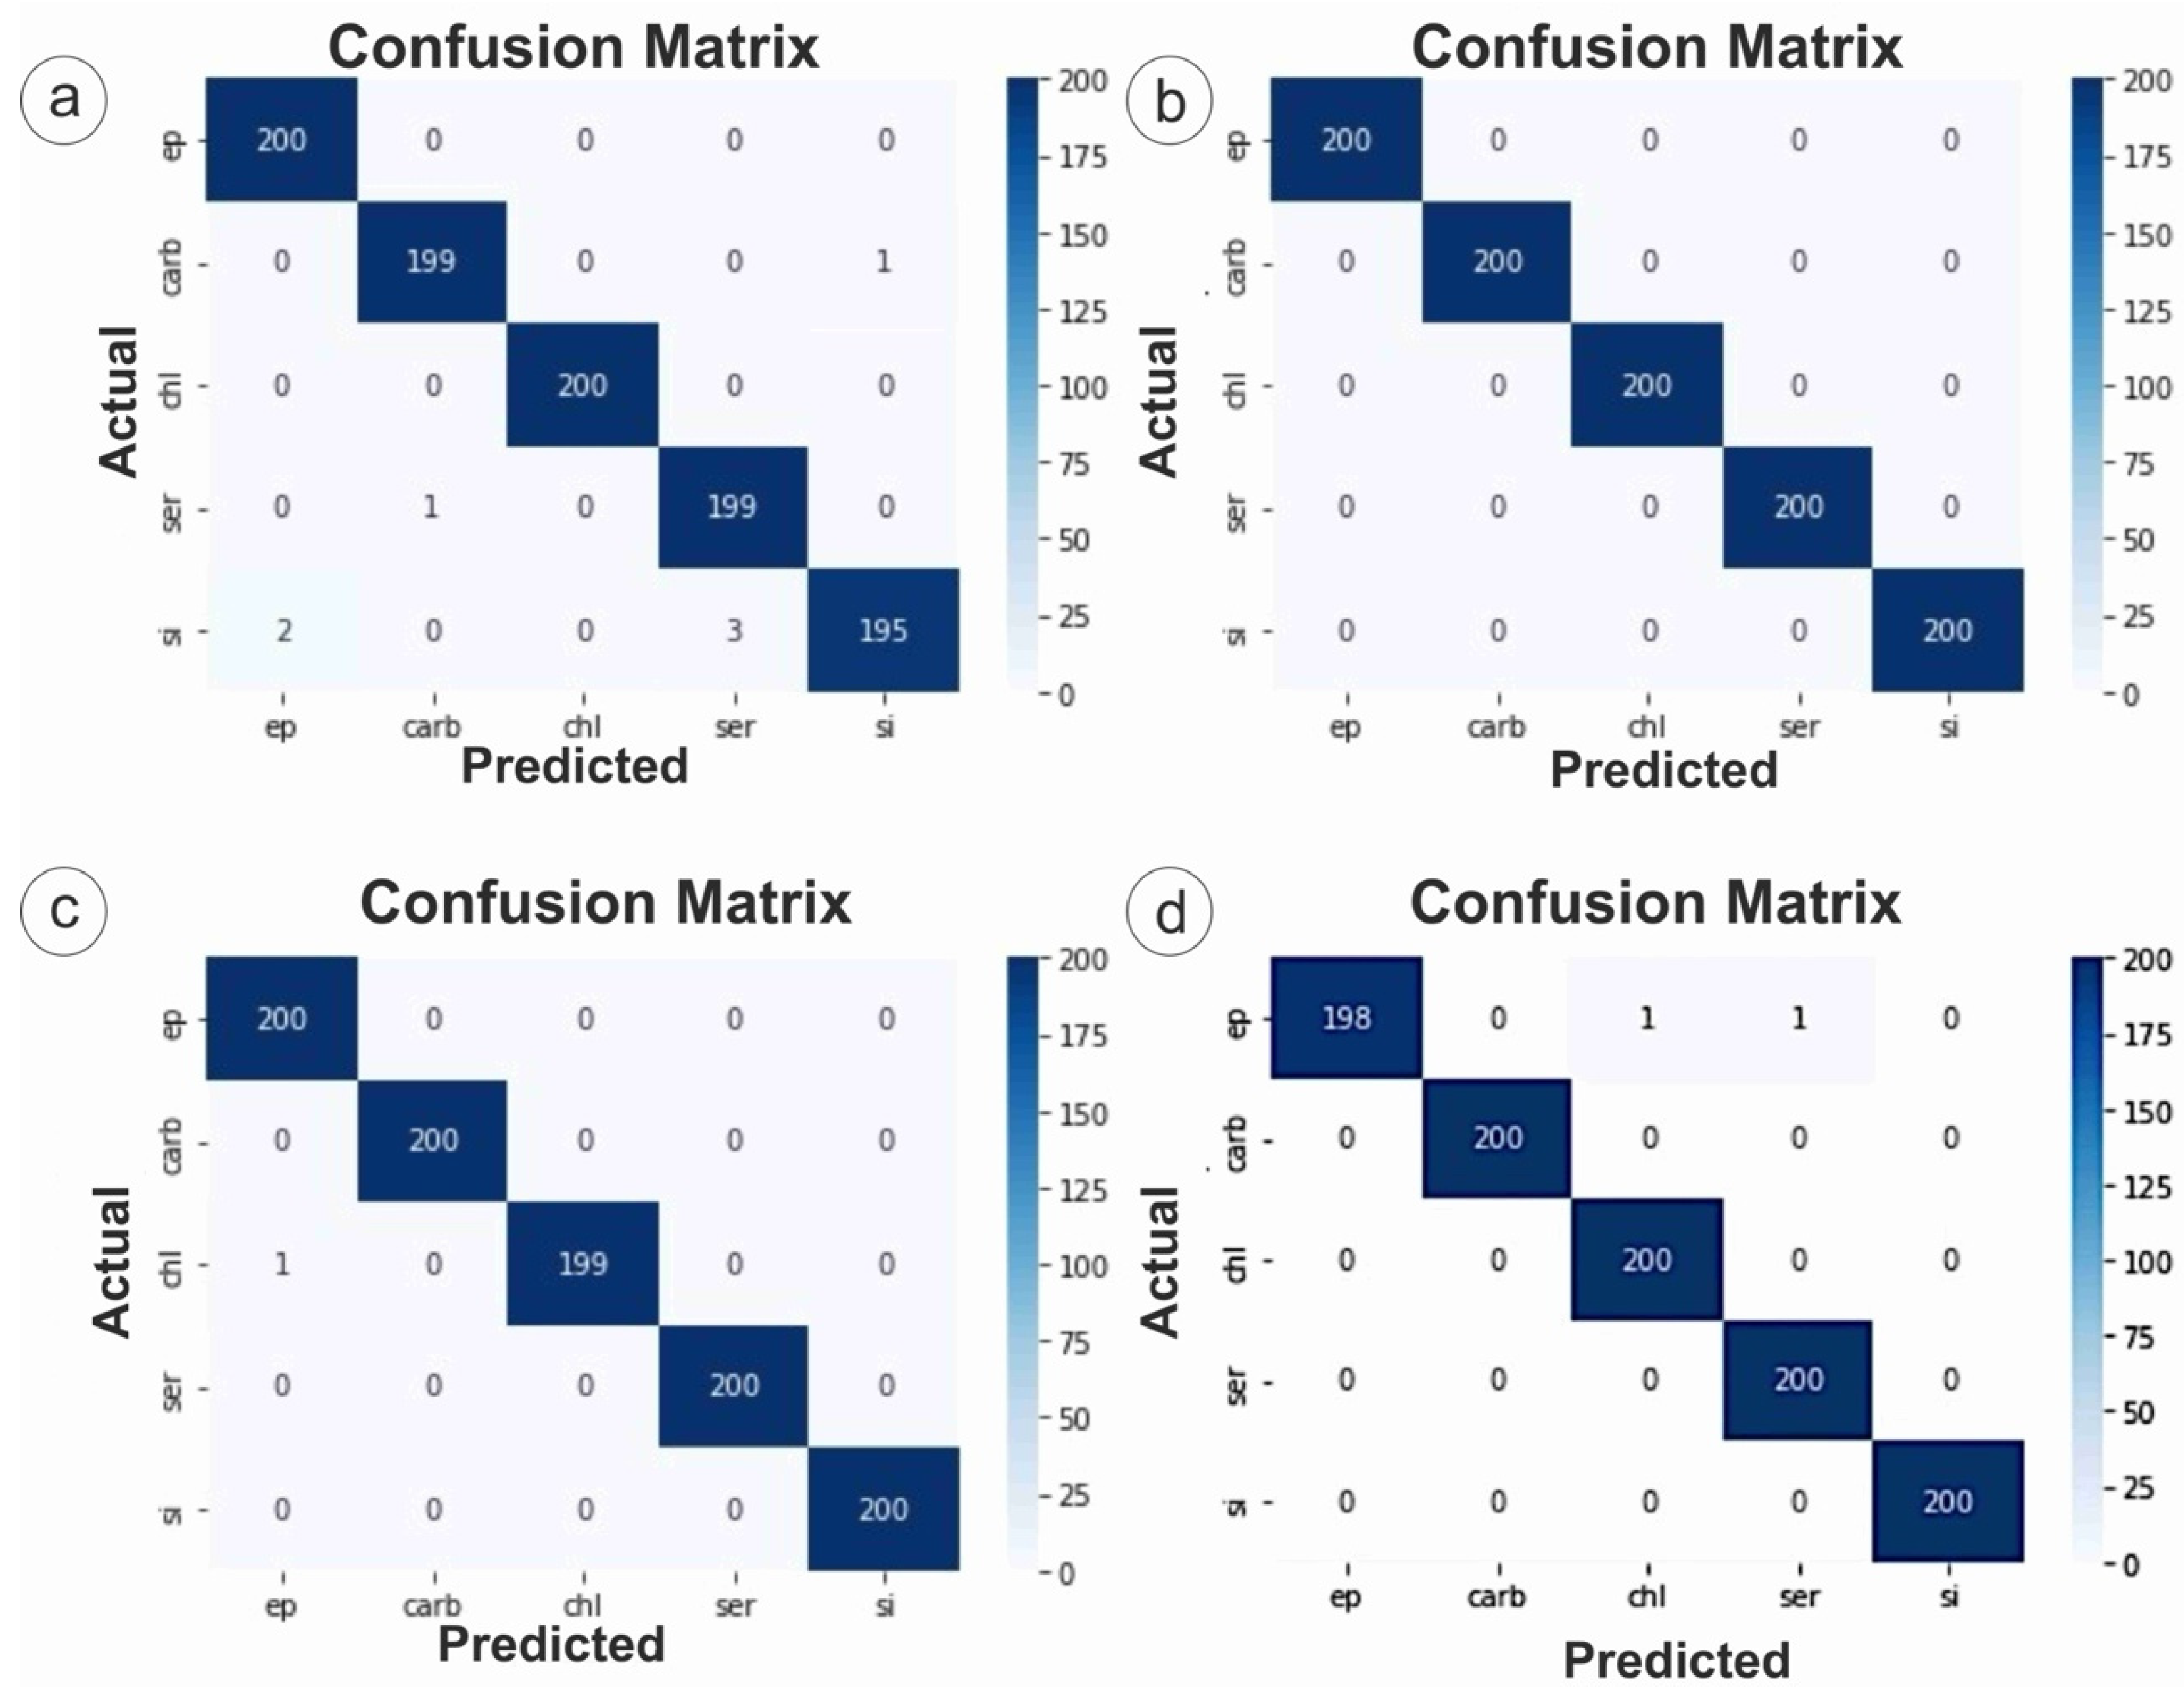
Model Accuracy and Model Loss graphs obtained for the DenseNet121 network with the Adam, RMSprop, SGD, and Adadelta optimizers are shown in Figure 8 and Figure 9, respectively. The training results are shown in blue, while the test results are represented by orange lines. The confusion matrices obtained during testing are given in Figure 10. Training curves indicate that DenseNet121 converged rapidly, surpassing 98% accuracy after the fifth epoch with Adam and RMSprop.
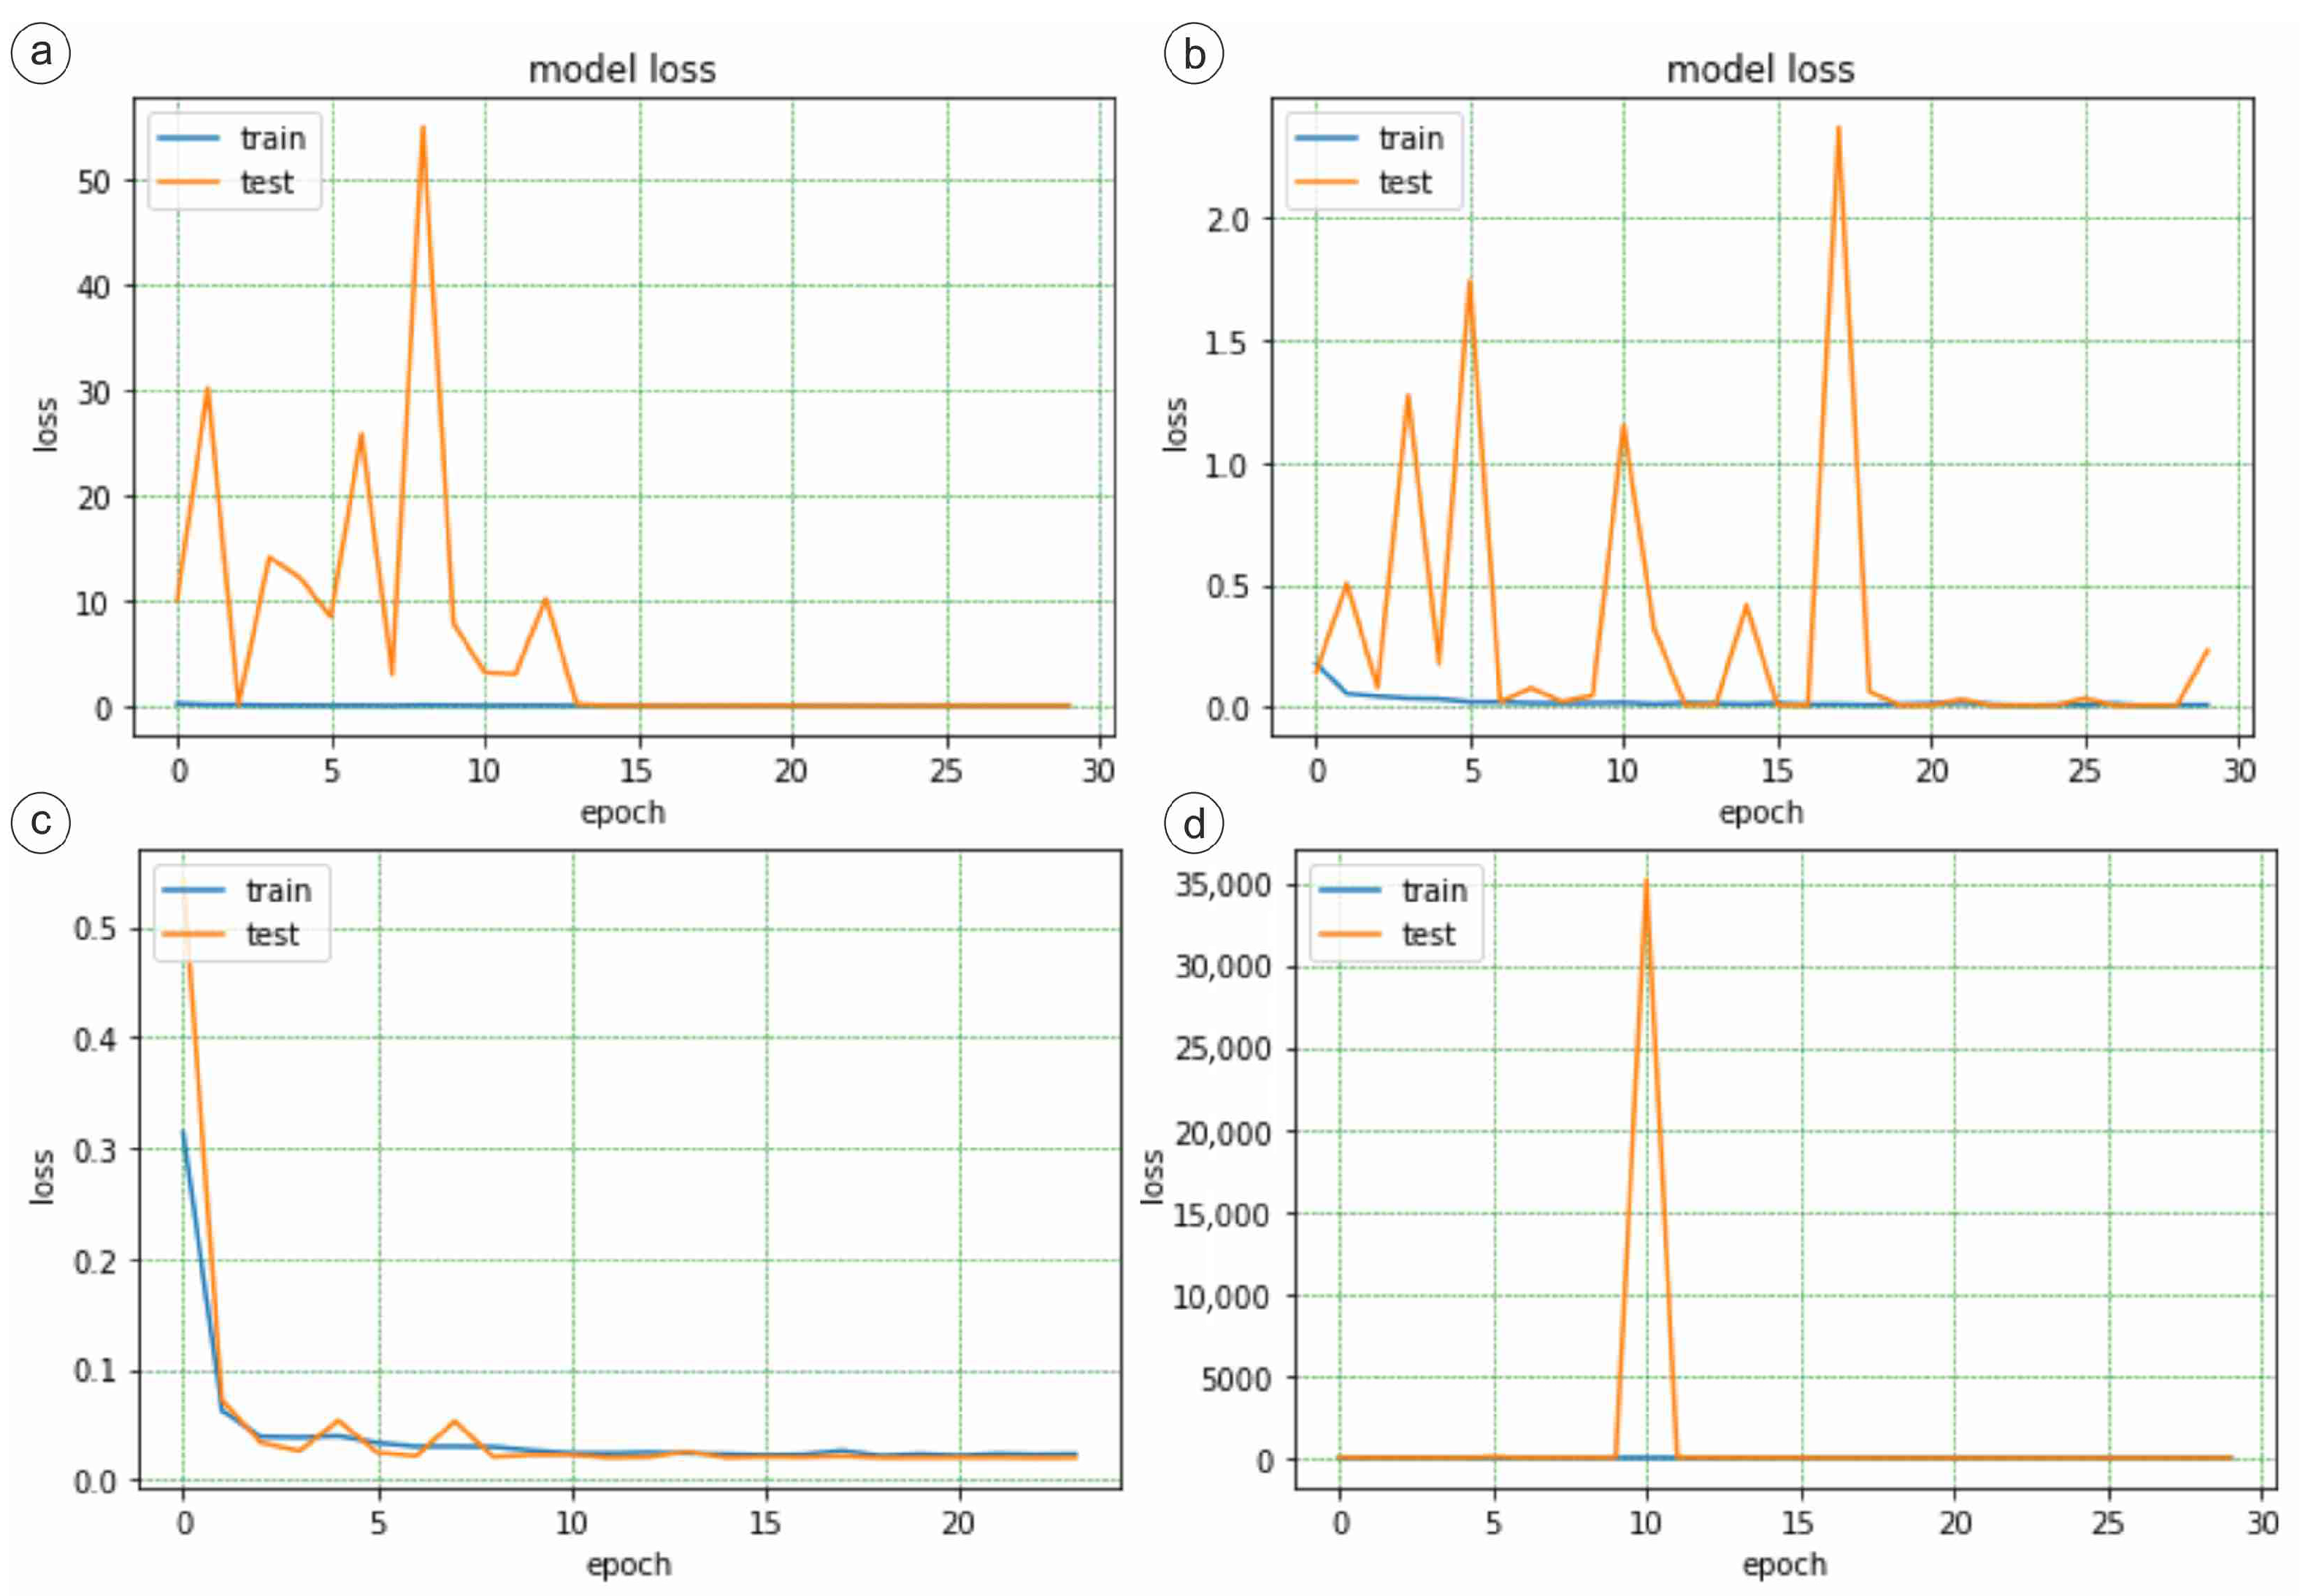
The loss graphs for all four optimizers are shown in Figure 9. Validation loss values were consistently low, indicating strong convergence.
However, a low loss function does not always imply high accuracy, as overfitting may occur. Therefore, the trained models were evaluated on the test data, and confusion matrices were generated. The test dataset consists of 1000 images, with 200 samples per class. Figure 10 shows that DenseNet121 achieved nearly 100% accuracy with Adam and RMSprop, correctly classifying all test classes. The model trained with Adadelta performed slightly worse, misclassifying 12 sericitization images as carbonatization and 2 as chloritization. Table 1 summarizes the accuracy, precision, recall, and F1-scores for all optimizers.

3.2. ResNet50

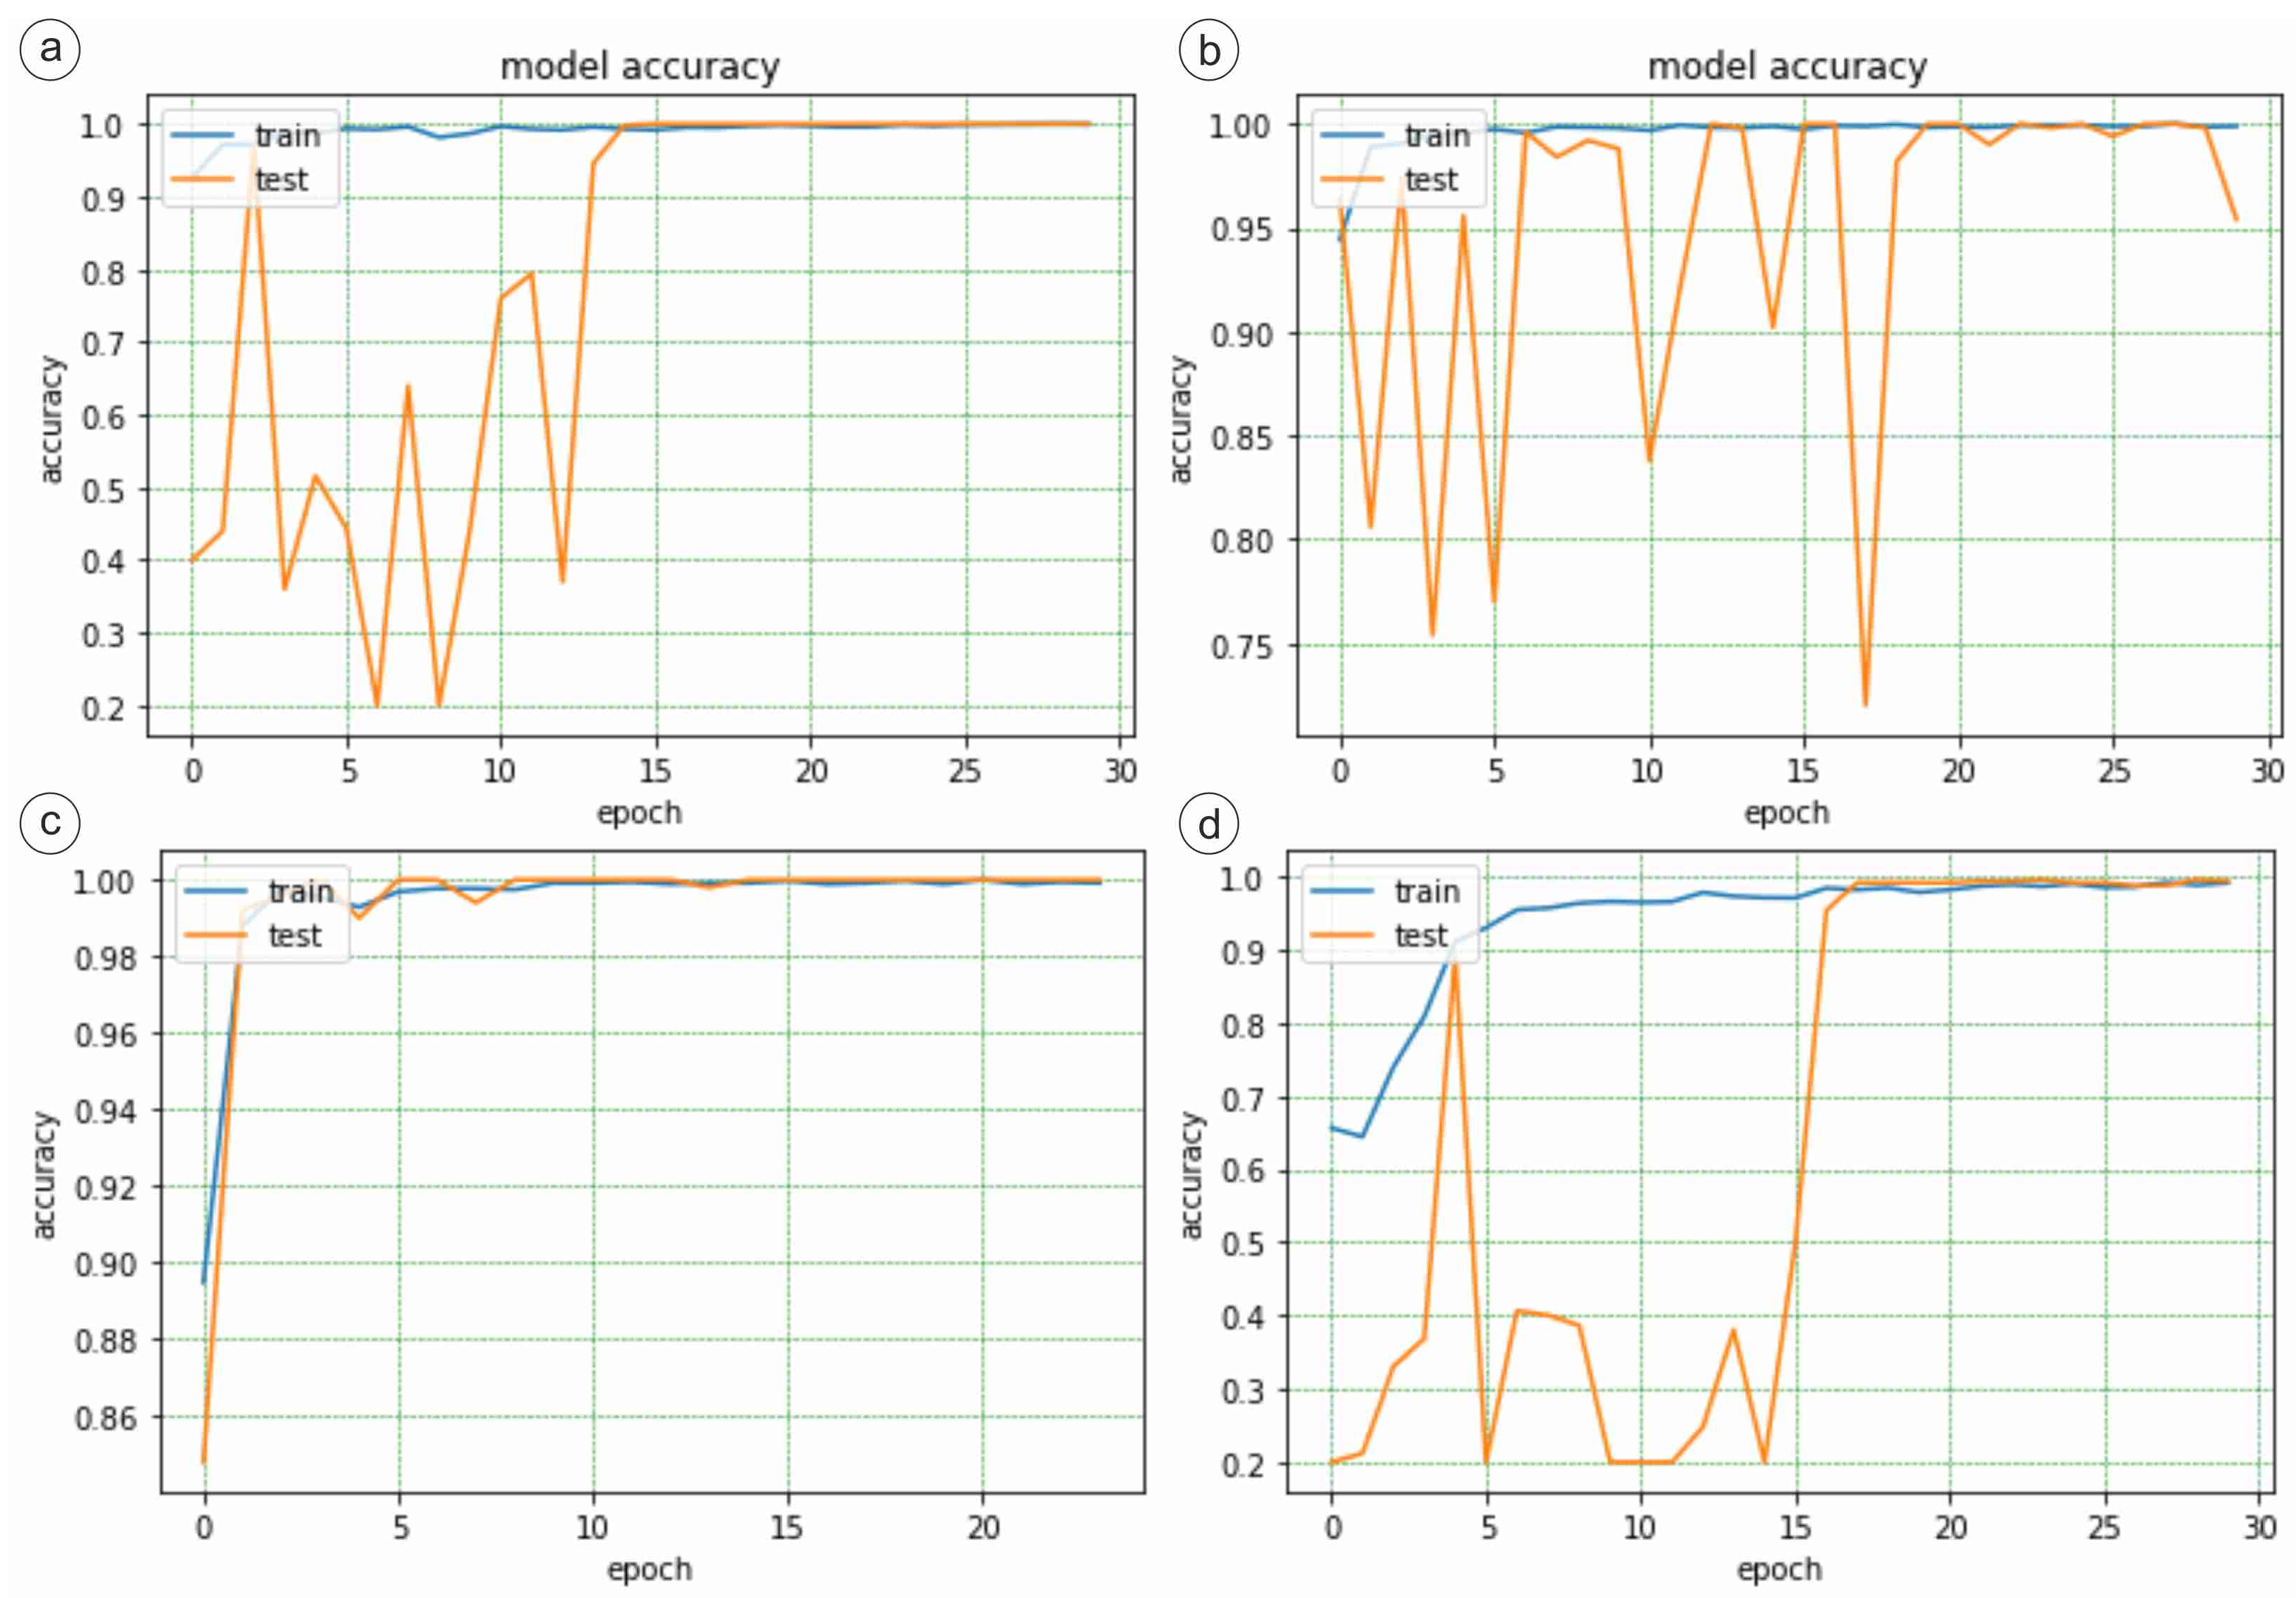
Figure 11 and Figure 12 present the accuracy and loss graphs for ResNet50. Confusion matrices from the test phase are shown in Figure 13. All RestNet50 variants achieved near-perfect accuracy, with rapid improvement after the sixth epoch, likely due to the architecture’s skip-connection mechanism. Loss values approached zero, indicating that predictions closely matched target values.
As shown in Figure 13, the RMSprop-optimized model correctly classified all test classes. Adam performed slightly worse, misclassifying seven images. Detailed performance metrics are provided in Table 2.

3.3. VGG16

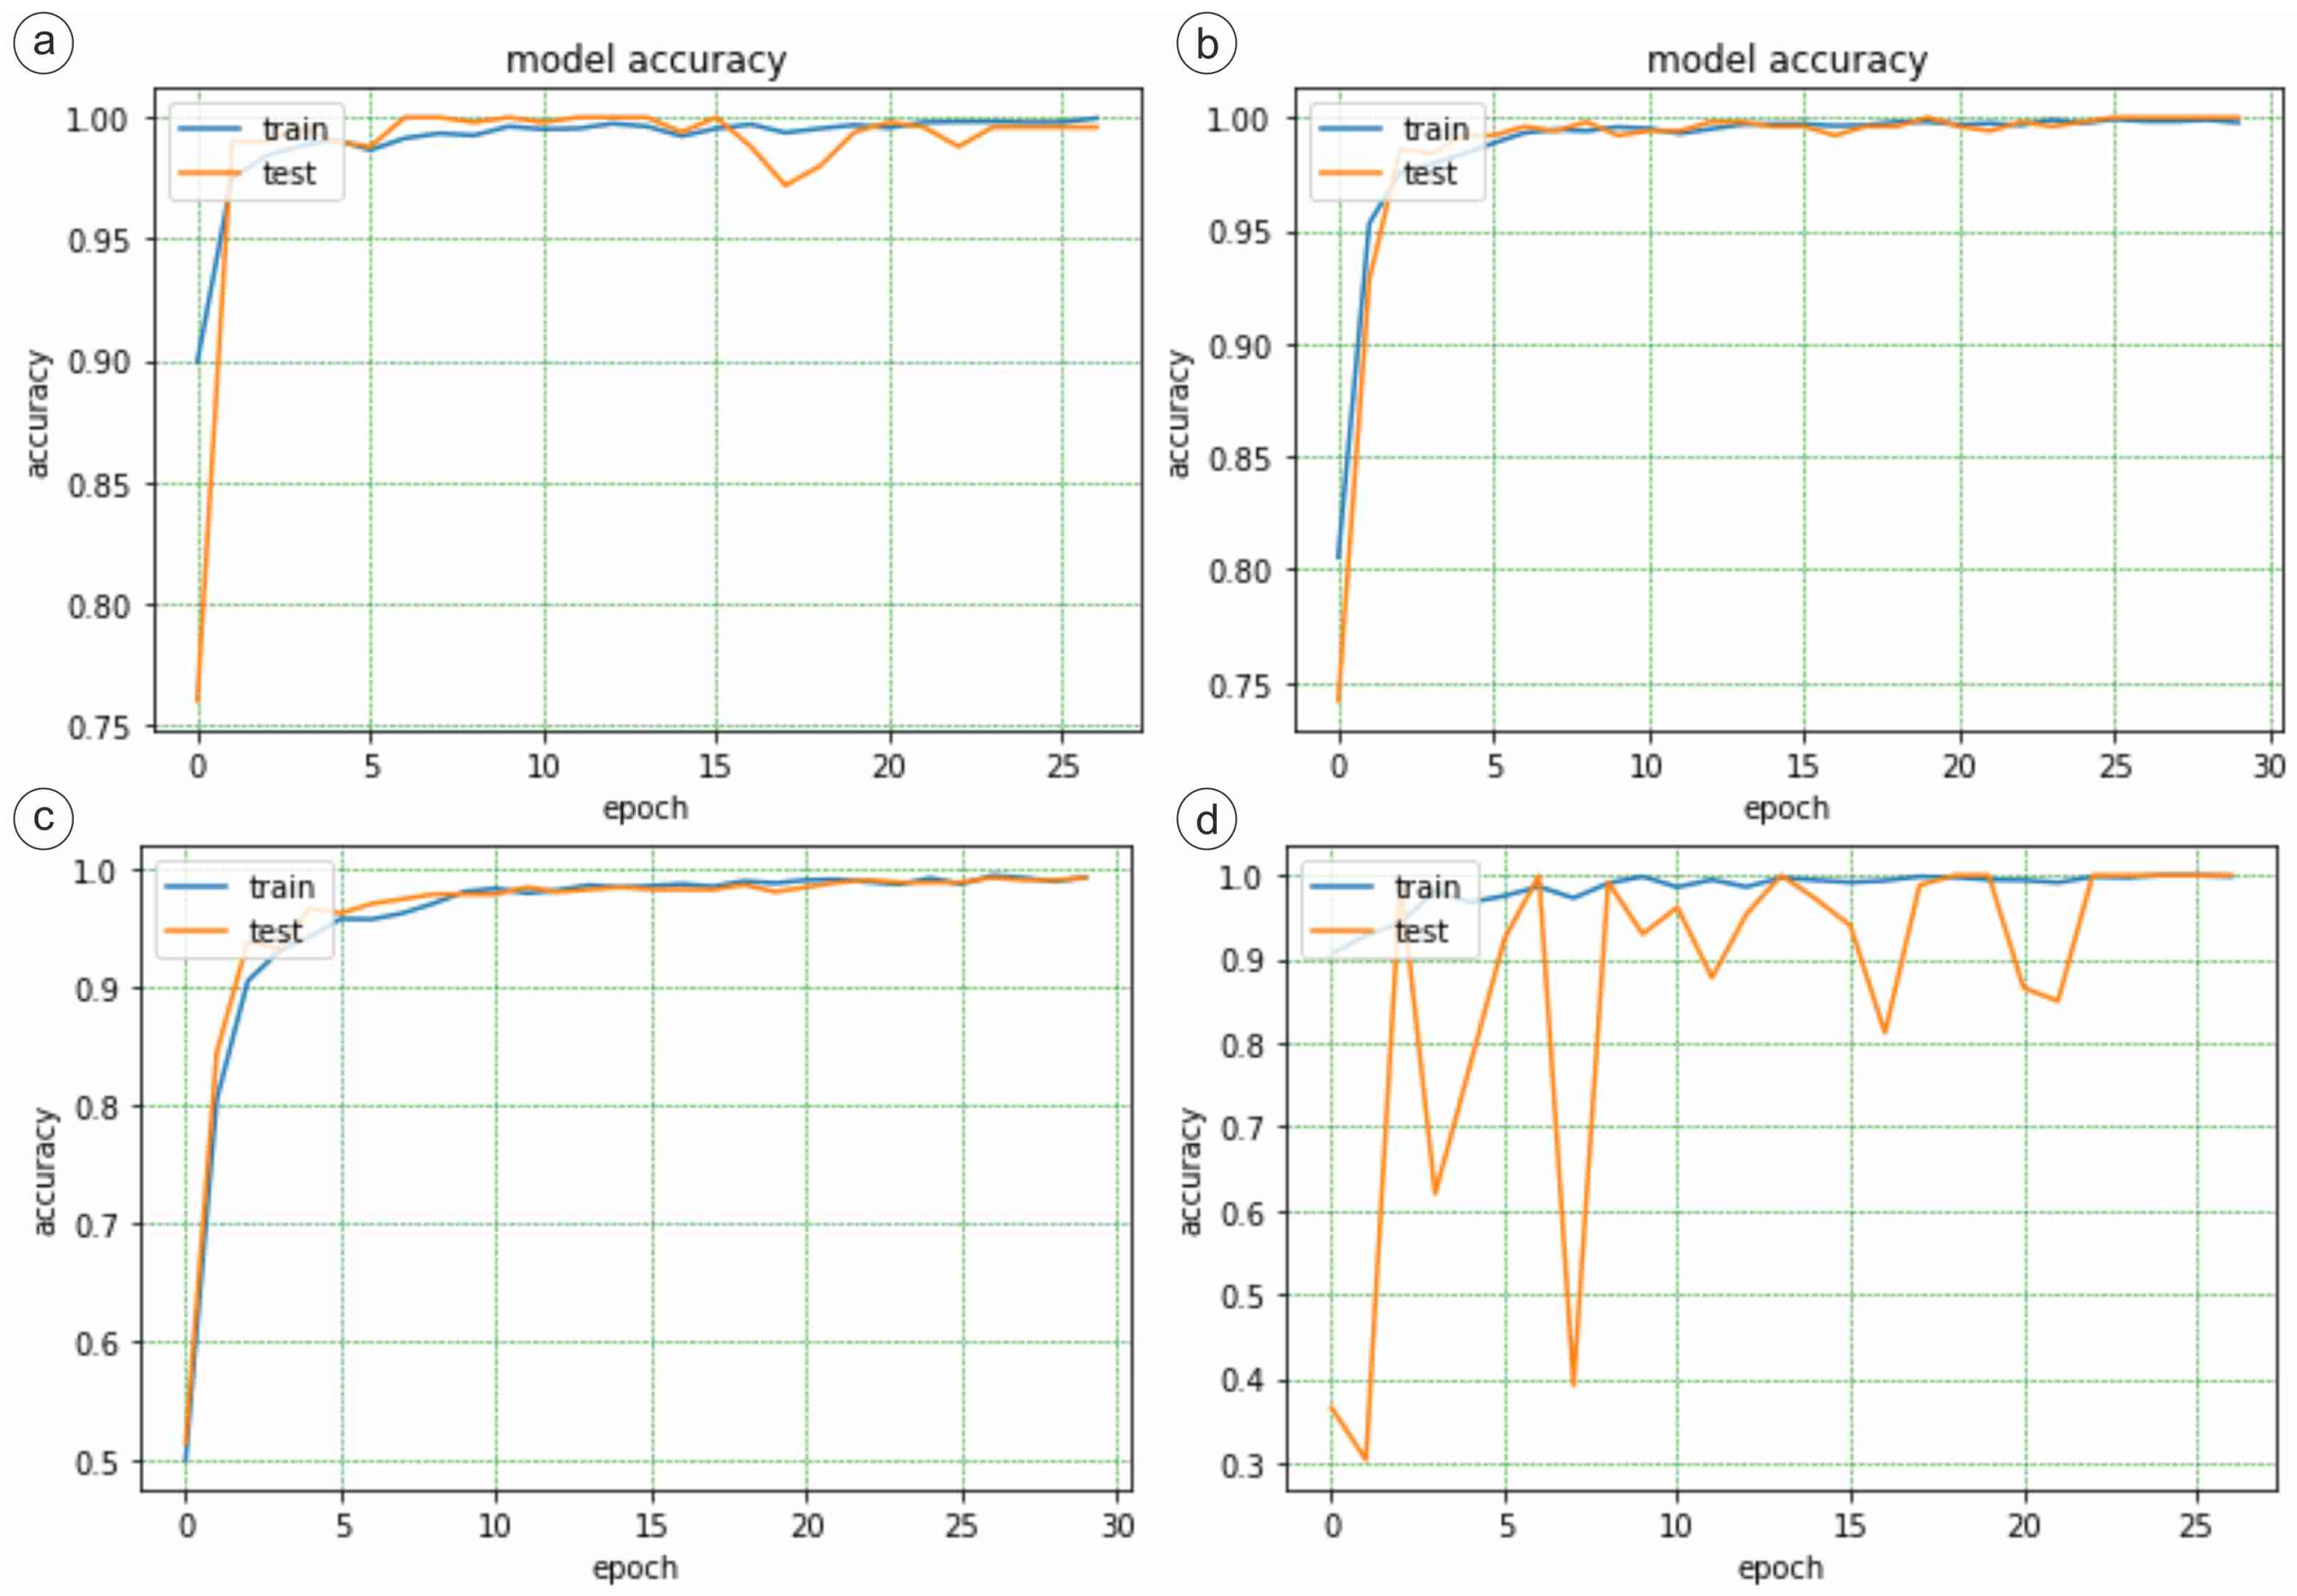
Figure 14 and Figure 15 show the accuracy and loss graphs for VGG16. Models trained with Adam and Adadelta achieved peak accuracy after the 17th epoch, while SGD showed faster initial convergence. RMSprop yielded the lowest accuracy, at 96%.
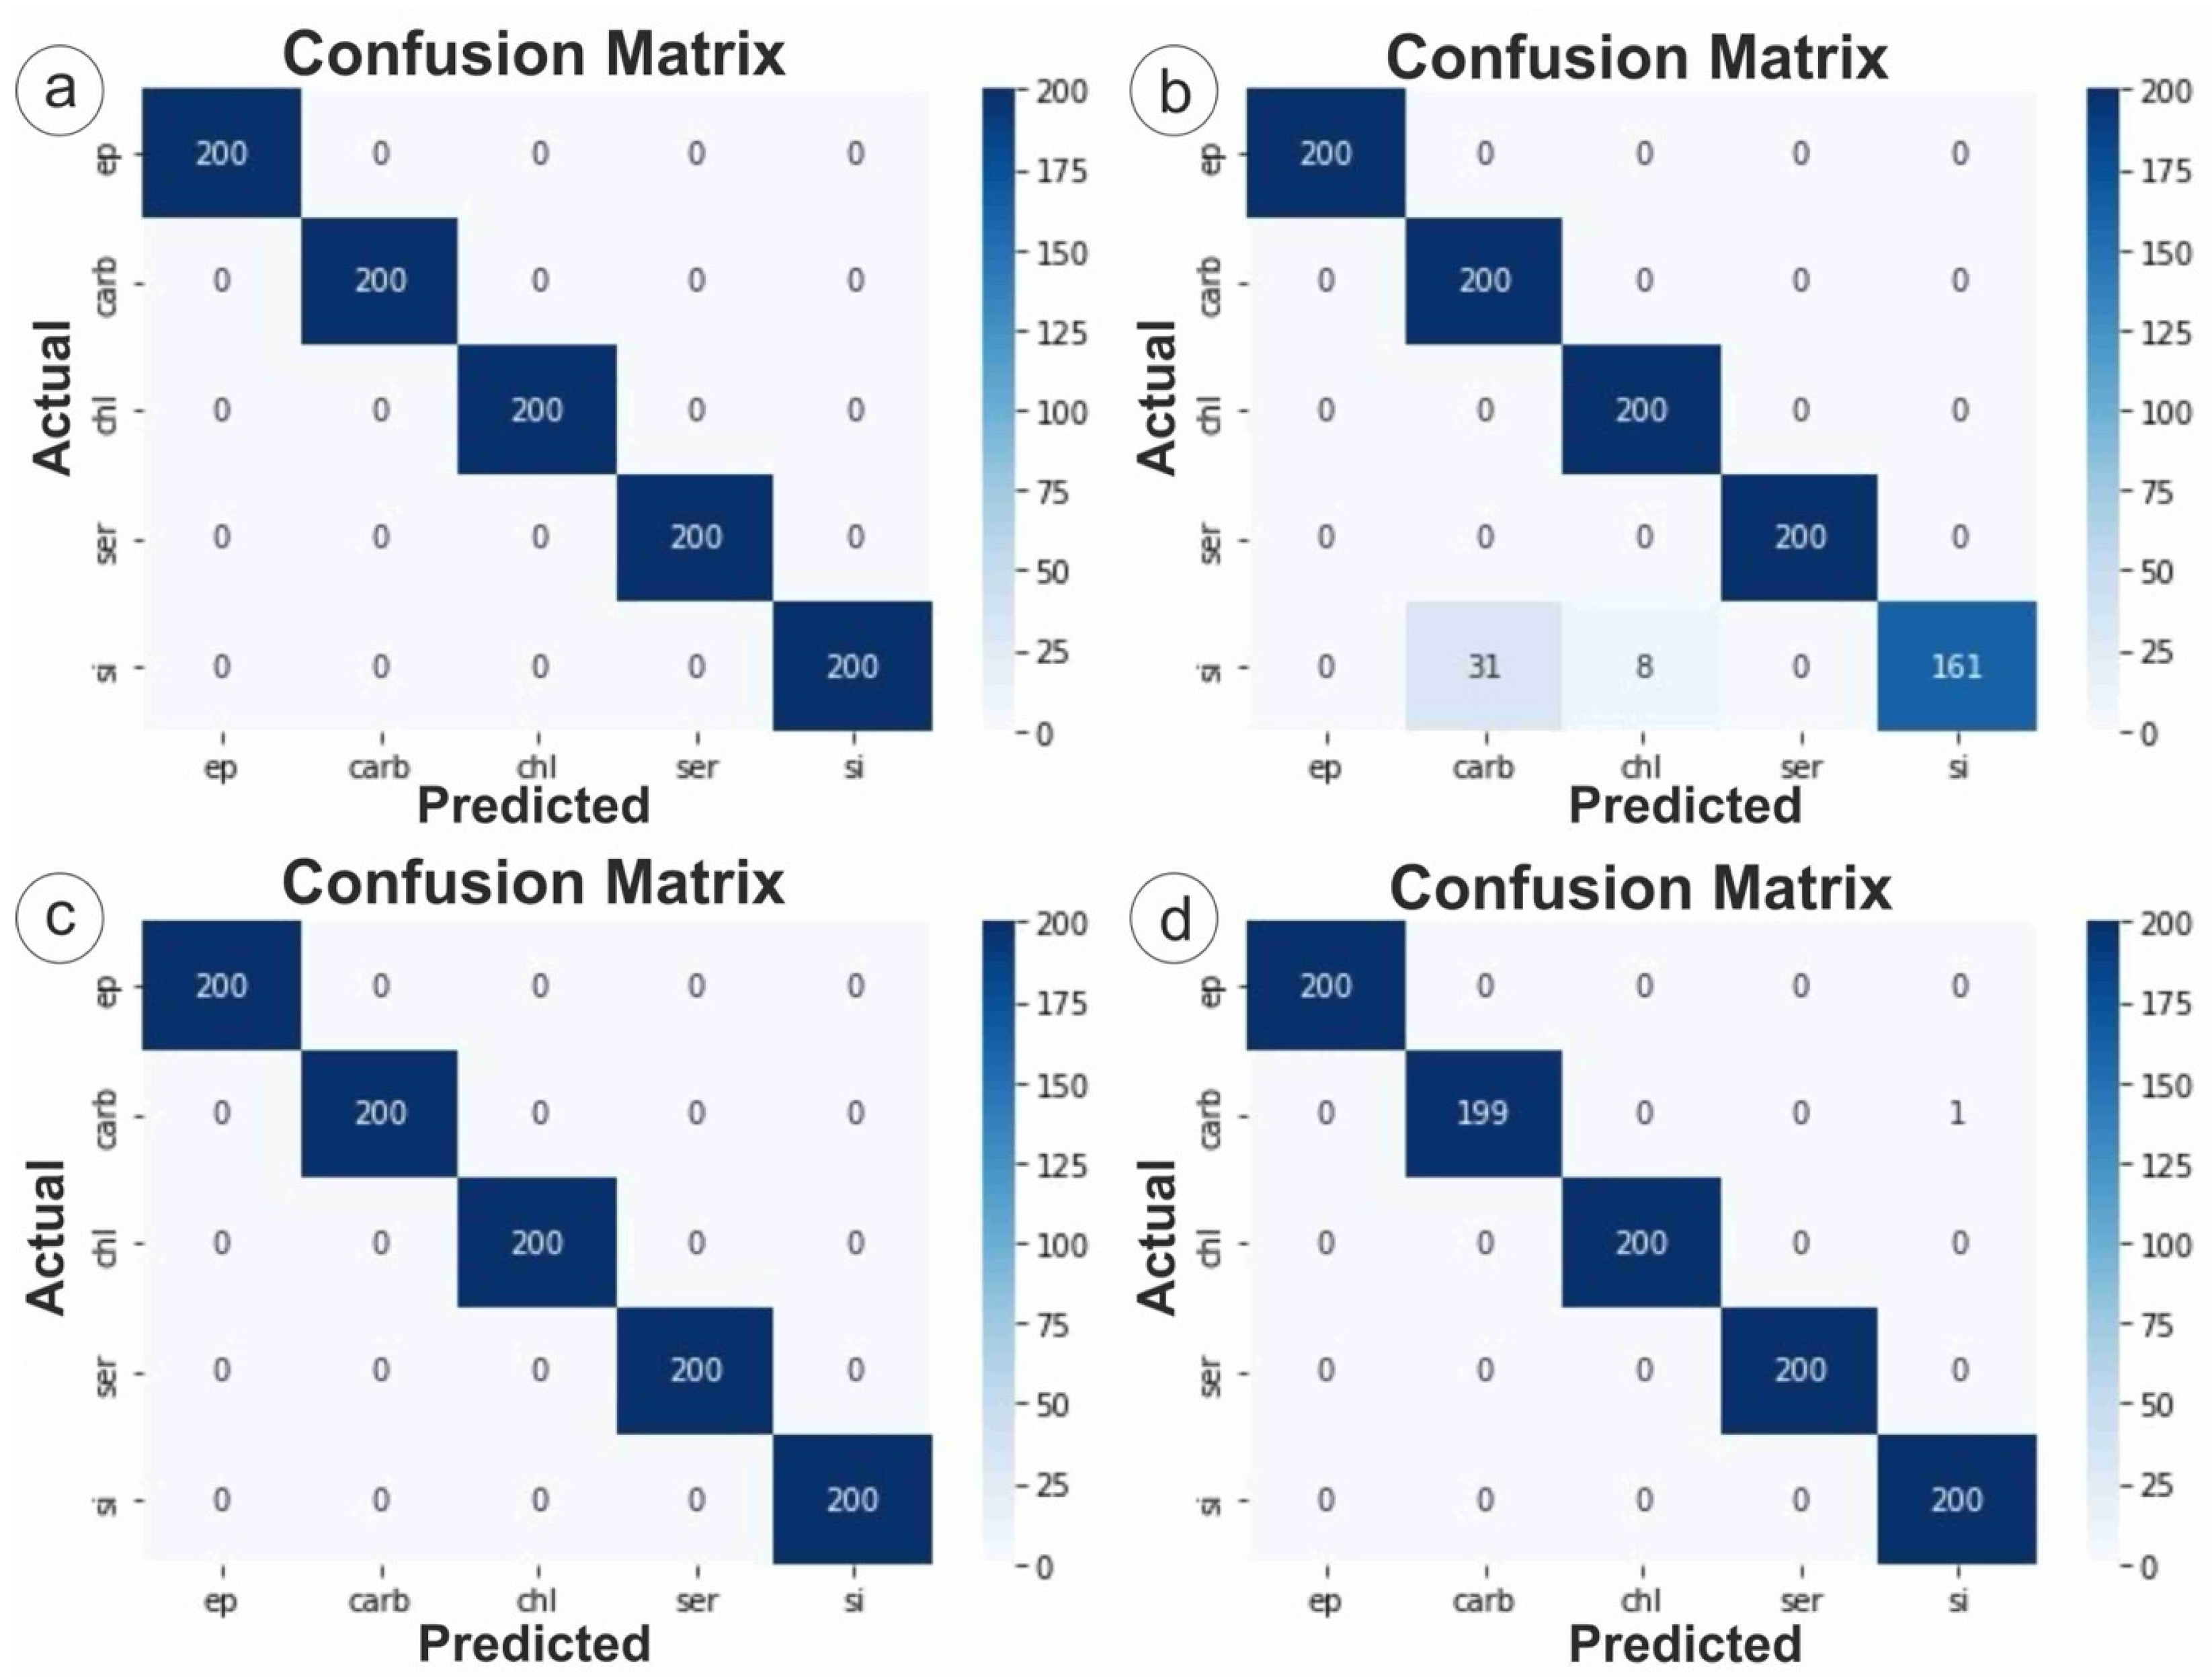
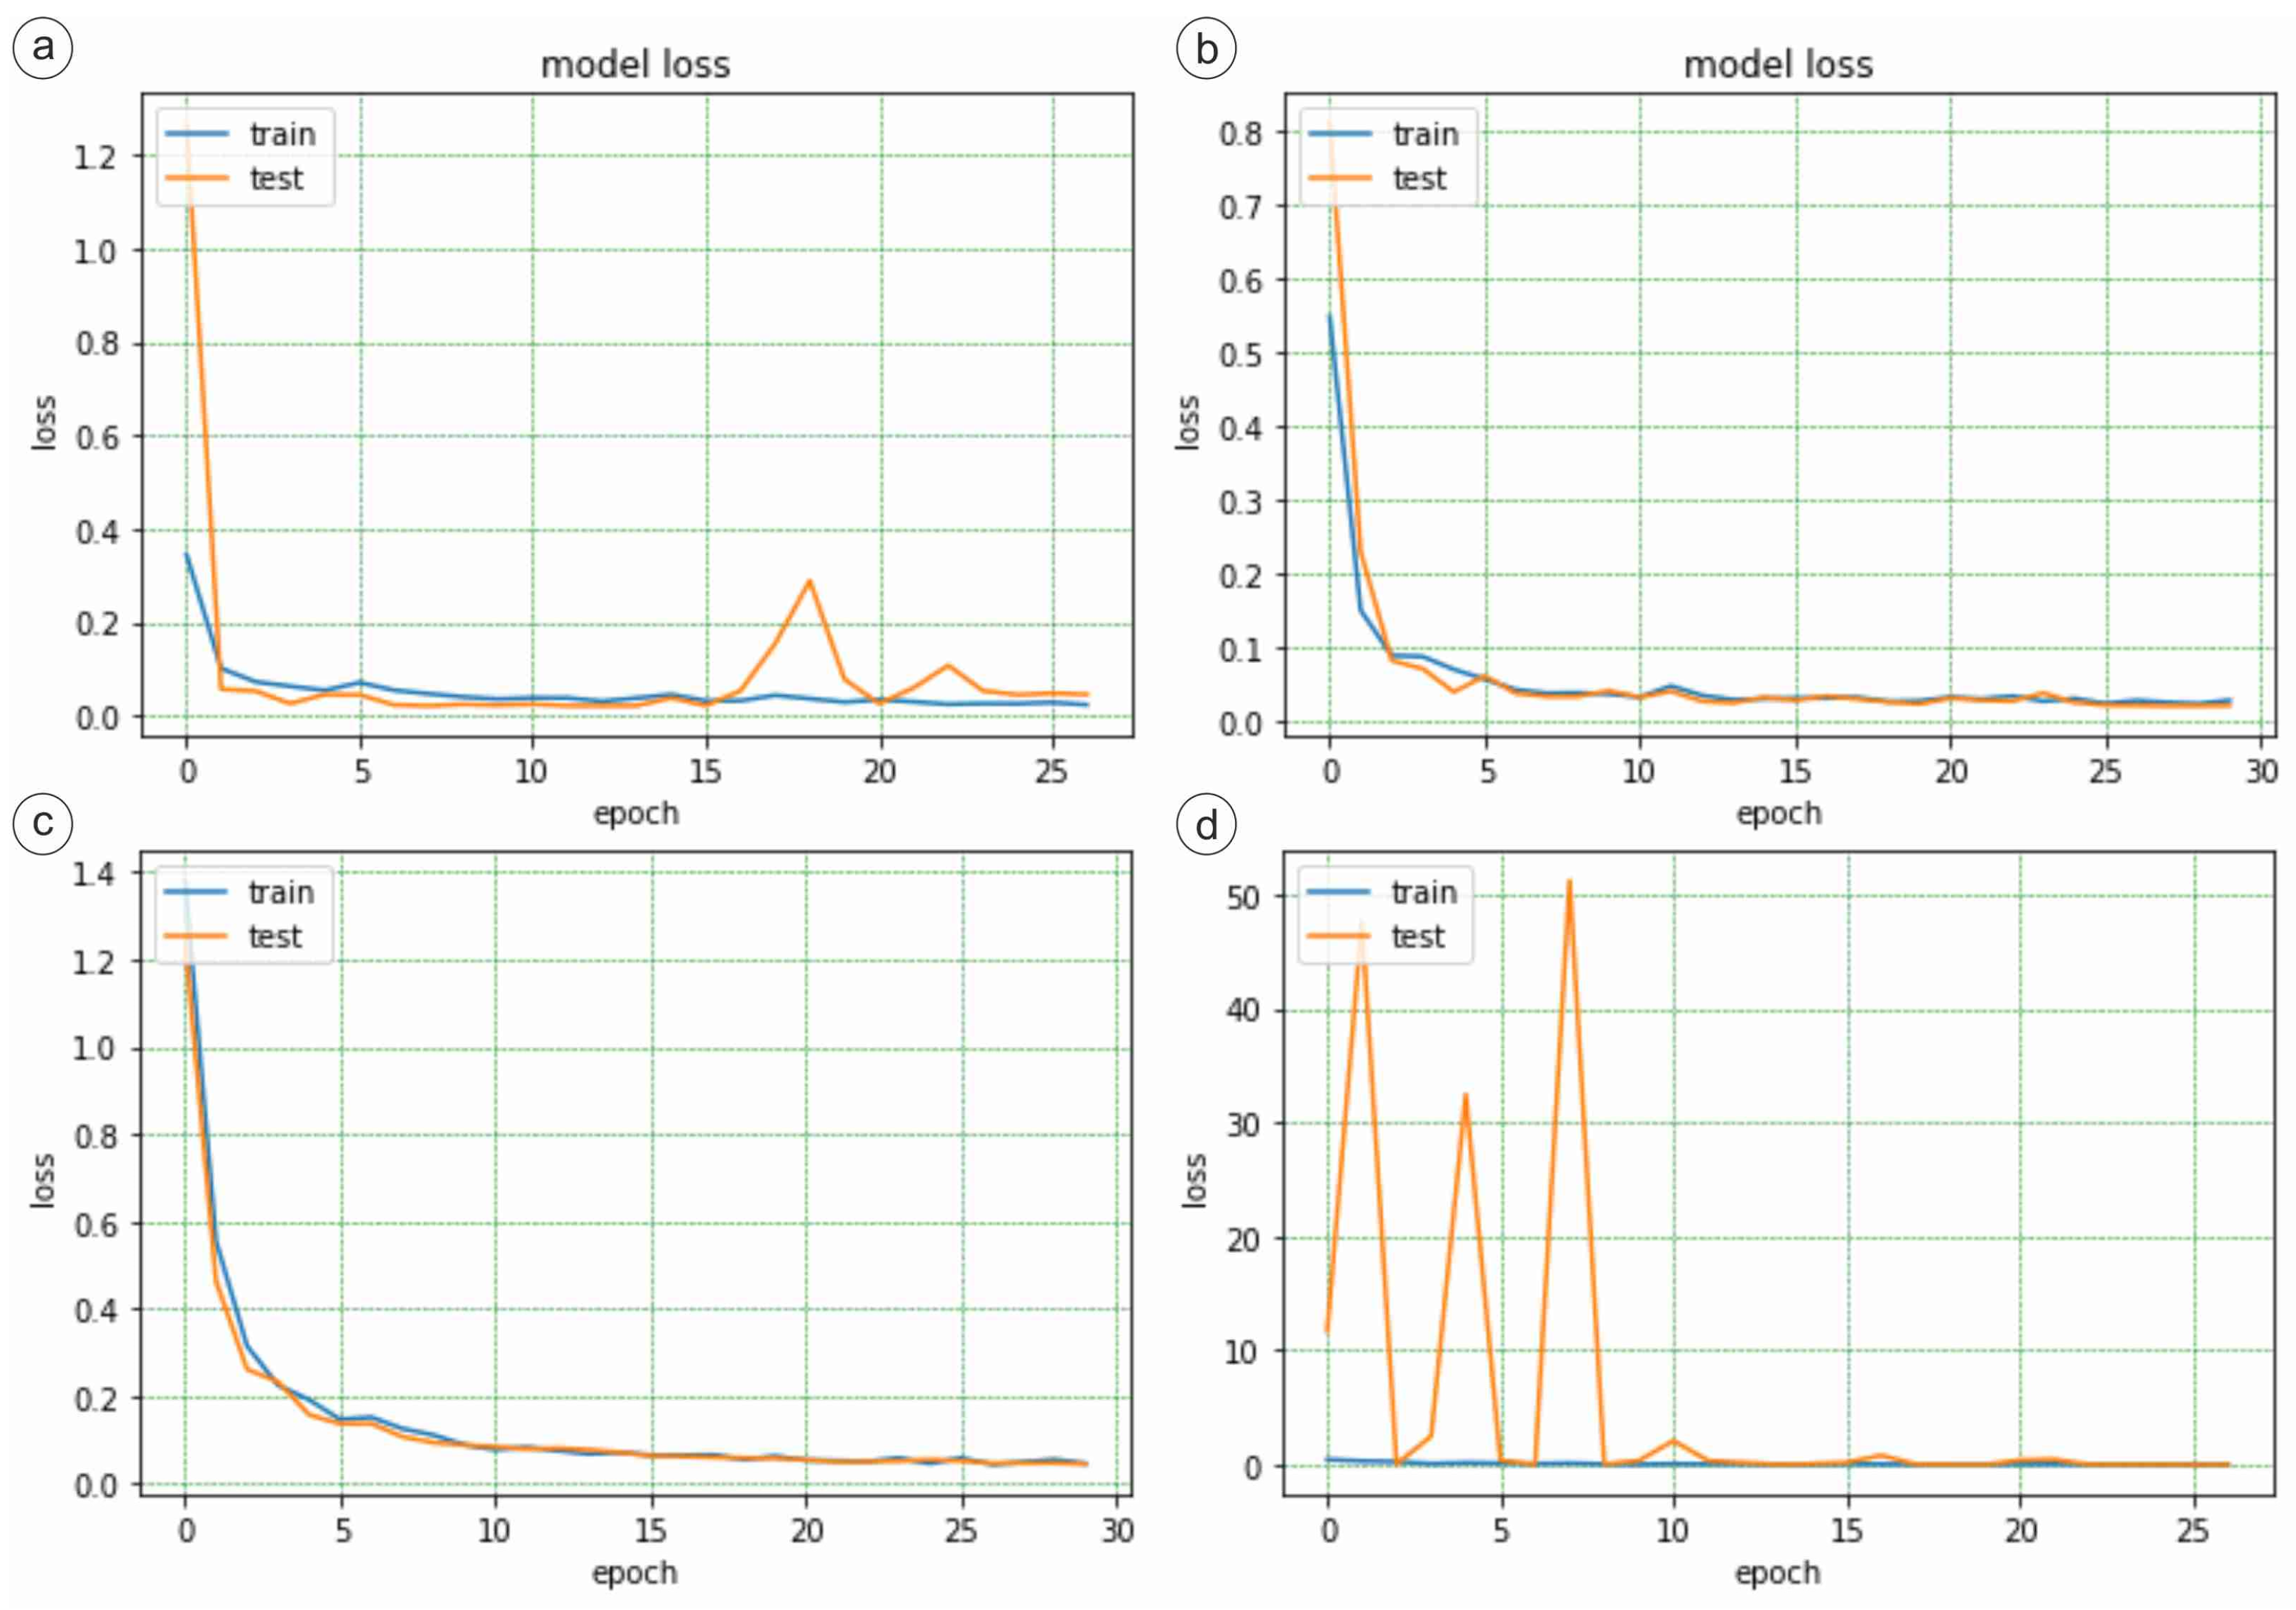
The loss graphs (Figure 15) indicate that the predictions closely matched target values. As shown in Figure 16, Adam and SGD correctly classified all test classes, achieving 100% accuracy. In contrast, the RMSprop-optimized model misclassified 39 silicification samples, 31 as carbonatization and 8 as chloritization. Table 3 presents the performance metrics for all VGG16 models.

3.4. InceptionV3

Figure 17 and Figure 18 display the accuracy and loss for InceptionV3. The model achieved high accuracy across all optimizers. Adam, RMSprop, and SGD showed rapid convergence after the fifth epoch, while Adadelta exhibited greater fluctuations in validation accuracy. Loss values gradually approached zero, indicating close alignment between predictions and targets.
Confusion matrices for all optimizers are shown in Figure 19. Adadelta achieved 100% accuracy across all test classes. The Adam, RMSprop, and SGD produced a few misclassifications: 12, 5, and 6 images, respectively. Table 4 summarizes the corresponding performance metrics.

3.5. Comparative Evaluation

Table 5 presents the comparative evaluation of all model-optimizer combinations. Adam and RMSprop consistently delivered the highest accuracy and lowest loss, making them the most effective choices. RMSprop achieved the lowest loss values, 0.009 for ResNet50 and 0.010 for DenseNet121, but required longer training times, especially for DenseNet121 (1382 s) and VGG16 (1312 s).
Adam offered a balanced solution, achieving 1.00 accuracy for DenseNet121 and VGG16, 0.993 for ResNet50. It also recorded the fastest training time (662 s) with InceptionV3, and competitive times for DenseNet121 (927 s) and ResNet50 (931 s). This balance makes Adam a practical choice for diverse applications.
SGD, while slightly behind in performance, achieved high accuracy (0.998 for DenseNet121 and 0.999 for ResNet50) with moderate loss and stable training times (1088 s and 932 s, respectively). This makes it suitable for resource-constrained environments.
Adadelta, though less effective in minimizing loss, achieved 1.00 accuracy with InceptionV3 and offered shorter training times for some models (e.g., 674 s for InceptionV3), making it an appealing option for rapid prototyping.
In summary, Adam and RMSprop are recommended for optimal accuracy and stability, while SGD offers a reliable alternative when computational efficiency is priority.

3.6. Microscopic Interpretation of Misclassification Patterns

Evaluating model outputs solely through numerical metrics limits geological insight. Therefore, a detailed expert-informed analysis of the confusion matrices was conducted to interpret misclassification sources.
The most frequent confusion occurred between sericitization (ser) and carbonatization (carb)-notably in the InceptionV3 (Adam) model (Figure 19a), which misclassified 10 “ser” images as “carb”. This likely stems from textural similarities, as both can appear as fine-grained, high-birefringence aggregates under cross-polarized light. A similar, though less frequent, confusion occurred between sericitization and chloritization (chl), as seen in the DenseNet121 (Adadelta) model (Figure 10d) and the InceptionV3 (Adam) model (Figure 19a).
Misclassifications between epidotization (ep) and carbonatization (carb), noted in the InceptionV3 (SGD) model (Figure 19c), are likely due to similar behaviors of high-relief crystals. Bright, high-order interference colors of epidote can resemble anhedral calcite. Overlapping textures between mosaic-textured quartz carbonate-fill zones may explain the significant errors in the VGG16 (RMSprop) model (Figure 16b).
These findings support the architectural strengths discussed in the Introduction. The models like DenseNet121 and ResNet50 effectively resolved such ambiguities, thanks to deep feature propagation and reuse. In contrast, VGG16 (RMSprop) struggled with complex textures, consistent with its simpler architecture.

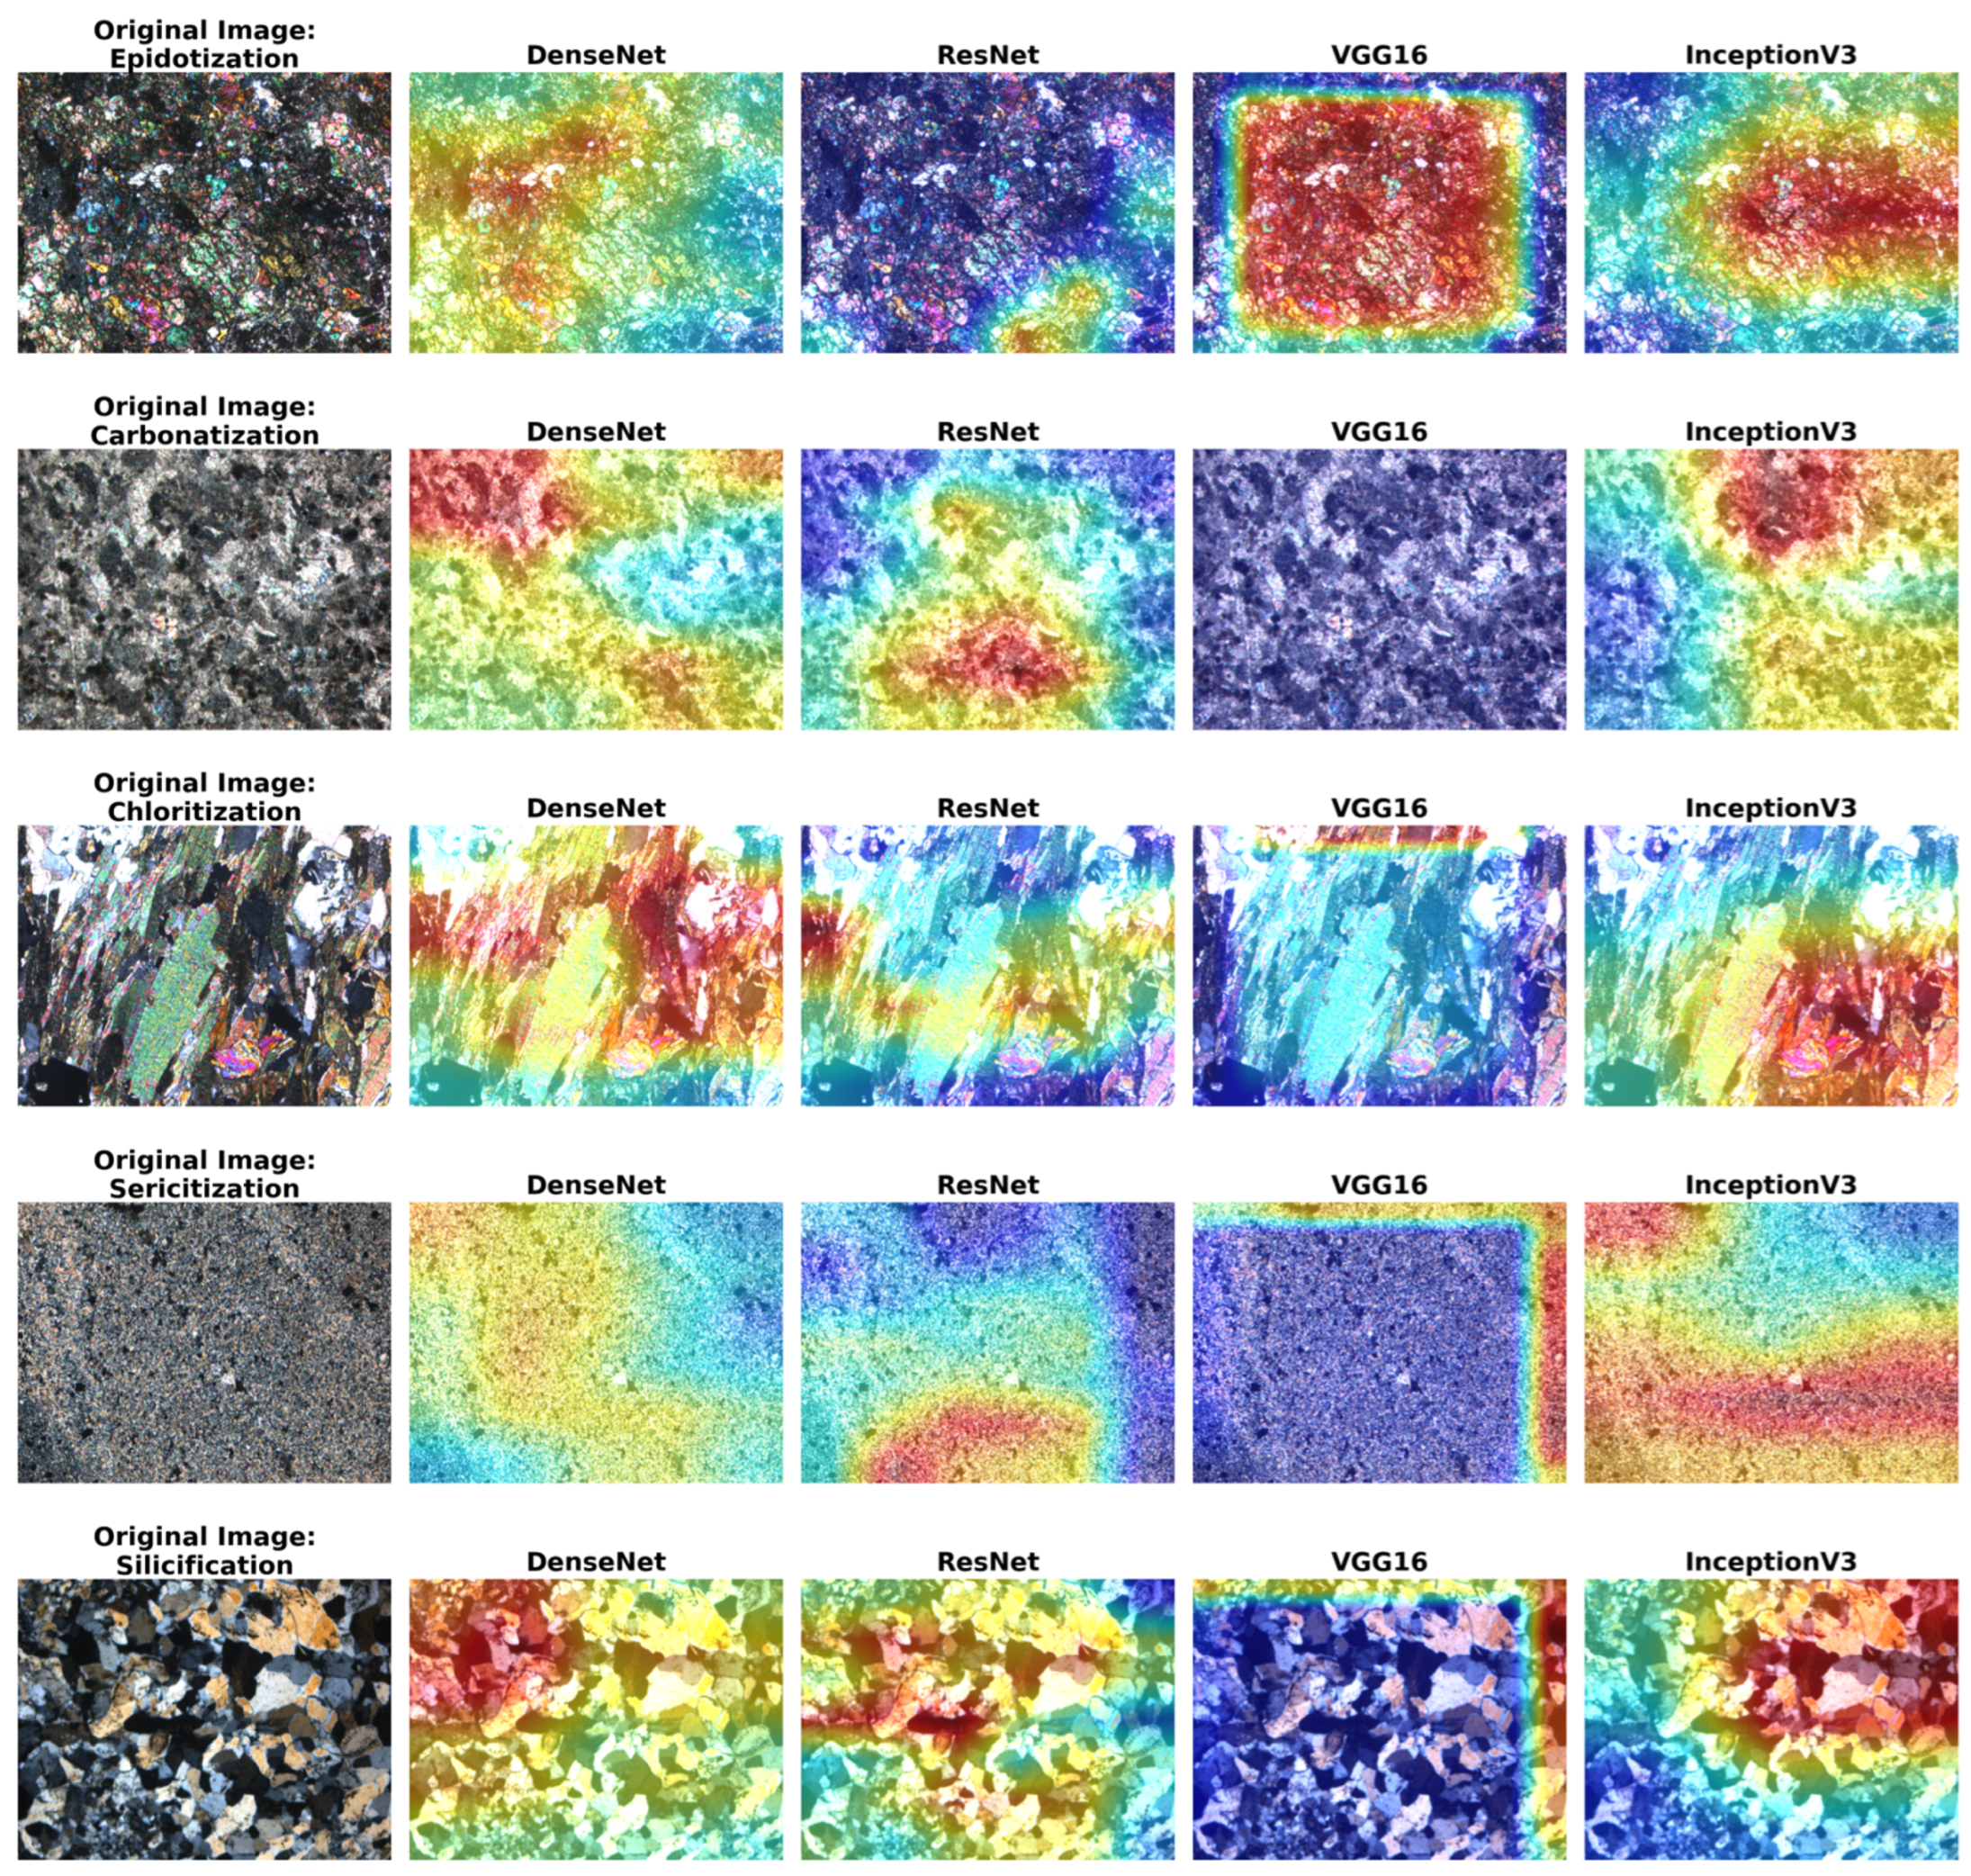
3.7. XAI-Based Visual Validation Using Grad-CAM

To assess whether the CNN architectures learned geologically meaningful patterns rather than relying on background artifacts or color biases, a Gradient-weighted Class Activation Mapping (Grad-CAM) analysis was performed. Figure 20 presents a comparative visualization matrix for five representative hydrothermal alteration types, illustrating the decision-making regions used by each model.
The Grad-CAM heatmaps reveal significant architectural differences in how the networks interpret thin-section textures. DenseNet121, ResNet50 and InceptionV3 consistently exhibit sharply localized activation patterns concentrated on relevant mineral textures. For instance, in Silicification, these models highlight grain boundaries and the interlocking mosaic fabric of quartz crystals, which are key petrographic indicators of silicified zones. Similarly, in Chloritization, the models accurately focus on fibrous–platy chlorite aggregates and their characteristic anomalous interference colors. These targeted activations demonstrate that the deeper models rely on fine-grained textural cues rather than global color intensity or illumination variations.
In contrast, VGG16 frequently displays diffuse and broadly distributed activation regions, often highlighting large portions of the image instead of precise mineralogical structures. This behavior reflects the architectural limitations of VGG16—its lack of skip connections and shallower depth reduce its ability to capture subtle microtextures such as sericite flakes (Sericitization), epidote aggregates (Epidotization), or fine carbonate mosaics (Carbonatization). The heatmaps reveal that VGG16 tends to focus on coarse brightness variations and global color gradients rather than detailed geological features, which aligns with its comparatively lower classification performance.
ResNet50 demonstrates intermediate behavior, producing more targeted activations than VGG16 but with less spatial accuracy than DenseNet121 and InceptionV3. Although it generally identifies major mineral domains correctly, its heatmaps occasionally show mid-level dispersion, indicating moderate reliance on broader texture regions.
Across all alteration types, a key shared observation is that the models—especially DenseNet121 and InceptionV3—consistently ignore the extinct (black) background and illumination artifacts, confirming that the learned representations are not influenced by irrelevant optical elements of the thin-section images. This provides strong validation that the networks’ decisions arise from authentic mineralogical and microstructural patterns.
These Grad-CAM findings not only support the quantitative accuracy results but also show that the highest-performing models rely on geologically interpretable features, thereby confirming the reliability and scientific validity of their classification behavior.

4. Conclusions

In this study, a new dataset consisting of 5000 thin section images representing various hydrothermal alteration types was created and used to train and test DL algorithms. The results demonstrate that DL networks can classify these hydrothermal alteration types with high accuracy and efficiency, offering a rapid and objective alternative to the traditional expert-driven methods.
Four widely used DL models—DenseNet121, ResNet50, VGG16, and InceptionV3—were systematically evaluated with four different optimizers (SGD, RMSprop, Adam, and Adadelta) to achieve precise classification. The experimental results show that several model-optimizer combinations achieved perfect or near-perfect performance.
DenseNet121 reached an accuracy and F1-score of 1.00 with both Adam and RMSprop, achieving its fastest processing time (927 s) with Adam. ResNet50 also achieved a perfect score with RMSprop. VGG16 delivered 1.00 accuracy using SGD and Adam, while InceptionV3 achieved perfect classification with Adadelta. Notably, InceptionV3 paired with Adam completed training in just 662 s, the fastest time recorded in this study.
Based on these findings, DenseNet121 emerges as the most robust model, combining top-tier accuracy with competitive processing speeds. The results also highlight the critical role of optimizer selection, with Adam and RMSprop consistently delivering superior accuracy and lower loss across architectures.
The Grad-CAM analysis further confirmed that the highest-performing models base their predictions on geologically meaningful features rather than irrelevant color or illumination patterns, reinforcing the scientific validity of their classification outcomes.
Furthermore, upcoming research will incorporate additional XAI methodologies and expert petrographic assessment to move beyond predictive accuracy and gain deeper geological insight into the decision-making behavior of the networks.

Author Contributions

Conceptualization, E.Ü. and O.C.; methodology, R.Ç. and E.Ü.; software, R.Ç. and E.Ü.; validation, R.Ç., E.Ü. and O.C.; formal analysis, R.Ç.; investigation, R.Ç. and E.Ü.; resources, E.Ü. and O.C.; data curation, E.Ü. and O.C.; writing—original draft preparation, R.Ç., E.Ü. and O.C.; writing—review and editing, E.Ü.; visualization, E.Ü. and O.C.; supervision, E.Ü.; All authors have read and agreed to the published version of the manuscript.

Funding

This research received no external funding.

Institutional Review Board Statement

Not applicable.

Informed Consent Statement

Not applicable.

Data Availability Statement

The original contributions presented in this study are included in the article. Further inquiries can be directed at the corresponding author.

Acknowledgments

The authors have reviewed and edited the output and take full responsibility for the content of this publication.

Conflicts of Interest

The authors declare no conflicts of interest.

Abbreviations

The following abbreviations are used in this manuscript:
AdamAdaptive Moment Estimation
CNNConvolutional Neural Network
DLDeep Learning
DenseNetDense Convolutional Network
MLMachine Learning
ReLURectified Linear Unit
ResNetResidual Neural Network
RMSpropRoot Mean Square Propagation
SGDStochastic Gradient Descent
SVMsSupport Vector Machines
VGGVisual Geometry Group
XAIExplainable Artificial Intelligence

References

  1. Pirajno, F. Hydrothermal Processes and Mineral Systems; Springer: Dordrecht, Netherlands, 2009. [Google Scholar] [CrossRef]
  2. Sillitoe, R.H. Porphyry Copper Systems. Econ. Geol. 2010, 105, 3–41. [Google Scholar] [CrossRef]
  3. Flügel, E. Microfacies of Carbonate Rocks; Springer: Berlin/Heidelberg, Germany, 2010; ISBN 978-3-642-03795-5. [Google Scholar]
  4. Bérubé, C.L.; Olivo, G.R.; Chouteau, M.; Perrouty, S.; Shamsipour, P.; Enkin, R.J.; Morris, W.A.; Feltrin, L.; Thiémonge, R. Predicting Rock Type and Detecting Hydrothermal Alteration Using Machine Learning and Petrophysical Properties of the Canadian Malartic Ore and Host Rocks, Pontiac Subprovince, Québec, Canada. Ore Geol. Rev. 2018, 96, 130–145. [Google Scholar] [CrossRef]
  5. Ordóñez-Calderón, J.C.; Gelcich, S. Machine Learning Strategies for Classification and Prediction of Alteration Facies: Examples from the Rosemont Cu-Mo-Ag Skarn Deposit, SE Tucson Arizona. J. Geochem. Explor. 2018, 194, 167–188. [Google Scholar] [CrossRef]
  6. Becerra, D.; Pires de Lima, R.; Galvis-Portilla, H.; Clarkson, C.R. Generating a Labeled Dataset to Train Machine Learning Algorithms for Lithological Classification of Drill Cuttings. Interpretation 2022, 10, SE85–SE100. [Google Scholar] [CrossRef]
  7. Tang, D.G.; Milliken, K.L.; Spikes, K.T. Machine Learning for Point Counting and Segmentation of Arenite in Thin Section. Mar. Pet. Geol. 2020, 120, 104518. [Google Scholar] [CrossRef]
  8. Ishitsuka, K.; Ojima, H.; Mogi, T.; Kajiwara, T.; Sugimoto, T.; Asanuma, H. Characterization of Hydrothermal Alteration along Geothermal Wells Using Unsupervised Machine-Learning Analysis of X-Ray Powder Diffraction Data. Earth Sci. Inform. 2022, 15, 73–87. [Google Scholar] [CrossRef]
  9. Aydın, İ.; Şener, T.K.; Kılıç, A.D.; Derviş, H. Classification of Thin-Section Rock Images Using a Combined CNN and SVM Approach. Minerals 2025, 15, 976. [Google Scholar] [CrossRef]
  10. Budennyy, S.; Pachezhertsev, A.; Bukharev, A.; Erofeev, A.; Mitrushkin, D.; Belozerov, B. Image Processing and Machine Learning Approaches for Petrographic Thin Section Analysis. In Proceedings of the Society of Petroleum Engineers—SPE Russian Petroleum Technology Conference 2017, Moscow, Russia, 16–18 October 2017. [Google Scholar]
  11. Dell’Aversana, P. Deep Learning for Automatic Classification of Mineralogical Thin Sections. Bull. Geophys. Oceanogr. 2021, 62, 455–466. [Google Scholar] [CrossRef]
  12. Su, C.; Xu, S.J.; Zhu, K.Y.; Zhang, X.C. Rock Classification in Petrographic Thin Section Images Based on Concatenated Convolutional Neural Networks. Earth Sci. Inform. 2020, 13, 1477–1484. [Google Scholar] [CrossRef]
  13. Rubo, R.A.; de Carvalho Carneiro, C.; Michelon, M.F.; Gioria, R.d.S. Digital Petrography: Mineralogy and Porosity Identification Using Machine Learning Algorithms in Petrographic Thin Section Images. J. Pet. Sci. Eng. 2019, 183, 106382. [Google Scholar] [CrossRef]
  14. Tharwat, A. Classification Assessment Methods. Appl. Comput. Inform. 2018, 17, 168–192. [Google Scholar] [CrossRef]
  15. Zhang, X.L.; Wang, Z.J.; Liu, D.T.; Sun, Q.; Wang, J. Rock Thin Section Image Classification Based on Depth Residuals Shrinkage Network and Attention Mechanism. Earth Sci. Inform. 2023, 16, 1449–1457. [Google Scholar] [CrossRef]
  16. Aydın, İ.; Kılıç, A.D.; Şener, T.K. Improving Rock Type Identification Through Advanced Deep Learning-Based Segmentation Models: A Comparative Study. Appl. Sci. 2025, 15, 1630. [Google Scholar] [CrossRef]
  17. Wang, H.; Cao, W.; Zhou, Y.; Yu, P.; Yang, W. Multitarget Intelligent Recognition of Petrographic Thin Section Images Based on Faster RCNN. Minerals 2023, 13, 872. [Google Scholar] [CrossRef]
  18. Koeshidayatullah, A.; Morsilli, M.; Lehrmann, D.J.; Al-Ramadan, K.; Payne, J.L. Fully Automated Carbonate Petrography Using Deep Convolutional Neural Networks. Mar. Pet. Geol. 2020, 122, 104687. [Google Scholar] [CrossRef]
  19. Fu, P.; Wang, J. Lithology Identification Based on Improved Faster R-CNN. Minerals 2024, 14, 954. [Google Scholar] [CrossRef]
  20. Dabek, P.; Chudy, K.; Nowak, I.; Zimroz, R. Superpixel-Based Grain Segmentation in Sandstone Thin-Section. Minerals 2023, 13, 219. [Google Scholar] [CrossRef]
  21. Singh, N.; Singh, T.N.; Tiwary, A.; Sarkar, K.M. Textural Identification of Basaltic Rock Mass Using Image Processing and Neural Network. Comput. Geosci. 2010, 14, 301–310. [Google Scholar] [CrossRef]
  22. Baykan, N.A.; Yılmaz, N. Mineral Identification Using Color Spaces and Artificial Neural Networks. Comput. Geosci. 2010, 36, 91–97. [Google Scholar] [CrossRef]
  23. Das, R.; Mondal, A.; Chakraborty, T.; Ghosh, K. Deep Neural Networks for Automatic Grain-Matrix Segmentation in Plane and Cross-Polarized Sandstone Photomicrographs. Appl. Intell. 2022, 52, 2332–2345. [Google Scholar] [CrossRef]
  24. Tatar, A.; Haghighi, M.; Zeinijahromi, A. Experiments on Image Data Augmentation Techniques for Geological Rock Type Classification with Convolutional Neural Networks. J. Rock. Mech. Geotech. Eng. 2025, 17, 106–125. [Google Scholar] [CrossRef]
  25. Wang, B.; Han, G.; Ma, H.; Zhu, L.; Liang, X.; Lu, X. Rock Thin Sections Identification under Harsh Conditions across Regions Based on Online Transfer Method. Comput. Geosci. 2022, 26, 1425–1438. [Google Scholar] [CrossRef]
  26. Zheng, D.; Zhong, H.; Camps-Valls, G.; Cao, Z.; Ma, X.; Mills, B.; Hu, X.; Hou, M.; Ma, C. Explainable Deep Learning for Automatic Rock Classification. Comput. Geosci. 2024, 184, 105511. [Google Scholar] [CrossRef]
  27. Pires de Lima, R.; Duarte, D.; Nicholson, C.; Slatt, R.; Marfurt, K.J. Petrographic Microfacies Classification with Deep Convolutional Neural Networks. Comput. Geosci. 2020, 142, 104481. [Google Scholar] [CrossRef]
  28. Li, N.; Hao, H.; Gu, Q.; Wang, D.; Hu, X. A Transfer Learning Method for Automatic Identification of Sandstone Microscopic Images. Comput. Geosci. 2017, 103, 111–121. [Google Scholar] [CrossRef]
  29. Polat, Ö.; Polat, A.; Ekici, T. Classification of Plutonic Rock Types Using Thin Section Images with Deep Transfer Learning. Turk. J. Earth Sci. 2021, 30, 551–560. [Google Scholar] [CrossRef]
  30. Polat, Ö.; Polat, A.; Ekici, T. Automatic Classification of Volcanic Rocks from Thin Section Images Using Transfer Learning Networks. Neural Comput. Appl. 2021, 33, 11531–11540. [Google Scholar] [CrossRef]
  31. Simonyan, K.; Zisserman, A. Very Deep Convolutional Networks for Large-Scale Image Recognition. In Proceedings of the 3rd International Conference on Learning Representations, ICLR 2015, San Diego, CA, USA, 7 May 2015. [Google Scholar]
  32. He, K.; Zhang, X.; Ren, S.; Sun, J. Deep Residual Learning for Image Recognition. In Proceedings of the 2016 IEEE Conference on Computer Vision and Pattern Recognition (CVPR), Las Vegas, NV, USA, 27–30 June 2016; pp. 770–778. [Google Scholar]
  33. Huang, G.; Liu, Z.; Van Der Maaten, L.; Weinberger, K.Q. Densely Connected Convolutional Networks. In Proceedings of the IEEE Conference on Computer Vision and Pattern Recognition, Honolulu, HI, USA, 21–26 July 2017; pp. 4700–4708. [Google Scholar]
  34. Szegedy, C.; Vanhoucke, V.; Ioffe, S.; Shlens, J. Rethinking the Inception Architecture for Computer Vision. In Proceedings of the IEEE Conference on Computer Vision and Pattern Recognition (CVPR), Las Vegas, NV, USA, 27–30 June 2016; pp. 2818–2826. [Google Scholar]
  35. Srinivasan, D.; Kalaiarasan, C. Gradient Propagation Based DenseNet121 with ResNet50 Feature Extraction for Lymphoma Classification. J. Inst. Eng. Ser. B 2025, 106, 1183–1195. [Google Scholar] [CrossRef]
  36. Raditya, D.I.; Slamet, I.; Sulandari, W.; Susanto, I.; Zukhronah, E.; Isnaini, B. A Comparative Study of Densenet121 And Resnet50 with Grad-Cam for Skin Disease Classification for Improving Good Health. J. Lifestyle SDGs Rev. 2025, 5, e06526. [Google Scholar] [CrossRef]
  37. Bai, K.; Zhang, Z.; Jin, S.; Dai, S. Rock Image Classification Based on Improved EfficientNet. Sci. Rep. 2025, 15, 18683. [Google Scholar] [CrossRef]
  38. Canbaz, O.; Gökce, A. Microthermometric and Stable Isotopic (O and H) Characteristics of Fluid Inclusions in the Porphyry Related Çöpler (İliç-Erzincan) Gold Deposit, Central Eastern Turkey. Cent. Eur. J. Geosci. 2014, 6, 139–147. [Google Scholar] [CrossRef]
  39. Gökce, A.; Canbaz, O.; Ünal Çakır, E.; Bozkaya, G.; Bektaş, Ö.; Başdelioğlu, O. Mineralization Characteristics of Lead-Zinc-Copper Deposits in Akdağmadeni Region (Northern Central Anatolia, Türkiye): Integration of Field Study, Geochemical, Isotope, and Geophysical Data. Geochemistry 2024, 84, 126201. [Google Scholar] [CrossRef]
  40. Canbaz, O.; Gökce, A. Davulalan A-Type Granitoid-Associated Cu, Mo, Pb, Zn, and REEs Mineralization, Central Anatolia, Turkey. J. Afr. Earth Sci. 2022, 196, 104665. [Google Scholar] [CrossRef]
  41. Canbaz, O. Application of Spectral Analysis and Image Processing Methods to Discriminate Hydrothermal Alteration Minerals Around the Tutakdağı (Şebinkarahisar-Giresun) Lead–Zinc Deposits, Northeastern Turkey. J. Indian Soc. Remote Sens. 2023, 51, 2019–2039. [Google Scholar] [CrossRef]
  42. Lowell, J.D.; Guilbert, J.M. Lateral and Vertical Alteration-Mineralization Zoning in Porphyry Ore Deposits. Econ. Geol. 1970, 65, 373–408. [Google Scholar] [CrossRef]
  43. Dong, N.; Zhao, L.; Wu, C.H.; Chang, J.F. Inception v3 Based Cervical Cell Classification Combined with Artificially Extracted Features. Appl. Soft Comput. 2020, 93, 106311. [Google Scholar] [CrossRef]
  44. Powers, D.M.W. Evaluation: From Precision, Recall and F-Measure to ROC, Informedness, Markedness and Correlation. J. Mach. Learn. Technol. 2011, 2, 37–63. [Google Scholar]
  45. Sammut, C.; Webb, G.I. Encyclopedia of Machine Learning and Data Mining, 2nd ed.; Springer: Boston, MA, USA, 2017; ISBN 978-1-4899-7685-7. [Google Scholar]
  46. Jukes, E. Encyclopedia of Machine Learning and Data Mining (2nd Edition). Ref. Rev. 2018, 32, 3–4. [Google Scholar] [CrossRef]
  47. Hossin, M.; Sulaiman, M.N. A Review on Evaluation Metrics for Data Classification Evaluations. Int. J. Data Min. Knowl. Manag. Process 2015, 5, 1. [Google Scholar] [CrossRef]
  48. Ting, K.M. Confusion Matrix. In Encyclopedia of Machine Learning and Data Mining; Sipringer: Boston, MA, USA, 2017; p. 260. [Google Scholar]
  49. Grandini, M.; Bagli, E.; Visani, G. Metrics for Multi-Class Classification: An Overview. arXiv 2008, arXiv:2008.05756. [Google Scholar]
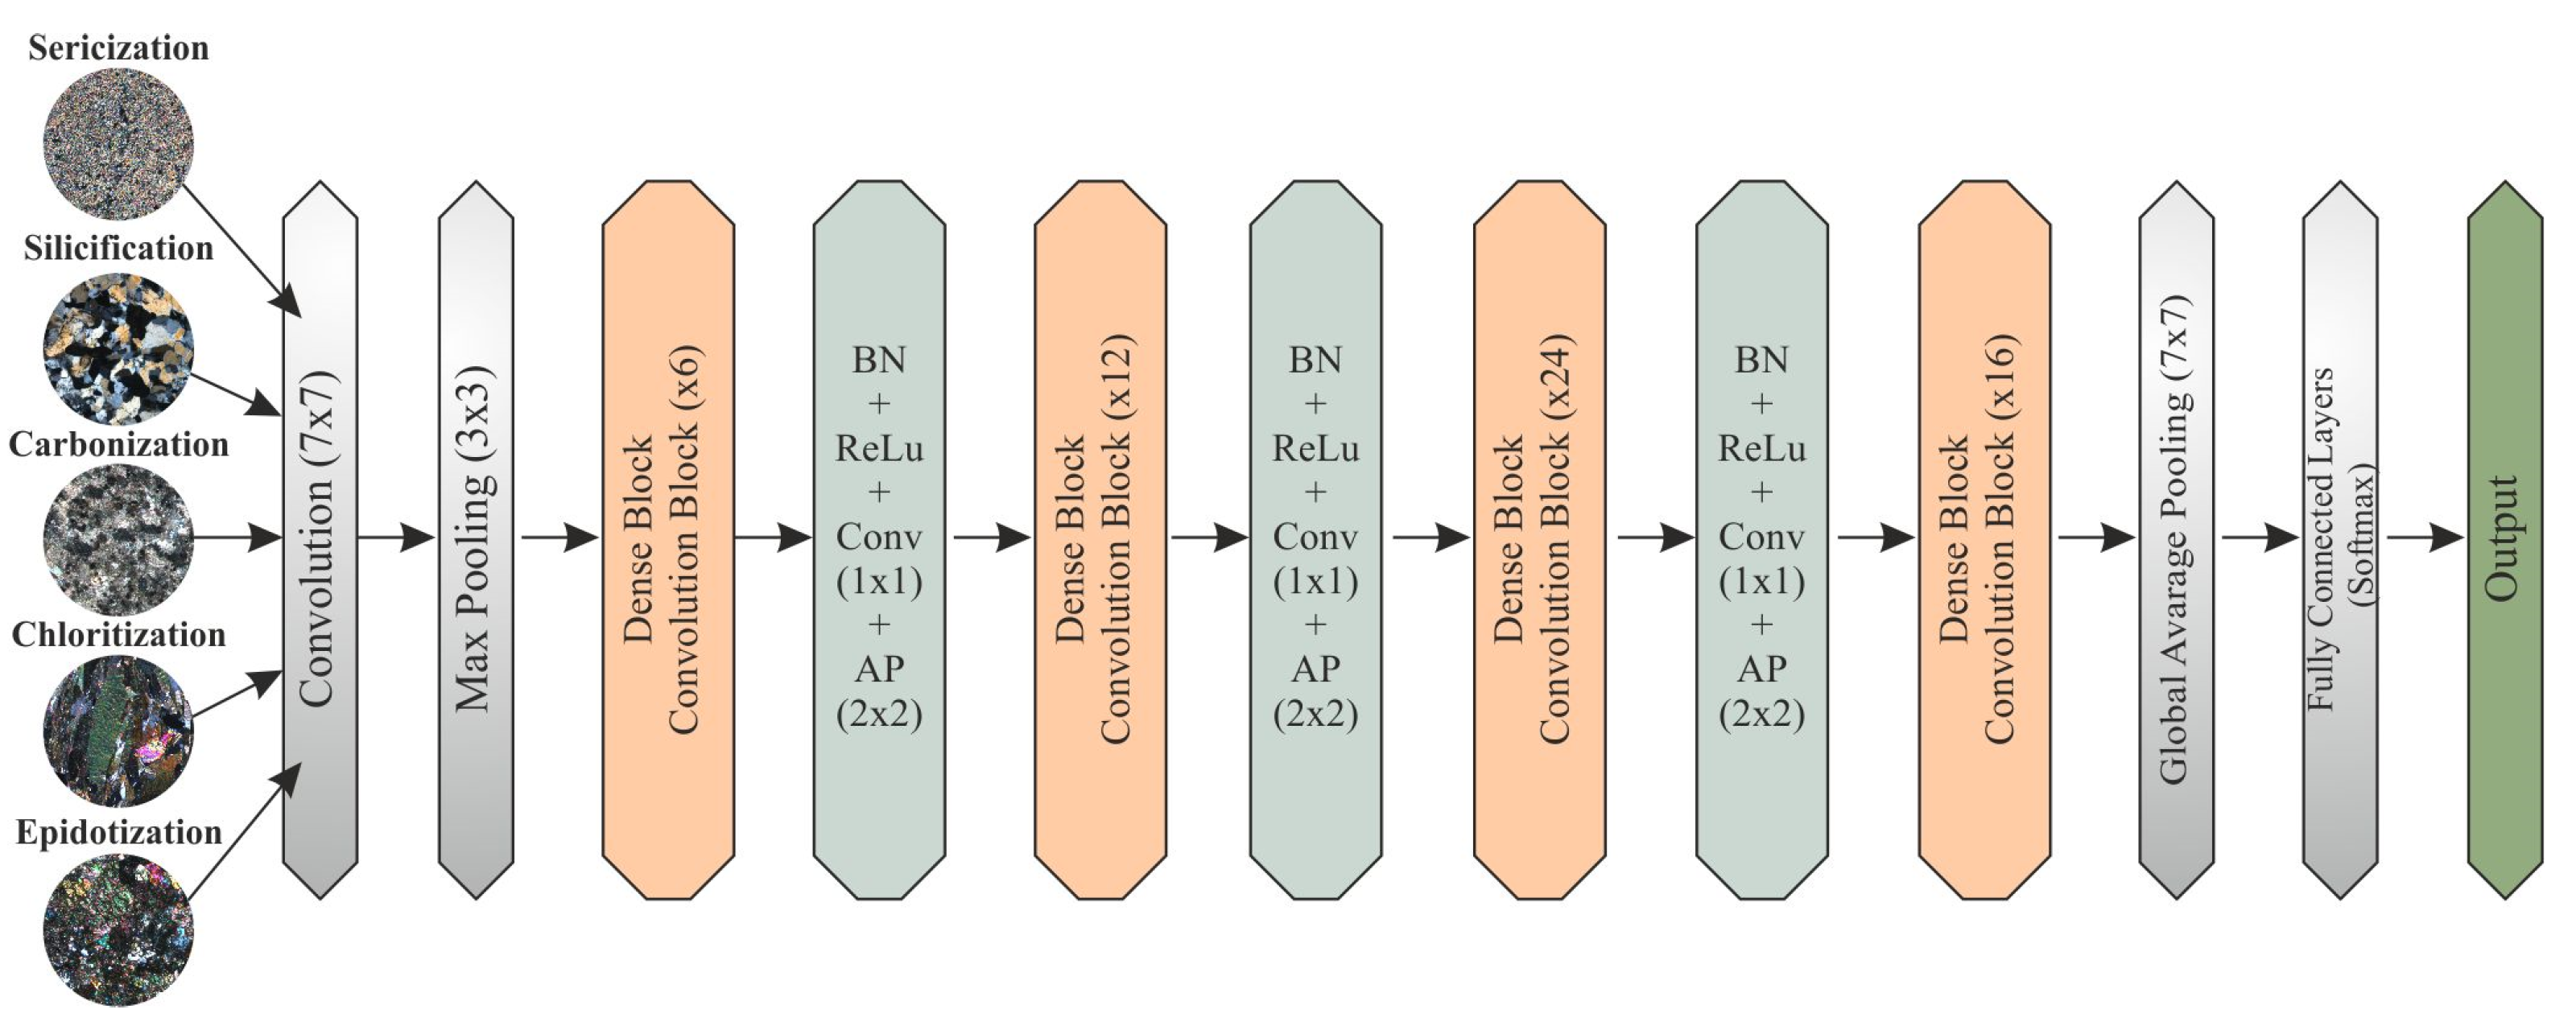
Figure 2. DenseNet121 network architecture.
Applsci 15 12274 g002
Figure 3. The architecture of a residual learning block demonstrating the use of a skip connection.
Applsci 15 12274 g003
Figure 4. ResNet50 network architecture.
Applsci 15 12274 g004
Figure 5. VGG16 network architecture.
Applsci 15 12274 g005
Figure 6. InceptionV3 network architecture.
Applsci 15 12274 g006
Figure 7. The Structure of a Confusion Matrix for Classification Tasks.
Applsci 15 12274 g007
Figure 8. Model Accuracy Graphs of DenseNet121: (a) Adam, (b) RMSprop, (c) SGD, (d) Adadelta.
Applsci 15 12274 g008
Figure 9. Model Loss Graphs of DenseNet121: (a) Adam, (b) RMSprop, (c) SGD, (d) Adadelta.
Applsci 15 12274 g009
Figure 10. Confusion Matrices of DenseNet121 after training with four different optimizers: (a) Adam, (b) RMSprop, (c) SGD, (d) Adadelta.
Applsci 15 12274 g010
Figure 11. Model Accuracy Graphs of ResNet50: (a) Adam, (b) RMSprop, (c) SGD, (d) Adadelta.
Applsci 15 12274 g011
Figure 12. Model Loss Graphs of ResNet50: (a) Adam, (b) RMSprop, (c) SGD, (d) Adadelta.
Applsci 15 12274 g012
Figure 13. Confusion Matrices of ResNet50 after training with four different optimizers: (a) Adam, (b) RMSprop, (c) SGD, (d) Adadelta.
Applsci 15 12274 g013
Figure 14. Model Accuracy Graphs of VGG16: (a) Adam, (b) RMSprop, (c) SGD, (d) Adadelta.
Applsci 15 12274 g014
Figure 15. Model Loss Graphs of VGG16: (a) Adam, (b) RMSprop, (c) SGD, (d) Adadelta.
Applsci 15 12274 g015
Figure 16. Confusion Matrices of VGG16 after training with four different optimizers: (a) Adam, (b) RMSprop, (c) SGD, (d) Adadelta.
Applsci 15 12274 g016
Figure 17. Model Accuracy Graphs of InceptionV3: (a) Adam, (b) RMSprop, (c) SGD, (d) Adadelta.
Applsci 15 12274 g017
Figure 18. Model Loss Graphs of InceptionV3: (a) Adam, (b) RMSprop, (c) SGD, (d) Adadelta.
Applsci 15 12274 g018
Figure 19. Confusion Matrices of InceptionV3 after training with four different optimizers: (a) Adam, (b) RMSprop, (c) SGD, (d) Adadelta.
Applsci 15 12274 g019
Figure 20. Grad-CAM visualization matrix comparing model focus areas across five hydrothermal alteration types. Each row represents an alteration class, while columns display activation heatmaps for DenseNet121, ResNet50, VGG16, and InceptionV3. Warmer colors (red/yellow) indicate areas with higher influence on the model’s classification decision.
Applsci 15 12274 g020
Table 1. The DenseNet121 model performance results.
AdamRMSpropSGDAdadelta
prf1prf1prf1prf1
ep1.001.001.001.001.001.001.001.001.001.001.001.00
carb1.001.001.001.001.001.001.001.001.000.941.000.97
chl1.001.001.001.001.001.001.000.991.000.991.001.00
ser1.001.001.001.001.001.001.000.991.001.000.930.96
si1.001.001.001.001.001.001.001.001.001.001.001.00
p: precision, r: recall, f1: f1-score.
Table 2. The ResNet50 model performance results.
AdamRMSpropSGDAdadelta
prf1prf1prf1prf1
ep0.991.001.001.001.001.001.001.001.001.000.990.99
carb0.990.990.991.001.001.001.001.001.001.001.001.00
chl1.001.001.001.001.001.001.000.991.001.001.001.00
ser0.990.990.991.001.001.001.000.991.001.001.001.00
si0.990.970.981.001.001.001.001.001.001.001.001.00
p: precision, r: recall, f1: f1-score.
Table 3. The VGG16 model performance results.
AdamRMSpropSGDAdadelta
prf1prf1prf1prf1
ep1.001.001.001.001.001.001.001.001.001.001.001.00
carb1.001.001.000.871.000.931.001.001.001.000.991.00
chl1.001.001.000.961.000.981.001.001.001.001.001.00
ser1.001.001.001.001.001.001.001.001.001.001.001.00
si1.001.001.001.000.810.891.001.001.001.001.001.00
p: precision, r: recall, f1: f1-score.
Table 4. The InceptionV3 model performance results.
AdamRMSpropSGDAdadelta
prf1prf1prf1prf1
ep1.001.001.000.990.990.991.000.990.991.001.001.00
carb0.951.000.980.990.990.990.991.001.001.001.001.00
chl0.991.001.000.990.990.990.990.990.991.001.001.00
ser1.000.940.970.990.990.991.001.001.001.001.001.00
si1.001.001.001.000.810.891.001.001.001.001.001.00
p: precision, r: recall, f1: f1-score.
Table 5. Comparison of final accuracy, loss, and training time for all model-optimizer combinations.
DenseNet121ResNet50VGG16InceptionV3
acclosstimeacclosstimeacclosstimeacclosstime
Adam1.000.0189270.9930.0919311.000.01312700.9870.099662
RMSprop1.000.01013821.000.00911380.9610.16313120.9930.030872
SGD0.9980.02610880.9990.0269321.000.02010640.9960.034831
Adadelta0.9910.0429520.9980.0459730.9990.02412591.000.021674
acc: accuracy, loss: loss value, time: training time (second).
Disclaimer/Publisher’s Note: The statements, opinions and data contained in all publications are solely those of the individual author(s) and contributor(s) and not of MDPI and/or the editor(s). MDPI and/or the editor(s) disclaim responsibility for any injury to people or property resulting from any ideas, methods, instructions or products referred to in the content.