Article

Investigation of Blast Resistance Performance in Reinforced Concrete Slabs Using CONWEP-ALE Coupling Algorithm

State Key Laboratory of Chemistry for NBC Hazards Protection, Beijing 102205, China
*
Authors to whom correspondence should be addressed.
Appl. Sci. 2025, 15(22), 12162; https://doi.org/10.3390/app152212162
Submission received: 27 August 2025 / Revised: 29 October 2025 / Accepted: 14 November 2025 / Published: 16 November 2025
(This article belongs to the Section Civil Engineering)

Abstract

The Conventional Weapons Effects Program (CONWEP) algorithm often lacks sufficient accuracy in predicting blast responses of reinforced concrete (RC) slabs, while the Arbitrary Lagrangian–Eulerian (ALE) algorithm demands prohibitively high computational resources. To enhance the engineering applicability of blast resistance assessments for RC slabs, this study proposed a novel CONWEP-ALE coupling algorithm. Utilizing validated blast tests on RC slabs, a representative finite element model was established using LS-DYNA. The performance differences between the CONWEP, ALE, and CONWEP-ALE coupling algorithms were systematically compared under three distinct blast scenarios. Key response characteristics, including incident overpressure, structural deformation, and computational time, were analyzed to evaluate the predictive capabilities of each algorithm for RC slab dynamic response. The results demonstrated that the CONWEP-ALE coupling algorithm achieved the lowest average error (23.23%) in predicting incident overpressure among the three algorithms. Both the ALE and CONWEP-ALE coupling algorithms demonstrate superior accuracy over the CONWEP algorithm in predicting the displacement. Crucially, computational time was reduced by approximately 50% using the CONWEP-ALE algorithm for the specific blast scenarios. Thus, the CONWEP-ALE coupling algorithm provides an effective and efficient approach for analyzing the dynamic response and failure modes of blast-loaded RC slabs.

1. Introduction

Reinforced concrete structures have become the predominant solution in modern construction due to their exceptional load-bearing capacity and cost-effectiveness, widely implemented in civil buildings (e.g., residences, offices, commercial centers) and military protective facilities. However, such structures remain vulnerable to blast threats arising from terrorist attacks, industrial accidents, and common hazards [1]. These extreme dynamic loads can induce severe damage or structural collapse, endangering lives and property while potentially triggering catastrophic secondary disasters such as progressive collapse or the release of toxic materials. Consequently, rigorous analysis of the dynamic response of reinforced concrete slabs under blast loading provides critical theoretical foundations for blast-resistant retrofitting of existing structures and guides the design of new protective facilities.
Due to the prohibitive costs of blast testing on reinforced concrete slabs, numerical simulations have become the predominant research approach. Current mainstream computational methods include direct blast load curve application, CONWEP algorithm, and ALE algorithm. The CONWEP algorithm applies explosive loads directly to structural surfaces, offering computational efficiency particularly advantageous for uncomplicated scenarios without structural shadowing effects. Lin et al. [2] numerically optimized offshore sandwich blast walls with various honeycomb cores using the CONWEP algorithm, finding that concave arc honeycomb cores exhibit best anti-blast performance. Kim et al. [3] analyzed protection walls under hydrogen tank explosion via CONWEP and ALE algorithms, 3.6 m minimum distance between the storage tank and the protection wall was recommended. Tian et al. [4] conducted field blast tests of precast concrete (PC) slabs and numerical simulations. The validated LS-DYNA model with the CONWEP algorithm effectively predicted overpressure, displacement, and damage, aiding the PC slab blast resistance study. Santos et al. [5] conducted eight improvised explosive device (IED) detonation tests on a RC building and performed LS-DYNA simulations using the CONWEP algorithm. Goel et al. [6] used ABAQUS (v2024) to perform numerical analysis on underground structures under internal blast loading, comparing CONWEP, Smoothed Particle Hydrodynamics (SPH), and coupled Eulerian–Lagrangian (CEL) methods. They found that explosive weight and concrete grade significantly affected structural stability, with buried parts more blast-resistant. Shirbhate et al. [7] investigated the blast response of hexagonal honeycomb sandwich structures with perforations via the CONWEP algorithm. They analyzed parameters like perforation size, shape, number, and sheet thickness, showing that perforations enhance blast mitigation and energy absorption. Kumar et al. [8] conducted experimental and finite element studies on RC panels under nearby explosions, using three gelatin masses and detonation distances. Simulations utilizing the multi-detonation CONWEP algorithm accurately predicted the damage.
The ALE algorithm accounts for interaction between air and structures, thus generally yielding higher computational accuracy than CONWEP. The fluid–structure interaction refers to the coupling of a medium described by conservation laws in Eulerian perspective with a medium described by conservation laws in Lagrangian perspective. Concurrently, the deformation and movement of the structure itself alter the surrounding flow field, influencing the pressure distribution through effects such as wave reflection, rarefaction, and trapping. In recent years, ALE has been extensively applied to study failure modes of reinforced concrete members (e.g., beams, columns, slabs, and walls) under various blast scenarios including contact, near-field, and far-field explosions [9,10,11,12,13,14]. Lee et al. [15] numerically investigated RC and High Performance Fiber Reinforced Concrete (HPFRCC) slabs under near-ground TNT explosions using the ALE method and found that HPFRCC slabs exhibited better blast resistance. Jiang et al. [16] conducted vulnerability analysis of a high-speed railway bridge system under near-field blasts using the ALE algorithm. Dynamic responses under four car-bomb blasts were calculated, and component damage levels were evaluated, providing references for post-blast safety evaluation. Guo et al. [17] performed implosion tests and numerical simulations on Masonry Infilled Reinforced Concrete (MIRC) frames using the ALE algorithm, analyzing internal explosion load characteristics and structure-shock wave interaction. Wijesooriya et al. [18] investigated band-beam slabs under close-in detonations via experiments and validated the ALE numerical framework. Parametric studies showed confinement detailing improved performance, and design recommendations for reinforcement were proposed. Fan et al. [19] conducted underwater explosion tests on a normal strength reinforced concrete (NSRC) arch and a high strength reinforced concrete (HSRC) arch, establishing ALE-based multi-media coupling models. They proposed prediction formulas for peak displacement, with HSRC arches showing better blast resistance. Zhou et al. [20] used the ALE algorithm to investigate the dynamic response and damage mechanism of sea-crossing bridge piers under underwater explosions, finding that detonation point below pier cap caused worst damage and 350 kg explosive risked collapse.
The pursuit of simulating severe material distortions and complex fluid–structure interaction phenomena has driven the adoption of meshless methods. Notably, SPH method has emerged as a powerful Lagrangian technique for modeling explosive detonation, shockwave propagation in air, and large deformation failure in solids, circumventing the mesh tangling issues associated with traditional FEM in extreme events. Li et al. [21] Numerically investigated the damage and failure of plain Ultra-High Performance Concrete (UHPC) panels under contact explosion, utilizing the SPH algorithm to capture the interaction between the blast wave and the slab. Liu et al. [22] established a SPH-FEM coupling model in LS-DYNA software (v2025) to investigate the dynamic fracture characteristics of granite after heat treatment. Peng et al. [23] employed the SPH algorithm to numerically investigate the effects of slab thickness and TNT charge weight on the blast response of UHPC slabs under contact explosions.
A common challenge in blast simulation lies in balancing computational efficiency and accuracy. The CONWEP algorithm, based on empirical formulas, offers low computational costs by eliminating the need for air domain modeling or explosive simulations. However, it neglects superposition effects between incident and reflected shockwaves, resulting in lower accuracy compared to the ALE algorithm [24]. While the ALE algorithm precisely simulates blast wave propagation and structural interactions, it requires large-scale air domains with refined meshing, leading to significantly higher computational demands. To balance computational efficiency and accuracy, this study adopted a CONWEP-ALE coupling algorithm. Near the RC slab—where shockwave effects were most pronounced—a localized ALE air domain was incorporated to accurately model the interaction of the air with the RC slab. In the far field, the CONWEP load model was retained. A mapping relationship between CONWEP loads and the ALE domain boundary enabled efficient transfer of blast loads from far-field to near-field regions. This methodology maintained high fidelity for near-field fluid–structure interactions while substantially reducing computational resource requirements. Its reliability was validated through comparisons with the CONWEP algorithm, the ALE algorithm, and existing experimental data.
This paper is organized as follows: First, the blast-loading methodology, finite element model development, and material constitutive models employed in this study are described. Subsequently, key parameters including incident overpressure, peak displacement, residual displacement, and computational time are evaluated and compared across three algorithms at varying scaled distances. Differences in algorithmic outcomes and their underlying causes are analyzed. Finally, the principal research findings are summarized. The advantages, limitations, and applicable scope of the three algorithms are discussed, with specific emphasis placed on the superior computational efficiency and applicability of the CONWEP-ALE coupling algorithm for blast analysis of RC slabs.

2. Numerical Simulation of Blast Loading

All numerical simulations in this study were performed using the explicit finite element code LS-DYNA. This paper adopts three algorithms: the CONWEP algorithm, the ALE algorithm, and the CONWEP-ALE coupling algorithm. This section introduces the theoretical foundations of these algorithms and their specific implementation within the LS-DYNA environment.

2.1. CONWEP Algorithm

The Conventional Weapons Effects Program (CONWEP) is an empirical algorithm derived from U.S. military experimental data [25,26] for calculating blast effects from free-air and surface bursts. By neglecting air medium stiffness and inertia, the CONWEP algorithm eliminates the need for fluid domain modeling. Particularly for structures in unconfined environments, this algorithm demonstrates strong agreement between numerical predictions and experimental results. In LS-DYNA, the empirical CONWEP load model was applied to the structure’s surface to calculate the blast pressure-time history based on equivalent TNT charge weight and standoff distance [27].

2.2. ALE Algorithm

The Arbitrary Lagrangian–Eulerian (ALE) method is a high-fidelity approach that explicitly models the explosion process and shockwave propagation through the air [28]. It accounts for the interaction of a fluid flow with a solid structure, generally yielding higher accuracy than empirical methods at a greater computational cost [29]. In the LS-DYNA simulations, the ALE algorithm requires:
  • Defining materials and equations of state for both the detonation products of high explosives (modeled with a Jones–Wilkins–Lee (JWL) equation of state) and air (modeled as an ideal gas).
  • Creating a multi-material Eulerian mesh to contain the air and explosive products.
  • Filling the respective parts of the mesh with the appropriate materials.
  • Coupling the area described in Eulerian perspective to the area described in Lagrangian perspective to achieve fluid–structure interaction simulation [30,31].
This approach captures shockwave propagation through air, yielding higher-fidelity results than the CONWEP algorithm.

2.3. ALE-CONWEP Coupling Algorithm

The ALE-CONWEP coupling algorithm requires modeling only the structure and a limited surrounding air domain. An ambient layer is applied to the air domain boundary, facilitating the transfer of CONWEP-generated blast loads into the air. To simulate blast wave effects on reinforced concrete (RC) slabs, both the ALE algorithm and the CONWEP-ALE coupling algorithm employ a penalty-based coupling algorithm [32]. Coupling is achieved through a penalty-based formulation incorporating material erosion capabilities. This formulation imposes compatibility between the different domains by applying penalty forces when the Lagrangian nodes penetrate the ALE elements.
A key component in the methodology for coupling empirical blast loads to an ALE domain is a specialized ALE element formulation known as an ambient element. In practice, a single layer of such ambient ALE elements constitutes the external boundary of the air domain that is directly exposed to the blast. This ambient layer functions as an interface that acquires data from empirical blast relations and converts it into thermodynamic state variables (pressure, density, and particle velocity), which are then imposed as source terms on adjacent air elements. Accordingly, the incident blast pressure is directly imposed at the quadrature point located at the centroid of the ambient element. The air density at this quadrature point is computed as follows:
The density at the shock front,  ρ 1 , resulting from a shock propagating into air at ambient atmospheric density  ρ 0 , is given by the Rankine–Hugoniot jump conditions [33].
ρ 1 ρ 0 = 6 P 1 / P 0 + 1 P 1 / P 0 + 6
In Equation (1),  P 0  denotes the ambient atmospheric pressure and  P 1  represents the total pressure at the shock front, which is defined as the sum of the incident pressure from the empirical equation and the ambient atmospheric pressure. Following this formula, the air density  ρ 1  at the shock front is computed and is then assigned to the quadrature point of the ambient element. A further application of the Rankine–Hugoniot jump conditions yields the particle velocity  u p  at the shock front, as defined by the following equation:
u p C o 2 = 25 P 1 / P 0 1 2 42 P 1 / P 0 + 7
C 0  is the sound speed in air before arrival of the shock. The particle velocity at the quadrature point is then transferred to the nodes via an area-weighted scheme, where it is assigned to each node based on its contributing area share from the integration point. This guarantees inter-element continuity of nodal velocities and facilitates smooth shock wave propagation in the ALE domain.

3. Development of Finite Element Models

3.1. Experimental Overview

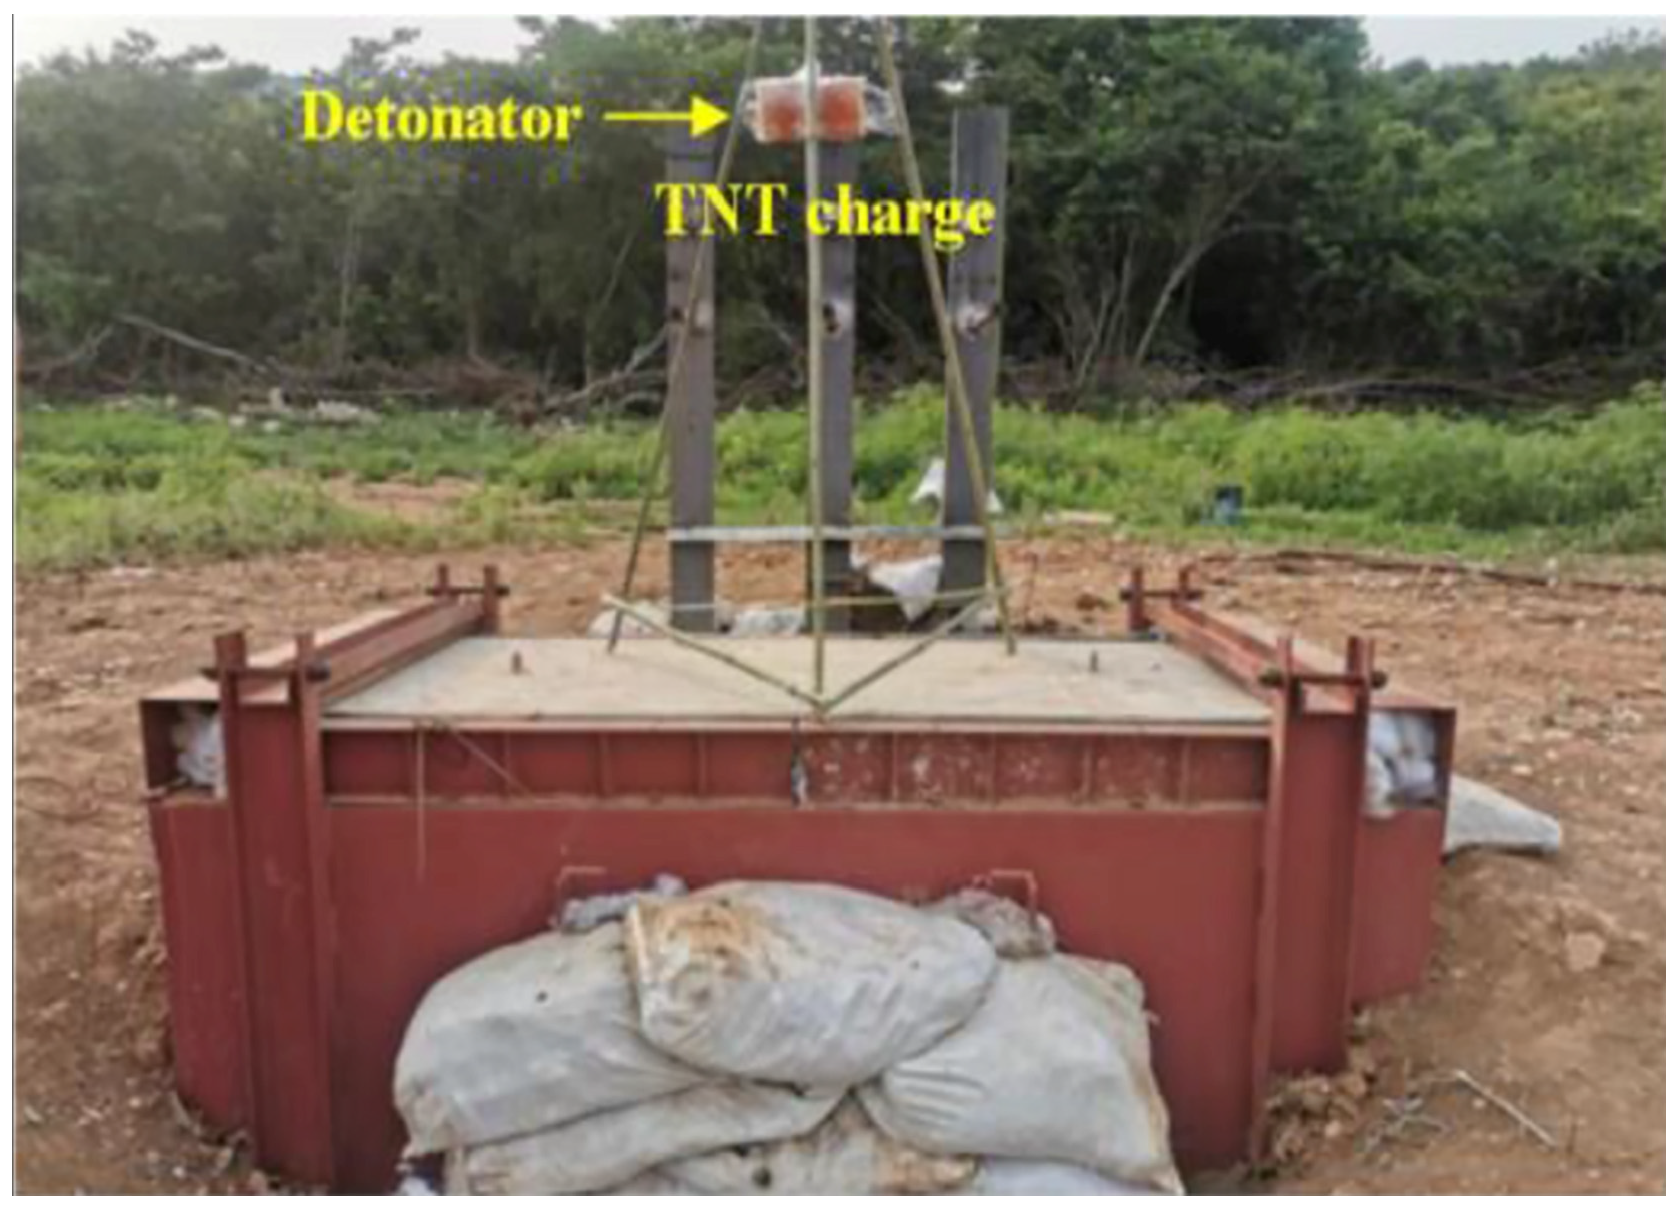
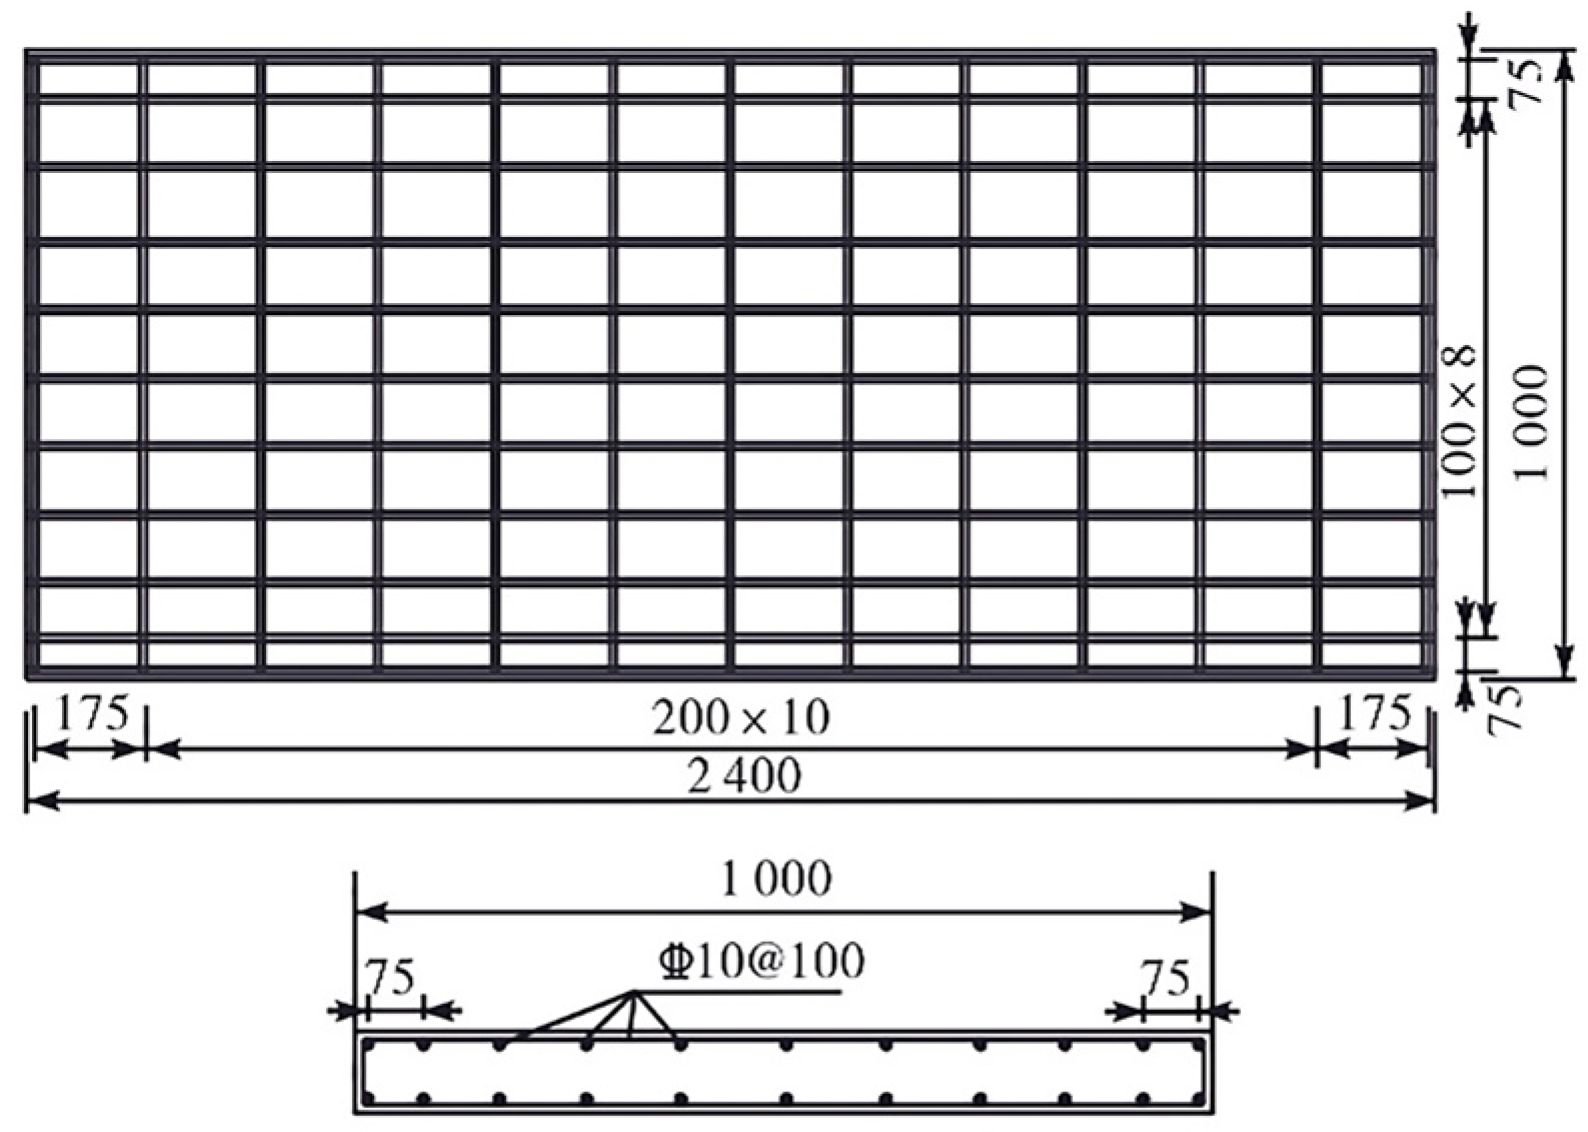
This study employs reinforced concrete (RC) slab explosion test data from Su et al. [34] and Zhou et al. [35] (the experimental data for the RC slabs used in Zhou et al. [35] were sourced from the earlier tests reported by Su et al. [34]). The blast test setup is shown in Figure 1. The slab, measuring 2400 mm × 1000 mm × 100 mm, was constructed with C30 concrete and 10 mm diameter HRB400 steel reinforcement. Key material properties included a measured compressive strength of 30.4 MPa for the concrete and a reinforcement ratio of 1.727% with double-layer steel placement. The reinforcement arrangement is shown in Figure 2. A clear concrete cover of 10 mm was maintained throughout. The experimental setup utilized a box-like blast-loading apparatus. The slab was positioned between four round rolls spaced 2000 mm apart to simulate simply supported boundary conditions. Three displacement sensors (D1, D2, D3) were positioned on the slab’s non-blast face as shown in Figure 3. Sensor D1 was located at the center, while D2 and D3 were symmetrically placed 500 mm from D1. A 4 kg cylindrical TNT charge was employed in the test, suspended above the RC slab by a bamboo frame. The scaled distance (0.6–1.0 m/kg1/3) was controlled by adjusting the length of the suspension ropes during detonation.
The blast testing procedure consisted of the following steps: the RC slab specimen was first mounted in a box-like blast-loading apparatus; the suspension height of the charge was then adjusted according to the target scaled distance; sensor positions were calibrated; the TNT was detonated using an electric detonator, simultaneously triggering all sensors to record real-time data. After the explosion, sensors were recovered and the residual deflection of the specimen was measured.

3.2. Material Model

The selection of appropriate constitutive models is critical for accurately simulating the high-strain-rate and high-pressure behavior of materials under blast loading. In LS-DYNA simulations, concrete materials are typically modeled using constitutive models such as the Holmquist–Johnson–Cook (HJC), Riedel–Hiermaier–Thoma (RHT), or Karagozian & Case (KCC) models. This study employs the KCC model, which incorporates three failure surfaces: yield strength, ultimate strength, and residual strength [36]. The model accounts for key dynamic behaviors including strain rate effects, damage evolution, elastoplasticity, and softening. A state equation describes the relationship between hydrostatic pressure and volumetric strain, enabling accurate simulation of concrete response under blast loading. The key material parameters for the concrete are listed in Table 1 and other parameters were automatically generated by the built-in calibration procedure.
The rebar was modeled using an elastoplastic constitutive model with isotropic and kinematic hardening capabilities [37]. This formulation accommodates isotropic hardening, kinematic hardening, or mixed hardening modes. Key material parameters are provided in Table 2. Parameters C and P are the strain rate coefficients for the Cowper-Symonds model, which quantifies how a material’s yield stress increases with the rate of deformation.
The TNT was modeled using a high-explosive material model combined with the Jones-Wilkins-Lee (JWL) equation of state, which is the industry standard for simulating the detonation products of high explosives [38,39,40]. The parameters used in this study, summarized in Table 3, are standard values for TNT [41]. The JWL equation describing detonation product pressure is expressed as:
P 1 = A 1 ω R 1 V e R 1 V + B 1 ω R 2 V e R 2 V + ω E 0 V
In Equation (3),  P 1  denotes the detonation pressure,  V  represents the relative volume,  E 0  is the initial energy density per unit volume, and other parameters are material constants.
Air was modeled using a null material model combined with a linear polynomial equation of state [42]. The linear polynomial equation is defined as:
P 2 = C 0 + C 1 μ + C 2 μ 2 + C 3 μ 3 + C 4 + C 5 μ + C 6 μ 2 E 0
In Equation (4),  P 2  is air pressure,  C 0 C 1 C 2 C 3 C 4 C 5 C 6  are material constants,  C 4 = C 5 = γ 1 = 0.4 γ  represents specific heat ratio.  μ = ρ / ρ 0 1 ρ  denotes the current air density, while  ρ 0  refers to the reference density at stress-free/deformation-free state.  E 0  is the initial energy density per unit volume. Complete parameter values are provided in Table 4.

3.3. Mesh Convergence Analysis

A systematic mesh convergence study was conducted to determine an appropriate mesh size for the air domain, ensuring that the numerical results for shockwave propagation were both accurate and computationally efficient. This analysis was performed using the CONWEP-ALE coupling algorithm under the 0.6 m/kg1/3 scaled distance condition. Four different element sizes were evaluated for the air domain: 40 mm, 30 mm, 20 mm, and 10 mm. The key metrics for comparison were the peak incident overpressure (compared against the experimental value of 1.920 MPa) and the total computation time.
The results are summarized in Table 5. It was observed that as the mesh was refined from 40 mm to 20 mm, the predicted peak overpressure converged towards a stable value, with an improvement in accuracy. However, further refinement to a 10 mm mesh provided negligible improvement in accuracy (less than 0.5% change in overpressure) while resulting in a significantly higher computational cost compared to the 20 mm mesh.
Based on this analysis, the 20 mm mesh was selected for the air domain in this paper. The mesh size for the concrete slab and rebars was set to 20 mm. This selection is supported by the mesh convergence study in Su et al. [34], which concluded that element sizes smaller than 25 mm yield stable results for concrete behavior, thus ensuring the reliability of the structural response predictions.

3.4. Finite Element Model

This study employs Figure 4 which illustrates the finite element models for the three simulation methodologies: (a) CONWEP, (b) ALE, and (c) CONWEP-ALE coupling. The specific setting parameters of the components are shown in Table 6.
In the CONWEP model, hexahedral solid elements represented both the concrete slab and steel supports, while beam elements with shared nodes modeled the reinforcement. All translational/rotational degrees of freedom at the four steel supports were constrained. Concrete-support interaction was defined by automatic contact. As shown in Figure 4a, the explosive load is applied directly to the surface of the RC slab, without any modeling of the air domain.
The ALE model extended this approach by incorporating a surrounding air domain measuring 2.5 m in length, 1.1 m in width, and 2.0 m in height around the reinforced concrete RC slab, with a cylindrical explosive charge (228 mm height × 117 mm diameter) modeled. Non-reflective boundary conditions were applied to the surfaces of six air layers.
The CONWEP-ALE coupling algorithm employed a smaller air domain (2.5 m × 1.1 m × 0.6 m) surrounding the plate, with an ambient layer of 0.02 m height configured on top. This layer received CONWEP-generated shockwaves and propagated them through the air domain to the slab surface. Non-reflective boundary conditions were applied to the surfaces of the other five air layers, except for the ambient layer.

4. Analysis and Discussion of Numerical Results

To ensure parametric consistency across blast simulations, the explosive load parameters in both CONWEP and CONWEP-ALE coupling algorithms, along with explosive placement in the ALE algorithm, strictly corresponded to the three experimental scenarios detailed in Table 7 [35]. For the 0.8 m/kg1/3 scaled distance scenario, Figure 5, Figure 6 and Figure 7 depict shockwave propagation patterns in the CONWEP algorithm, ALE algorithm, and CONWEP-ALE coupling algorithm, respectively.

4.1. Incident Overpressure

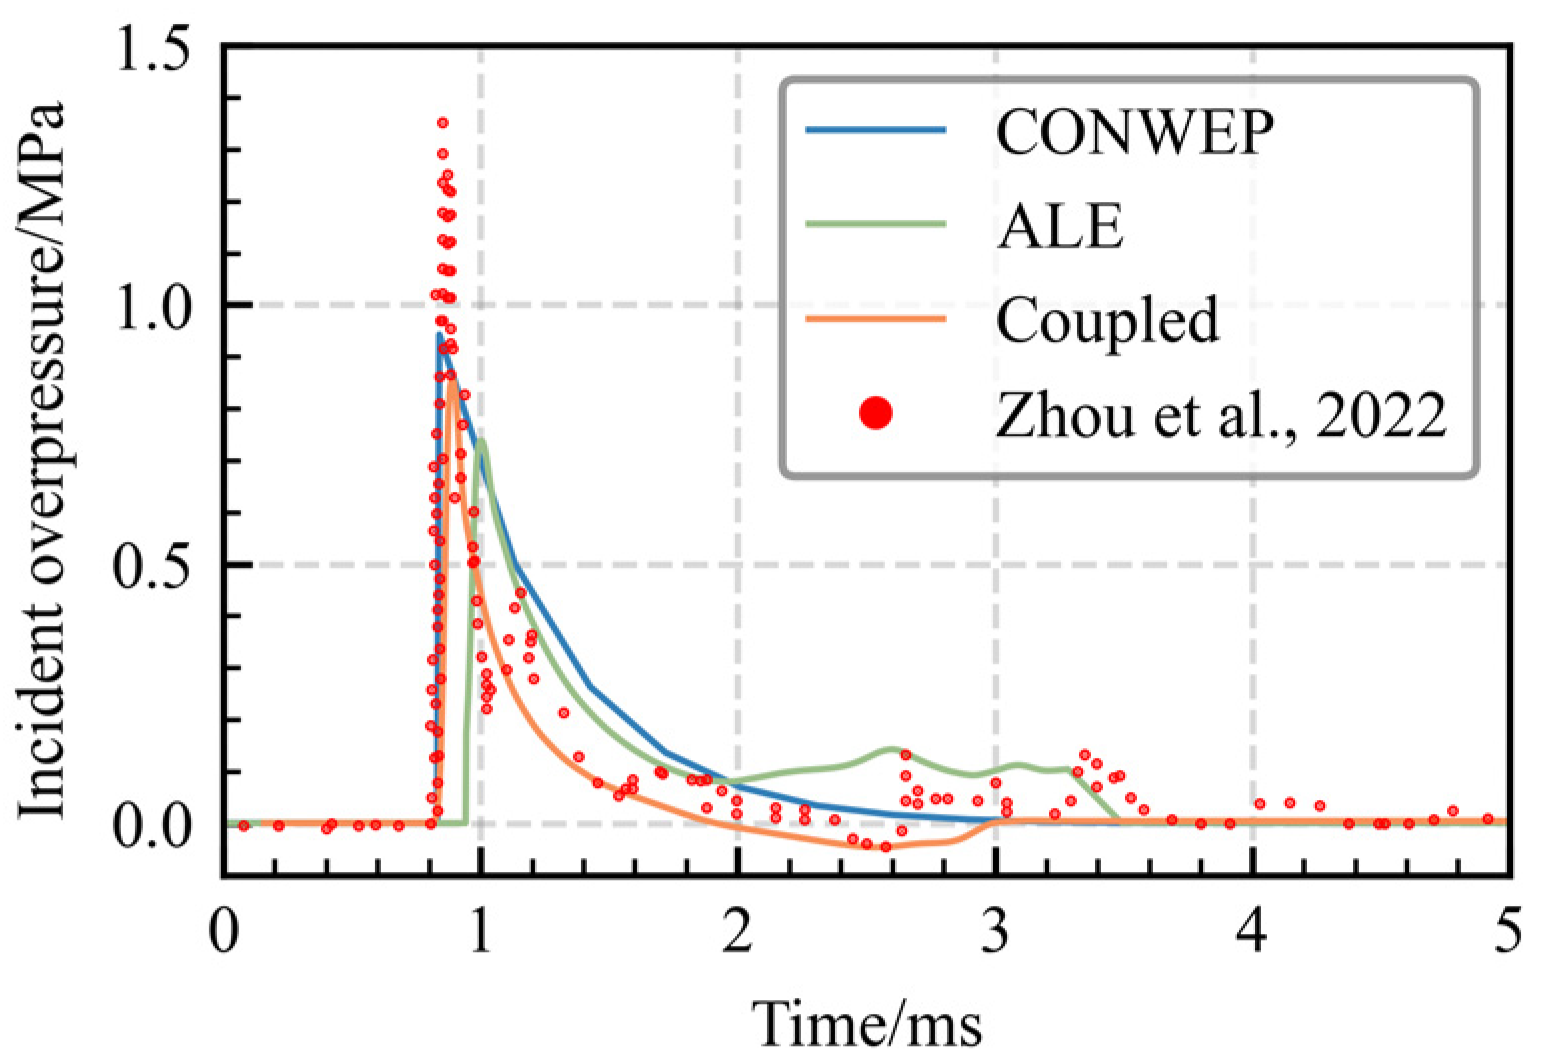
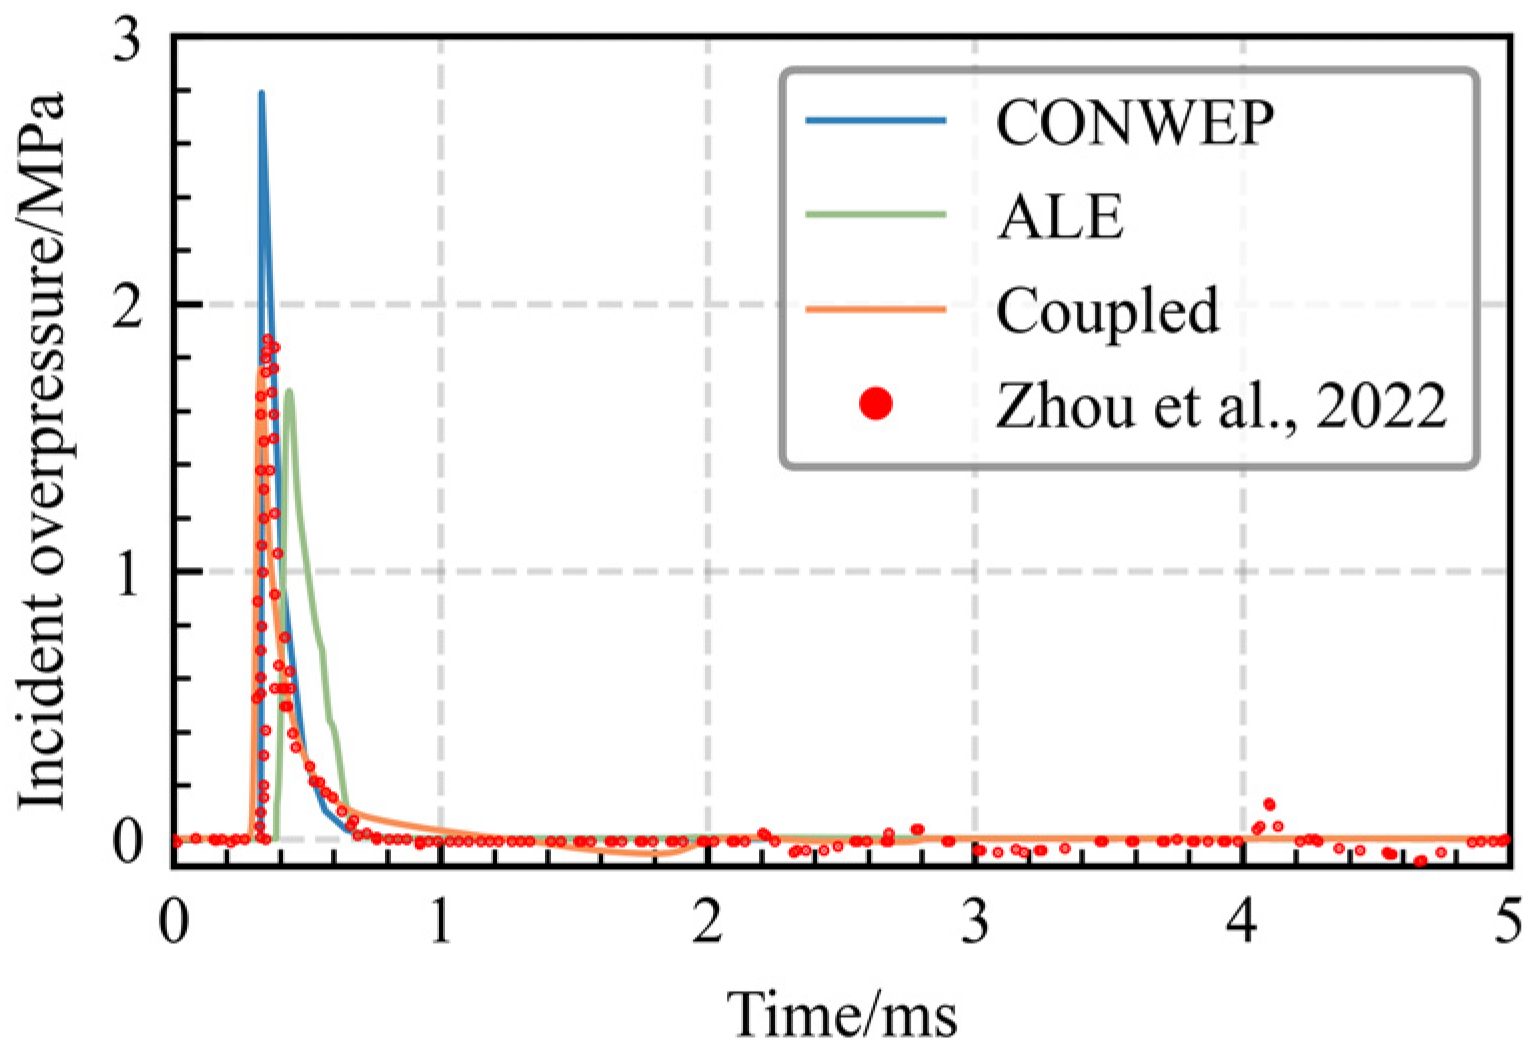
Figure 8, Figure 9 and Figure 10 present incident overpressure results from the CONWEP, ALE, and CONWEP-ALE coupling algorithms. The CONWEP algorithm calculated incident overpressure using empirical formulas. In both the ALE and CONWEP-ALE coupling algorithms, incident overpressure was monitored using a single tracer point located in the air domain. The tracer was positioned 0.01 m from the center of the blast-facing surface of the RC slab. Pressure-time histories were recorded at a sampling frequency of 105 Hz to adequately capture the blast wave characteristics.
All three algorithms predict incident overpressure-time histories exhibiting rapid initial peak escalation followed by gradual decay. Table 8 compares peak incident overpressure values and relative errors ( Calculated value - Experimental value Experimental value × 100 % ) for the three algorithms across test scenarios. Key findings reveal: Under all working conditions, the CONWEP-ALE coupling algorithm demonstrates higher accuracy in predicting the peak incident overpressure compared to the ALE algorithm. Moreover, as the scaled distance decreases, the relative error of both algorithms exhibits a gradual reduction trend. It should be noted that the CONWEP algorithm achieved its best incident overpressure prediction at the 0.8 m/kg1/3 scaled distance. This likely represents a special case where the empirical model for spherical charges coincidentally aligned with cylindrical charge experiment. This trend is consistent with the findings in the source experimental study [35], which also reported relatively higher accuracy for CONWEP at this particular scaled distance. However, this does not indicate general superiority, as CONWEP algorithm exhibits substantial errors (>30%) at other distances.
Overall, the CONWEP-ALE coupling algorithm achieves an average error rate of 23.23% across the three scenarios, which is lower than the 27.22% of the CONWEP algorithm and the 30.72% of the ALE algorithm. This indicates that the CONWEP-ALE coupling algorithm offers higher reliability and accuracy in predicting incident overpressure under the given conditions.
A sensitivity analysis of the CONWEP-ALE coupling algorithm was performed to assess the influence of the ambient layer thickness and the local ALE domain height on the predicted incident overpressure. The analysis, conducted for the 0.8 m/kg1/3 scaled distance scenario, varied the layer thickness (0.02 m, 0.04 m, 0.06 m) and the domain height (0.4 m, 0.6 m, 0.8 m). The results, summarized in Table 9, demonstrate that the model exhibits low sensitivity to changes in the ambient layer thickness and ALE domain dimensions.
For the domain height of 0.6 m, increasing the thickness from 0.02 m to 0.06 m resulted in a modest increase in error (from 24.88% to 25.91%). This indicates that the performance of the coupling algorithm is not critically sensitive to this parameter within the tested range; for the layer thickness of 0.02 m, the results indicate a mild sensitivity to the ALE domain height. While a smaller domain (0.4 m) yielded a slightly lower overpressure error (24.09%) compared to the baseline (24.88%), and a larger domain (0.8 m) yielded a slightly higher error (25.79%), the variation is contained within a narrow band of approximately ±0.9%.
In conclusion, the sensitivity analysis confirms that the accuracy of the proposed CONWEP-ALE coupling algorithm is stable with respect to the tested numerical parameters.

4.2. Displacement

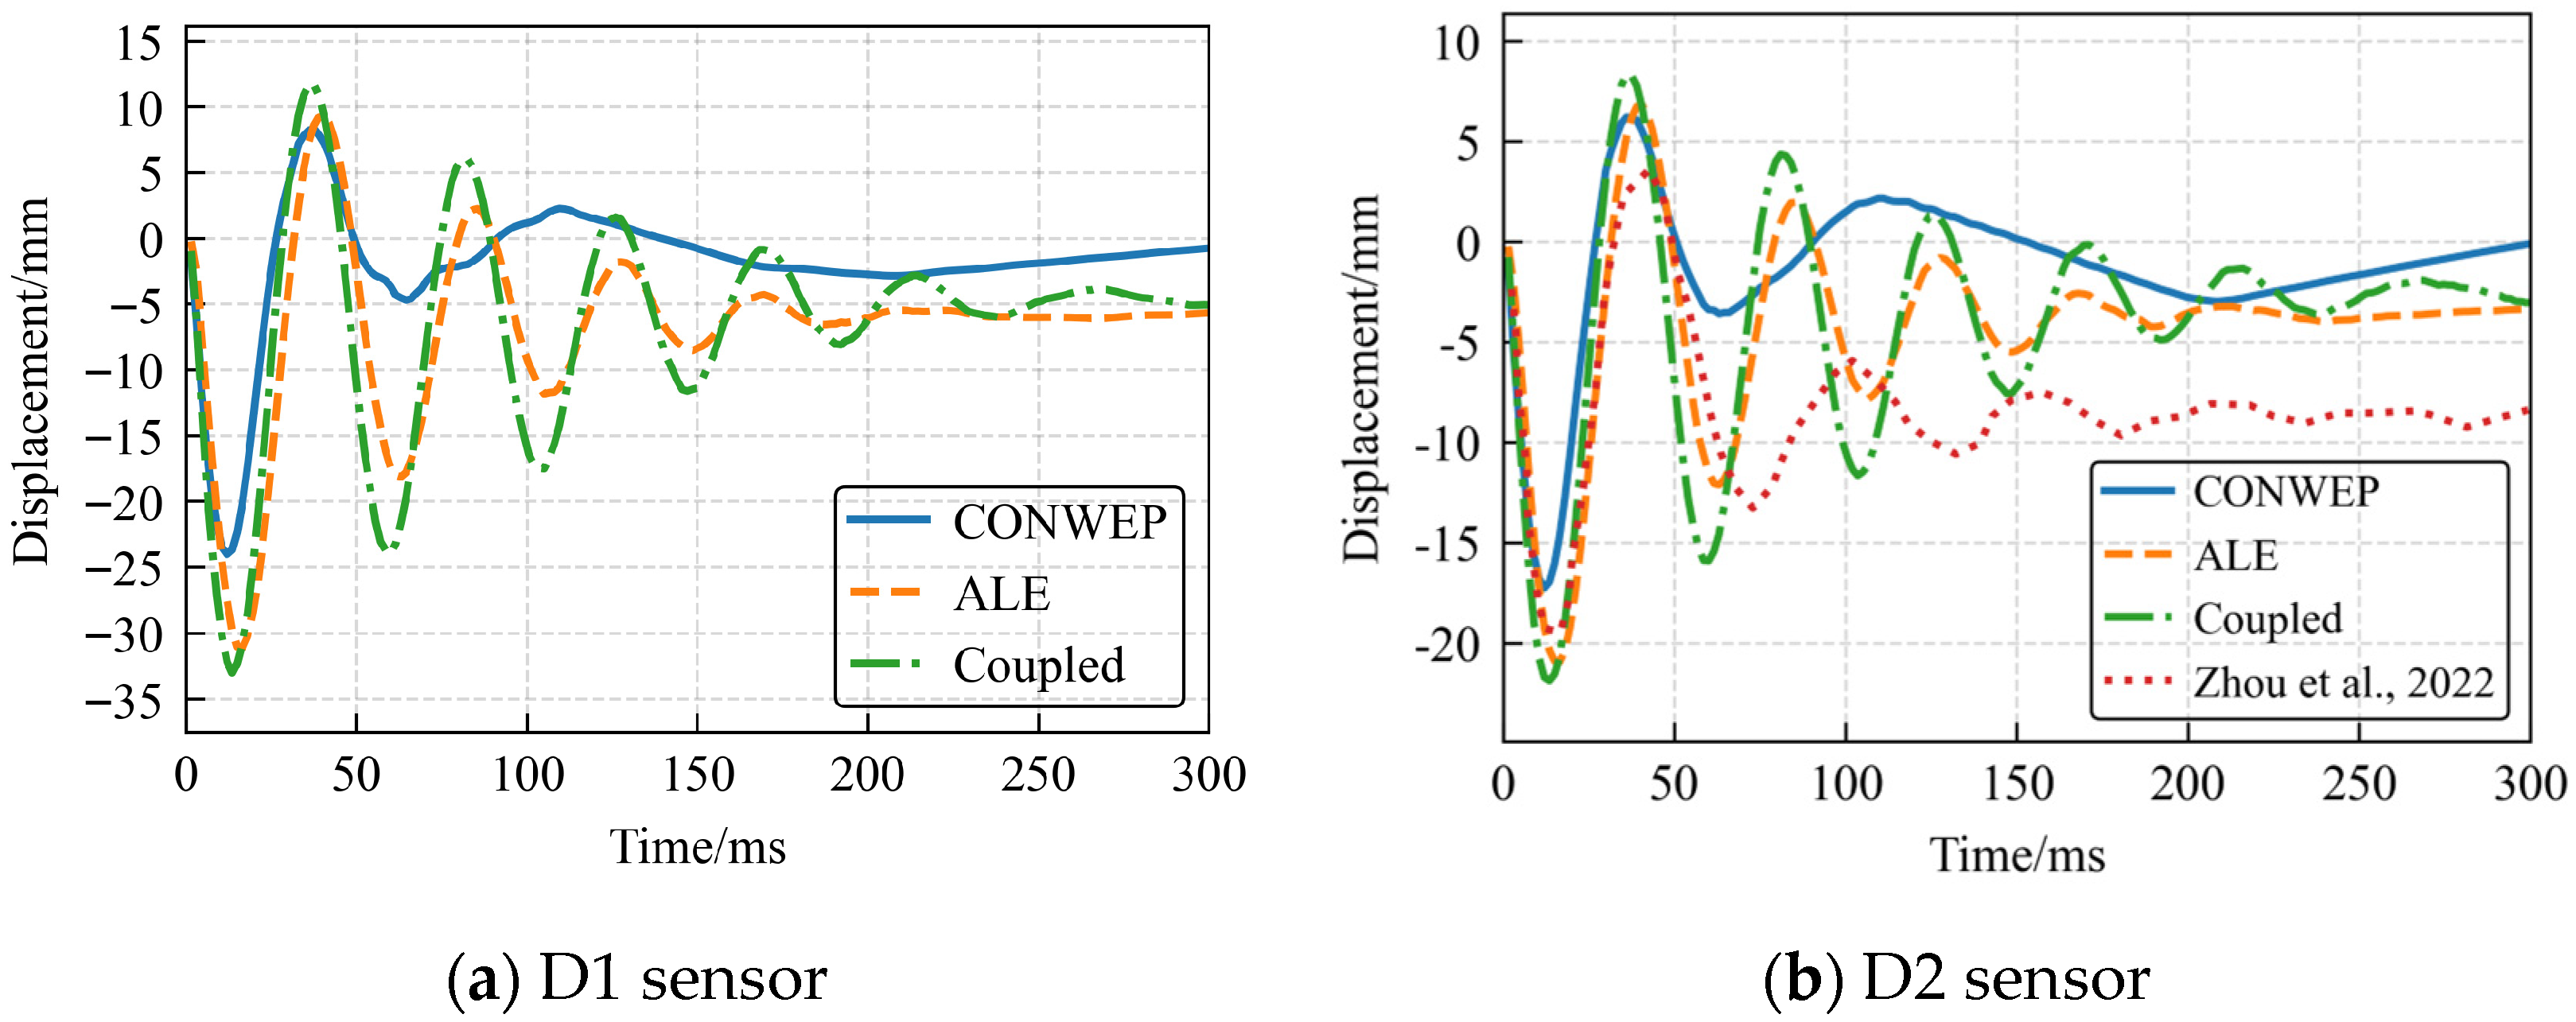
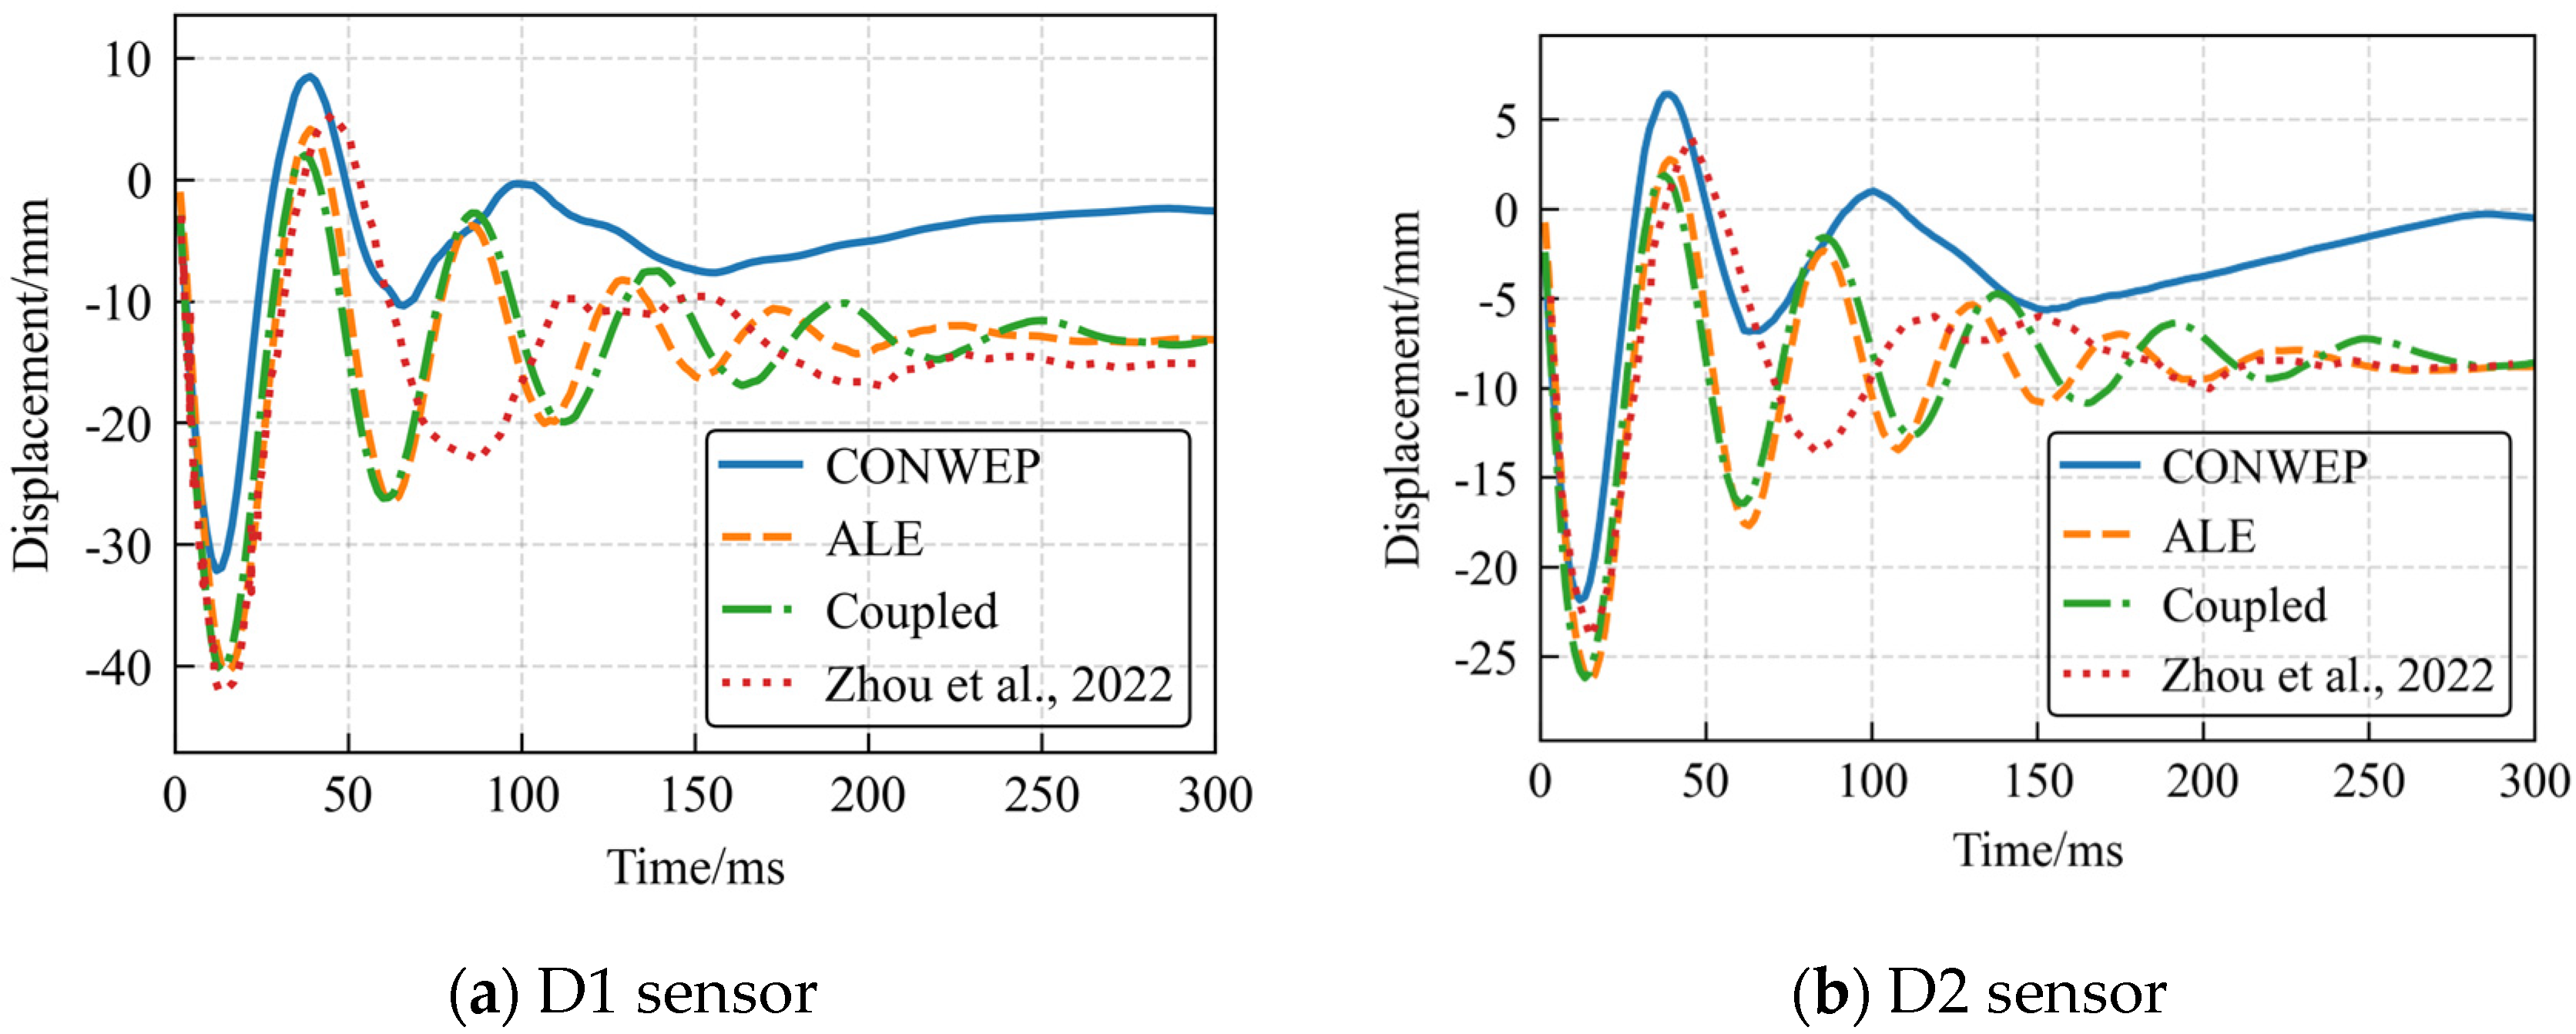
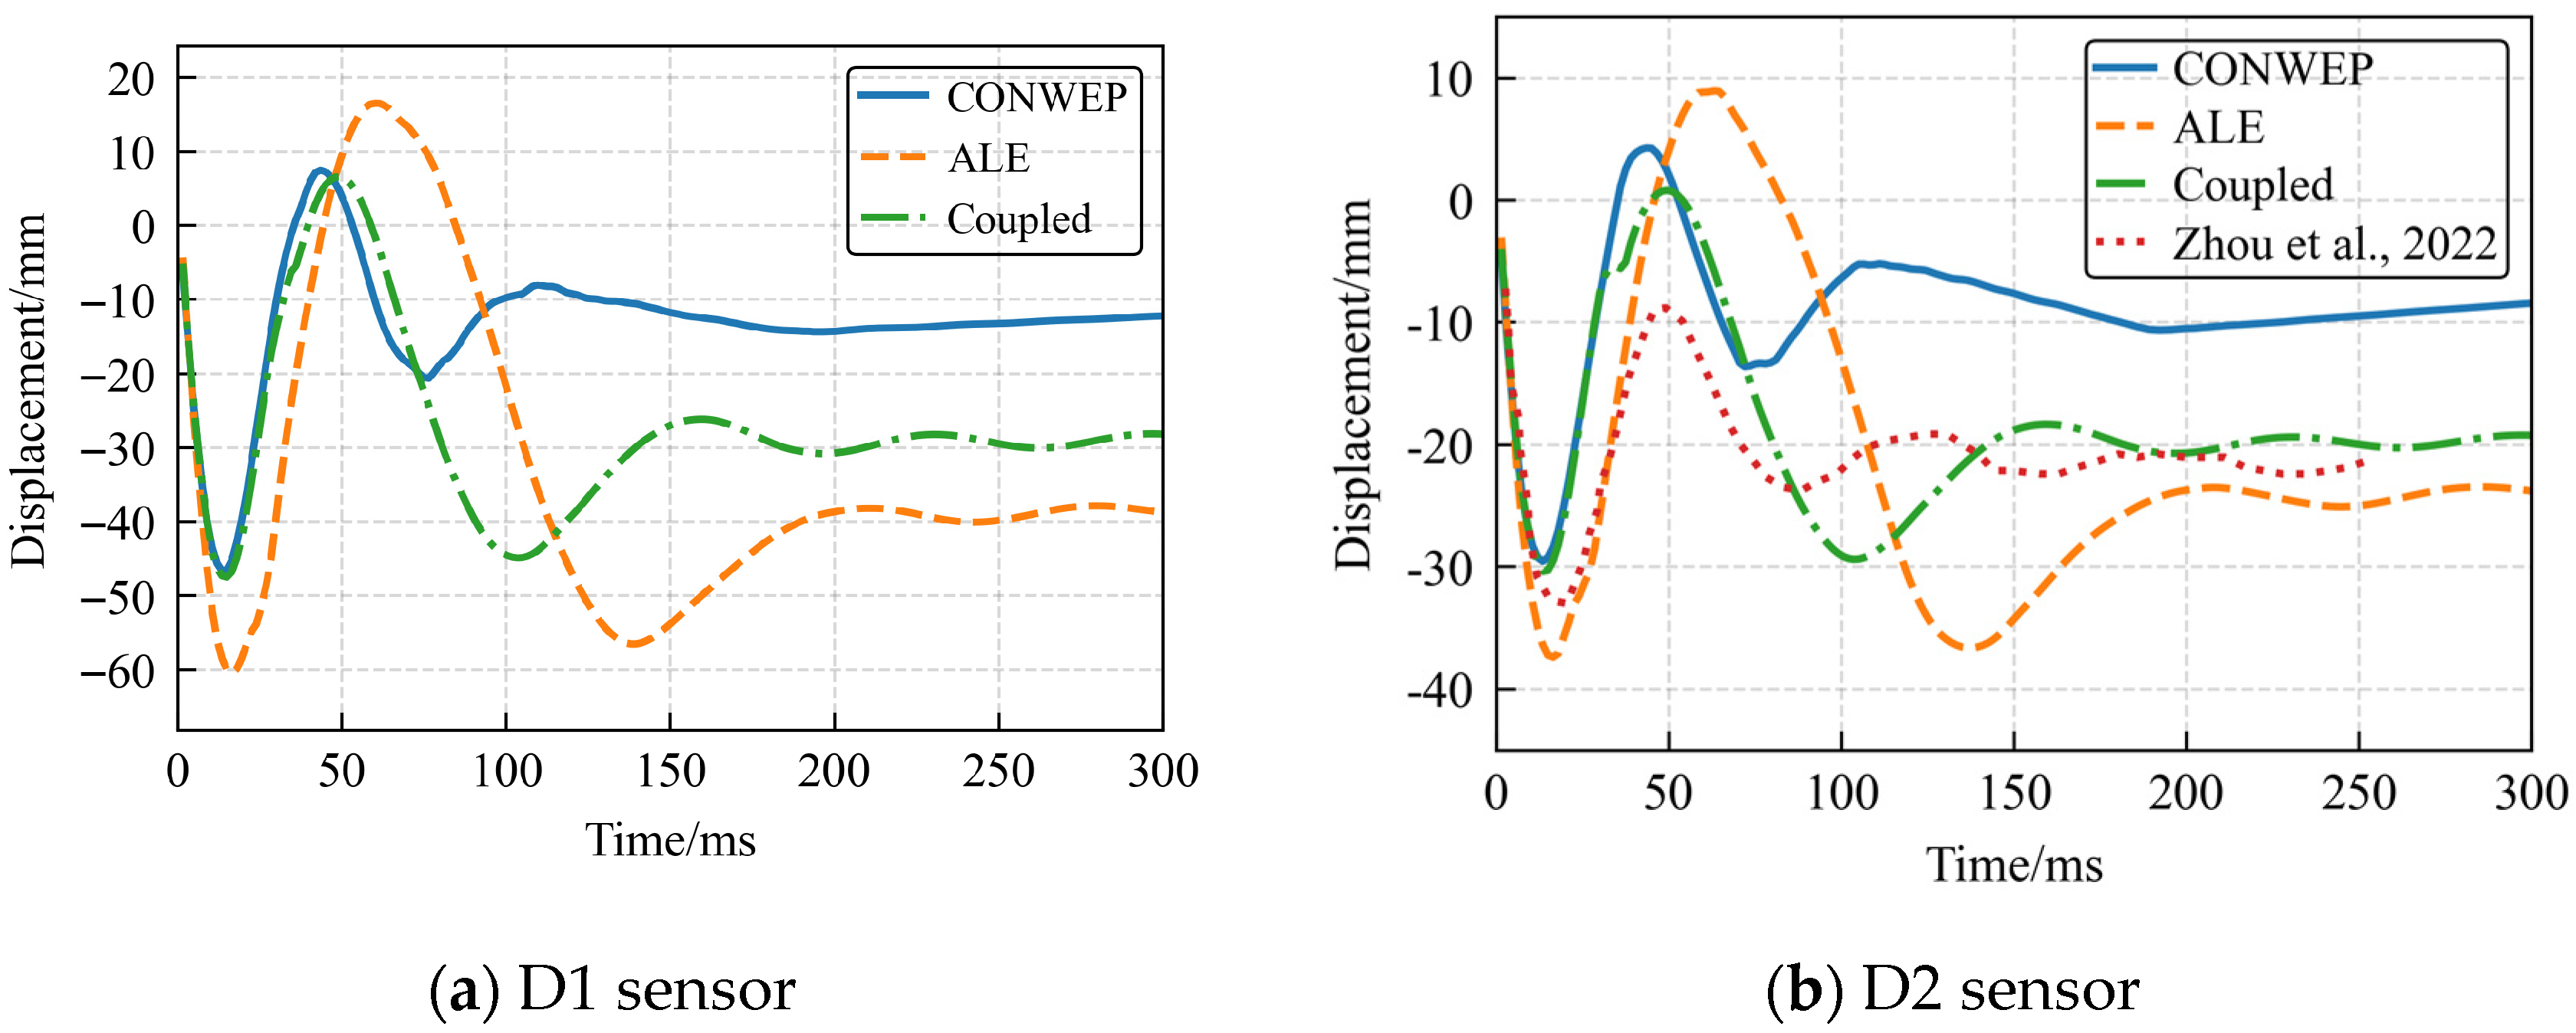
Given that measurement points D2 and D3 are symmetric and exhibit identical displacement responses under ideal simulation conditions, we plotted displacement–time history curves for points D1 and D2 across three test cases (Figure 11, Figure 12 and Figure 13). These curves compare results from the CONWEP algorithm, the ALE algorithm, and the coupled CONWEP-ALE approach. Note: Displacement data for D1 at scaled distances of 1.0 m/kg1/3 and 0.6 m/kg1/3 were unavailable due to sensor detachment during intense slab vibrations [35].
Displacement–time histories at measurement points reveal significant periodic oscillations in all three numerical simulations, consistent with experimental data. This demonstrates the algorithms’ capability to capture fundamental vibration responses of RC slabs under blast loading. The CONWEP algorithm achieves reasonable initial displacement correlation, though deviations progressively amplify over time. This divergence probably stems from its empirical loading formulation’s inability to accurately simulate fluid–structure interaction, compounded by insufficient mesh refinement that accumulates deflection errors in later stages. Conversely, both ALE and CONWEP-ALE coupling algorithms achieve superior peak displacement and period predictions. However, their late-stage response accuracy diminishes as shockwave energy dissipates and complex wave superposition develops in the air domain. At the 0.6 m/kg1/3 scaled distance, all algorithms exhibit amplified oscillation amplitudes and period errors compared to experimental data. An interesting observation is that the vibration simulated by the CONWEP algorithm decays more rapidly than that of the ALE and coupled algorithms (Figure 11, Figure 12 and Figure 13). This is despite the theoretical expectation that the absence of an air medium in the CONWEP model would remove a source of damping. This apparent discrepancy is attributed to the simplifying assumptions of the empirical method. The CONWEP algorithm applies a simplified blast load history, primarily encompassing the positive phase, and cannot capture the complex energy transfer from phenomena such as the negative (suction) phase or the entrapment and re-reflection of pressure waves between the deformed structure and its surroundings. These phenomena, which are naturally simulated in the ALE and CONWEP-ALE methods, act to impart additional energy into the structure, prolonging its vibrational response. Thus, the lack of these effects in the CONWEP model results in a response dominated by structural damping, leading to a quicker decay.
Table 10 summarizes peak and residual displacements recorded at measurement points on the reinforced concrete slab across all test scenarios. The results demonstrate a consistent trend: both displacement metrics systematically increase as scaled distance decreases. This correlation indicates progressively intensified bending deformation under higher blast intensities. Regarding predictive accuracy, the CONWEP algorithm shows deviations of 5–30% when estimating peak displacements. In contrast, both the ALE method and the CONWEP-ALE coupling algorithm achieve significantly higher precision, with prediction errors falling within 0–15%.
Regarding residual displacement, CONWEP shows significant inaccuracies in all scenarios. The ALE algorithm maintains 0–20% errors at 0.8 m/kg1/3 and 0.6 m/kg1/3 scaled distances but reaches 62.92% error at 1.0 m/kg1/3. The CONWEP-ALE coupling algorithm demonstrates approximately 0–20% residual displacement errors at closer scaled distances (0.6 m/kg1/3,0.8 m/kg1/3), matching ALE’s precision while substantially outperforming CONWEP.

4.3. Computational Efficiency

Computational efficiency was evaluated using a 24-core processor for Massively Parallel Processing (MPP) single-precision calculations, with execution times for the CONWEP, ALE, and CONWEP-ALE coupling algorithms across three scenarios detailed in Table 11. Identical mesh discretization was applied to the reinforced concrete slab in all cases. While ALE and coupling algorithms incorporated additional ALE air domain meshing, CONWEP required no such domain.
Analysis reveals: CONWEP algorithm achieved the shortest computation time. The ALE algorithm demonstrated the longest runtime, where the total element count primarily determined efficiency. Scaled distance minimally impacted computation duration for any given algorithm. Notably, the CONWEP-ALE coupling algorithm reduced computation time by approximately 50% compared to the ALE algorithm while maintaining comparable or superior accuracy in predicting overpressure and displacement.
To provide a deeper insight into algorithmic efficiency, Table 11 also presents the computational cost normalized by the seconds per 104 elements. The ALE algorithm shows the lowest normalized cost, indicating efficient per-element calculation within its fluid domain. The CONWEP-ALE coupling algorithm exhibits a higher normalized cost, which can be attributed to the additional computational overhead of the coupling interface (ambient layer). However, this is offset by an approximately 70% reduction in the number of air elements compared to the ALE model. Therefore, while the normalized efficiency of the coupled algorithm is lower, its strategic reduction in problem size results in a superior overall performance in terms of absolute computational time, making it a highly efficient approach for the intended application.

4.4. Discussion on Applicability to Confined and Reflective Conditions

A discussion on the performance of the proposed CONWEP-ALE coupling algorithm under confined or reflective conditions is warranted, given the open-field nature of the CONWEP empirical data. It is important to delineate the scope of the method’s applicability. The algorithm is not intended for scenarios with significant confinement, such as internal explosions in sealed chambers, where the empirical CONWEP input would be inherently inaccurate due to unmodeled global wave trapping and superposition.
However, the strength of the proposed CONWEP-ALE coupling algorithm is its demonstrated capability to handle localized reflections in the immediate vicinity of the structural component. In such scenarios, the CONWEP load provides an efficient representation of the initial, incident far-field shockwave. The ALE domain can be strategically designed to encompass any nearby reflective surfaces.
In summary, while the coupled algorithm inherits the inherent limitations of the CONWEP model for scenarios involving significant confinement, it avoids the prohibitive computational cost of a full-scale ALE simulation of the entire environment. This positions the CONWEP-ALE coupling algorithm as a balanced and efficient solution for a wide range of practical engineering scenarios where accuracy and computational cost are both paramount.
5. Conclusions

This study leverages existing blast test data for reinforced concrete slabs to evaluate three numerical methods—CONWEP, ALE, and CONWEP-ALE coupling—across three scaled distances. Key findings reveal:
  • The CONWEP-ALE coupling algorithm demonstrates higher computational efficiency compared to the ALE algorithm. For the specific blast scenarios, the CONWEP-ALE coupling algorithm reduces computation time by approximately 50% compared to the ALE algorithm.
  • In terms of incident overpressure prediction, the CONWEP-ALE coupling algorithm achieved the lowest average error. Its error rate was 23.23% across the three tested conditions and this performance was superior to the CONWEP (27.22%) and ALE (30.71%) algorithms. Therefore, the CONWEP-ALE coupling algorithm is more reliable and accurate in predicting the incident overpressure for this specific case.
  • In predicting peak displacement, both ALE and CONWEP-ALE coupling algorithms confine errors within 0–15%, outperforming the CONWEP algorithm. For residual displacement, CONWEP algorithm shows significant errors across all distances. ALE and coupled algorithms maintain 0–20% accuracy at 0.6–0.8 m/kg1/3. In conclusion, both the ALE and CONWEP-ALE coupling algorithms demonstrate superior accuracy over the CONWEP algorithm in predicting the displacement.
It is important to note that the quantitative results, including the reported average overpressure error of 23.23%, are specific to the conditions of this study, namely cylindrical TNT charges and a scaled distance range of 0.6 to 1.0 m/kg1/3. While the proposed coupling methodology is general and can, in principle, accommodate different charge geometries through the CONWEP input, its quantitative performance for spherical, hemispherical, or other charge configurations should be validated in future work.

Author Contributions

Conceptualization, C.W., W.L. and K.Z.; methodology, K.Z., W.L. and P.L.; software, C.W.; validation, C.W. and K.Z.; formal analysis, C.W.; resources, W.L. and P.L.; data curation, C.W.; writing—original draft preparation, C.W.; writing—review and editing, W.L. and K.Z.; supervision, P.L.; project administration, W.L. All authors have read and agreed to the published version of the manuscript.

Funding

This research received no external funding.

Institutional Review Board Statement

Not applicable.

Informed Consent Statement

Not applicable.

Data Availability Statement

The original contributions presented in this study are included in the article. Further inquiries can be directed to the corresponding author.

Conflicts of Interest

The authors declare no conflicts of interest.

References

  1. Fareed, S.; Asad, J.; Khan, AuR. Simulation of Reinforced Concrete Slabs in Residential Buildings Under Internal Gas Blast. Arab. J. Sci. Eng. 2025, 50, 1833–1850. [Google Scholar] [CrossRef]
  2. Lin, H.; Han, C.; Yang, L.; Zhang, L.; Luan, H.; Han, P.; Xu, H.; Zhang, S. Numerical Investigation on Performance Optimization of Offshore Sandwich Blast Walls with Different Honeycomb Cores Subjected to Blast Loading. J. Mar. Sci. Eng. 2022, 10, 1743. [Google Scholar] [CrossRef]
  3. Kim, S.; Jang, T.; Oli, T.; Park, C. Behavior of Barrier Wall under Hydrogen Storage Tank Explosion with Simulation and TNT Equivalent Weight Method. Appl. Sci. 2023, 13, 3744. [Google Scholar] [CrossRef]
  4. Tian, S.; Yan, Q.; Du, X.; Chen, F.; Zhang, B. Experimental and numerical studies on the dynamic response of precast concrete slabs under blast load. J. Build. Eng. 2023, 70, 106425. [Google Scholar] [CrossRef]
  5. Santos, A.P.; Castedo, R.; López, L.M.; Chiquito, M.; Yenes, J.I.; Alañón, A.; Costamagna, E.; Martínez-Almajano, S. Reinforced Concrete Building with IED Detonation: Test and Simulation. Appl. Sci. 2022, 12, 7803. [Google Scholar] [CrossRef]
  6. Goel, M.D.; Jagrit, V.; Panchal, S. Numerical Simulation of Explosive Storage Underground Structure Subjected to Blast. Int. J. Struct. Stab. Dyn. 2025, 25, 2440005. [Google Scholar] [CrossRef]
  7. Shirbhate, P.A.; Goel, M.D. Investigation of effect of perforations in honeycomb sandwich structure for enhanced blast load mitigation. Mech. Adv. Mater. Struct. 2023, 30, 3463–3478. [Google Scholar] [CrossRef]
  8. Kumar, V.; Iqbal, M.A.; Kartik, K.V. Experimental and Finite Element Study on Performance of RC Panels Subjected to Nearby Explosion. Int. J. Civ. Eng. 2024, 22, 397–420. [Google Scholar] [CrossRef]
  9. Wang, W.; Zhang, C.; Yang, G. Anti-explosion Performance of a New Type of Polyurea-Coated Corrugated Steel Plate Reinforced Concrete Slab. Int. J. Concr. Struct. Mater. 2024, 18, 42. [Google Scholar] [CrossRef]
  10. Zhao, H.; Zhao, X.; Fang, H.; Jia, Y.; Sun, J. The destructive form and response analysis of buried concrete pipes under the action of internal explosion loads. Eng. Fail. Anal. 2024, 161, 108306. [Google Scholar] [CrossRef]
  11. Zhou, F.; Li, H.; Wu, H. Numerical study on local failures of reinforced concrete slabs against underwater close-in explosions. J. Zhejiang Univ. Sci. 2024, 25, 650–669. [Google Scholar] [CrossRef]
  12. Song, R.-F.; Li, L.-S.; Ma, S.-J. Numerical Simulation of Contact Explosion on Reinforced Concrete Slabs Based on Different Algorithms. Adv. Civ. Eng. 2024, 2024, 1789656. [Google Scholar] [CrossRef]
  13. Yu, J.; Liang, S.; Ren, Z.; Deng, Y.; Fang, Q. Structural behavior of steel-concrete-steel and steel-ultra-high-performance-concrete-steel composite panels subjected to near-field blast load. J. Constr. Steel Res. 2023, 210, 108108. [Google Scholar] [CrossRef]
  14. Wu, J.; Liu, Z.; Yu, J.; Xu, S. Experimental and numerical investigation of normal reinforced concrete panel strengthened with polyurea under near-field explosion. J. Build. Eng. 2022, 46, 103763. [Google Scholar] [CrossRef]
  15. Lee, M.; Kwak, H.-G.; Kim, S.-W.; Park, G.-K. Numerical study on RC and HPFRCC slabs exposed to TNT explosion near ground. Comput. Concrete 2023, 31, 561–570. [Google Scholar] [CrossRef]
  16. Jiang, J.; Xia, C.; Yao, J.; Sun, Q.; Xia, H. Vulnerability analysis of HSR bridge under near-field blast based on response surface method. Structures 2023, 55, 983–994. [Google Scholar] [CrossRef]
  17. Guo, B.; Liang, W.; Xu, X.; Song, S.; Fu, Q.; Liu, S. Study on the Characteristics of Internal Explosion Loads in Masonry-Infilled Reinforced Concrete Frame Structures. J. Build. Eng. 2025, 111, 113243. [Google Scholar] [CrossRef]
  18. Wijesooriya, K.; Mohotti, D.; Fernando, P.; Nishshanka, B.; Lee, C.-K.; Remennikov, A. Investigation of band-beam slabs subjected to close-in blast loading-Experimental and numerical study. J. Build. Eng. 2024, 98, 111446. [Google Scholar] [CrossRef]
  19. Fan, Y.; Yang, G.; Tian, X.; Ding, S.; Li, Q.; Zhou, T.; Peng, T.; Tian, B. Experimental and numerical investigation on normal strength and high strength RC arches subjected to underwater explosions. Eng. Struct. 2025, 322, 119138. [Google Scholar] [CrossRef]
  20. Zhou, L.; Li, X.; Yan, Q. Dynamic response and vulnerability analysis of pier under near-field underwater explosion. Eng. Fail. Anal. 2024, 155, 107749. [Google Scholar] [CrossRef]
  21. Li, J.; Wu, C.; Hao, H. Investigation of ultra-high performance concrete slab and normal strength concrete slab under contact explosion. Eng. Struct. 2015, 102, 395–408. [Google Scholar] [CrossRef]
  22. Liu, Z.; Yu, W.; Wu, G.; Zhang, Z. Investigate on dynamic mechanical and mesoscopic damage characteristics of high-temperature treated granite based on SPH-FEM coupling algorithm. J. Mater. Res. Technol. 2025, 36, 1891–1911. [Google Scholar] [CrossRef]
  23. Peng, Y.; Wu, C.; Li, J.; Liu, J.; Liang, X. Mesoscale analysis on ultra-high performance steel fibre reinforced concrete slabs under contact explosions. Compos. Struct. 2019, 228, 111322. [Google Scholar] [CrossRef]
  24. Erdik, A.; Uçar, V. On Evaluation and Comparison of Blast Loading Methods Used In Numerical Simulations. Sak. Univ. J. Sci. 2018, 22, 1385–1391. [Google Scholar] [CrossRef]
  25. Nian, X.Z.; Xie, Q.M.; Huang, K. Experimental and numerical study on protective effect of RC blast wall against air shock wave. Def. Technol. 2024, 31, 567–579. [Google Scholar] [CrossRef]
  26. UFC 3-340-02; Unified Facilities Criteria (UFC): Structures to Resist the Effects of Accidental Explosions. Department of Defense: Washington, DC, USA, 2008.
  27. Prado, A.; Alañón, A.; Castedo, R.; Santos, A.; López, L.; Chiquito, M.; Bermejo, M.; Oggeri, C. Resistance of full-scale beams against close-in explosions. Numerical modeling and field tests. Def. Technol. 2024, 40, 35–47. [Google Scholar] [CrossRef]
  28. Yang, S.; Liang, Z.; Xu, X.; Ning, J. A numerical simulation method for fragments distribution of concrete subjected to blast loading. Eng. Fail. Anal. 2025, 176, 109606. [Google Scholar] [CrossRef]
  29. Liu, Z.; Zhao, X.; Liu, D.; Wang, G.; Shi, M. Comparative study on blast damage features of reinforced concrete slabs with polyurethane sacrificial cladding based on different numerical simulation methods. Polymers 2022, 14, 3857. [Google Scholar] [CrossRef]
  30. Basting, S.; Quaini, A.; Čanić, S. Extended ALE method for fluid–structure interaction problems with large structural displacements. J. Comput. Phys. 2017, 331, 312–336. [Google Scholar] [CrossRef]
  31. Souli, M.; Ouahsine, A.; Lewin, L. ALE formulation for fluid–structure interaction problems. Comput. Methods Appl. Mech. Eng. 2000, 190, 659–675. [Google Scholar] [CrossRef]
  32. Al-Salloum, Y.A.; Almusallam, T.H.; Khawaji, M.Y. Progressive collapse analysis of RC buildings against internal blast. Adv. Struct. Eng. 2015, 18, 2181–2192. [Google Scholar] [CrossRef]
  33. Kinney, G.F.; Graham, K.J. Explosive Shocks in Air; Springer Science & Business Media: Berlin/Heidelberg, Germany, 2013. [Google Scholar]
  34. Su, Q.; Wu, H.; Sun, H.; Fang, Q. Experimental and numerical studies on dynamic behavior of reinforced UHPC panel under medium-range explosions. Int. J. Impact Eng. 2021, 148, 103761. [Google Scholar] [CrossRef]
  35. Zhou, Z.; Yan, Q.; Tian, S.; Wu, J.; Li, J. Experimental Study on Antiexplosion Performance of Precast Concrete Slabs Under Explosion Load. J. Tianjin Univ. 2022, 55, 611–620. Available online: https://d.wanfangdata.com.cn/periodical/CiFQZXJpb2RpY2FsQ0hJU29scjlTMjAyNTEwMjEwOTUwNDYSEnRpYW5qZHh4YjIwMjIwNjAwNxoIdms5cHMyYzk%3D (accessed on 13 November 2025). (In Chinese).
  36. Su, Q.; Wu, H.; Fang, Q. Calibration of KCC model for UHPC under impact and blast loadings. Cem. Concr. Compos. 2022, 127, 104401. [Google Scholar] [CrossRef]
  37. Peng, Q.; Wu, H.; Jia, P. Numerical studies on rebar-concrete interactions of RC members under impact and explosion. Structures 2023, 47, 63–80. [Google Scholar] [CrossRef]
  38. Altunışık, A.C.; Önalan, F.; Sunca, F. Effects of Concrete Strength and Openings in Infill Walls on Blasting Responses of RC Buildings Subjected to TNT Explosive. Iran. J. Sci. Technol. Trans. Civ. Eng. 2021, 45, 2525–2554. [Google Scholar] [CrossRef]
  39. Chen, G.; Wu, H.; Ou, Y.; Wang, F.; Lü, J. Destruction analysis of RC frame structure with infill walls under internal explosion. J. Vib. Shock 2025, 44, 289–301. [Google Scholar] [CrossRef]
  40. Dobratz, B.M.; Crawford, P.C. LLNL Explosives Handbook: Properties of Chemical Explosives and Explosive Simulants; Lawrence Livermore National Laboratory: Livermore, CA, USA, 1985. Available online: https://sciarium.com/file/63644/ (accessed on 1 August 2025).
  41. Lee, E.; Finger, M.; Collins, W. JWL Equation of State Coefficients for High Explosives; Lawrence Livermore National Laboratory: Livermore, CA, USA, 1973.
  42. Mu, M.; Liu, F.; Li, J.; He, F. Influence of modified polyurea coating thickness on the blast resistance of RC slab. Structures 2024, 67, 107009. [Google Scholar] [CrossRef]
Figure 1. Photograph of RC slab blast test setup by Su et al. [34].
Applsci 15 12162 g001
Figure 2. RC slab reinforcement distribution diagram [35].
Applsci 15 12162 g002
Figure 3. Displacement sensor distribution diagram.
Applsci 15 12162 g003
Figure 4. (a) CONWEP algorithm model; (b) ALE algorithm model; (c) CONWEP-ALE coupling algorithm model.
Applsci 15 12162 g004
Figure 5. Pressure Distribution of the CONWEP Algorithm.
Applsci 15 12162 g005
Figure 6. Shockwave propagation process of ALE algorithm.
Applsci 15 12162 g006
Figure 7. Shockwave propagation process of CONWEP-ALE coupling algorithm.
Applsci 15 12162 g007
Figure 8. Incident overpressure-time history (1.0 m/kg1/3). The experimental data of incident overpressure is derived from the explosion tests conducted by Zhou et al. [35].
Applsci 15 12162 g008
Figure 9. Incident overpressure-time history (0.8 m/kg1/3). The experimental data of incident overpressure is derived from the explosion tests conducted by Zhou et al. [35].
Applsci 15 12162 g009
Figure 10. Incident overpressure-time history (0.6 m/kg1/3). The experimental data of incident overpressure is derived from the explosion tests conducted by Zhou et al. [35].
Applsci 15 12162 g010
Figure 11. Displacement–time histories (1.0 m/kg1/3). The experimental data of displacement is derived from the explosion tests conducted by Zhou et al. [35].
Applsci 15 12162 g011
Figure 12. Displacement–time histories (0.8 m/kg1/3). The experimental data of displacement is derived from the explosion tests conducted by Zhou et al. [35].
Applsci 15 12162 g012
Figure 13. Displacement–time histories (0.6 m/kg1/3). The experimental data of displacement is derived from the explosion tests conducted by Zhou et al. [35].
Applsci 15 12162 g013
Table 1. Material parameters of concrete.
Density/(kg/m3)Poisson’s RatioCompressive Strength/MPa
24000.2330.4
Table 2. Material parameters of rebar [34].
Density/(kg/m3)Young’s Modulus/GPaTangent Modulus/GPaPoisson’s RatioYield Stress/MPaCPFailure Strain
78501841.420.34804050.05
Table 3. Material parameters of TNT [41].
Density/(kg/m3)Detonation Velocity/(m/s)Chapman–Jouguet Pressure/GPaA/GPaB/GPa R 1 R 2 ω E 0 /(J/m3)
1630693021373.83.7474.150.90.356 × 109
Table 4. Material parameters of air.
Density/(kg/m3) C 0 C 1 C 2 C 3 C 4 C 5 C 6 E 0 /(J/m3)
1.184500000.40.402.53 × 105
Table 5. Mesh convergence study for the air domain.
Mesh Size/mmTotal Element CountPeak Incident Overpressure/MPaError in Peak Incident Overpressure/%Computation Time/s
4061,5451.69511.72268
3096,8751.7459.11451
20242,0141.7628.231065
101,685,7641.7658.077403
Table 6. Summary of finite element modeling parameters.
ComponentElement TypeMesh Size/mElement Formulation
Concrete Slab8-node solid element0.02Constant stress solid element
Rebar2-node beam element0.01 (Diameter)Hughes-Liu with cross section integration
Support8-node solid element0.02Constant stress solid element
Air8-node solid element0.021 point ALE multi—material element
Table 7. Numerical simulation of working conditions.
CaseTNT Weight/kgScaled Distance/(m/kg1/3)Standoff Distance/m
141.01.59
240.81.27
340.60.95
Table 8. Comparison of peak incident overpressure.
Scaled Distance/(m/kg1/3)Test/MPaCONWEP/MPaRelative Error/%ALE/MPaRelative Error/%Coupled/MPaRelative
Error/%
1.01.3500.94230.220.73845.330.85636.60
0.81.6401.5386.221.08333.961.23224.88
0.61.9202.78845.211.67312.861.7628.23
Table 9. Sensitivity analysis of numerical parameters (0.8 m/kg1/3).
CaseAmbient Layer Thickness/mALE Domain Height/mPeak Incident Overpressure/MPaError in Peak Incident Overpressure/%
10.020.61.23224.88 (Baseline)
20.040.61.22125.55 (+0.67)
30.060.61.21525.91 (+1.03)
40.020.41.24524.09 (−0.79)
50.020.81.21725.79 (+0.91)
Note: The error values for all cases are presented as the relative deviation from the experimental peak overpressure. The configuration selected for the main study (Case 1: 0.02 m thickness, 0.6 m height) is highlighted as the Baseline.
Table 10. Comparison of peak and residual RC plate displacements.
Scaled Distance (m/kg1/3)SensorsPeak Displacement/mmResidual Displacement/mm
TestCONWEPError/%ALEError/%CoupledError/%TestCONWEPError/%ALEError/%CoupledError/%
1.0D132.9624.0027.2531.115.6133.010.15-0.74-5.66-5.06-
D220.0117.2513.8020.934.6021.879.308.980.0899.113.3362.923.0266.37
0.8D143.4832.1226.1340.556.7440.347.2215.512.5783.4313.1515.2213.1415.28
D223.9521.848.8126.3910.1926.209.398.830.4994.458.800.348.582.83
0.6D1-46.61-60.50-47.50--12.21-38.80-28.19-
D235.3429.5416.4137.385.7730.3414.1522.448.4262.4823.796.0219.2314.30
Table 11. Computation time comparison.
Calculation MethodScaled Distance/(m/kg1/3)ALE Air Element CountTotal Element CountCPU Time/sSeconds per 104 Elements/s
CONWEP1.0035,76430785.8
0.829783.0
0.631688.4
ALE1.0687,500723,264212129.3
0.8207428.7
0.6214529.7
Coupled1.0206,250242,014113647.0
0.8107944.6
0.6106544.0
Disclaimer/Publisher’s Note: The statements, opinions and data contained in all publications are solely those of the individual author(s) and contributor(s) and not of MDPI and/or the editor(s). MDPI and/or the editor(s) disclaim responsibility for any injury to people or property resulting from any ideas, methods, instructions or products referred to in the content.