Article

A Streamlined Polynomial Regression-Based Modeling of Speed-Driven Hermetic-Reciprocating Compressors

by
Jay Wang
1,* and
Wei Lu
1,2
1
School of Engineering, Computer & Mathematical Sciences, Auckland University of Technology, Auckland 1010, New Zealand
2
Guangdong Provincial Mechanical Engineering Experimental Teaching Center, Guangdong Technology College, Zhaoqing 266041, China
*
Author to whom correspondence should be addressed.
Appl. Sci. 2025, 15(22), 12016; https://doi.org/10.3390/app152212016
Submission received: 22 October 2025 / Revised: 9 November 2025 / Accepted: 11 November 2025 / Published: 12 November 2025
(This article belongs to the Section Mechanical Engineering)

Abstract

This study presents a streamlined and accurate approach for modeling the performance of hermetic reciprocating compressors under variable-speed conditions. Traditional compressor models often neglect the influence of motor frequency, leading to considerable deviations at low-speed operation. To address these limitations, a frequency-dependent numerical framework was developed using one-dimensional (1-D) and two-dimensional (2-D) polynomial regressions to represent volumetric efficiency ( η v ) and isentropic efficiency ( η i s e n t r ) as functions of compression ratio (r) and motor speed frequency (f). The proposed model integrates manufacturer data and thermodynamic property databases to predict compressor behavior across a wide range of operating conditions. Validation using the Bitzer 4HTE-20K CO2 compressor demonstrated strong agreement with experimental data, maintaining prediction errors within ±10% for both power input and discharge temperature. Moreover, the model enhanced accuracy by up to 19.4% in the low-frequency range below 40 Hz, where conventional models typically fail. The proposed method provides a practical and computationally efficient tool for accurately simulating the performance of hermetic reciprocating compressors that support improved design, optimization, and control of refrigeration and heat pump systems.

1. Introduction

As a fundamental component in refrigeration and heat pump systems, compressors are categorized into four main types: axial, centrifugal, reciprocating [1], and rotary compressors [2]. Among these, reciprocating compressors find extensive application in small to medium-sized vapor-compression systems for refrigeration, air conditioning, and heat pumps, due to their exceptional compression efficiency [3], straightforward construction, and versatility under diverse operating conditions [4]. Specifically, hermetic reciprocating compressors achieve an optimal balance among operational performance, system reliability, and upfront cost, establishing them as a favored option in both refrigeration and heat pump setups [5]. In heating and cooling systems, the compressor’s primary role is to elevate the gaseous refrigerant from a low-temperature and low-pressure state to a high-temperature and high-pressure state, typically through volume reduction [6]. A hermetic reciprocating compressor functions via a piston that oscillates within a sealed cylinder to compress the refrigerant gas [2]. These compressors are particularly well-suited for refrigerants, such as R12, R-134a, R22, and R744 that demand relatively low displacement volumes and condense at comparatively high pressures [7].
Accurate modelling of compressor performance plays a vital role in system design, optimization, and control. Over time, diverse modelling methodologies, that is, from empirical correlations to detailed thermodynamic simulations have been introduced [8]. The research group led by Perez-Segarra [9] introduced a thermodynamic simulation approach for hermetic reciprocating compressors, emphasizing the decomposition of key efficiencies, such as volumetric, isentropic, and combined mechanical-electrical efficiency into fundamental physical sub-processes to enable deeper performance insights [10]. These efficiencies were examined by accounting for multiple influencing factors, including pressure losses, heat transfer, leakage, valve dynamics, and exergy destruction [11]. The resulting criteria have proven valuable for comparison, characterization, and optimization efforts. Wang and colleagues developed a numerical model for semi-reciprocating compressors in CO2 heat pumps [12]; however, its applicability is limited to variable-speed operating conditions. Although the model has been validated with reasonable agreement, that is partially due to limited experimental data being available in the low-frequency motor speed range. A study by Dutra and Deschamps [13] introduced an integrated simulation model for hermetic reciprocating compressors, which combine thermodynamic, thermal, and electrical sub-models to forecast compressor performance, temperature profiles, and motor behaviour. Simulation results demonstrated deviations as low as 5.3% in volumetric efficiency ( η v o l u m ) and 5.6% in isentropic efficiency ( η i s e n t r ) under high-pressure ratio conditions (evaporating at −35 °C and condensing at 70 °C), surpassing conventional models that exhibited deviations of 10.2% and 7.8%, respectively. The model also precisely predicts electric motor performance, with torque and efficiency calculations closely matching experimental data and a maximum efficiency deviation of only 1.5%. Furthermore, it quantifies the influence of input voltage on motor temperature, indicating a 5.7 °C rise when voltage increases from 228 V to 255 V under low-torque operation, while motor efficiency declines from 74.5% to 71.1%. In addition, while machine learning models and hybrid physics-enhanced hybrid methods can capture strong nonlinearities, they typically require large datasets and have limited interpretability. The proposed polynomial regression framework offers a simpler, data-efficient, and computationally efficient alternative that maintains physical meaning and sufficient accuracy for compressor modelling.
Despite numerous efforts to accurately predict compressor performance, existing models often prove either overly complex that requires consideration of numerous interdependent parameters or insufficiently accurate when applied to variable-speed or low-frequency operations. Many simplified numerical models neglect motor-related effects, which limit their applicability across the full operating range and leave gaps in the understanding of compressor behavior under diverse conditions. Furthermore, several studies assume that both volumetric efficiency ( η v o l u m ) and isentropic efficiency ( η i s e n t r ) remain constant [14], whereas in practice, both vary significantly with motor frequency [15]. This variation becomes particularly pronounced at lower speeds (below 40 Hz), where even small frequency differences (e.g., 5 Hz) can lead to substantial deviations, especially for η i s e n t r . The absence of a comprehensive frequency-dependent analytical framework further constrains the accurate characterization of compressor performance across varying operating scenarios. Addressing these limitations through a more precise and frequency-sensitive modeling approach can substantially enhance simulation accuracy, thereby improving system optimization, energy efficiency assessments, and reliability in predicting compressor behavior across the entire operating range.
To address these challenges, this study proposes an integrated frequency-dependent numerical model that employs a combination of 1-D and 2-D polynomial regressions to estimate both volumetric and isentropic efficiencies based on compression ratio and frequency. Input data sourced from manufacturer software, including tools such as Bitzer’s online platform as well as thermodynamic properties from CoolProp and NIST RefProp, are used to inform the model across a broad spectrum of operating conditions. Designed to characterize the performance of speed-driven compressors operating between 25 Hz and 70 Hz, the model places particular emphasis on enhancing predictive accuracy at lower speeds.
Unlike conventional manufacturer-based correlations that express compressor efficiency as fixed empirical functions of pressure ratio, and physics-based models that rely on detailed geometry and thermodynamic analysis, the proposed frequency-dependent 1-D and 2-D polynomial regression framework directly links efficiency to both compression ratio and motor frequency. This approach offers a simple alternative that accurately captures variable-speed behavior while maintaining computational efficiency.

2. Methodology

2.1. Analytical Procedures

The polynomial correlations for volumetric and isentropic efficiencies of a hermetic reciprocating compressor can be developed through a structured procedure, as outlined in Figure 1. The process begins by selecting multiple operating points across the compressor’s full working range. Key input parameters include evaporation temperature (or pressure) and discharge pressure (Input 1), suction superheat (Input 2), and compressor frequency (Input 3). These inputs are processed using manufacturer-provided software, such as the Bitzer online tool V7.1.1.0 [16], to obtain key performance indicators including mass flow rate and compressor power input, which is under the specified operating conditions. Concurrently, thermodynamic properties of the refrigerant at both suction and discharge states (such as, enthalpy and density) are determined based on the selected operating conditions. These properties, together with known compressor specifications (including revolutions per minute and displacement rate), are used to compute the compressor efficiencies. Volumetric efficiency is derived from the mass flow rate, refrigerant properties, and compressor parameters, isentropic efficiency is calculated using state properties and compressor power input [17]. The resulting efficiency values are then fitted using polynomial regression techniques. First, 1-D correlations are developed as functions of compression ratio (r). Subsequently, 2-D polynomial models are established that incorporate both compression ratio (r) and frequency (f) to accurately represent the influence of varying operating conditions on compressor performance.

2.2. Mathematical Model

The compressor work is fundamentally modelled as an adiabatic process; however, it is explicitly treated as non-isentropic to account for irreversible losses inherent in real-world operation. This adiabatic yet non-isentropic assumption ensures that the model realistically captures the actual thermodynamic behaviour, where entropy generation due to factors such as fluid friction, mechanical inefficiencies, and heat dissipation is considered, thereby providing a more accurate representation of the energy transfer within the compressor.
The operational framework of the model requires several key inputs. Primary among these are the operating conditions, which include the frequency (f), the evaporation temperature ( T e v a ), the degree of suction gas superheat (Δ T s u p e r ), and the system discharge pressure ( P d i s ). Additionally, essential technical specifications for the selected compressor type must be provided. A critical parameter is the displacement rate ( V s _ r e f ), which is typically defined at a referenced operating frequency, such as 50 Hz, and serves as a baseline for calculating volumetric performance across other speed conditions. Within the performance modeling framework, the mass flow rate ( m ˙ c o m p ) through a single semi-hermetic reciprocating compressor is formulated as follows:
m ˙ c o m p = η v × V s _ r e f ×   ρ s u c ×   f f r e f
where η v represents the volumetric efficiency of the compressor, and ρ s u c denotes the density of the refrigerant at the suction state. This suction density is a state function, the value of which can be uniquely determined based on the corresponding suction temperature ( T s u c ) and suction pressure ( P s u c ), as defined by the following relation:
ρ s u c = f 1 ( T s u c ,   P s u c )
where
T s u c = T e v a + Δ T s u p e r
P s u c = f 2   ( T e v a )
It should be noted that thermodynamics properties of the refrigerant at a specific state can be determined either via CoolProp database [18] or NIST RefProp [19], which introduces a minor uncertainty (typically <1%) in property estimation.
The power required for the compression process, denoted as W c o m p , can be determined by applying the following fundamental thermodynamic equation:
W c o m p = m ˙ c o m p ( h d i s _ i s e n t r h s u c ) η i s e n t r
where h d i s _   i s e n t r is a specific enthalpy at the discharge state during an isentropic compression process and h s u c is the specific enthalpy at the compressor suction state, which can be determined from:
h d i s _ i s e n t r = f 3   ( P d i s , s s u c )
h s u c = f 4   ( T s u c ,   P s u c )
Following the application of the compression model, the specific enthalpy at the compressor discharge state is determined by applying the First Law of Thermodynamics for a control volume surrounding the compressor, as given by:
h d i s = h s u c + W c o m p m ˙ c o m p
The discharge temperature ( T d i s ) is then determined, as the thermodynamic state is fixed by the known discharge enthalpy and pressure ( P d i s ), so this relationship is expressed as:
T d i s = f 5   ( h d i s ,   P d i s )
The compression ratio (r) is defined as the ratio of the discharge pressure ( P d i s ) to the suction pressure ( P s u c ), as expressed by the following equation:
r = P d i s P s u c
The η v o l u m can be estimated as a function of r. The correlation is derived by fitting parameters from a polynomial equation using the online software provided by the compressor manufacturer. The dataset used for this fitting is provided in Table 1, where η v is obtained via the online tool for specific operating conditions. The resulting polynomial correlation is then expressed as a function of r.
The correlation between η v o l u m and r can be described as:
η v o l u m = a 1 + b 1 r + c 1 r 2 + d 1 r 3
where a 1 , b 1 , c 1 , and d 1 are regression coefficients.
The upgraded two-dimensional (2-D) correlation for η v o l u m with the functions of r and f for the speed-driven compressor can be driven as:
η v o l u m 2 = a 11 + b 11 r + c 11 f + d 11 r 2 + a 12 r f + b 12 f 2
where a 11 , b 11 , c 11 , d 11 , a 12 , and b 12 are 2-D regression coefficients.
η i s e n t r was also modeled as a function of r using an empirical fitting method. As demonstrated in Table 2, the requisite data for both m ˙ c o m p and W c o m p were sourced from the manufacturer’s online software. A polynomial was subsequently fitted to this dataset, yielding a correlation that describes the trend of η i s e n t r with respect to r.
The functional dependence of η i s e n t r on r is established through the following empirical correlation:
η i s e n t r = a 2 + b 2 r + c 2 r 2 + d 2 r 3
where a 2 , b 2 , c 2 , and d 2 are regression coefficients.
The original 1-D correlation for η i s e n t r is extended to a 2-D model, expressing it as a function of both r and f. For the speed-driven compressor, this enhanced correlation is formulated as follows:
η i s e n t r 2 = a 21 + b 21 r + c 21 f + d 21 r 2 + a 22 r f + b 22 f 2
where a 21 , b 21 , c 21 , d 21 , a 22 , and b 22   are 2-D regression coefficients.
Specifically, the first-order terms in compression ratio (r) and frequency (f) correspond to the primary physical dependencies of volumetric and isentropic efficiencies on pressure ratio and piston speed, respectively. The cross term (r·f) represents the interaction between mechanical speed and pressure ratio effects. Higher-order terms (including r2, f2, r2·f, r·f2) were retained only when they contributed significantly to reducing residual errors and ensuring smooth trend behavior.

3. Results

The analysis presented in this study focuses on a semi-hermetic compressor model 4HTE-20K from Bitzer [17], which is designed for use with CO2 refrigerant. The key technical specifications of this compressor, as provided by the manufacturer for operation at 50 Hz, are as follows: the cylinder configuration is 4 mm × 34 mm × 38 mm, the rotational speed is 1450 RPM, and the displacement volume is 12 m3/h.

3.1. Operating Range

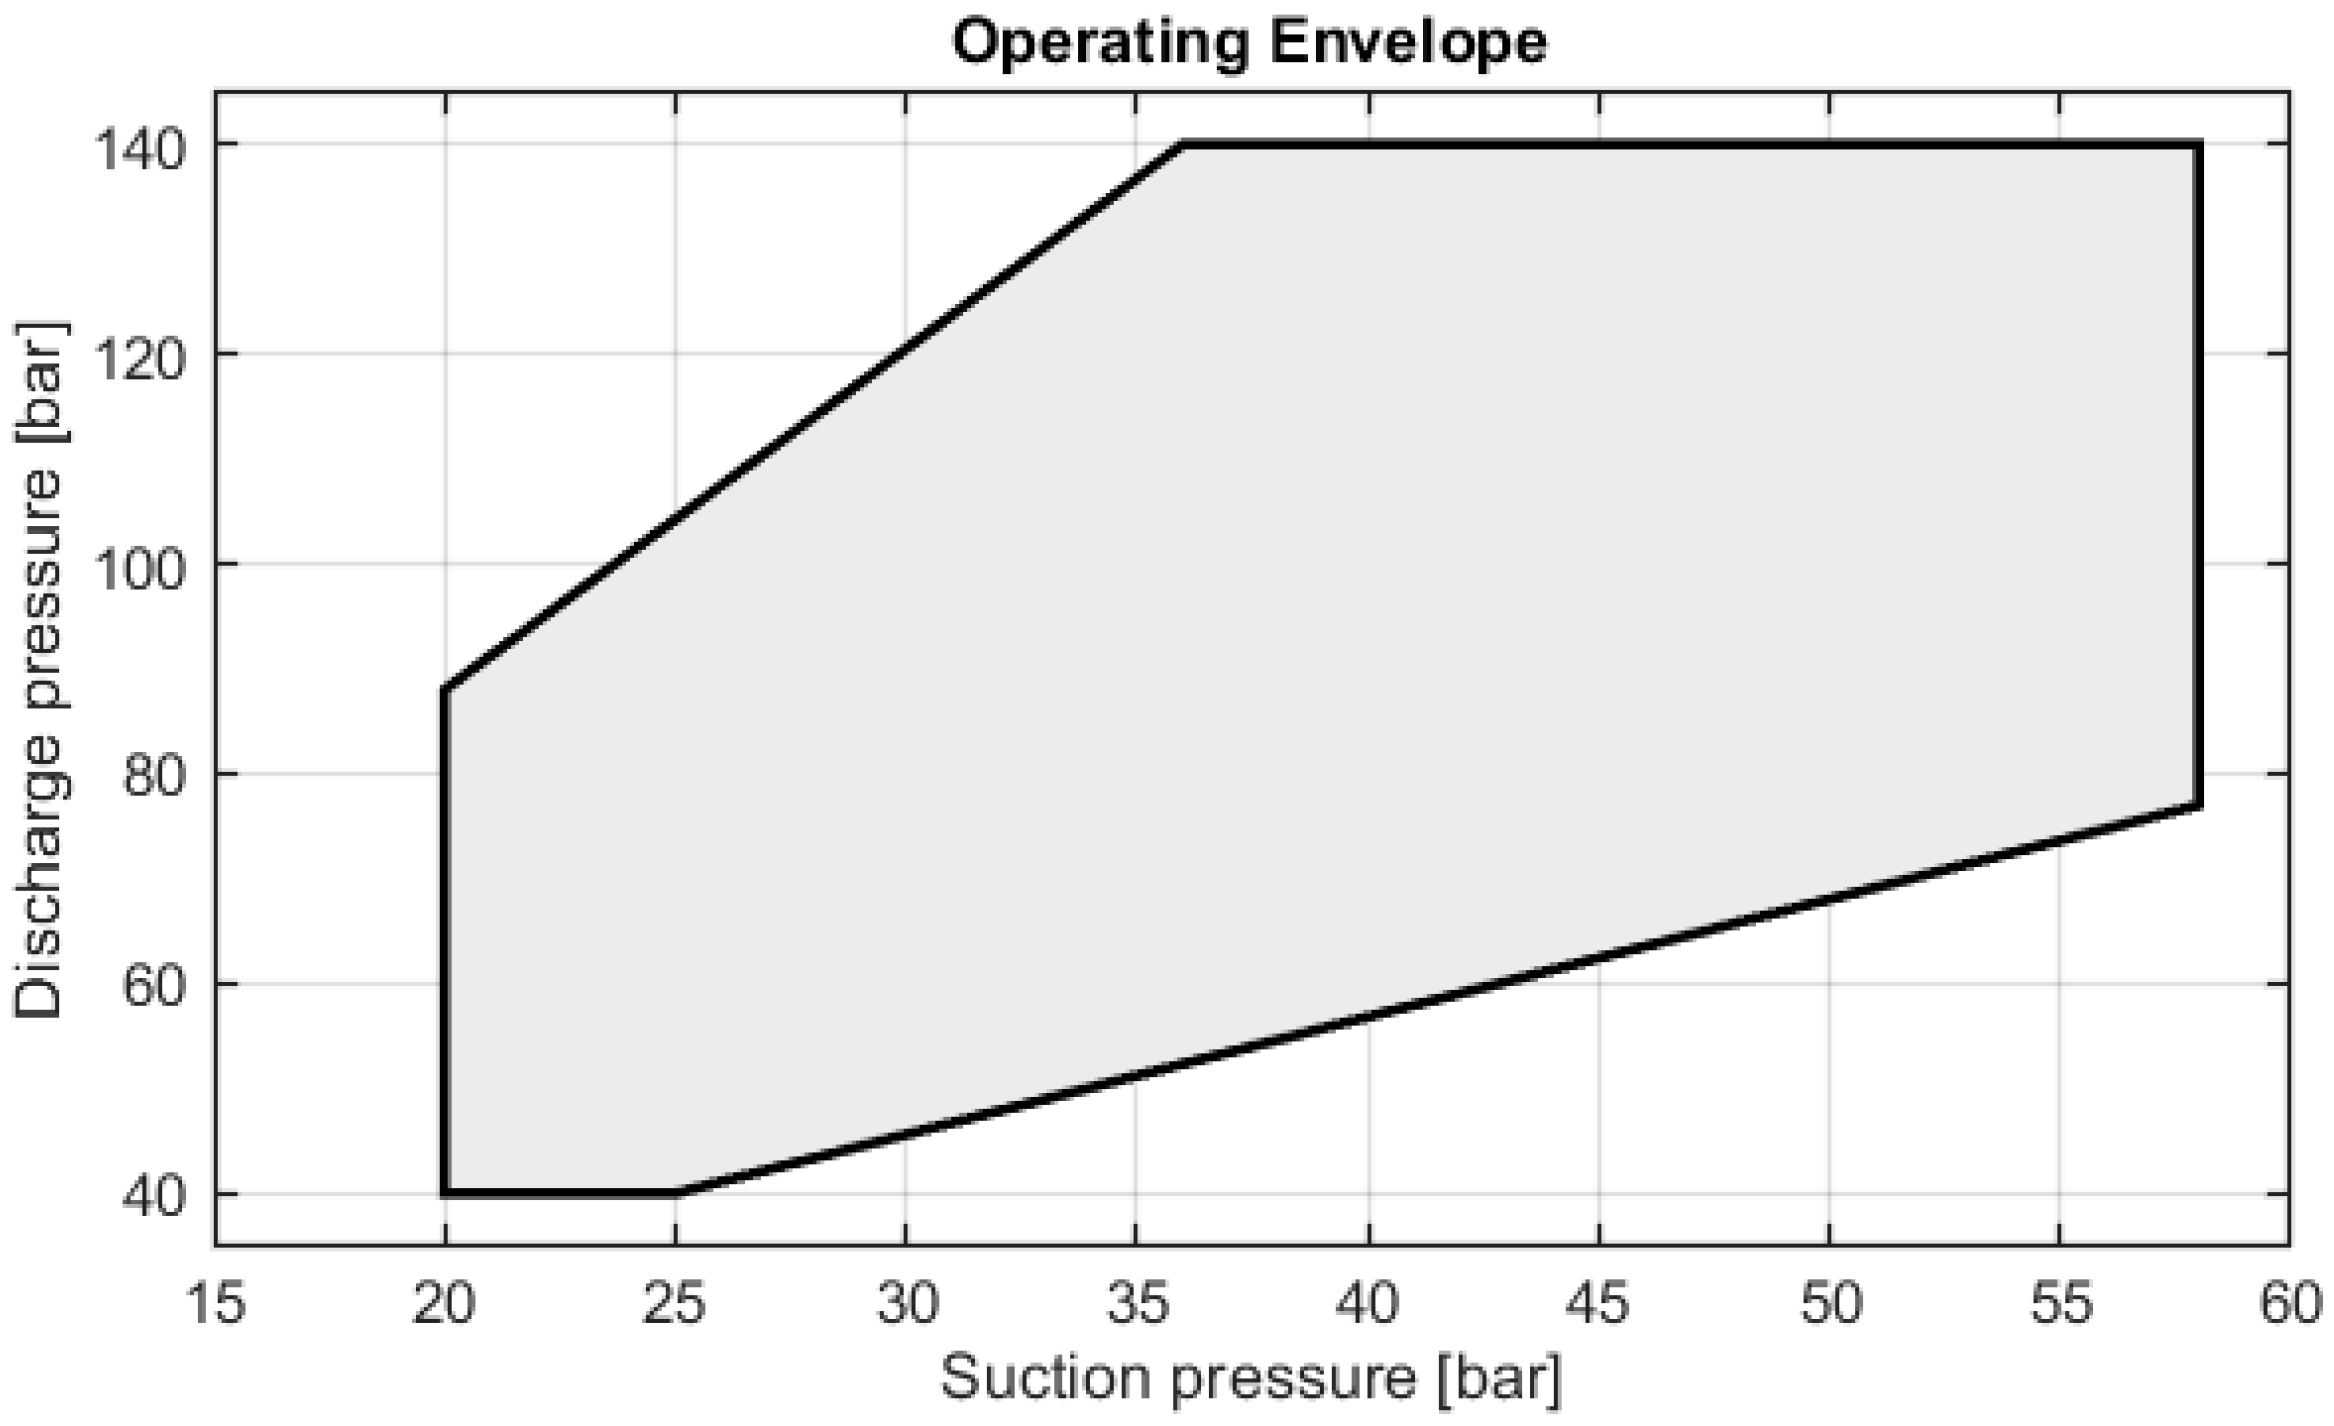
Figure 2 depicts the entire operational envelope of the compressor in terms of suction and discharge pressures, as sourced from the Bitzer online software [20]. These pressure limitations, with suction ranging from 20 to 58 bar and discharge from 40 to 140 bar, are primarily imposed by mechanical integrity constraints and the physical size of the motor. This defined operating range is critical for ensuring the compressor’s reliability and preventing mechanical failure under extreme conditions.
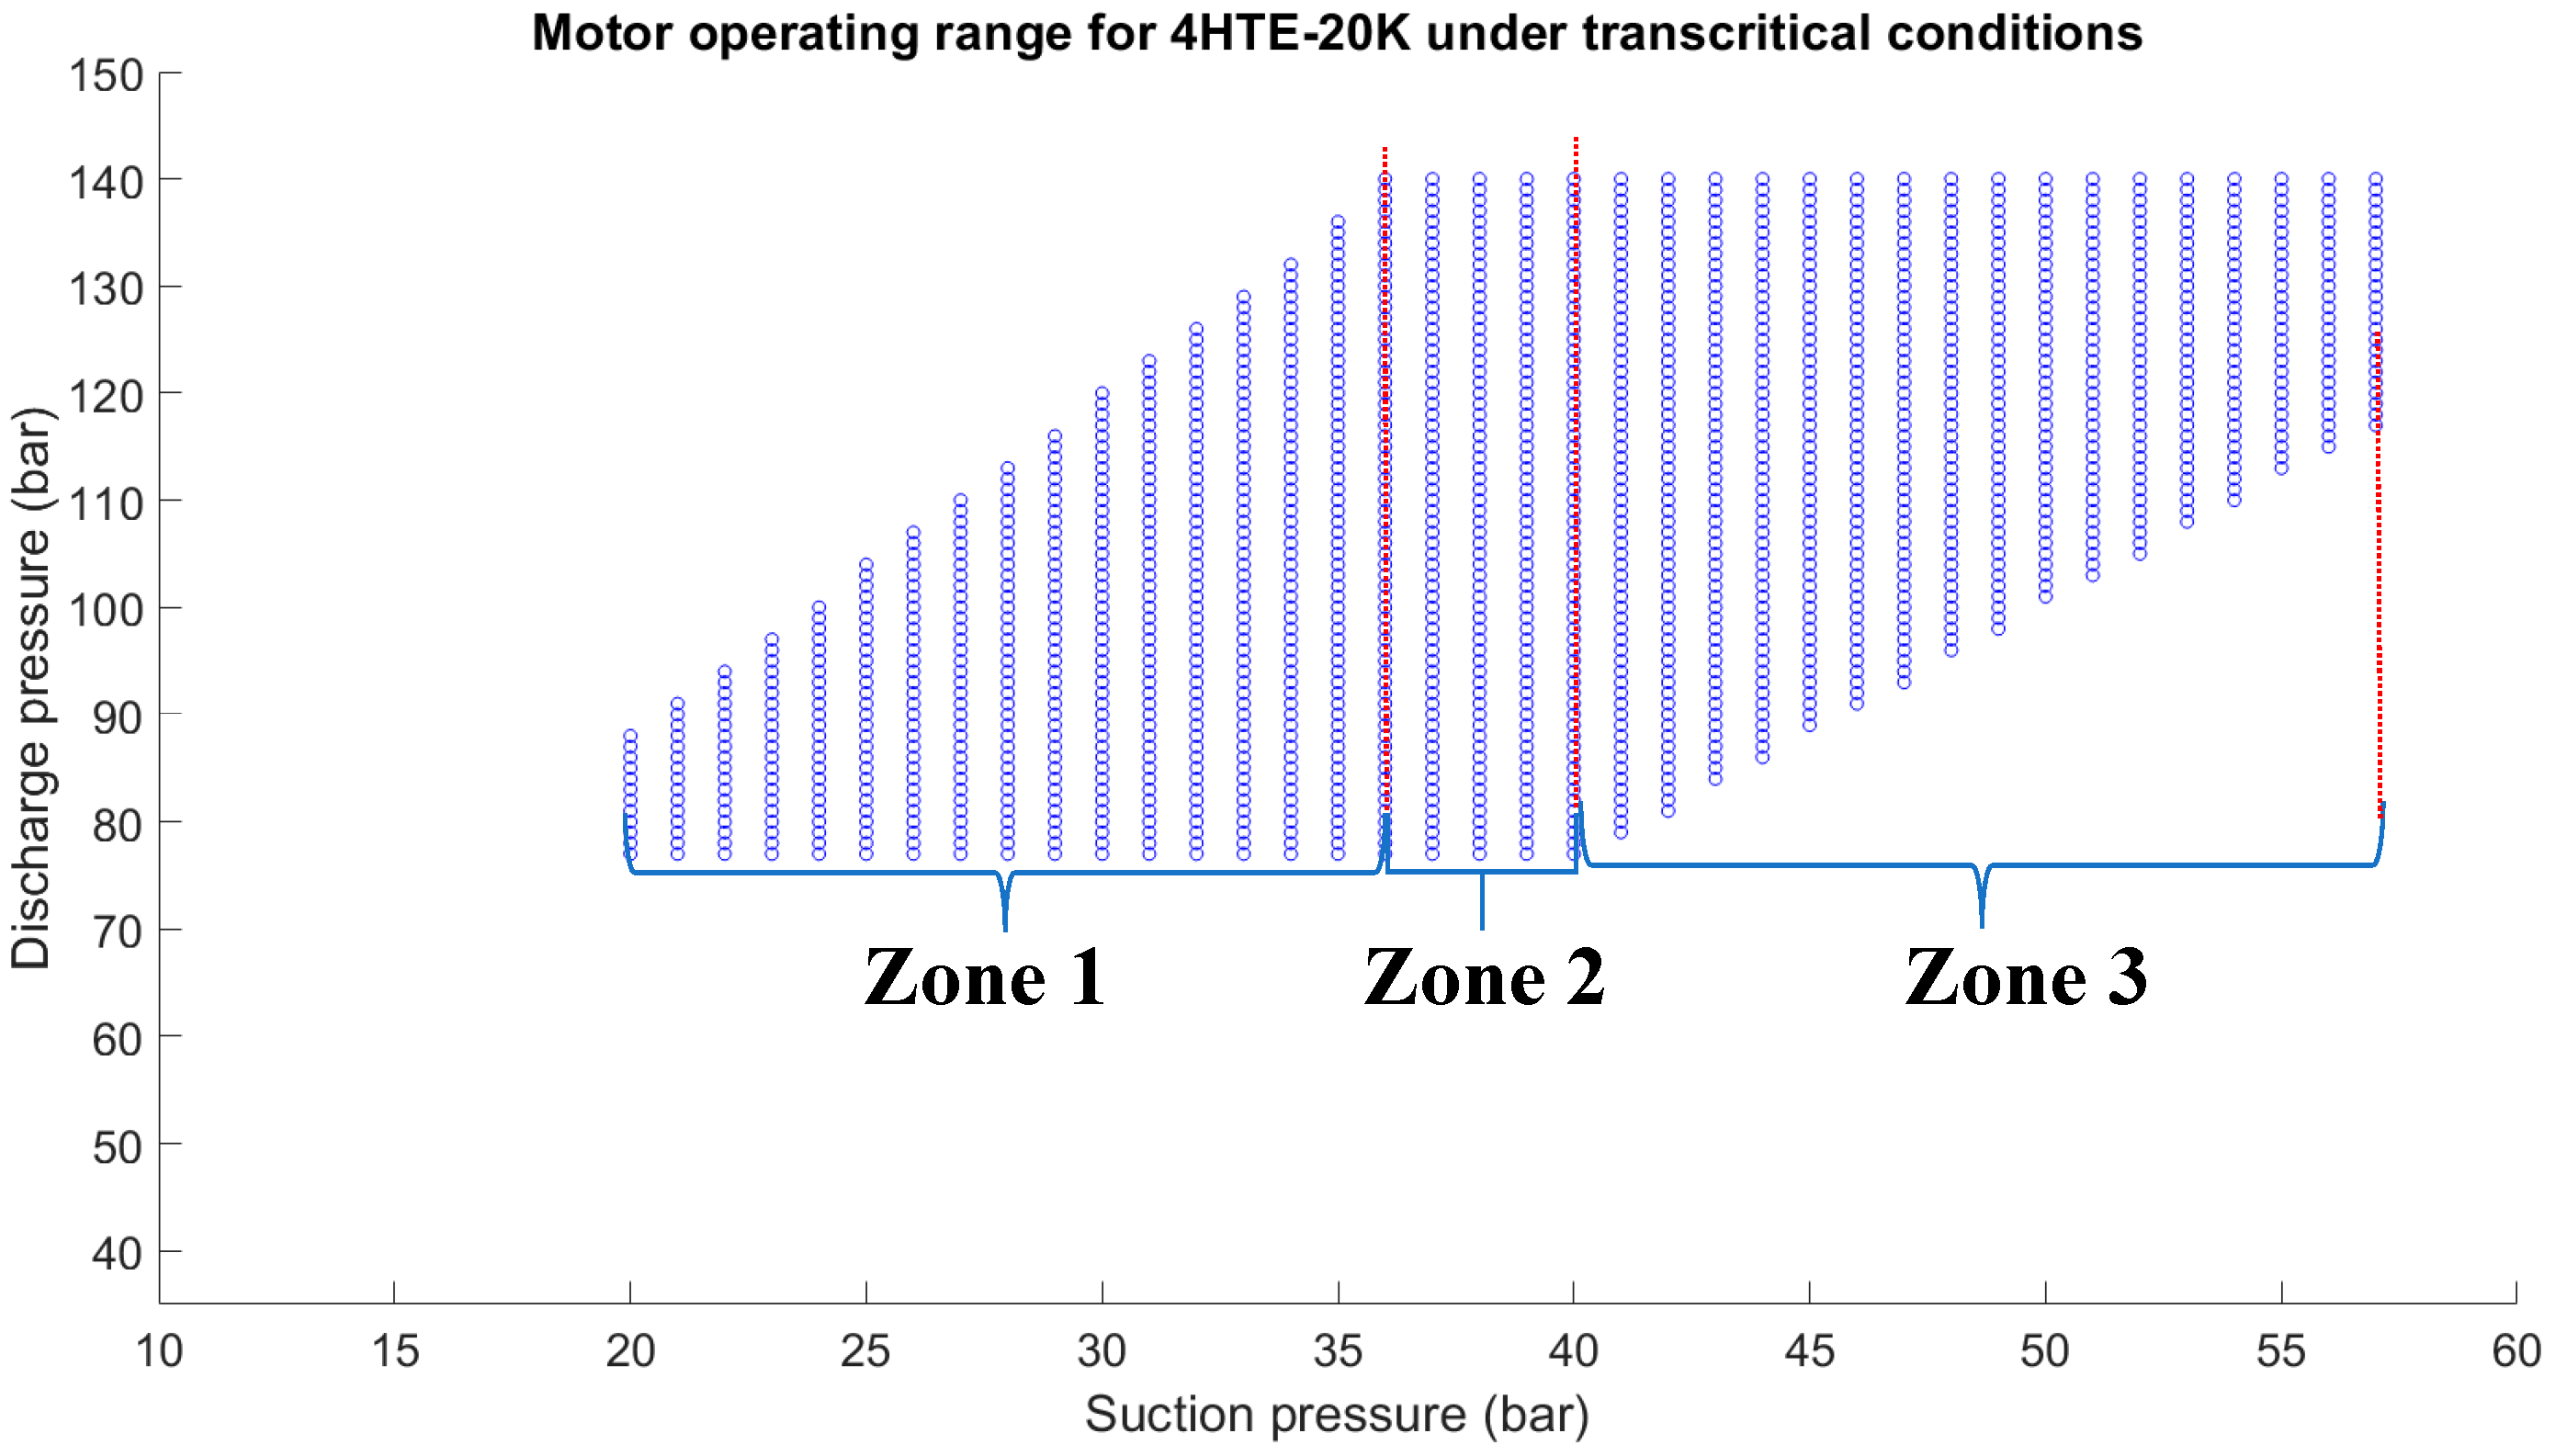
Figure 3 illustrates the operational envelope selected for the compressor under transcritical conditions, which has been directly incorporated into the mathematical model. A defining feature of this transcritical regime is that the discharge pressure exceeds the critical value of 77 bar. To facilitate analysis, the figure delineates several key zones within this envelope, spanning the upper and lower pressure limits. The correlations governing system performance within this range were subsequently derived from specific data points sampled across these zones.
For each zone, the suction pressure ( P suc ) operates within a specified range, while the discharge pressure ( P dis ) is bounded by defined upper and lower limits. The specific calculations can be determined by the following formulas.
P dis _ upper =   3.2 P suc + 24 ,   20     P suc     36   140 ,   36   <   P suc       58  
P dis _ lower =     77 ,   20     P suc       40 2.4 P suc - 20 ,   40   <   P suc       58  

3.2. One-Dimensional Polynomial Regression

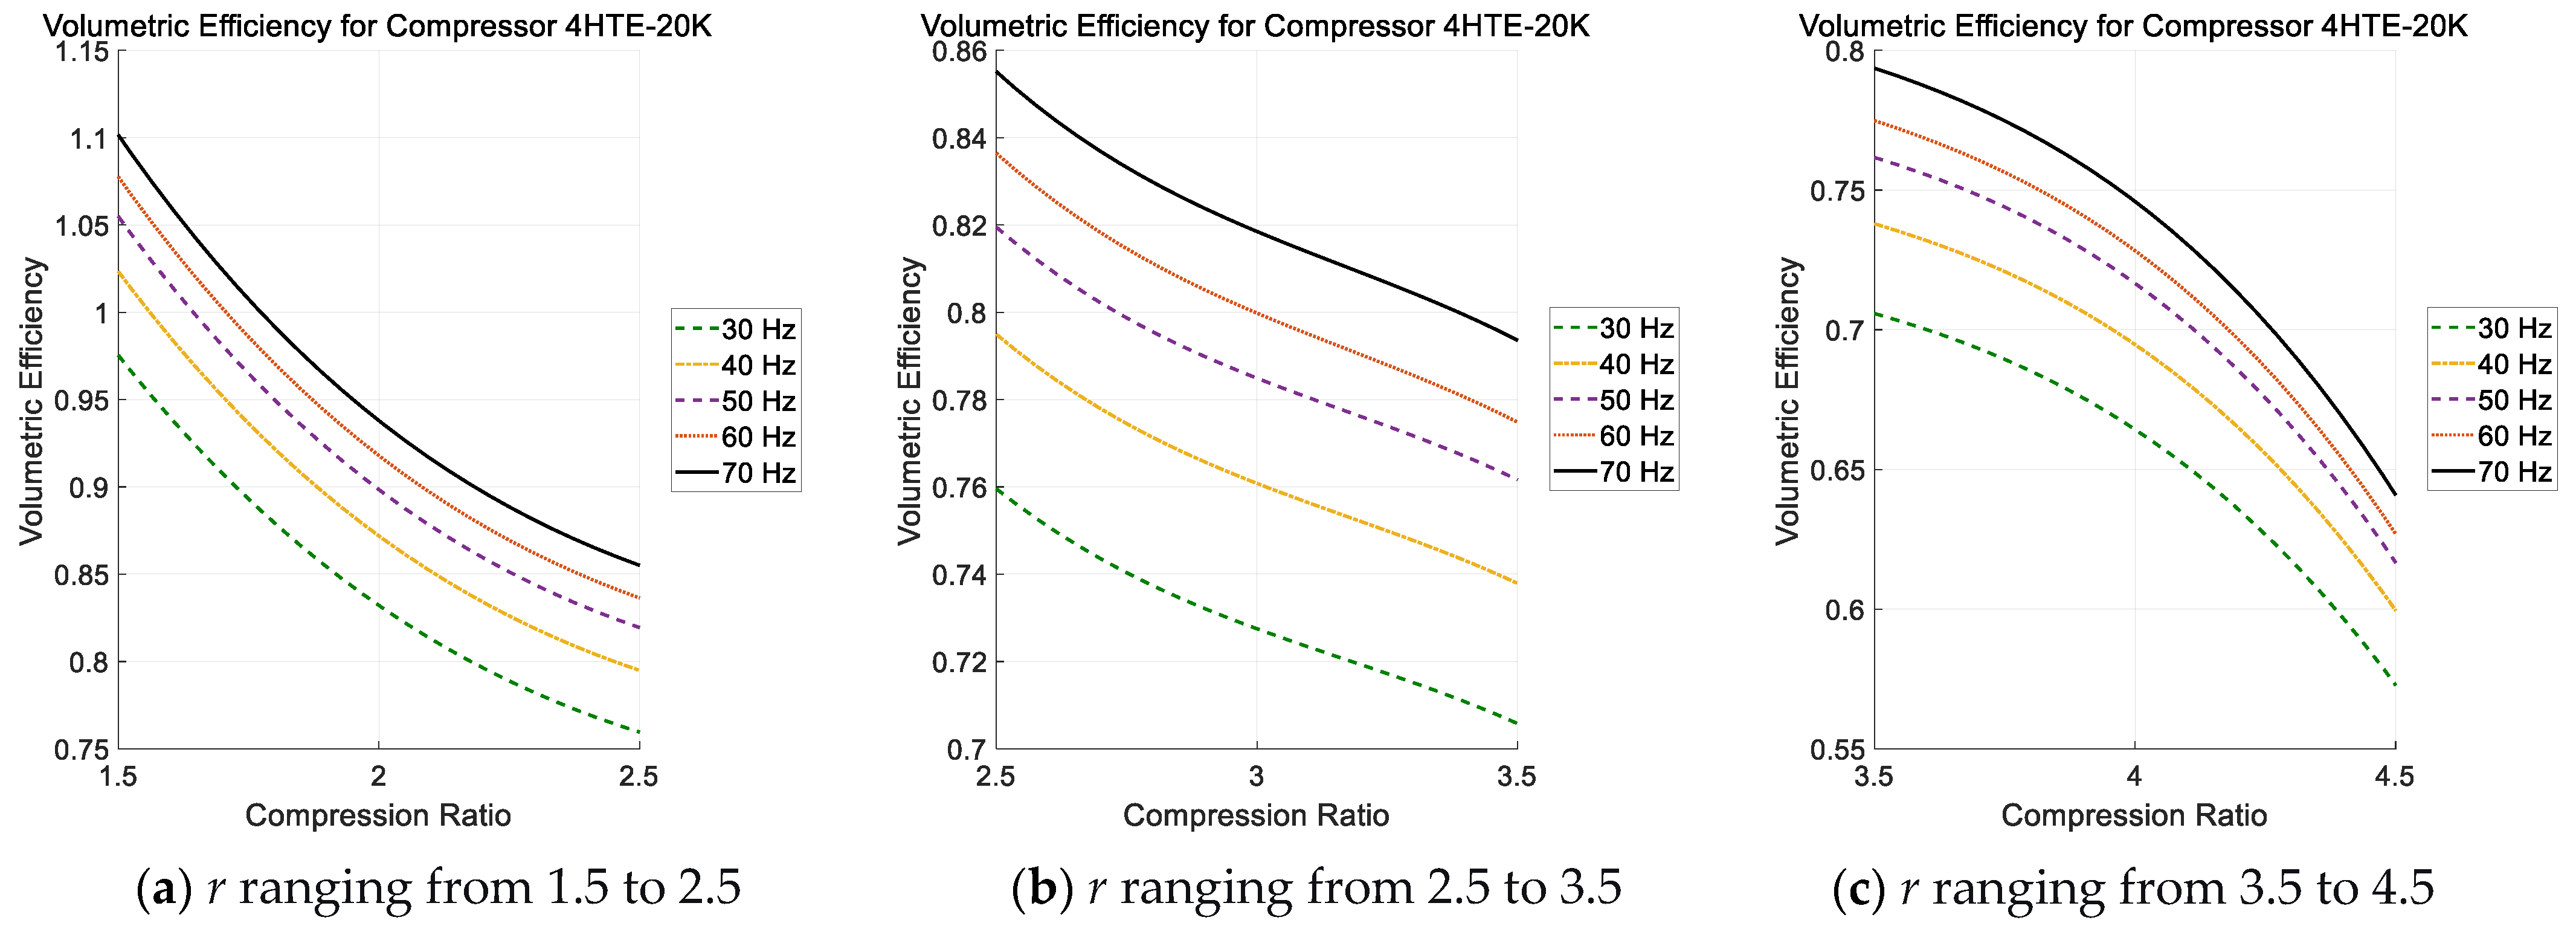
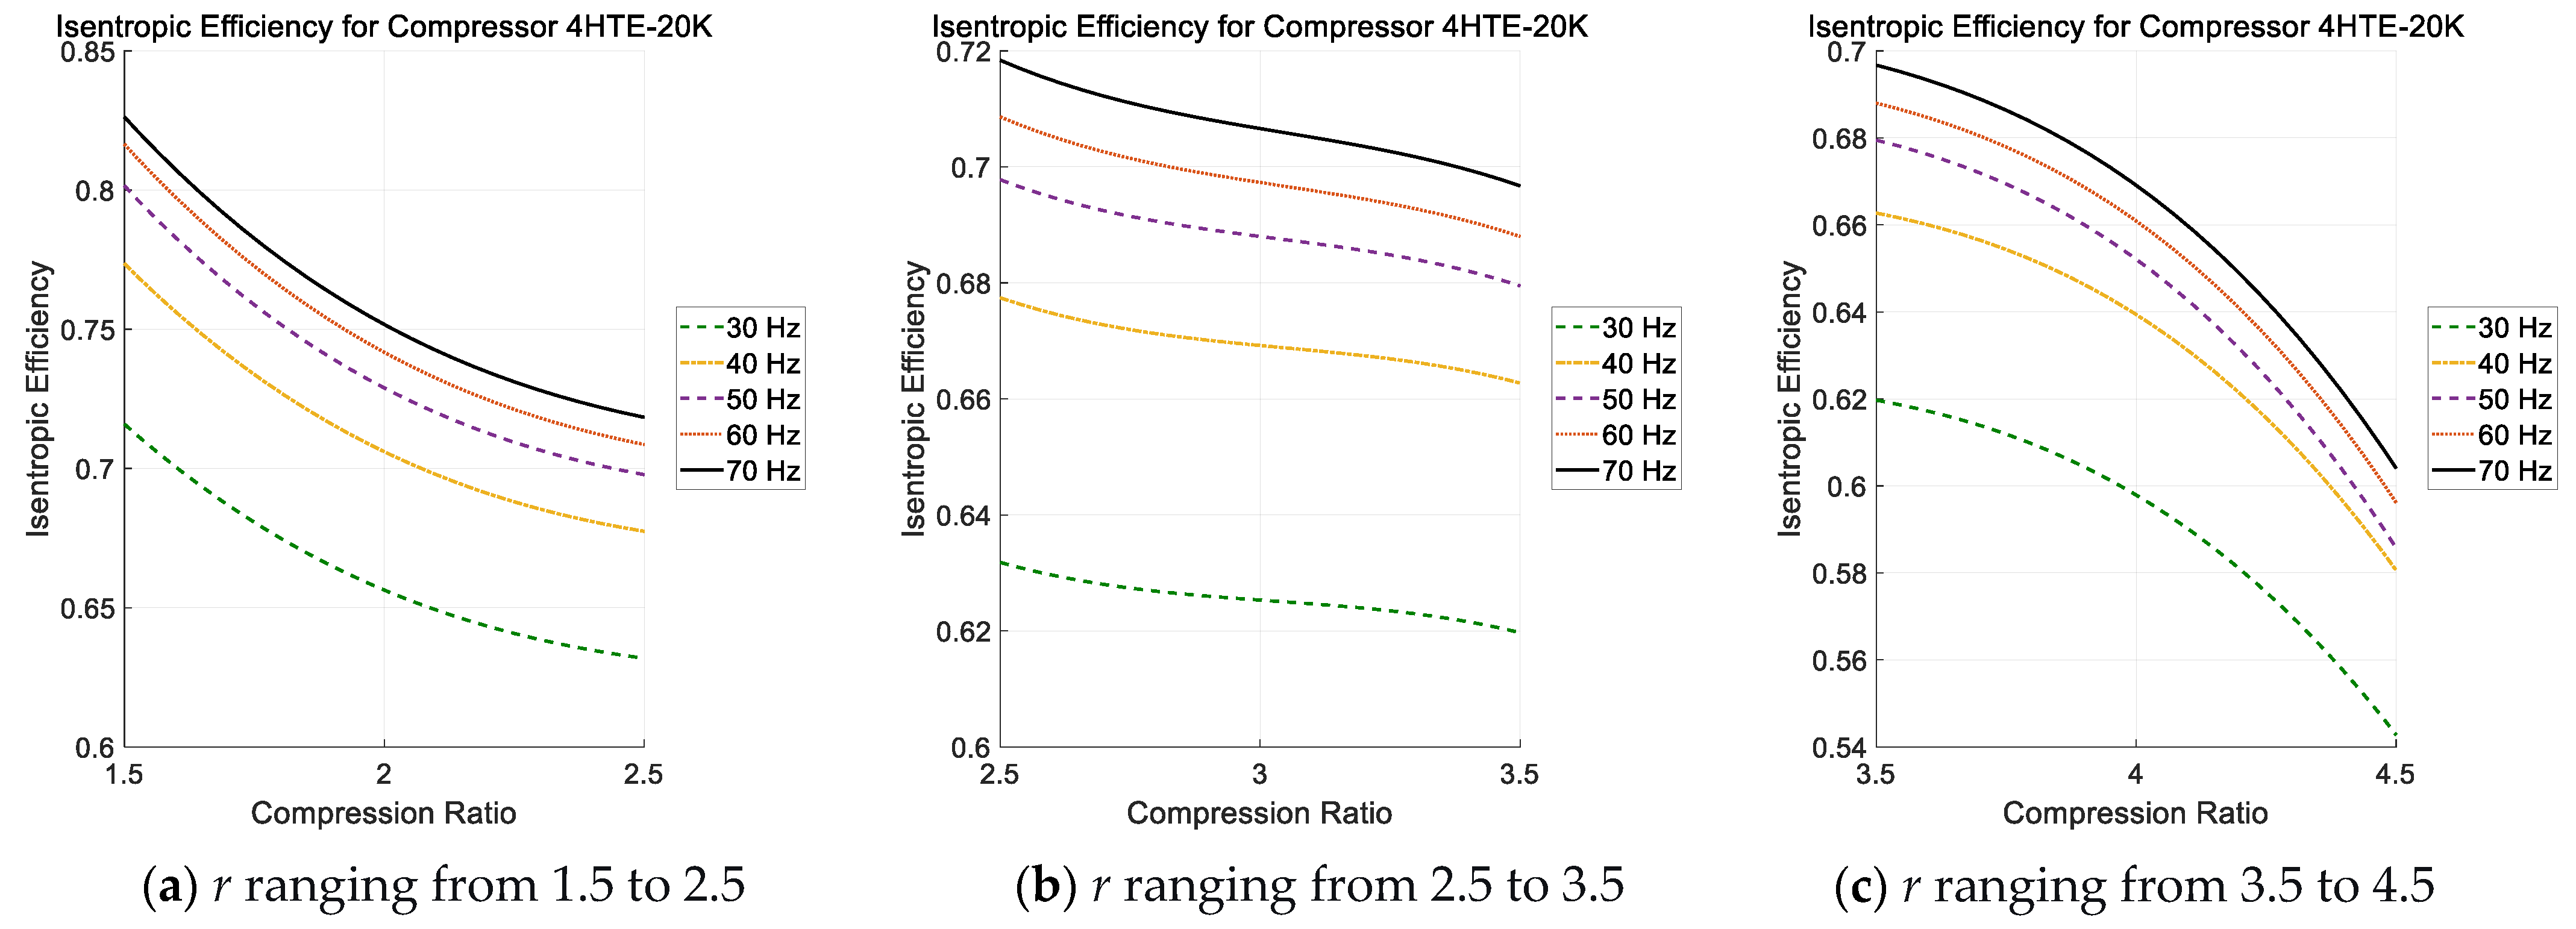
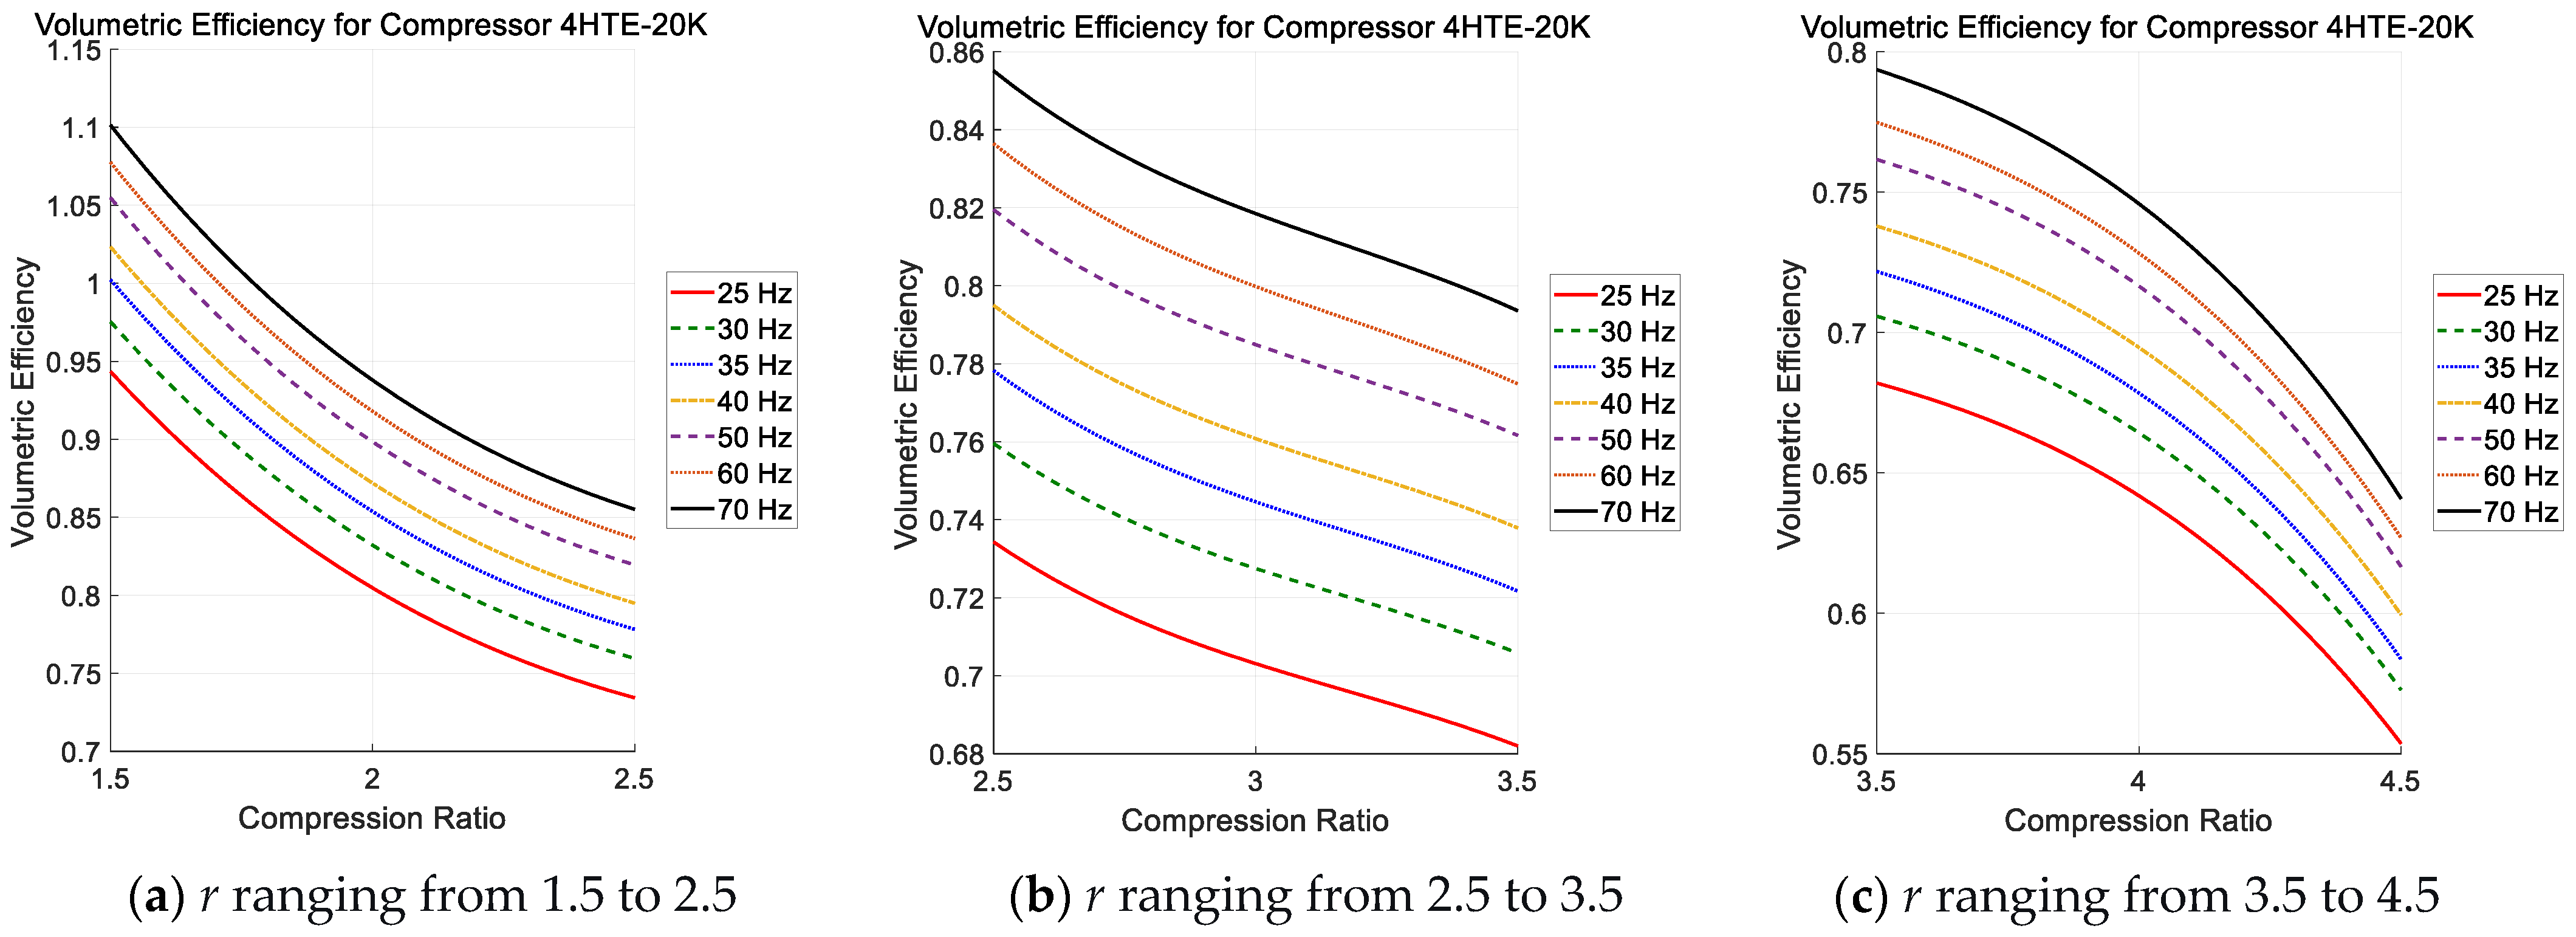
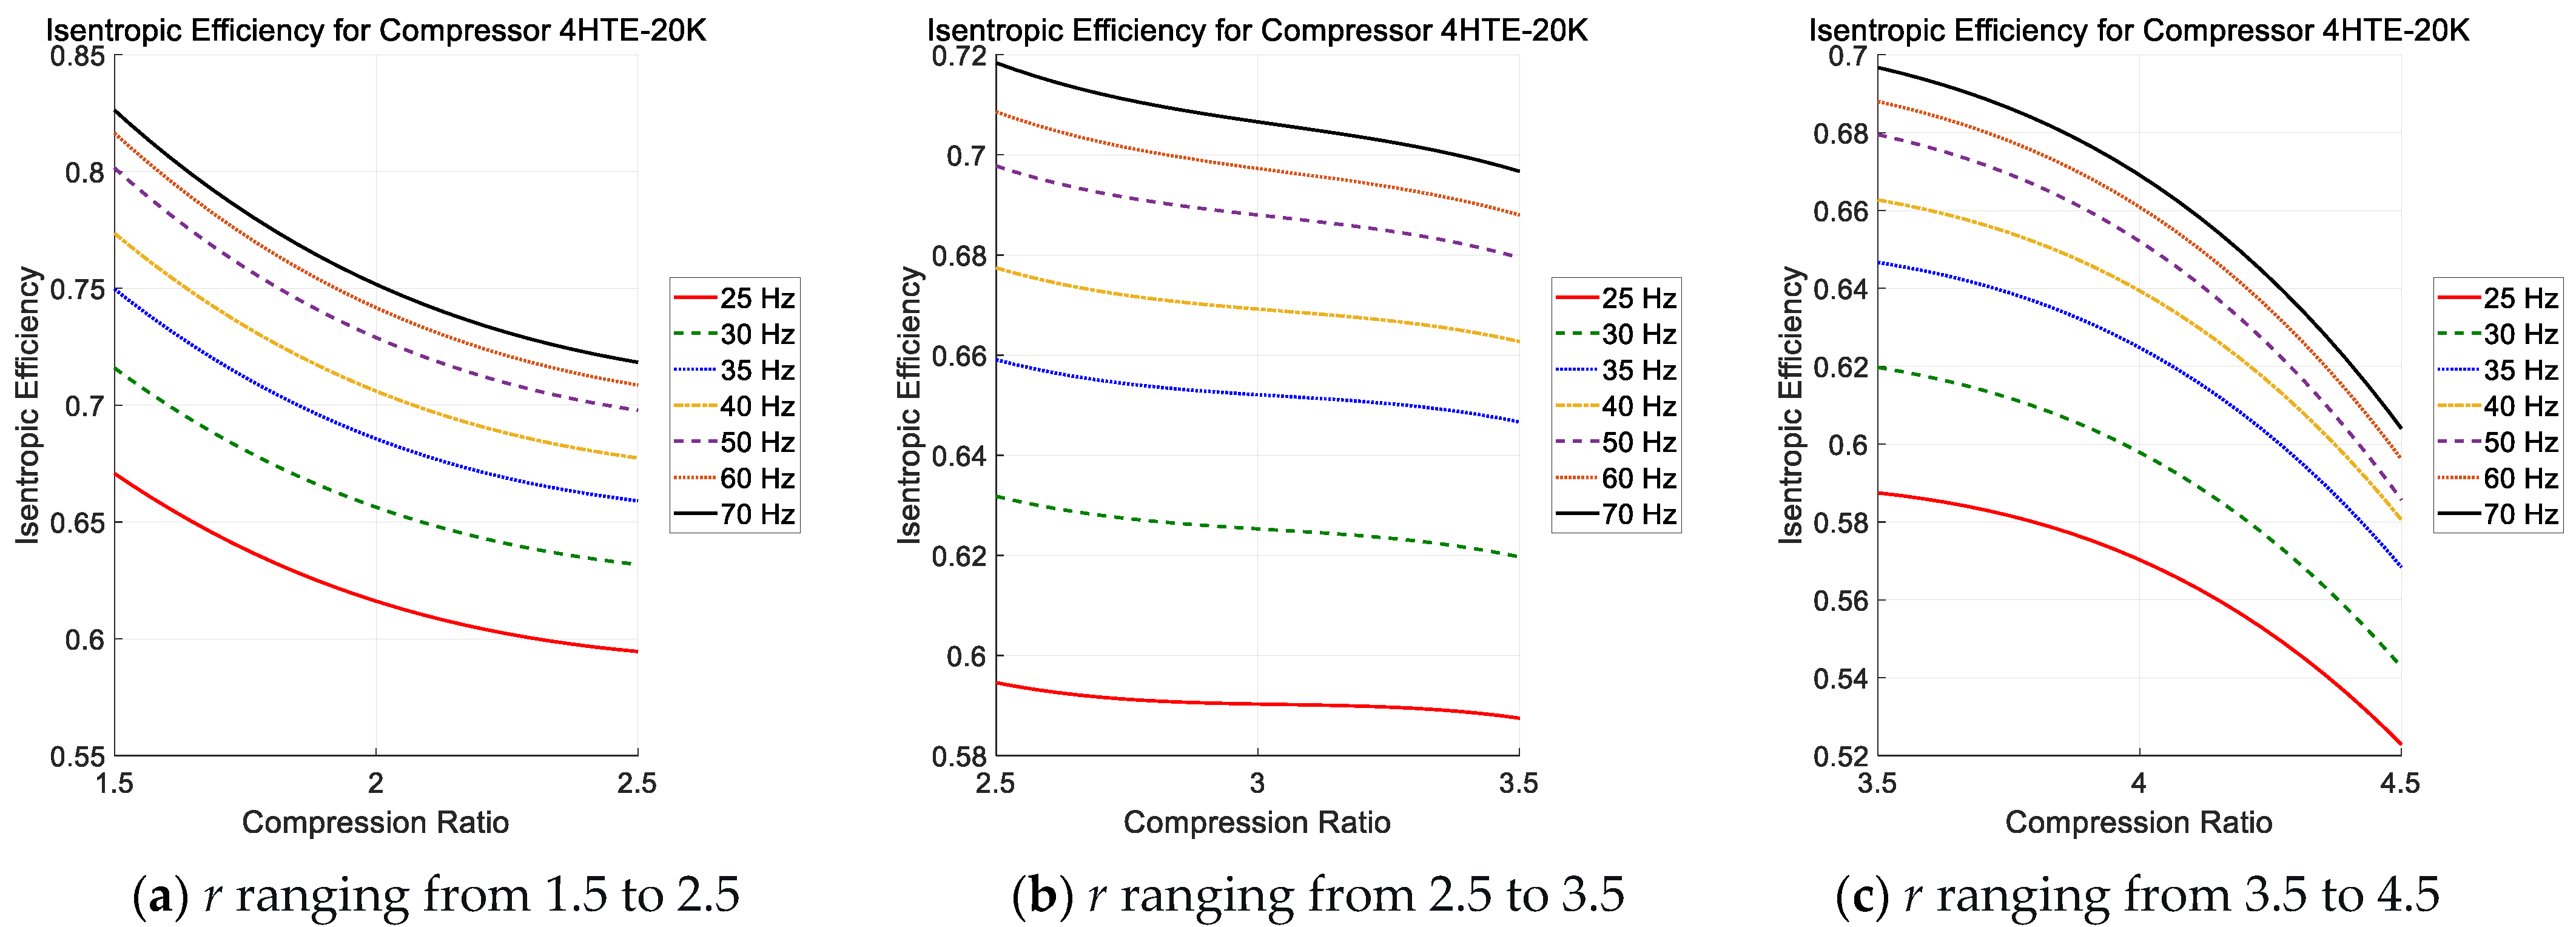
Multiple data points were selected across the designated zones to cover the entire range of suction and discharge pressures. Key operating parameters, including a suction gas superheat of 10 K and a f range of 30 to 70 Hz, were defined. The trend curves for volumetric and η i s e n t r at 10 Hz intervals are presented in Figure 4 and Figure 5, respectively. Both efficiencies generally increase with motor speed. However, Figure 5 reveals a more pronounced discrepancy in η i s e n t r between 30 Hz and 40 Hz compared to other intervals. This highlights the difficulty of accurately predicting compressor performance at low speeds with existing models, a challenge often attributed to compromised flow dynamics or inadequate lubrication at low operating speeds. To address this, the trend curves were refined with additional frequency points below 40 Hz, as shown in Figure 6 and Figure 7.
As can be seen from Figure 4, Figure 5, Figure 6 and Figure 7, the following trends are observed: as r increases, both η v o l u m and η i s e n t r experience a slowing decline in the range of r = 1.5–2.5. Within r = 2.5–3.5, the rate of decrease for both efficiencies first reduces and then increases. Finally, in the range of r = 3.5–4.5, the decline of both efficiencies accelerates. The complete mathematical expressions for these correlations are presented in Equations (17) and (18) below.
η v o l u m = 2.0603 1.2114 r + 0.3694 r 2 0.0388 r 3 ; f = 25   Hz 2.1303 1.2533 r + 0.3825 r 2 0.0402 r 3 ;   f = 30   Hz 2.1969 1.2956 r + 0.3950 r 2 0.0415 r 3 ; f = 35   Hz 2.2395 1.3182 r + 0.4014 r 2 0.0421 r 3 ;   f = 40   Hz 2.3194 1.3731 r + 0.4195 r 2 0.0441 r 3 ;   f = 50   Hz 2.3571 1.3864 r + 0.4220 r 2 0.0443 r 3 ;   f = 60   Hz 2.4211 1.4324 r + 0.4374 r 2 0.0460 r 3 ;   f = 70   Hz
η i s e n t r = 1.1915 0.5889 r + 0.1928 r 2 0.0211 r 3 ; f = 25   Hz   1.2763 0.6328 r + 0.2070 r 2 0.0228 r 3 ;   f = 30   Hz 1.3472 0.6730 r + 0.2191 r 2 0.0240 r 3 ; f = 35   Hz 1.3958 0.6991 r + 0.2267 r 2 0.0248 r 3 ;   f = 40   Hz 1.4689 0.7502 r + 0.2437 r 2 0.0268 r 3 ;   f = 50   Hz 1.4881 0.7508 r + 0.2416 r 2 0.0264 r 3 ;   f = 60   Hz 1.4935 0.7453 r + 0.2396 r 2 0.0262 r 3 ;   f = 70   Hz

3.3. Two-Dimensional Polynomial Regression

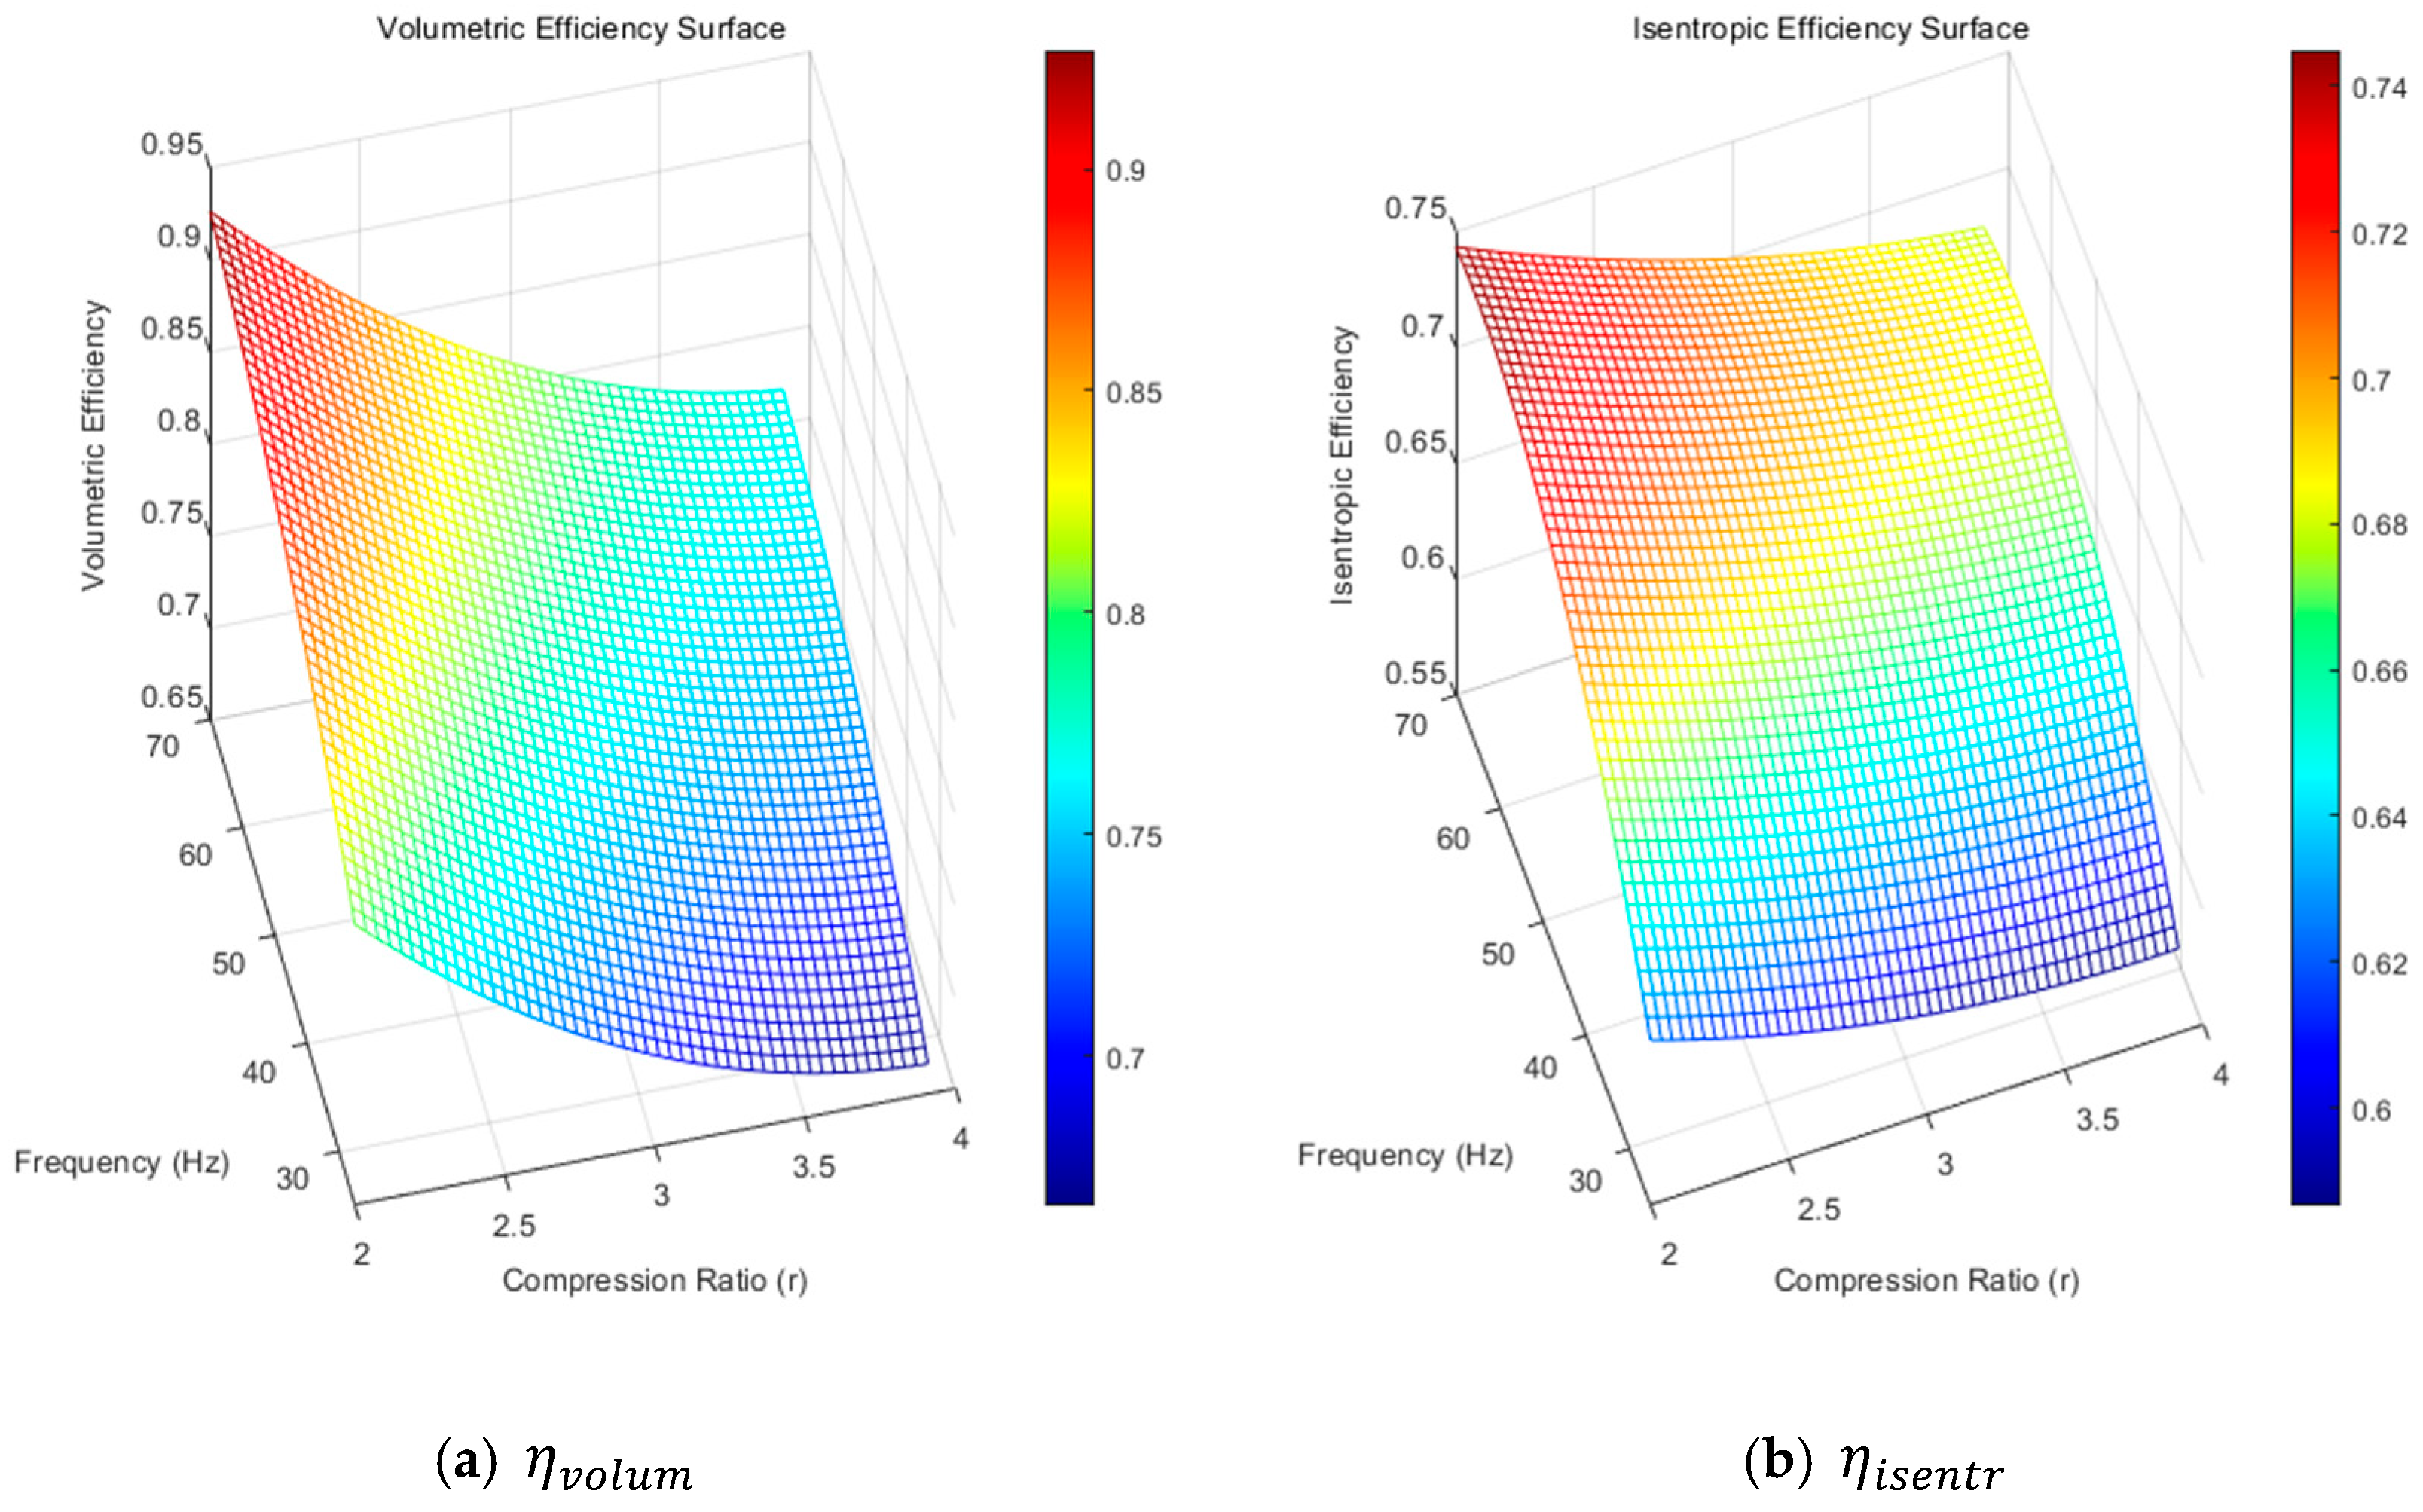
Based on the results obtained above, the 1-D correlations can accurately predict compressor performance at a specified frequency (f). However, when the actual operating frequency falls outside this defined range, the predicted performance may deviate significantly from experimental results, leading to inaccuracies in overall system modeling. These discrepancies become particularly pronounced at low-speed conditions (below 40 Hz), where even small variations in frequency can cause considerable performance deviations. To address this limitation, two-dimensional (2-D) polynomial correlations were developed to enable accurate performance prediction under variable-speed operation across the entire frequency range. To ensure model reliability and avoid overfitting caused by excessive polynomial terms, the 1-D and 2-D regression structures were designed to achieve a balance between model flexibility and generalization. Only polynomial terms that improved the overall prediction accuracy and reflected physically consistent trends were kept. The 2-D polynomial regression plots of volumetric efficiency ( η v o l u m ) and isentropic efficiency ( η i s e n t r ) as functions of compression ratio (r) and frequency (f) are presented in Figure 8, Figure 9, Figure 10 and Figure 11, while their corresponding correlations for frequencies between 25 Hz and 70 Hz are expressed in Equations (19) and (20).
As can be seen from Figure 8, Figure 9, Figure 10 and Figure 11, when r is constant, η v o l u m and η i s e n t r increase with f; when f is constant, η v o l u m and η i s e n t r   decrease with r. Overall, the variation of η v o l u m is more significantly influenced by r and f. Based on the analysis, 2-D polynomial correlations have been developed to predict η v o l u m and η i s e n t r as functions of r at specified motor speeds ranging from 25 Hz to 70 Hz. It can be concluded that parameters η v o l u m and η i s e n t r exhibit distinct trends in relation to the variables f and r. Specifically, when the value of r is held constant, both η v o l u m and η i s e n t r show a clear increasing trend with the rise in f. Conversely, when f is maintained at a fixed value, both parameters demonstrate a decreasing behavior as r increases. Overall, the variation in parameter η v o l u m is more significantly influenced by the combined effects of r and f.
Therefore, based on the observed relationships, 2-D polynomial correlations have been developed to predict η v o l u m and η i s e n t r as functions of r at specified motor speeds ranging from 25 Hz to 70 Hz. These empirical models provide a mathematical framework for quantifying the behavior of these key performance parameters across the operational range. The complete mathematical expressions for these correlations are presented in Equations (19) and (20) below, which enable accurate prediction under various operational conditions.
η v o l u m r , f = 1.071 0.2708 r + 6.83 × 10 3 f + 3.476 × 10 2 r 2 2.512 × 10 4 r f 3.767 × 10 5 f 2 ,     25   H z < f < 70   H z
η i s e n t r r , f = 0.5199 7.183 × 10 2 r + 1.074 × 10 2 f + 1.064 × 10 2 r 2 3.612 × 10 4 r f 7.694 × 10 5 f 2 ,     25   H z < f < 70   H z
Although this study focuses on the Bitzer 4HTE-20K CO2 compressor, the proposed methodology is generally applicable to any hermetic reciprocating compressor, regardless of refrigerant, size, or manufacturer, provided that sufficient performance data are available. Since the model is physics-based rather than purely empirical, it can be adapted to other compressors once their operational data are obtained, making the approach versatile and broadly useful for vapor compression system simulations.

4. Validation and Comparison

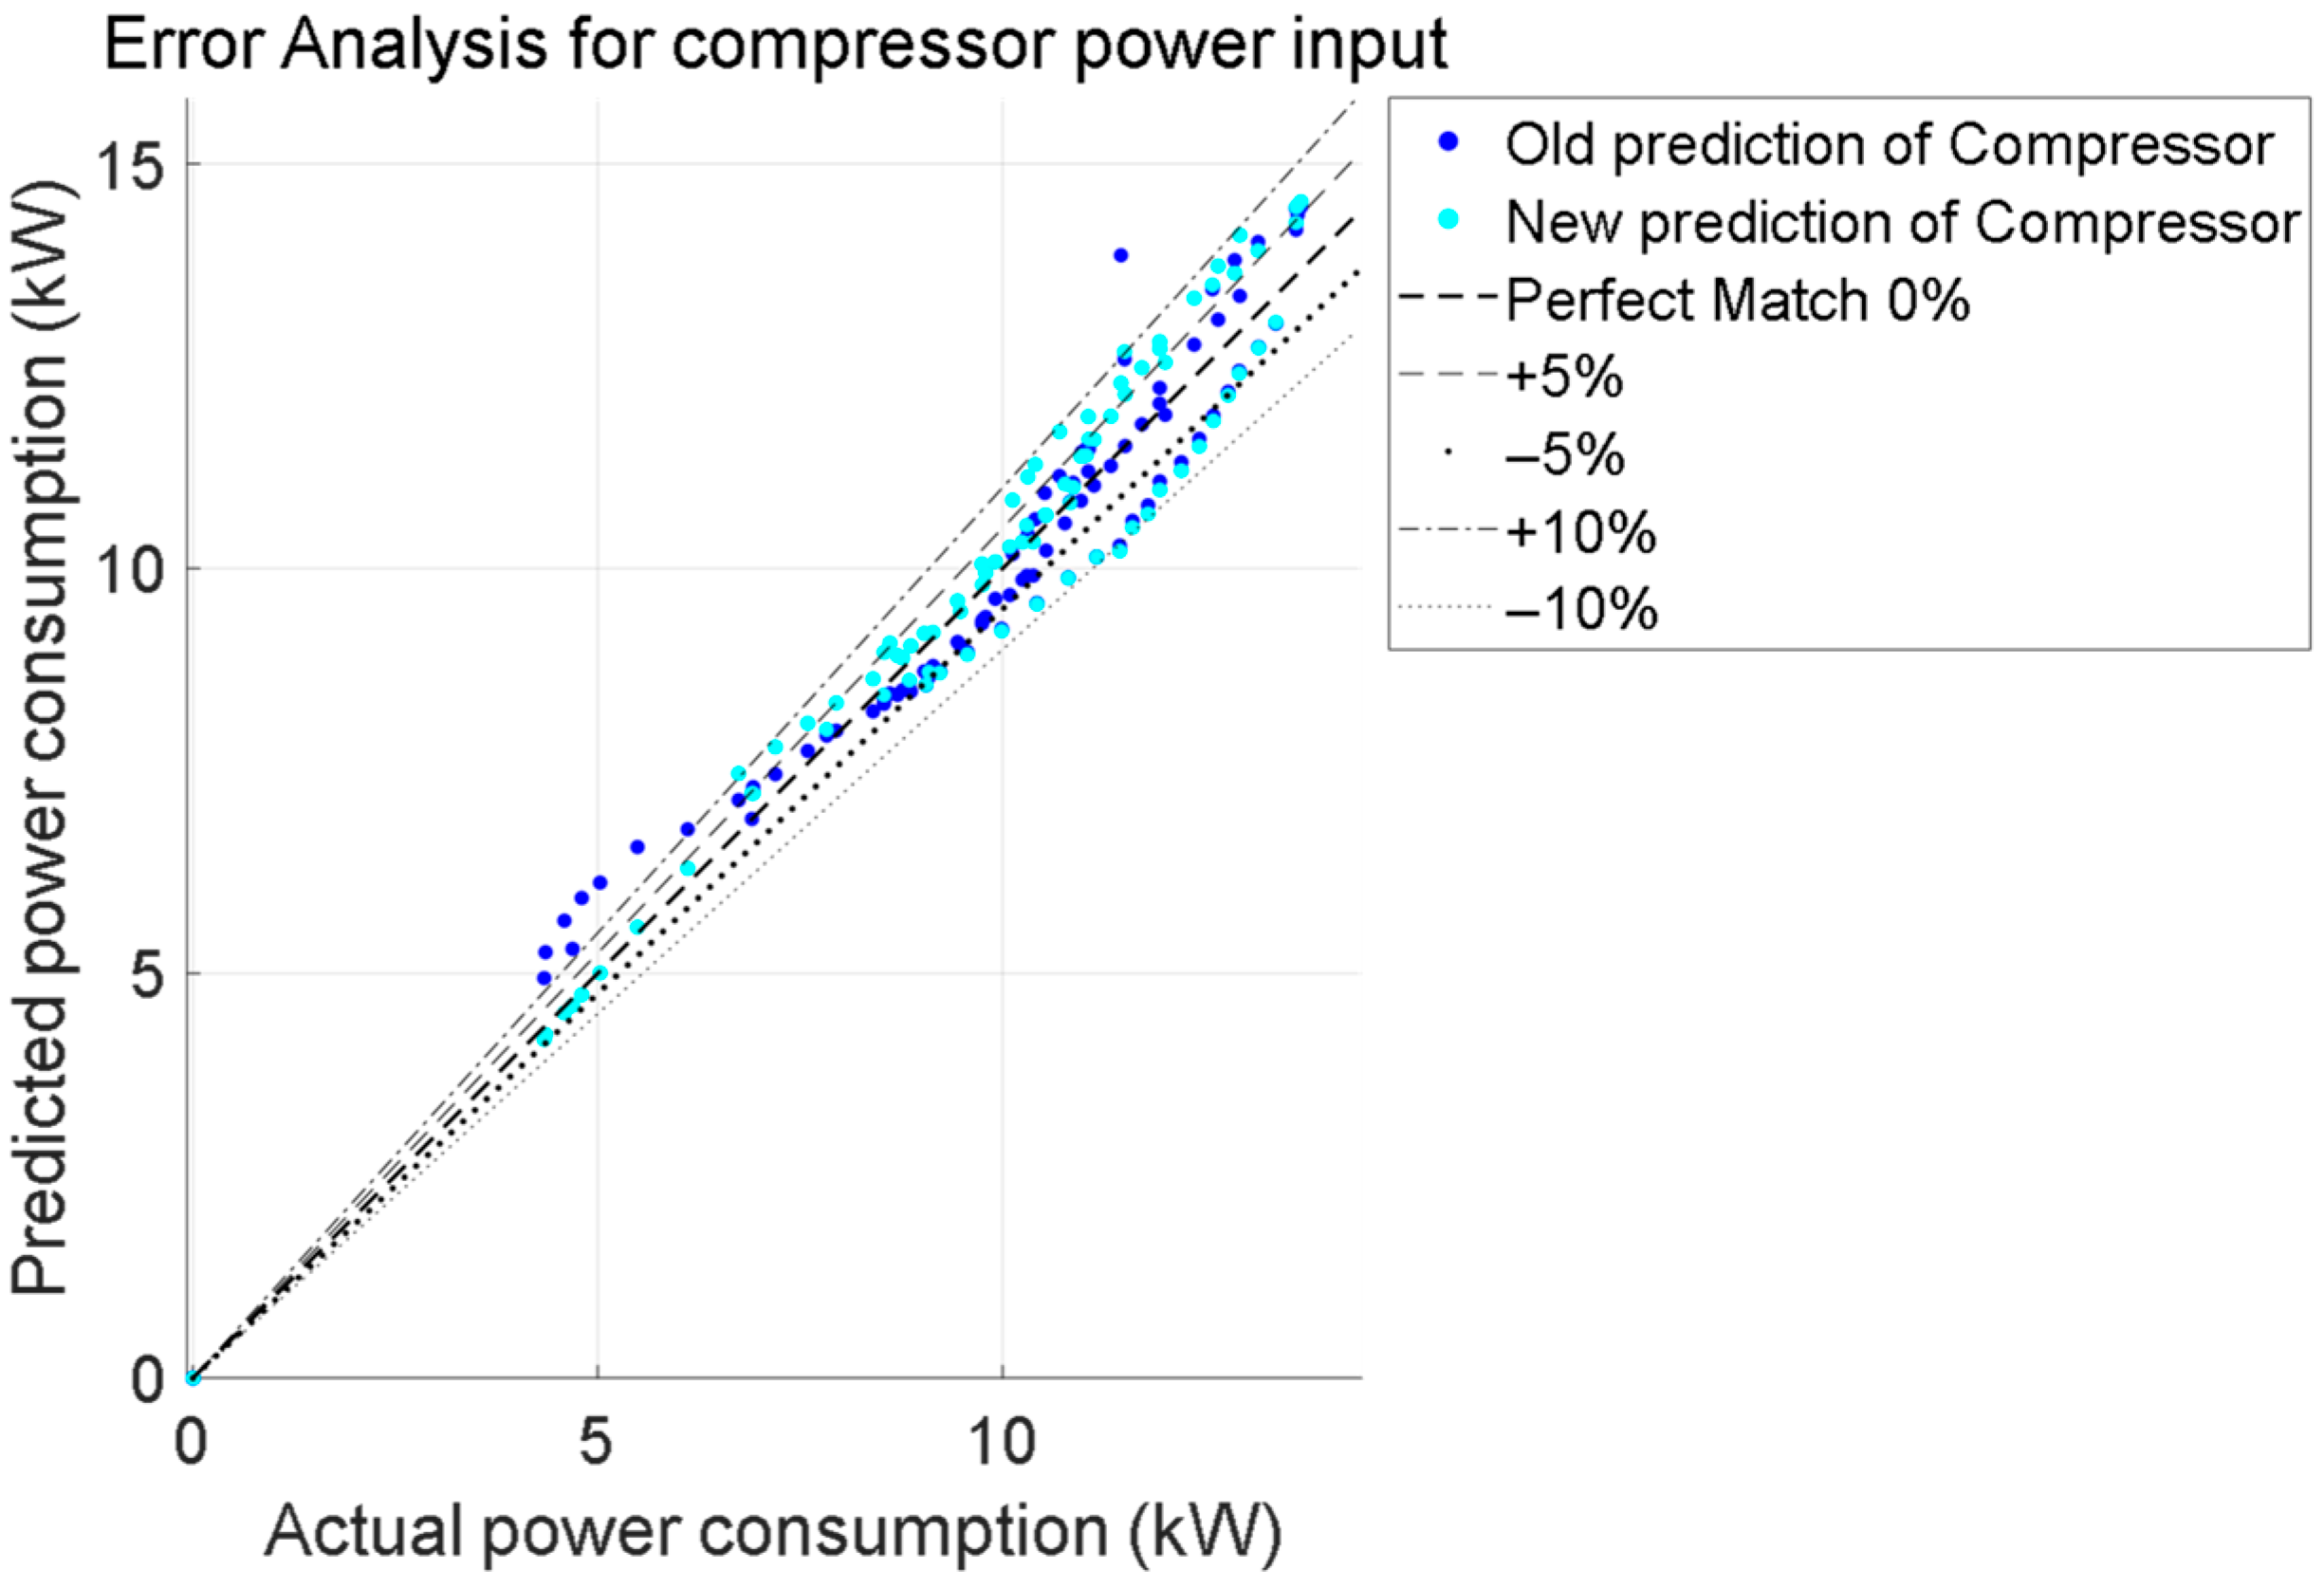
Based on experimental data obtained from a real-world CO2 heat pump system in the public domain [15], which employed a Bitzer compressor model 4HTE-20K that a two-dimensional polynomial regression-based mathematical model has been developed and validated for compressors of the same type. The validation process involved comparing the simulated compressor power input and discharge temperature against published experimental measurements. The “old prediction” in the figures refers to simulation results based on the 1-D polynomial regression model from the previous study, whereas the “new prediction” represents results derived from the proposed 2-D polynomial regression model.
As shown in Figure 12 and Figure 13, the predicted values for both compressor power input and discharge temperature fall within an acceptable error margin of ±10%. Notably, the enhanced speed-driven compressor model demonstrates improved accuracy in predicting performance at low-speed frequencies—a scenario that previous models failed to adequately address. Furthermore, under variable-speed conditions, the proposed mathematical model achieves a reduction in maximum prediction error by up to 19.44%. Although statistical indicators such as root mean square error (RMSE), mean absolute percentage error (MAPE), and error histograms can further illustrate model accuracy, they are not essential for the present framework demonstration. These methods will be incorporated in future studies to support broader validation and comparison across different compressors and working fluids.
At compressor speeds below about 40 Hz, performance becomes more difficult to predict accurately. When the motor runs more slowly, the piston moves at a lower speed, which reduces the suction gas velocity and delays the opening and closing of the valves. These effects cause greater re-expansion and backflow losses inside the cylinder. In addition, the gas stays in the cylinder longer, allowing more heat transfer between the gas and the cylinder walls, which changes the effective compression process and lowers both volumetric and isentropic efficiencies. Together, these factors make compressor behavior more nonlinear and harder to describe with simple or constant-efficiency models. By including motor frequency as a variable, the proposed 2-D polynomial regression model captures these low-speed effects and therefore provides more accurate predictions in this operating range.
These results confirm that the proposed model not only maintains reliability across common operating ranges but also significantly enhances predictive capability in low-speed regimes. Future extensions of this work could include incorporating valve dynamics, thermal losses, and motor efficiency into the regression framework to improve prediction accuracy and expand the model’s applicability to more complex operating conditions.

5. Conclusions

This study established a validated frequency-dependent numerical modeling framework, integrating both 1-D and 2-D polynomial regression methodologies, to accurately predict volumetric and isentropic efficiencies as functions of both r and f. Based on the comprehensive analysis conducted in this work, several key conclusions can be drawn:
(1)
A systematic and detailed methodology for determining η i s e n t r and η v o l u m of the reciprocating compressor has been thoroughly elaborated and implemented.
(2)
Both η v o l u m and η i s e n t r exhibit significant dependency on variations in motor speed frequency; however, the disparity in η i s e n t r observed between 30 Hz and 40 Hz is markedly more pronounced when compared to the differentials identified across other adjacent frequency intervals.
(3)
Although 1-D polynomial regression approaches are capable of representing compressor performance under constant-speed or fixed-frequency conditions, they demonstrate considerable limitations and fail to deliver reliable predictions when applied to variable-speed operational scenarios.
(4)
The introduction of 2-D regression models, which simultaneously incorporate compression ratio and motor frequency as independent variables, facilitates highly accurate predictions of compressor performance under speed-varying conditions and significantly improves model accuracy at low-frequency operation, where traditional models tend to underperform.
(5)
The newly developed CO2 compressor model proposed in this study has been rigorously validated against publicly available experimental datasets, demonstrating satisfactory agreement between simulated and empirical results, with particular emphasis on its enhanced predictive accuracy under low-speed operating regimes.
(6)
The proposed framework represents a novel and transparent numerical approach that accounts for frequency-dependent behavior without relying on complex CFD models. This methodological advancement provides a practical foundation for future numerical studies, system-level simulations, and optimization of variable-speed compressor applications.
Future studies could combine the proposed polynomial modeling framework with learning-based optimization methods to enable real-time adaptation and control of compressor performance [21]. Such hybrid approaches could refine model accuracy under dynamic conditions and further enhance system efficiency.

Author Contributions

Conceptualization, J.W.; methodology, J.W. and W.L.; software, J.W. and W.L.; validation, J.W. and W.L.; formal analysis, J.W. and W.L.; investigation, J.W. and W.L.; resources, J.W.; data curation, J.W.; writing—original draft preparation, J.W. and W.L.; writing—review and editing, J.W. and W.L.; project administration, J.W.; funding acquisition, J.W. All authors have read and agreed to the published version of the manuscript.

Funding

This research received no external funding.

Data Availability Statement

The data presented in this study are available on request from the corresponding author.

Acknowledgments

The authors received no external assistance during the preparation of this work.

Conflicts of Interest

The authors declare no conflicts of interest.

Abbreviations

The following abbreviations are used in this manuscript:
fmotor speed frequency, Hz
f 1 , f 2 , f 3 , f 4 , f 5 functions of refrigerant property
henthalpy, kJ/kg
m ˙ mass flow rate, kg/s
Ppressure, bar
rcompression ratio
Ttemperature, °C or K
ΔTtemperature difference, °C or K
V s displacement rate of the compressor, m3/h
W c o m p compression work, kW
η efficiency
η volumvolumetric efficiency
η isentrIsentropic efficiency
ρ density, kg/m3
MAPEmean absolute percentage error
RMSEroot mean square error
RPMRevolution per minute
1-DOne-dimensional
2-DTwo-dimensional
comp compressor
disdischarge
e v a evaporation
refreference
sucsuction

References

  1. Mathie, R.; Markides, C.N.; White, A.J. A Framework for the Analysis of Thermal Losses in Reciprocating Compressors and Expanders. Heat Transf. Eng. 2014, 35, 1435–1449. [Google Scholar] [CrossRef]
  2. Prata, A.T.; Barbosa, J.R., Jr. Role of the Thermodynamics, Heat Transfer, and Fluid Mechanics of Lubricant Oil in Hermetic Reciprocating Compressors. Heat Transf. Eng. 2009, 30, 533–548. [Google Scholar] [CrossRef]
  3. Barbosa, J.R., Jr.; Ribeiro, G.B.; de Oliveira, P.A. A State-of-the-Art Review of Compact Vapor Compression Refrigeration Systems and Their Applications. Heat Transf. Eng. 2012, 33, 356–374. [Google Scholar] [CrossRef]
  4. Stouffs, P.; Tazerout, M.; Wauters, P. Thermodynamic analysis of reciprocating compressors. Int. J. Therm. Sci. 2001, 40, 52–66. [Google Scholar] [CrossRef]
  5. Rigola, J.; Pérez-Segarra, C.; Raush, G.; Oliva, A.; Escriba, M.; Jover, J.; Escanes, F. Experimental studies of hermetic reciprocating compressors with special emphasis on pV diagram. In Proceedings of the International Compressor Engineering Conference, West Lafayette, IN, USA, 16–19 July 2002. [Google Scholar]
  6. Liu, Z.; Luo, W.; Zhao, Q.; Zhao, W.; Xu, J. Preliminary Design and Model Assessment of a Supercritical CO2 Compressor. Appl. Sci. 2018, 8, 595. [Google Scholar] [CrossRef]
  7. Ozdemir, A.R.; Oguz, E.; Onbasioglu, S. An investigation of the heat transfer phenomena between the hermetic reciprocating compressor components. In Proceedings of the 8th International Conference on Compressors and their Systems, London, UK, 9–10 September 2013; Woodhead Publishing: Sawston, UK, 2013; pp. 385–395. [Google Scholar] [CrossRef]
  8. Kroupa, A. Modelling of phase diagrams and thermodynamic properties using Calphad method–Development of thermodynamic databases. Comput. Mater. Sci. 2013, 66, 3–13. [Google Scholar] [CrossRef]
  9. Pérez-Segarra, C.D.; Rigola, J.; Sòria, M.; Oliva, A. Detailed thermodynamic characterization of hermetic reciprocating compressors. Int. J. Refrig. 2005, 28, 579–593. [Google Scholar] [CrossRef]
  10. Wang, J.; Belusko, M.; Evans, M.; Liu, M.; Zhao, C.; Bruno, F. A comprehensive review and analysis on CO2 heat pump water heaters. Energy Convers. Manag. X 2022, 15, 100277. [Google Scholar] [CrossRef]
  11. Shariatzadeh, O.J.; Abolhassani, S.; Rahmani, M.; Nejad, M.Z. Comparison of transcritical CO2 refrigeration cycle with expander and throttling valve including/excluding internal heat exchanger: Exergy and energy points of view. Appl. Therm. Eng. 2016, 93, 779–787. [Google Scholar] [CrossRef]
  12. Wang, J.; Belusko, M.; Semsarilar, H.; Evans, M.; Liu, M.; Bruno, F. An optimisation study on a real-world transcritical CO2 heat pump system with a flash gas bypass. Energy Convers. Manag. 2022, 251, 114995. [Google Scholar] [CrossRef]
  13. Dutra, T.; Deschamps, C.J. A simulation approach for hermetic reciprocating compressors including electrical motor modeling. Int. J. Refrig. 2015, 59, 168–181. [Google Scholar] [CrossRef]
  14. Rafiee, S.E. Experimental and thermo-dynamical analysis of fully turbulent gas flows in vortex tube-fluid, temperature and power separations, isentropic efficiency, coefficient of performance (COP). Int. Commun. Heat Mass Transf. 2022, 138, 106296. [Google Scholar] [CrossRef]
  15. Wang, J.; Belusko, M.; Liu, M.; Semsarilar, H.; Liddle, R.; Alemu, A.; Evans, M.; Zhao, C.; Hudson, J.; Bruno, F. A comprehensive study on a novel transcritical CO2 heat pump for simultaneous space heating and cooling—Concepts and initial performance. Energy Convers. Manag. 2021, 243, 114397. [Google Scholar] [CrossRef]
  16. Bitzer. ECOLINE Series (Transcritical CO2). Available online: https://www.bitzer.de/gb/en/reciprocating-compressors/ecoline-transcritical/ (accessed on 11 July 2025).
  17. Sandberg, M.R. Equation Of State Influences On Compressor Performance Determination; Texas A&M University: College Station, TX, USA, 2005. [Google Scholar]
  18. Bell, I.H.; Wronski, J.; Quoilin, S.; Lemort, V. Pure and pseudo-pure fluid thermophysical property evaluation and the open-source thermophysical property library CoolProp. Ind. Eng. Chem. Res. 2014, 53, 2498–2508. [Google Scholar] [CrossRef] [PubMed]
  19. Lemmon, E.W.; Huber, M.L.; McLinden, M.O. NIST reference fluid thermodynamic and transport properties—REFPROP. NIST Stand. Ref. Database 2002, 23, v7. [Google Scholar]
  20. Bitzer. Bitzer Software Version 7.0.5. Available online: https://www.bitzer.de/websoftware/calculate/HHK/?tab=results (accessed on 11 July 2025).
  21. Hazem, Z.B.; Saidi, F.; Guler, N.; Altaif, A.H. Reinforcement learning-based intelligent trajectory tracking for a 5-DOF Mitsubishi robotic arm: Comparative evaluation of DDPG, LC-DDPG, and TD3-ADX. Int. J. Intell. Robot. Appl. 2025. [Google Scholar] [CrossRef]
Figure 1. The detailed procedure for determining the isentropic and volumetric efficiencies of the reciprocating compressor.
Applsci 15 12016 g001
Figure 2. The operating range given for Bitzer compressor 4HTE-20K.
Applsci 15 12016 g002
Figure 3. The selected operating range for a compressor 4HTE-20K under transcritical conditions.
Applsci 15 12016 g003
Figure 4. Trend curves of η v o l u m for the 4HTE-20K compressor at 30 Hz–70 Hz (10 Hz intervals).
Applsci 15 12016 g004
Figure 5. Trend curves of η i s e n t r for the 4HTE-20K compressor at 30 Hz–70 Hz (10 Hz intervals).
Applsci 15 12016 g005
Figure 6. Upgraded trend curves of η v o l u m for the 4HTE-20K compressor at 25 Hz–70 Hz.
Applsci 15 12016 g006
Figure 7. Upgraded trend curves of η i s e n t r for the 4HTE-20K compressor at 25 Hz–70 Hz.
Applsci 15 12016 g007
Figure 8. Two-dimensional polynomial regression plots for η v o l u m and η i s e n t r for the 4HTE-20K compressor at 25 Hz–70 Hz.
Applsci 15 12016 g008
Figure 9. Two-dimensional polynomial regression plots for η v o l u m and η i s e n t r for the 4HTE-20K compressor at 25 Hz–40 Hz.
Applsci 15 12016 g009
Figure 10. Two-dimensional polynomial regression plots for η v o l u m and η i s e n t r for the 4HTE-20K compressor at 40 Hz–55 Hz.
Applsci 15 12016 g010
Figure 11. Two-dimensional polynomial regression plots for η v o l u m and η i s e n t r for the 4HTE-20K compressor at 55 Hz–70 Hz.
Applsci 15 12016 g011
Figure 12. An error analysis for the old and new predicted compressor power input against actual values.
Applsci 15 12016 g012
Figure 13. An error analysis for the old and new predicted discharge temperatures against actual values.
Applsci 15 12016 g013
Table 1. An example of data fitting for the volumetric efficiency correlation.
ParameterValueParameterValue
f (Hz)25 m ˙ c o m p (kg/h)490
fref (Hz)50 ρ suc (kg/m3)102.39
Pdis (bar)80 V s _ r e f (m3/h)12
Psuc (bar)40 η v o l u m 0.7975
r2
Table 2. An example of data fitting for η i s e n t r .
ParameterValueParameterValue
Pdis (bar)80 Δ h = h d i s h s u c 35.22
Psuc (bar)40 W c o m p (kW)7.8
r2 η i s e n t r 0.6146
m ˙ c o m p (kg/s)0.136
Disclaimer/Publisher’s Note: The statements, opinions and data contained in all publications are solely those of the individual author(s) and contributor(s) and not of MDPI and/or the editor(s). MDPI and/or the editor(s) disclaim responsibility for any injury to people or property resulting from any ideas, methods, instructions or products referred to in the content.