Article

Study of Electrical Contact in a System for High Power Transmission Through Well Piping

1
Department of Production Technology and Systems, Faculty of Industrial Technology, Technical University of Sofia, 1000 Sofia, Bulgaria
2
Department of Theory of Mechanisms and Machines, Faculty of Industrial Technology, Technical University of Sofia, 1000 Sofia, Bulgaria
*
Author to whom correspondence should be addressed.
Appl. Sci. 2025, 15(18), 9932; https://doi.org/10.3390/app15189932
Submission received: 8 August 2025 / Revised: 19 August 2025 / Accepted: 25 August 2025 / Published: 10 September 2025
(This article belongs to the Section Mechanical Engineering)

Abstract

Featured Application

The performed study on effects in an electrical contact shows the potential to supply high voltage to downhole equipment and avoid long cables. This approach is expected to provide efficient applications in the petroleum industry.

Abstract

The study examines in detail the possibility of using well casing as a means for power transmission downhole to high-power equipment, such as pumps. The ultimate goal is to transmit single-phase AC to the well bottom and then convert it into three-phase power to operate the downhole equipment, which is a major challenge for such applications. The focus is set on the particular problem of the contact between the packer slips and the casing, and the study aims to examine it in detail. An analysis of high-voltage effects (arcing, etching, contact welding, and heating) and possible mechanical and chemical failures (fatigue, corrosion, surface treatment, contact pressure, and stresses) is performed. These effects are evaluated using common physics laws, and the mechanical structural behavior of the contact is analyzed through Finite Element Method simulation. The performed calculations and analyses show that this is a viable and innovative solution that eliminates the use of cables (umbilicals), especially for long distances and in deep wells. The main contribution is the validated conceptual design, with physical prototyping and tests planned for the next stage of this research.

1. Introduction

The continuous increase in the Earth’s population and economy, together with emerging new technologies and their energy needs, is leading to a nonlinear increase in energy demand. The current energy matrix still consists predominantly of fossil fuels (in 2022, fossil fuels accounted for 79% of total energy consumption) [1,2], and oil still represents the leading primary energy source (accounting for 33% of total primary sources) [1,3]. The growth of energy supply from gas and oil is expected to be provided by two types of sources: expanding older fields and developing deep and ultra-deep water stock or reservoirs [4]. Deep wells are suitable for electrically bottom-driven downhole applications, an area currently under intense development [5]. In fact, production using surface motor and expensive equipment through a long flexible-strain system is known to be inefficient [6]. Submersible pumps and other downhole equipment require external power. Electricity supply is typically provided either by retrievable “rechargeable batteries” or by a so-called “Tubing Encapsulated Cable” (TEC), which is used typically in oil or gas wells to provide power and communication to downhole electrical machines [7]. The cable needs to be able to withstand the high pressures, temperatures, and corrosive fluids found inside oil and gas wells. Supplying electricity to these gauges involves additional completion work and associated risks.
Completed oil and gas wells typically consist of multiple intervals of casing successively placed within one another, all of which surround the production tubing [8]. The existing tubing/casing structure of a well could be used as an electrical conductor for powering downhole equipment, thus eliminating the need for a cable. Common applications would require the casing to transmit approximately 100 kW–1 MW of power, raising several key questions regarding the practicality of this proposed solution. Low-voltage applications, such as RF transmissions, have proven to be safe; however, further investigation into the transmission of high current density and voltage is required to validate the concept.
Initial investigations have been focused on the use of well casing as a means for power transmission downhole to high-power equipment, such as pumps. The concept has been proven on low-power applications in the field for applications, such as RF signals and low-voltage equipment. A successful test in the lab was completed, demonstrating that the concept is possible for running a 15 HP pump. There is a need to advance this process to expand the capabilities and to power equipment in the well. The ultimate goal is to transmit single-phase AC to the well bottom and then convert it into three-phase power to operate the downhole equipment. There is an inherent limitation to single-phase power transmission down the casing due to the availability of only two conductors, the casing and the tubing. Further development and consideration are necessary to ensure safe delivery of higher power up to 300 kW.
A principal diagram of the system is shown in Figure 1a, with the existing design of the packer shown in Figure 1b.
The conceptual diagram presents the motor and pump positions at the end of the tubing string. The novel approach, marked in blue, provides single-phase AC electric supply through well piping to power the inverter. The “inverter” would be close to the isolator sub above the fluid level, possibly 3–6 joints from the pump. One pole (the zero phase of the electrical line) runs through the casing, packer slips, and along the production tubing to the inverter. The motor is powered by a phase cable that needs to pass through the entire packer. Certain challenges exist for the application of this innovation, and they require detailed research [9,10].
The focus of this study was set on particular problems related to the new concept of electric power supply through well piping, specifically the contact between the packer slips and the casing [11,12]. This is an important point in the development of this concept, and two groups of aspects of this problem have been identified:
  • High-voltage effects on the system:
    Arcing effects;
    Electric etching;
    Contact welding;
    Heating at current transfer interfaces.
  • Mechanical and chemical failure mechanisms in the system:
    Fatigue;
    Corrosion;
    Surface treatment and roughness.
These effects are examined in detail, including virtual prototyping of the mechanical behavior of contact surfaces, in addition to the existing research in this area [13,14,15,16].

2. Materials and Methods

The aspects listed above were examined according to their group categorization.

2.1. High-Voltage Effects

2.1.1. Arcing Effects

Arcing is a phenomenon by which current can travel across a gap between electrically charged surfaces. An electric arc is a current-intensive gas discharge that occurs when a switch is opened or as a result of a flashover (spark). The minimum voltage and current required for the generation and maintenance of a stable electrical arc depend on the contact material and the length of the air gap (the distance between the contacts). Due to the extremely high temperatures of the arc, the contact surface will melt. Finally, material migration between contact sides can lead to rapid wear of the contact. The resulting formation of craters and cones on the contact surfaces eventually leads to failure due to the mechanical interlocking of contacts and the reduction of the contact gap [17,18].
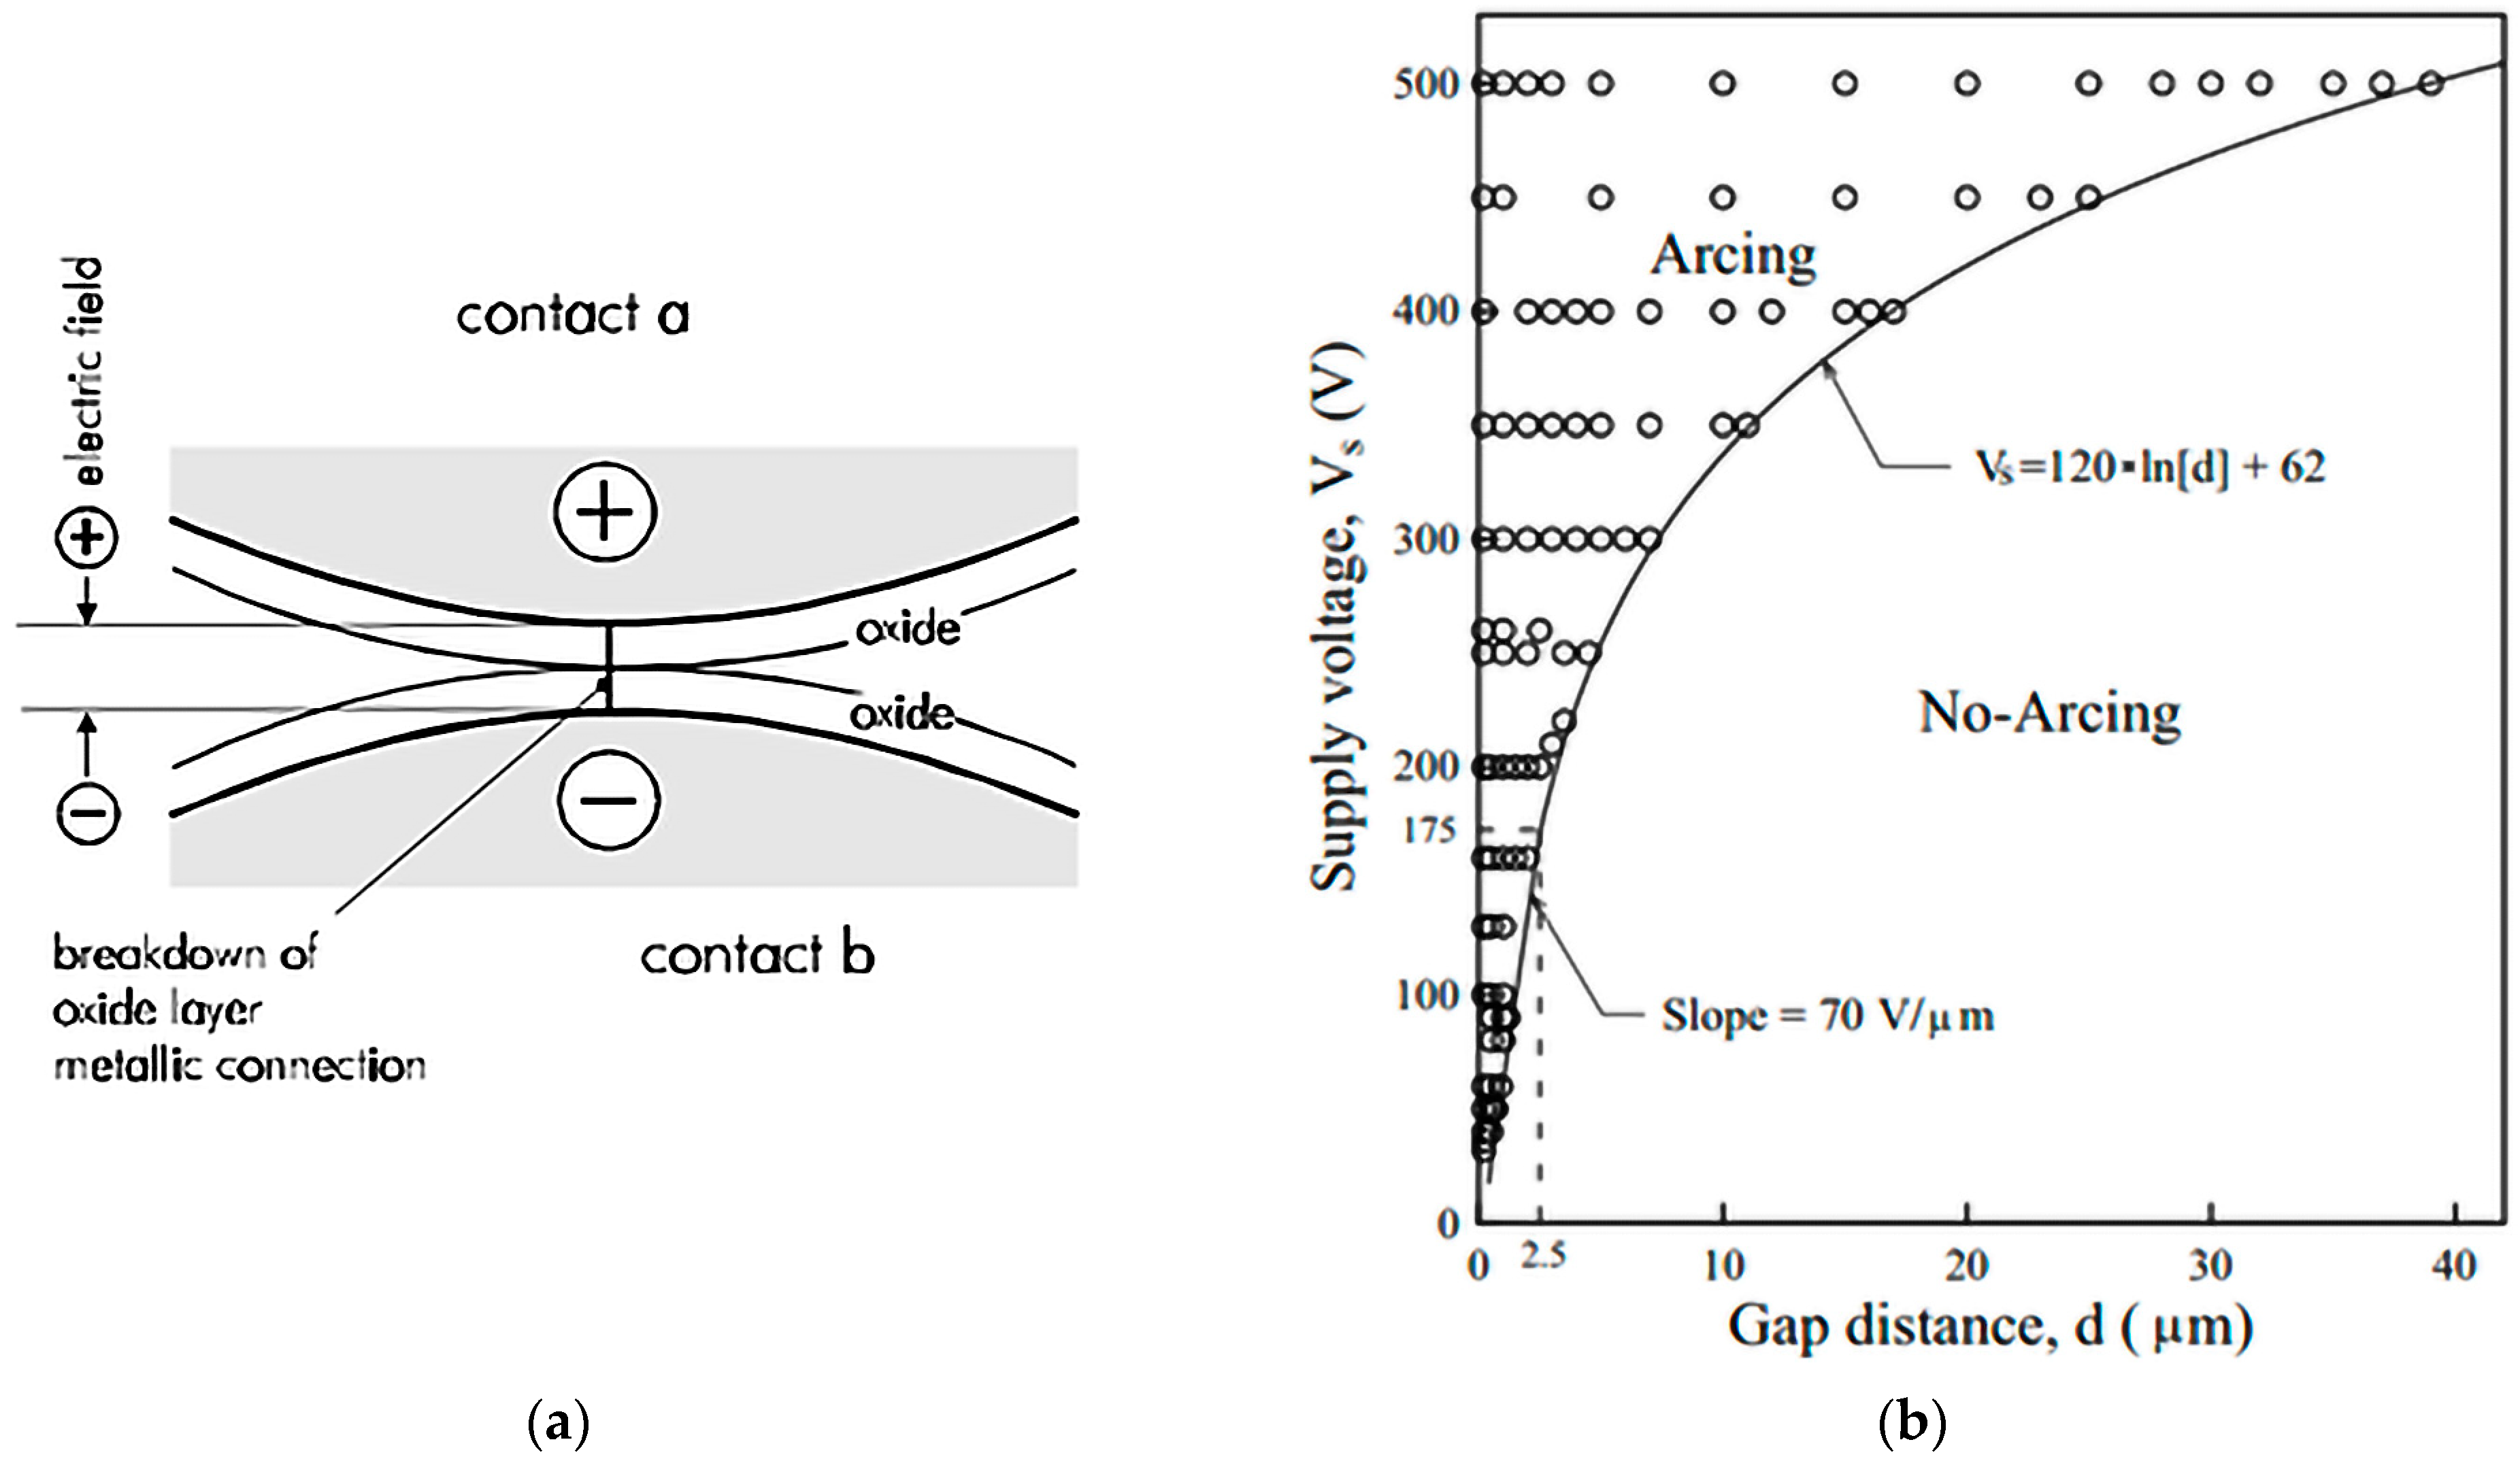
Assuming that packer slips are closed when they are not powered, a major reason for arcing could be the phenomenon known as contact fritting. This effect occurs especially when the layers have not been mechanically destroyed by the closing of the contacts, or if the contacts have been closed for a long period without conducting sufficient current, the electrical effect of fritting will contribute to establishing a metallic contact, despite the presence of layers on the effective contact area. The term fritting describes the electrical breakdown of the oxide/foreign layer when a sufficiently high voltage (fritting voltage) is applied across a closed contact (refer to Figure 2). Due to the applied voltage and the very short distance (the thickness of the layers) between the two potentials, an extremely high electric field is generated. The low-conductivity layer breaks down, and a small current is forced through very thin channels within the layer. The resulting local high-current density quickly heats the conducting channels, destroying the layers, until a metal-to-metal bridge is established, electrically linking the two surfaces.
This could cause arcing in the contact pair.
DC circuits, unlike AC circuits, do not have the advantage of self-extinguishing arcs, as the current does not cross zero every half cycle. Depending on the switching voltage, current, and load characteristics, the arc may remain stable for an extended period or fail to extinguish at all. The DC breaking capacity indicates the maximum switching current and voltage for a resistive or inductive load for the arc to be extinguished in 10 ms (this value is based on the maximum possible arcing time when switching resistive AC loads at 50 Hz). Above this limit, it cannot be certain that the arc will be extinguished.
It is known that arcs cause erosion, but surface morphology also influences arc behavior during dynamic switching contact tests. Moreover, mechanical stresses, molten bridges, and chunk transfer due to welding also result in erosion. Consequently, it is very difficult to develop a quantitative understanding of the erosion behavior of a material related to the arcing condition alone.
Data from static-gap experiments are available from tests performed with single arc discharge, conducted to reduce the complexity of numerous arcs striking [19]. The figure below shows the boundary between the arcing and no-arcing regions under a wide range of supply voltage and gap distance. When the gap distance is greater than 2.5 µm, the critical supply voltage is gradually increased with increasing gap distance. This critical supply voltage, VS (V), for gap distances greater than 2.5 µm, expressed in terms of gap distance d (µm), is given by [19].
V S = 120 · ln d + 62
Hence, it is seen in Figure 2b that at small gap distances, the arcing phenomenon is dominated by the gap distance, while it is significantly influenced by the supply voltage at the bigger gap distance. Air breakdown occurs at 70 V/µm up to 175 V, at 10 µm it occurs at 330 V, and at 40 µm it occurs at 500 V.
Preliminary calculations, based on a system operating voltage of 925 V (for arc-type packer slip teeth), show that air breakdown occurs at 1.3 mm (this value is for reference only).
Conclusions:
  • A reliable contact between packer slip teeth and the casing surface must be provided to avoid contact fritting;
  • Current switching should be performed when the packer slip is closed.

2.1.2. Electric Etching

Electric etching is a process by which material is removed from a surface because of melting and/or vaporization, along with pressure dynamics in the spark gap caused by the collapse of plasma channels. The appearance of an electric arc exhibits a non-linear relationship between current and voltage. Once the arc is established (either by progression from a glow discharge or by momentarily touching and then separating the electrodes), an increased current results in a lower voltage between the arc terminals. This negative resistance effect requires some positive form of impedance—an electrical ballast—in the circuit to maintain a stable arc. This property is the reason uncontrolled electrical arcs in equipment become so destructive, since, once initiated, an arc will draw more and more current from a fixed-voltage supply until the equipment is destroyed [20,21,22].
Electric discharge (electric etching) can be avoided by eliminating one (or several) of the next four deficiencies: capacitance, charge (voltage across capacitance), isolation, and isolation failure. Generally, the energy in the arc evaporates the steel, creating a crater. Its overall dimensions can be calculated as follows:
d = k·∛(U2·C)
where
  • k—units-related coefficient (k = 0.1 when units are µm, V, and nF);
  • U—voltage, V;
  • C—capacitance, nF.
If a detailed microstructure analysis of surface samples is performed, it can be observed that in the damaged part, the surface appears crumpled, as if composed of a large number of small half-ball particles. In a different area, small depressions have small half-ball particles settled in them. These exhibit a typical martensitic structure with fine carbide particles characteristic of the given steel. A thin non-corroding layer appears on the surface. These surface features provide the context for understanding the effects of electric etching, which can alter the microstructure observed.
Microfarads and hundreds of volts produce shallow craters. But the principle holds—more capacitance and more voltage create larger craters. Low capacitance values (1–10 nF) and low voltages (5–15 V) produce craters in the 1 μm range. Electric etching only occurs when there is a potential difference across the material; in other words, a voltage difference must exist between the packer and the tubing. This voltage difference can be created in four different ways: capacitive coupling; inductive coupling; conducted coupling (frame voltage due to high ground impedance); radiated coupling (externally coupled energy).
Having described these fundamental principles, etching intensity can be evaluated through the calculation of the linear etching velocity of the anodic material solvent using the following formula:
Vh = η·εv·(U/d)·σ
where
η = 0.87 = cosφ—electrical power factor;
εv = 2.2 mm3/A·min—volumetric electrochemical equivalent for steel;
U—applied voltage;
d = 4.1, mm—minimal distance between packer and casing;
σ = 2 × 10⁻¹¹, S/m—electrical conductivity of mineral oil.
As shown in the above equation, the conductivity of the fluid media (such as mineral oil, mud, and oil-based drilling fluids) has a major influence on etching. Generally, these fluids have low relative conductivity. The above parameter is also illustrated in the next diagram, where the electrical resistivity of mineral oil varies with humidity. The worst-case value is used in the calculation shown above.

2.1.3. Electric Arcing and Etching Summary

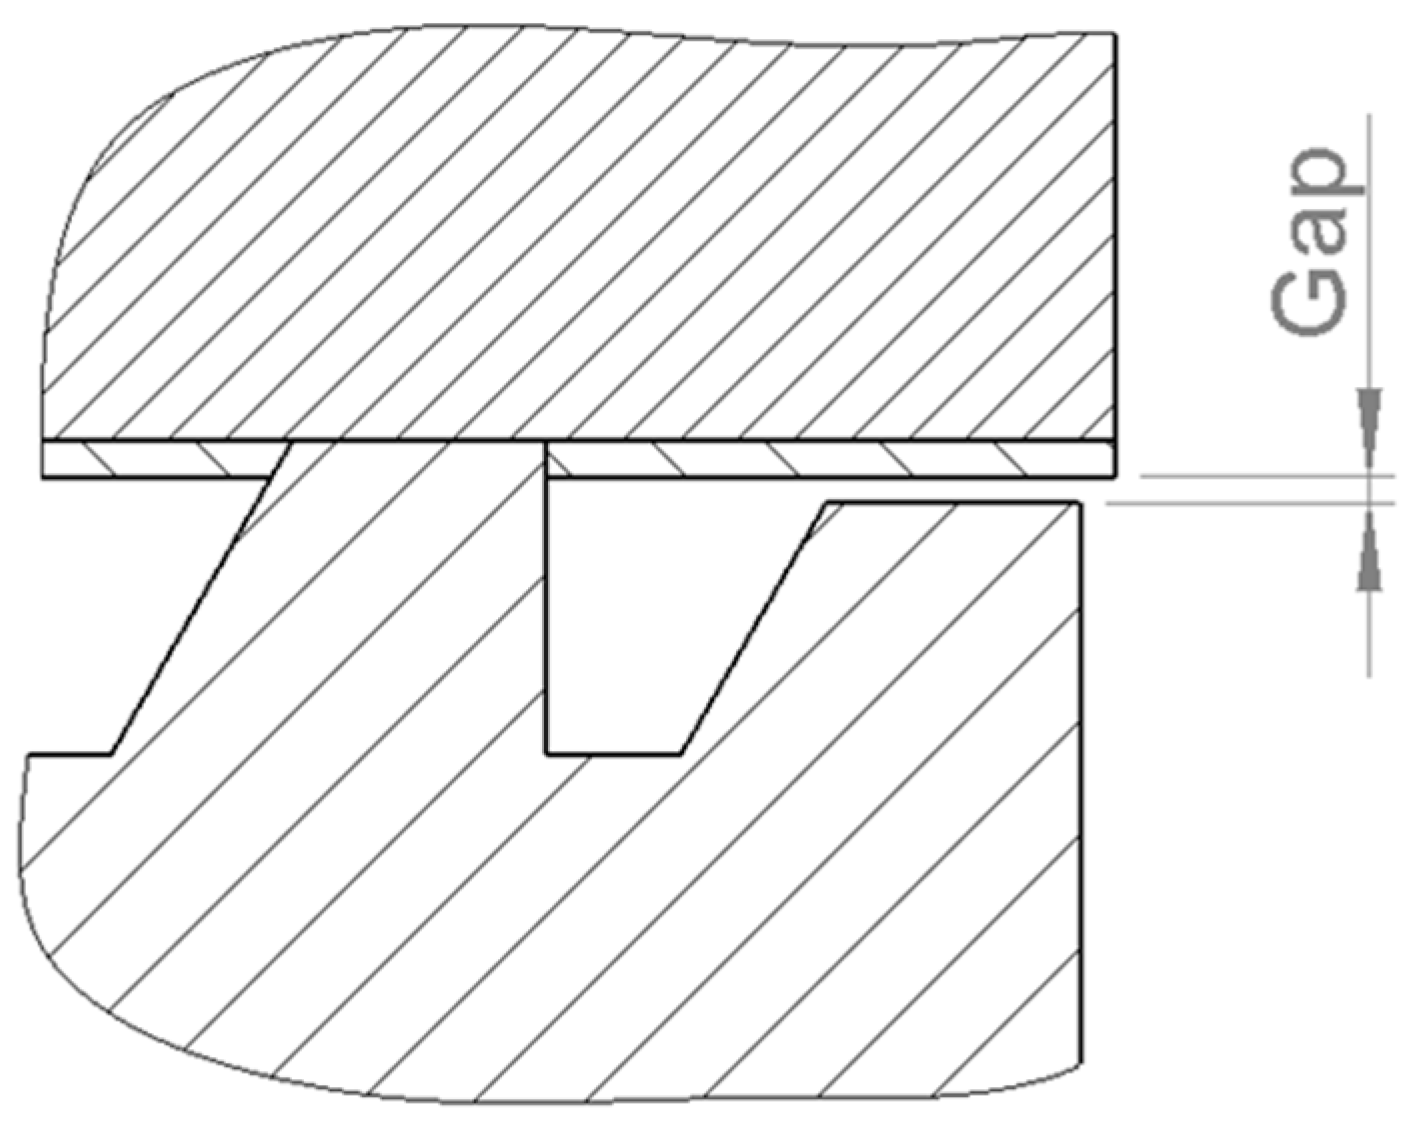
A review of both effects shows they are highly influenced by contact distances (gaps). Such gaps could be the result of geometry or contact force application variations, as shown in Figure 3.
These gaps can be avoided with a proper mechanism that will guarantee good contact for all teeth. The mechanism also should allow for contact conditions that will not result in contact welding. Balance among these effects was researched and evaluated through a structural analysis of the contact pair. This analysis inspected the contact area in detail to evaluate the overall behavior. Some of the calculations, including the above (for etching linear velocity), are continued further.

2.1.4. Contact Welding

A welded joint can form between contacting parts in three different ways [23,24]:
  • The first option is by electric arc in the contact area. It is unlikely for this option to occur due to the following circumstances: the absence of switching (on or off) under voltage, and relatively high pressure (30 MPa) during current flow. For a micro-arc to ignite during current flow through a closed contact, it is necessary for the voltage across the connection to exceed the ionization potential of the medium. Since the drop in contact resistance is not expected to exceed 0.1V, the occurrence of this mechanism is unlikely.
  • The second option involves the possibility of cold pressure welding occurrence in the contact system. This option, however, is not applicable in steel, where temperatures (up to 100 °C ÷ 150 °C) are insufficient to conduct effective diffusion processes in the joining area.
  • The third option is the formation of a compound through increased welding resistance (resistance flash welding is not applicable). This requires volumetric flow of plastic deformation in the joining area and an increase in temperature to a value close to the solidus temperature (typically 0.8 of the melting temperature expressed in Kelvin degrees). For this process to happen, the current density should be in the range of 15 to 30 A/mm2, but in some instances the welding current density reaches 3000 A/mm2. Based on the material properties and the initial conditions, it can be argued that such a compound cannot be formed. However, heating of the system components should be analyzed to confirm that the probability of forming individual welded sections is very low.
The contact system works in continuous mode. The processes of heating and cooling were examined. The temperature in the contact area was determined under the assumption was that the temperature variation range is relatively small. Therefore, a linear differential equation of the thermal conductivity can be used to describe the temperature field. Thus, it is possible to use the principle of superposition to determine the temperature rise of each existing heat source and then sum these temperature differences.
The identified heat sources are as follows: the tubing is heated by the flowing electricity, each contact part is heated by the current flowing through it, and adjacent parts are heated by the energy released from the resistance of the contact system. It is assumed that heat transfer is achieved through the outer and inner surfaces of the pipe and the circumferential surface of the slips.
Ignoring the heat transfer between slips and other mechanical components resulted in higher temperatures in the contacting zone.
The excess temperature of the contact parts in relation to the ambient temperature was determined as follows:
∆T = ∆T1 + ∆T2 + ∆T3
where
  • ΔT1 is the excess temperature of the contact parts forming the contact system over the ambient temperature. This excess is determined by the heat generated by the current through the contact parts and heat removal. The highest value occurs in the tubing and is used;
  • ΔT2 is the excess temperature of the contacting zone over the temperature of the contact parts;
  • ΔT3 is the excess temperature of the effective area of the contact parts over the temperature of the conditioned area of the contact parts.
Determination of the Temperature Increase in the Tube from the Current Flow
Since the tubing is warmer, the thermal energy generated by the electrical current is conducted through its surface. The conditions of heat generation and transfer are the same for any section perpendicular to the tube axis. Therefore, the following ratio can be used:
T 1 = I 2 · ρ S t · α t o · S O + α t i · S i
where
I—total value of the current through the tube;
St = 2600.3 mm2—sectional area of the tube in the area of contact in a plane perpendicular to the flow of current;
αto = 8 W/(m2.K)—heat removal coefficient for outside the tube surface;
αti = 5 W/(m2.K)—heat removal coefficient for inside the tube surface;
So = 438,880 mm2—outer surface of 1 m from the tube;
Si = 399,925 mm2—inner surface of 1 m from the tube;
ρ = 2.63 × 10⁻⁷—electrical resistivity.
Determination of the Excess Temperature at the Area of Contact over the Temperature of the Contact Parts
The temperature difference is defined as follows:
T 2 = I 6 2 · R C S · l 2 · α t i + α t o 2 · 2 · λ 1 · λ 2 λ 1 + λ 2 · S S + l · S o 3 · S 1
where
λ1 and λ2 are the thermal conductivities of the tube and the slip materials;
Ss = 7500 mm2 is the free surface of a slip;
l = 50 mm is the size of the contact surface in the direction of flow of the current;
S1 = 334.09   m m 2 is the sectional area of the tube in the area of contact in a plane perpendicular to the flow of current;
RCS is the resistance of contact system, calculated by the following equation:
RCS = RC + Rd
where
RC is the contact resistance, determined by
R C = 0.157 · ρ 1 + ρ 2 · S m · H / β · σ · A s
where
H—micro-hardness of the workpiece from the contact system with lower specifications;
Sm—average step of the roughness profile; when cleaned with a wire brush and with roughness of 2.5 to 5 μm, the actual ratio is Sm/Ra = 70;
β = A C / A b —the area ratio of the contact spot (Ac—conductive area of the contact and Ab—total area of contact). The calculation is performed for several values of β;
σ—contact pressure;
ρ1, ρ2—electrical resistivity of the tube and the slip materials.
The resistance of the parts into contact area (Rd) can be calculated with the following formula:
R d = k c · ρ 1 + ρ 2 2 · l S 1 + S 2
The coefficient of distortion of the current lines in the contact area may be taken as kc = 1.5. According to the conceptual design, the middle area of the section of the slip in the plane perpendicular to the flow of current is calculated as S2 = 473.5 mm2.
Substituting the values into formula [22] gives Rd = 23.73 μΩ.
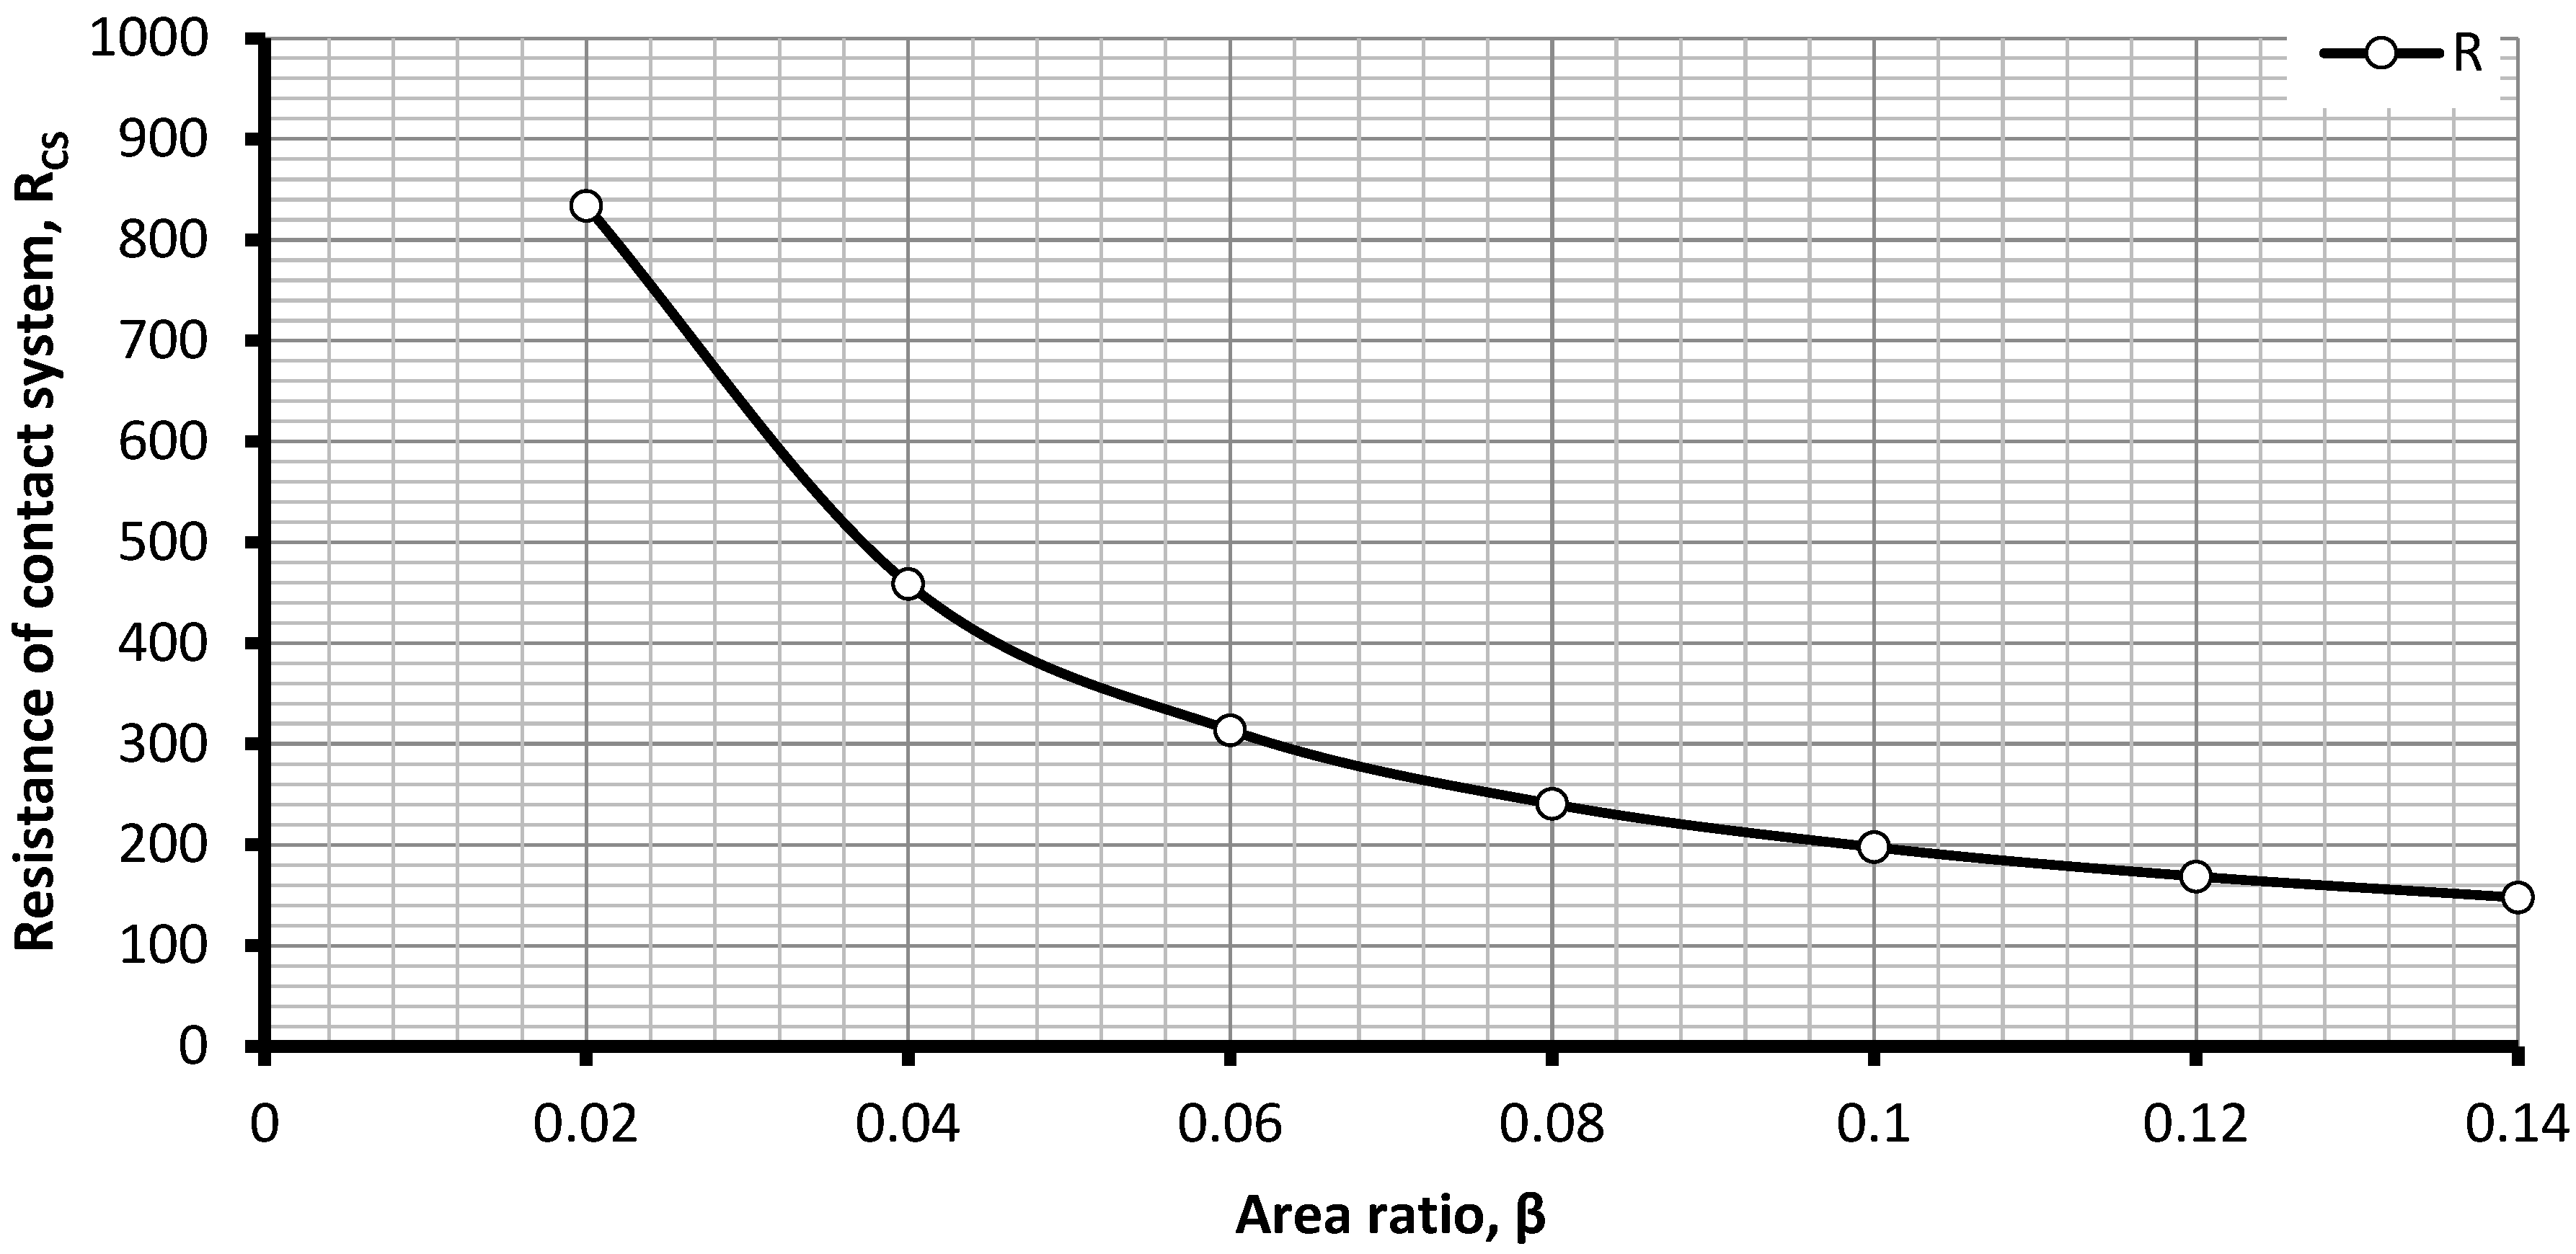
The obtained results for the above-described resistances, calculated by Formulas (7)–(9), are shown in Figure 4, as a function of the area ratio β.
Determination of the Excess Temperature of the Effective Area of the Contact over the Temperature of Conditioned Area of the Contact
This excess (gradient) is calculated as follows:
T 3 = I 6 2 · R C S 2 8 · 2 · λ 1 · λ 2 λ 1 + λ 2 · ρ 1 + ρ 2 2
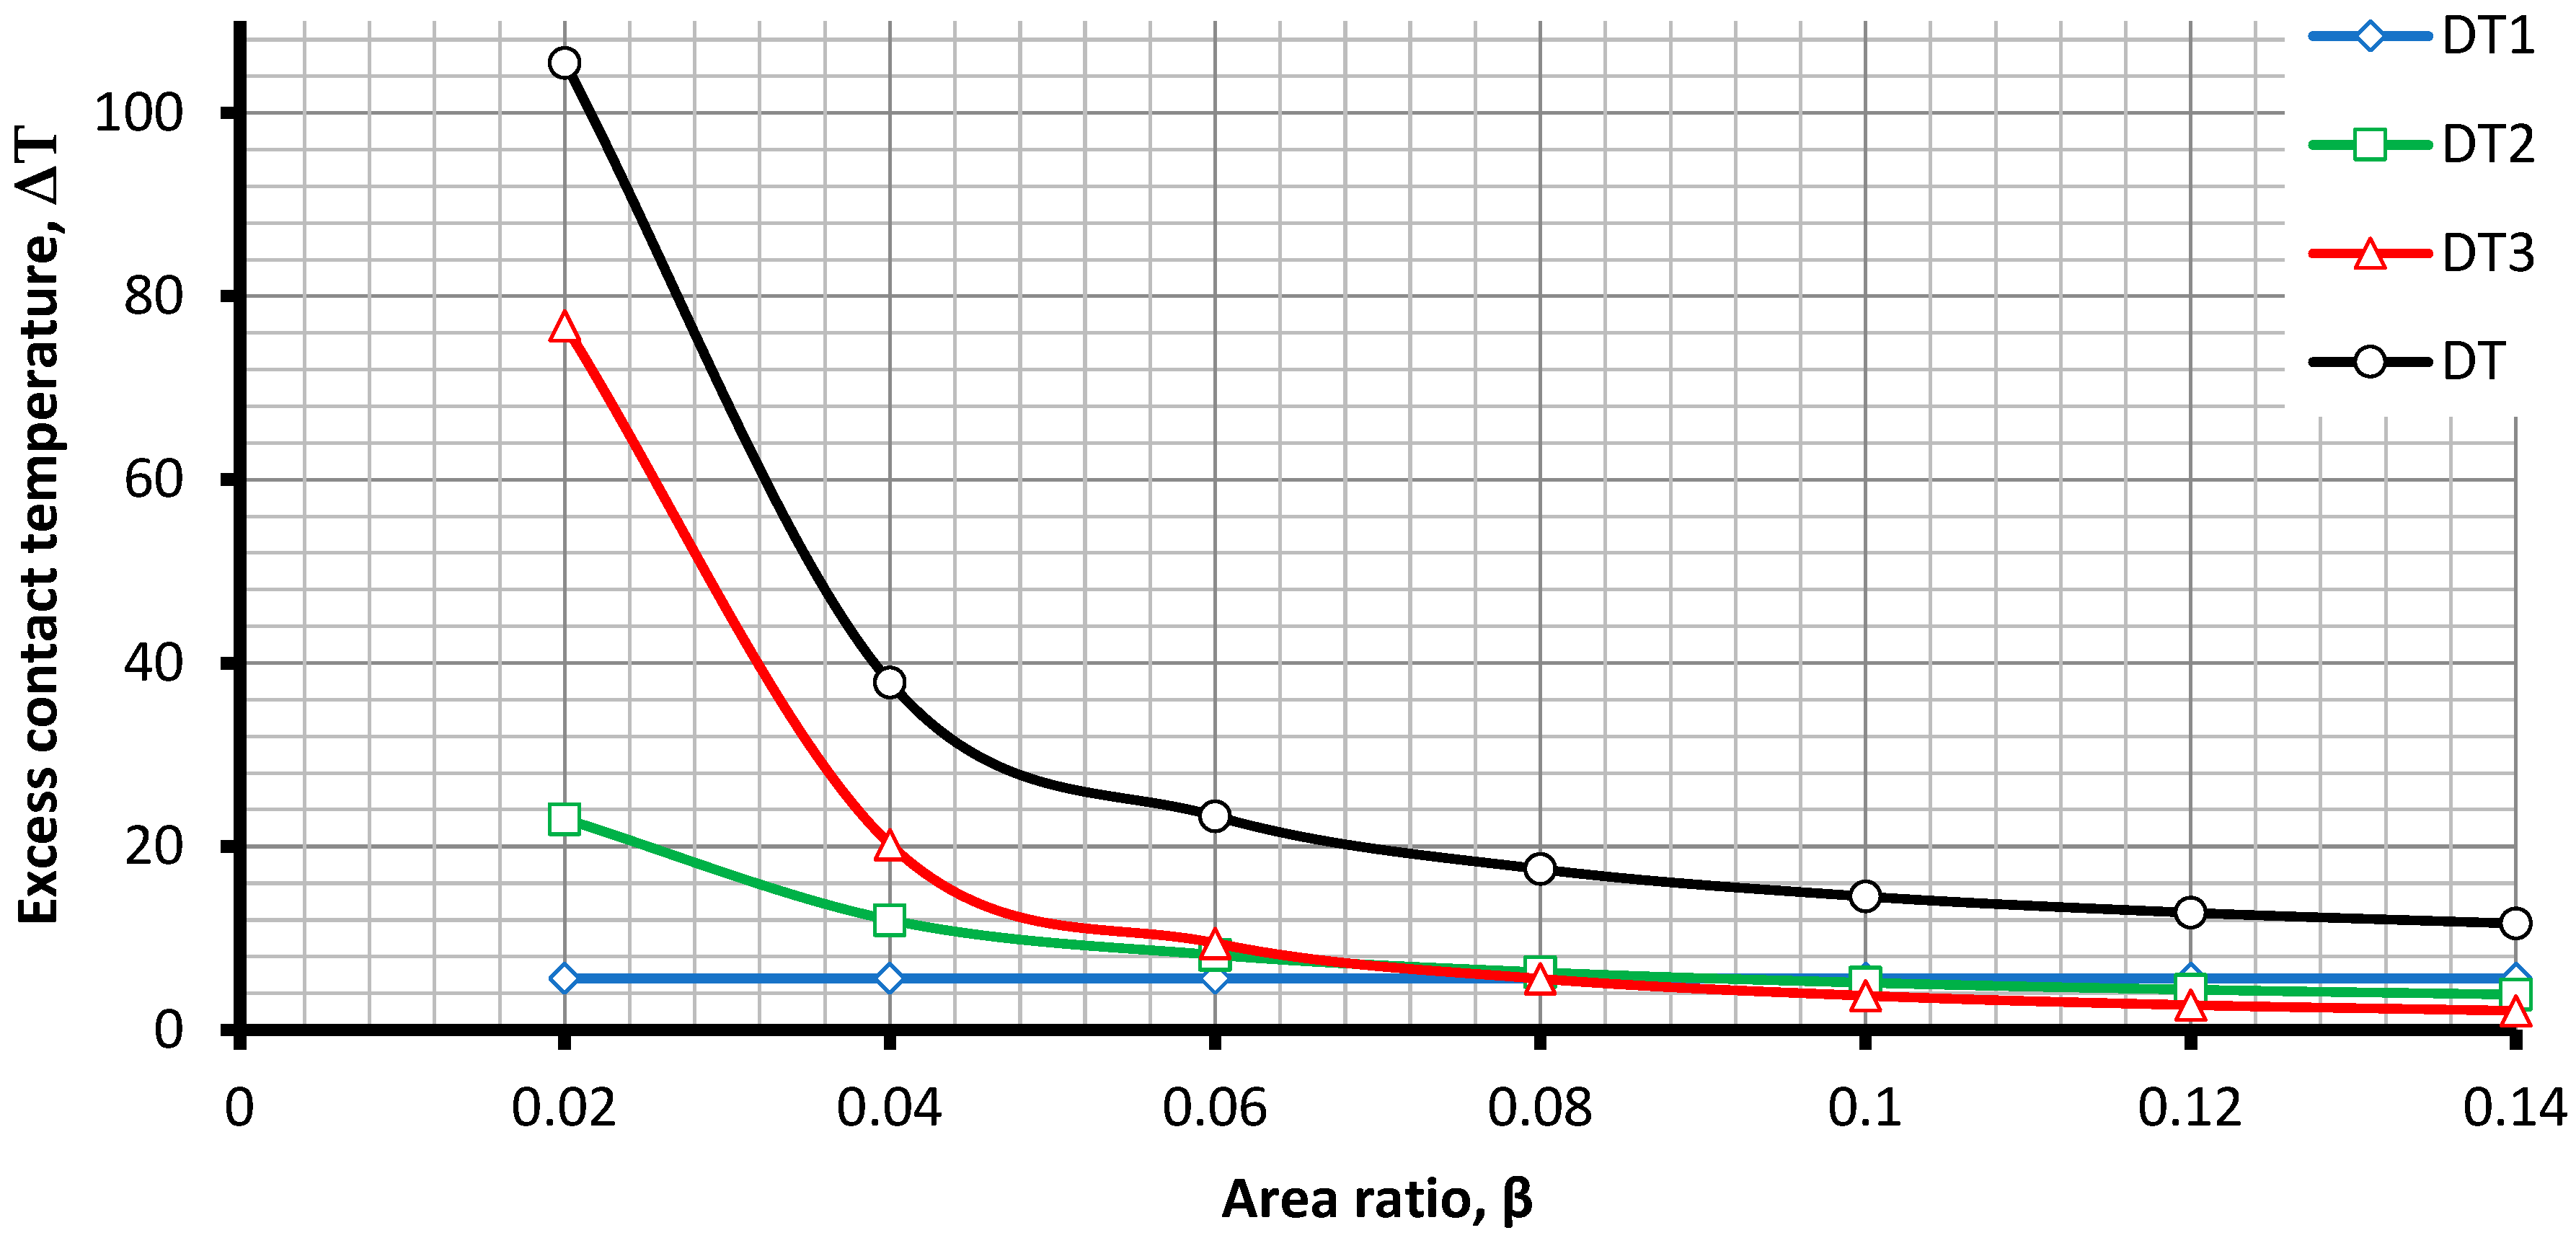
The calculated results of the contact temperature (and its components) are summarized in Figure 5.
Another possible effect is the field electron emission. This generally results in the emission of electrons (from the cathode). This was not reported because even when accounting for the Schottky tunnel effect, the current density is very low. In this case, it can be shown that the total current density from both thermal and field emission is approximately 4.10−90 A/m2.
Important material parameters, such as thermal conductivity and electrical resistivity, also change with temperature changes. There is a relatively simple formula to determine this effect. The analysis was performed with material properties at 1000 °C. Thus, this problem was eliminated. At lower temperatures, less heat will be generated.
The analysis found that there were no temperature conditions for the formation of the welded joint. The degree of tread cleanliness substantially affects the temperature of the effective area of the contact and should be consistent with the requirements for maximum temperature contact surfaces.

2.1.5. High-Voltage Effects—Summary

Several Assumptions Can Be Made Based on the Performed Research Regarding High-Voltage Effects (Arcing, Etching, Welding, and Heating)
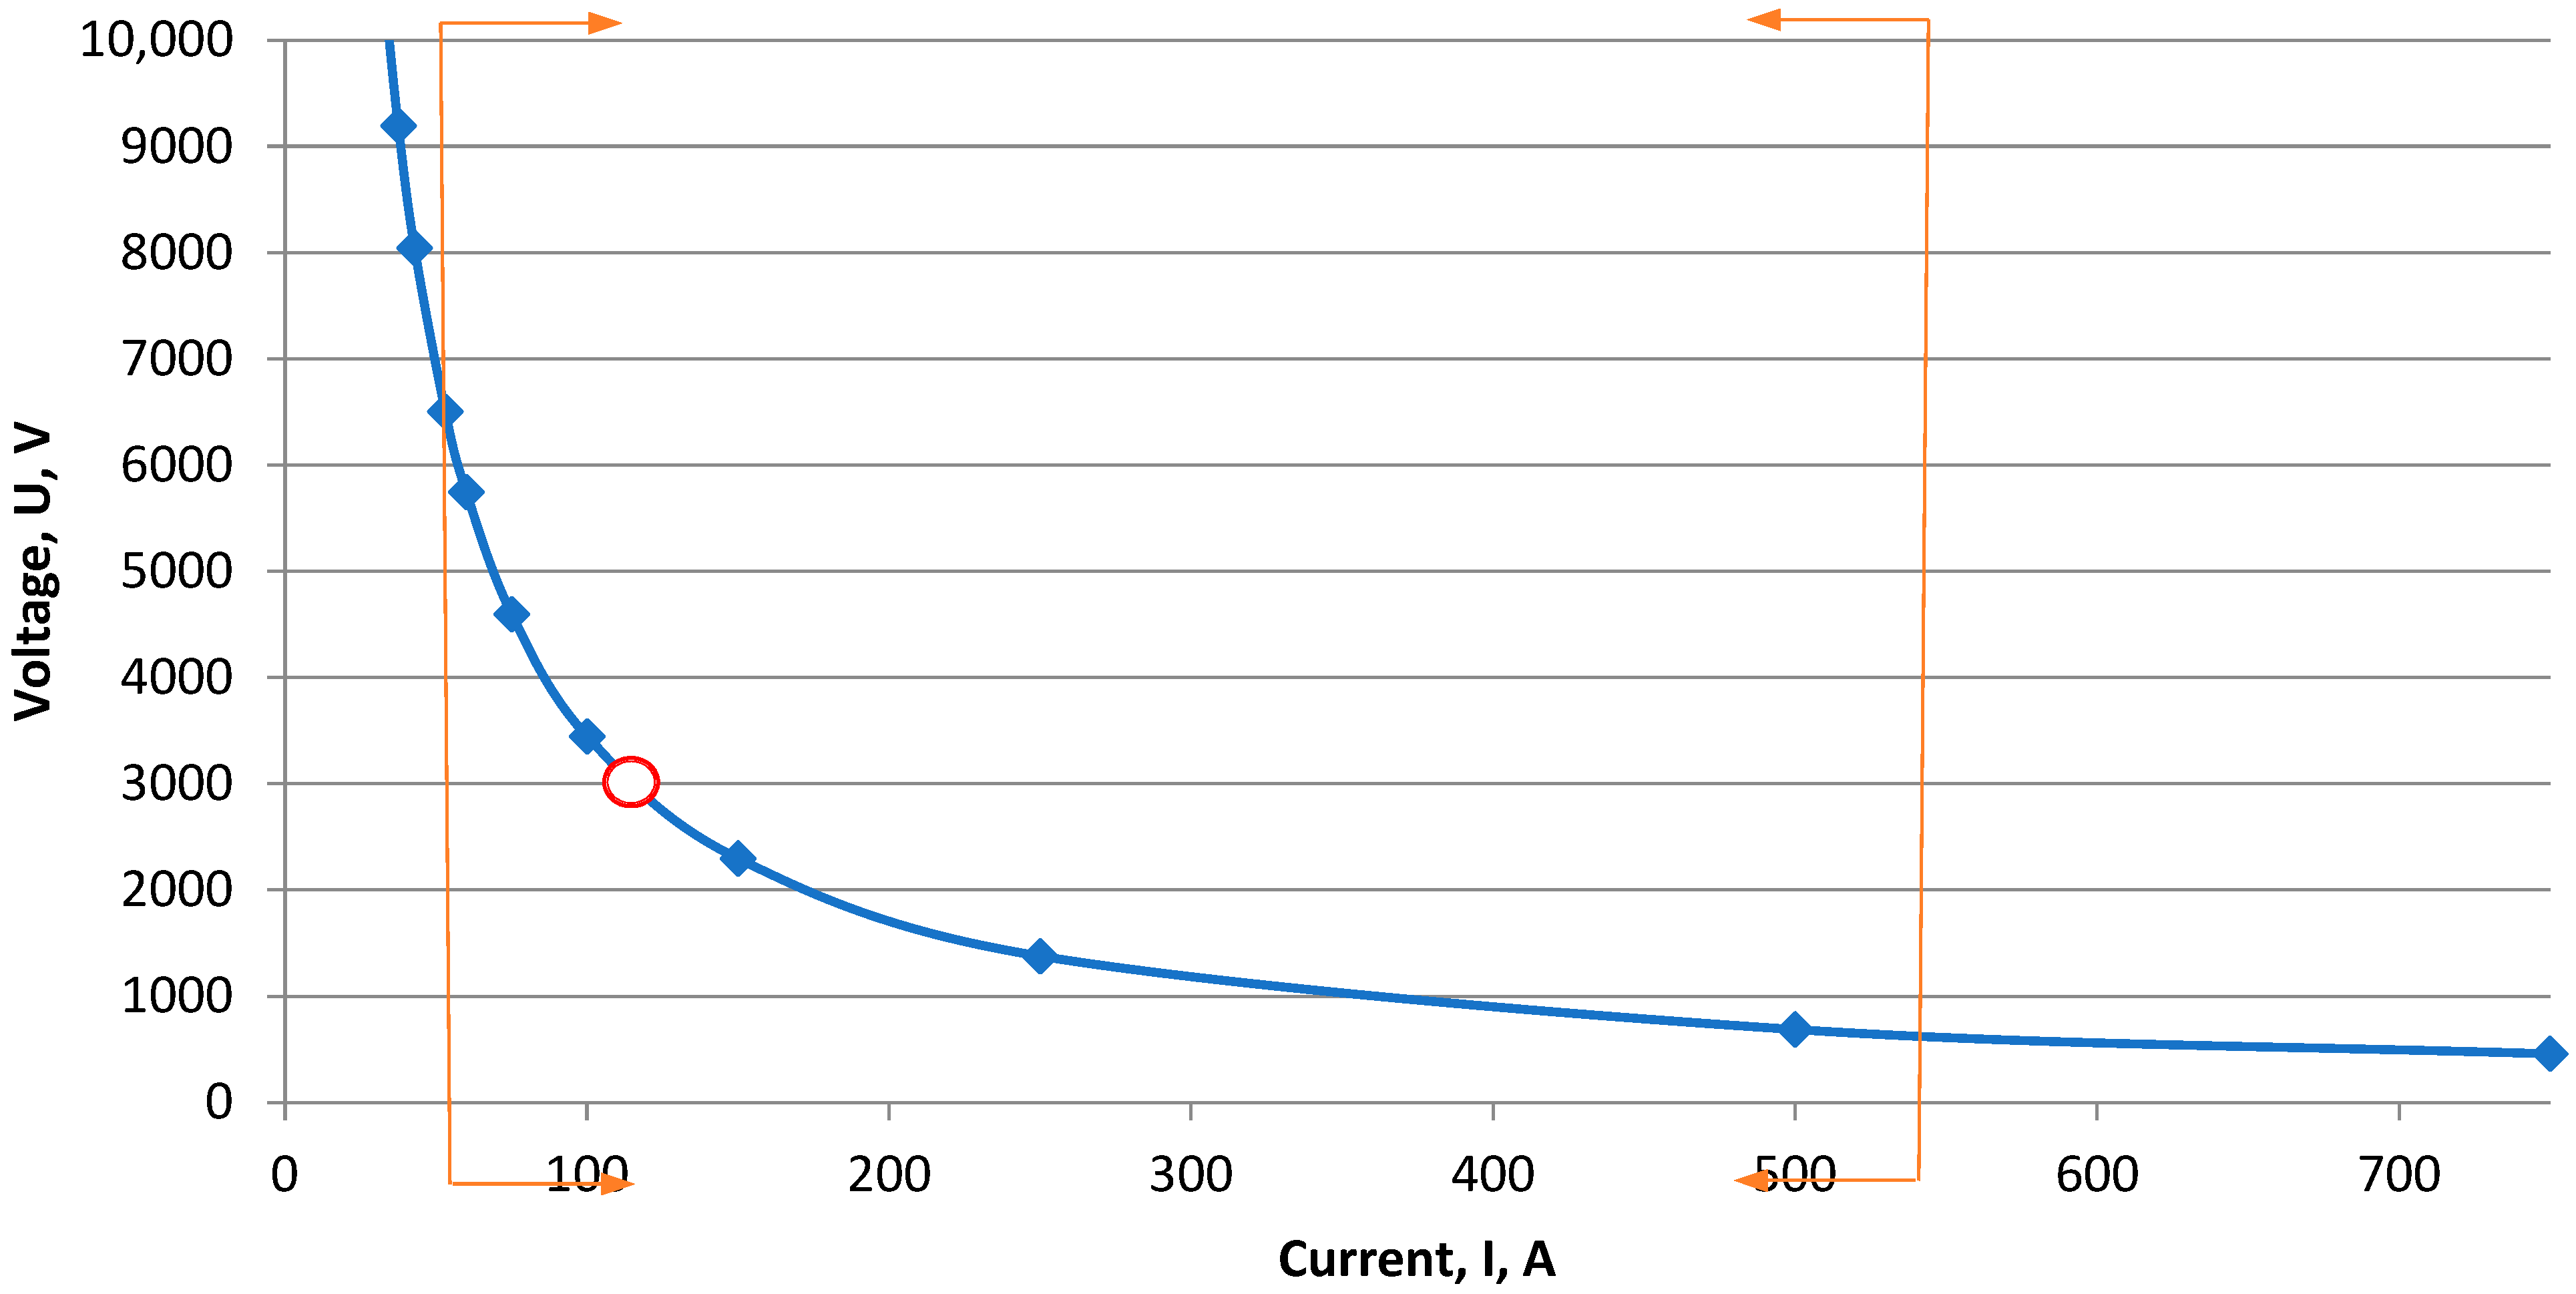
  • The main goal here was to determine possible combinations of voltage and current that will result in 300 kW electric power transfer. Thus, the function
    U = 3000 I · cos φ
    can be used, and it is graphically presented in Figure 6 for cosφ = 0.87.
  • Next, current density through the contact pair should be considered as a limitation. This is defined by the study of contact welding process possibilities, where examined values vary from 3 A/cm2 up to 30 A/cm2 (expected maximum possible value). Corresponding current values of 53 A and 530 A are shown as limiting lines in Figure 6.
  • The second limitation results from the study of arcing effects. Assuming that the current will be switched on after slip activation, calculations show that it does not influence voltage choice.
  • The third limitation is the breakdown voltage between two conducting bodies—the casing and the production tube (the nearest point of the production tube is the connector, about 16 mm away from the casing). Paschen’s law can be applied, simplified by performed tests, as the following formula to determine breakdown voltage through dry air at standard atmosphere pressure [25]:
V B R = 24.22 · d + 6.08 · d = 46 kV
where
d = 1.6 cm—minimal distance between casing and production tube.
Thus, this is also not a limitation, as the maximal voltage (at a current density of 3 A/cm) is 6.5 kV.
At this point, two voltage variants can be used, based on previous stage calculations: 925 V and 3 kV. These values will be used for further verification calculations.
  • The fourth limitation is related to electric etching, specifically the linear etching velocity. The corresponding values for both voltage variants are shown for steel to steel contact as follows:
    For U = 925 V, the linear etching velocity is 4.5 μm/year;
    For U = 3 kV, the linear etching velocity is 14.5 μm/year.
The above calculated values show that the etching process does not occur when working in a mineral oil environment at both examined possible voltages;
  • Finally, the approximate power losses (considering only the main conducting bodies—the production tube and the casing, initially excluding the gap-sub joints and all contact resistances) are to be calculated for the two possible voltage variants—925 V and 3 kV. These values correspond to currents of 372.6 A and 115 A. Assuming a tube length of 3700 m, a casing pipe of 5.5”, and production tubing of 2.375”, the corresponding overall power losses can be calculated as follows:
P = I 2 · ρ · L A P T + A C A S
where
APT = 8.41 × 10⁻⁴, m2—cross section of production tubing;
ACAS = 2.91 × 10⁻³, m2—cross section of casing pipe;
ρ = 6.9 × 10⁻⁷, Ω·m—electrical resistivity of conductors;
L = 3700 m—conductor’s overall length.
Thus,
○  For I = 372.6 A (at 925 V), the overall power loss is 94.5 kW;
○  For I = 115 A (at 3 kV), the overall power loss is 9 kW.
Additional work will be performed in the next stage of the electric field analysis.

2.2. Mechanical and Chemical Failure Mechanisms

2.2.1. Fatigue

Damage can be caused by loads considerably lower than the tensile or yield strengths of the material under static fluctuating/cyclic stresses. This damage is caused by movement misalignments in the crystalline metal, resulting in the formation of intrusions and extrusions, referred to as fatigue. Such damage resembles a brittle fracture, as the damaged surfaces are flat and perpendicular to the stress axis. The specifics of fatigue failure, however, are quite different from those of a static brittle fracture arising from three stages of development. Stage I involves cyclic loads and deformations that initiate microcracks, followed by crystallographic propagation that extends from two to five grains around the origin. Stage I cracks are not easily recognizable. Stage II progresses from microcracks to macrocracks, resulting in parallel, plateau-like fracture surfaces. These surfaces are generally smooth and normal to the direction of maximum tensile stress. These cracked surfaces open and close under friction due to cycling, and the overall behavior depends on changes in the level or frequency of loading, as well as the active corrosion processes. Stage III occurs when the material’s stiffness is insufficient, resulting in a sudden, rapid fracture. It could be brittle, ductile, or a combination of both. Sometimes, there are marks and patterns, called chevron lines, showing the initial cracks [26,27].
A major characteristic of fatigue is that it occurs at fluctuating loads. The application to the packer workloads can be divided into two groups:
  • Steady loads—basically, these are the loads applied by the packer slips when connected to the casing (borehole wall);
  • Fluctuating loads—these loads result in thermal stresses in slips and casing near their contact zone, caused by switching power supply.
There is also another possible influence: corrosion fatigue [28,29]. Chemical reactions induce pits, which act as stress raisers. Corrosion also enhances crack propagation. The corrosive environment will decrease the product fatigue resistance, which is attributed to the roughening or pitting of the surface by the corrosive material. The endurance limit is difficult to determine, as corrosion and stressing occur simultaneously, because the part will fail when subjected to cycling in a corrosive environment. There is no clear fatigue limit, and the main goal is to minimize the factors that affect fatigue life, including mean or static stress, alternating stress, electrolyte concentration, dissolved oxygen in the electrolyte, the characteristics of the used material, temperature, load variation, and fluid flow parameters.
Some prerequisites to corrosion fatigue are listed below:
  • Electrolytic Plating: Metallic coatings (plating) with chromium, nickel, or cadmium reduce the fatigue limit by half, making it necessary to eliminate the plating process. Other platings, such as zinc, do not affect the fatigue strength. Light alloys, with anodic oxidation, lead to a nearly 40% reduction in the fatigue limit for bending, but it do not affect torsional fatigue.
  • Metal Spraying: This reduces the fatigue limit by about 15% of due to surface imperfections that can initiate cracks.
  • Fretting Corrosion: This is caused by small relative displacements in tightly assembled components, such as bolted connections, wheel hubs, etc. The process is also referred to as pitting and leads to eventual failure due to fatigue.
In examining fatigue, these thermal stresses are particularly interesting and represent another aspect of contact resistance. The following are the two types of thermal cycling:
  • Low-frequency thermal cycling;
  • High-frequency thermal cycling.
Thermal stresses arise when thermal strain, which can be either expansive or constrictive, is totally or partly constrained. Repetition of these thermal transients can result in thermal fatigue of the component. In many engineering applications, thermal stresses are superimposed on primary stresses, which arise from pressures, mechanical end loads, and constraints. Severe temperature changes, combined with mechanical loading, may induce plastic deformation in surface layers, which could result in the initiation of cracks even in 5 × 10⁴ cycles [30]. Thermal and thermal–mechanical fatigue is, therefore, mostly an anisothermal low-cycle fatigue process.
Failure modes for metal parts subjected to thermal cycling/thermal fatigue can be classified as follows:
  • Brittle materials (for instance, cast iron): initiation of cracks in the hot zone of the component (thermal cycling), and probable propagation through the section.
  • Ductile iron materials: severe distortion, leading to general failure.
  • All materials, when improper materials are selected or with insufficient design stiffness: general cracking through the entire section during the first few cycles, known as low-cycling fatigue.
  • Failures caused by problems in production technology: materials with lower mechanical properties because of process variations, leading to the premature failure of components.
Fatigue analysis will be performed based on the preliminary combined results from steady loads (as preload) and acting thermal stresses. Thermal stresses in the components cannot be directly measured and must be estimated through finite element analysis using appropriate constitutive models, which are of tremendous importance in predicting inelastic strains and stress redistributions. The searched results include safety factors, life cycle predictions, and critical zones for each component.
This is planned to be performed in the next stage of the research, and it is not included in the current study.

2.2.2. Electrochemical Corrosion and Corrosion Protection

Corrosion is always caused by a potential difference between the metallic material (e.g., pipeline) and its environment. It is an electrochemical process that results in the removal of material from the metal surface material.
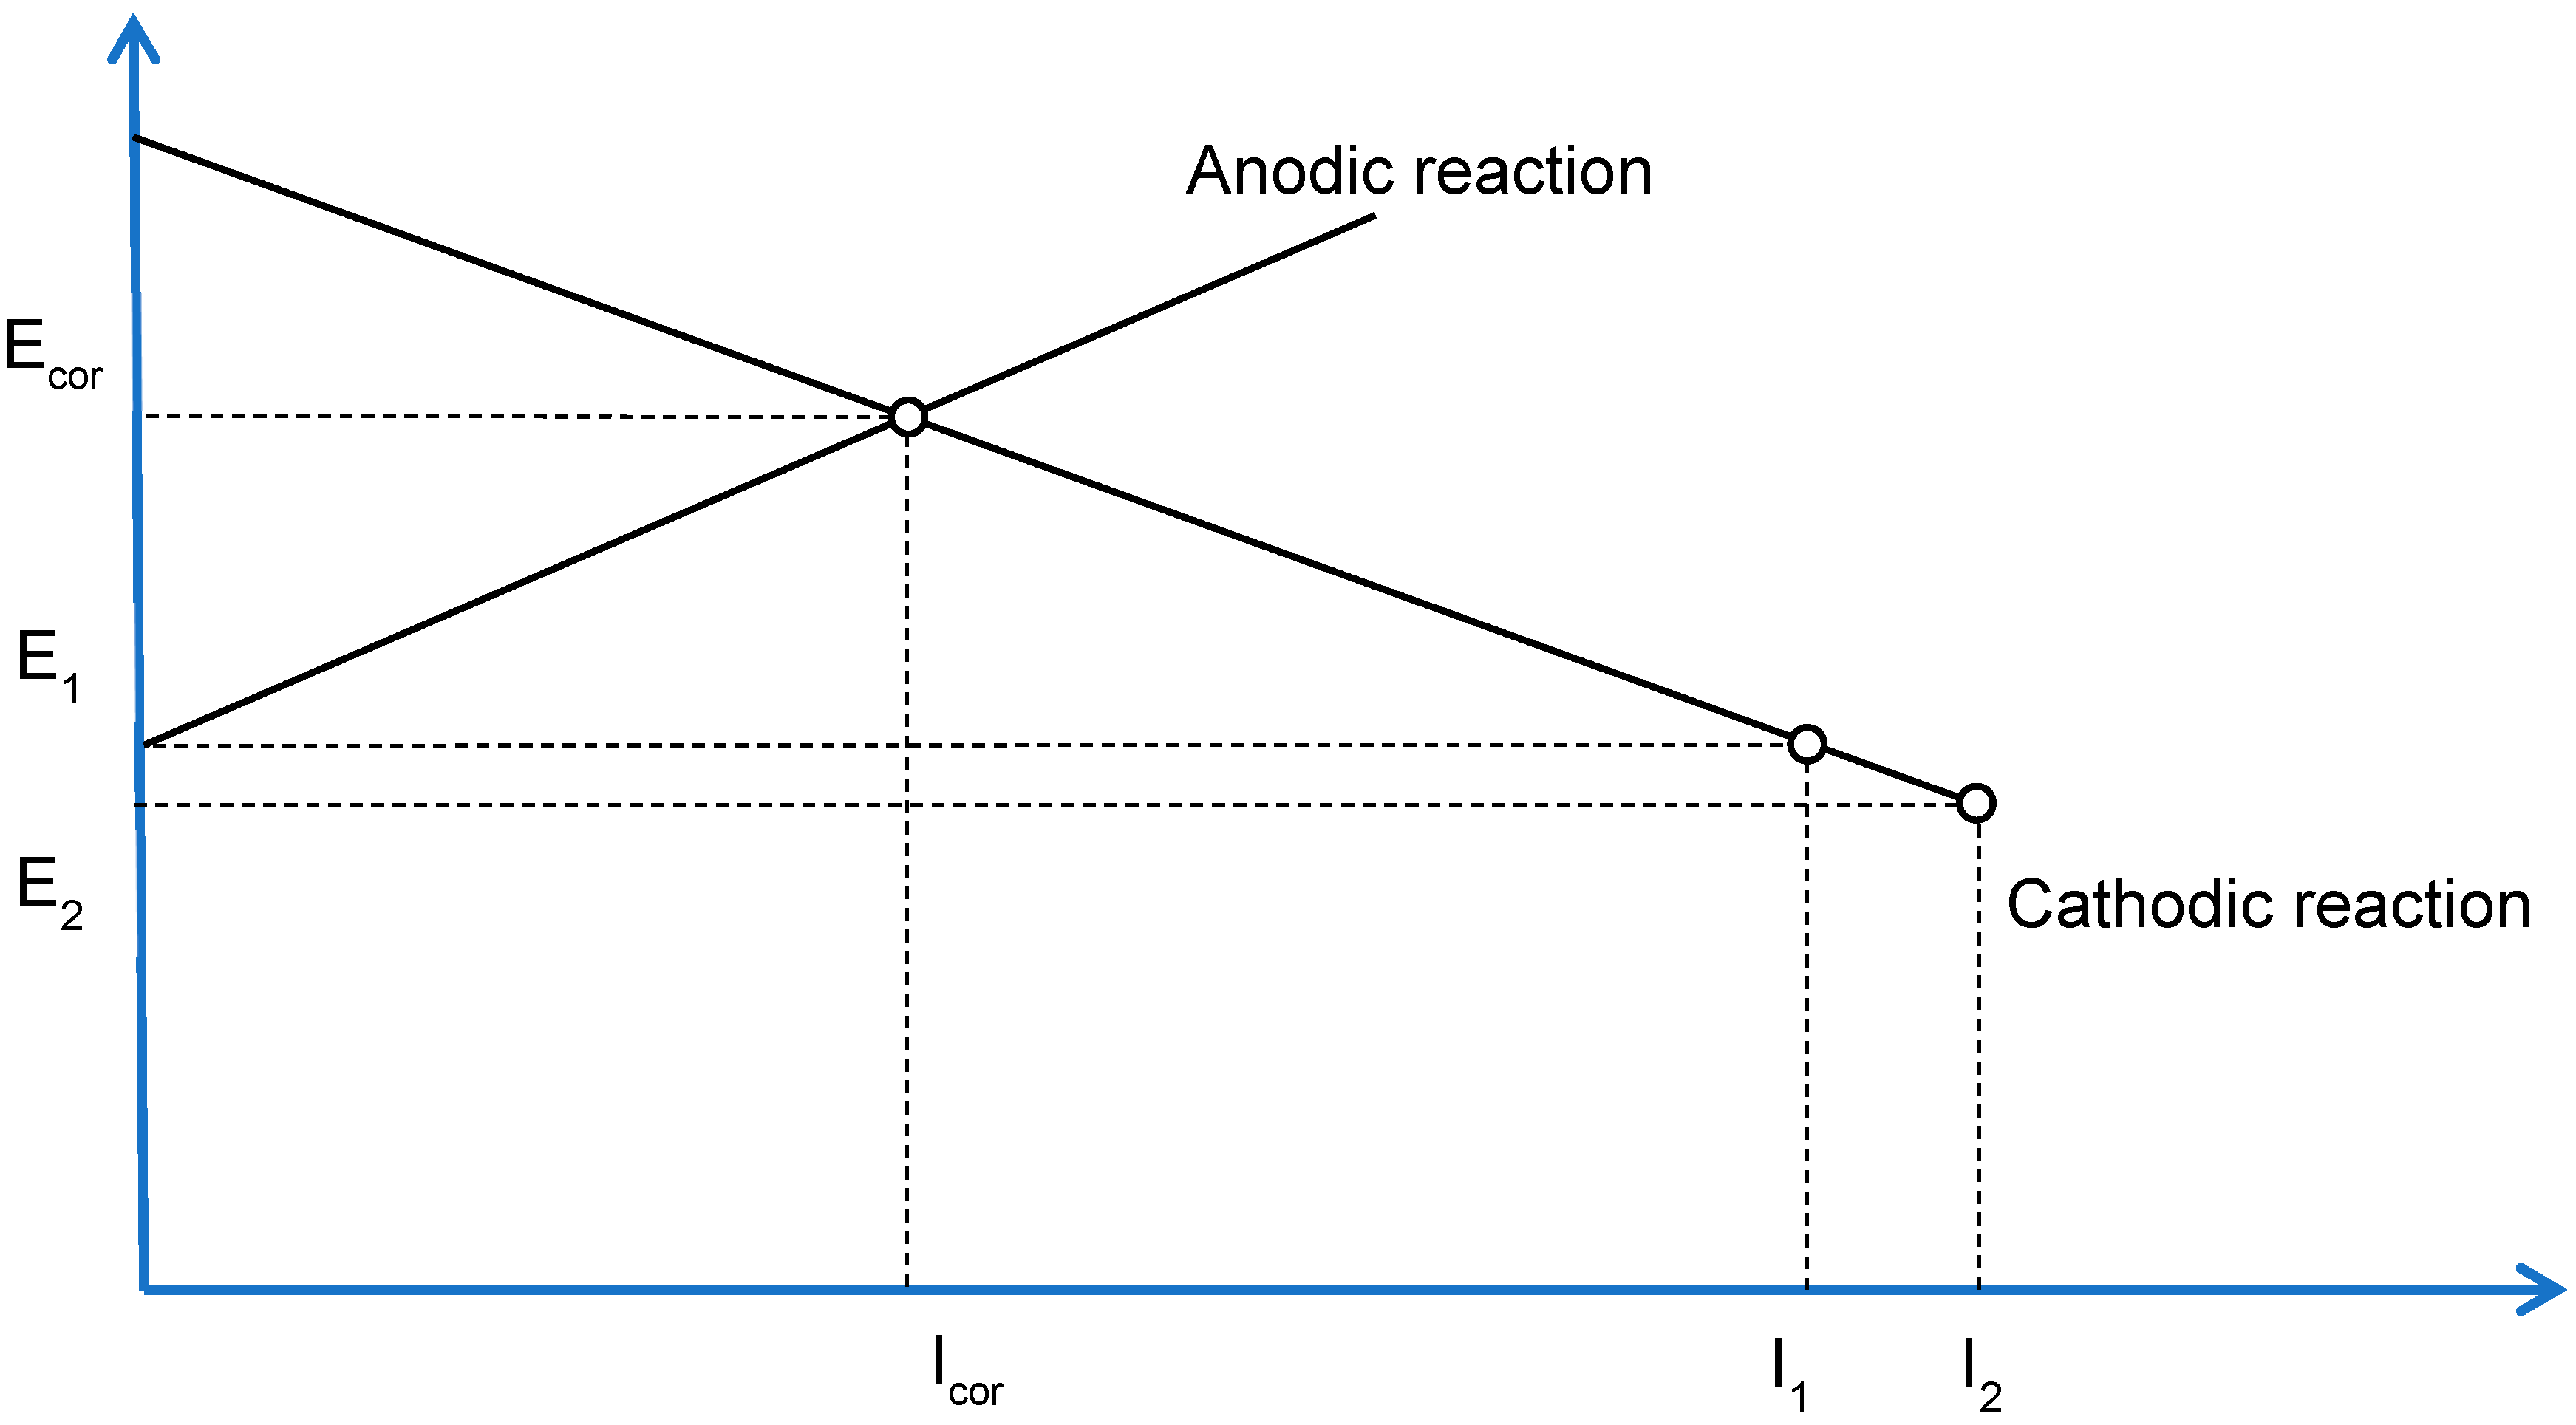
Typical anodic and cathodic curves are illustrated in Figure 7. Corrosion current Icor and corrosion potential Ecor occur at the point of the anode and cathode curve where the anode and cathode processes are equal. If electrons are supplied to the metal, making its potential more negative, the anode process slows slightly, reaching a potential E1, where the size of the cathode current increases to a level I1. Therefore, the current size I1 must be supplied by an external source to maintain the potential at level E1, at which the speed of the corrosion process remains low. If the potential is lowered to level E2, the current from an external source must be increased to level I2. Further protection of the metal would be negligible, and the current from an external source would be wasted; this condition is considered as “over-protective” of the metal [31,32,33].
The rate of corrosion by the suspended metal volume can be calculated using Faraday’s law, and the obtained values can be measured as the speed of penetration of corrosion (CR) or mass loss (MR).
C R = K 1 · i c o r ρ · E W
M R = K 2 · i c o r · E W
where
icor = Icor/A is the density of the corrosion current, measured in [μA/cm2], where Icor is the total anode current, and A is the contact surface area [cm2];
K1 and K2 are the constant ratios that define the units of the rate of corrosion;
ρ is the density measured in [g/cm3];
EW is the equivalent weight, defined as the mass in grams of metal that is oxidized with the passage of each Faraday electric charge.
A number of materials are used for non-consumable anodes for cathodic protection with an external power source. The basic properties that we are looking for in these anodes include good electrical conductivity; delayed development of corrosion; good mechanical properties to withstand the forces they are subjected to during installation and operation; low price; and the ability to withstand large current densities without forming a resistive oxide layer on its surface.
The following materials are used for anodes: magnetite, carbon materials (graphite), metal with high silicon content (14–18% Si), lead, lead oxide, lead alloy, and coated materials (tantalum, niobium, titanium). Due to its high resistance to corrosion, platinum is ideal for anode material. The only drawback is its high price. In practice, voltages up to 100 V and high current densities are allowed when protecting an external source.
Another possible option is to use titanium (Ti).
Most related research results indicate that the titanium oxide (TiO2) and iron oxide (Fe2O3) layers formed on the surfaces of two counter-faces or between contacting surfaces can reduce the friction coefficient. The presence of Ti, Cr, and Fe elements during a tribology test confirmed the formation of oxides like TiO2, Fe2O3, and Cr2O3, which ultimately affect the performance during testing (i.e., in terms of increasing the coefficient of friction in all TiN-coated samples).
However, hard coatings, such as TiN, when sliding against an aluminum ball, have intrinsic frictional characteristics of low friction and also depend on the surface quality of the counterparts. The coating deposited at lower temperatures, i.e., 150 °C, showed lower values of friction coefficients and surface roughness compared to the coating deposited at higher temperatures, i.e., 450 °C.
The recommended deposition temperature is less than or equal to 150 °C.
Overall, the friction coefficient and surface roughness analyses showed a similar trend in coating properties and that increasing the substrate temperature friction coefficient also increased the surface roughness.

2.2.3. Surface Treatment and Roughness

Surface treatment depends on the selected material for slips. Considering corrosion issues, there are two possible solutions for slip materials: stainless steel and steel alloy. Due to its electrical performance, stainless steel material is not recommended.
AISI 4140 steel should be used, as it can reach sufficient hardness; however, galvanic corrosion is likely to occur. Thus, certain anticorrosion treatments are needed. TiN coating has provided good results in prior applications on active contact surfaces.
Titanium nitride (TiN) is a metallic nitride compound. It is a solid material with a light, metallic gold color and no discernible odor. In solid form, it is a thin coating that is non-volatile, non-flammable, and insoluble in organic solvents. It is hard and highly resistant to abrasive wear, and as such, it does not release wear debris. When deposited as a titanium nitride coating, TiN is fully dense and void-free, and as such, will not absorb or trap any powdered or liquid materials that it may come into contact with.
TiN is a significant tribological material due to its properties. TiN is one of the most widely chosen coating materials due to its high mechanical properties and resistance to corrosion. Its excellent hardness is useful for protecting other materials. TiN is also chemically inert in many environments, making it an effective protective agent against corrosion.
Although the performance of a thin film produced by physical vapor deposition (PVD) yields unsatisfactory results against corrosion, this can be significantly improved by the addition of an intermediate Ti layer between the steel substrate and the TiN layer, particularly in the case of aqueous corrosion.
Typical PVD hard coating–substrate systems may suffer from severe corrosion damage due to defects in the coating structure (pores, pinholes). This eventually leads to film breakdown in the form of sheets or splints. Several methods for reducing pinhole occurrences are well established, including increasing the coating thickness, modifying the film microstructure from columnar to equiaxed, controlling the bias potential during film deposition, and depositing a noble metal interlayer.
Important for TiN coating is the value of electrical resistance: 2.5 × 10⁻⁷ Ω·m (close to 2.22 × 10⁻⁷ Ω·m of steel alloy).
Hard coatings, such as TiN, have intrinsically low friction. TiN-coated surfaces, featuring titanium oxide (TiO2) and iron oxide (Fe2O3) layers, exhibit relatively high frictional characteristics compared to surfaces without these oxide layers. The thickness of TiN coatings is very high when compared to the thickness of oxide layers over surfaces of TiN-coated silicon wafer. The oxidation of the wear tracks of TiN-coated steel in air protects the base material from wear. TiN coatings with oxides show relatively high friction compared to those without an oxide layer. It has been shown that in a nitrogen environment, the average value of the steady-state friction coefficient increases by approximately three times compared to that in an air atmosphere.
The roughness of TiN coatings on HSS twist drills was found to increase from 0.104 μm to 0.116 μm depending on the process settings. The genetic algorithm reduced the surface roughness value in the mold cavity from 0.412 μm to 0.375 μm, corresponding to approximately a 10% improvement in optimizing cutting conditions for milling mold surfaces using the coupling response surface methodology.
Typical roughness values of tribological coatings are generally in the range of Rz = 0.5 ÷ 3.0 μm.

2.3. Study of Mechanical Contact Behavior

Structural mechanical analysis is planned to evaluate force-deflection behavior of the examined contact system at nominal workloads. The structural mechanical behavior of the system is important for its ability to transmit high power and has been researched in previous studies [34,35,36]. The focus is on two main objectives:
  • Contact pressure for three interfaces: To review the geometry, identify design modifications to improve and guarantee sufficient contact pressure values, and to provide good electrical contact:
    Casing (steel AISI 4340)–slip (steel AISI 4340);
    Slip–caliper (copper alloy ASTM B36);
    Caliper–mandrel (steel AISI 4340);
  • Equivalent (von Mises) stress distributions: To examine whether critical zones exist and to make possible changes.
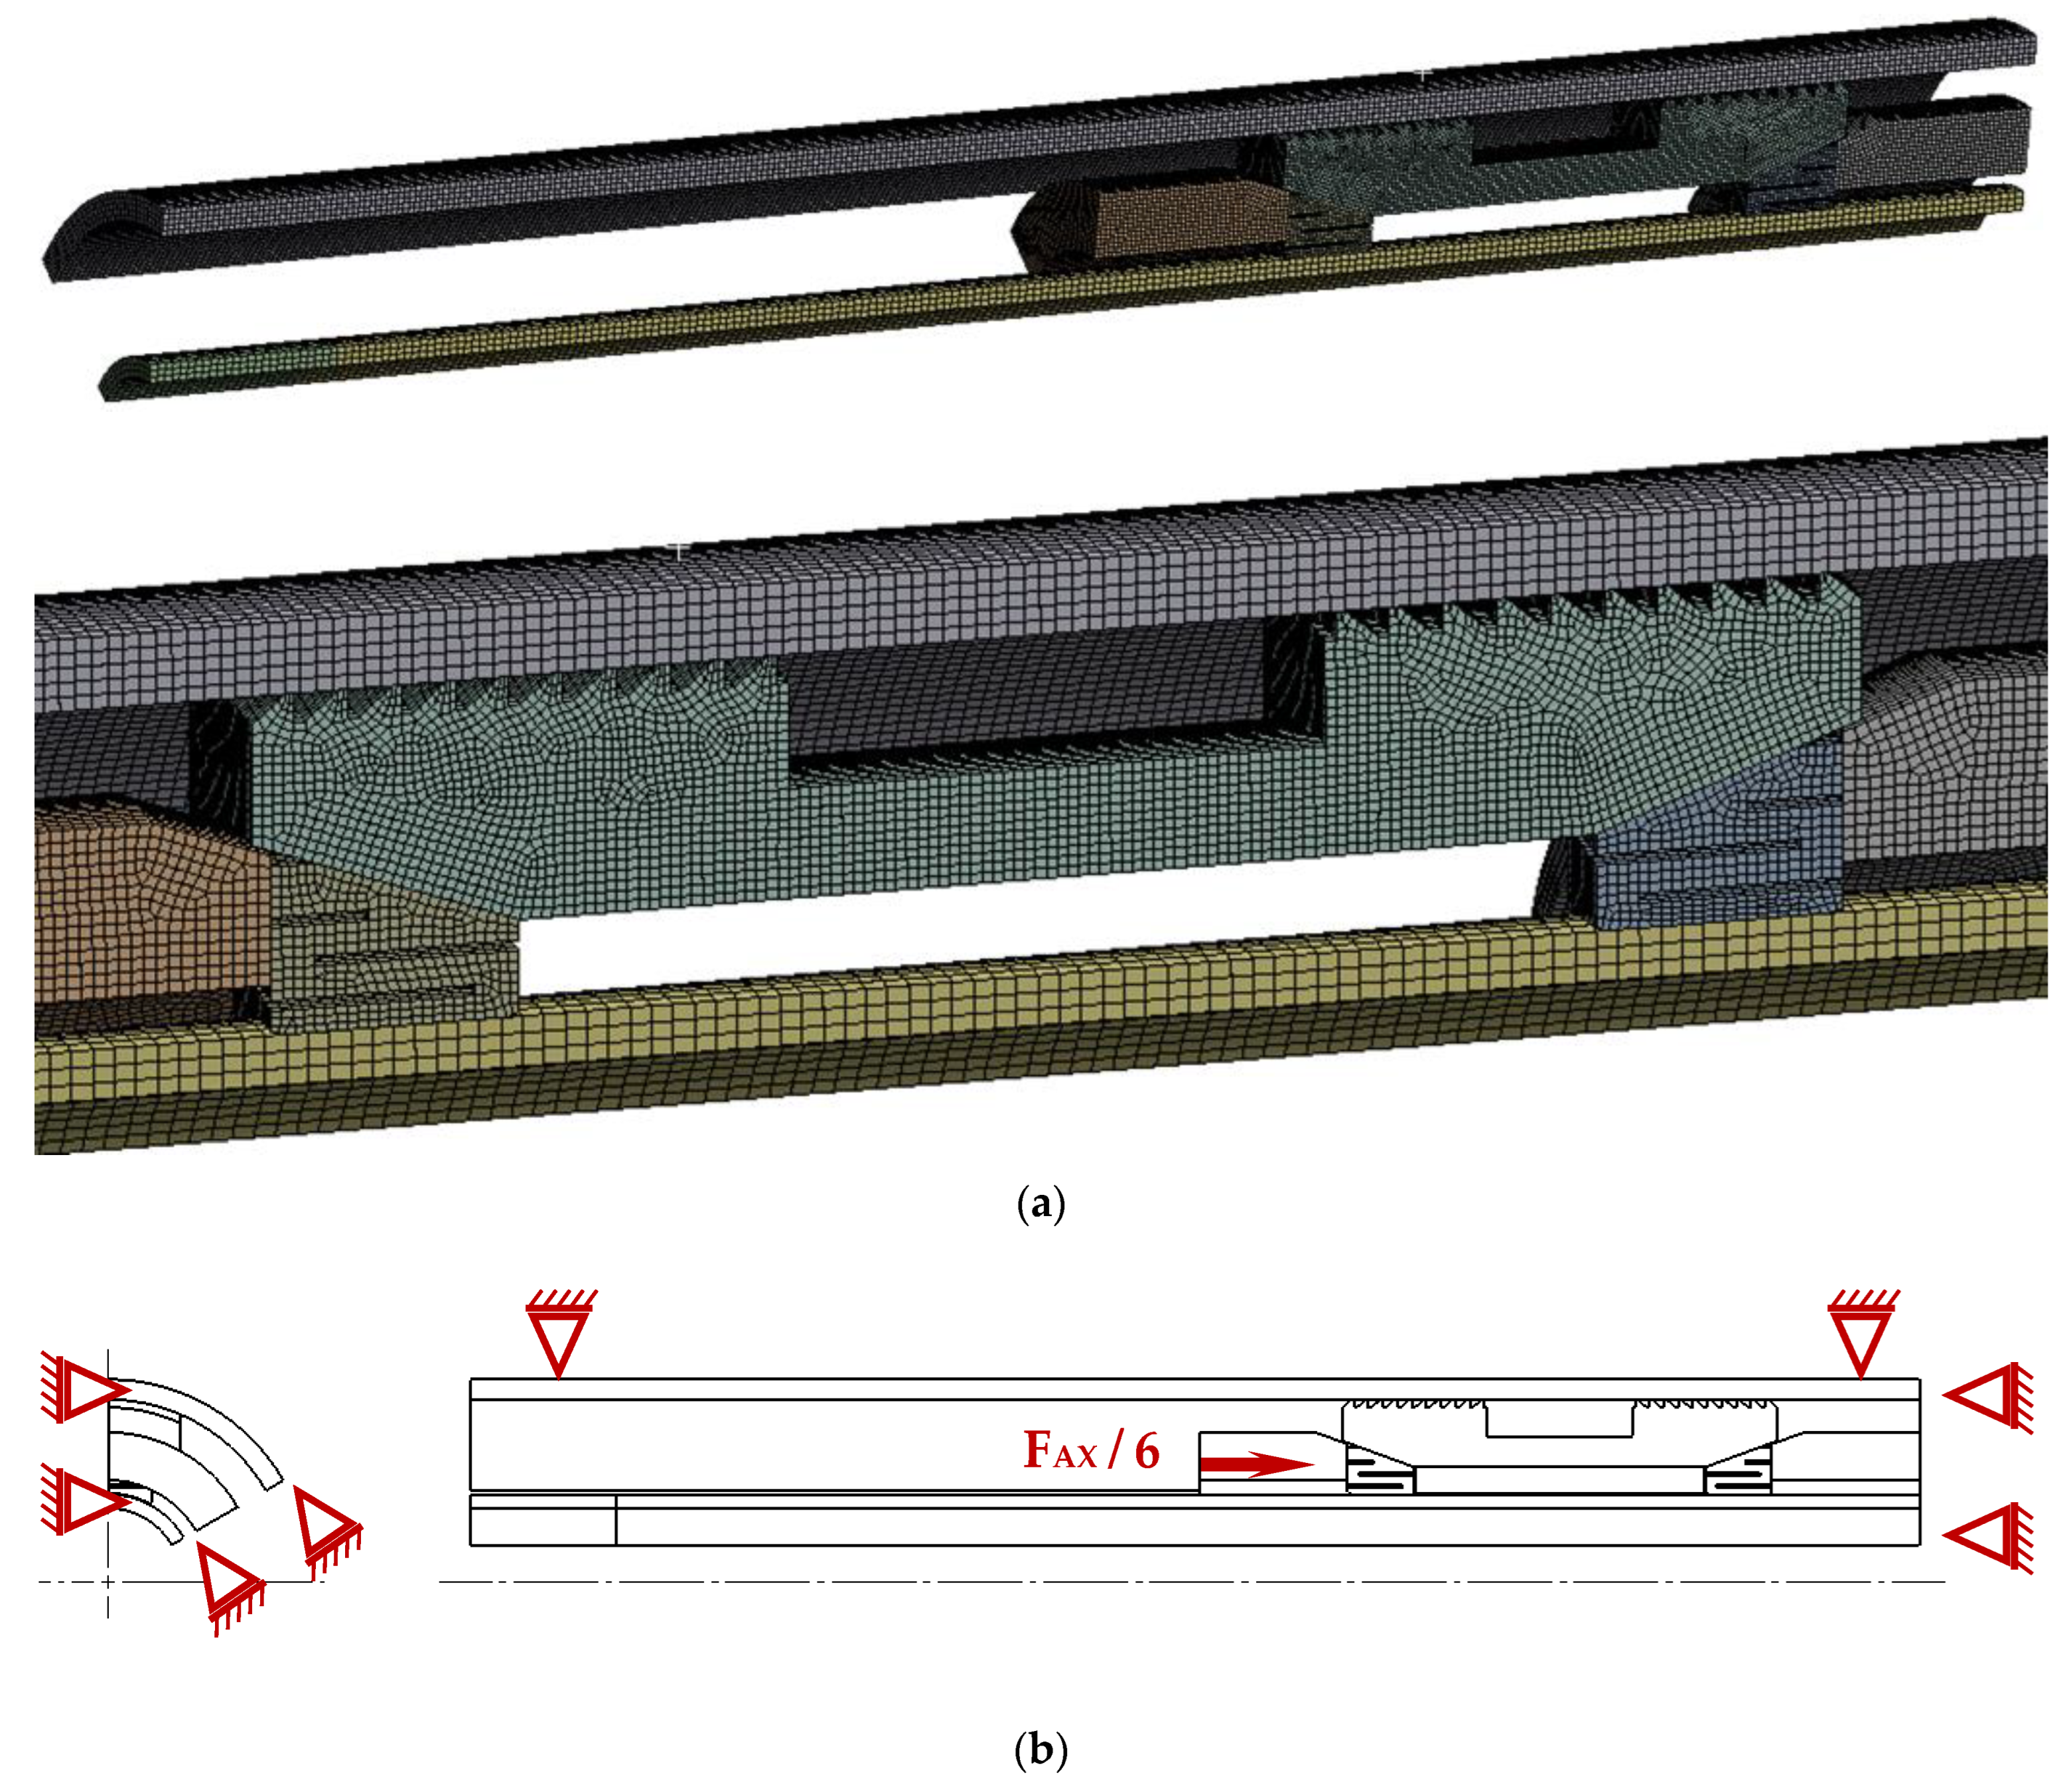
Structural analysis was performed using ANSYS Workbench 2019 R3 software, based on Finite Element Method (FEM) simulation. A virtual prototype (VP) was required for preparation of the simulation model. VP is a common approach in the actual industry, which allows for examining the design parameters at a very early stage, even at the conceptual level. It is also suitable for topology, shape, or parametric optimization, as shown in many studies [37,38]. Three packer components were examined, as they have direct impact on the mechanical and electrical performance—slips, calipers, and cones. Together with the casing and mandrel, these formed a simulation model of the contact system. Because of its cyclic symmetry, the examined contact system is modeled as one-sixth of the whole. The model is shown in Figure 8.
Cones are presented just to include their contact conical surfaces, while slips and calipers are modeled in high detail.
A mesh model was generated based on the above presented model. It contains about 271,000 nodes and 262,000 elements, with sufficient element size to simulate the examined contact behavior. The generated mesh was hexahedral-dominant in order to obtain a correct solution, and its mesh quality metrics, including skewness, aspect ratio, warping factor, etc., correspond to the requirements for a correct solution. The used material properties for the mechanical simulations, including the elasticity modulus and Poisson coefficient, are typical for steel and copper alloy. All contacts between bodies were nonlinear which allowed for relative motion. A friction coefficient of 0.6 [39] was used for dry contact between the steels, and 0.5 for the steel-to-copper alloy interface. The mesh model is shown in Figure 9a.
The applied boundary conditions correspond to conditions under the maximal axial force. It was assumed that FAX = 31,138 N (approx. 7000 lbs), based on the set-down weight specified for typical packers of size 45. One-sixth of this value was applied, according to Figure 9b, because of model cyclic geometry. Symmetry is presented by tangential constraints. Radial displacement is constrained over the external casing diameter. Axial displacement is constrained on the end side, representing the full axial attachment of the packer to the casing.

3. Results

3.1. Simulation Results for Contact Pressure

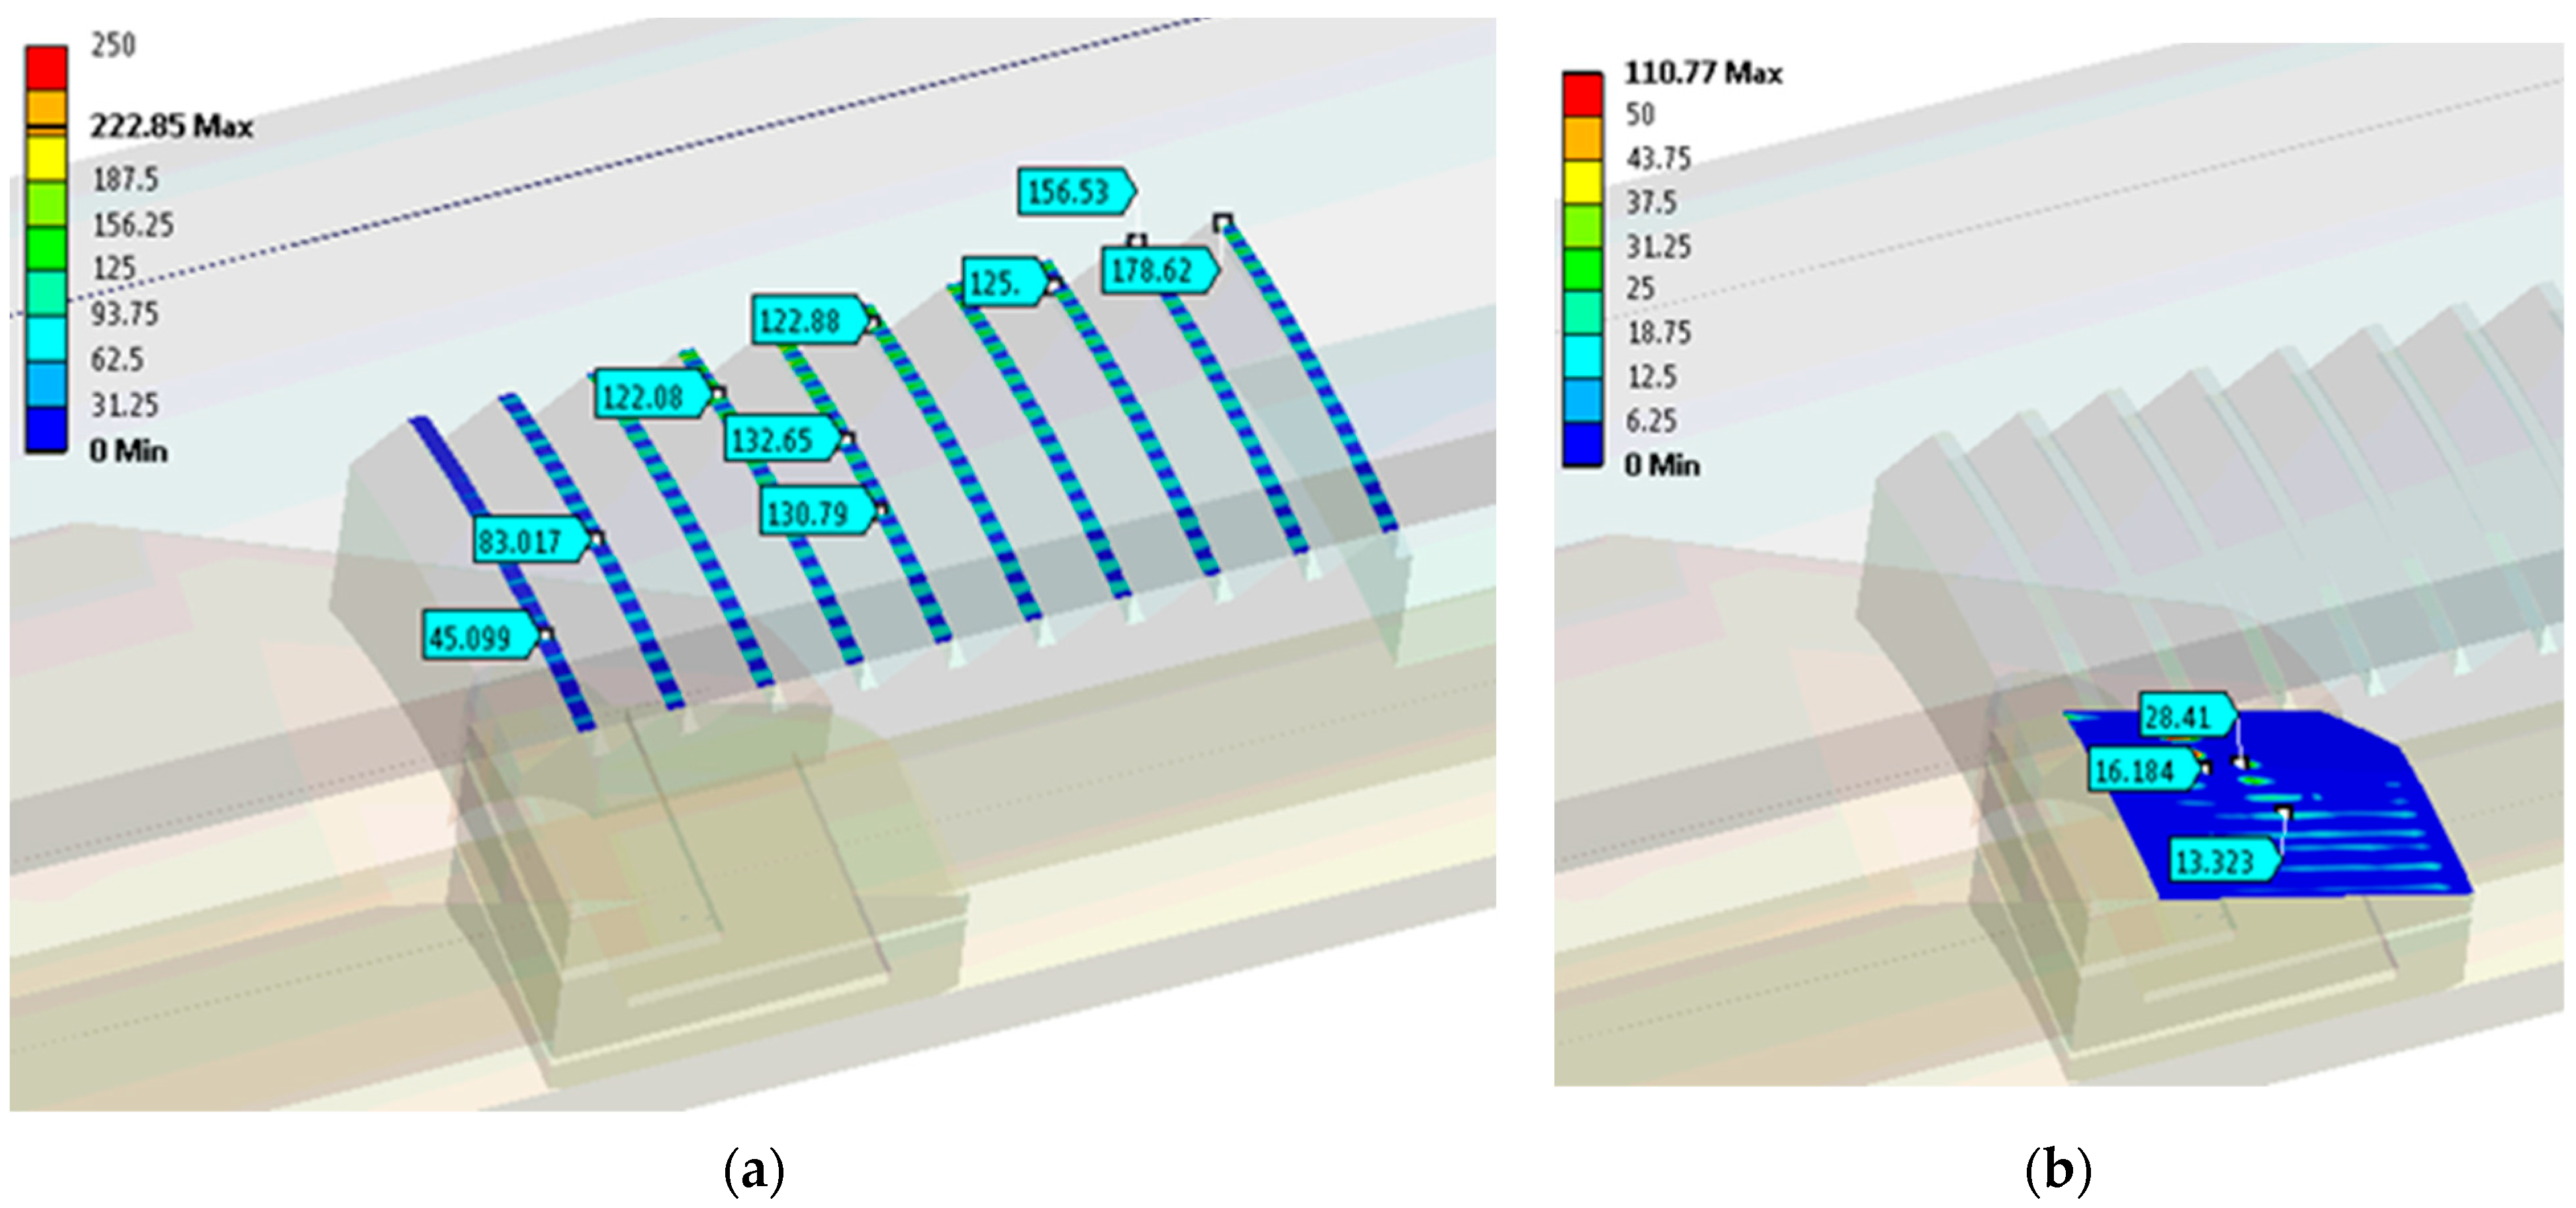
The first important parameter is the contact pressure. Its distributions for three contacts (as mentioned above) are shown in Figure 10 (using different scales for better presentation of the proper results and better understanding the values). The slip-to-casing contact provides important information about the contact pressure’s unequal distribution. It can be observed that the end teeth bear the load, while the central ones are not in contact at all. This also resulted in high pressure values, reaching about 250 MPa. Some nodal values were higher, but these were due mainly to the mesh size and local effects. The main conclusion is that more even contact pressure distribution is needed.
The caliper contacts with slips and cones offer additional information concerning contact pressure values.

3.2. Simulation Results for Equivalent Stress

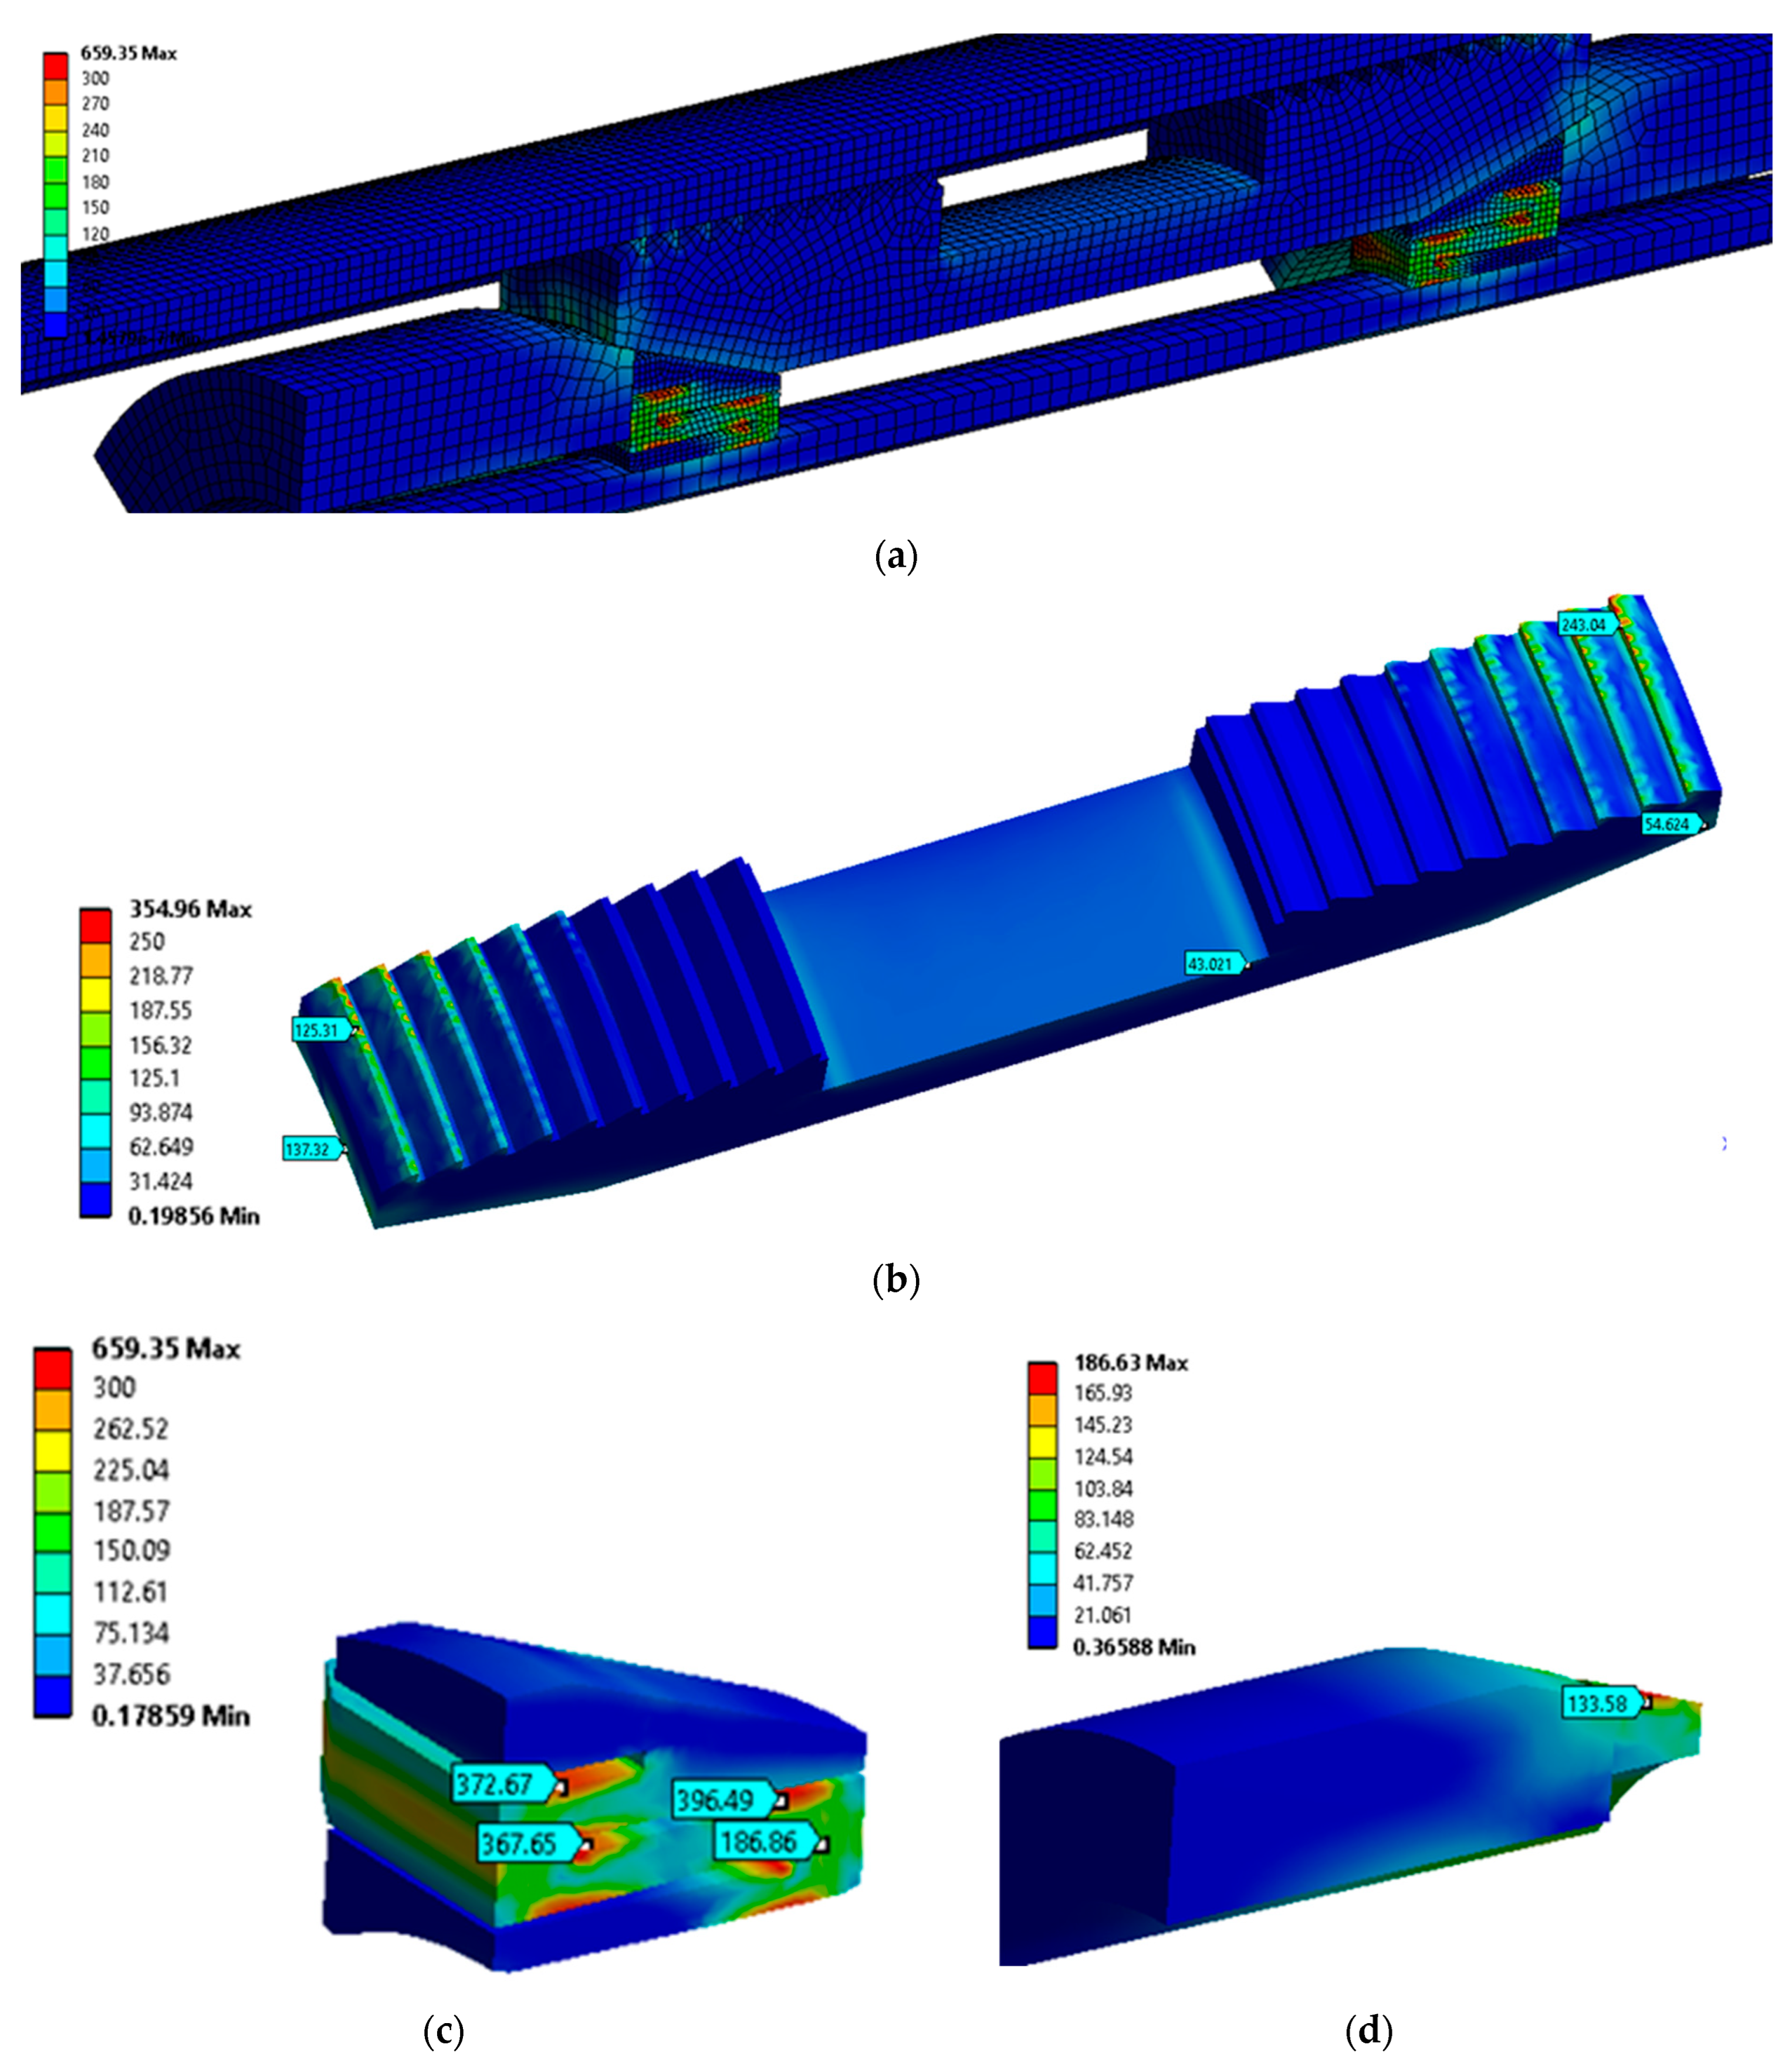
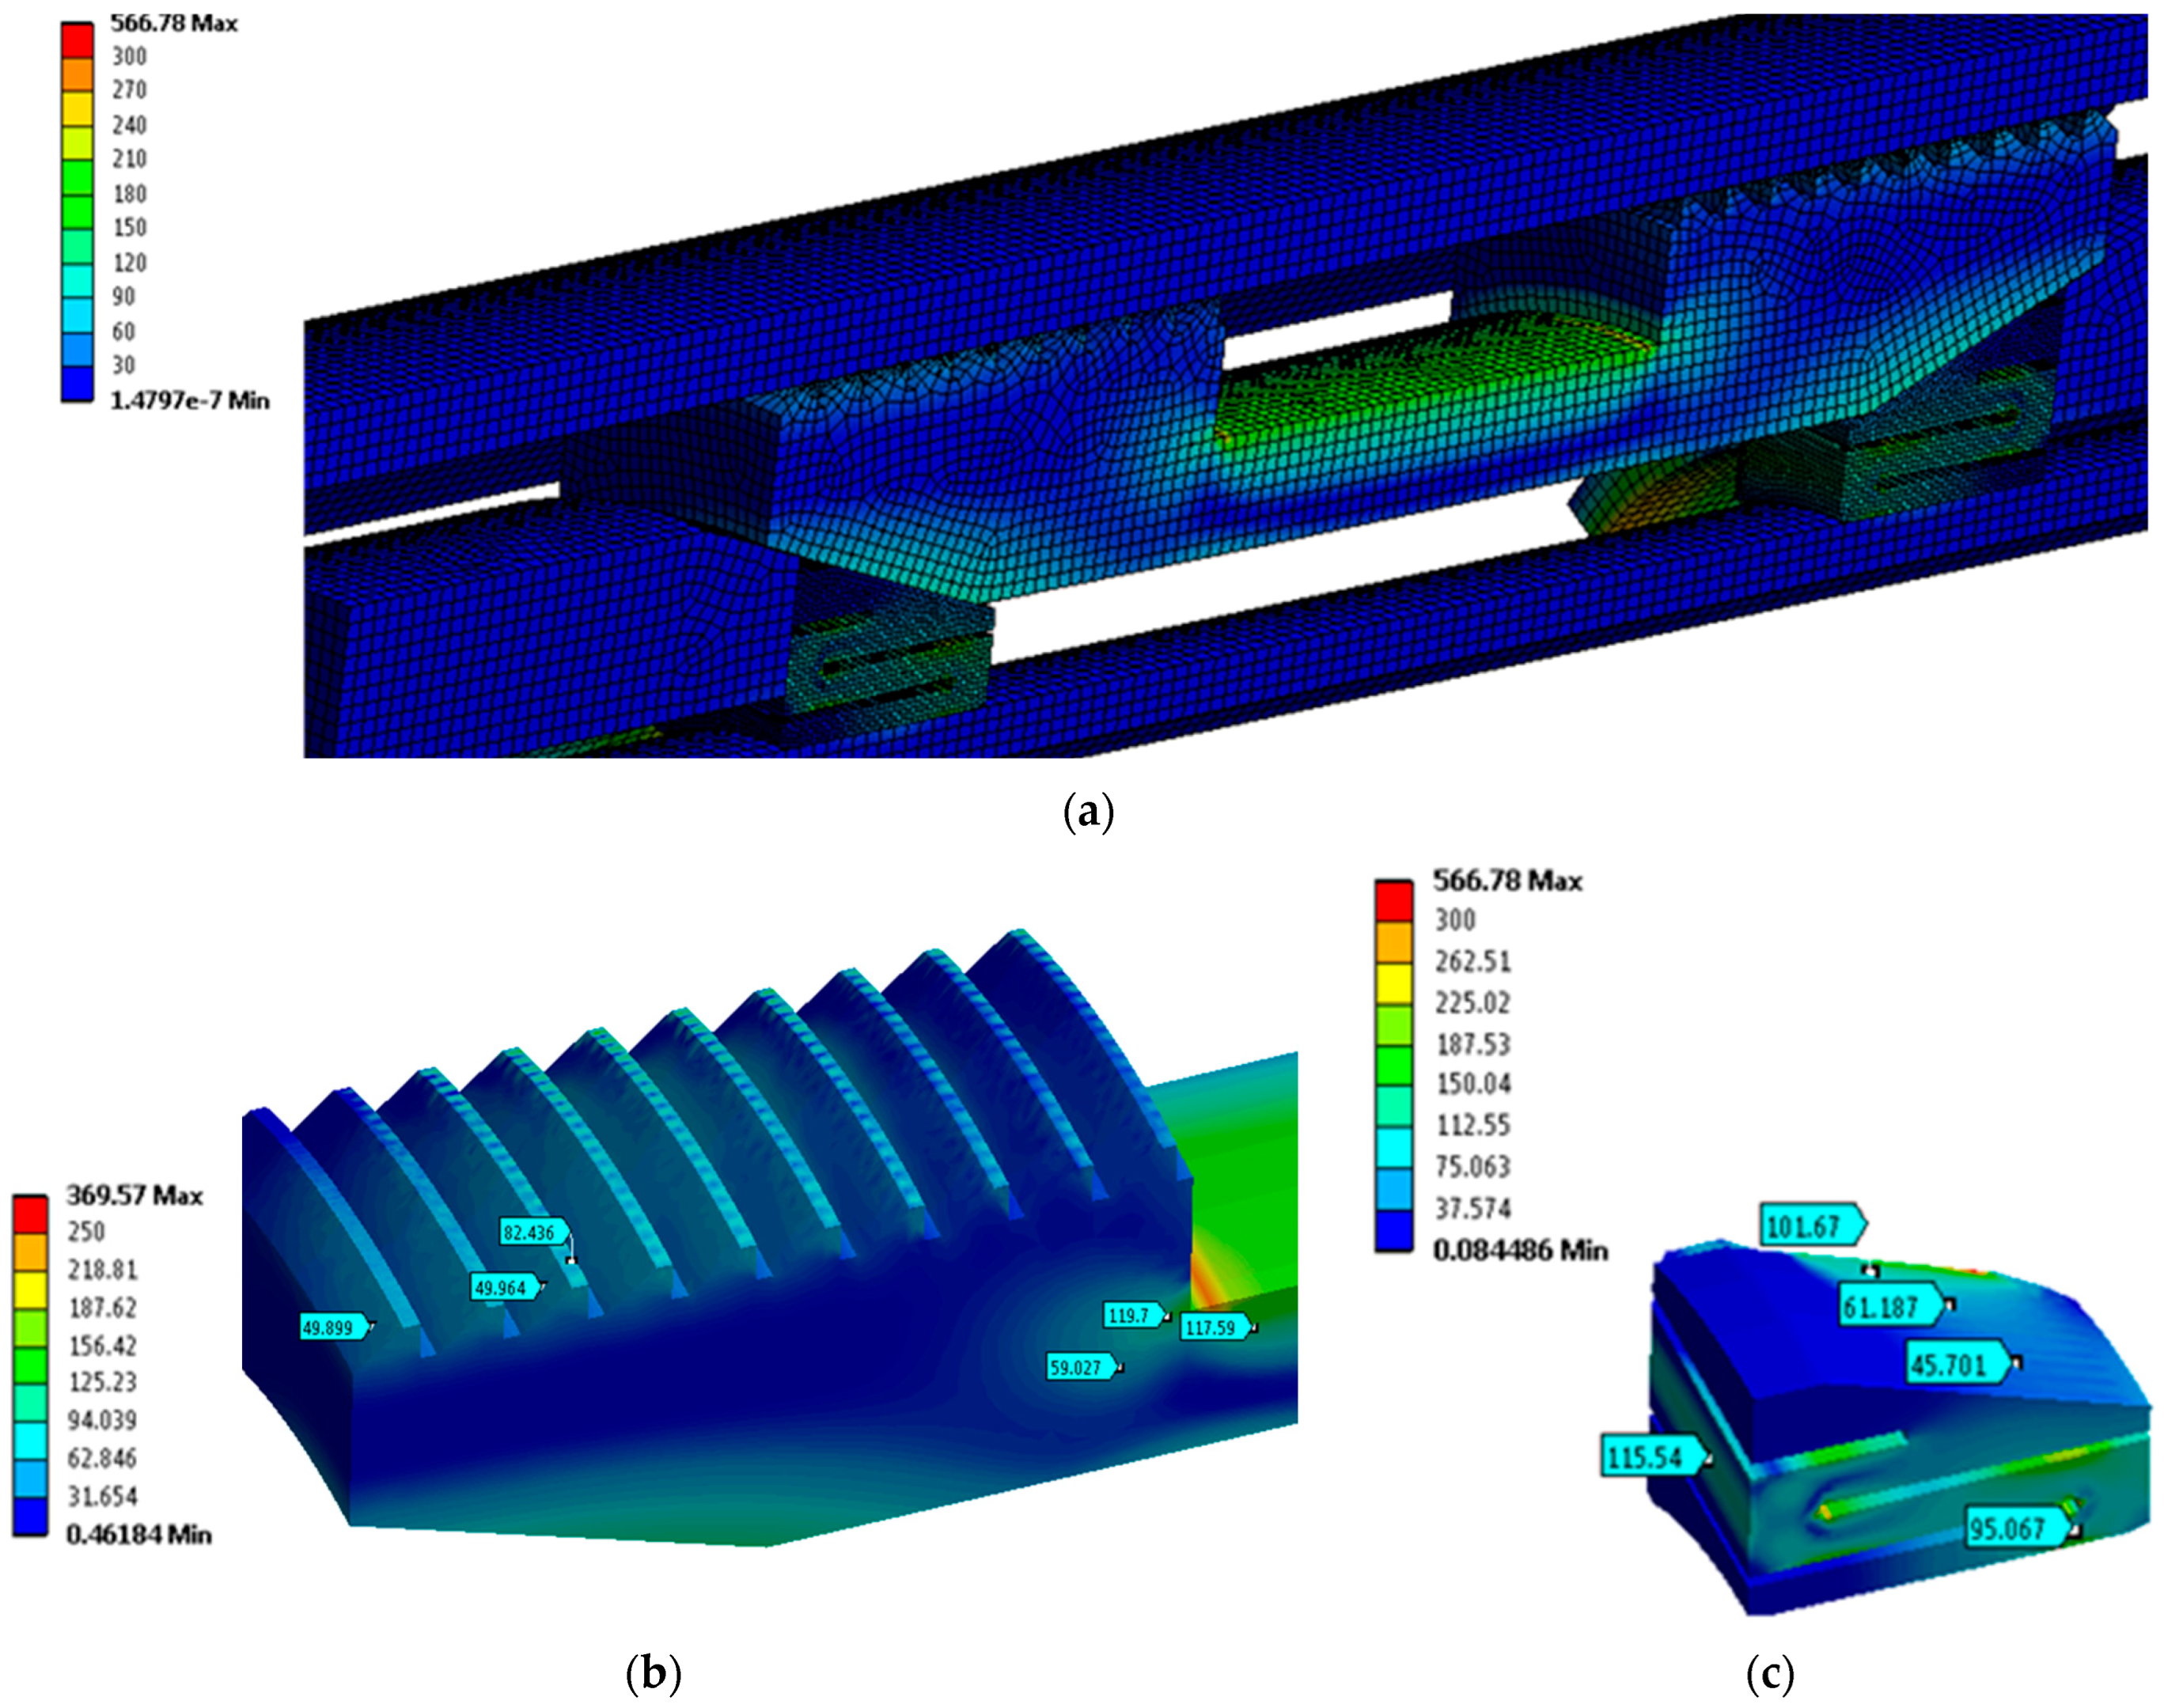
The other important parameter is the distribution and values of the equivalent (von Mises) stress. These are presented in Figure 11, where the overall view is shown for the entire examined model, with a zoomed-in view of the zone of active components. All components’ equivalent (von Mises) stress distributions are shown in detail in the same Figure 11, with particular attention given to the teeth surfaces.
The maximum stress values were calculated for the calipers—about 350 MPa (with higher stresses at the edge, up to 400 MPa). This is very close to the typical values for copper alloy, such as ASTM B36, and certain design modifications are needed. All other steel components experience significantly lower stress levels, not exceeding 250 MPa.
The casing and mandrel experience even lower stress levels, not exceeding 100 MPa.

3.3. Results Analysis

Based on the presented results, several conclusions can be drawn regarding the two main components—slip and calipers:
  • Caliper design (refer to Figure 12):
    High stresses were found in the calipers, exceeding the allowable stresses for electrical copper alloy;
    Certain caliper behavior improvement can be achieved by tuning its deflection by adjusting the dimension “Δ”. This will be included in the final detailed design that will be used in the prototype.
  • Slip (refer to Figure 12):
    The contact of the slip teeth to casing also needs improvement. It varies from about 250 MPa to 0 MPa (no contact), increasing the local contact resistivity;
    Contacting teeth surfaces form an elliptical area, which is defined by the direction of the cone’s acting force vector and by the slip’s stiffness;
    Two directions for improvement are proposed (as shown in the figure below):
    Conical external teeth surfaces at the optimal angle α would improve the contact pressure homogeneous distribution;
    Decreasing the slip’s slot between the teeth with dimensions “g” and “t” would improve the slip’s stiffness and equalize the teeth contact pressure.

3.4. Improved Mechanical Behavior of the Contact System

The performed improvements, based on the results analysis, are aimed at the following:
  • Decreasing the caliper deformation “Δ” (refer to Figure 12a);
  • Decreasing the dimension “g” of the slip slot (refer to Figure 12b);
  • Implementing conical external surface teeth (refer to Figure 12b).
An updated simulation model was prepared and the same boundary conditions were applied to evaluate force-deflection behavior of the modified contact system at nominal workloads. The simulation model was very similar to the one shown in Figure 9.
The analysis results are presented in a similar way to the previous ones for easy comparison. The obtained new results are shown in Figure 13 and Figure 14. The obtained results for contact pressure of the improved model are presented in Figure 13 and are further discussed.

4. Discussion

The modified design was examined, and the obtained results show that the contact behavior was significantly improved. Because of the conical surface of the teeth, the contact pressure was decreased and distributed very evenly. It can be seen in Figure 13 that the average value was about 130 MPa and the maximum value (except the local edge values) was 180 MPa. The most important achievement is that the contact was almost homogeneous.
The slip showed improved stresses (comparing to initial design), with maximum stress values of about 100 MPa and local values reaching 200 MPa. This is acceptable for the steel material used in this application.
Maximum stress values for the calipers were also significantly decreased—about 150 MPa (with higher stresses at the edge—up to 210 MPa). Certain copper alloys of type ASTM B36 have yield strength up to 250 MPa, and the calculated stresses are acceptable.
The initial simulation and proposed modifications have resulted in an improved design of the contact system, with prototyping planned for the next project stage.
The following major issues and influences will be tested using a physical prototype:
  • Electrical effects, such as arcing effects, electric etching, contact welding, heating at current transfer interfaces, contact conductivity, etc., for the following specific areas:
    Electrical contact between slip teeth and casing;
    Electrical contact between slips and cones.
  • Mechanical effects (strength and force-deflection behavior):
    Mechanical stiffness and resulting force of connector caliper;
    Holding capacity of the button-type hold-down device for slips and back cone;
    Locking and unlocking at the sub to back cone assembly interface;
  • Environmental effects, such as corrosion and contamination.

5. Conclusions

A comprehensive study of the electrical contact in a system for high power transmission through well piping was performed. The study included a detailed examination of electrical (high-voltage) effects (arcing, etching, contact welding, and heating), as well as mechanical and chemical failure mechanisms. The preliminary design was explored using virtual prototype of the contact system, which was evaluated by numerical simulation. Certain improvement of the local contact behavior was achieved, and the improved design can be used in further exploration, which is a major outcome of the implemented virtual prototyping techniques. Furthermore, the virtual prototype will be used for additional assessment of the electro thermal behavior of the system, which will be the focus of further research. The obtained results show the feasibility of this innovative solution, which will allow for avoiding the usage of cables (umbilicals), especially over long distances in deep wells. Further tests of physical prototypes and the development of a detailed design are expected to allow for final validation of the design and further application of this solution in the petroleum industry.

Author Contributions

Conceptualization, G.T. and K.K.; methodology, G.T. and Y.S.; software, R.M. and T.G.; validation, Y.S. and R.M.; formal analysis, K.K.; investigation, T.G.; resources, Y.S.; data curation, R.M.; writing—original draft preparation, K.K.; writing—review and editing, K.K., Y.S. and T.G.; visualization, T.G.; supervision, G.T.; project administration, R.M.; funding acquisition, G.T. All authors have read and agreed to the published version of the manuscript.

Funding

This study was financed by the European Union-Next Generation EU, through the National Recovery and Resilience Plan of the Republic of Bulgaria, project № BG-RRP-2.004-0005.

Data Availability Statement

The data presented in this study are available on request from the corresponding author. The data are not publicly available due to public funding specifications.

Conflicts of Interest

The authors declare no conflicts of interest.

References

  1. Manfroni, M.; Bukkens, S.G.; Giampietro, M. The declining performance of the oil sector: Implications for global climate change mitigation. Appl. Energy 2021, 298, 117210. [Google Scholar] [CrossRef]
  2. Wiatros-Motyka, M.; Fulghum, N.; Jones, D. Global Electricity Review 2024; Ember: London, UK, 2024. [Google Scholar]
  3. Patel, D.; Thakar, V.; Pandian, S.; Shah, M.; Sircar, A. A review on casing while drilling technology for oil and gas production with well control model and economical analysis. Petroleum 2019, 5, 1–12. [Google Scholar] [CrossRef]
  4. Nouman, D.; Ullah, M.F.; Haider, S.H.; Keyani, M.B.K. An Overview of Downhole Electrical Machines and their Benefits. In Proceedings of the 1st International Conference on Contemporary Academic Research, Konya, Turkey, 17–19 May 2023. [Google Scholar]
  5. Shentu, L.; Yiming, M.; Jin, W.; Jia, Z.; Libing, Z.; Kun, Q. Design and Analysis of a Direct-Drive Permanent Magnet Vernier Motor for Electric Drilling Applications. In Proceedings of the IEEE: 21st International Conference on Electrical Machines and Systems (ICEMS), Jeju, Republic of Korea, 7–10 October 2018. [Google Scholar]
  6. Epelle, E.I.; Gerogiorgis, D.I. A review of technological advances and open challenges for oil and gas drilling systems engineering. AIChE J. 2020, 66, e16842. [Google Scholar] [CrossRef]
  7. Alghamdi, A.S. Encapsulated ESP System: An Innovative Solution for Extended Run Life in High H2S Environments. In Proceedings of the International Petroleum Technology Conference, Bangkok, Thailand, 1–3 March 2023. [Google Scholar]
  8. Mubarak, G.; Verma, C.; Barsoum, I.; Alfantazi, A. Internal corrosion in oil and gas wells during casings and tubing: Challenges and opportunities of corrosion inhibitors. J. Taiw. Inst. Chem. Eng. 2023, 150, 105027. [Google Scholar] [CrossRef]
  9. Liu, S. Study on the cause of casing damage and the feasibility of comprehensive prevention. In Proceedings of the E3S Web of Conferences 375, 01027, ESAT 2023, Yichang, China, 10–12 March 2023. [Google Scholar]
  10. Wang, J.; Li, D.; Du, X.; Li, H.; Yang, S. Development of a Design Method for Casing and Tubing Strings under Complex Alternating Loads. Processes 2023, 11, 2582. [Google Scholar] [CrossRef]
  11. Tang, Y.; Wang, J.; Zhou, M.; Li, G.; Xiao, X. Casing failure mechanism and slip anchoring optimization of the compression packer in the oil and gas well. Proc. Inst. Mech. Eng. Part E J. Process Mech. Eng. 2023, 238, 2759–2769. [Google Scholar] [CrossRef]
  12. Dou, Y.; Pan, H.; Tong, S.; Cao, Y.; Gao, W. Study on the Interaction Mechanism of Packer Slips and Thick Wall Casing. Op Mech. Eng. J. 2014, 8, 230–233. [Google Scholar] [CrossRef]
  13. Wang, Y.; Gao, Q.; Zheng, F. Contact Analysis between Packer Slips and Casing Based on Abaqus. Adv. Mat. R. 2014, 850–851, 262–265. [Google Scholar] [CrossRef]
  14. Sun, X.; Dou, Y.; Song, H.; Wang, X.; Cao, Y. Analysis of the Interaction between Casing and Completion Packer Slip in HPHT Wells. In Proceedings of the Conference: 2015 2nd International Conference on Machinery, Materials Engineering, Chemical Engineering and Biotechnology, Phuket, Thailand, 27–28 December 2015. [Google Scholar]
  15. Tang, Y.; Sun, P.; Wang, G.; Li, W. Analysis of pressure-bearing performance and optimization of structural parameters of the slip in a compression packer. Sci. Prog. 2019, 103, 20–34. [Google Scholar] [CrossRef]
  16. Yu, X.; Cen, X.; Kan, C.; Hu, Y.; Yang, Y.; Tao, S. Numerical Simulation Analysis of Wellbore Integrity and Casing Damage in High-Temperature Injection and Production of Shale Oil. Processes 2023, 11, 3053. [Google Scholar] [CrossRef]
  17. Slade, P.G. Electrical Contacts. Principles and Applications, 2nd ed.; CRC Press: Boca Raton, FL, USA, 2017. [Google Scholar]
  18. Alabani, A.; Ranjan, P.; Jiang, J.; Chen, L.; Cotton, I.; Peesapati, V. Electrical Characterization and Modeling of High Frequency Arcs for Higher Voltage Aerospace Systems. IEEE Trans. Transp. Electrif. 2023, 9, 4716–4725. [Google Scholar] [CrossRef]
  19. Lee, R.-T.; Chung, H.-H.; Chiou, Y.C. Arc erosion behaviour of silver electric contacts in a single arc discharge across a static gap. IEEE Proc.—Sci. Meas. Technol. 2001, 148, 8–14. [Google Scholar] [CrossRef]
  20. Esmaeili, K.; Wang, L.; Harvey, T.; White, N.; Holweger, W. A Study on the Influence of Electrical Discharges on the Formation of White Etching Cracks in Oil-Lubricated Rolling Contacts and Their Detection Using Electrostatic Sensing Technique. Lubricants 2023, 11, 164. [Google Scholar] [CrossRef]
  21. Steinweg, F.; Mikitisin, A.; Oezel, M.; Schwedt, A.; Janitzky, T.; Hallstedt, B.; Broeckmann, C.; Mayer, J. Formation of White Etching Cracks under electrical current flow—Influence of load, slip and polarity. Wear 2022, 504–505, 204394. [Google Scholar] [CrossRef]
  22. Holm, R.; Holm, E. Electric Contacts: Theory and Application, 4th ed.; Springer: Berlin/Heidelberg, Germany, 2010. [Google Scholar]
  23. Zhang, X.; Ren, W.; Zheng, Z.; Wang, S. Effect of Electrical Load on Contact Welding Failure of Silver Tin Oxide Material Used in DC Electromechanical Relays. IEEE Acc. 2019, 7, 133079–133089. [Google Scholar] [CrossRef]
  24. Ksiazkiewicz, A.; Janiszewski, J. Welding tendency for selected contact materials under different switching conditions. Eksploat. Niezawodn. 2019, 21, 237–245. [Google Scholar] [CrossRef]
  25. Al-Taie, A.; Park, C.; Cheetham, P.; Kim, C.; Graber, L.; Pamidi, S. A New Representation of Paschen’s Law Suitable for Variable Temperature Power Applications. In Proceedings of the 2019 IEEE Electrical Insulation Conference (EIC), Calgary, AB, Canada, 16–19 June 2019. [Google Scholar]
  26. Qi-Ling, Z.; Lei, H.; Chao, H.; He-Gao, W. Low-cycle fatigue issue of steel spiral cases in pumped-storage power plants under China’s and US’s design philosophies: A comparative numerical case study. Int. J. Press. Vessel. Pip. 2019, 172, 134–144. [Google Scholar]
  27. Tanaka, S.; Ichikawa, M.; Akita, S. A probabilistic investigation of fatigue life and cumulative cycle ratio. Eng. Fract. Mech. 1984, 20, 501–513. [Google Scholar] [CrossRef]
  28. Wang, Y.; Zhang, W.; Zheng, Y. Experimental Study on Corrosion Fatigue Performance of High-Strength Steel Wire with Initial Defect for Bridge Cable. Appl. Sci. 2020, 10, 2293. [Google Scholar] [CrossRef]
  29. Behvar, A.; Haghshenas, M. A critical review on very high cycle corrosion fatigue: Mechanisms, methods, materials, and models. J. Space Saf. Eng. 2023, 10, 284–323. [Google Scholar] [CrossRef]
  30. Tateishi, K.; Hanji, T.; Minami, K. A prediction model for extremely low cycle fatigue strength of structural steel. Int. J. Fatig. 2007, 29, 887–896. [Google Scholar] [CrossRef]
  31. Akpoborie, J.; Fayomi, O.S.I.; Agboola, O.; Samuel, O.; Oreko, B.; Ayoola, A. Electrochemical Corrosion Phenomenon and Prospect of Materials Selection in Curtailing the Challenges. IOP Conf. Ser. Mater. Sci. Eng. 2021, 12, 1107. [Google Scholar] [CrossRef]
  32. Adamczyk, P.; Zięty, A.; Grygier, D. Evaluation of materials used for coatings of electrical connectors used in the electrical harness of passengers cars. Comb. Eng. 2023, 192, 43–49. [Google Scholar] [CrossRef]
  33. Song, J.; Wang, L.; Zibart, A.; Koch, C. Corrosion Protection of Electrically Conductive Surfaces. Metals 2012, 2, 450–477. [Google Scholar] [CrossRef]
  34. Yu, G.-F.; Chiu, Y.; Zheng, X.; Yuan, Z.-L.; Wang, Z.-X. Contact pressure of high-voltage DC power relay change and life prediction and structure optimization. Adv. Mech. Eng. 2021, 13, 2–22. [Google Scholar] [CrossRef]
  35. Liu, Y.; Zhang, G.; Zhao, C.; Qin, H.; Yang, J. Influence of mechanical faults on electrical resistance in high voltage circuit breaker. Int. J. Electr. Power Energy Syst. 2021, 129, 106827. [Google Scholar] [CrossRef]
  36. Shen, F.; Ke, L.-L. Numerical Study of Coupled Electrical-Thermal-Mechanical-Wear Behavior in Electrical Contacts. Metals 2021, 11, 955. [Google Scholar] [CrossRef]
  37. Malakov, I.; Zaharinov, V. Optimization of size ranges of technical products. Appl. Mech. Mat. 2016, 859, 194–203. [Google Scholar] [CrossRef]
  38. Romansky, R.P.; Hinov, N.L. Deterministic and Stochastic Approaches in Computer Modeling and Simulation; IGI Global: Hershey, PA, USA, 2023. [Google Scholar]
  39. Soares, M.; He, Q.; DePaiva, J.; de Freitas, B.; Soares, P.; Veldhuis, S.; Amorim, F.; Torres, R. Mechanical and Tribological Behavior of Nitrided AISI/SAE 4340 Steel Coated with NiP and AlCrN. Lubricants 2024, 12, 181. [Google Scholar] [CrossRef]
Figure 1. System for high power transmission through well piping: (a) conceptual diagram; (b) existing packer—photo and diagram.
Applsci 15 09932 g001
Figure 2. Arcing effects: (a) contact fritting; (b) boundary between the arcing and no-arcing regions in terms of the supply voltage and the gap distance.
Applsci 15 09932 g002
Figure 3. Gap in slip contact.
Applsci 15 09932 g003
Figure 4. Resistance of the contact system as a function of the area ratio.
Applsci 15 09932 g004
Figure 5. Excess temperature of the contact system as a function of the area ratio.
Applsci 15 09932 g005
Figure 6. Summary for high voltage effects. Possible working zone for 300 kW electric power transfer.
Applsci 15 09932 g006
Figure 7. Anodic and cathodic reactions for the occurrence of corrosion.
Applsci 15 09932 g007
Figure 8. Contact system analysis. Simulation geometry model.
Applsci 15 09932 g008
Figure 9. Contact system analysis: (a) mesh model; (b) applied boundary conditions.
Applsci 15 09932 g009
Figure 10. Contact system analysis. Results for contact pressure in MPa in: (a) slip–casing interface; (b) slip–caliper interface; (c) caliper–mandrel interface.
Applsci 15 09932 g010
Figure 11. Contact system analysis. Results for equivalent (von Mises) distribution fields in MPa for: (a) entire model; (b) slip; (c) caliper; (d) cone.
Applsci 15 09932 g011
Figure 12. Contact system analysis. Proposed improvements in (a) caliper design adjustment; (b) slip teeth improvement directions.
Applsci 15 09932 g012
Figure 13. Contact system analysis of the improved system. Results for contact pressure in MPa in (a) slip–casing interface; (b) slip–caliper interface.
Applsci 15 09932 g013
Figure 14. Contact system analysis. Results for equivalent (von Mises) distribution fields in MPa for (a) entire model; (b) slip; (c) caliper.
Applsci 15 09932 g014
Disclaimer/Publisher’s Note: The statements, opinions and data contained in all publications are solely those of the individual author(s) and contributor(s) and not of MDPI and/or the editor(s). MDPI and/or the editor(s) disclaim responsibility for any injury to people or property resulting from any ideas, methods, instructions or products referred to in the content.