Article

Improved YOLOv8s-Based Detection for Lifting Hooks and Safety Latches

by
Yunpeng Guo
1,2,
Dianliang Xiao
1,
Xin Ruan
2,
Ran Li
1,* and
Yuqian Wang
1
1
Transportation Safety Research Center, China Academy of Transportation Sciences, Beijing 100010, China
2
College of Civil Engineering, Tongji University, Shanghai 200092, China
*
Author to whom correspondence should be addressed.
Appl. Sci. 2025, 15(18), 9878; https://doi.org/10.3390/app15189878
Submission received: 6 August 2025 / Revised: 8 September 2025 / Accepted: 8 September 2025 / Published: 9 September 2025

Abstract

Lifting hooks equipped with safety latches are critical terminal components of lifting machinery. The safety condition of this component is a crucial factor in preventing load dislodgement during lifting operations. To achieve intelligent monitoring of the hook and the safety latch, precise identification of these components is a crucial initial step. In this study, we propose an improved YOLOv8s detection model called YOLO-HOOK. To reduce computational complexity while simultaneously maintaining precision, the model incorporates an Efficient_Light_C2f module, which integrates a Convolutional Gated Linear Unit (CGLU) with Star Blocks. The neck network utilizes Multi-Scale Efficient Cross-Stage Partial (MSEICSP) to improve edge feature extraction capabilities under complex lighting conditions and multi-scale variations. Furthermore, a HOOK_IoU loss function was designed to optimize bounding box regression through auxiliary bounding boxes, and a piecewise linear mapping strategy was used to improve localization precision for challenging targets. The results of ablation studies and comparative analyses indicate that the YOLO-HOOK secured mAP scores of 90.4% at an Intersection over Union (IoU) threshold of 0.5 and 71.6% across the 0.5–0.95 IoU span, thereby eclipsing the YOLOv8s reference model by margins of 4.6% and 5.4%, respectively. Furthermore, it manifested a paramount precision of 97.0% alongside a commendable recall rate of 83.4%. The model parameters were reduced to 9.6 M, the computational complexity was controlled at 31.0 Giga Floating-point Operations Per Second (GFLOPs), and the inference speed reached 310 frames per second (FPS), balancing a lightweight design with excellent performance. These findings offer a technical approach for the intelligent recognition of hooks and safety latches during lifting operations, thus aiding in refining the safety management of lifting operations.

1. Introduction

Lifting machinery is indispensable at construction sites and is widely employed in material lifting and handling operations [1,2]. To enhance the operational safety of lifting machinery, scholars have conducted research from various perspectives [3]. Despite the implementation of safety measures, due to the complex operational environment and variable loading conditions, safety accidents involving such machinery frequently occur during construction operations, posing a significant threat to both project progress and personnel safety [4]. Relevant statistical data demonstrate that, among major equipment accidents, those related to lifting operations rank high in terms of accident frequency and fatality rates [5,6]. Dropped objects are a common cause of injury during lifting operations. Shepherd et al. [7] revealed in their study that 27.4% of lifting-related accidents are caused by dropped objects. Enhancing the operational safety of lifting machinery is therefore critical and requires immediate action.
The safety status of a lifting hook equipped with a safety latch is a critical factor that governs the operational integrity of lifting procedures [8,9]. At present, safety supervision relies predominantly on manual inspection at the construction site; this traditional method is often insufficient for providing effective real-time warning capabilities [10]. With the development of machine vision technology, its applications in the field of construction are being explored in greater depth [11]. Precise detection of the lifting hook and its safety latch is the critical foundation for safety monitoring. Various scholars have also conducted research related to hook identification. In terms of traditional image processing methods, Wu et al. [12] designed a machine vision system based on a backpropagation neural network, specifically for identifying hook positions in coal mine lifting scenarios. Fu et al. [13] developed a lifting hook visual detection method relying on constraint relationships derived from multiple features of both the hook and its hoisting rope.
In recent years, as the YOLO model has become a prevalent algorithm in the field of object detection, several scholars have undertaken investigations into hook detection leveraging the YOLO architecture. Studies on hook recognition algorithms have mainly focused on the improvement of the YOLOv5 model. Liang et al. [14] proposed an improved YOLOv5 algorithm guided by a transformer for hook detection and employed the SIoU loss function to achieve precise hook localization. Li [15] enhanced the YOLOv5s network model by incorporating a Convolutional Block Attention Module into the final layer of its backbone, which resulted in the improved model achieving a hook detection precision of 83.7%. Zhang et al. [16] improved the YOLOv5s network model for the recognition of lifted objects and hooks. The key improvements include the introduction of AKConv into the backbone network and the replacement of the C3 module with the C3Ghost module in the neck. The hook recognition precision of the improved model reaches 96%, with an inference speed of 111.1 frames per second (FPS). Sun et al. [17] proposed a hook recognition method based on an improved YOLOv5s architecture. The main improvements include embedding the SELayer for channel attention and employing the CIoU loss function to optimize bounding box regression. For the improved model, the hook recognition precision is increased to 96%, while mAP@0.5 reaches 96.42%, and mAP@0.5:0.95 attains 62.02%. Chen et al. [18] proposed an improved YOLOv5s model. They replaced the original SPPF module in the backbone with a HOOK-SPPF module, incorporated a decoupled head to optimize the confidence scores and bounding box regression, and adopted SIoU as the loss function. By leveraging the vector angle information between the ground truth and predicted boxes, this approach facilitated improved model convergence. The experimental results demonstrated that this algorithm achieved a 3% improvement in mAP@0.5, reaching a 91.2% precision at a detection speed of 24.0 FPS.
Overall, while existing research has made considerable progress in the precision and robustness of hook detection, certain limitations remain. First, the size of hooks and safety latches varies with distance, especially in long-distance scenarios where the effective pixel area of these components in images significantly decreases. The faint feature information at such scales easily leads to missed detections (false negatives). Existing models still struggle to adapt effectively to multi-scale object detection, limiting their robustness in practical applications. Furthermore, given the hardware and energy limitations typical of edge-computing scenarios, maintaining a balance between computational efficiency and reliable object recognition performance is essential.
As an iterative improvement over YOLOv5, YOLOv8 achieves enhanced parameter efficiency through an optimized architecture while maintaining detection precision, thereby demonstrating superior deployment suitability in resource-constrained environments. This study focuses on optimizing and enhancing the YOLOv8s model to improve its detection capabilities for lifting hooks and their safety latches. The improvement strategies primarily include the following: in the backbone network, the original C2f module is replaced by a newly designed Efficient_Light_C2f module, which integrates the Convolutional Gated Linear Unit (CGLU) and Star Blocks components; in the neck network, the C2f module is substituted with a Multi-Scale Efficient Cross-Stage Partial (MSEICSP) module, and a novel loss function, denoted as HOOK_IoU, is introduced. The proposed method is validated using an established dataset. Through this study, we aim to enhance the recognition accuracy of hooks and safety latches during operation, thereby laying the groundwork for monitoring and early warning of hook and safety latch issues.
The main contributions of this study can be summarized as follows:
(1)
Efficient_Light_C2f module: We integrate the lightweight Star Block and the CGLU with the C2f module, thereby proposing the Efficient_Light_C2f module. This design leverages the lightweight characteristics of the Star Block and the channel attention mechanism of CGLU, enabling the network to maintain low computational cost while enhancing feature extraction capability. Consequently, it improves the model’s robustness and adaptability to complex or variant inputs.
(2)
MSEICSP module: We develop the MSEICSP module, which integrates multiple Multi-scale Efficient (MSEI) units to achieve integrated multi-scale feature acquisition, reinforced delineation of edge-associated cues, and streamlined yet effective feature amalgamation. By capitalizing on these proficiencies, the MSEICSP module significantly augments the network’s representational richness and elevates its overall operational efficacy.
(3)
HOOK_IoU loss function: We propose a loss function, HOOK_IoU, to improve the model’s ability to detect objects in complex scenes and recognize challenging targets. This loss function enables precise evaluation of overlap for small objects and edge-localized targets and demonstrates excellent adaptability to morphologically complex or irregular defects. It is particularly suited for fine-grained detection tasks involving imbalanced categories, such as the operational state monitoring of hooks and safety latches.

2. Related Work

Within the domain of machine vision, object detection constitutes a pivotal investigative avenue, dedicated to the automated identification and precise spatial delineation of designated object classes within static imagery or dynamic video sequences. Specifically, this task requires models not only to determine whether a target exists within an image, but also to accurately annotate its location, typically by employing a bounding box representation. Early approaches to object detection primarily relied on hand-crafted features combined with traditional machine learning algorithms.
In 2001, Viola P., Jones M. proposed the classical Viola–Jones detector [19], originally designed for face detection but extendable to other categories. This method leveraged Haar-inspired descriptors in conjunction with the AdaBoost paradigm to assemble a robust discriminative model, further integrated with a hierarchical cascade architecture and a sliding-window traversal scheme to facilitate efficient detection. The tiered cascade mechanism permitted the prompt exclusion of non-target instances at the initial evaluation stages, thereby markedly accelerating the overall inference throughput. Subsequently, in 2005, Dalal N., Triggs B. introduced the Histogram of Oriented Gradients (HOG) algorithm [20], which encodes texture and shape information through the computation of local gradient orientation histograms, laying the foundation for pedestrian detection. However, HOG is sensitive to noise and exhibits limited robustness to scale variations. In 2008, the Deformable Part Models (DPM) [21] method was introduced, decomposing objects into multiple deformable components and constructing discriminative models for each part, thereby enhancing robustness and adaptability.
Driven by the progressive refinement of deep learning methodologies, alongside escalations in computational processing power and the diversification of data acquisition modalities, Convolutional Neural Networks (CNNs) have ascended to a dominant paradigm in object detection research. In a pivotal milestone of 2012, Krizhevsky A and collaborators introduced the groundbreaking AlexNet model [22], which significantly reduced the error rate on the test dataset by using a deep architecture, ReLU activation function, and Dropout regularization, marking a breakthrough for deep learning in computer vision. In 2014, the Visual Geometry Group (VGG) at the University of Oxford introduced VGGNet [23], which employed stacked small convolutional kernels and increased network depth to improve classification accuracy, albeit at the cost of higher computational demands and issues such as gradient explosion. In the same year, Girshick et al. presented R-CNN [24], which comprised region proposal generation, convolutional feature extraction, SVM classification, and bounding box regression, achieving superior performance on the PASCAL VOC 2007 dataset [25]. However, its requirement for fixed input dimensions limited flexibility. In 2015, He et al. proposed ResNet [26], whose residual learning framework effectively alleviated the vanishing gradient problem. That year, Fast R-CNN [27] improved upon R-CNN by introducing RoI Pooling, which reduced complexity and accelerated training. In 2016, Faster R-CNN [28] further integrated a Region Proposal Network and anchor boxes, enabling end-to-end region proposal generation and detection.
Also in 2015, Redmon et al. proposed YOLO (You Only Look Once) [29], which reframed object detection as a regression problem. Unlike conventional two-stage detection methods, YOLO divides the input image into a grid and performs regression-based predictions for each grid cell. This end-to-end approach enables the model to directly output bounding boxes and class probabilities, resulting in high efficiency and low inference latency. In the same year, the Single Shot MultiBox Detector (SSD) [30], borrowing concepts from YOLO and Faster R-CNN, was introduced to handle multi-scale feature maps effectively, yielding better precision compared with YOLO.
In 2017, the Feature Pyramid Network (FPN) [31] was proposed, which constructed a pyramid-shaped feature hierarchy to utilize multi-level features effectively, thus improving small-object detection performance. The same year witnessed improvements to YOLO with YOLO 9000 [32], which incorporated batch normalization and prior boxes to enhance generalization and performance. Concurrently, Lin T Y et al. [33] introduced RetinaNet, combining FPN with the Focal Loss function to mitigate inter-class sample distribution skewness and concurrently strengthen detection performance across varying object scales. Subsequently, in 2018, Redmon J et al. [34] unveiled YOLOv3, leveraging the Darknet-53 feature-extraction backbone and incorporating a multi-label prediction mechanism, achieving significant precision improvements. In 2020, Bochkovskiy A et al. [35] proposed YOLOv4, integrating techniques such as data augmentation, label smoothing [36], Complete IoU loss [37], Spatial Pyramid Pooling [38], Cross Stage Partial Network [39], and Path Aggregation Network (PANet) [40], further enhancing both precision and speed. Ultralytics subsequently released the YOLOv5 series with continuous iterations and optimizations [41]. In the same year, Megvii Technology introduced YOLOX [42], employing a decoupled head, SimOTA label assignment strategy, and anchor-free detection to improve precision. In 2022, Bochkovskiy’s team [43] proposed YOLOv7, which utilized computationally efficient feature aggregation architectures, adaptive label allocation strategies, and structurally re-parameterized convolutional modules to achieve an improved trade-off between precision and speed. YOLOv8 [44] restructured the CSPDarknet backbone by introducing the C2f module to strengthen feature flow, adopted an anchor-free detection head to simplify computation, and added segmentation and pose estimation branches to enhance performance, flexibility, and efficiency. YOLOv9 [45] introduced Programmable Gradient Information and a Generalized Efficient Layer Aggregation Network, improving feature utilization through dynamic gradient propagation adjustments, while optimizing backbone-neck feature fusion. YOLOv10 [46] incorporated an end-to-end detection head that eliminates the need for Non-Maximum Suppression, advancing real-time detection performance. The latest YOLOv11 [47] by Ultralytics introduced the C3K2 dynamic convolution module and C2PSA attention mechanism, combining adaptive convolution kernels with multi-head self-attention to achieve superior multi-scale feature extraction. Combined with the SPFF neck architecture and depthwise separable convolutional detection heads, YOLOv11 enhances training speed and reduces GPU memory consumption without compromising precision.
In the deep learning era, object detection continues to be an active research area, with increasingly powerful algorithms introduced annually. Some research teams focus on designing novel architectures, exploring entirely new frameworks and methodologies; others improve existing models by integrating advancements from related fields to further enhance speed and precision. Additionally, numerous studies aim to promote the practical deployment of object detection systems, driving their adoption across diverse industry applications.

3. YOLOv8

The YOLOv8 model was released by Ultralytics in 2023 [44]. The high detection speed and precision of the YOLOv8 model establish it as an optimal framework for object monitoring and tracking applications. Typical application scenarios for the model include autonomous driving, intelligent surveillance, and industrial inspection [48]. The network architecture of YOLOv8 is illustrated in Figure 1. Its architecture comprises four key components: the input module, the backbone network, the neck network, and the detection head.
The input module handles critical operations, including image scaling, normalization, and sophisticated data augmentation strategies. These operations are crucial for enhancing the model’s adaptability to variations in scale, illumination, and background conditions. The backbone network generally utilizes efficient CNN techniques based on the Cross-Stage Partial (CSP) concept to extract deep features. This design enhances the model’s robustness against changes in object scale, pose, and appearance. The neck network, which commonly employs structures such as PANet, integrates feature maps from various layers of the backbone network. This integration combines high-level semantic information with low-level spatial details, and this multi-scale feature fusion mechanism significantly improves the detection capabilities for objects of diverse sizes. Furthermore, the detection head typically adopts a decoupled head or anchor-free design, enabling it to address classification and localization tasks independently while directly predicting bounding boxes and class probabilities from the fused features. This architecture enables YOLOv8 to achieve high precision and high-speed real-time object detection.
Five versions of YOLOv8 are currently available [49]. In this study, YOLOv8s was selected as the baseline model due to its optimal balance between detection speed and precision [50,51].

4. Proposed Modifications to the YOLOv8s Model

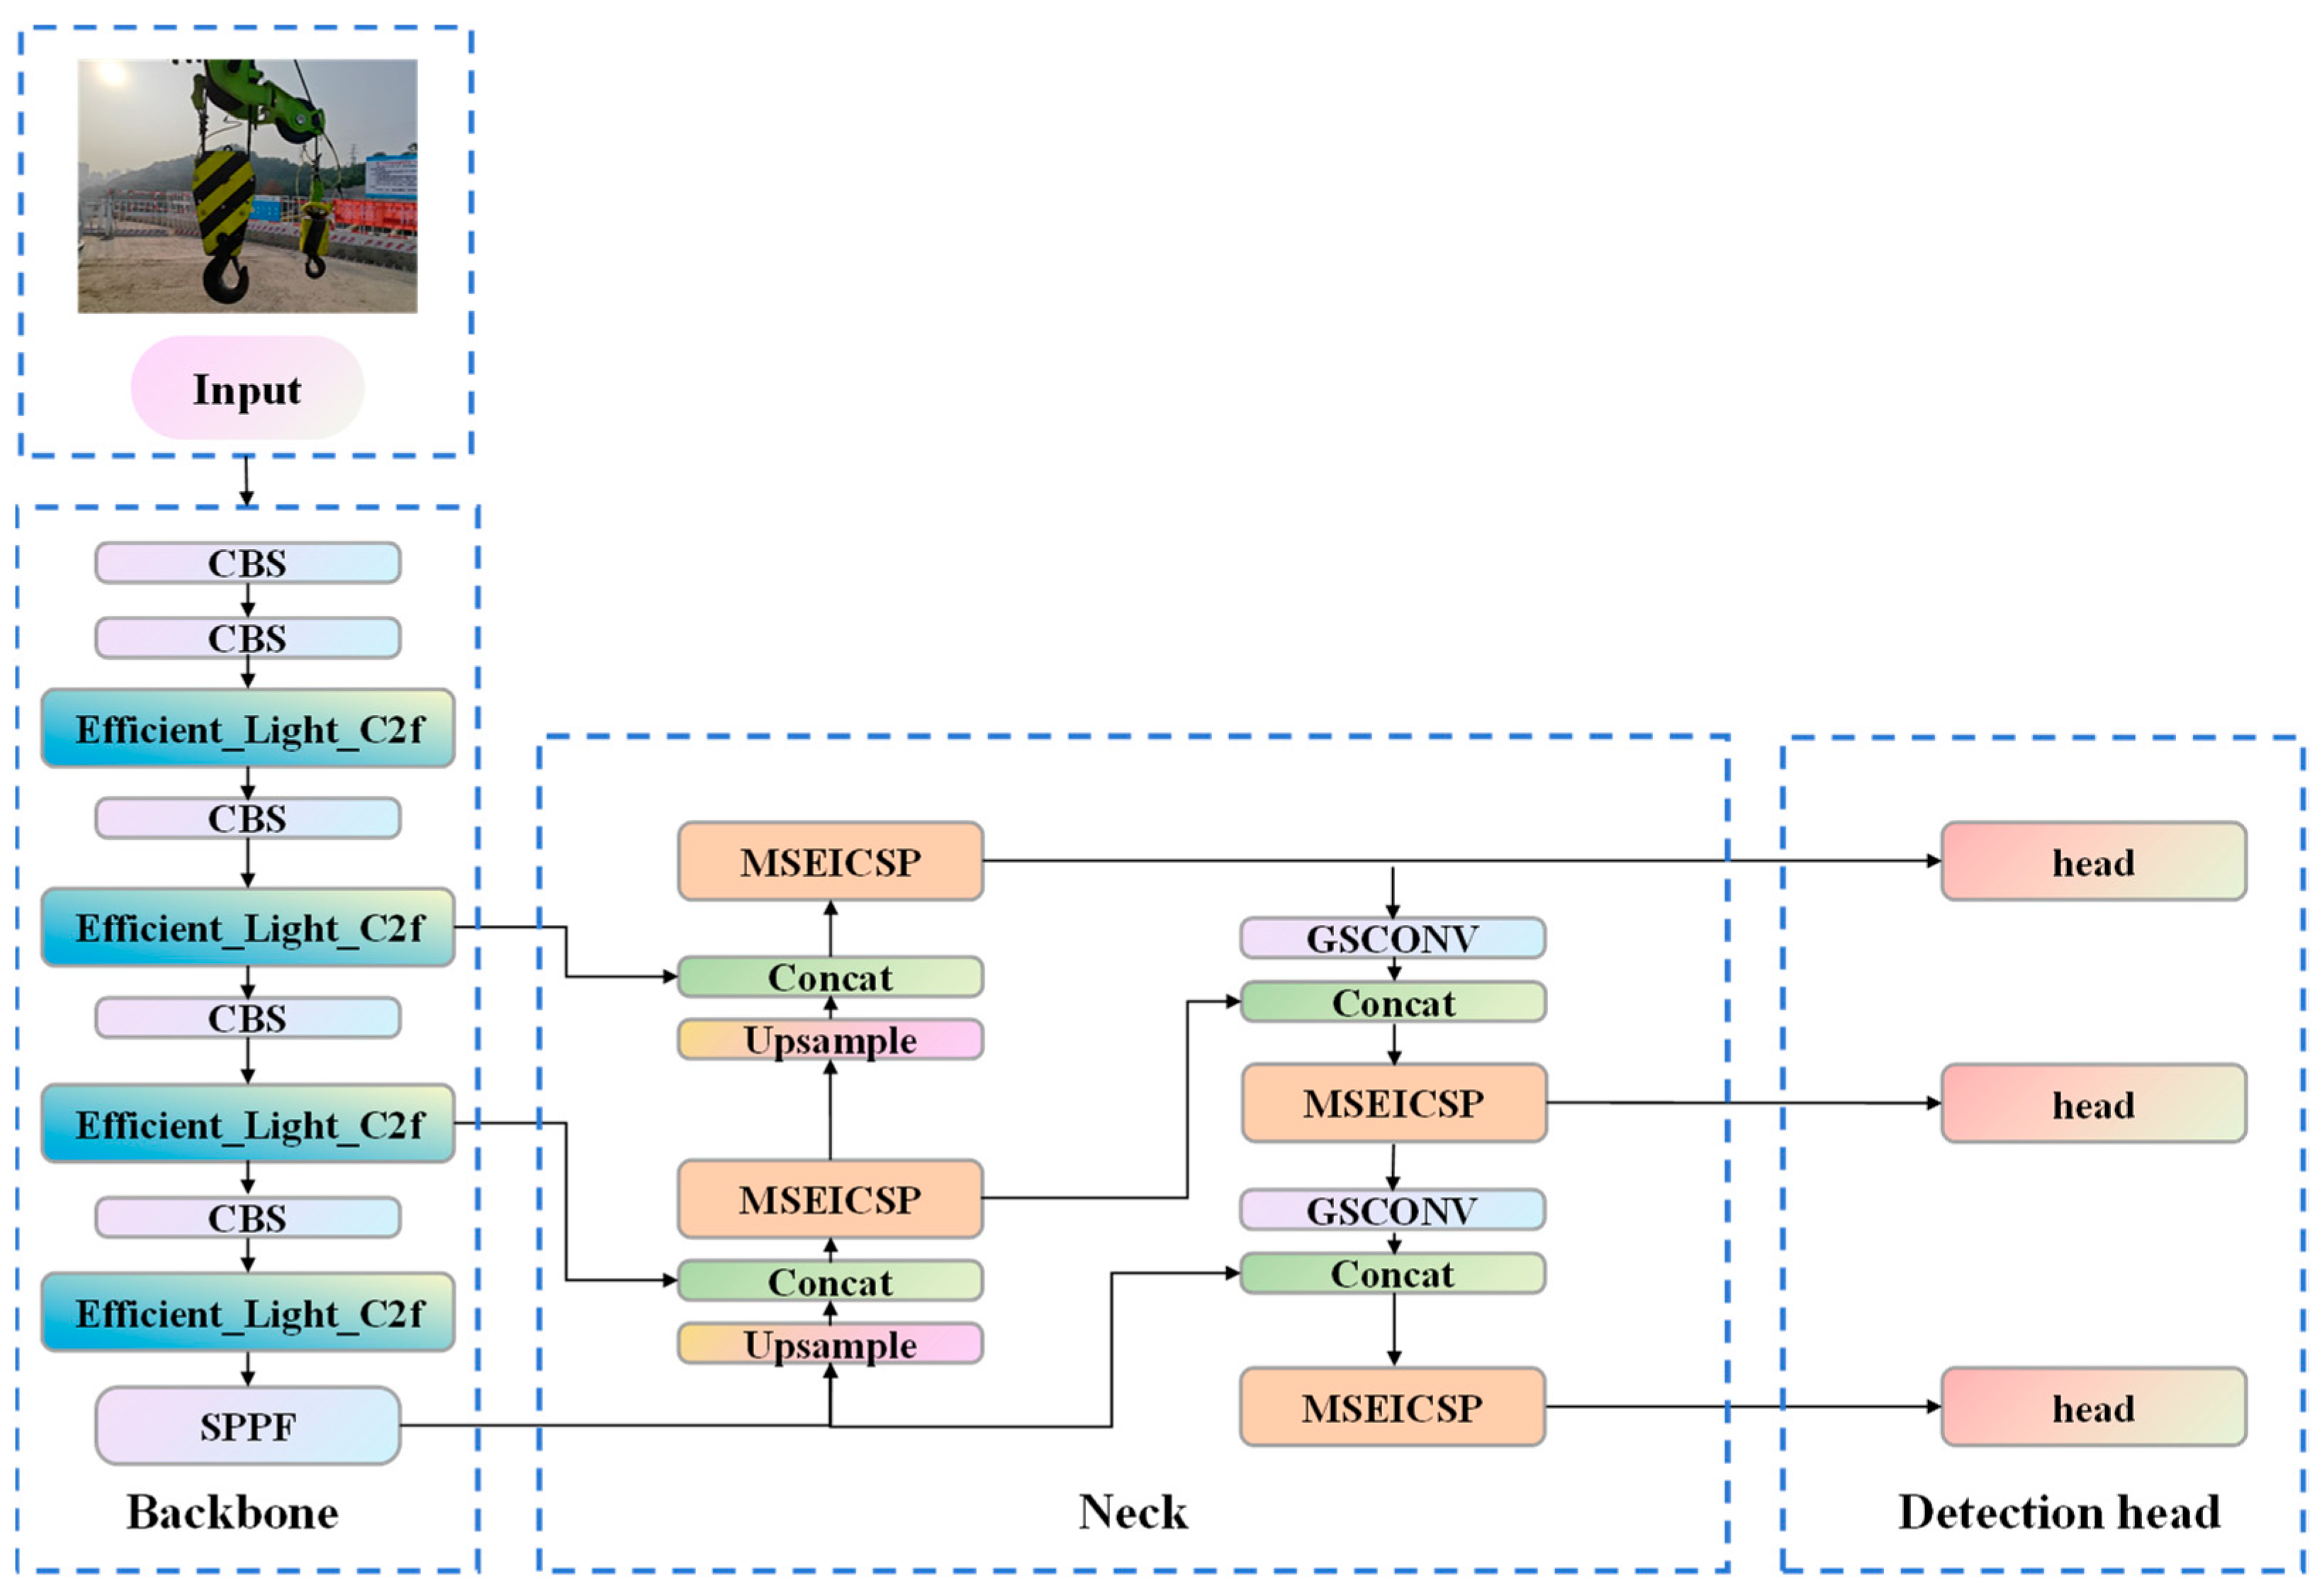
To enhance the detection precision of lifting hooks and safety latches, herein, we propose an improved detection model based on YOLOv8s, referred to as YOLO-HOOK. The network architecture is illustrated in Figure 2. The improved detection model incorporates three key components: Efficient_Light_C2f, MSEICSP, and HOOK_IoU loss function.

4.1. Efficient_Light_C2f

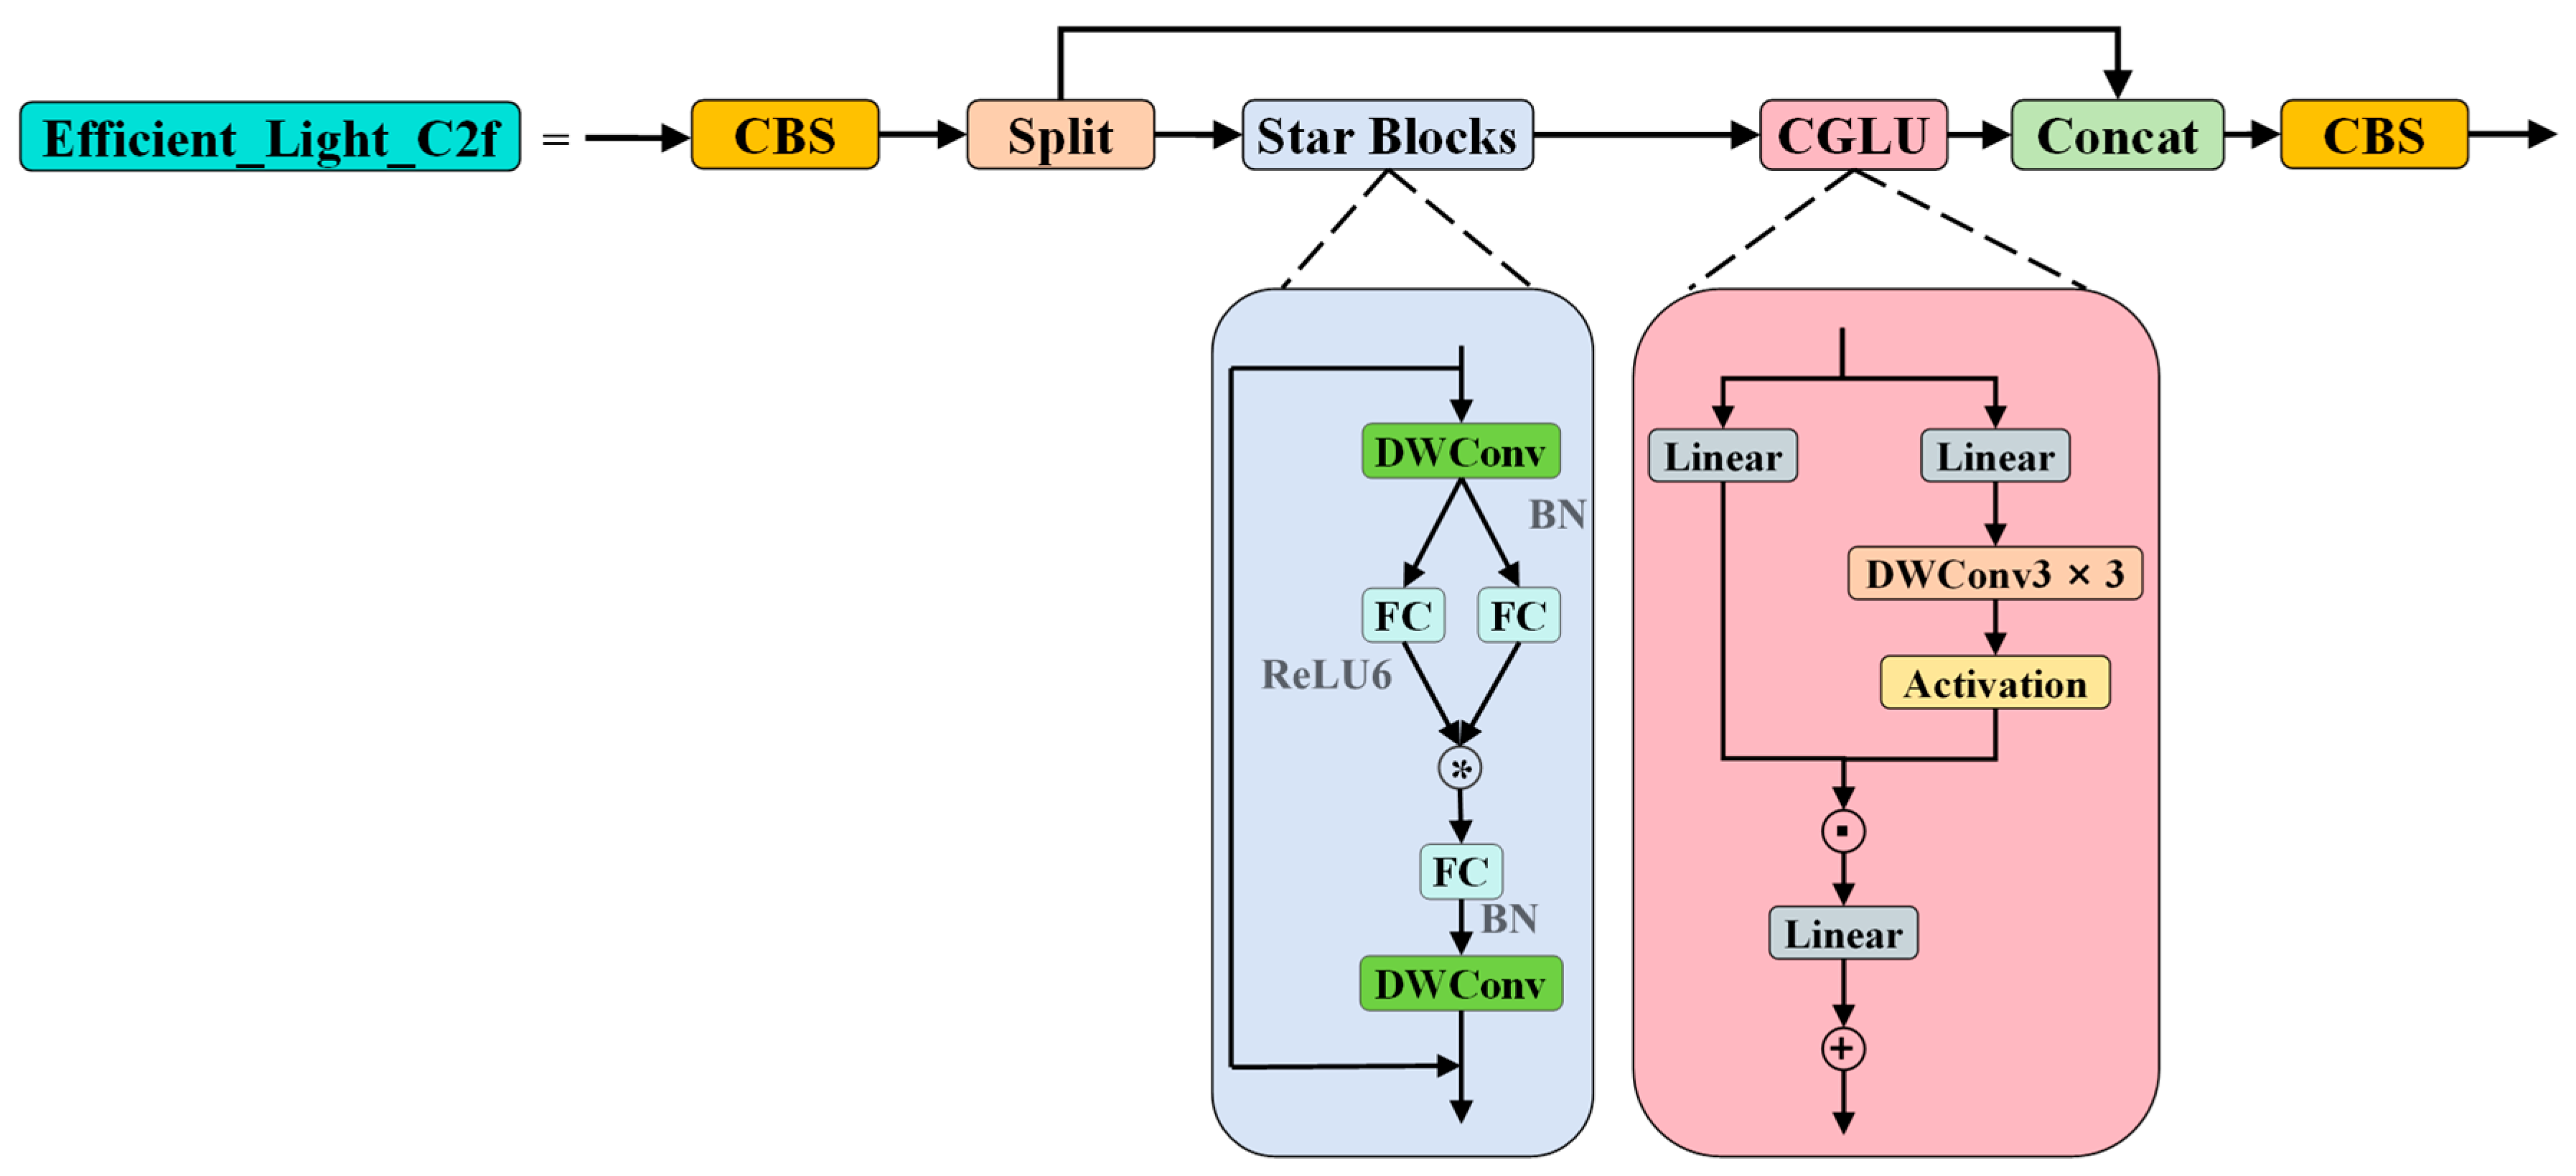
We reconstructed the original C2f module by introducing CGLU and Star Blocks, naming the resulting module Efficient_Light_C2f (structure illustrated in Figure 3). This module achieves enhanced feature representation and a superior model performance within a low-dimensional computational space by integrating local channel attention, as provided by the CGLU, with the high-dimensional feature mapping capabilities of Star Blocks. Concurrently, Efficient_Light_C2f reduces computational complexity in challenging scenarios, facilitating deployment on resource-constrained devices.

4.1.1. Star Blocks

Star Blocks [52] are the fundamental building blocks of the StarNet network architecture, serving as the concrete implementation of the star operation. This operation fuses features from two linear transformations via element-wise multiplication. In a single-layer neural network, this is typically expressed as W 1 T X + B 1 W 2 T X + B 2 . By merging the weight matrices and biases, this can be simplified to W 1 T X W 2 T X . Rewriting and expanding this expression as shown in Equation (1), we obtain a form consisting of d + 2 d + 1 2 distinct terms. The majority of these terms exhibit a non-linear relationship with the input, representing independent implicit dimensions.
w 1 T x w 2 T x = i = 1 d + 1 w 1 i x i j = 1 d + 1 w 1 j x j = i = 1 d + 1 j = 1 d + 1 w 1 i w 2 j x i x j = α 1 , 1 x 1 x 1 + + α 4 , 5 x 4 x 5 + + α d + 1 , d + 1 x d + 1 x d + 1 d + 2 d + 1 / 2 i t e m s
where we use i, j to index the channel and α is the coefficient for each item:
α i , j =                 w 1 i w 2 j                           if   i = = j w 1 i w 2 j + w 1 j w 2 i           if   i ! = j
The above calculations allow the star operation, while computing in a d-dimensional space, to achieve representation in an implicit feature space of approximately d 2 2 (considering d 2 ), significantly increasing the feature dimensionality without additional computational overhead. When generalized to multi-layer networks, by stacking multiple layers, the star operation can recursively increase the implicit dimensionality exponentially to near infinity. With an initial network layer width of d, a single star operation generates a representation in an implicit feature space of R d 2 2 1 . If the output of the l t h star operation is O l , then O l belongs to a feature space of R d 2 2 l .
The preceding analysis reveals that the star operation can implicitly map input features to a higher-dimensional, non-linear feature space without increasing the network’s explicit width or computational complexity (FLOPs). These measures allow it to achieve high performance while maintaining computational efficiency within a compact network structure, making it suitable for resource-constrained scene detection applications.

4.1.2. CGLU

The CGLU [53] is a novel channel mixing architecture that integrates depthwise convolution (DWConv) into the Gated Linear Unit (GLU) mechanism. This integration endows the model with both local perception capabilities and fine-grained feature modulation. The fundamental framework of CGLU adopts a parallel dual-branch structure. The value branch maintains the same depth as Multi-Layer Perceptron (MLP) and GLU, facilitating effective backpropagation. The gating branch, however, incorporates a 3 × 3 DWConv before the activation function. This allows the gating branch to encode surrounding spatial context information and generate independent gating weights for each feature point. The outputs of the two branches are then modulated through element-wise multiplication.
CGLU bridges the gap between GLU and Squeeze-and-Excitation (SE) mechanisms. Furthermore, when maintaining a consistent number of parameters with a Convolutional Feed-Forward Network (ConvFFN) with an expansion ratio of R and a kernel size of k × k, CGLU exhibits a computational complexity of r, which is lower than the 2RHWC2 + RHWCk2 of ConvFFN. In these equations, H and W represent the height and width of the pooling layer, respectively, and C represents the number of channels in the input feature map.

4.2. MSEICSP

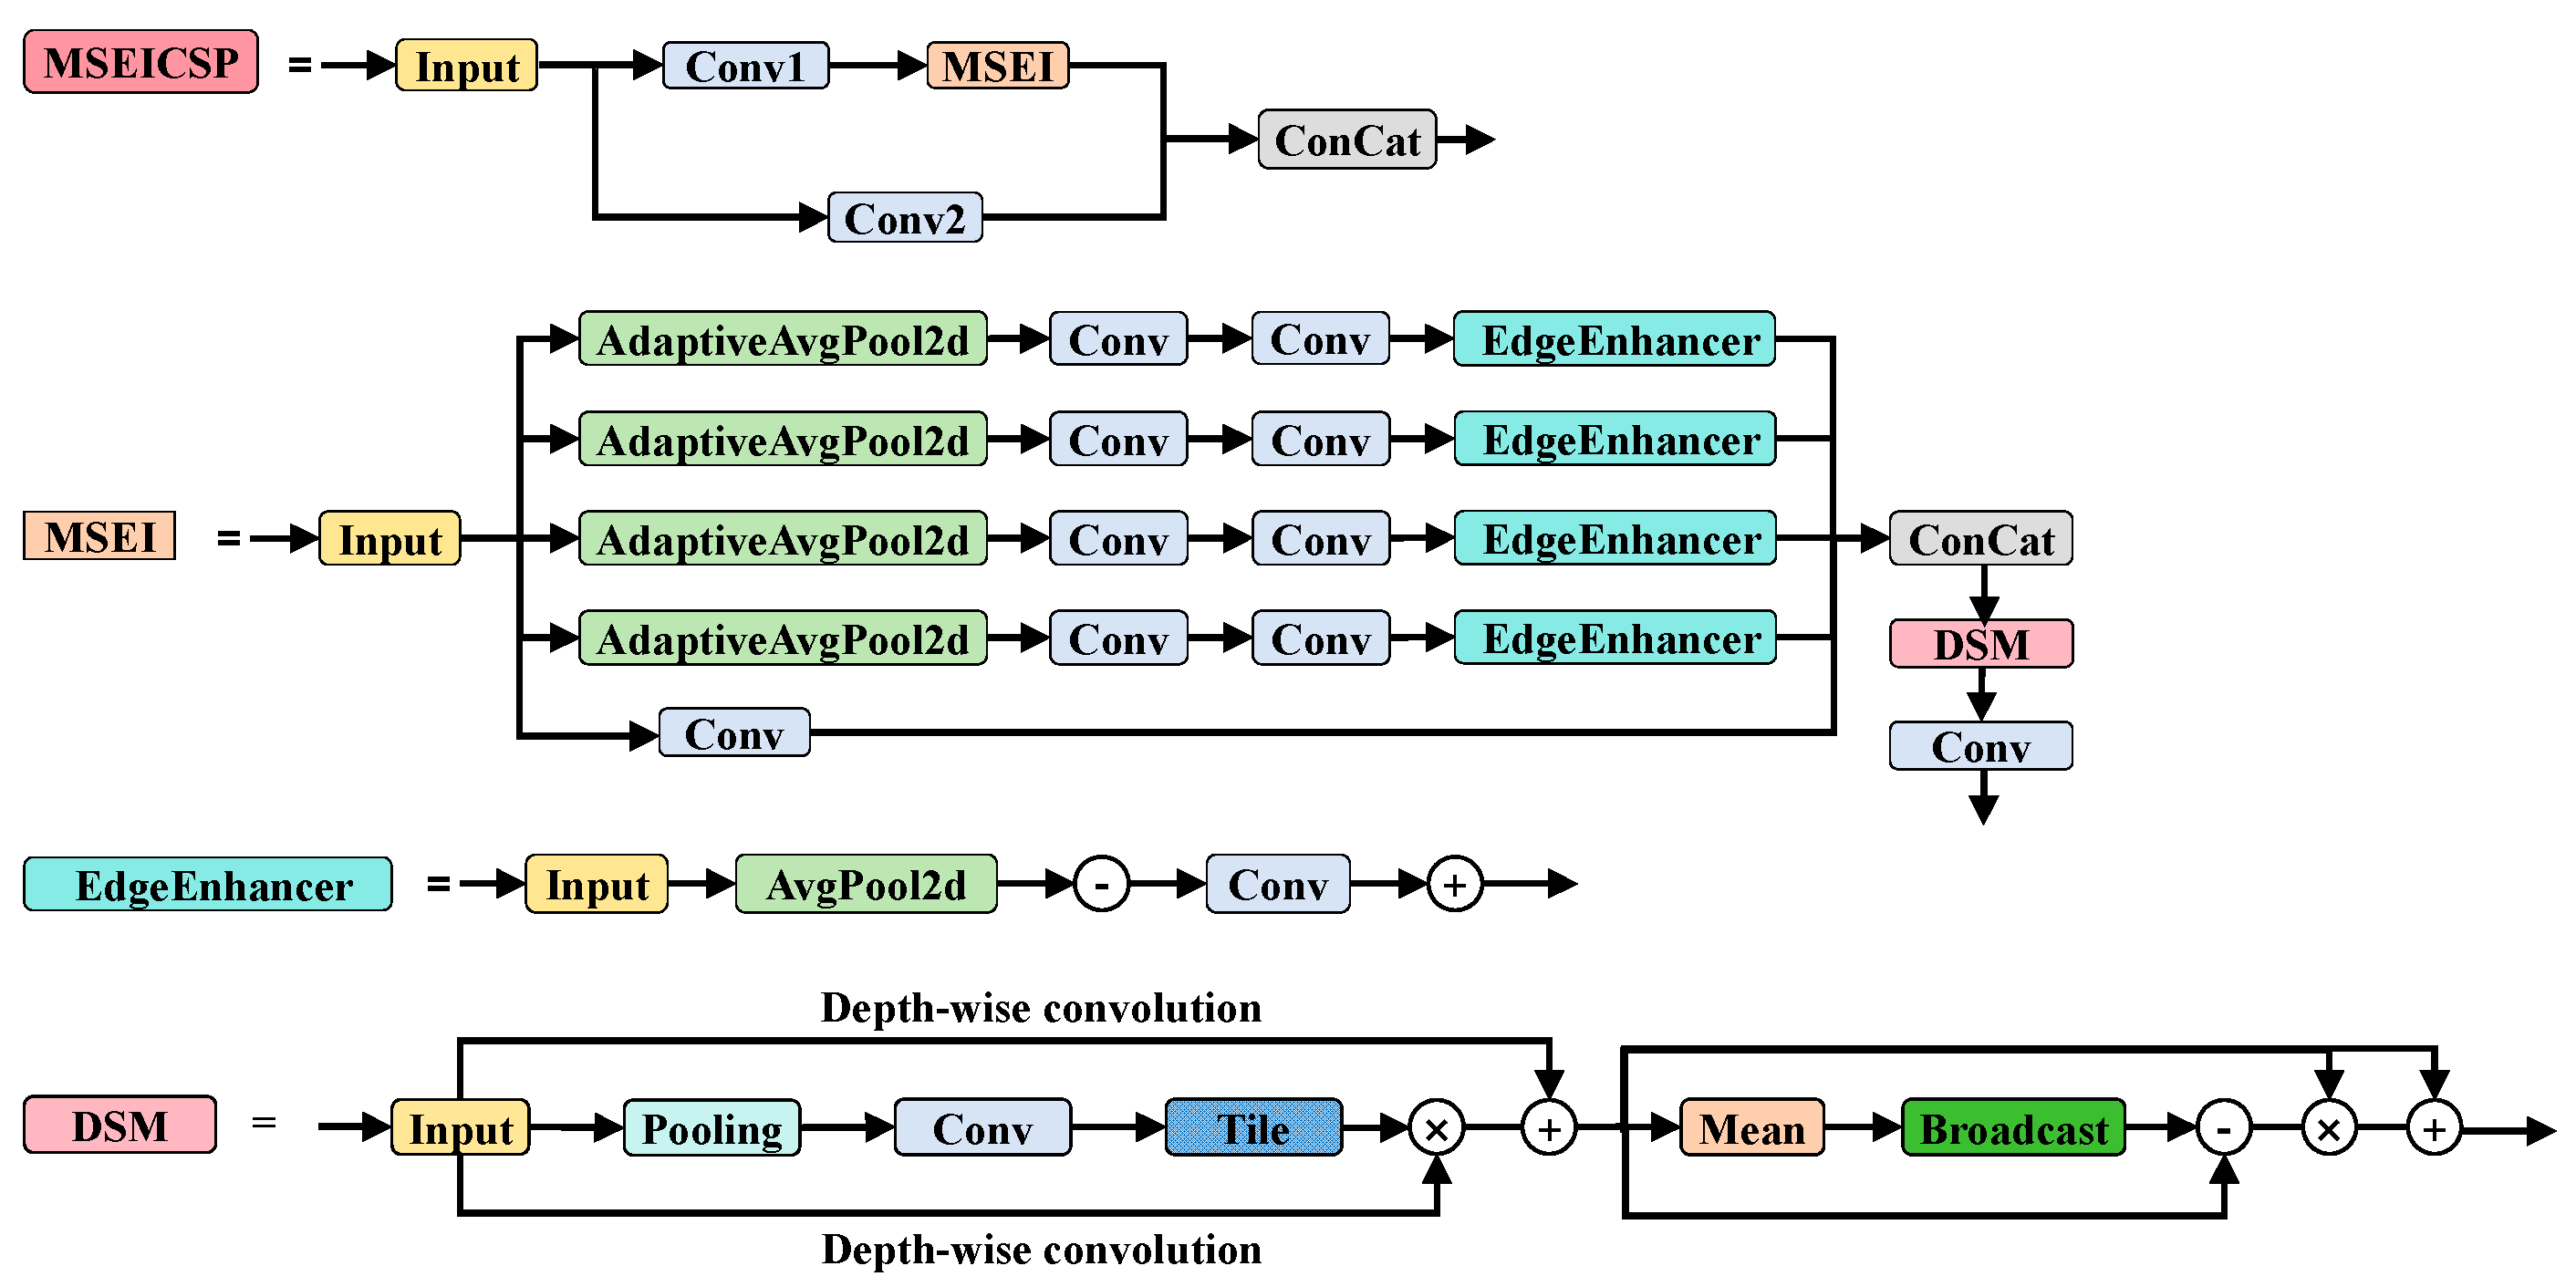
To enhance the model’s ability to extract multi-scale features and capture edge details in complex images, we propose the MSEICSP feature enhancement module (structure illustrated in Figure 4). This module concatenates the image features from the “Conv1 + MSEI” branch and the “Conv2” branch (Concat), followed by a convolutional layer to compress channel dimensionality. This design efficiently utilizes parameters while maintaining computational efficiency, thereby improving model performance and enabling effective multi-scale feature extraction and edge enhancement.
Multi-scale Efficient (MSEI) serves as the core submodule of MSEICSP. AdaptiveAvgPool2d processes the input feature map to generate four branches with differentiated resolutions. Simultaneously, a direct convolutional branch is included to balance the computational load. Each branch undergoes basic feature extraction via two convolutional layers. In the four fine-grained branches, the convolutional output of each branch is connected to an EdgeEnhancer module. The features from all branches are then concatenated and fed into a dual-domain selection mechanism (DSM) [54] module. Lastly, the features outputted by the DSM are processed by a convolutional layer for channel integration and dimension adjustment, forming enhanced features that are adapted to downstream tasks, preserving both multi-scale semantics and edge details while achieving precise matching of feature dimensions.
(a)
EdgeEnhancer Module
This module initially performs average pooling on the input feature map using AvgPool2d, smoothing the feature map and extracting its low-frequency information. The original input feature map is then subtracted from the blurred feature map, yielding the edges or high-frequency components of the image. The resulting edge information is input into a convolutional layer to enhance its feature representation. Typically, an activation function, such as Sigmoid, is used to regulate the enhancement intensity. Lastly, the processed edge information is fed back into the original input feature map, achieving explicit edge detail enhancement.
(b)
DSM Module
The DSM module consists of a Spatial Selection Module (SSM) and a Frequency Selection Module (FSM). The SSM is used to locate important regions in the spatial domain, providing degradation location information for subsequent processing. It first extracts features through average pooling and max pooling and then generates a generic degradation location feature map F via a 3 × 3 convolution ( F = C o n v 3 A v g P o o l F , M a x P o o l F ). Subsequently, a depthwise separable convolution is combined to perform channel separation transformation, and a spatial selection feature F S is obtained through feature modulation ( F S = D C o n v 5 , 7 F T F , C + D C o n v 3 F ). The FSM is designed to amplify high-frequency signals and difficult-to-recover regions. It first applies mean filtering to the SSM output F S to obtain low-frequency features and then extracts high-frequency features F S h through subtraction ( F S h = F S M e a n F S ). The result is outputted through a multiplication of the high-frequency features with the original features and a residual connection ( F ^ = F S h F S + F S ).

4.3. HOOK_IoU Loss Function

Aiming to augment the model’s optimization capability across heterogeneous sample categories, we devise an innovative Intersection-over-Union (IoU) loss formulation, termed HOOK_IoU, specifically designed for the detection of hooks and safety latches. This loss function is optimized with a high degree of efficiency using adaptive weighting and a differential processing strategy. HOOK_IoU analyzes the intersected spatial domain shared by the predicted and reference (ground-truth) bounding geometries, and subsequently modulates the loss weighting in alignment with the intrinsic complexity of detecting the specific target. This methodology enhances the model’s ability to identify challenging targets in complex scenarios, making it particularly suitable for detecting targets with small sizes and blurry boundaries.
Specifically, HOOK_IoU introduces the concept of an auxiliary bounding box, the size of which is adjusted by setting a scale factor (ratio, the default value is 0.7). The boundary coordinates of the auxiliary bounding box for the ground truth box were calculated using Equations (3)–(6):
b g t l = x c g t w g t ratio 2
b g t r = x c g t + w g t ratio 2
b g t t = y c g t h g t ratio 2
b g t b = y c g t + h g t ratio 2
The formulas for calculating the boundary coordinates of the auxiliary bounding box for the predicted box are expressed in Equations (7)–(10).
b l = x c w ratio 2
b r = x c + w ratio 2
b t = y c h ratio 2
b b = y c + h ratio 2
where x c g t and y c g t are the center coordinates of the ground truth box; w g t and h g t represent the width and height of the ground truth box, respectively; x c and y c denote the center coordinates of the predicted box; and w and h represent the width and height of the predicted box, respectively.
The intersection (inter) and union (union) areas of the auxiliary bounding boxes are calculated using Equations (11) and (12), respectively.
inter = min b g t r , b r max b g t l , b l × min b g t b , b b max b g t t , b t
union = w g t h g t ratio 2 + w h ratio 2 inter i n t e r
HOOK_IoU employs a segmented linear transformation approach to enhance the granularity of loss computation. Regarding the IoU metric derived from the intersection of predicted and reference (ground-truth) bounding geometries, mapping was performed using Equation (13). The schematic diagram of HOOK_IoU is shown in Figure 5.
HOOK _ I o U = inter union d union u d
This linear mapping strategy is designed to significantly enhance the gradient weights of samples within the moderate IoU range. Although these samples exhibit suboptimal localization precision, they still possess potential for improvement. By increasing their gradient weights, the model’s focus on challenging samples is strengthened. Conversely, for samples with high IoU values (indicating minor localization deviations), the mapping value is set to 1 to reduce their contribution to the loss. For samples with low IoU values (indicating substantial localization errors), the mapping value is set to 0 to prevent excessive penalization of poorly predicted bounding boxes. By integrating the aforementioned piecewise mapping strategy, the newly defined HOOK_IoU loss function is presented in Equation (14).
HOOK _ I o U =       0 ,                                                           inter union < d inter union d union u d ,                           d i n t e r u n i o n u       1 ,                                                           i n t e r u n i o n > d

5. Results and Discussion

5.1. Quantitative Criteria for Assessing Model Efficacy

To appraise the efficacy of the hooks and safety latches recognition framework, we utilized precision (P), recall (R), mean Average Precision (mAP), parameter magnitude (Params), Floating-point Operations Per Second (FLOPs), together with FPS as quantitative assessment criteria. Specifically, P represents the proportion of actual positive cases to all positive predictions made by the model, reflecting the model’s ability to minimize false positives. R represents the proportion of positive instances in an image correctly predicted by the model, reflecting the model’s capacity to reduce the number of false negatives produced [55]. The mAP is another metric used to express the model’s overall performance, indicating the precision of the objects detected by the model. In addition, mAP reflects the precision of predicted classes as well as the number of correctly predicted classes [56]. The mAP is defined as the arithmetic mean of the average precision (AP) values across all classes in object detection tasks. AP is defined as the mean precision across different recall thresholds in object detection tasks. Params and FLOPs are employed to comprehensively evaluate the model’s complexity; params indicate the model’s size, and FLOPs reflect its computational load. FPS refers to the number of image frames that a model can process and output detection results for per second, and is commonly used as a metric to evaluate the operational speed of the model. P, R, AP, and mAP can be calculated using (15)–(18), respectively.
P = T P T P + F P
R = T P T P + F N
A P = 0 1 P R d R
m A P = 1 n k = 1 k = n A P k
where TP denotes true positives, FP denotes false positives, FN denotes false negatives, and n represents the number of interpolated points on the PR curve.

5.2. Experimental Setup

5.2.1. Experimental Platform and Parameter Settings

Linux was used as the operating system in the experiments. The computer was equipped with an Intel (R) Core (TM) i7-12700KF CPU (Intel Corporation, Santa Clara, CA, USA) and an NVIDIA GeForce RTX 3090 graphics card (NVIDIA Corporation, Santa Clara, CA, USA). A detailed configuration of the hyperparameters used for model training is provided in Table 1.

5.2.2. Dataset Preparation

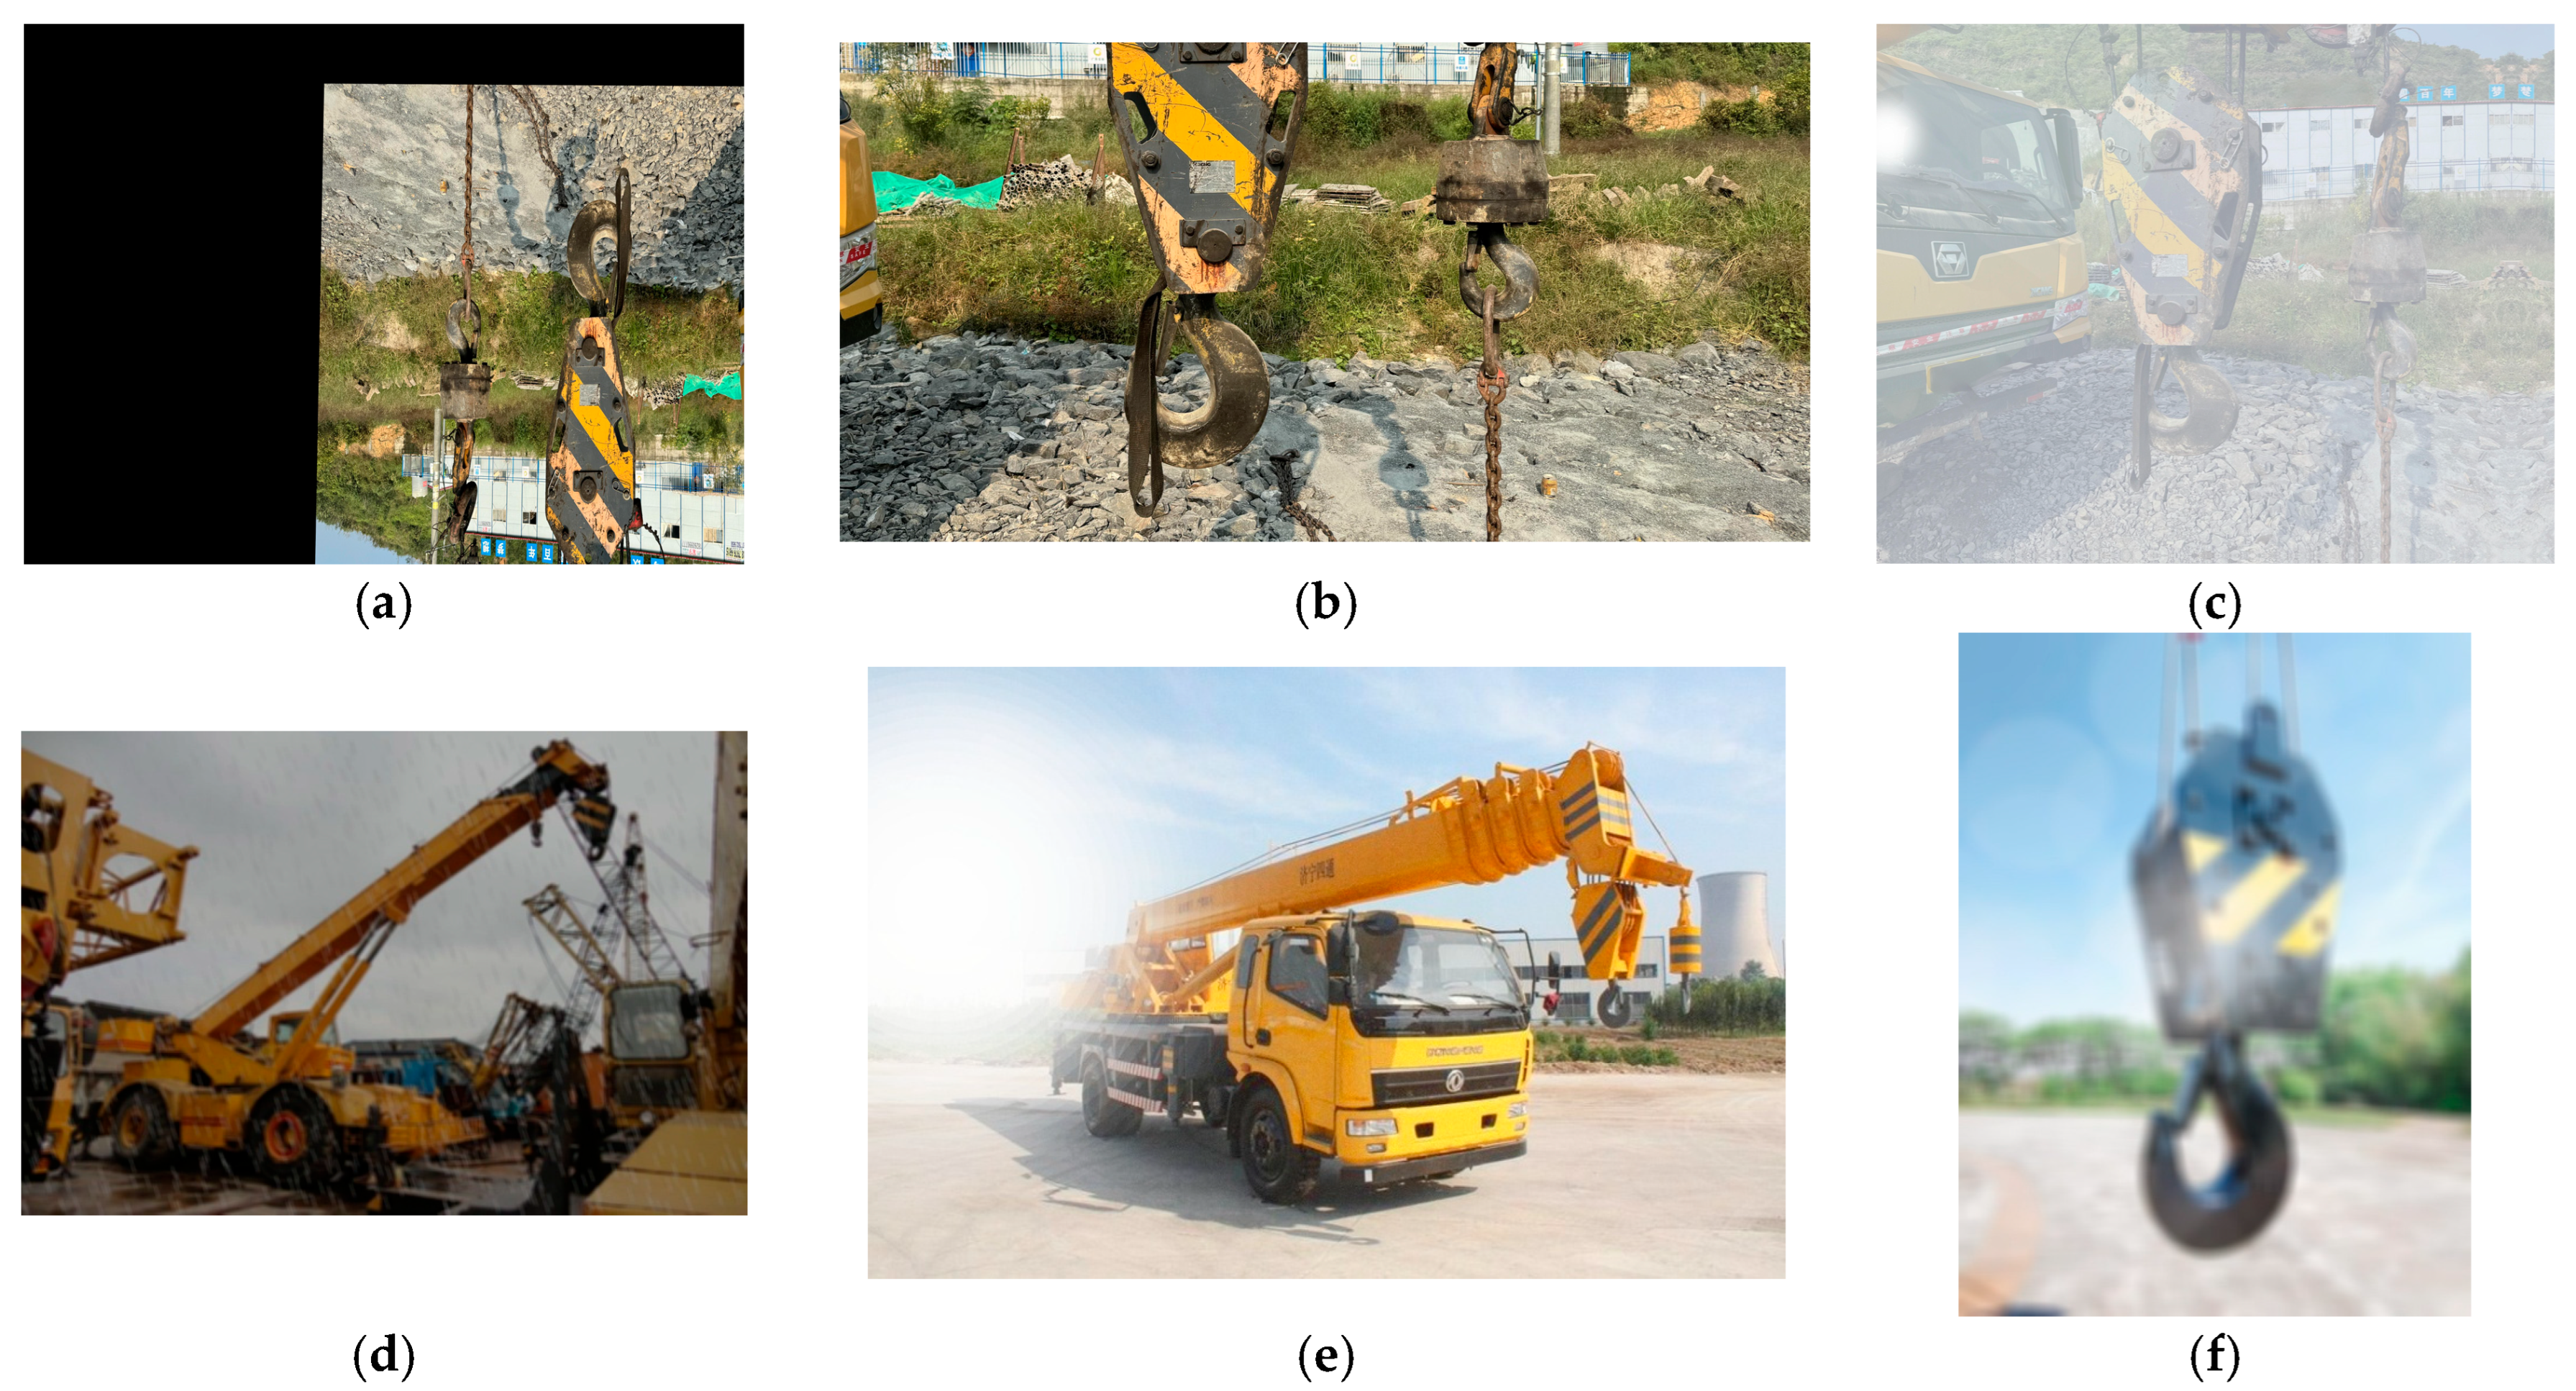
The dataset was compiled using a dual approach involving onsite photography at construction sites and acquisition of publicly available online images. On-site photography involves capturing images of the hooks and safety latches in various states and scenarios using mobile phones. Public online images were collected by systematically searching and downloading relevant images from reputable search engines, such as Baidu and Google. All collected images, regardless of their origin, were stored in JPG format. As the initial dataset consisted of images of varying dimensions, the collected photos were processed using an open-source lossless image processing application for normalization (resizing). Common data-augmentation techniques were applied to enhance data diversity. These techniques included rotation, zoom-in view, and luminance enhancement, which were used to simulate the hooks and safety latches under varying angles and lighting conditions. Different types of images are shown in Figure 6. Lastly, a dataset of hooks and safety latches comprising 2333 original images was constructed. All images were resized to 640 × 640 pixels.
For an exhaustive appraisal of the operational efficacy of the proposed hooks and safety latches identification algorithms, the dataset was stratified into three distinct partitions: a training subset, a validation subset, and a testing subset. The training subset contained 2017 images and was used for the model training process, enabling the algorithm to learn image features and optimize network parameters. The validation set contained 158 images and was used to monitor model performance and adjust hyperparameters during the training process, aiding in preventing overfitting and in selecting the optimal model structure. The test set, comprising 158 images, was used for the final independent evaluation of the model’s generalization ability, ensuring that the evaluation results accurately reflected the model’s performance in real-world applications. All image data were annotated using LabelImg software (v1.8.1) and stored as .txt files.
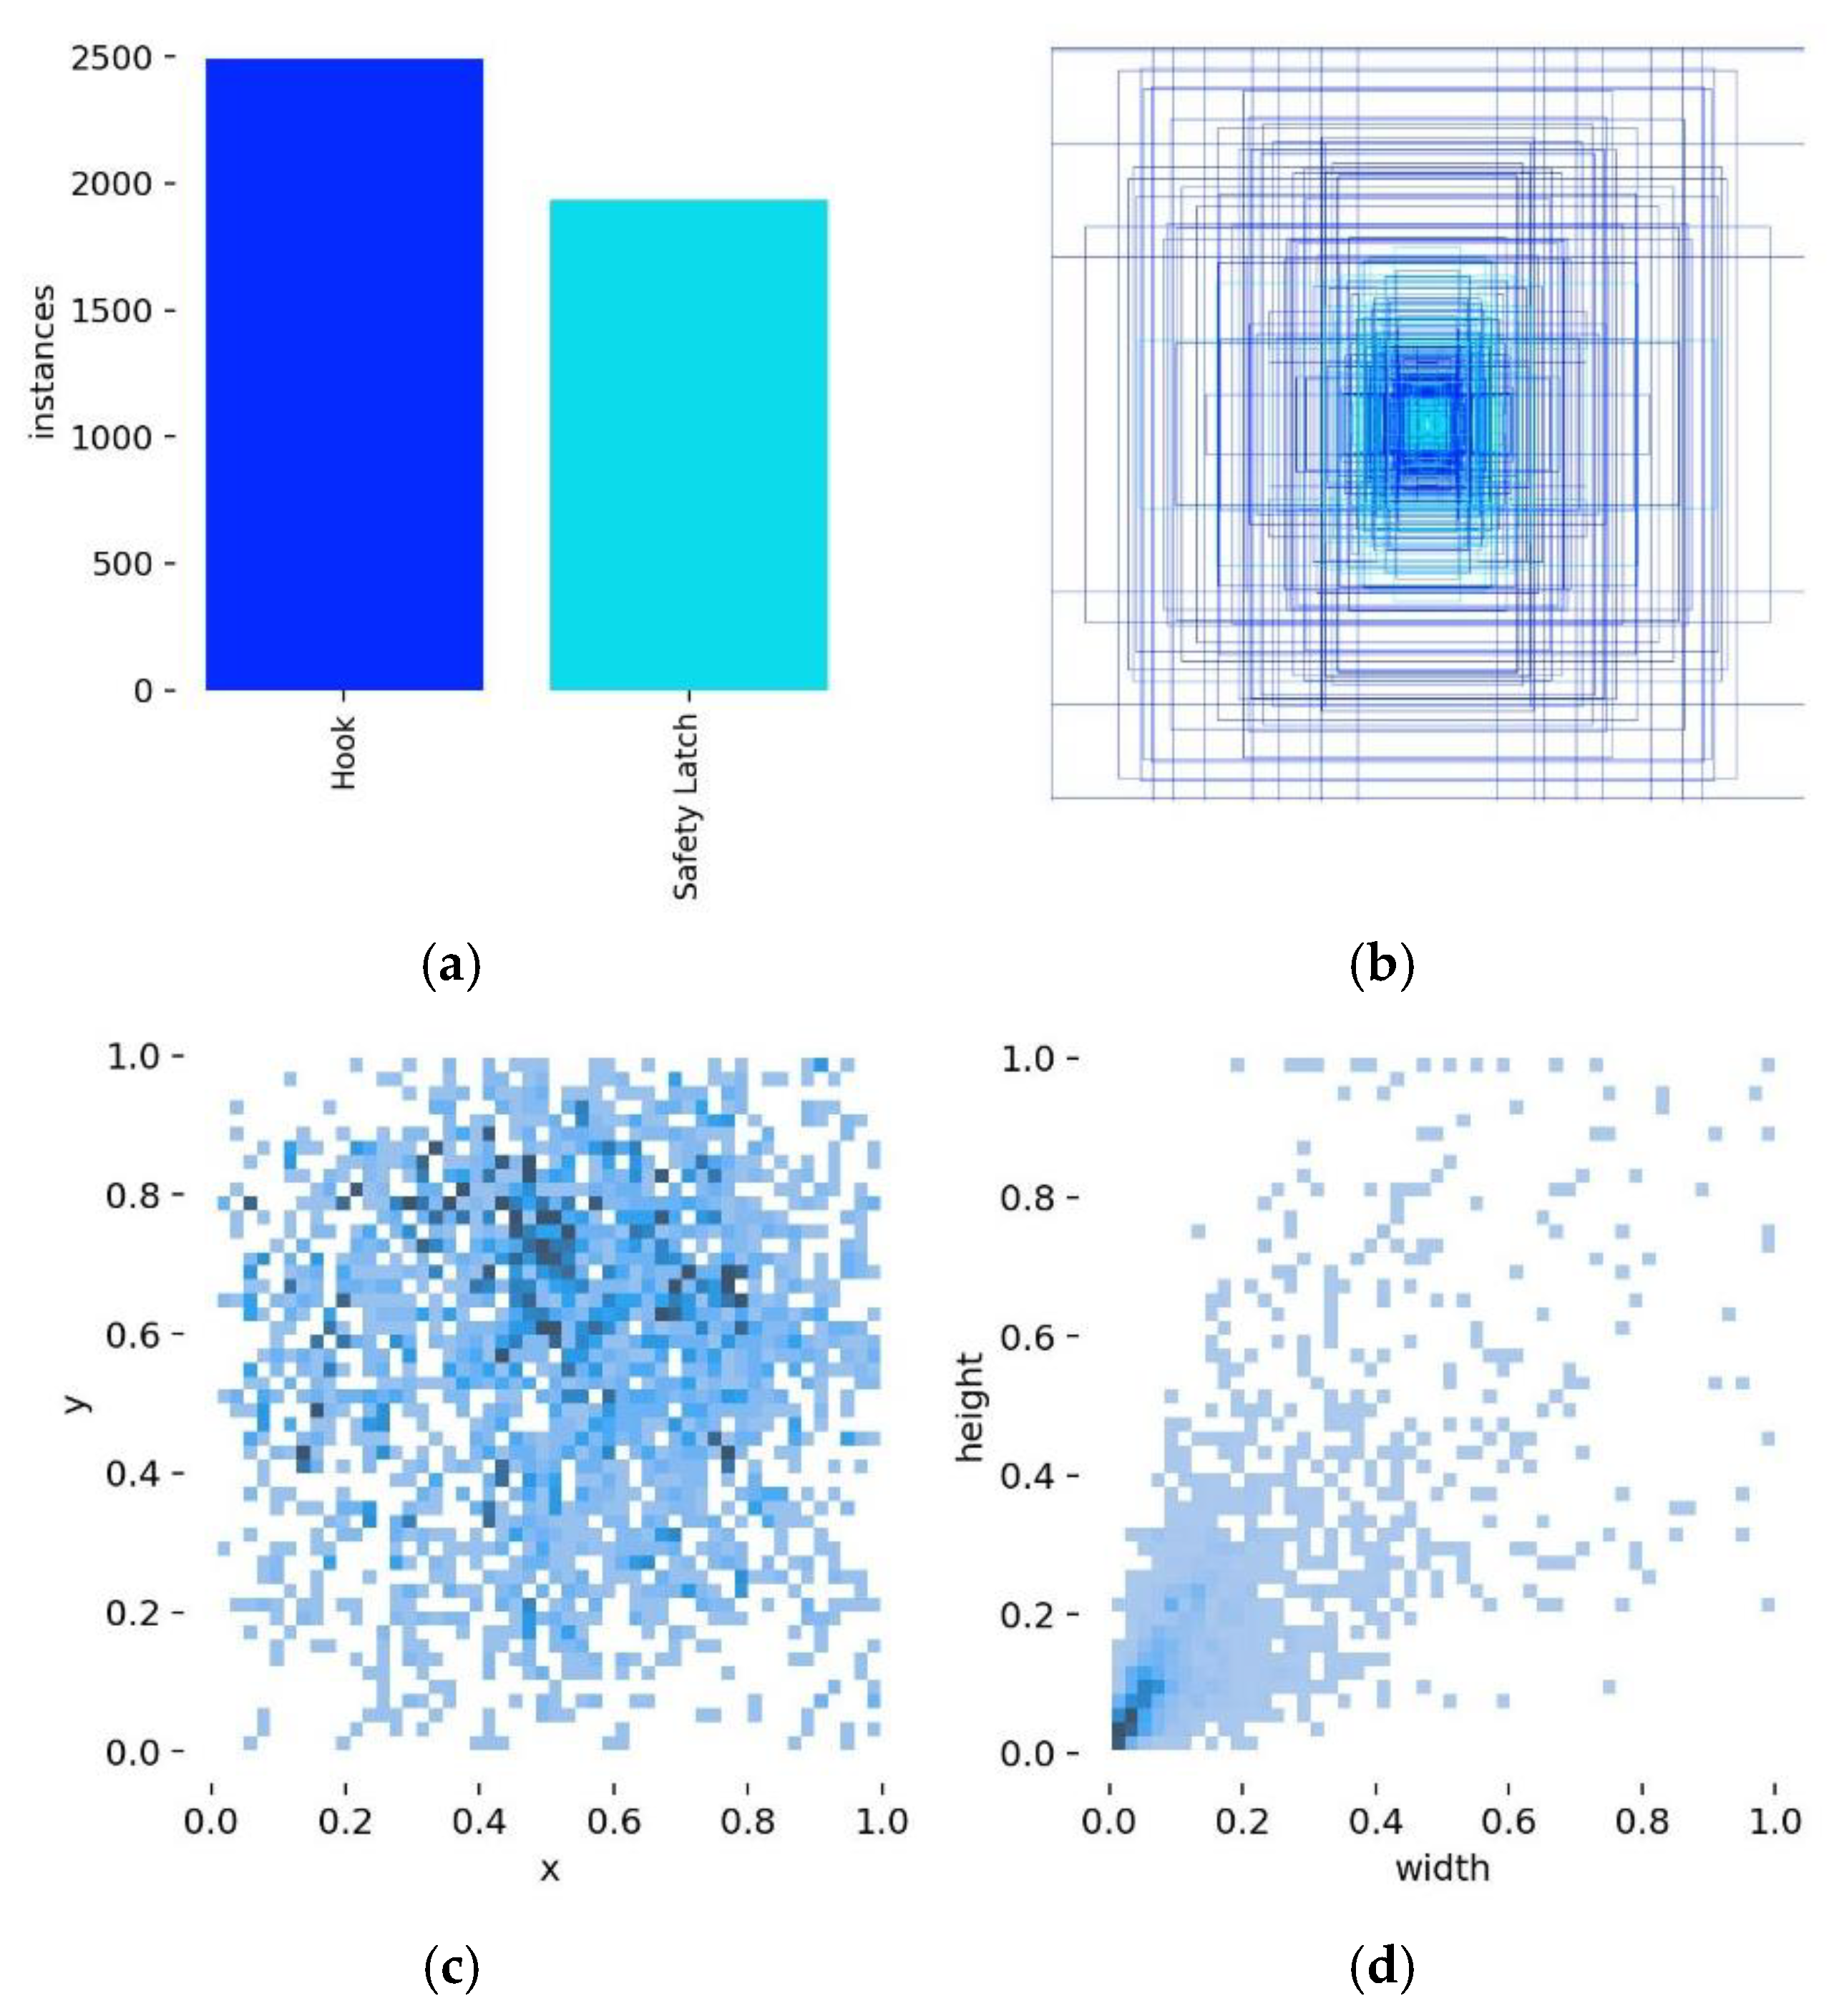
Visualization and statistical analysis of the dataset comprising lifting hooks and safety latches are presented in Figure 7. (a) illustrates the number of instances for the two categories, hooks and safety latches, reflecting their distribution within the dataset; (b) portrays the spatial allocation profile of all annotated bounding geometries; (c) presents the concentration mapping of target centroid positions; and (d) elucidates the proportional interplay between object width and height in the annotations. The results indicate that although the number of hook instances slightly exceeds that of safety latches, the two categories are of comparable magnitude, rendering the class balance acceptable. The distribution of target center points is relatively uniform, and the width-height distribution of the targets shows significant clustering. Additionally, the dataset contains a relatively large number of small targets. These characteristics demonstrate that the dataset is suited for detection tasks involving lifting hooks and safety latches.

5.3. Experimental Comparison Before and After Model Improvement

The performance of the YOLO-HOOK model and YOLOv8s in detecting hooks and safety latches was evaluated through comparative experiments, with the results summarized in Table 2. The results show that YOLO-HOOK achieves improvements of 2.7% in precision, 3.8% in recall, 4.6% in mAP@0.5, and 5.4% in mAP@0.5:0.95 compared to YOLOv8s. In addition, the number of parameters is reduced to 9.6 M, the GFLOPs increase to 31.0, and the inference speed reaches 310 FPS. These findings indicate that YOLO-HOOK significantly enhances detection accuracy and recall while maintaining a high detection speed. Moreover, it achieves a balanced trade-off between lightweight design and performance optimization, making it suitable for deployment on edge devices with limited processing power and storage capacity.
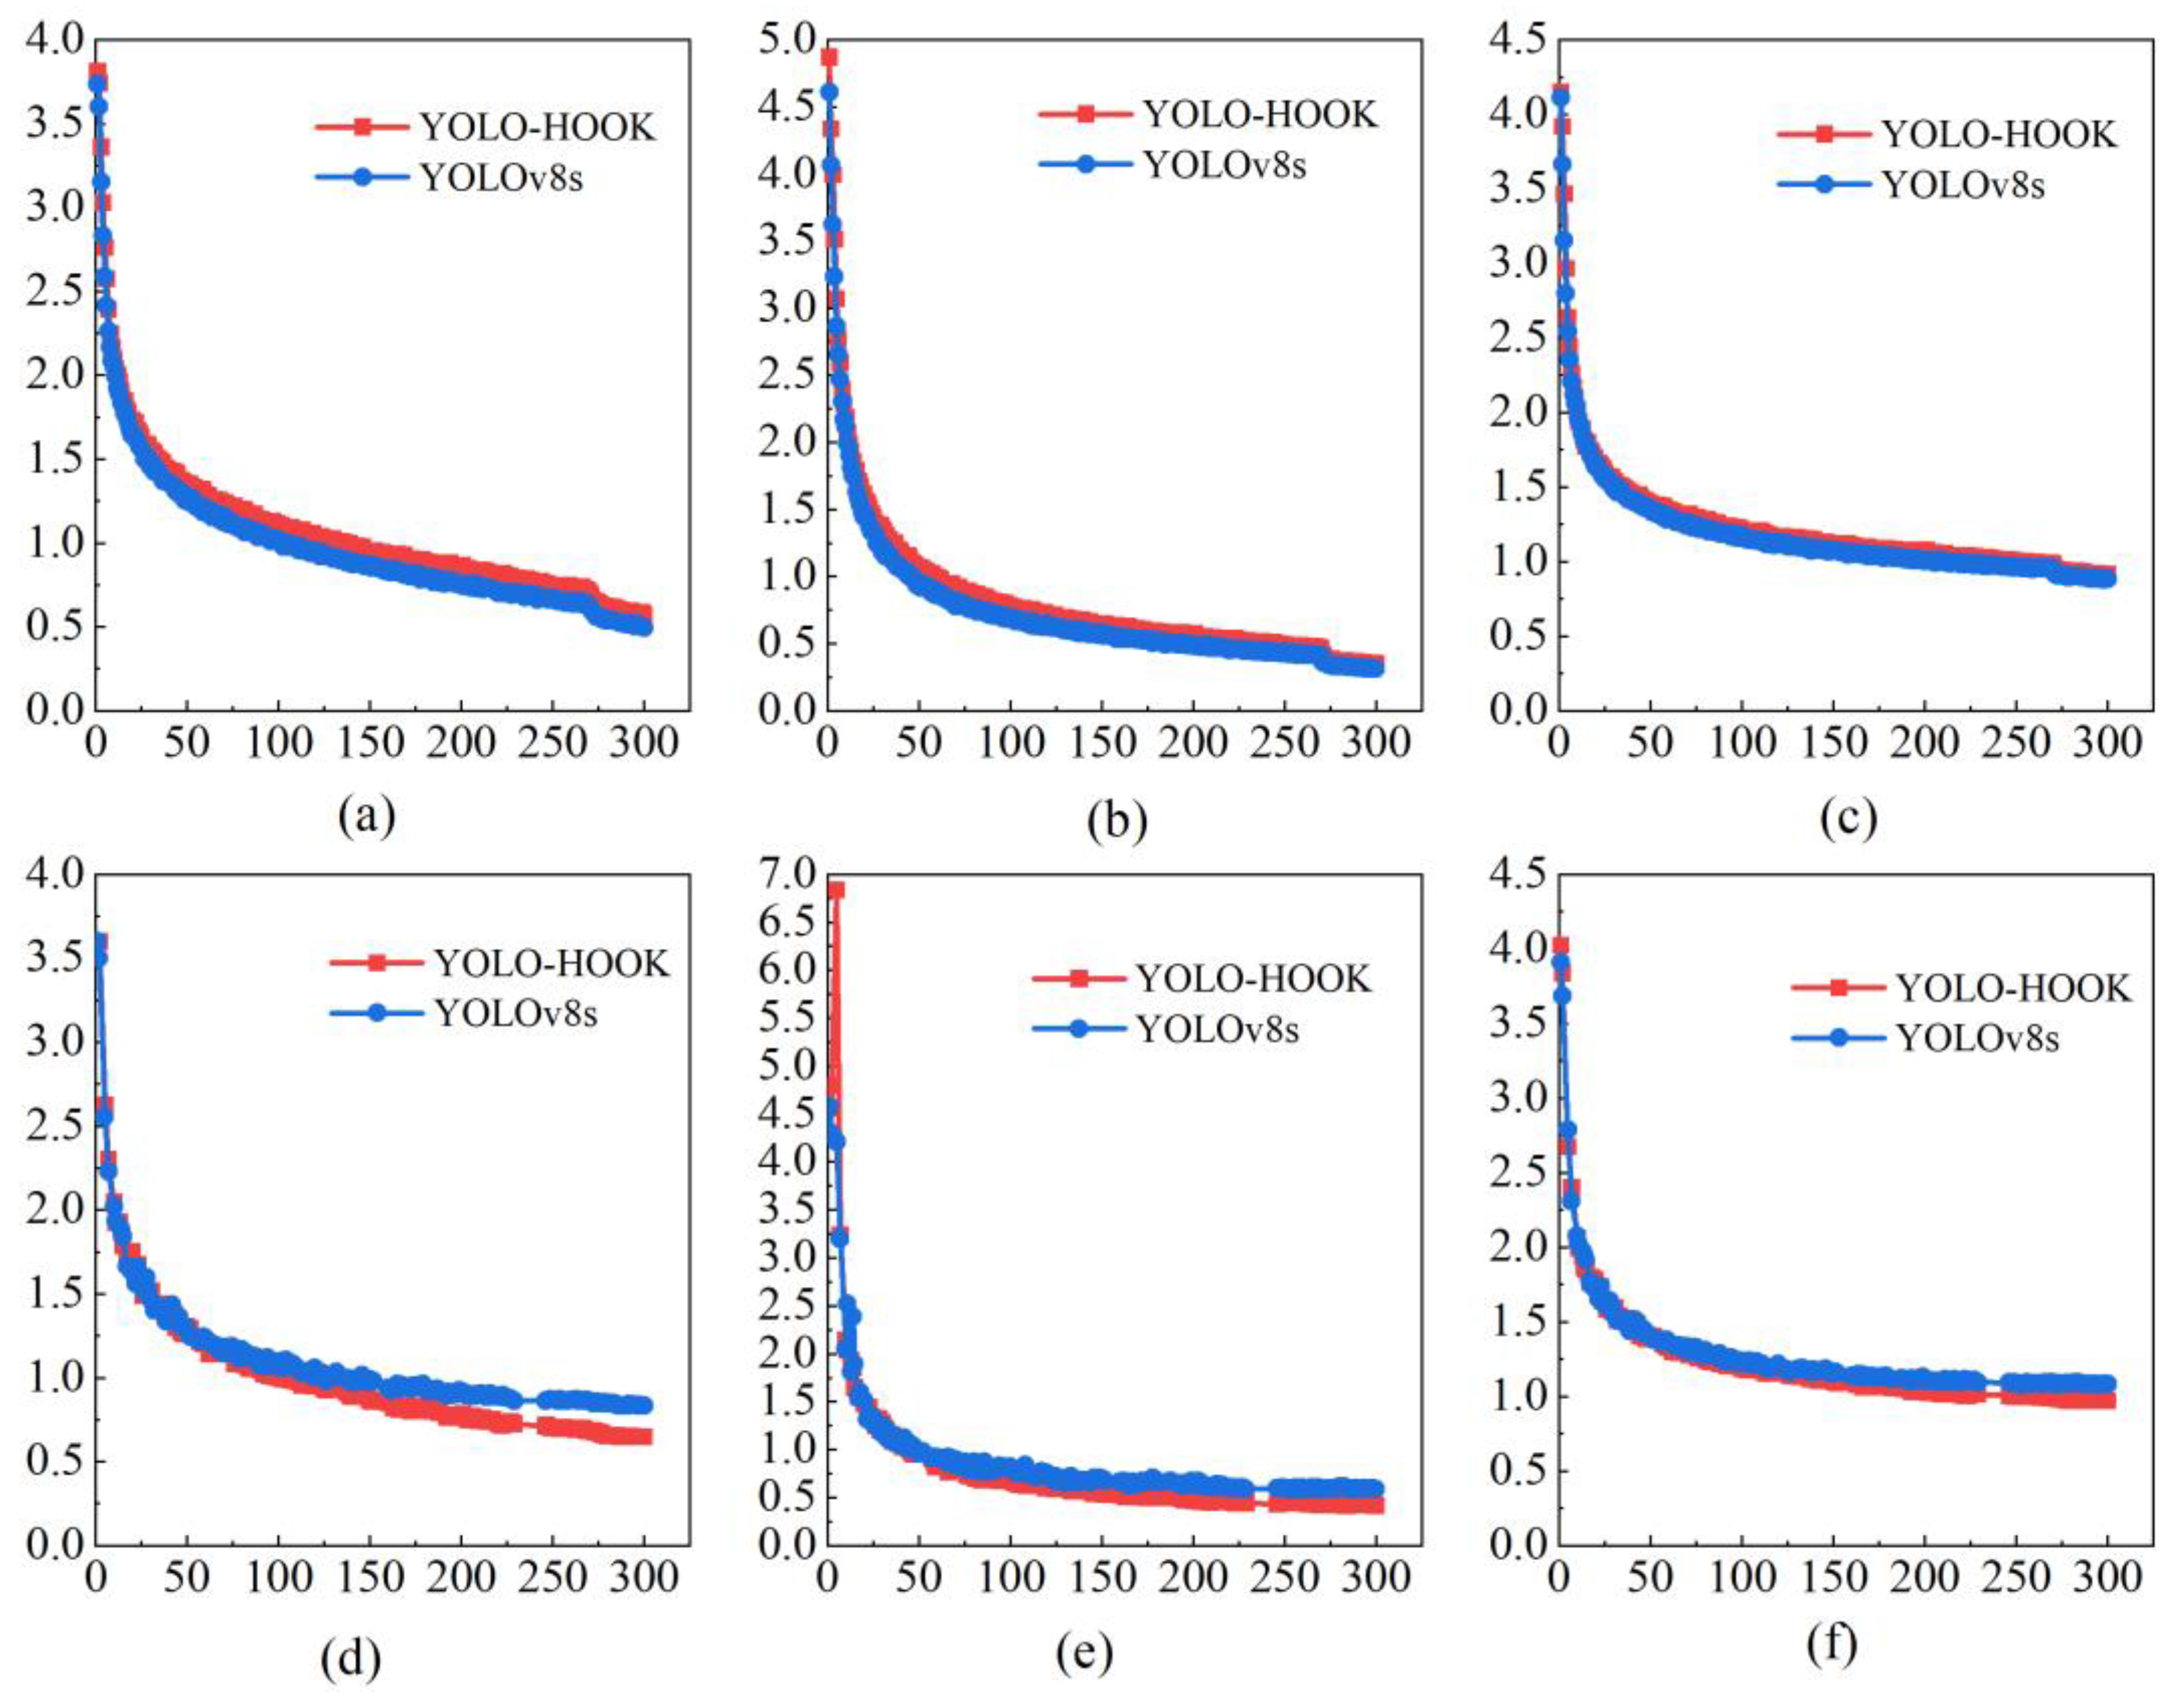
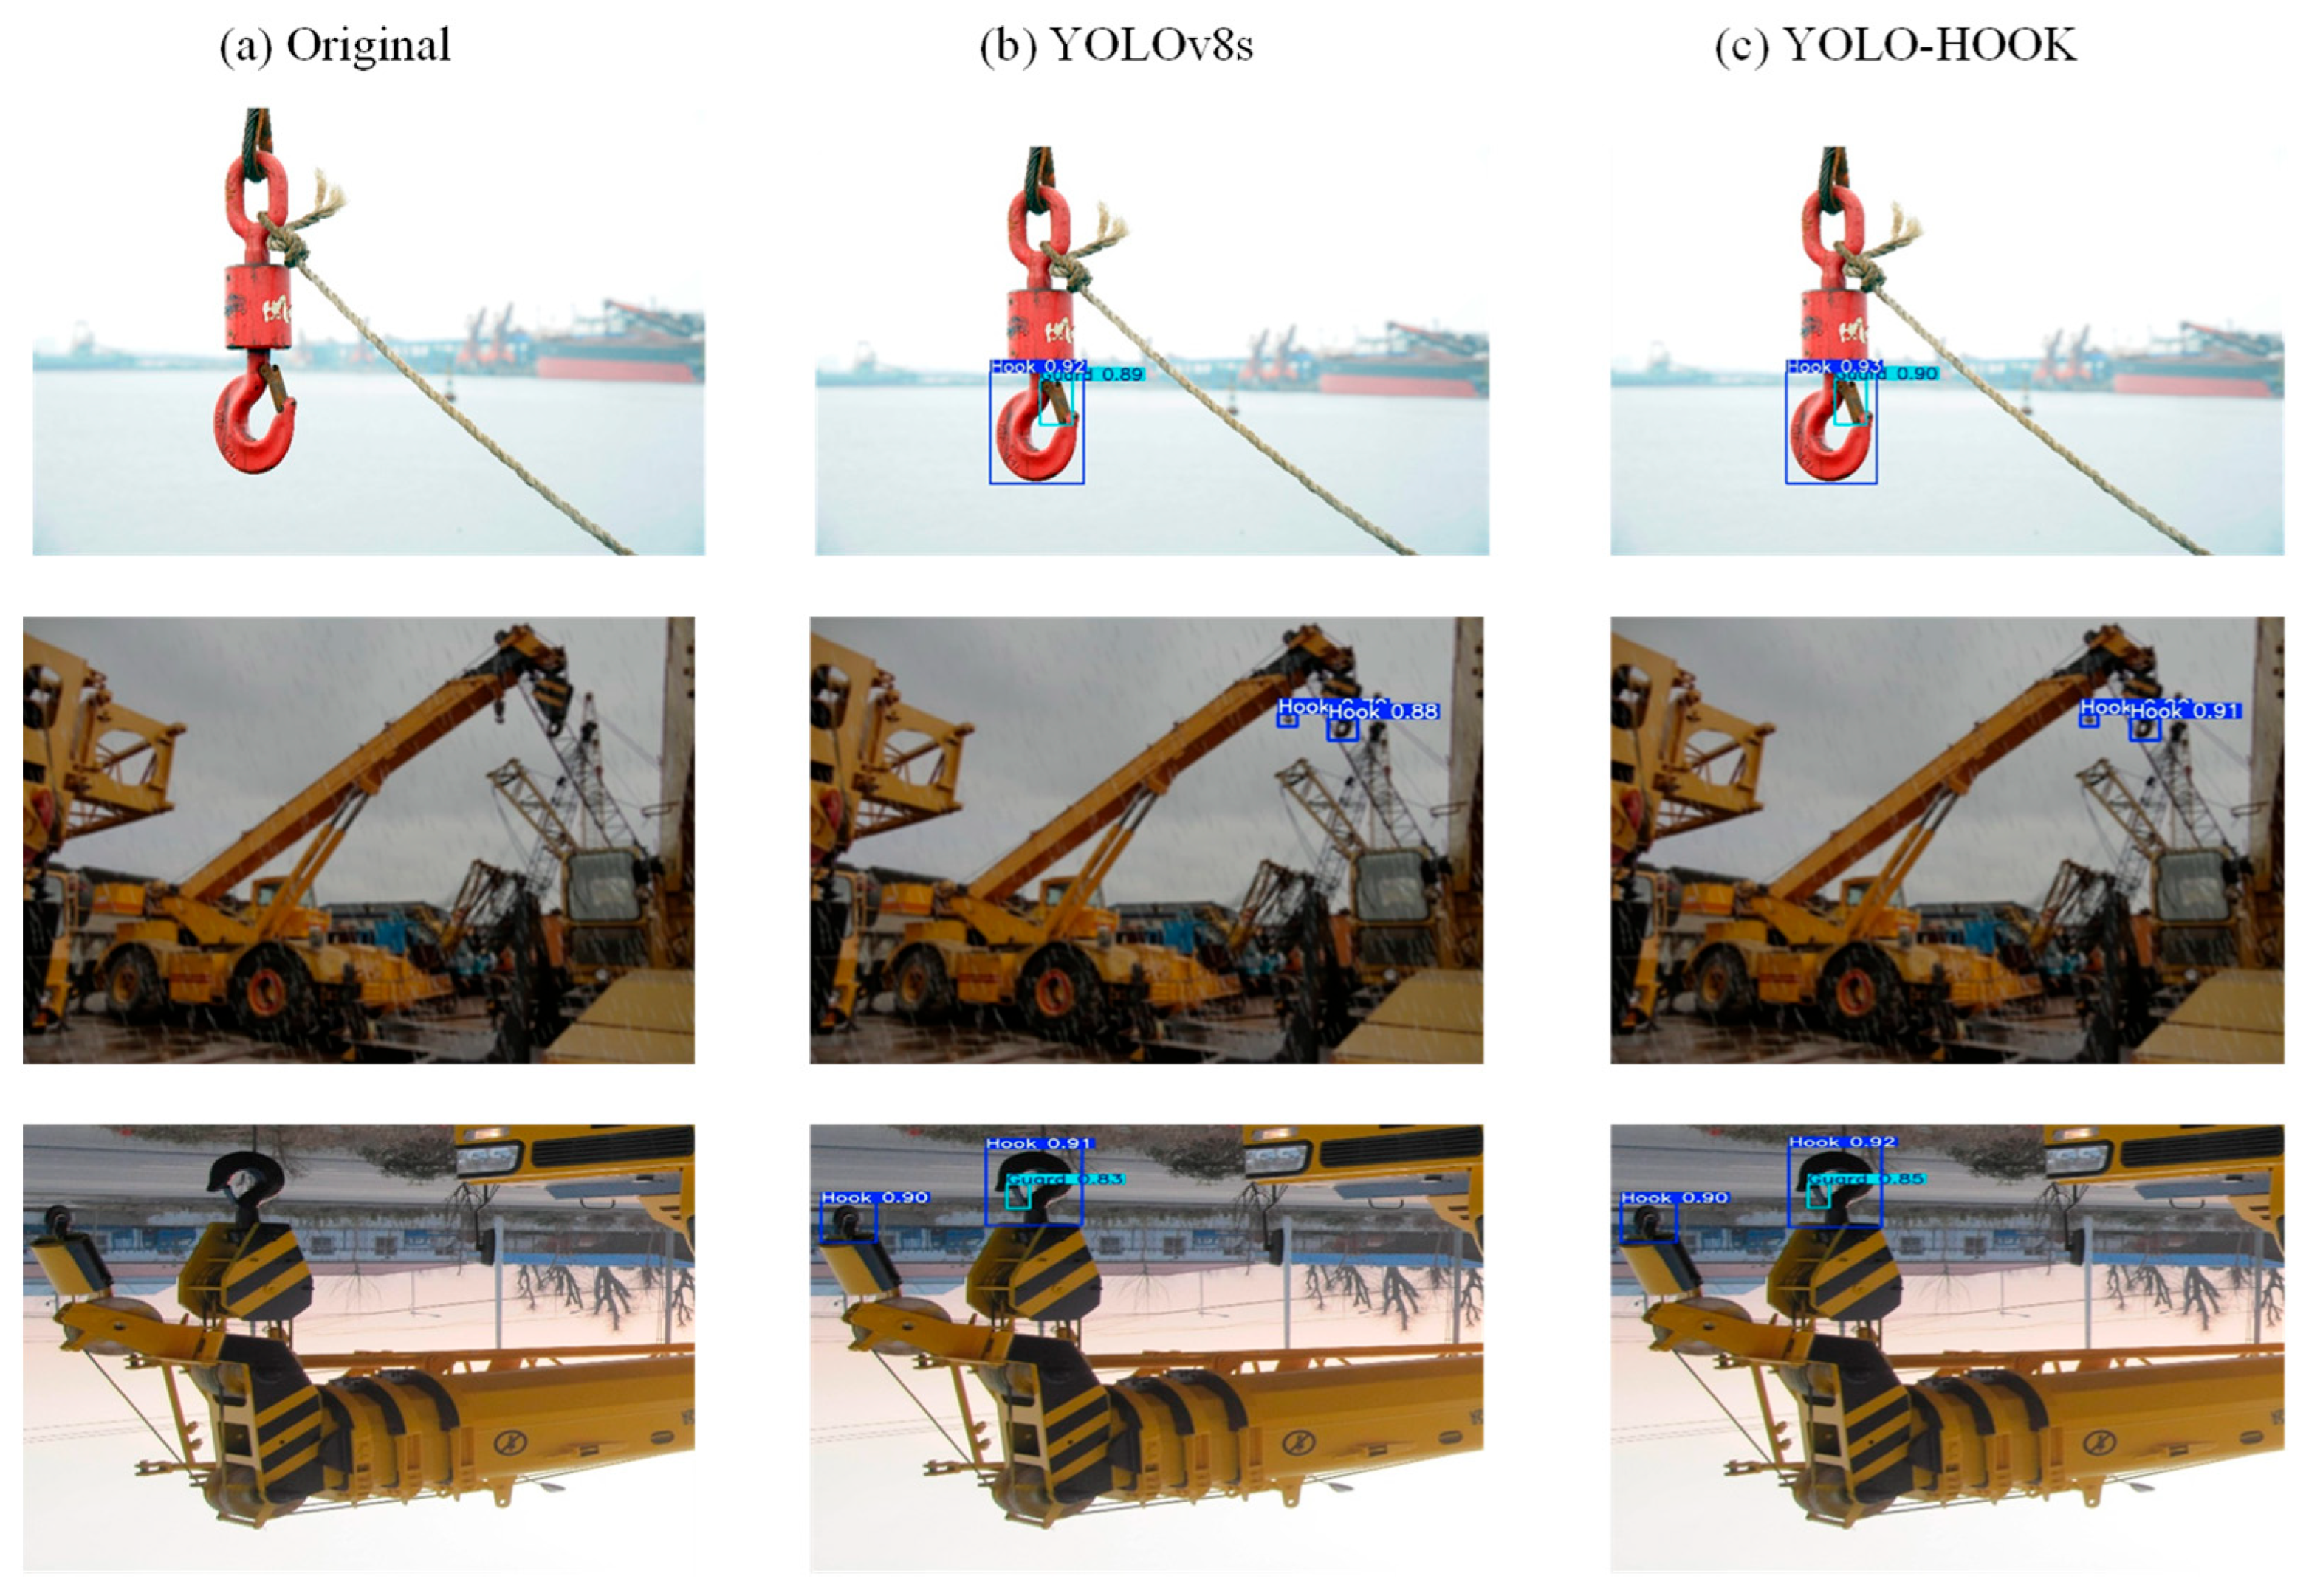
Figure 8 presents the comparative loss curves of YOLOv8s (blue) and YOLO-HOOK (red) across six loss metrics, including training/validation box loss, classification loss, and distribution focal loss (Figure 8a–f). As shown in Figure 8, YOLO-HOOK exhibits a faster decline in loss values during the early training stage (first 50 epochs), indicating a superior convergence rate compared to YOLOv8s, which can be attributed to the improved feature extraction efficiency of the Efficient_Light_C2f module. In the later training stage (200–300 epochs), all three loss types of YOLO-HOOK stabilize at lower levels. Compared with the baseline YOLOv8s, YOLO-HOOK reduces the box loss to 0.64778 (a decrease of 0.18357), the classification loss to 0.41969 (a decrease of 0.16975), and the distribution focal loss to 0.97009 (a reduction of 0.11021). These results indicate that the enhanced multi-scale feature fusion capability of the MSEICSP module, together with the regression optimization introduced by the HOOK_IoU loss function, enables the model predictions to match the ground-truth targets more closely. The detection results of the YOLO-HOOK model are shown in Figure 9 and Figure 10.
The error rate is an evaluation metric reflecting the extent of incorrect predictions made by the model, with higher values indicating poorer performance. A comparative analysis of the error rates before and after model optimization is presented in Table 3. As shown, the baseline model (YOLOv8s) exhibits an ELoc of 4.94%, EDupe of 0.37%, EBkg of 1.36%, and EMiss of 6.48%. After incorporating the proposed improvements, the YOLO-HOOK model demonstrates reductions across all error categories, with ELoc decreasing to 3.36% (a decrease of 1.58%), EDupe to 0.16% (a reduction of 0.21%), EBkg to 0.57% (a decrease of 0.79%), and EMiss to 3.53% (a reduction of 2.95%). These results indicate that the improved model effectively mitigates issues such as inaccurate localization, duplicate detections, background false positives, and missed detections, thereby substantially improving the overall robustness of object detection.
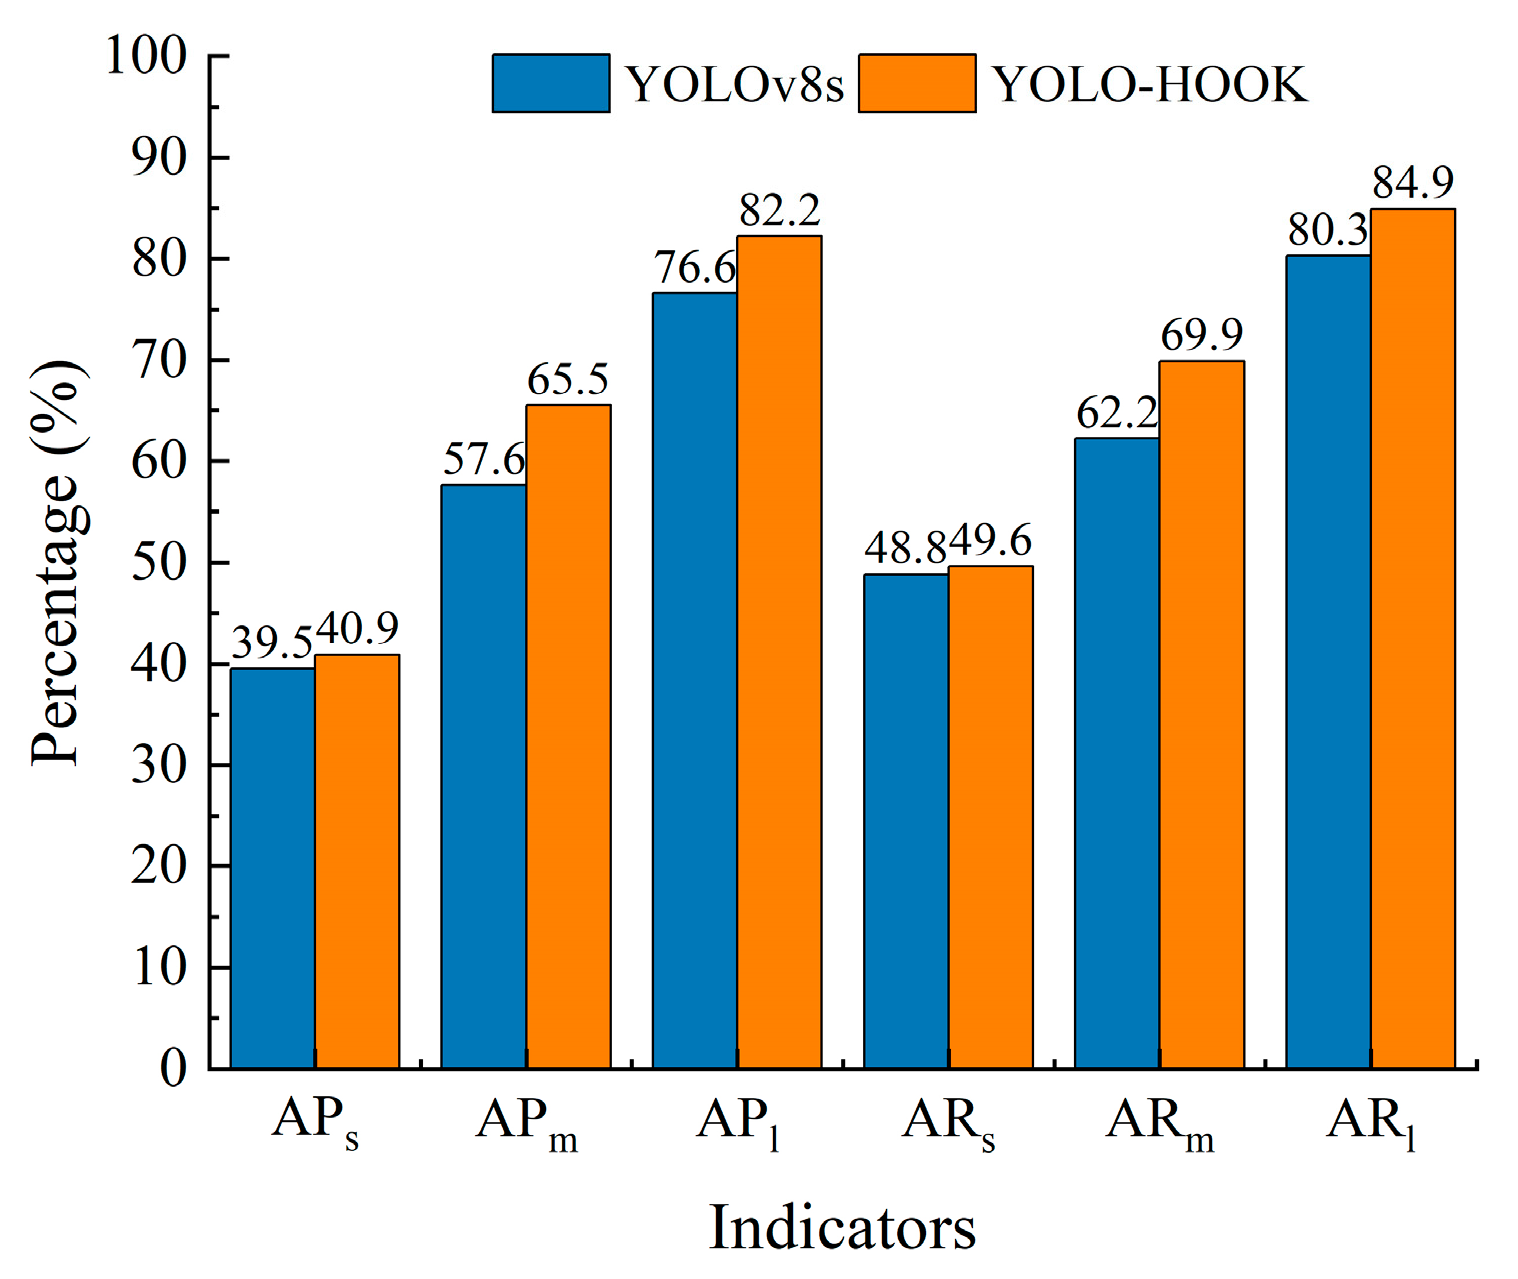
To evaluate the performance of the improved YOLO-HOOK model in multi-scale object detection tasks, a comparative analysis was conducted between the YOLO-HOOK model and the baseline YOLOv8s model in terms of Average Precision (AP) and Average Recall (AR) across different object scales. The experimental results and corresponding comparison plots are presented in Table 4 and Figure 11. As shown in the results, the YOLO-HOOK model consistently outperforms the baseline model across all object scales. For small object detection, AP increased from 39.5% to 40.9%, representing an absolute improvement of 1.4%, while AR rose from 48.8% to 49.6%, yielding a gain of 0.8%. For medium-scale objects, the performance improvement was more pronounced, with AP rising from 57.6% to 65.5% (an increase of 7.9%) and AR improving from 62.2% to 69.9% (a rise of 7.7%). In large object detection, AP improved from 76.6% to 82.2%, up by 5.6%, and AR increased from 80.3% to 84.9%, marking a gain of 4.6%. These results demonstrate that the improved YOLO-HOOK model achieves superior detection performance across different object scales, with the most significant enhancement observed in medium-scale object detection. This indicates that the proposed improvements effectively strengthen the model’s feature extraction and discrimination capabilities for objects of varying sizes, thereby enhancing the overall object detection performance.

5.4. Comparison of Ablation Study Results

To systematically evaluate the impact of the three proposed improvement strategies, Efficient_Light_C2f, MSEICSP, and HOOK_IoU, on the performance of the baseline model YOLOv8s, a series of ablation experiments was conducted, with the quantitative results summarized in Table 5.
It can be observed that the introduction of the Efficient_Light_C2f module alone results in an increase of 3.2% in mAP@0.5 and 3.1% in mAP@0.5:0.95, while reducing the number of parameters by 0.97M and lowering the computational cost by 3.2 GFLOPs. Furthermore, the inference speed improves from 300 FPS to 347 FPS, demonstrating notable gains in both precision and computational efficiency. These improvements are primarily attributed to the lightweight feature extraction structure, which effectively eliminates redundant computations while preserving the representation of critical feature information.
When the MSEICSP module is further integrated into the Efficient_Light_C2f configuration, mAP@0.5 and mAP@0.5:0.95 increase by an additional 0.8% and 1.9%, respectively, accompanied by a 3.7% rise in recall. The inference speed decreases from 347 FPS to 330 FPS. However, precision decreases by 4.1%, which can be attributed to the fact that, while MSEICSP enhances multi-scale feature fusion and improves recall for objects of varying sizes, it may also introduce additional background noise or similar interferences, thereby increasing the false positive rate.
Finally, incorporating the HOOK_IoU loss function into the Efficient_Light_C2f + MSEICSP configuration increases precision to 97.0%, with corresponding gains of 0.6% in mAP@0.5 and 0.4% in mAP@0.5:0.95, while recall reaches 83.4%. Notably, this improvement is achieved without increasing the number of parameters (9.60M) and the computational cost (31.0 GFLOPs). Although the inference speed decreases slightly from 330 FPS to 310 FPS, it remains at a high level, achieving a favorable balance between precision and real-time detection performance.
In summary, the ablation study demonstrates that the proposed enhancements for YOLOv8s deliver substantial gains in precision, recall, and inference speed, making it well-suited for hooks and safety latches identification scenarios requiring rigorous temporal responsiveness alongside elevated accuracy in target recognition.

5.5. Performance Comparison of Different Loss Functions

To comprehensively assess the effectiveness and superiority of the proposed HOOK_IoU loss function in object detection, we conducted comparative experiments by integrating several bounding box regression loss functions into the baseline YOLOv8s model. The evaluated loss functions include EIoU [57], Wise-IoU [58], and SIoU [59]. The quantitative results are summarized in Table 6.
As shown in Table 6, the HOOK_IoU loss demonstrates consistent advantages over the other regression losses across multiple evaluation metrics. In terms of detection precision, HOOK_IoU achieves an mAP@0.5 of 86.4%, which is 0.6 percentage points higher than the baseline YOLOv8s and outperforms EIoU (85.7%), Wise-IoU (86.2%), and SIoU (85.1%). More notably, for the more stringent mAP@0.5:0.95, HOOK_IoU attains 67.9%, surpassing EIoU (62.4%), Wise-IoU (63.9%), and SIoU (62.9%) by 5.5, 4.0, and 5.0 percentage points, respectively. This indicates that HOOK_IoU offers superior generalization ability and robustness under high IoU thresholds. From the perspective of recall, HOOK_IoU achieves the highest recall rate of 80.3%, improving upon the baseline YOLOv8s (79.6%), EIoU (79.2%), Wise-IoU (78.0%), and SIoU (77.6%), thereby reducing missed detections while maintaining accurate localization. In precision, HOOK_IoU reaches 94.9%, ranking second only to Wise-IoU (96.5%).
In summary, without increasing model parameters (11.13M) or computational cost (28.4GFLOPs), the proposed HOOK_IoU loss function substantially enhances detection performance, with the most significant gains observed at high IoU thresholds. These results demonstrate that HOOK_IoU loss function delivers stronger localization robustness and regression stability.

5.6. Comparison of Different Object Detection Models

The proposed YOLO-HOOK model was benchmarked against several representative state-of-the-art object detectors, including Faster R-CNN, Dynamic R-CNN [60], YOLOv5s, YOLOv6s [61], YOLOv8s, YOLOv9s, YOLOv10s, YOLOv11s, RT-DETR [62], and RF-DETR [63], and evaluated on the same dataset. The comparative results are presented in Table 7. Experimental findings demonstrate that YOLO-HOOK achieved a precision of 97.0% and a recall of 83.4%, representing an improvement of 0.5% over the highest precision recorded by RF-DETR (96.5%), and an increase of 3.8% over the highest recall achieved by YOLOv8s (79.6%). In terms of mAP, the model attained 90.4% for mAP@0.5 and 71.6% for mAP@0.5:0.95, both surpassing other models. These results substantiate the model’s robustness and generalization capability in both multi-scale and high-precision detection tasks.
With respect to computational complexity, YOLO-HOOK exhibits an increase of approximately 2.43M parameters and 9.7GFLOPs compared with YOLOv9s and YOLOv11s. Regarding inference speed, the model operates at 310 FPS, which is slightly lower than YOLOv5s (350 FPS). Nonetheless, YOLO-HOOK achieves an excellent balance between precision and speed, making it well-suited for scenarios requiring both real-time performance and high detection precision.
In summary, YOLO-HOOK consistently outperforms mainstream detectors across key performance metrics, including precision, recall, and mAP, thereby validating its stability and robustness in high-reliability detection tasks for hooks and safety latches.

5.7. Comparison of the Effectiveness and Generalizability of the Improved Module

To verify the effectiveness and generalizability of the proposed improvement module across different object detection frameworks, the module was integrated into YOLOv5s, YOLOv6s, YOLOv9s, YOLOv10s, YOLOv11s, and RT-DETR models, and comparative analyses were conducted against their respective baseline models. The results are summarized in Table 8. Experimental results demonstrate that the proposed module consistently yields performance gains across different detection frameworks, achieving simultaneous optimization in detection precision and computational efficiency.
In CNN-based backbone architectures, the improvement module delivered substantial performance enhancements. Specifically, YOLOv5s-HOOK achieved improvements of 3.0% in mAP@0.5 and 4.5% in mAP@0.5:0.95 compared to the baseline, while reducing the number of parameters and computational complexity by 16.7% and 16.0%, respectively. YOLOv6s-HOOK exhibited 2.1% and 4.0% increases in mAP@0.5 and mAP@0.5:0.95, respectively, accompanied by significant reductions of 57.1% in parameters and 58.2% in computational cost. YOLOv9s-HOOK achieved a 4.2% improvement in mAP@0.5 and a 6.4% improvement in mAP@0.5:0.95, along with 37.5% and 27.3% reductions in model parameters and computational load. Although YOLOv10s-HOOK showed a slight decrease in precision, it yielded a 4.7% gain in mAP@0.5 and achieved reductions of 12.2% in parameters and 35.5% in computation, demonstrating a synergistic advancement in model lightweighting and performance optimization. YOLOv11s-HOOK achieved considerable improvements in precision (96.6%) and recall (81.2%), with a 6.2% increase in mAP@0.5 and a 6.8% increase in mAP@0.5:0.95. Despite increases of 6.8% in parameters and 30.5% in computational complexity, it remains advantageous for high-precision applications.
For the Transformer-based RT-DETR model, the proposed module also exhibited high adaptability and general applicability. RT-DETR-HOOK improved recall by 8.4% and mAP@0.5 by 4.4%, while reducing parameters and computational cost by 49.6% and 60.8%, respectively, thereby significantly enhancing inference efficiency and computational resource utilization.
Overall, the comprehensive experimental analysis demonstrates that the proposed improvement module exhibits strong transferability and robustness across diverse detection architectures. It effectively strengthens feature representation capability, improves the balance between precision and recall, and achieves the dual objectives of enhancing detection precision while reducing model complexity in multiple detection frameworks.

5.8. Limitations of the Methodology Used in the Current Study

In this study, although we investigated the ability of our model to detect hooks and their safety latches, certain limitations remain. First, regarding the dataset, although diversity was enhanced through multisource acquisition and data augmentation, its scale and complexity were still inadequate. This limitation may restrict the structural generalization capability of the model. Furthermore, the data augmentation strategies failed to adequately simulate extreme working conditions, such as complex occlusions and blurred boundaries, which could affect the robustness of the model in real-world scenarios. Second, regarding model performance, although YOLO-HOOK enhances the detection precision of objects across different scale features, there remains room for further improvement in its capability to extract small-scale features, as indicated by absolute performance metrics.

6. Conclusions

The proposed YOLOv8s-based detection algorithm for hooks and safety latches demonstrated significant improvements in detection precision and multi-scale adaptability compared to other detection and baseline models. The mAP@0.5 metric reached 90.4%, representing an increase of 4.6% compared with the baseline model YOLOv8s, and the mAP@0.5:0.95 metric improved to 71.6%, representing an increase of 5.4%, while maintaining an inference speed of 310 FPS. For object detection across different scales, average precision improved by 1.4%, 7.9%, and 5.6% for small, medium, and large objects, respectively, while average recall increased by 0.8%, 7.7%, and 4.6%. The most substantial gains were observed for medium-scale objects. This performance improvement can be primarily attributed to the following factors: Firstly, an Efficient_Light_C2f module was introduced into the backbone network, enhancing the model’s lightweight characteristics while maintaining precision. Second, the MSEICSP module is adopted in the neck network. This module strengthens the integration of multi-scale contextual information and edge details, thereby improving detection robustness for objects at different distances. Third, the HOOK_IoU loss function, which employs auxiliary bounding boxes and a piecewise linear mapping strategy, dynamically optimizes the loss weights for difficult-to-detect objects, thereby significantly improving bounding box regression precision.
Although these improvements enhance the precision of the algorithm, they also increase the computational cost. This is evident in the GFLOPs of the improved model, which increased by 2.6 compared to those of the baseline model, primarily because of the additional computational burden associated with multi-scale feature fusion in the neck network. In future studies, we aim to improve the generalization ability of the model further, enhancing its detection capability under severe occlusion and extreme motion blur while maintaining a lightweight architecture. Furthermore, we aim to apply these findings to the determination of the safe state of lifting hooks and safety latches, thereby enhancing the safety of lifting machinery during operation.

Author Contributions

Conceptualization, Y.G., D.X., X.R. and R.L.; methodology, Y.G., D.X., X.R. and R.L.; software, Y.G.; validation, Y.G., X.R., R.L. and Y.W.; formal analysis, Y.G., R.L. and Y.W.; data curation, Y.G. and R.L.; writing—original draft preparation, Y.G.; writing—review and editing, D.X., X.R., R.L. and Y.W.; visualization, Y.G., R.L. and Y.W.; supervision, D.X. and X.R. All authors have read and agreed to the published version of the manuscript.

Funding

This research received no funding.

Institutional Review Board Statement

Not applicable.

Informed Consent Statement

Not applicable.

Data Availability Statement

The data presented in this study are available on request from the corresponding author.

Conflicts of Interest

The authors declare no conflicts of interest.

References

  1. Dipu, M.N.H.; Apu, M.H.; Chowdhury, P.P. Identification of the effective crane hook’s cross-section by incorporating finite element method and programming language. Heliyon 2024, 10, e29918. [Google Scholar] [CrossRef] [PubMed]
  2. Muddassir, M.; Zayed, T.; Ali, A.H.; Elrifaee, M.; Abdulai, S.F.; Yang, T.; Eldemiry, A. Automation in tower cranes over the past two decades (2003–2024). Autom. Constr. 2025, 170, 105889. [Google Scholar] [CrossRef]
  3. Kishore, K.; Sanjay Gujre, V.; Choudhary, S.; Sanjay Gujre, A.; Vishwakarma, M.; Thirumurgan, T.; Choudhury, M.; Adhikary, M.; Kumar, A. Failure analysis of a 24 T crane hook using multi-disciplinary approach. Eng. Fail. Anal. 2020, 115, 104666. [Google Scholar] [CrossRef]
  4. Sadeghi, S.; Soltanmohammadlou, N.; Rahnamayiezekavat, P. A systematic review of scholarly works addressing crane safety requirements. Saf. Sci. 2021, 133, 105002. [Google Scholar] [CrossRef]
  5. Wang, X.; Jin, X.; Lin, X.; Luo, Z.; Guo, H.; Lan, R. Spatial collision monitoring of cranes and workers in steel structure construction scenarios. J. Tsinghua Univ. 2025, 65, 45–52. [Google Scholar] [CrossRef]
  6. Simutenda, P.; Zambwe, M.; Mutemwa, R. Types of occupational accidents and their predictors at construction sites in Lusaka city. medRxiv 2022. [Google Scholar] [CrossRef]
  7. Shepherd, G.W.; Kahler, R.J.; Cross, J. Crane fatalities-a taxonomic analysis. Saf. Sci. 2000, 36, 83–93. [Google Scholar] [CrossRef]
  8. Zhang, W.; Xue, N.N.; Zhang, J.R.; Zhang, X. Identification of Critical Causal Factors and Paths of Tower-Crane Accidents in China through System Thinking and Complex Networks. J. Constr. Eng. Manag. 2021, 147, 04021174. [Google Scholar] [CrossRef]
  9. Zhang, X.; Zhang, W.; Jiang, L.; Zhao, T.S. Identification of Critical Causes of Tower-Crane Accidents through System Thinking and Case Analysis. J. Constr. Eng. Manag. 2020, 146, 04020071. [Google Scholar] [CrossRef]
  10. Xie, X.; Chang, Z.; Lan, Z.; Chen, M.; Zhang, X. Improved YOLOv7 Electric Work Safety Belt Hook Suspension State Recognition Algorithm Based on Decoupled Head. Electronics 2024, 13, 4017. [Google Scholar] [CrossRef]
  11. Zhang, J.T.; Ruan, X.; Si, H.; Wang, X.Y. Dynamic hazard analysis on construction sites using knowledge graphs integrated with real-time information. Autom. Constr. 2025, 170, 105938. [Google Scholar] [CrossRef]
  12. Wu, Y.; Zhao, P.; Liu, X. Hoisting position recognition based on BP neural network. Coal Eng. 2020, 52, 121–125. [Google Scholar]
  13. Fu, L.; Wu, S.; Fan, Q.; Huang, Z.; Yang, T. Hook Recognition and Detection Method Based on Visual Image Multi-Feature Constraints. Constr. Mach. Technol. Manag. 2022, 35, 32–35. [Google Scholar] [CrossRef]
  14. Liang, G.; Ll, X.; Rao, Y.; Yang, L.; Shang, B. A Transformer Guides YOLOv5 to ldentify lllegal Operation of High-altitude Hooks. Electr. Eng. 2023, 1–4. [Google Scholar] [CrossRef]
  15. Li, H.; Xue, X.; Wu, L.; Wang, Y.; Zhong, X. Protective equipment and hook testing methods for workers in lifting operations under deep learning. J. Saf. Environ. 2024, 24, 1027–1035. [Google Scholar] [CrossRef]
  16. Zhang, Y.; Liu, Y.; Zhao, P.; Zhang, K.; Wu, Y. Real-time monitoring method for loads and hooks in lifting operations using machine vision. J. Saf. Environ. 2025, 25, 508–517. [Google Scholar] [CrossRef]
  17. Sun, X.; Lu, X.; Wang, Y.; He, T.; Tian, Z. Development and Application of Small Object Visual Recognition Algorithm in Assisting Safety Management of Tower Cranes. Buildings 2024, 14, 3728. [Google Scholar] [CrossRef]
  18. Chen, M.J.; Lan, Z.X.; Duan, Z.X.; Yi, S.H.; Su, Q. HDS-YOLOv5: An improved safety harness hook detection algorithm based on YOLOv5s. Math. Biosci. Eng. 2023, 20, 15476–15495. [Google Scholar] [CrossRef]
  19. Viola, P.; Jones, M. Rapid object detection using a boosted cascade of simple features. In Proceedings of the Conference on Computer Vision and Pattern Recognition, Kauai, HI, USA, 8–14 December 2001; IEEE Computer Society: Los Alamitos, CA, USA, 2001; pp. 511–518. [Google Scholar]
  20. Dalal, N.; Triggs, B. Histograms of oriented gradients for human detection. In Proceedings of the Conference on Computer Vision and Pattern Recognition, San Diego, CA, USA, 20–25 June 2005; IEEE Computer Society: Los Alamitos, CA, USA, 2005; pp. 886–893. [Google Scholar]
  21. Felzenszwalb, P.; McAllester, D.; Ramanan, D. A discriminatively trained, multiscale, deformable part model. In Proceedings of the IEEE Conference on Computer Vision and Pattern Recognition, Anchorage, AK, USA, 23–28 June 2008; IEEE: New York, NY, USA, 2008. [Google Scholar]
  22. Krizhevsky, A.; Sutskever, I.; Hinton, G.E. ImageNet Classification with Deep Convolutional Neural Networks. Commun. ACM 2017, 60, 84–90. [Google Scholar] [CrossRef]
  23. Simonyan, K.; Zisserman, A. Very Deep Convolutional Networks for Large-Scale Image Recognition. arXiv 2014. [Google Scholar] [CrossRef]
  24. Girshick, R.; Donahue, J.; Darrell, T.; Malik, J. Rich Feature Hierarchies for Accurate Object Detection and Semantic Segmentation. In Proceedings of the IEEE Conference on Computer Vision and Pattern Recognition, Columbus, OH, USA, 23–28 June 2014; pp. 580–587. [Google Scholar]
  25. Everingham, M.; Van Gool, L.; Williams, C.K.I.; Winn, J.; Zisserman, A. The Pascal Visual Object Classes (VOC) Challenge. Int. J. Comput. Vis. 2010, 88, 303–338. [Google Scholar] [CrossRef]
  26. He, K.; Zhang, X.; Ren, S.; Sun, J. Deep Residual Learning for Image Recognition. In Proceedings of the IEEE Conference on Computer Vision and Pattern Recognition, Las Vegas, NV, USA, 27–30 June 2016; IEEE: New York, NY, USA, 2016. [Google Scholar]
  27. Girshick, R. Fast R-CNN. In Proceedings of the International Conference on Computer Vision, Santiago, Chile, 7–13 December 2015. [Google Scholar]
  28. Ren, S.Q.; He, K.M.; Girshick, R.; Sun, J. Faster R-CNN: Towards Real-Time Object Detection with Region Proposal Networks. In Proceedings of the 29th Annual Conference on Neural Information Processing Systems (NIPS), Montreal, QC, Canada, 7–12 December 2015; Neural Information Processing Systems (Nips): La Jolla, CA, USA, 2015. [Google Scholar]
  29. Redmon, J.; Divvala, S.; Girshick, R.; Farhadi, A. You Only Look Once: Unified, Real-Time Object Detection. In Proceedings of the 2016 IEEE Conference on Computer Vision and Pattern Recognition (CVPR), Seattle, WA, USA, 27–30 June 2016; IEEE: New York, NY, USA, 2016. [Google Scholar]
  30. Wei, L.; Dragomir, A.; Dumitru, E.; Christian, S.; Scott, R.; Cheng-Yang, F.; Berg, A.C. SSD: Single Shot MultiBox Detector; Springer: Cham, Switzerland, 2016. [Google Scholar]
  31. Lin, T.Y.; Dollar, P.; Girshick, R.; He, K.; Hariharan, B.; Belongie, S. Feature Pyramid Networks for Object Detection. In Proceedings of the IEEE Conference on Computer Vision and Pattern Recognition, Honolulu, HI, USA, 21–26 July 2017; IEEE Computer Society: Washington, DC, USA, 2017. [Google Scholar]
  32. Redmon, J.; Farhadi, A. YOLO9000: Better, Faster, Stronger. In Proceedings of the 30th IEEE/CVF Conference on Computer Vision and Pattern Recognition (CVPR), Honolulu, HI, USA, 21–26 July 2017; IEEE: New York, NY, USA, 2017. [Google Scholar]
  33. Lin, T.-Y.; Goyal, P.; Girshick, R.; He, K.; Dollar, P. Focal Loss for Dense Object Detection. IEEE Trans. Pattern Anal. Mach. Intell. 2020, 42, 318–327. [Google Scholar] [CrossRef]
  34. Redmon, J.; Farhadi, A. YOLOv3: An Incremental Improvement. arXiv 2018, arXiv:1804.02767. [Google Scholar] [CrossRef]
  35. Bochkovskiy, A.; Wang, C.-Y.; Liao, H.-Y.M. YOLOv4: Optimal Speed and Accuracy of Object Detection. arXiv 2020, arXiv:2004.10934. [Google Scholar] [CrossRef]
  36. Müller, R.; Kornblith, S.; Hinton, G. When Does Label Smoothing Help? In Advances in Neural Information Processing Systems 32; Curran Associates Inc.: New York, NY, USA, 2019. [Google Scholar]
  37. Zheng, Z.; Wang, P.; Ren, D.; Liu, W.; Ye, R.; Hu, Q.; Zuo, W. Enhancing Geometric Factors in Model Learning and Inference for Object Detection and Instance Segmentation. IEEE Trans. Cybern. 2020, 52, 8574–8586. [Google Scholar] [CrossRef] [PubMed]
  38. He, K.; Zhang, X.; Ren, S.; Sun, J. Spatial Pyramid Pooling in Deep Convolutional Networks for Visual Recognition. IEEE Trans. Pattern Anal. Mach. Intell. 2014, 37, 1904–1916. [Google Scholar] [CrossRef]
  39. Wang, C.Y.; Liao, H.Y.M.; Wu, Y.H.; Chen, P.Y.; Hsieh, J.W.; Yeh, I.H. CSPNet: A New Backbone that can Enhance Learning Capability of CNN. In Proceedings of the IEEE/CVF Conference on Computer Vision and Pattern Recognition (CVPR), Seattle, WA, USA, 14–19 June 2020; Electr Network; IEEE Computer Society: Los Alamitos, CA, USA, 2020. [Google Scholar]
  40. Liu, S.; Qi, L.; Qin, H.F.; Shi, J.P.; Jia, J.Y. Path Aggregation Network for Instance Segmentation. In Proceedings of the 31st IEEE/CVF Conference on Computer Vision and Pattern Recognition (CVPR), Salt Lake City, UT, USA, 18–23 June 2018; IEEE: New York, NY, USA, 2018. [Google Scholar]
  41. Ultralytics. YOLOv5. 2020. Available online: https://docs.ultralytics.com/zh/models/yolov5/ (accessed on 20 August 2024).
  42. Ge, Z.; Liu, S.; Wang, F.; Li, Z.; Sun, J. YOLOX: Exceeding YOLO Series in 2021. arXiv 2021, arXiv:2107.08430. [Google Scholar] [CrossRef]
  43. Wang, C.Y.; Bochkovskiy, A.; Liao, H.Y.M. YOLOv7: Trainable bag-of-freebies sets new state-of-the-art for real-time object detectors. In Proceedings of the IEEE/CVF Conference on Computer Vision and Pattern Recognition (CVPR), Vancouver, BC, Canada, 17–24 June 2023; IEEE Computer Society: Los Alamitos, CA, USA, 2023. [Google Scholar]
  44. Ultralytics. YOLOv8. 2023. Available online: https://github.com/ultralytics/ultralytics (accessed on 5 October 2024).
  45. Wang, C.Y.; Yeh, J.; Liao, H.Y.M. YOLOv9: Learning What You Want to Learn Using Programmable Gradient Information. In Proceedings of the 18th European Conference on Computer Vision (ECCV), Milan, Italy, 29 September–4 October 2024; Springer International Publishing Ag: Cham, Switzerland, 2025. [Google Scholar]
  46. Wang, A.; Chen, H.; Liu, L.; Chen, K.; Lin, Z.; Han, J.; Ding, G. YOLOv10: Real-Time End-to-End Object Detection. arXiv 2024, arXiv:2405.14458. [Google Scholar]
  47. Ultralytics. YOLOv11. 2024. Available online: https://docs.ultralytics.com/zh/models/yolo11/ (accessed on 22 August 2025).
  48. Zhao, Z.Q.; Zheng, P.; Xu, S.T.; Wu, X. Object Detection with Deep Learning: A Review. IEEE Trans. Neural Netw. Learn. Syst. 2019, 30, 3212–3232. [Google Scholar] [CrossRef]
  49. Talaat, F.M.; ZainEldin, H. An improved fire detection approach based on YOLO-v8 for smart cities. Neural Comput. Appl. 2023, 35, 20939–20954. [Google Scholar] [CrossRef]
  50. Rehman, F.; Rehman, M.; Anjum, M.; Hussain, A. Optimized YOLOV8: An efficient underwater litter detection using deep learning. Ain Shams Eng. J. 2025, 16, 103227. [Google Scholar] [CrossRef]
  51. Lee, Y.-S.; Patil, M.P.; Kim, J.G.; Seo, Y.B.; Ahn, D.-H.; Kim, G.-D. Hyperparameter optimization of apple leaf dataset for the disease recognition based on the YOLOv8. J. Agric. Food Res. 2025, 21, 101840. [Google Scholar] [CrossRef]
  52. Ma, X.; Dai, X.Y.; Bai, Y.; Wang, Y.Z.; Fu, Y. Rewrite the Stars. In Proceedings of the 2024 IEEE/CVF Conference on Computer Vision and Pattern Recognition (CVPR), Seattle, WA, USA, 16–22 June 2024; IEEE Computer Society: Los Alamitos, CA, USA, 2024. [Google Scholar]
  53. Shi, D. TransNeXt: Robust Foveal Visual Perception for Vision Transformers. In Proceedings of the IEEE/CVF Conference on Computer Vision and Pattern Recognition (CVPR), Seattle, WA, USA, 16–22 June 2024; IEEE Computer Society: Los Alamitos, CA, USA, 2024. [Google Scholar]
  54. Cui, Y.N.; Ren, W.Q.; Cao, X.C.; Knoll, A. Focal Network for Image Restoration. In Proceedings of the IEEE/CVF International Conference on Computer Vision (ICCV), Paris, France, 2–6 October 2023; IEEE Computer Society: Los Alamitos, CA, USA, 2023. [Google Scholar]
  55. Lin, F.; Wang, B.; Chen, Z.; Zhang, X.; Song, C.; Yang, L.; Cheng, J.C.P. Efficient visual inspection of fire safety equipment in buildings. Autom. Constr. 2025, 171, 105970. [Google Scholar] [CrossRef]
  56. Akdoğan, C.; Özer, T.; Oğuz, Y. PP-YOLO: Deep learning based detection model to detect apple and cherry trees in orchard based on Histogram and Wavelet preprocessing techniques. Comput. Electron. Agric. 2025, 232, 110052. [Google Scholar] [CrossRef]
  57. Zhang, Y.-F.; Ren, W.; Zhang, Z.; Jia, Z.; Wang, L.; Tan, T. Focal and Efficient IOU Loss for Accurate Bounding Box Regression. Neurocomputing 2021, 506, 146–157. [Google Scholar] [CrossRef]
  58. Tong, Z.; Chen, Y.; Xu, Z.; Yu, R. Wise-IoU: Bounding Box Regression Loss with Dynamic Focusing Mechanism. arXiv 2023, arXiv:2301.10051. [Google Scholar]
  59. Gevorgyan, Z. SIoU Loss: More Powerful Learning for Bounding Box Regression. arXiv 2022, arXiv:2205.12740. [Google Scholar] [CrossRef]
  60. Zhang, H.; Chang, H.; Ma, B.; Wang, N.; Chen, X. Dynamic R-CNN: Towards High Quality Object Detection via Dynamic Training. arXiv 2020, arXiv:2004.06002. [Google Scholar] [CrossRef]
  61. Yang, X.; Castillo, E.d.R.; Zou, Y.; Wotherspoon, L. UAV-deployed deep learning network for real-time multi-class damage detection using model quantization techniques. Autom. Constr. 2024, 159, 105254. [Google Scholar] [CrossRef]
  62. Zhao, Y.; Lv, W.Y.; Xu, S.L.; Wei, J.M.; Wang, G.Z.; Dan, Q.Q.; Liu, Y.; Chen, J. DETRs Beat YOLOs on Real-time Object Detection. In Proceedings of the 2024 IEEE/CVF Conference on Computer Vision and Pattern Recognition (CVPR), Seattle, WA, USA, 16–22 June 2024; pp. 16965–16974. [Google Scholar]
  63. Sapkota, R.; Cheppally, R.H.; Sharda, A.; Karkee, M. RF-DETR Object Detection vs YOLOv12: A Study of Transformer-based and CNN-based Architectures for Single-Class and Multi-Class Greenfruit Detection in Complex Orchard Environments Under Label Ambiguity. arXiv 2025, arXiv:2504.13099. [Google Scholar]
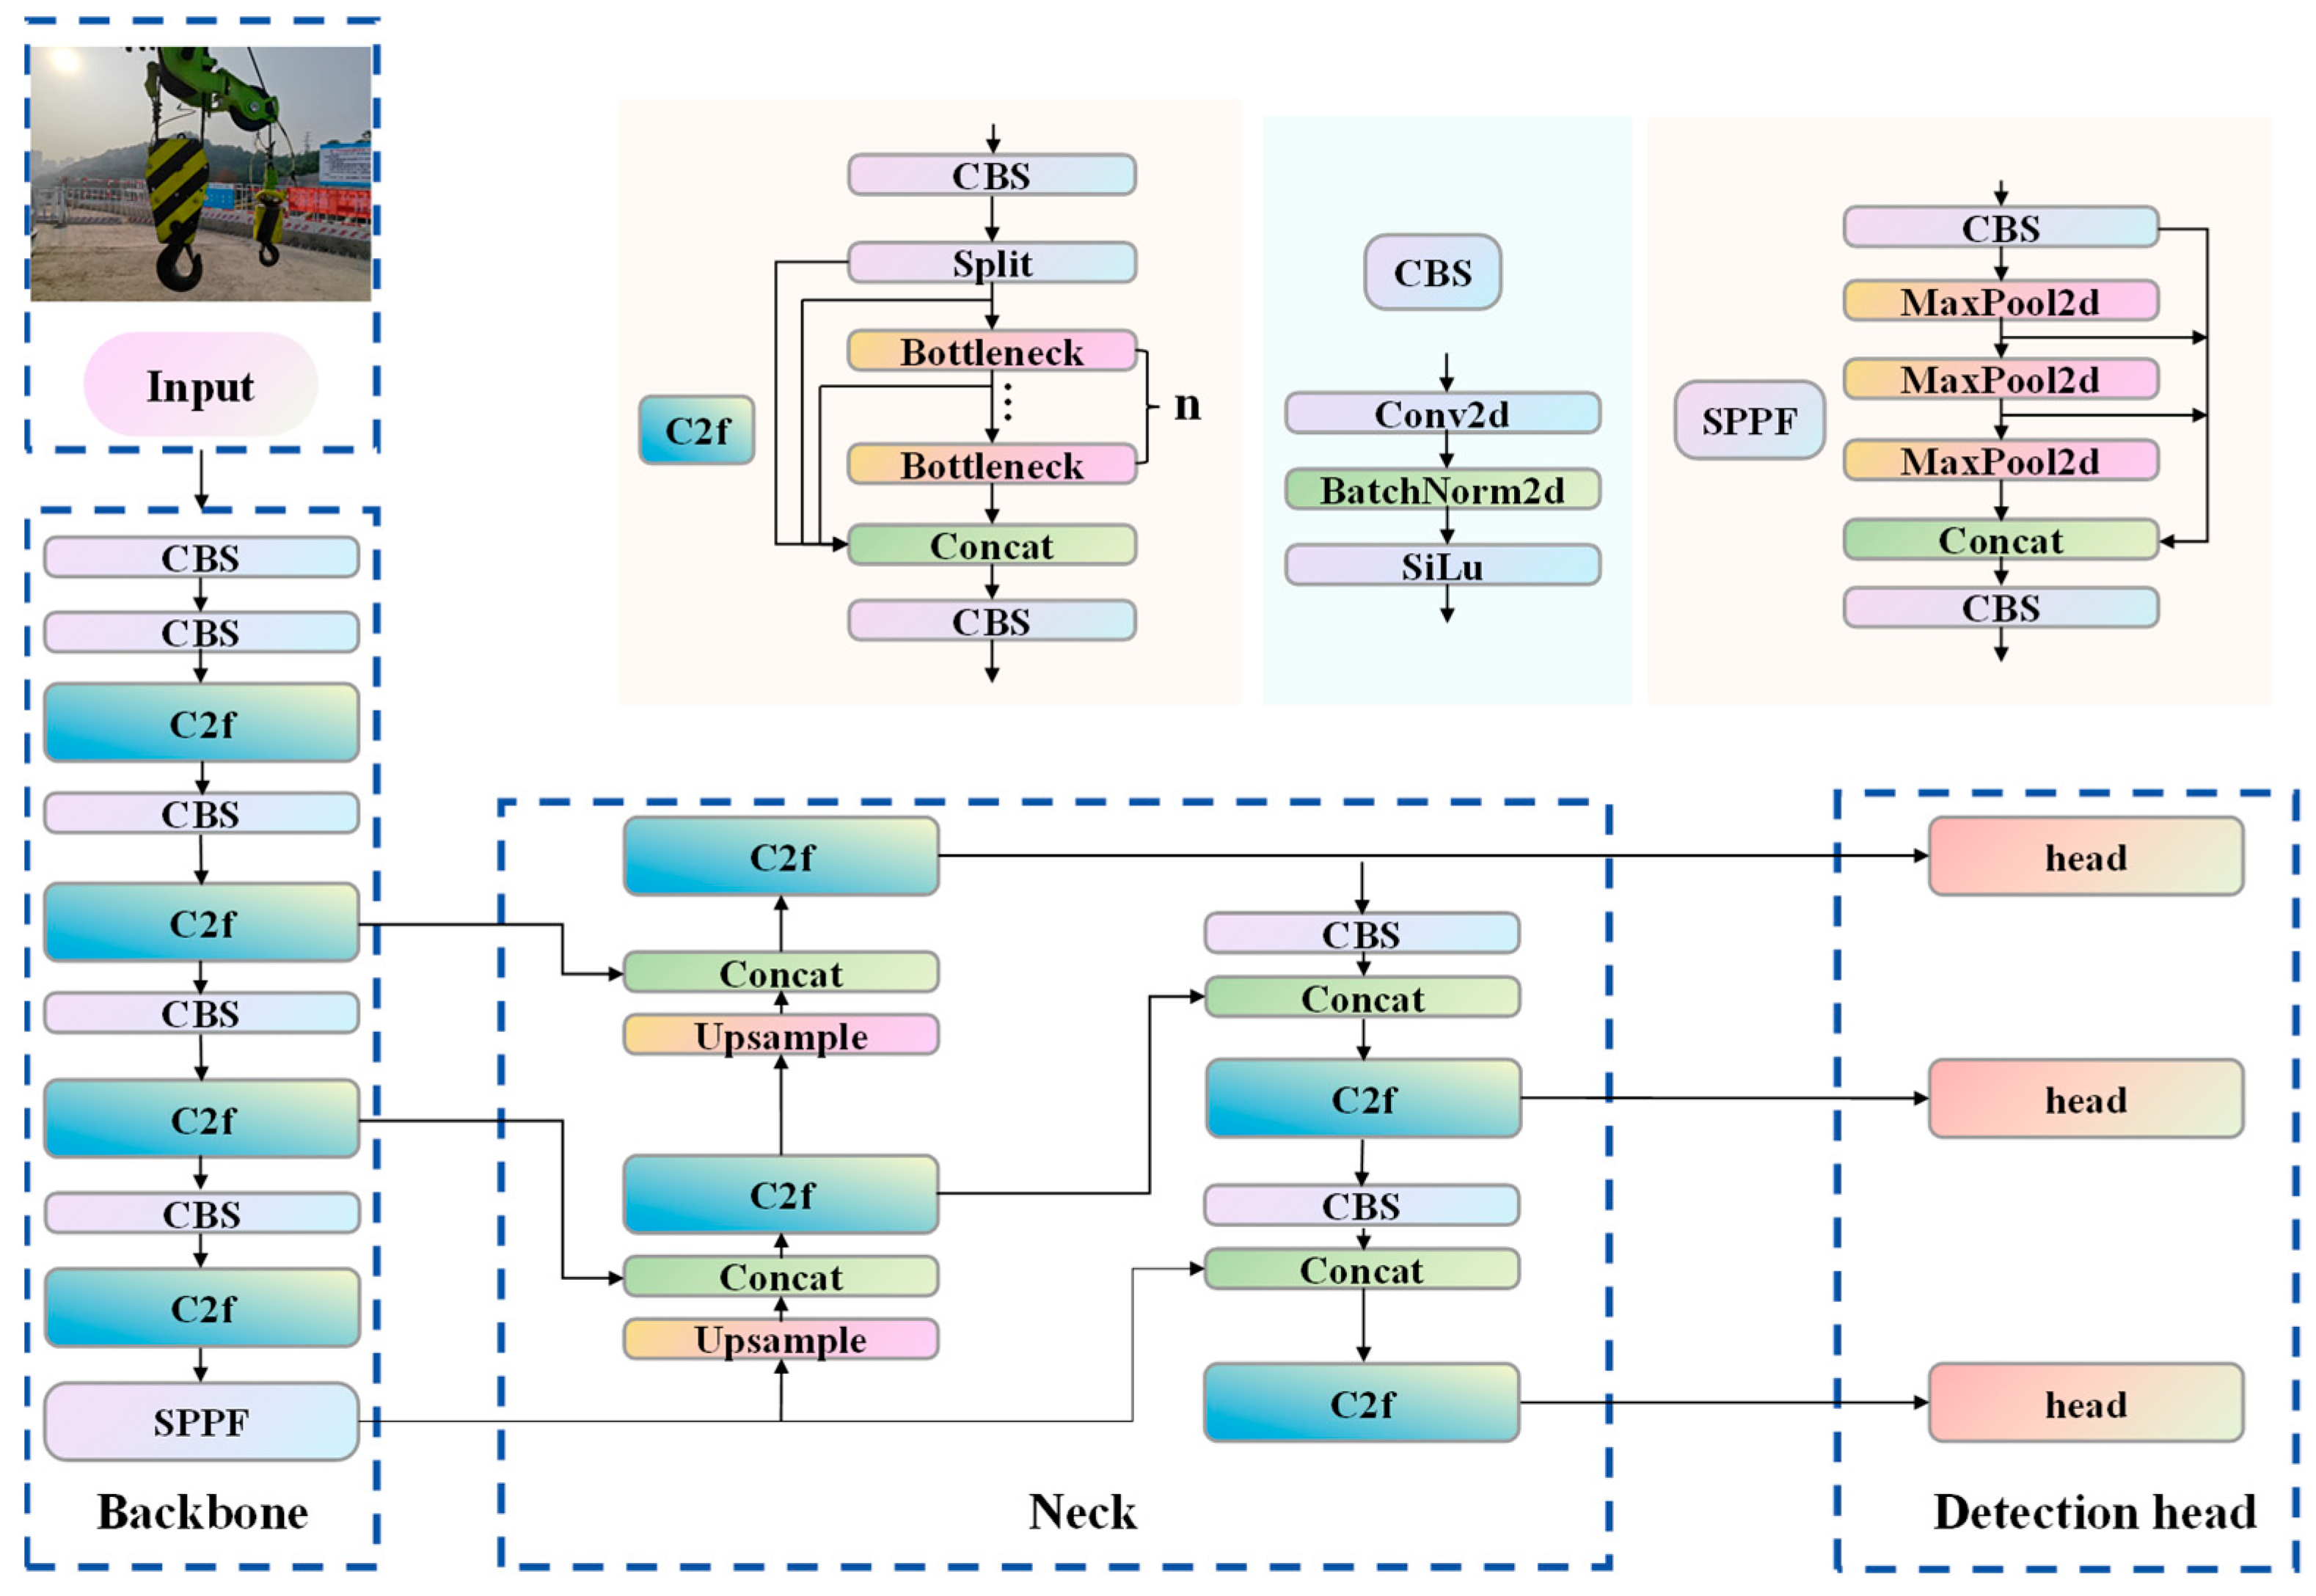
Figure 1. Architecture of the YOLOv8 network, illustrating the Input, Backbone, Neck, and Detection head modules.
Applsci 15 09878 g001
Figure 2. Structural schematic of the YOLO-HOOK framework, wherein C2f components within the Backbone are substituted by the Efficient_Light_C2f variant (embedding the CGLU and Star Blocks components), while those in the Neck are supplanted with the MSEICSP.
Applsci 15 09878 g002
Figure 3. Architecture of the Efficient_Light_C2f module, which is based on the original C2f module and incorporates the CGLU and Star Blocks components.
Applsci 15 09878 g003
Figure 4. Architecture of the MSEICSP module, which enables efficient multi-scale feature extraction and edge enhancement.
Applsci 15 09878 g004
Figure 5. Schematic diagram of HOOK_IoU. The HOOK_IoU loss function addresses the limitations of existing methods in generalization capability by allocating supplementary bounding geometries at varying dimensional scales to distinct detection modules.
Applsci 15 09878 g005
Figure 6. Different types of images. (a) rotation; (b) zoomed-in view; (c) luminance enhancement; (d) adverse weather (rainy + low-light condition); (e) strong light occlusion; (f) motion blur.
Applsci 15 09878 g006
Figure 7. Visualization of the dataset: (a) category statistics; (b) distribution of all annotated bounding boxes; (c) distribution of target center points; (d) distribution of bounding box widths and heights.
Applsci 15 09878 g007
Figure 8. Training (train) and validation (val) loss curves for box_loss, classification loss (cls_loss), and distribution focal loss (dfl_loss) in the baseline YOLOv8s and the proposed YOLO-HOOK models. Blue curves represent YOLOv8s and red curves represent YOLO-HOOK. (ac) represent the training losses, including box regression loss (train/box_loss), classification loss (train/cls_loss), and distribution focal loss (train/dfl_loss), respectively, while (df) represent the corresponding validation losses (val/box_loss, val/cls_loss, and val/dfl_loss, respectively).
Applsci 15 09878 g008
Figure 9. Comparison of object detection results before and after the proposed model improvement: (a) original images of hooks and safety latches; (b) detection results obtained using the baseline YOLOv8s model; (c) detection results obtained using the proposed YOLO-HOOK model.
Applsci 15 09878 g009
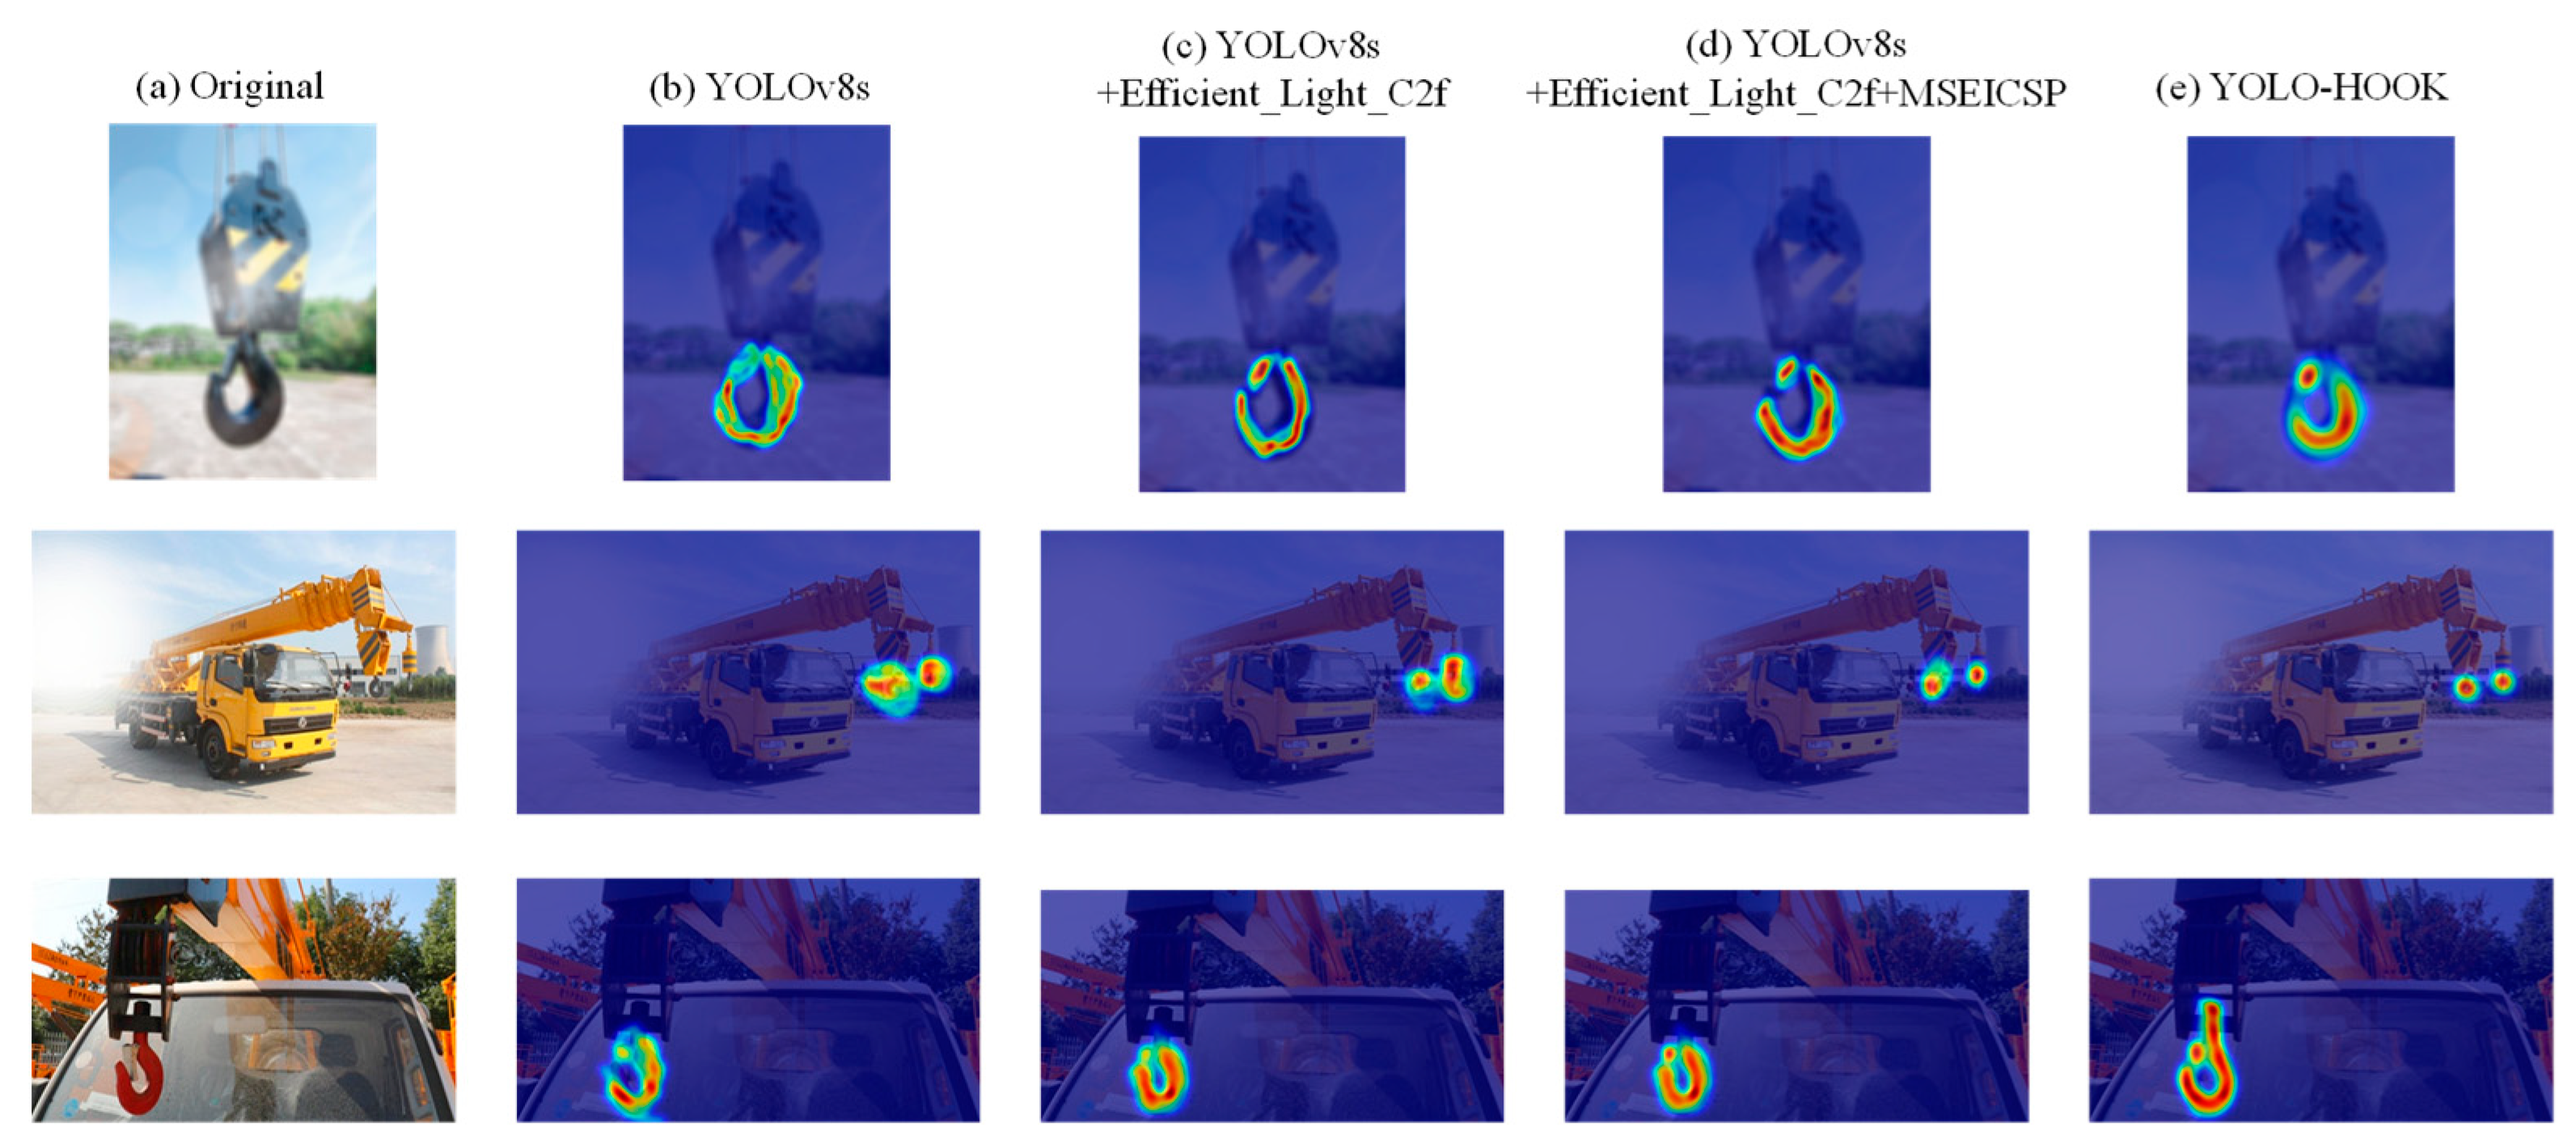
Figure 10. Progressive comparison of object detection heatmaps illustrating the effect of incremental model improvements: (a) original images of hooks and safety latches; (b) heatmap generated by the baseline YOLOv8s model; (c) heatmap from YOLOv8s + Efficient_Light_C2f; (d) heatmap from YOLOv8s + Efficient_Light_C2f + MSEICSP; (e) heatmap from the final YOLO-HOOK model.
Applsci 15 09878 g010
Figure 11. Comparison of average precision (AP) and average recall (AR) for small-scale, medium-scale, and large-scale objects between the baseline YOLOv8s model and the proposed YOLO-HOOK model.
Applsci 15 09878 g011
Table 1. Configuration of experimental parameters.
NameParameters
Image Size (pixels)640 × 640
Batch Size32
Initial Learning Rate0.01
OptimizerSGD
Learning Rate Momentum0.937
Weight Decay Factor5 × 10−4
Epoch300
Table 2. Comparison of object detection performance metrics between the baseline YOLOv8s and the improved YOLO-HOOK model.
ModelP(%)R(%)mAP@0.5
(%)
mAP@0.5:0.95
(%)
Params
(M)
GFLOPsFPSBS=32
YOLOv8s94.379.685.866.211.1328.4300
YOLO-HOOK97.083.490.471.69.631.0310
Table 3. Comparison of detection error rates between the baseline YOLOv8s model and the proposed YOLO-HOOK model. The error rate refers to the proportion of incorrectly detected or classified hooks and safety latches in the test set. YOLO-HOOK achieves a lower error rate than YOLOv8s, indicating improved detection precision after the model improvements.
ModelELoc (%)EDupe (%)EBkg (%)EMiss (%)
YOLOv8s4.940.371.366.48
YOLO-HOOK3.360.160.573.53
Note: ELoc represents the localization error rate, indicating instances where the target is detected but the predicted bounding box deviates substantially from the ground-truth box. EDupe denotes the duplicate detection error rate, referring to cases in which the same target is detected multiple times. EBkg corresponds to the background false positive rate, defined as the proportion of background regions that are incorrectly identified as targets. EMiss refers to the miss detection rate, representing the proportion of true targets that remain undetected.
Table 4. Comparison of detection across different object scales (small, medium, large) between the baseline YOLOv8s model and the proposed YOLO-HOOK.
ModelAPs (%)APm (%)APl (%)ARs (%)ARm (%)ARl (%)
YOLOv8s39.557.676.648.862.280.3
YOLO-HOOK40.965.582.249.669.984.9
Note: The subscripts s, m, and l represent small-scale, medium-scale, and large-scale objects, respectively.
Table 5. Comparison of ablation study results. Components A, B, and C correspond to the Efficient_Light_C2f module, the MSEICSP module, and the HOOK_IoU loss function, respectively.
ModelABCP
(%)
R
(%)
mAP@0.5
(%)
mAP@0.5:0.95
(%)
Params
(M)
GFLOPsFPSBS=32
YOLOv8s×××94.379.685.866.211.1328.4300
YOLOv8s_01××98.582.089.069.310.1625.2347
YOLOv8s_02××92.482.788.067.310.2832.8275
YOLOv8s_03××94.980.386.467.911.1328.4280
YOLOv8s_04×94.485.789.871.29.6031.0330
YOLOv8s_05×95.982.889.570.710.1625.2320
YOLOv8s_06×93.084.588.769.010.2832.8258
YOLO-HOOK97.083.490.471.69.6031.0310
Note: The symbol “√” denotes that the corresponding module is incorporated, whereas “×” indicates that the module is not used.
Table 6. Comparison of detection performance and efficiency among different bounding box regression loss functions for the YOLOv8s model.
ModelP (%)R (%)mAP@0.5
(%)
mAP@0.5:0.95
(%)
Params
(M)
GFLOPs
YOLOv8s94.379.685.866.211.1328.4
YOLOv8s+EIoU92.379.285.762.411.1328.4
YOLOv8s+Wise-IoU96.578.086.263.911.1328.4
YOLOv8s+SIoU92.577.685.162.911.1328.4
YOLOv8s+HOOK_IoU94.980.386.467.911.1328.4
Table 7. Experimental results of the different detection models.
ModelP
(%)
R
(%)
mAP@0.5
(%)
mAP@0.5:0.95
(%)
Params
(M)
GFLOPsFPSBS=32
Faster R-CNN83.270.877.556.341.2200.160
Dynamic R-CNN89.577.082.562.140.81988.365
YOLOv5s93.877.885.264.59.1123.8350
YOLOv6s95.676.884.564.316.3044.0274
YOLOv9s89.974.582.359.77.1726.7206
YOLOv10s93.171.783.060.97.2121.4265
YOLOv11s92.969.581.458.79.4121.3290
RT-DETR93.573.885.563.331.99103.479
RF-DETR96.578.086.263.931.1212096
YOLOv8s94.379.685.866.211.1328.4300
YOLO-HOOK97.083.490.471.69.6031.0310
Table 8. Comparison of results after applying the improved model to different models.
ModelP (%)R (%)mAP@0.5
(%)
mAP@0.5:0.95
(%)
Params
(M)
GFLOPs
YOLOv5s93.877.885.264.59.1123.8
YOLOv5s-HOOK93.683.788.269.07.5920.0
YOLOv6s95.676.884.564.316.344.0
YOLOv6s-HOOK95.380.686.668.37.018.4
YOLOv9s89.974.582.359.77.1726.7
YOLOv9s-HOOK93.980.086.566.14.4819.4
YOLOv10s93.171.783.060.97.2121.4
YOLOv10s-HOOK89.177.087.763.96.3313.8
YOLOv11s92.969.581.458.79.4121.3
YOLOv11s-HOOK96.681.287.665.510.0527.8
RT-DETR93.573.885.563.331.99103.4
RT-DETR-HOOK85.782.289.962.816.1340.5
Disclaimer/Publisher’s Note: The statements, opinions and data contained in all publications are solely those of the individual author(s) and contributor(s) and not of MDPI and/or the editor(s). MDPI and/or the editor(s) disclaim responsibility for any injury to people or property resulting from any ideas, methods, instructions or products referred to in the content.