1. Introduction
Suspension bridges represent a highly efficient structural solution for long-span crossings, offering superior material utilization, favorable stiffening girder height-to-span ratios, and minimal environmental footprint compared to alternative bridge types. The ground-anchored configuration, where main cable forces are transmitted to foundation rock through massive anchorages, enables exceptional span capabilities by effectively decoupling axial forces from the stiffening girder. Among anchorage options, tunnel-type anchorages demonstrate particular advantages through their inverted wedge geometry that mobilizes surrounding rock resistance, achieving comparable stability to gravity anchorages with significantly reduced material volumes and enhanced economic viability [
1,
2,
3].
Despite their engineering merits and successful historical applications-including pioneering implementations in the 1932 Washington Bridge (Manhattan District, New York, NY, USA) and subsequent major crossings like the Forth Road Bridge (Edinburgh, Scotland, UK) and Shimotsui Seto Bridge (Honshu, Japan) critical knowledge gaps persist regarding tunnel anchorage behavior. Current limitations center on three fundamental aspects: First, the load-transfer mechanisms between anchorage concrete and surrounding rock remain inadequately quantified, particularly for heterogeneous or weak rock masses where stress redistribution phenomena dominate performance. Second, existing failure mode analyses often oversimplify geological complexity, lacking systematic evaluation of progressive failure paths in fractured or stratified formations. Third, assessment methodologies for anchorage capacity potential in challenging geologies require refinement, as current approaches frequently lead to overly conservative designs that unnecessarily constrain application ranges [
4,
5,
6,
7].
The expansion of tunnel anchorage applications into more demanding geological environments—including soft rock strata, shallow bedrock conditions, and tectonically disturbed zones—has exposed additional research needs. Key among these is the need to characterize time-dependent behavior, where creep deformation of rock masses under sustained uplift loading may precipitate long-term serviceability concerns [
8,
9]. Furthermore, the composite “anchorage—rock” system lacks well-defined stability criteria, particularly for extreme loading scenarios that could trigger nonlinear interaction effects. Modern monitoring data from instrumented anchorages suggests that conventional design assumptions may not fully capture true system behavior, indicating potential gaps between analytical predictions and actual performance [
10,
11].
Addressing these challenges requires coordinated advances in computational modeling, experimental validation, and field monitoring. Emerging approaches incorporating discrete fracture network modeling, 3D printing of rock analogs for physical testing, and distributed fiber optic sensing for real-time performance tracking show particular promise [
12]. A robust theoretical framework accounting for rock-concrete interface behavior, scale effects, and cyclic degradation mechanisms would significantly enhance predictive capability. Such advancements would facilitate more rational, performance-based design methodologies moving beyond current empirical practices and enable optimized applications of tunnel anchorage technology for next-generation megaprojects while ensuring long-term safety and reliability across diverse geological settings [
13,
14].
Before the actual construction of the tunnel anchor suspension bridge, in order to fully guarantee the optimal design and safe construction of the tunnel anchor, the influence of geological conditions and rock mass characteristics similar to the actual anchoring area on the tunnel anchor system can be determined through in situ model experiments, and the structural and mechanical properties of the rock mass can be further obtained. The common similarity experiment method involves integrating laboratory and in situ test results to geologically generalize the surrounding rock of tunnel anchorages. A three-dimensional geomechanical model is established, and sensors are deployed to monitor model displacement and strain. Model design load tests, overload tests, and ultimate failure tests are conducted to investigate the influence range of tunnel anchorages and the deformation mechanism of rock mass under load. At present, some scholars have studied the performance of tunnel anchor system based on in situ scaling model test. However, the bridge construction based on the results of in situ scaling model test is limited. Some scholars have analyzed the deformation characteristics and failure modes by in situ scaling model test. Wu et al. revealed the mechanical rock mass characteristics of tunnel anchor under different load conditions through large-scale field model tests, and evaluated the potential load-bearing performance of tunnel anchor in the proposed super-large railway suspension bridge based on practical application cases [
15]. Based on field model tests, Han et al. analyzed the load-bearing performance of tunnel anchor in soft rock with weak interlayers, and divided the deformation stages, and determined that the final failure mode of tunnel anchor under special geological conditions was similar to that of inverted wedge [
16,
17]. At the same time, relevant scholars analyzed and determined the bearing capacity of tunnel anchors under different rock mass conditions based on the field model test monitoring data, which provided references for the actual construction of suspension Bridges. Shen et al. conducted design load test, overload test, failure test and rheological test on the field scale model of 1:12, and the results showed that: when the test load exceeded the overload stability coefficient, there would be an obvious inflection point; when the test load was less than the overload stability coefficient, the anchorage deformation and rheological characteristics were not obvious [
18]. Based on the characteristics of rock mass at the test site and the performance of the test instrument, scholars improved the in situ scaling model test. Since the field scale model test is easily affected by the field loading conditions, and it is generally difficult to reach the failure conditions, it is difficult to fully grasp the failure form and uplift process of the surrounding rock in the anchoring area, and to determine the ultimate bearing capacity of the tunnel anchor. Therefore, by simulating the failure conditions through the indoor similar model test, it can further deepen the failure form and the working mechanism of the “tunnel anchor-surrounding rock” co-bearing system. Scholars have studied the relevant mechanism and optimal design based on tunnel anchor indoor model test. They have conducted relevant studies on the stress and deformation of tunnel anchor body and surrounding rock, the stress mechanism and bearing capacity of anchor structure, and the deformation mechanism by changing the variables such as anchor depth and rock conditions in laboratory model tests. Lim and Seo conducted tunnel anchor pullout tests based on indoor model tests. Based on the test data and tunnel anchor failure phenomenon, the bearing capacity and failure mode of tunnel anchor were further analyzed on the basis of clarifying the influencing factors of tunnel anchor failure [
19,
20,
21]. Xia et al. employed two-dimensional particle flow numerical simulation to investigate the effects of confining pressure and dip angles of structural planes on the failure characteristics, mechanical behavior, and slip behavior of rock masses [
22]. Liang et al. employed model tests and numerical analysis methods to investigate the deformation evolution characteristics during adjacent construction. They specifically examined the influence distance between the anchor body and the tunnel, as well as the effect of tunnel burial depth on the deformation of the anchor body [
23]. Zhou et al. conducted a case study on the tunnel anchorage of a long-span suspension bridge using three-dimensional numerical simulations to investigate the impact of adjacent tunnel excavation on anchorage stability [
24]. Zhang et al. established a refined numerical model to explore the load-response behavior of a railway suspension bridge tunnel anchorage embedded in fractured rock interlayers, conducting a comprehensive stability assessment that verified both the applicability and safety of such anchorages in complex geological conditions [
25]. Ko et al. validated the numerical model’s effectiveness by comparing finite element simulation results with small-scale model tests of tunnel anchorages, demonstrating strong agreement between numerical predictions and experimental observations. These studies collectively provide a theoretical foundation for the broader application of tunnel anchorage technologies [
26]. Substantial research has also been conducted on the preparation of similar materials for physical model tests. Ahmad et al. investigated the properties of hybrid fiber-reinforced composites modified by the addition of slag and metakaolin, which significantly enhanced the compressive strength, tensile strength, and deformation capacity of the material. These improvements are crucial for the preparation of such analogous materials [
27,
28].
Although the parameters of rock mass determined by the laboratory model test can reflect the mechanical properties of the anchorage rock mass in the engineering area, the synergistic effect between the “tunnel anchor and surrounding rock” is difficult to be fully revealed due to the length contraction effect.
The above field and laboratory model experiments have played a key guiding role in the subsequent analysis of tunnel anchor bearing capacity and tunnel anchor system stability, but both of them will be affected by in situ test site conditions, similar test materials, safety assurance. Therefore, the relevant test results are insufficient to fully understand the load-bearing characteristics of tunnel anchors under different engineering geological conditions and the failure modes affected by the mechanics and structural characteristics. Therefore, it is very important to study the load-bearing mechanism of tunnel anchors and the deformation of surrounding rock mass.
Existing research has predominantly focused on the global stability, ultimate bearing capacity, and final failure modes (i.e., macroscopic outcomes) of anchor foundations. These are typically obtained through numerical simulations or simplified model tests. There remains a lack of intuitive and quantitative understanding of the mesoscopic mechanical behaviors during the formation of bearing capacity, including internal and continuous deformation evolution, stress redistribution, crack initiation and propagation, and cumulative damage in the surrounding rock. The primary disadvantage associated with tunnel anchorage pertains to the relatively high geological conditions in the anchoring area. This involves the interaction between the anchorage and the surrounding rock, as well as the deformation of the rock mass under load. Consequently, the bearing mechanism is relatively complex. The Wujiagang Yangtze River Bridge is notable as the first tunnel anchorage with conglomerate strata in China. The region’s complex geological characteristics, characterized by soft, layered, and uneven overlying rock formations, pose significant challenges to construction efforts. The research in this paper not only greatly reduces the project investment and environmental cost of Wujiagang Yangtze River Bridge, but also provides a theoretical basis and practical reference for the construction of tunnel anchorage in small mountain complex strata in plain or hilly areas. Meanwhile, physical model testing enables the visualization and precise measurement of the entire process from initial loading to ultimate failure, revealing the intrinsic mechanisms and evolutionary patterns underlying macroscopic phenomena. This approach goes beyond traditional studies that merely provide a safety factor or final failure mode.
The most groundbreaking innovation of this study is the first-ever construction of a large-scale physical model testing system capable of simultaneously replicating complex geological structures and real loading conditions. This system successfully simulates the full-process interaction between the tunnel anchor and the soft-hard interbedded, heterogeneous conglomerate strata, enabling the analysis of the entire process from elastic deformation and plastic development to final failure. It provides unprecedented intuitive data and a theoretical basis for understanding the nonlinear deformation behavior and progressive failure mechanism of tunnel anchors under real load conditions, thereby overcoming the bottlenecks of traditional methods in revealing the system’s synergistic failure mechanisms.
3. Test Model Construction and Monitoring
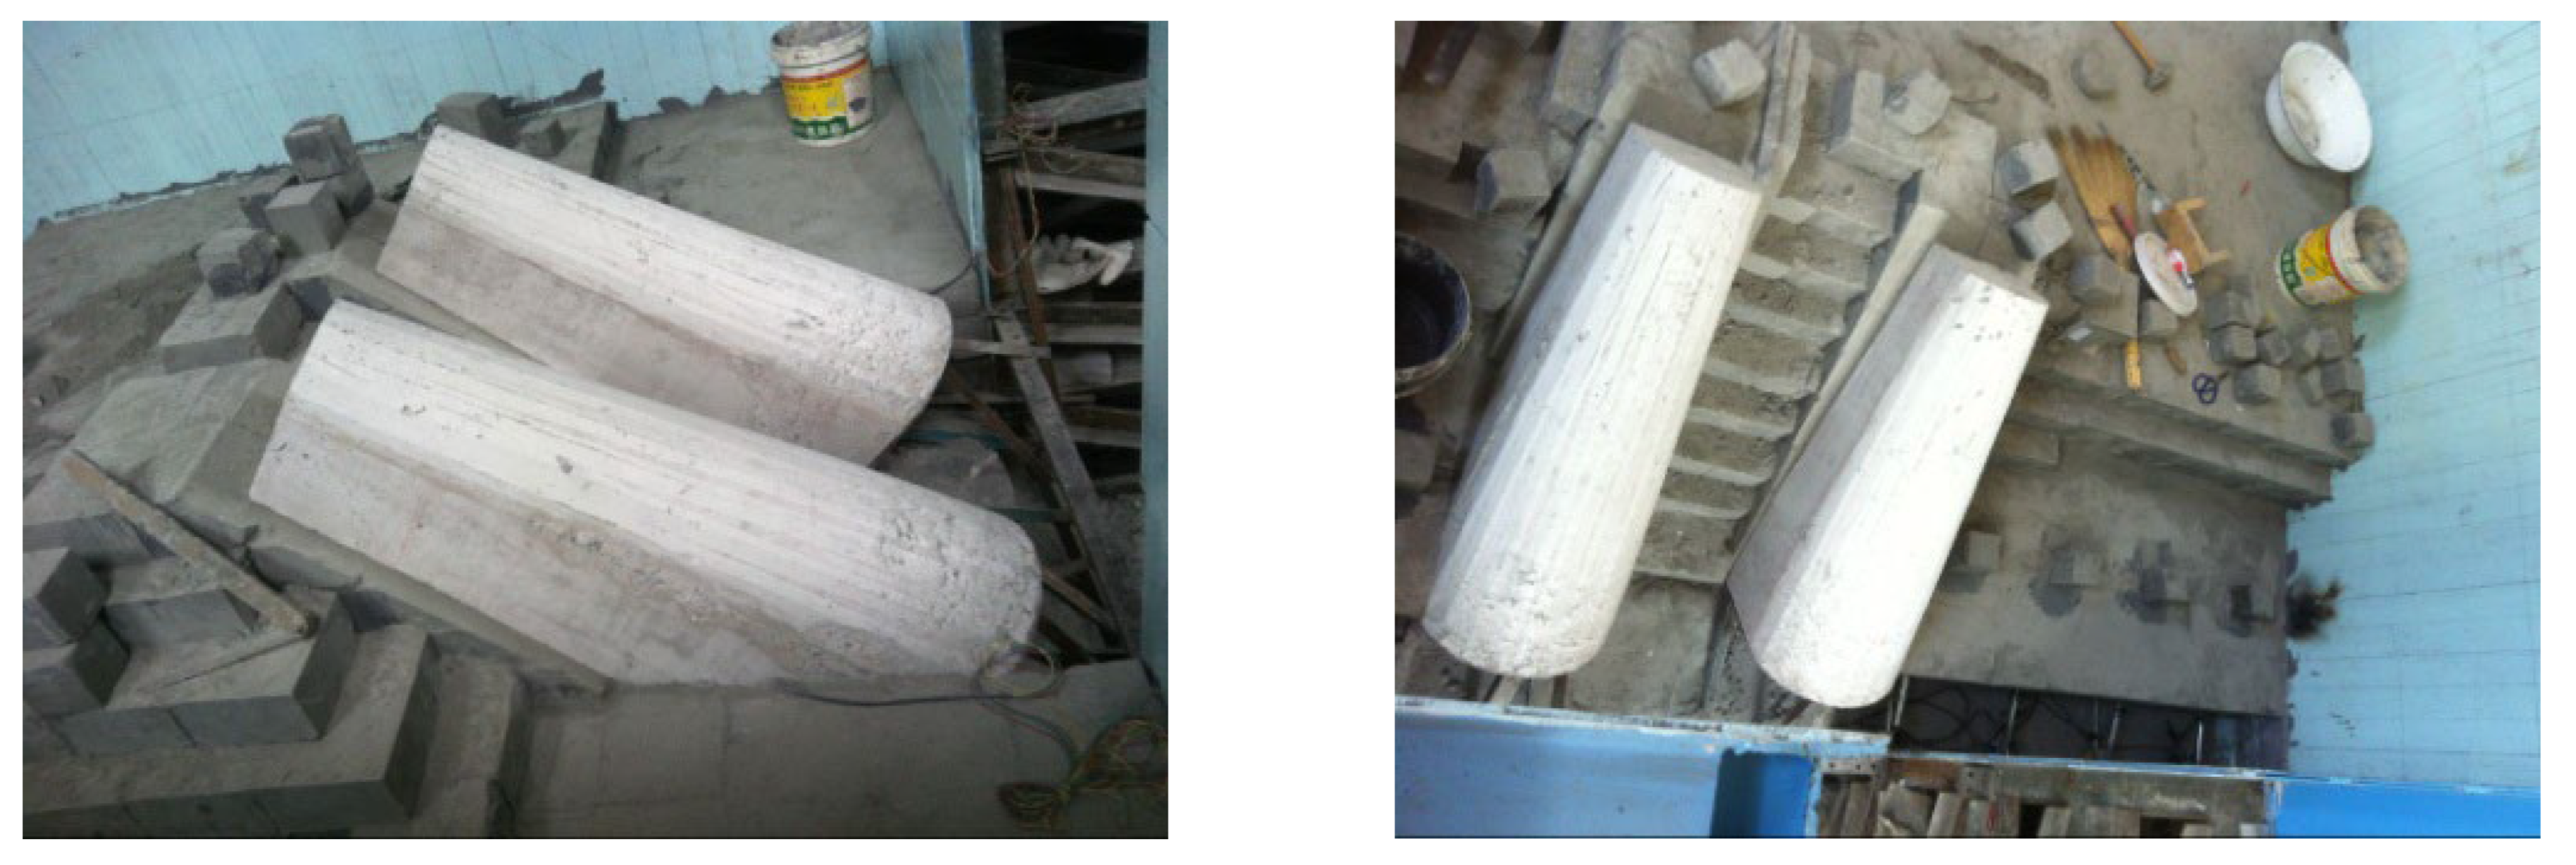
To ensure the quality of the masonry blocks, the cementitious materials and fillers were uniformly mixed and pressed into blocks of fixed dimensions using a steel mold. The model boundaries were constructed with high-stiffness steel formwork, which was welded into an integral trough-shaped structure. This configuration was implemented to maximize the rigidity of the constrained boundaries. Subsequently, the blocks and adhesives were meticulously layered and staggered in the steel trough to construct the model. During the masonry process, strict curing procedures were implemented. To ensure the precise relative positioning of the anchorage and rock layer interfaces, levels and theodolites were employed to facilitate the accurate positioning and layout during the experiment. The strategic placement and protection of embedded monitoring devices throughout the construction process were meticulous [
30,
31].
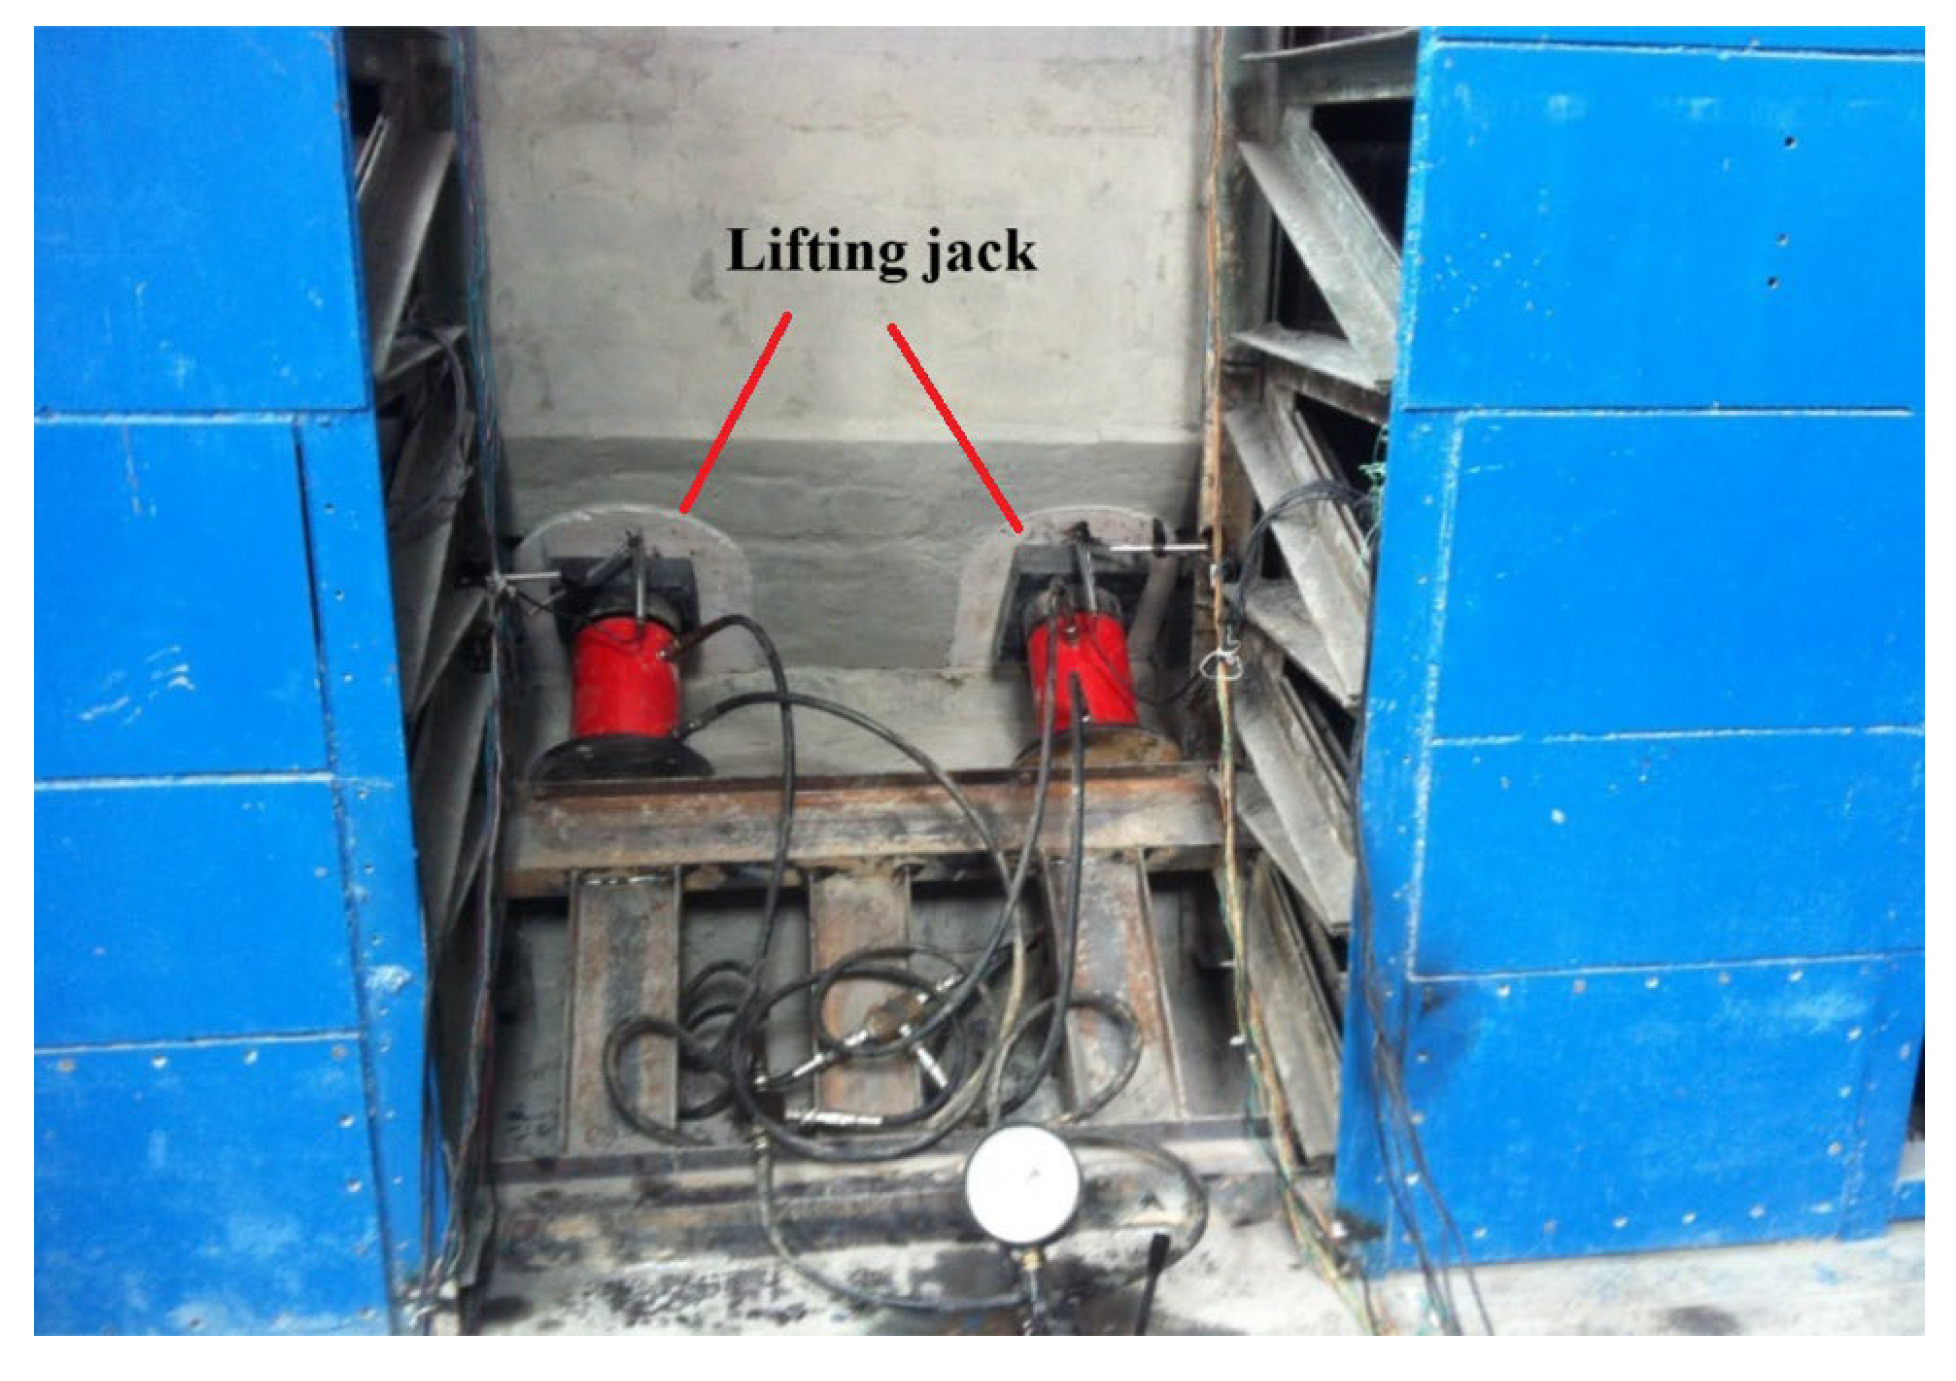
The model test employed the back-pushing method to simulate the pull-out effect of tunnel anchors. In accordance with the principles of similitude, the design load per anchor was determined to be 3.45 kN. A 100 kN jack was installed on the rear anchor face of each anchor. To ensure equal force distribution between the twin anchors, the hydraulic lines of the two jacks were connected in parallel. Spacer blocks were placed on the rear anchor face of each anchor to ensure uniform stress distribution across the anchor body. The test protocol comprised three phases: 1P test (1 time design load: 3.45 kN), 5P test (5 times design load: 17.25 kN), and overload-to-failure test. Due to the complexity of preparing model specimens for similarity tests and the extended duration of the testing process, one specimen was prepared for each test group.
The model test incorporated a comprehensive experimental setup, incorporating loading and monitoring systems. The back-pushing method was employed to simulate the effects of tunnel anchor pull-out, with each anchor designed to withstand a 3.45 kN load. Two 100 kN jacks, installed on rear anchor faces, were connected through parallel hydraulic circuits to ensure synchronized force application. Spacer blocks were also utilized to facilitate stress homogenization. The tests comprised three sets of parallel tests: a 1× normal load test, a 5× overload test, and an overload failure test. These corresponded to the tunnel anchorage’s normal working state, overloaded working state, and ultimate failure state, respectively. A rigid reaction system was achieved by welding jack supports to I-beams and boundary-constraint steel channels (
Figure 4).
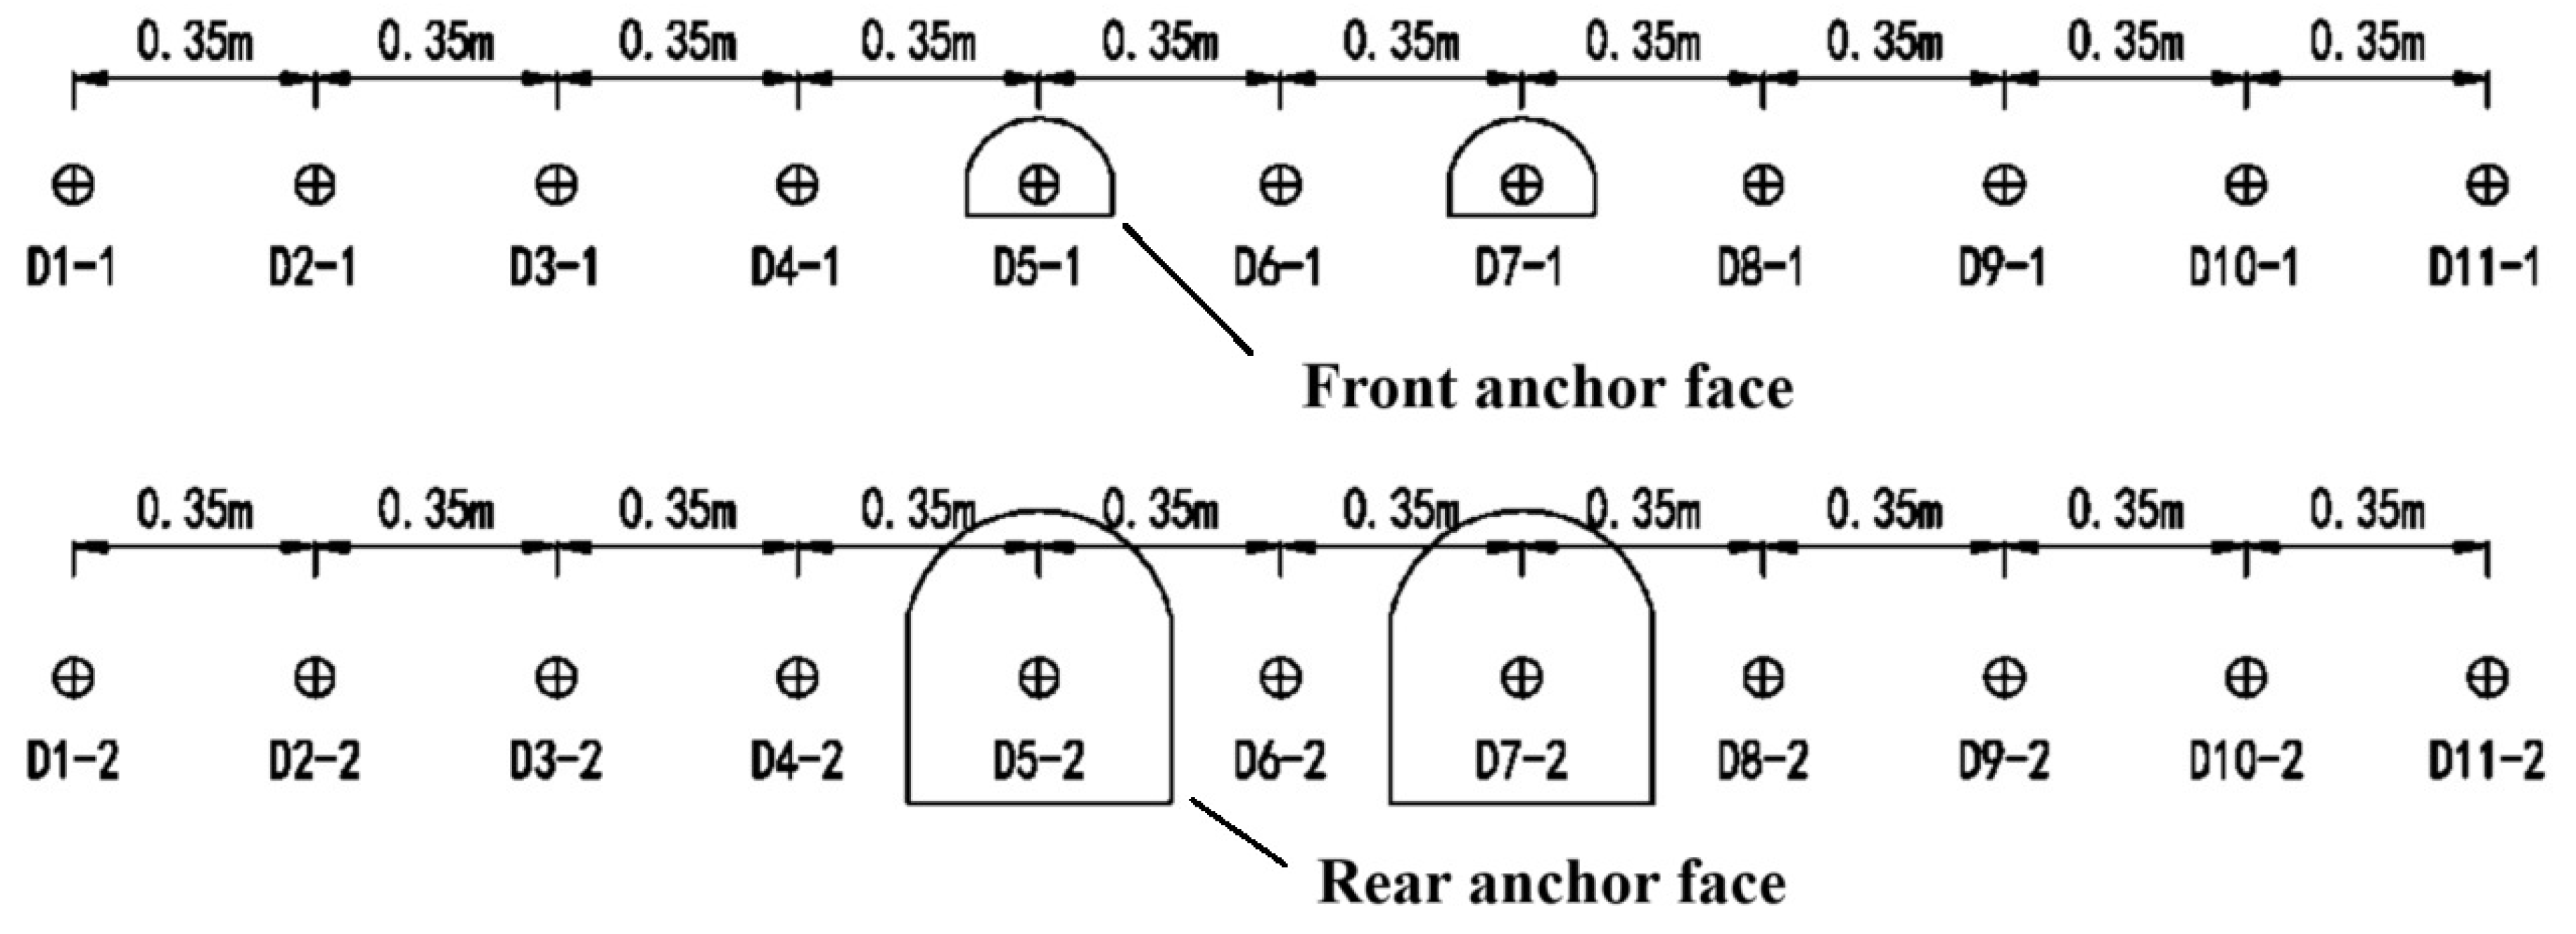
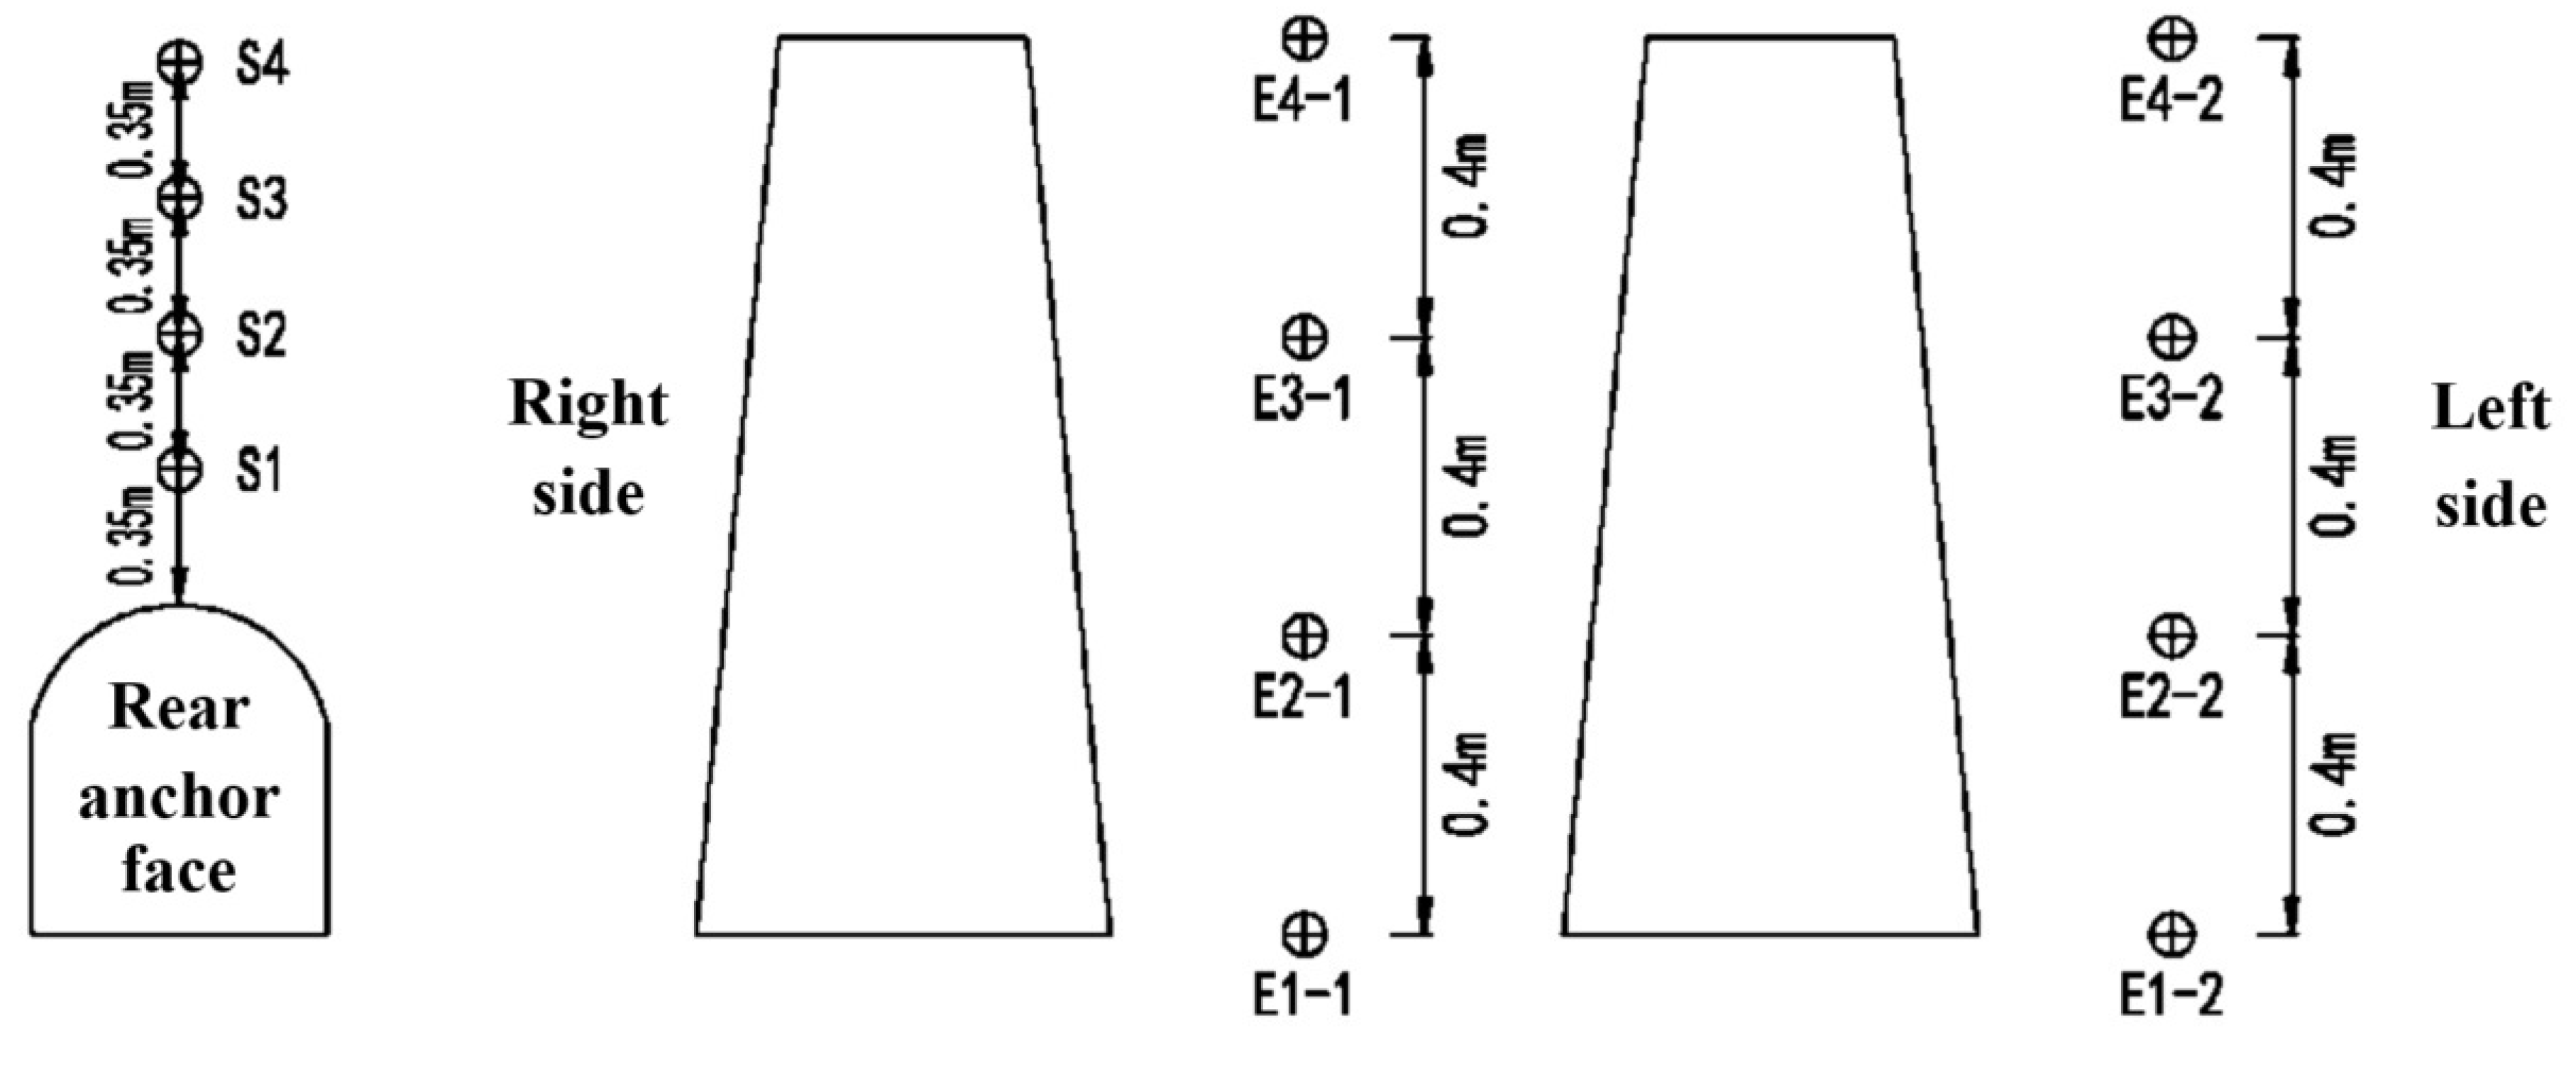
Three distinct monitoring systems were implemented: (1) Displacement monitoring using 11 GA-10 LVDTs (0.35 m spaced) on the rear anchor face and fiber Bragg grating sensors on the front face, (2) Four 0.4 m-spaced measurement points along anchor axes in inter-anchor zones and rock mass, and (3) Vertical strain monitoring with four 0.35 m-spaced gauges 0.2 m behind the rear face (
Figure 5 and
Figure 6). This integrated approach yielded loading accuracies within ±1.2% and facilitated full-field deformation measurement across service, extreme, and ultimate limit states.
4. Test Results
4.1. 1P Load Test
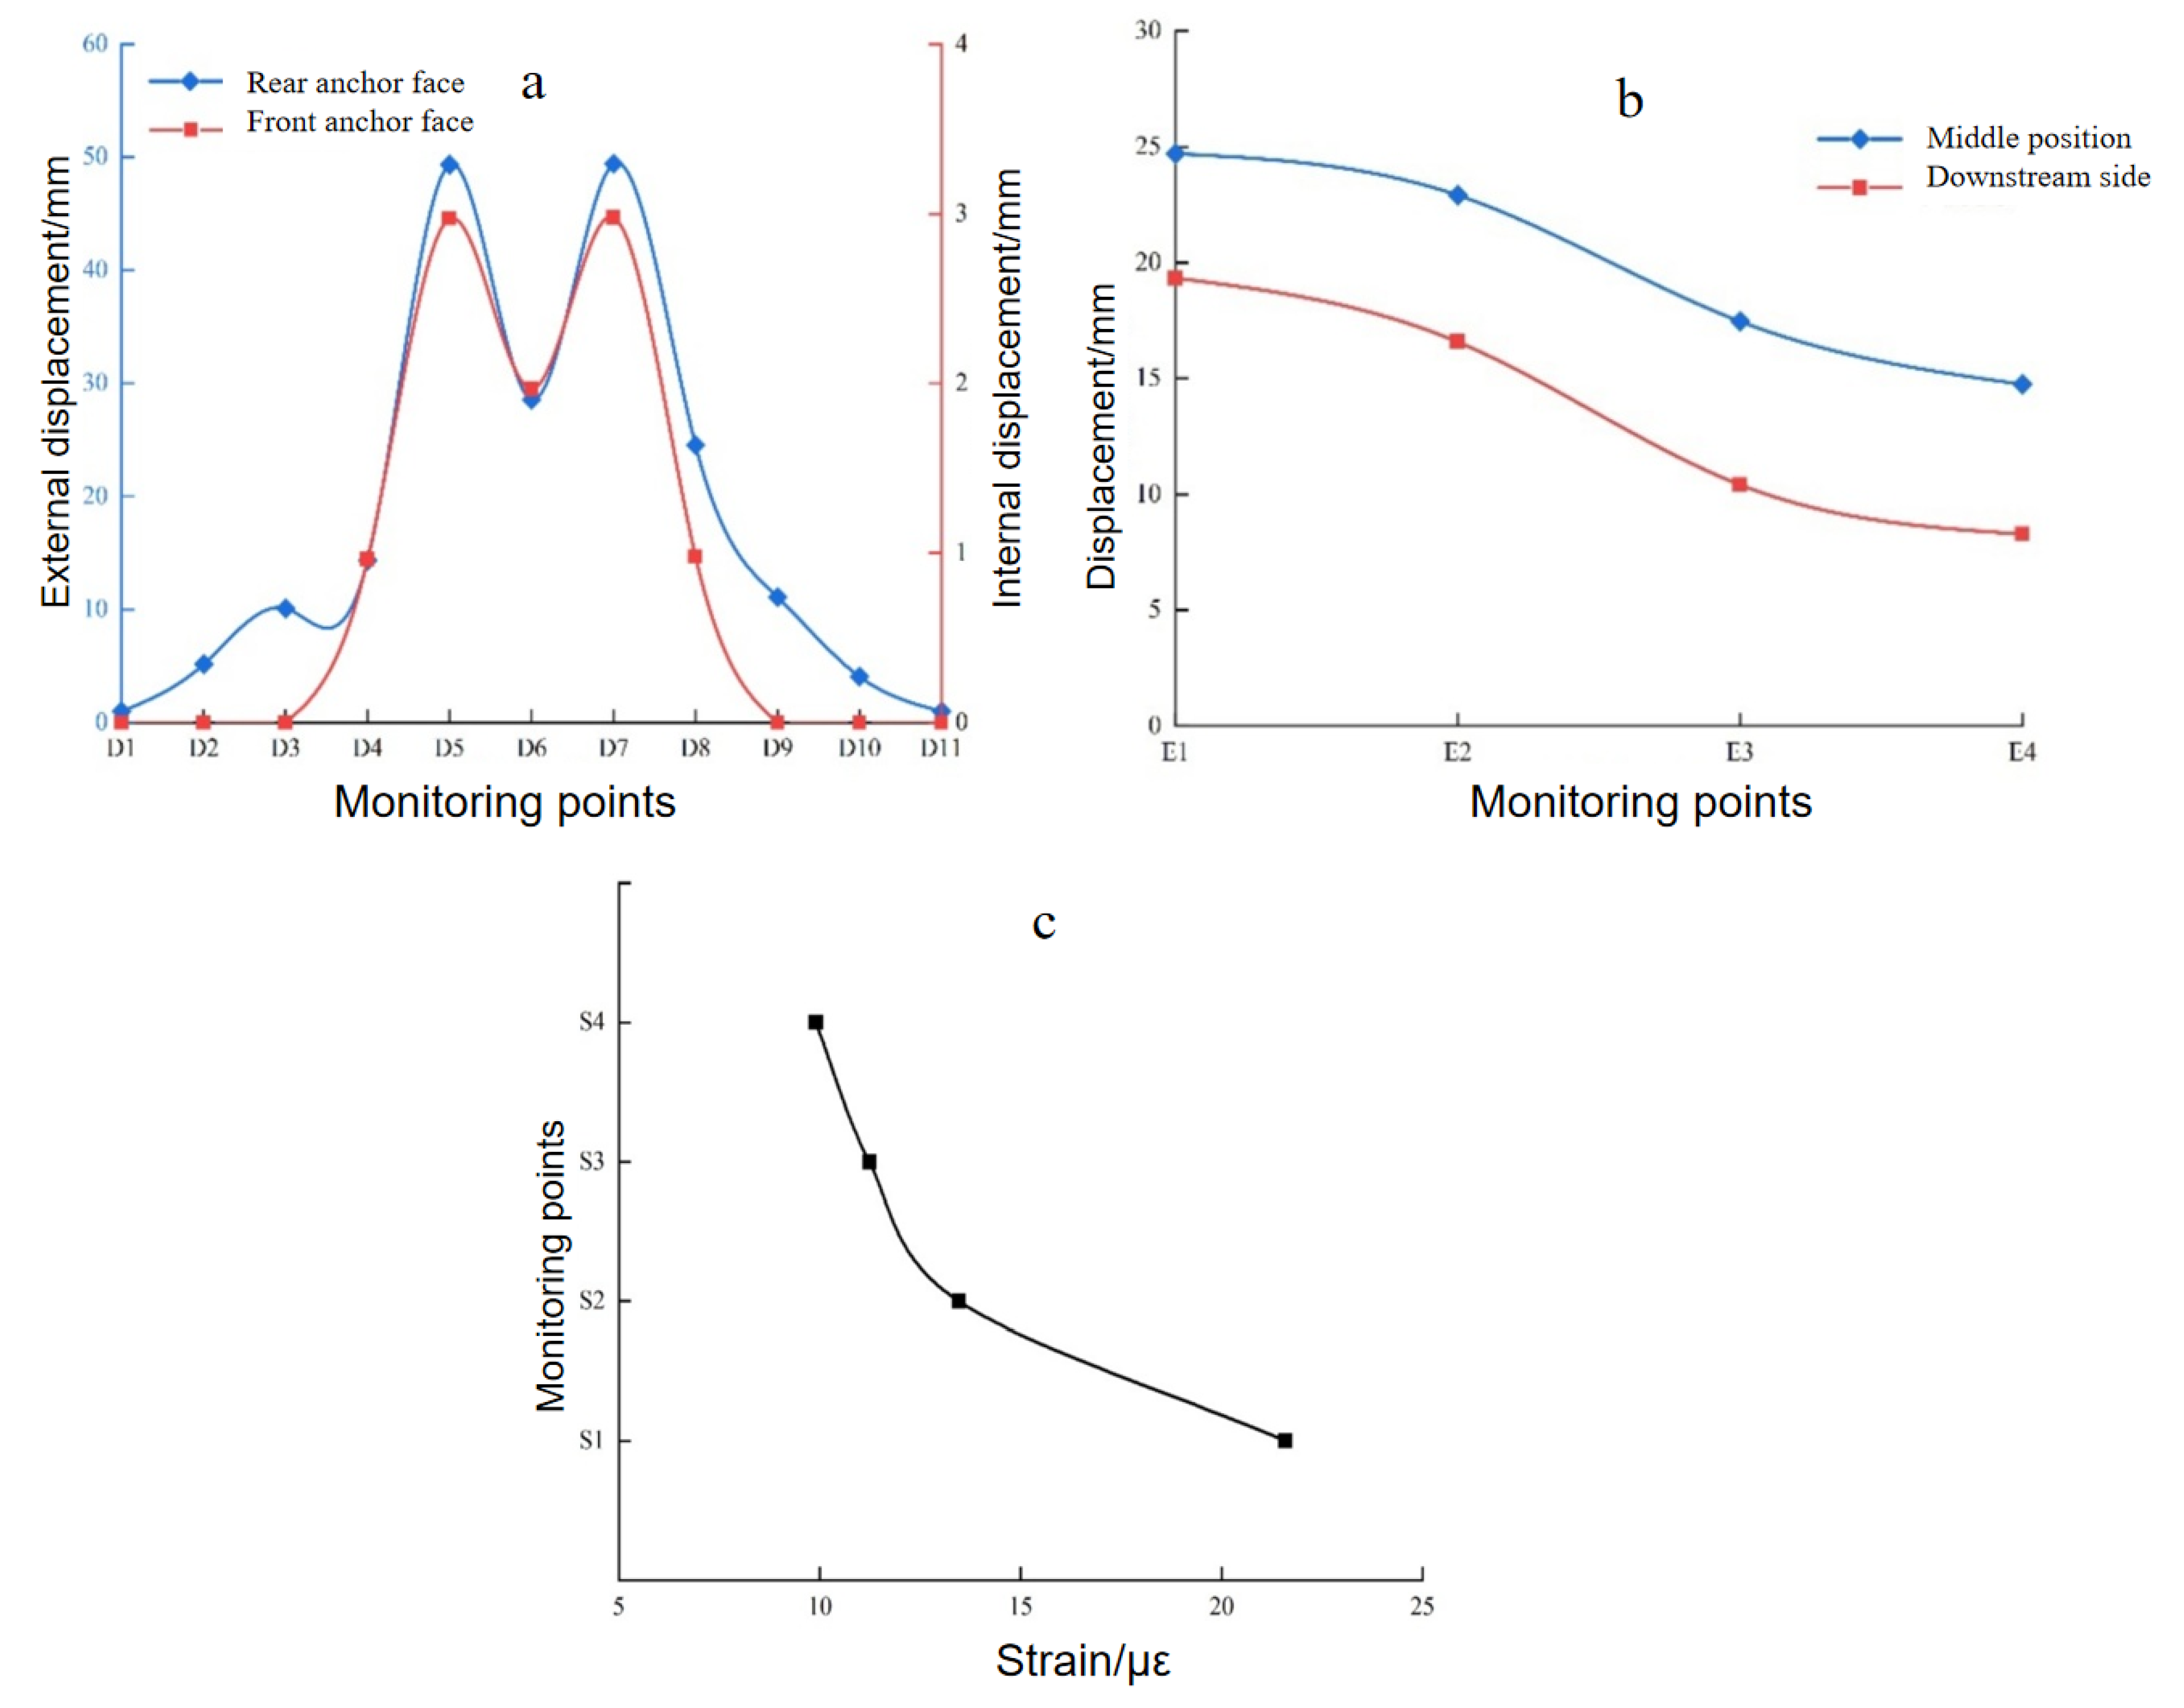
The first test group applied a 1 × equivalent normal load value derived from similitude theory, with the load imposed using hydraulic jacks. Observations of cross-sectional deformation revealed significantly greater displacement at the rear anchorage face (maximum deformation: 50 μm) compared to the front anchorage face (maximum deformation: 3 μm), as detailed in
Figure 7a. This indicates that under the 1P load, the surrounding rock at the rear anchorage primarily bore the load, with the anchorage slowly transferring the load forward through the rock.
The transverse deformation exhibited a camelback-shaped profile with good symmetry. Anchorage deformation exceeded that of the surrounding rock, and the rock between anchorages deformed more than the rock on either side. Strain decreased sharply with increasing distance from the anchorage. The transverse influence range measured 2.1 m at the front face and 3.5 m at the rear face, with a stress diffusion angle of approximately 50°.
Deformation trends suggest that the anchorage underwent initial deformation and sliding upon loading, subsequently mobilizing the surrounding rock to resist external forces. The loaded rock mass predominantly concentrated near the rear anchorage face, consistent with results from on-site scaled model tests, confirming stress concentration at the rear anchorage.
The strain distribution from the rear to the front anchorage face is illustrated in
Figure 7, with strain values of 24 με at the rear anchorage face and 15 με at the front anchorage face. The significantly higher strain at the rear face aligns with the previously observed greater deformation at the rear anchorage face compared to the front. As the distance from the rear anchorage face increases, the strain rapidly diminishes.
The deformation trend of the left-side rock mass parallel to the axis (
Figure 7b) exhibits significantly lower strain compared to the inter-anchorage rock mass, consistent with earlier transverse monitoring results. The strain distribution along the axis follows a pattern similar to that of the inter-anchorage rock mass, with strain attenuation intensifying with distance from the rear anchorage face.
Deformation of the upper rock mass at the rear anchorage face (
Figure 7c) shows that strain values decrease and attenuation accelerates with increasing distance from the anchorage.
In the experimental model, the upper rock mass on the rear anchorage surface gradually diminishes as the distance from the anchorage increases, and its attenuation pattern aligns closely with the lateral deformation pattern.
Based on the strain variation patterns in the axial and lateral directions, it can be concluded that when the anchorage is subjected to loading, it first exhibits a tendency to slide. However, due to the constraints imposed by its wedge-shaped geometry, the anchorage rapidly drags the surrounding rock, inducing deformation. The stress, however, diffuses and attenuates quickly into the surrounding rock. The strain in the load-bearing layer decays rapidly beyond a certain distance, with strain concentration primarily occurring within a range of approximately 1 to 2 times the width of the rear anchorage surface. Stress concentration at the rear anchorage surface is highly pronounced. The anchorage primarily resists the applied load through confinement by the surrounding rock, working in tandem with it.
4.2. 5P Load Test
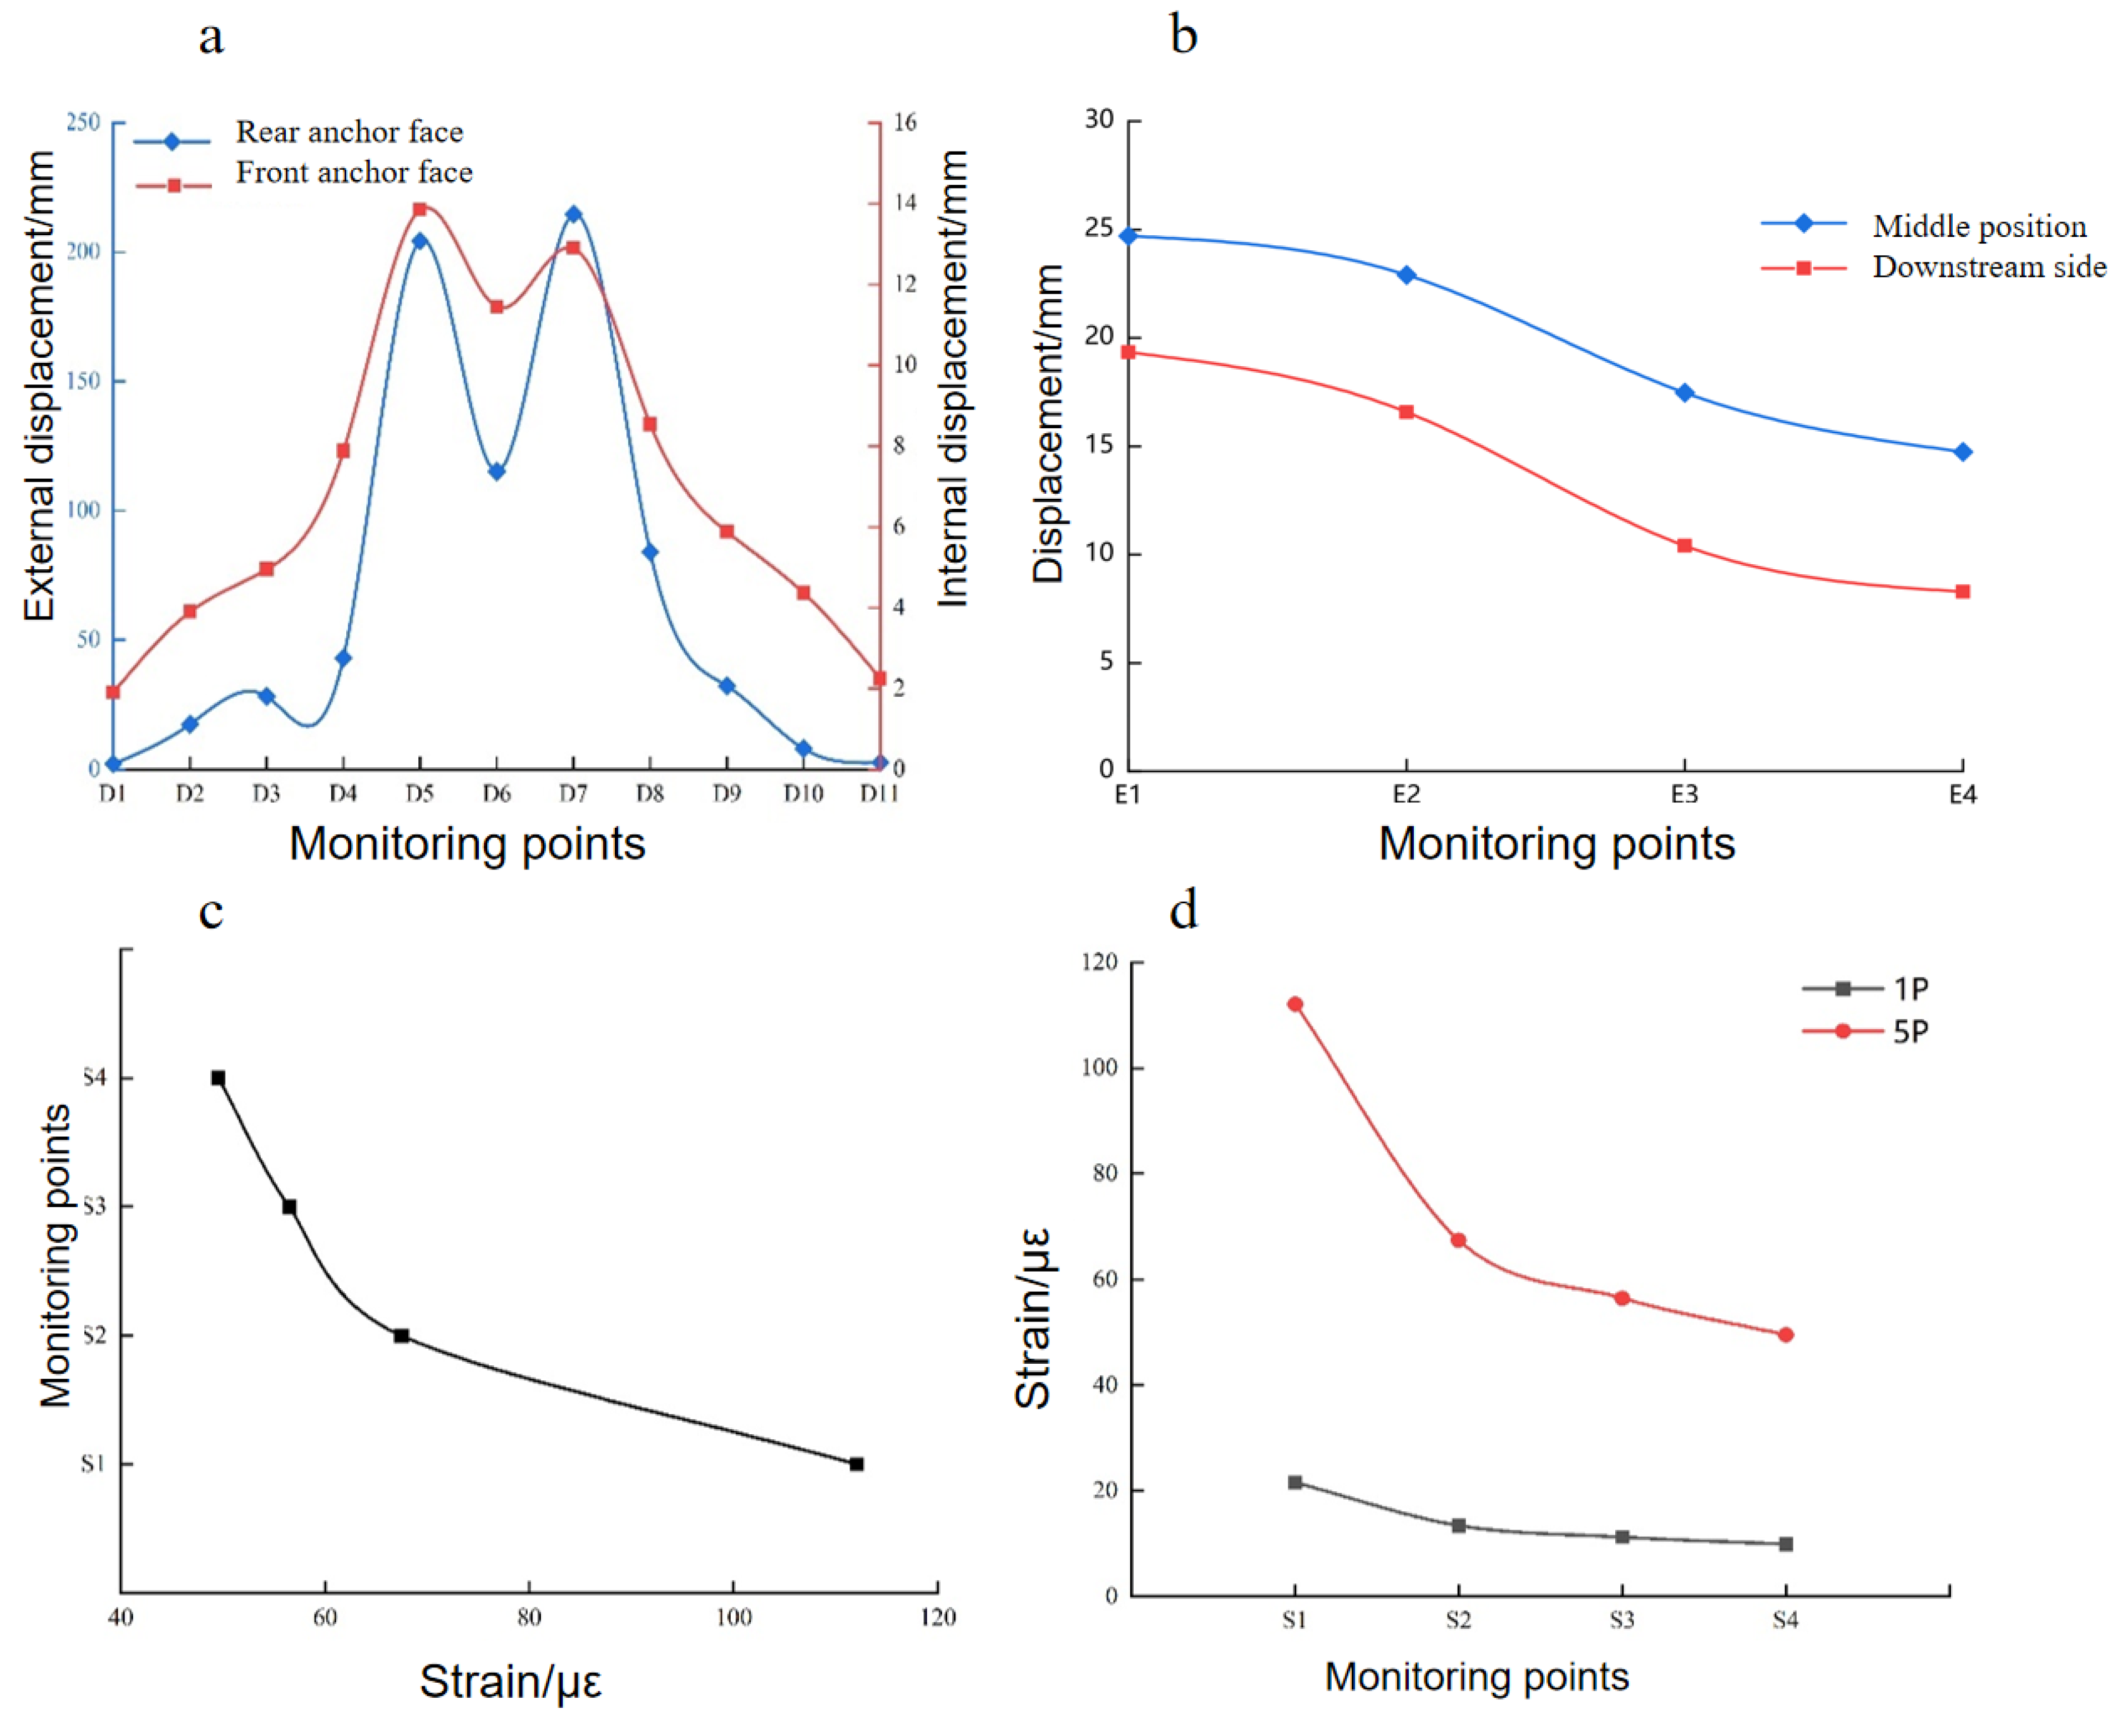
An overload test with 5 times the load (5P) was conducted based on the 1P load test. From the cross-sectional deformation observations, the deformation of the rear anchorage surface is significantly greater than that of the front anchorage surface. The maximum deformation of the rear anchorage surface reached 210 μm, while that of the front anchorage surface was 13.5 μm. Compared to the 1P load condition, these values increased by 160 μm and 10.5 μm, respectively (as detailed in
Figure 8a). This indicates that under the 5P load, stress concentration in the surrounding rock behind the anchorage intensified sharply. The lateral deformation exhibited a double-hump-shaped profile, with symmetry remaining relatively intact. The deformation of the anchorage itself exceeded that of the surrounding rock, and the inter-anchorage surrounding rock deformed more than the rock on either side. The deformation decreased rapidly with increasing distance from the anchorage body, consistent with observations under the 1P load. The lateral influence range of the front anchorage surface expanded slightly but remained limited, suggesting that the load primarily propagated forward. The deformation values at inter-anchorage measurement points were approximately twice those at equivalent distances on the left side, aligning with elastic superposition principles. This confirms that the surrounding rock remains in the elastic deformation stage.
Under the 5P load, the lateral deformation curve reveals a shallowing of the saddle depth at the front anchorage surface. This indicates that under increased loading, the deformation of the inter-anchorage front surface significantly intensifies due to the superposition of dual-anchor stresses. It further demonstrates that the sliding deformation of the anchorage is markedly constrained by the confinement of the surrounding rock. Simultaneously, the load-bearing confinement effect of the surrounding rock progressively transfers toward the front anchorage surface.
The deformation trend of the left-side rock mass parallel to the axial direction is shown in
Figure 8b. Its strain is significantly smaller than that of the inter-anchorage rock mass, consistent with the deformation pattern observed under the 1P load. The strain attenuation increases with distance from the rear anchorage surface, and the attenuation rate exceeds that of the inter-anchorage rock mass. This indicates that stress primarily diffuses along the axial direction.
The deformation patterns of the upper rock mass on the rear anchorage surface are illustrated in
Figure 8c,d. The strain near the anchorage is 12 με, while the strain farther from the anchorage reaches 79 με, representing increases of 96 με and 64 με, respectively. The strain at the rear anchorage surface is markedly greater than that at the front anchorage surface, aligning with the deformation behavior under the 1P load. As the distance from the rear anchorage increases, the deformation diminishes, and the weakening trend becomes more gradual compared to the 1P load condition. This suggests that the load-bearing effect of the surrounding rock progressively shifts forward, with both the range of rock mobilized by the anchorage and the deformation of the surrounding rock further expanding.
4.3. Overload Test
The third group of tests (Group III) consisted of overload tests involving continuous loading until model failure, building upon the conditions of Tests I and II. These tests aimed to investigate the deformation-to-failure behavior of the model. Monitoring data revealed the following patterns.
4.3.1. Cross-Sectional Deformation
Both the front and rear anchorage surfaces exhibited deformations, with the anchorage body consistently deforming more than the surrounding rock. The rear anchorage surface always experienced greater deformation than the front surface. The inter-anchorage rock mass deformed more significantly than the surrounding rock on the left side of the anchorage. The cross-sectional deformation profiles of the front and rear anchorage surfaces consistently maintained a double-hump shaped pattern. For the front anchorage surface within the inter-anchorage zone, the saddle region of the deformation profile gradually elevated as the anchorage load increased.
The cross-sectional deformation of the rear anchorage surface was primarily concentrated within a specific distance from the anchorage body, spanning approximately 1.4 m on either side of the midline between the dual anchors (equivalent to 1.0–1.5 times the width of the rear anchorage surface). This deformation exhibited symmetrical distribution, with rapid attenuation observed beyond this range.
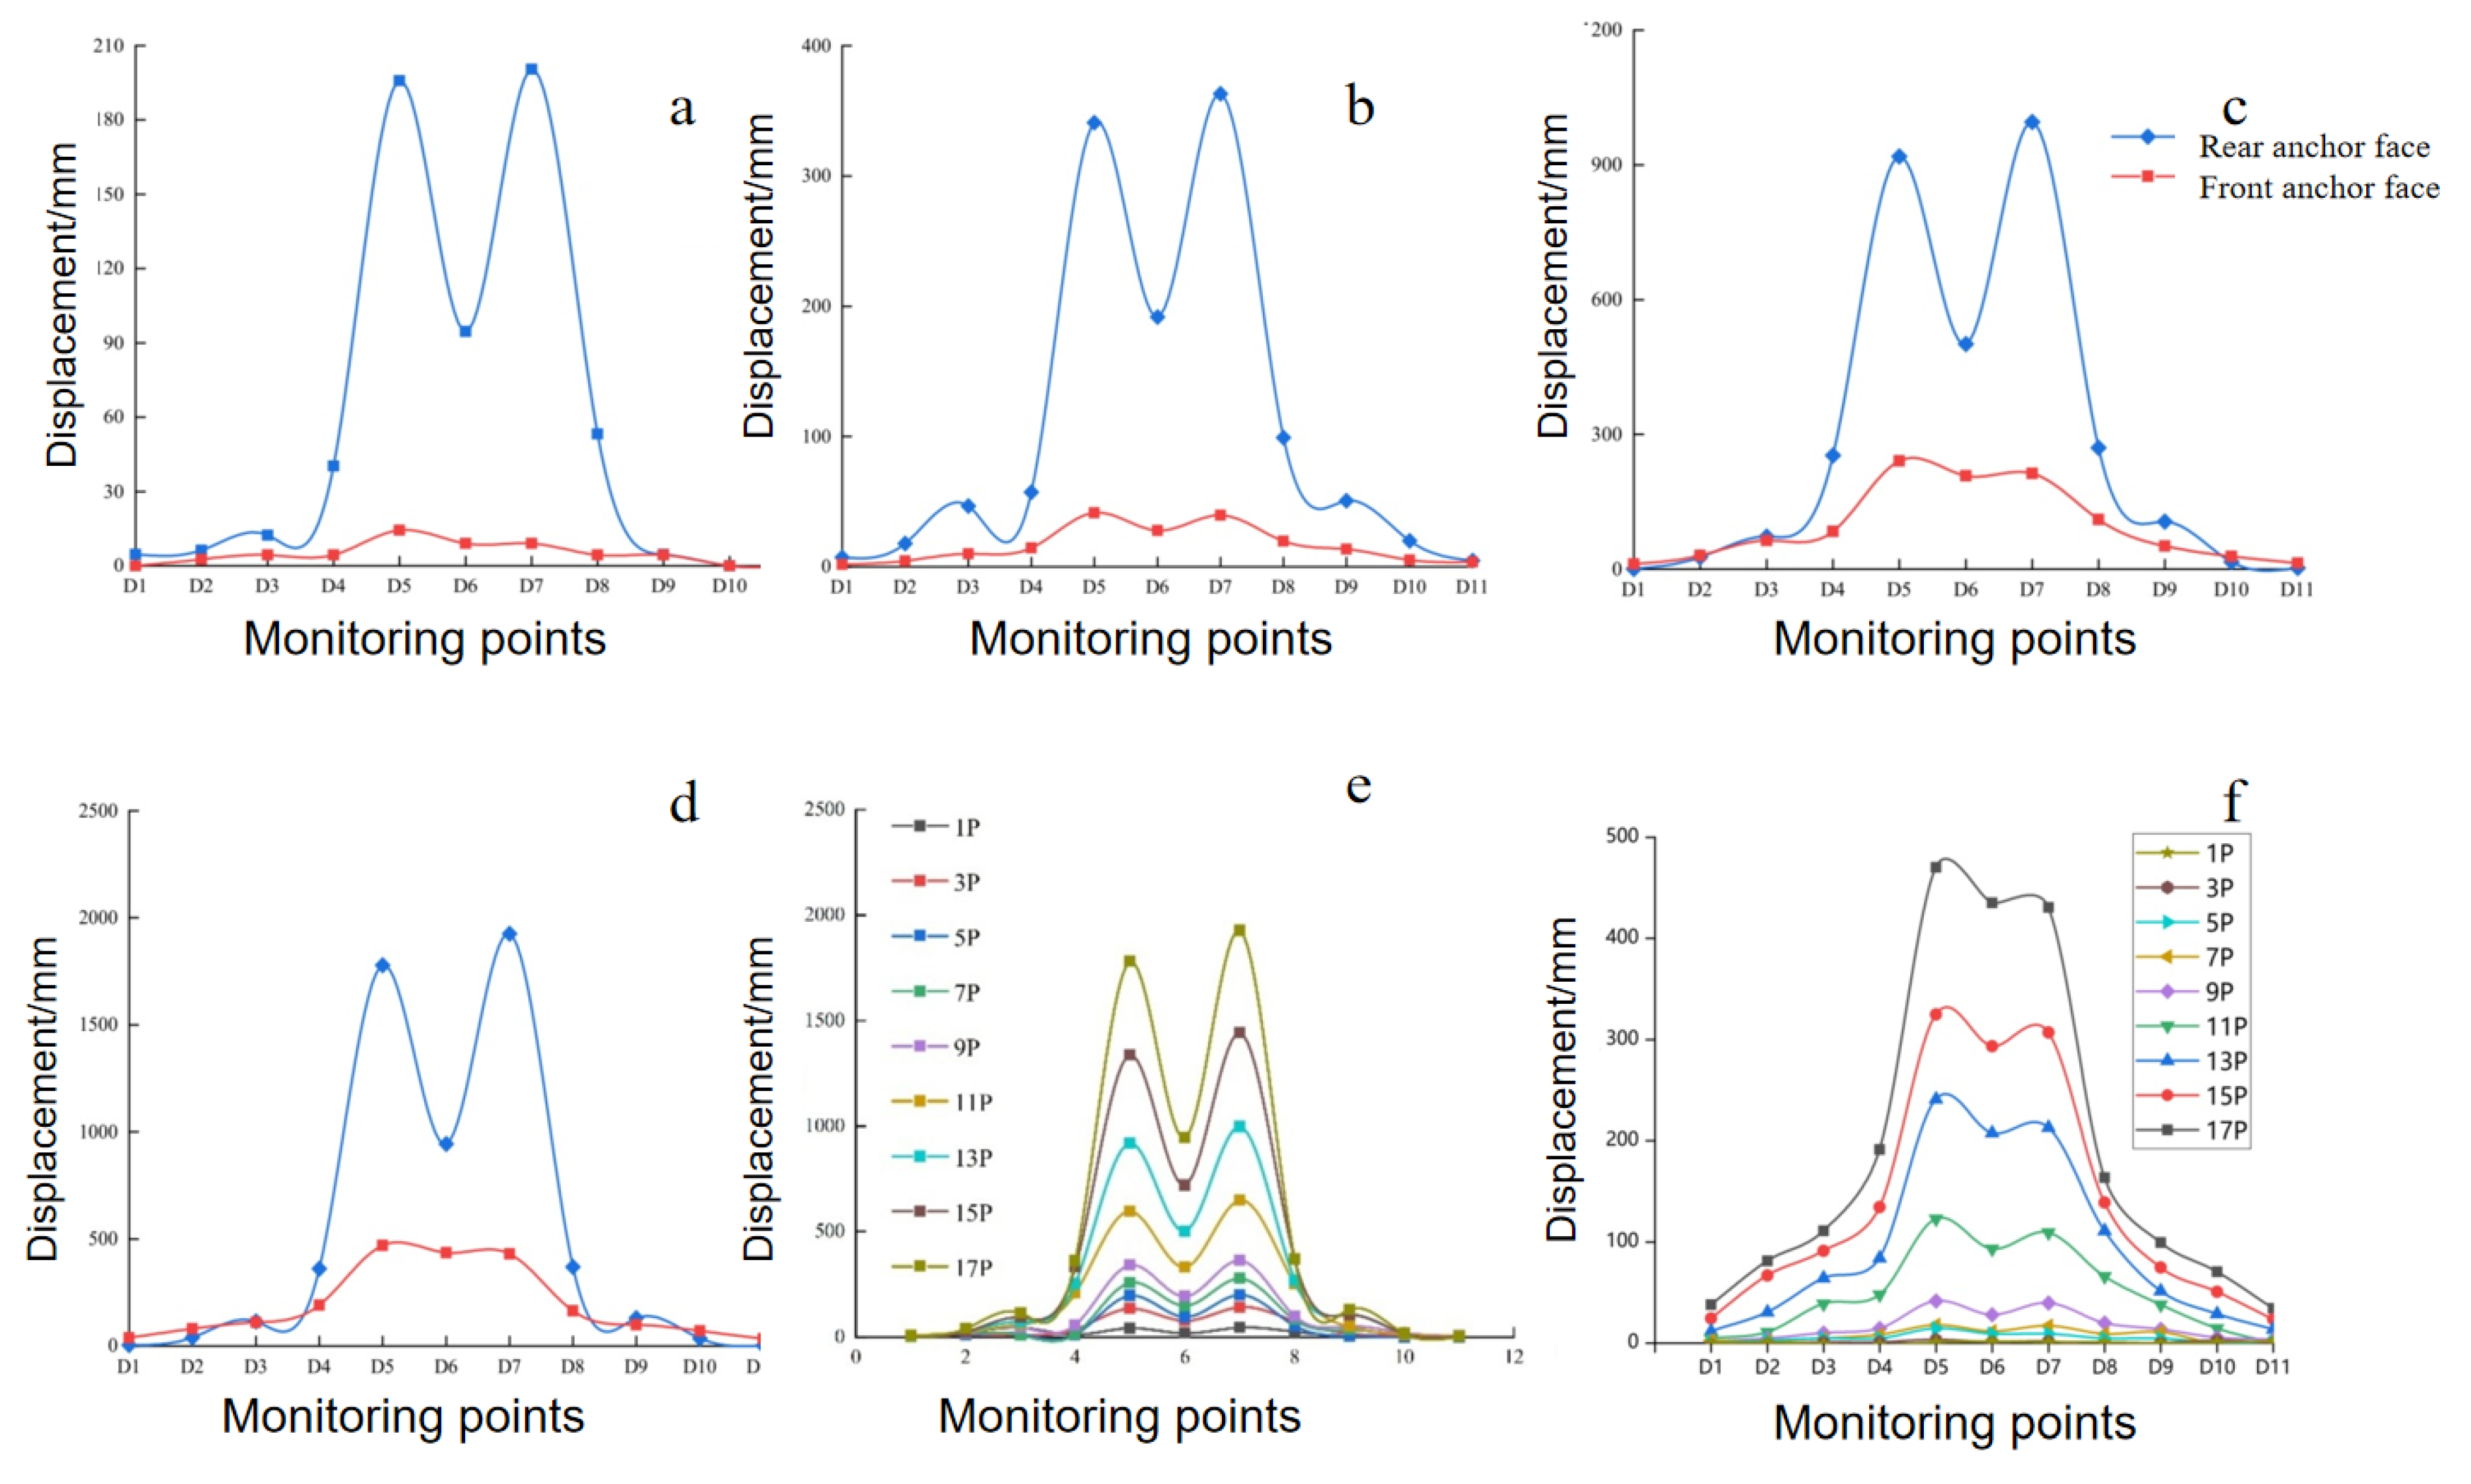
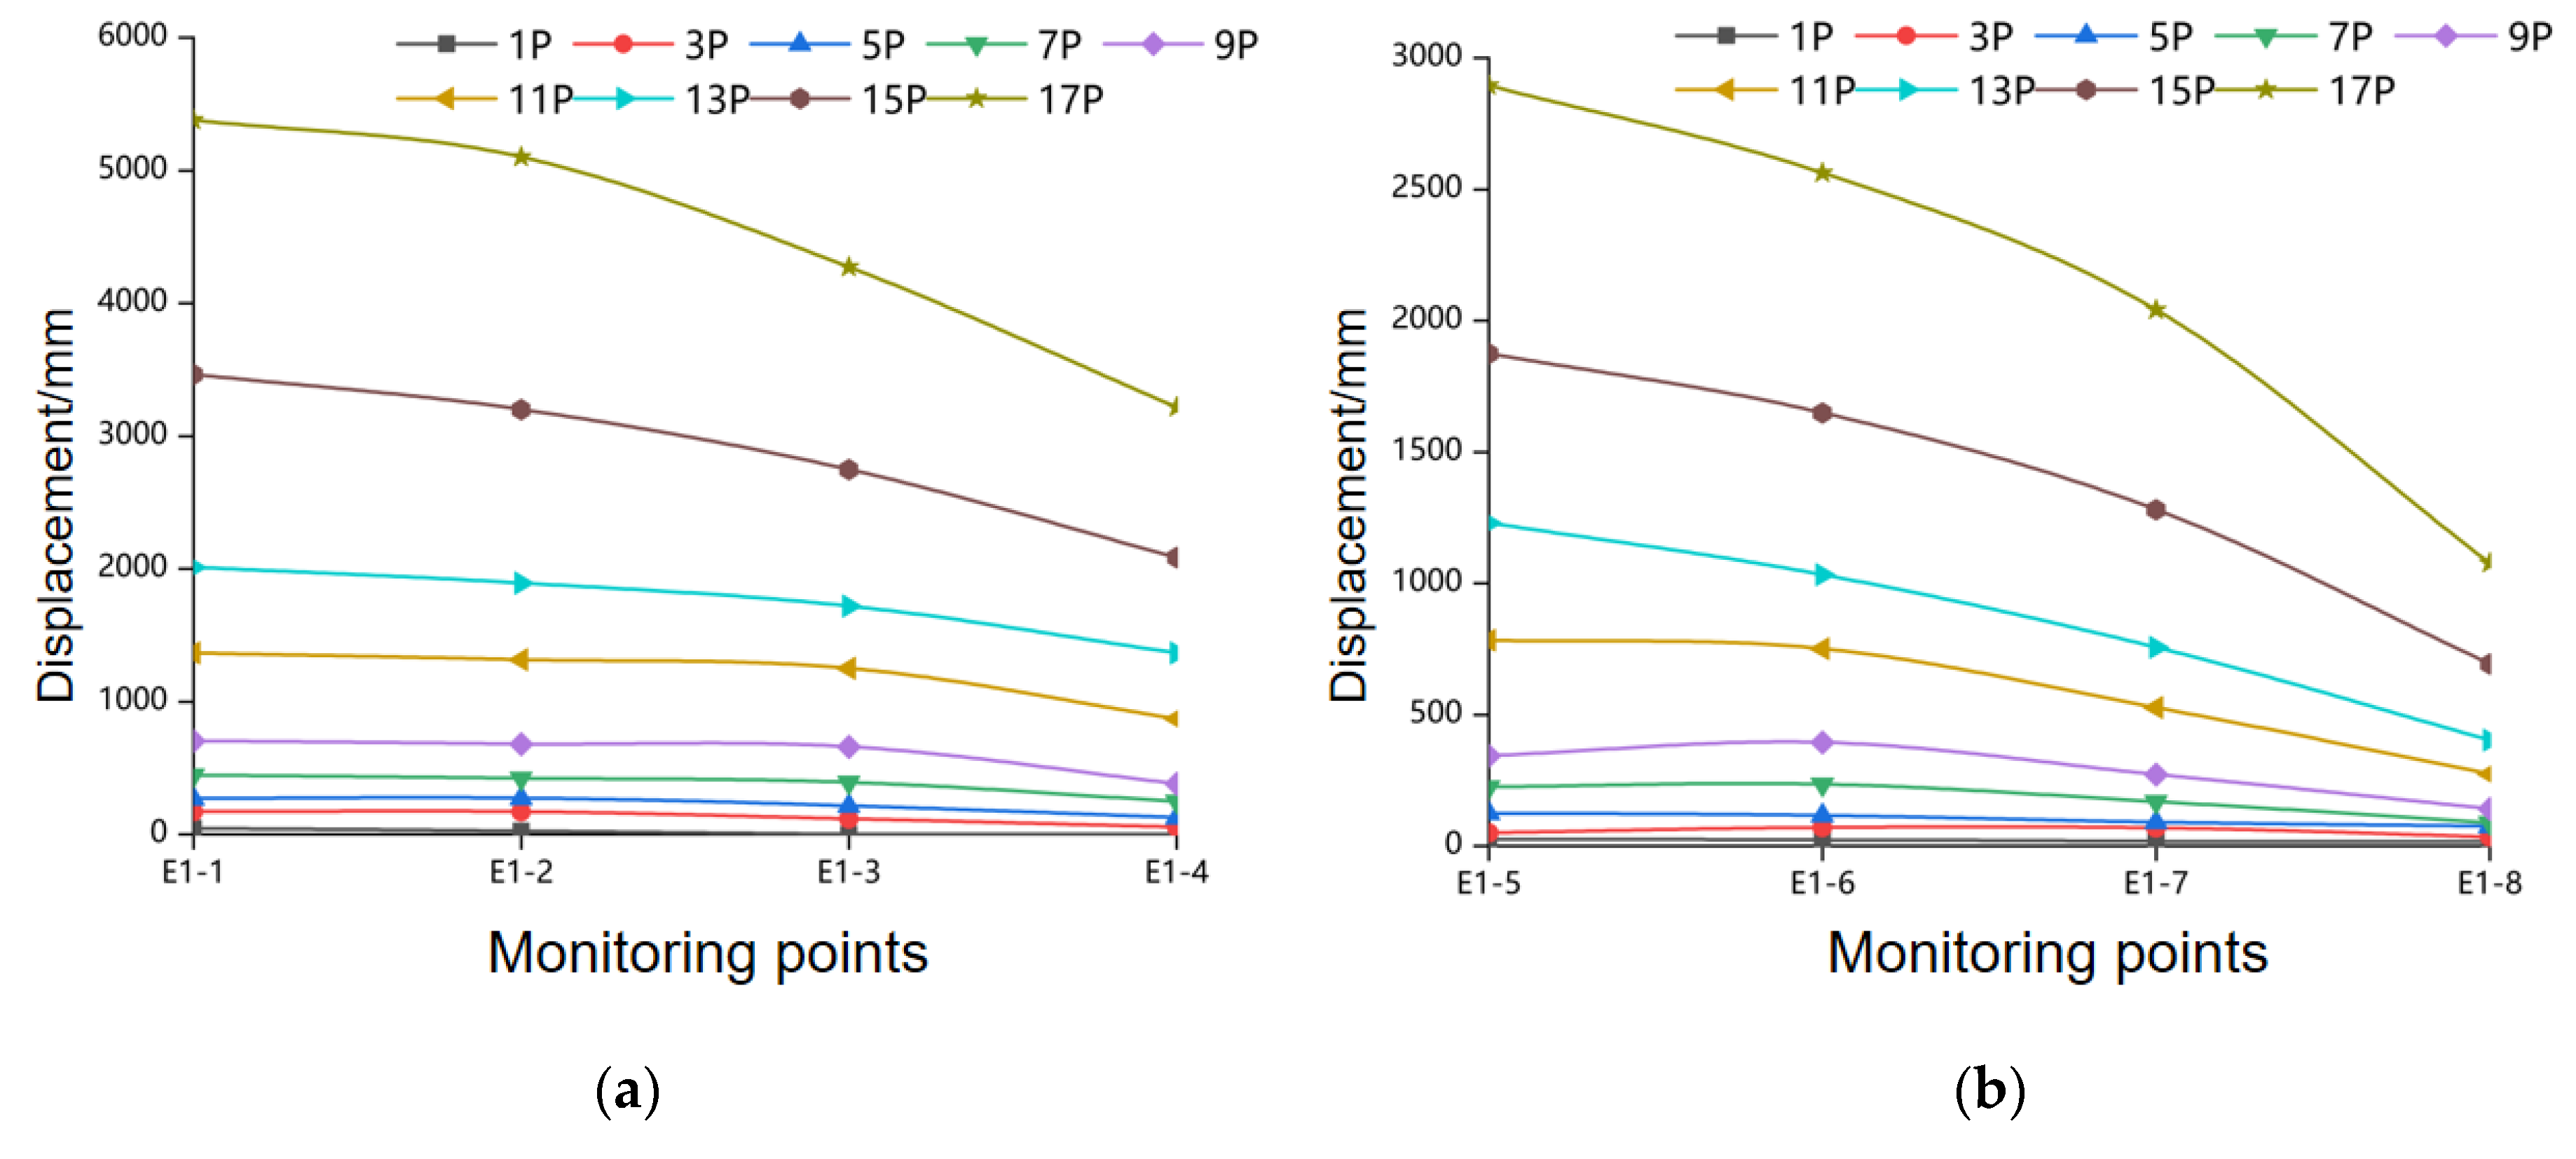
Based on the deformation trends observed at different monitoring points during the overload process, the monitoring points near the anchorage body exhibited a sharp increase in deformation at a critical load level of 9P. Below 9P, the deformation progressed linearly with load increments. Beyond 9P, the deformation transitioned to a nonlinear growth pattern. If the occurrence of this abrupt deformation surge is used as the criterion for judging anchorage instability, the overload safety factor of the model is determined to be 9P.
During the overload test, the deformation at monitoring points distant from the anchorage body was minimal, with a gradual increase in deformation observed. This indicates that the anchorage mobilized only a limited range of surrounding rock to undergo displacement until failure. Although the extent of mobilized rock increased slightly with higher loads, the increment remained constrained, shown as
Figure 9.
4.3.2. Axial Deformation
With progressive load increases, both the inter-anchorage rock mass and the left-side surrounding rock exhibited deformation trends that intensified with higher loads. The deformation of the rear anchorage surface consistently exceeded that of the front anchorage surface, as detailed in
Figure 10a,b. The inter-anchorage surrounding rock deformed more significantly than the left-side rock mass, and the deformation difference gradually increased with higher loads. This further indicates that the propagation of anchorage-induced loads is laterally constrained to a specific range, with primary transfer occurring along the axial direction.
4.3.3. Upper Rock Mass
The deformation trend of the upper rock mass above the rear anchorage surface aligns closely with the axial deformation pattern. As the load increases, the deformation intensifies, and the discrepancy in deformation between zones also grows. Deformation attenuates significantly with increasing distance from the anchorage, as detailed in
Figure 11a. This directly reveals that the tunnel anchorage induces deformation within a confined range in the cross-sectional plane, and additional load does not lead to significant further deformation beyond this range.
4.3.4. Deformation–Load Relationship at Monitoring Points
Analysis of the deformation–load curves from monitoring points reveals that at 9P, the deformation at points adjacent to the anchorage on both the front and rear anchorage surfaces exhibited nonlinear growth. In contrast, monitoring points farther from the anchorage (D10-1, D11-1, D10-2, and D11-2) showed no significant nonlinear growth characteristics, as detailed in
Figure 11b–d. This reaffirms that the influence range of the anchorage is localized, with rapid stress dissipation in the surrounding rock. Anchorage instability ultimately mobilizes failure within a limited volume of rock mass.
The overload failure test revealed that the strain in the anchorage exceeded that in the surrounding rock. After a relative displacement tendency developed between the anchorage and rock, the surrounding rock began to exert its confinement effect. As the load increased, the volume of rock mobilized by the anchorage also expanded, primarily along the axial direction, with stress gradually propagating forward. Based on the lateral and longitudinal deformation characteristics of the anchorage and surrounding rock, the load transfer predominantly occurred along the axial direction, with the lateral mobilization range of the anchorage limited to 1.0–1.5 times the rear anchorage surface width. This range did not significantly increase with higher loads. The pull-out resistance of the anchorage is determined by both the mobilized rock volume and its strength.
4.4. Destruction Mode
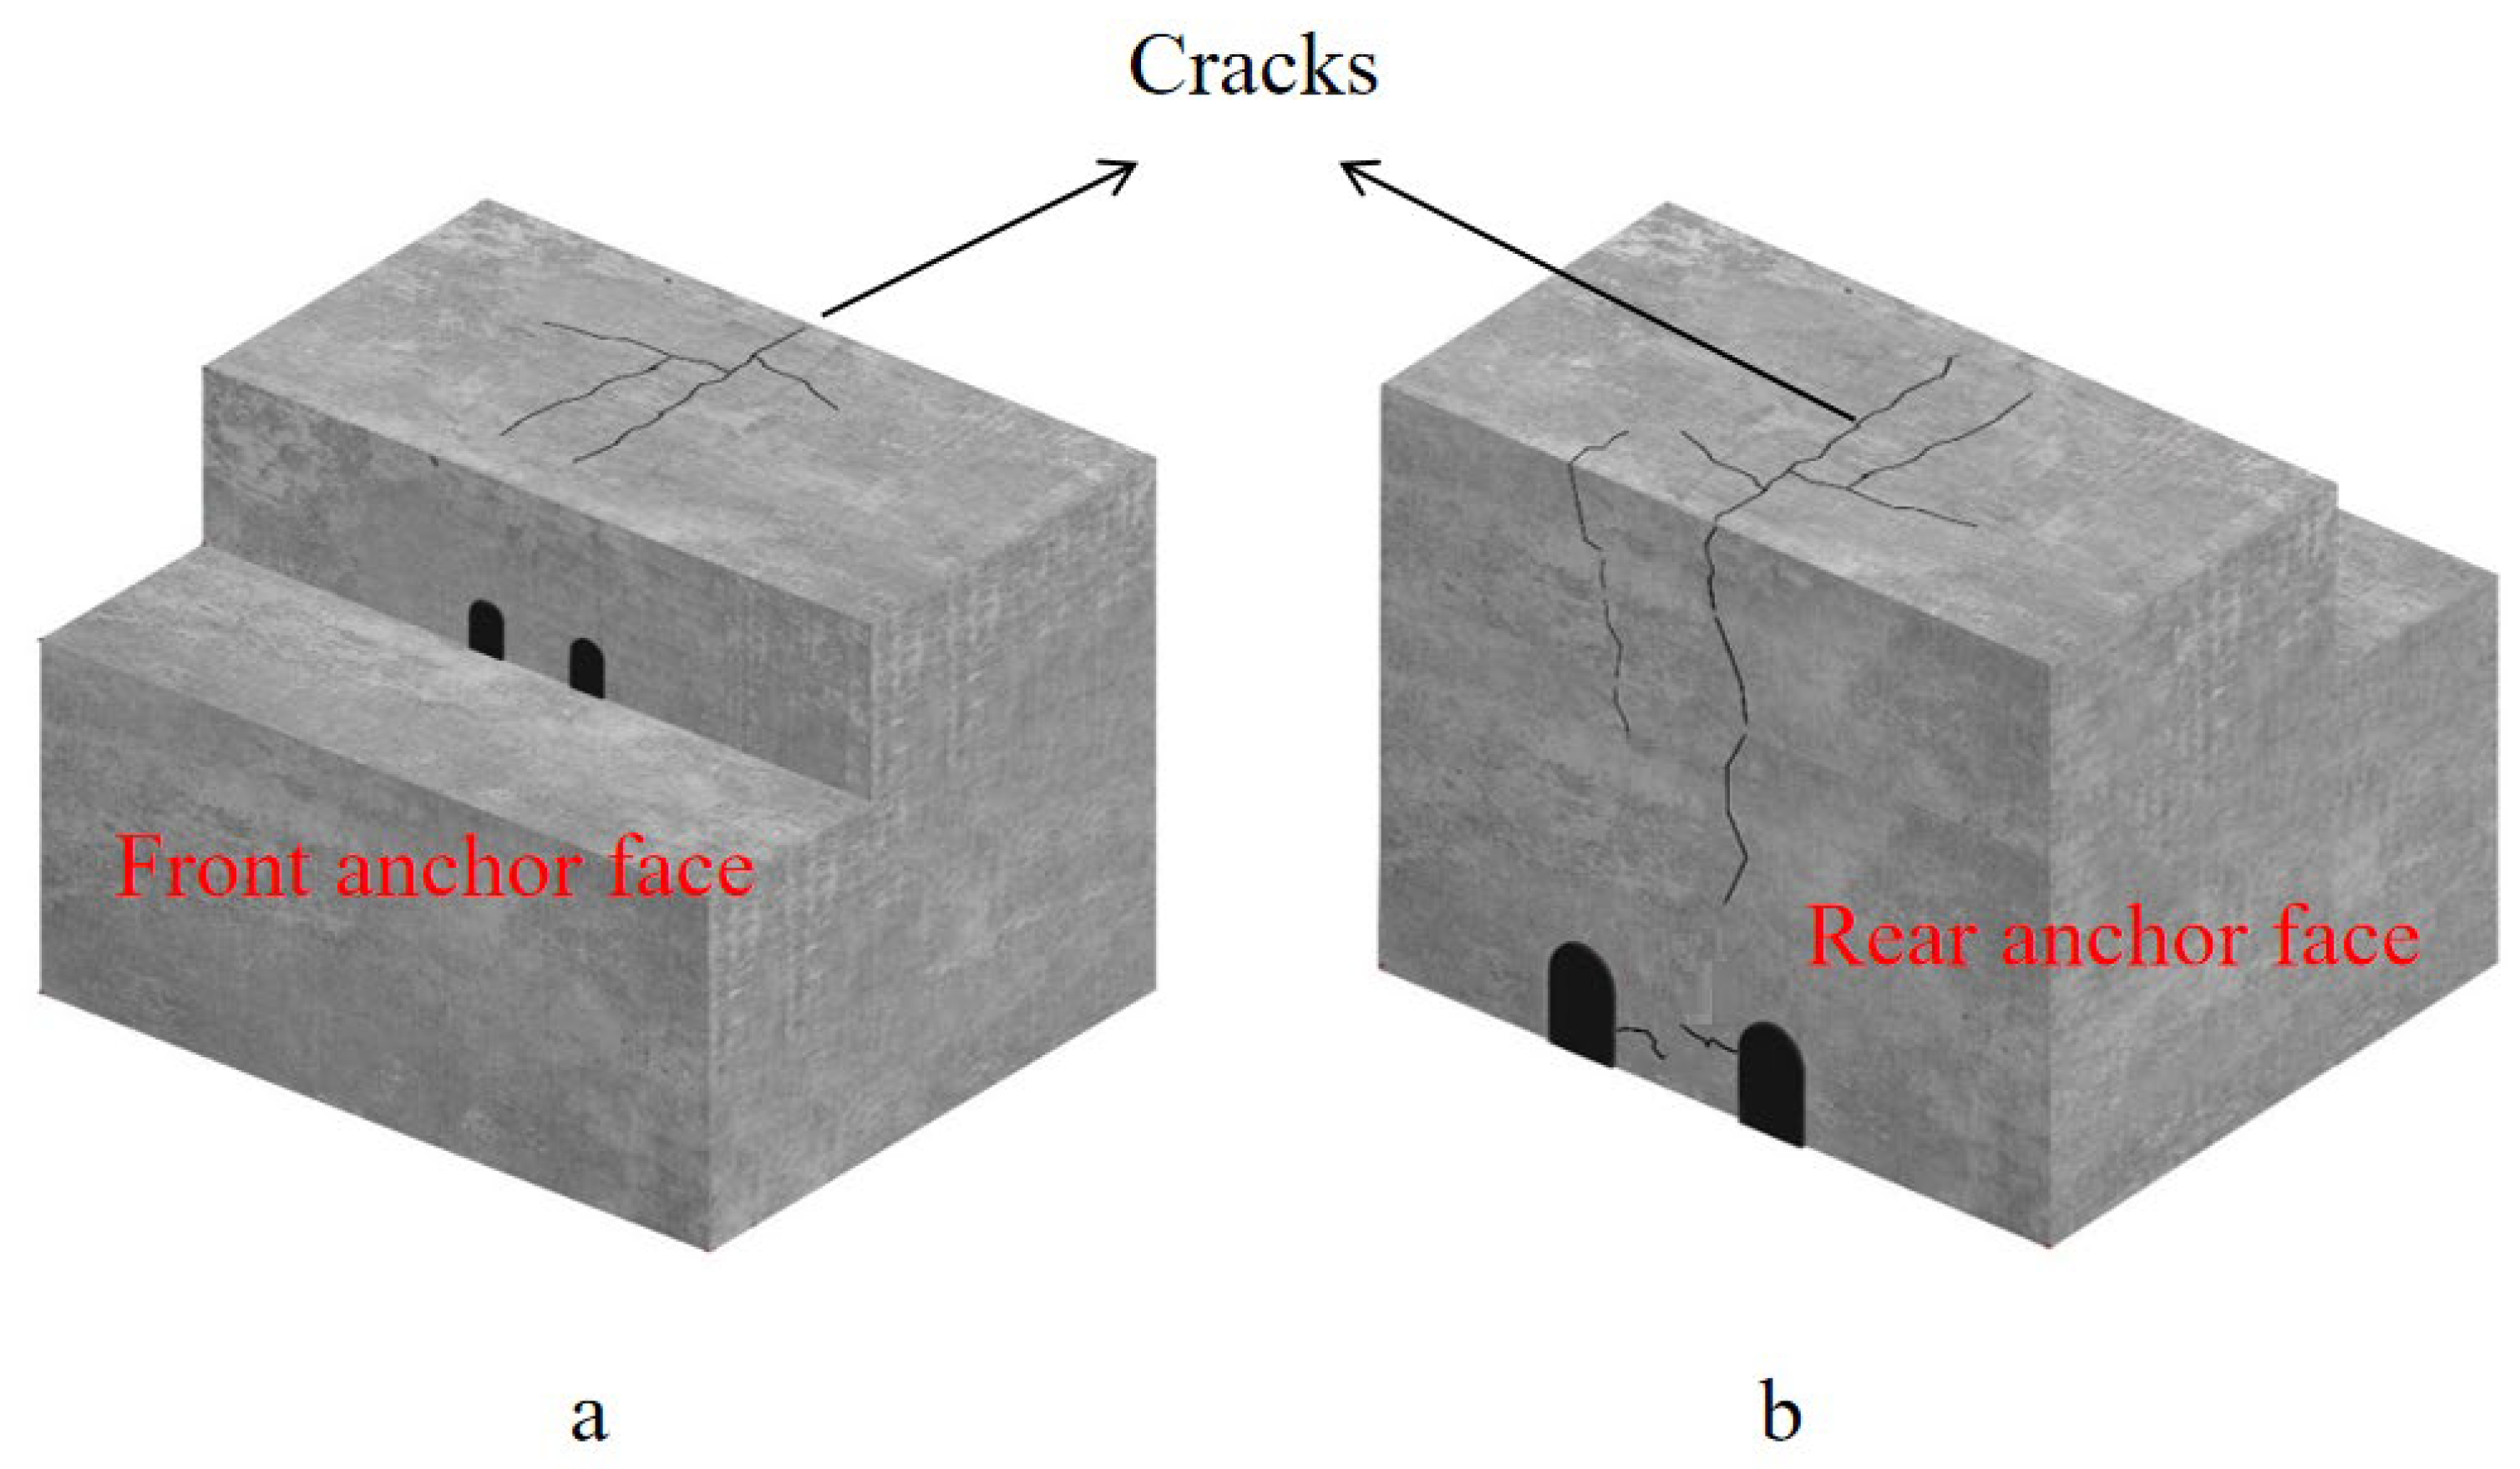
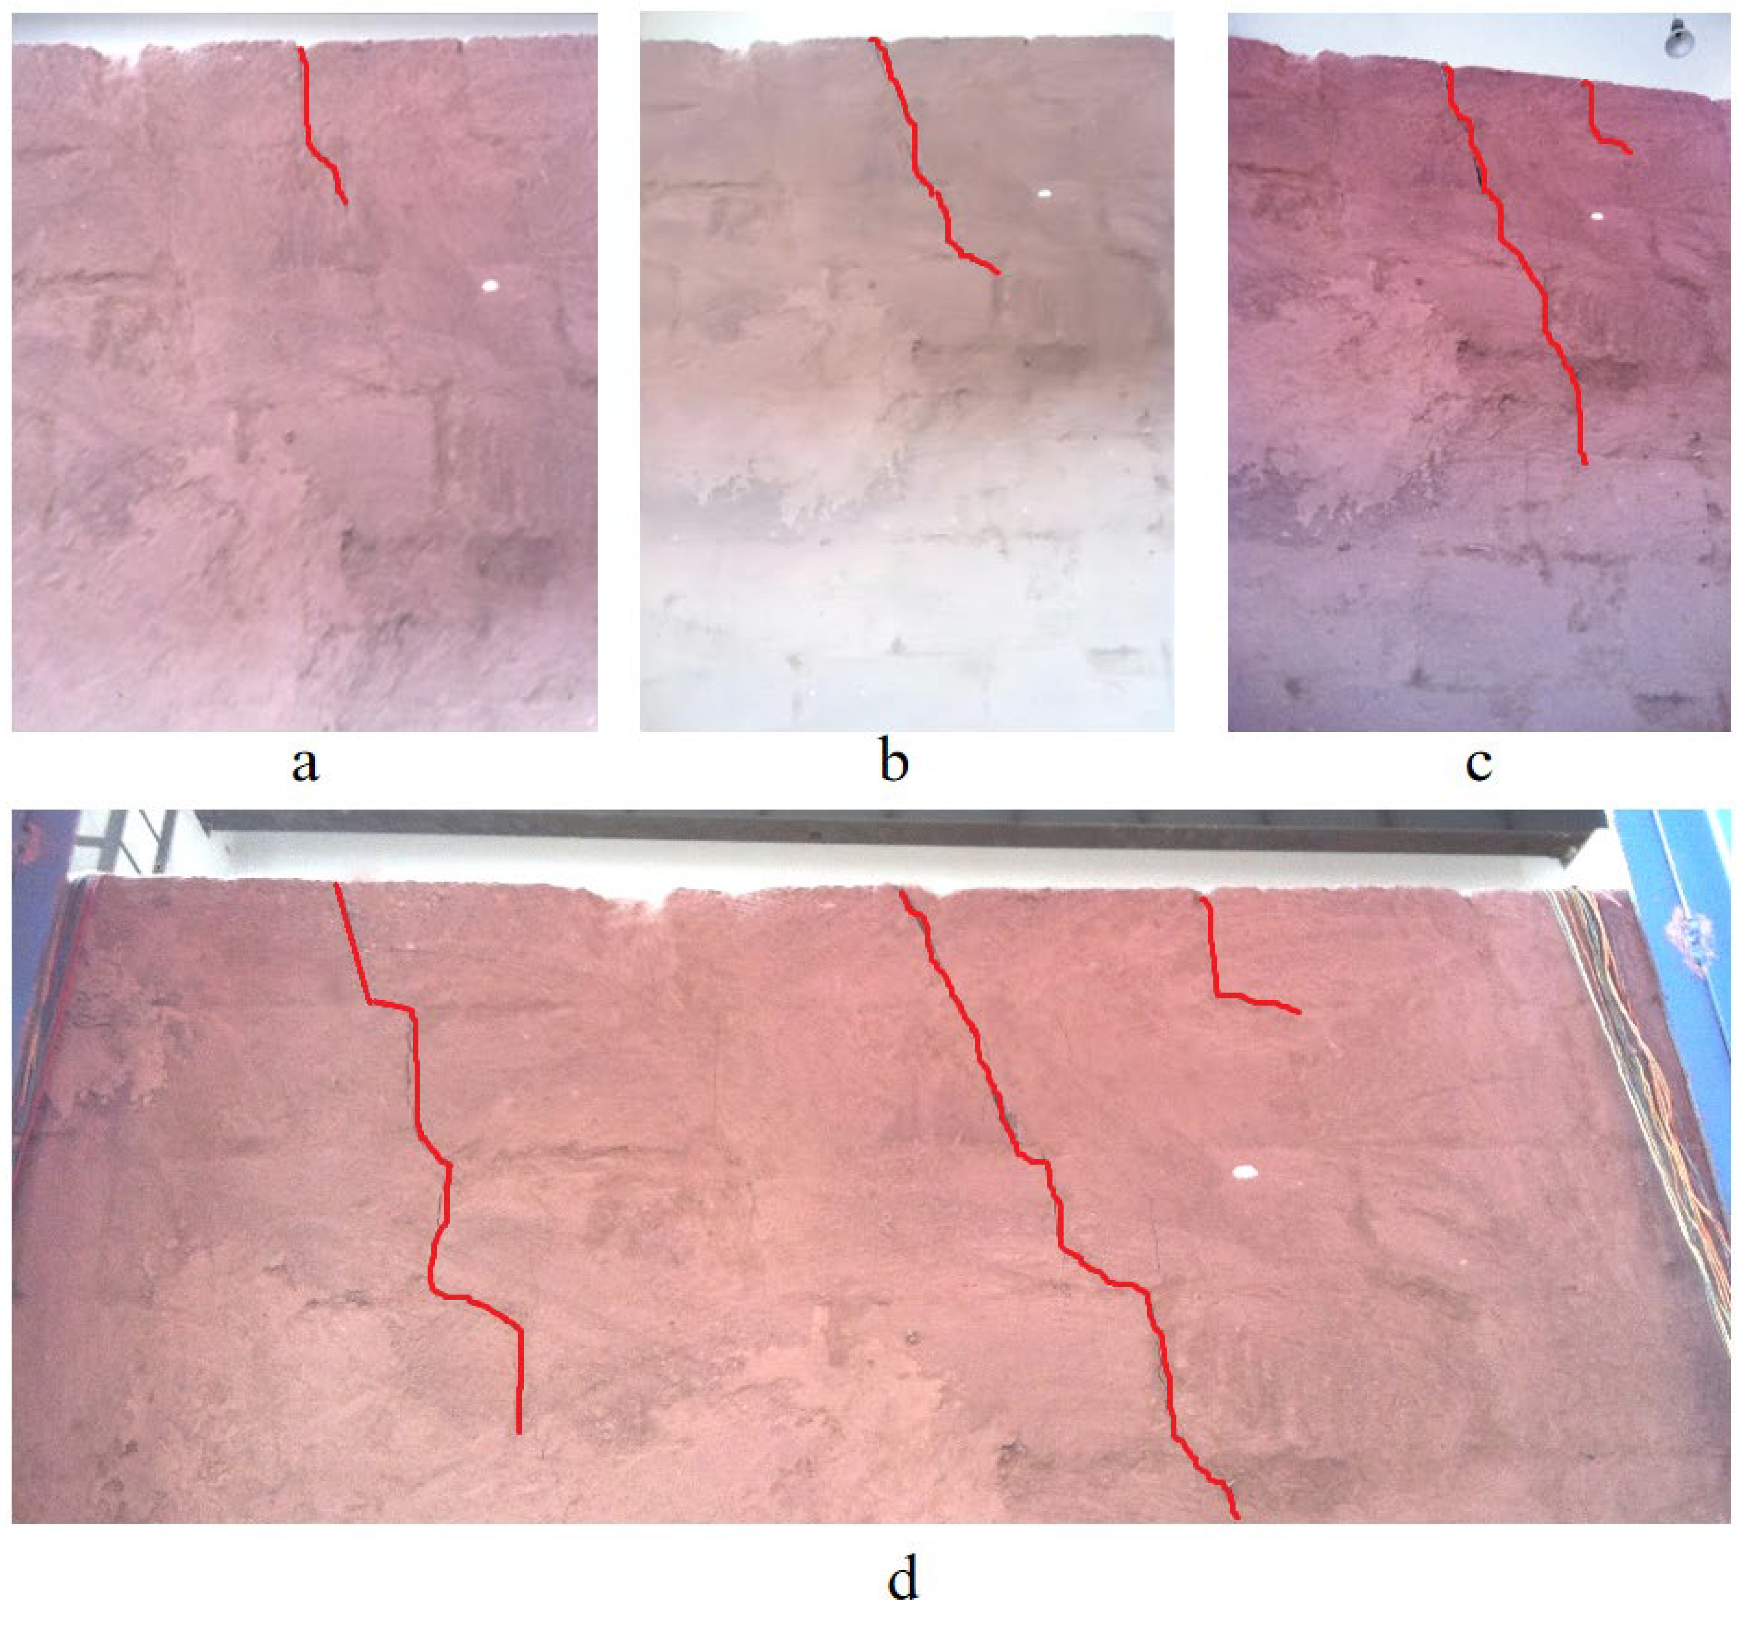
In the failure test, cracks in the model were primarily concentrated in the inter-anchorage zones and the upper rock mass above the anchorages. Between the dual anchors, the cracks predominantly exhibited connectivity, forming interconnected networks. On the model’s top surface, cracks displayed front-to-back continuity and propagated deeper into the structure, as detailed in
Figure 12.
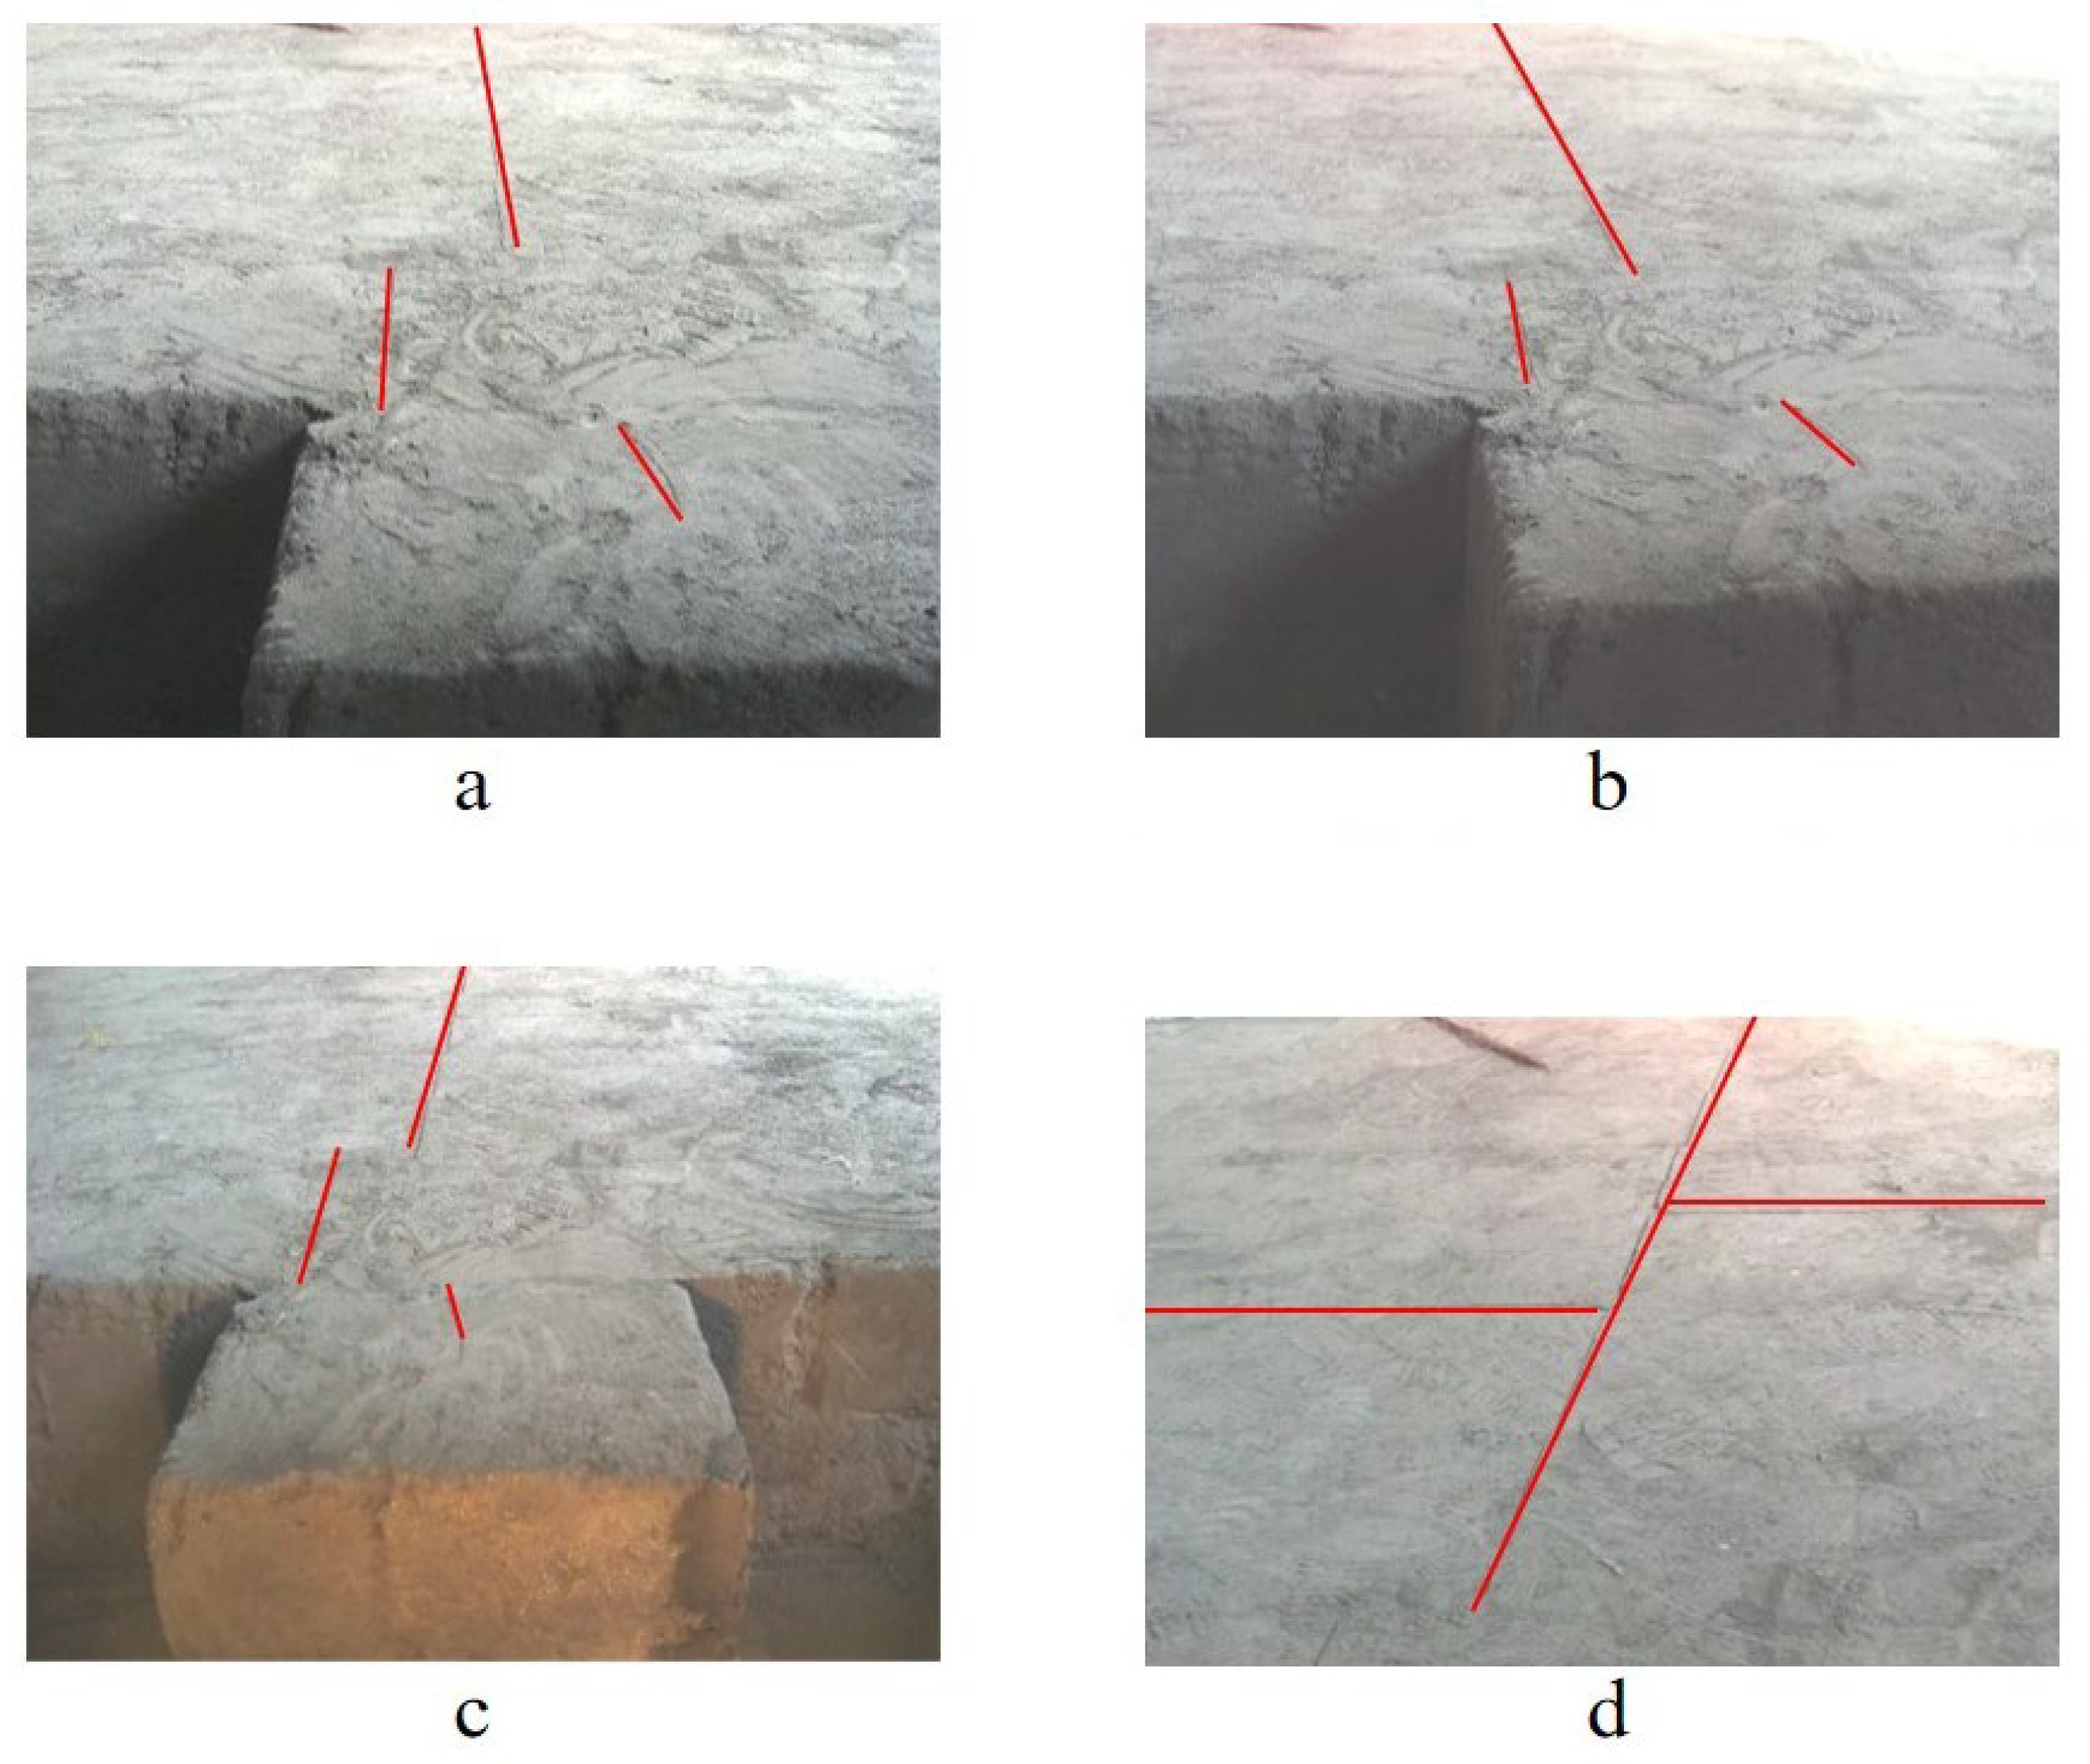
When the load was below 9P, the surrounding rock remained in the elastic deformation stage, with no visible cracks on the model’s surface. During the 9P–11P loading range, microcracks began to form in the shallow layers of the surrounding rock. At 11P, microcracks emerged near the symmetry axis on the model’s top surface, as shown in
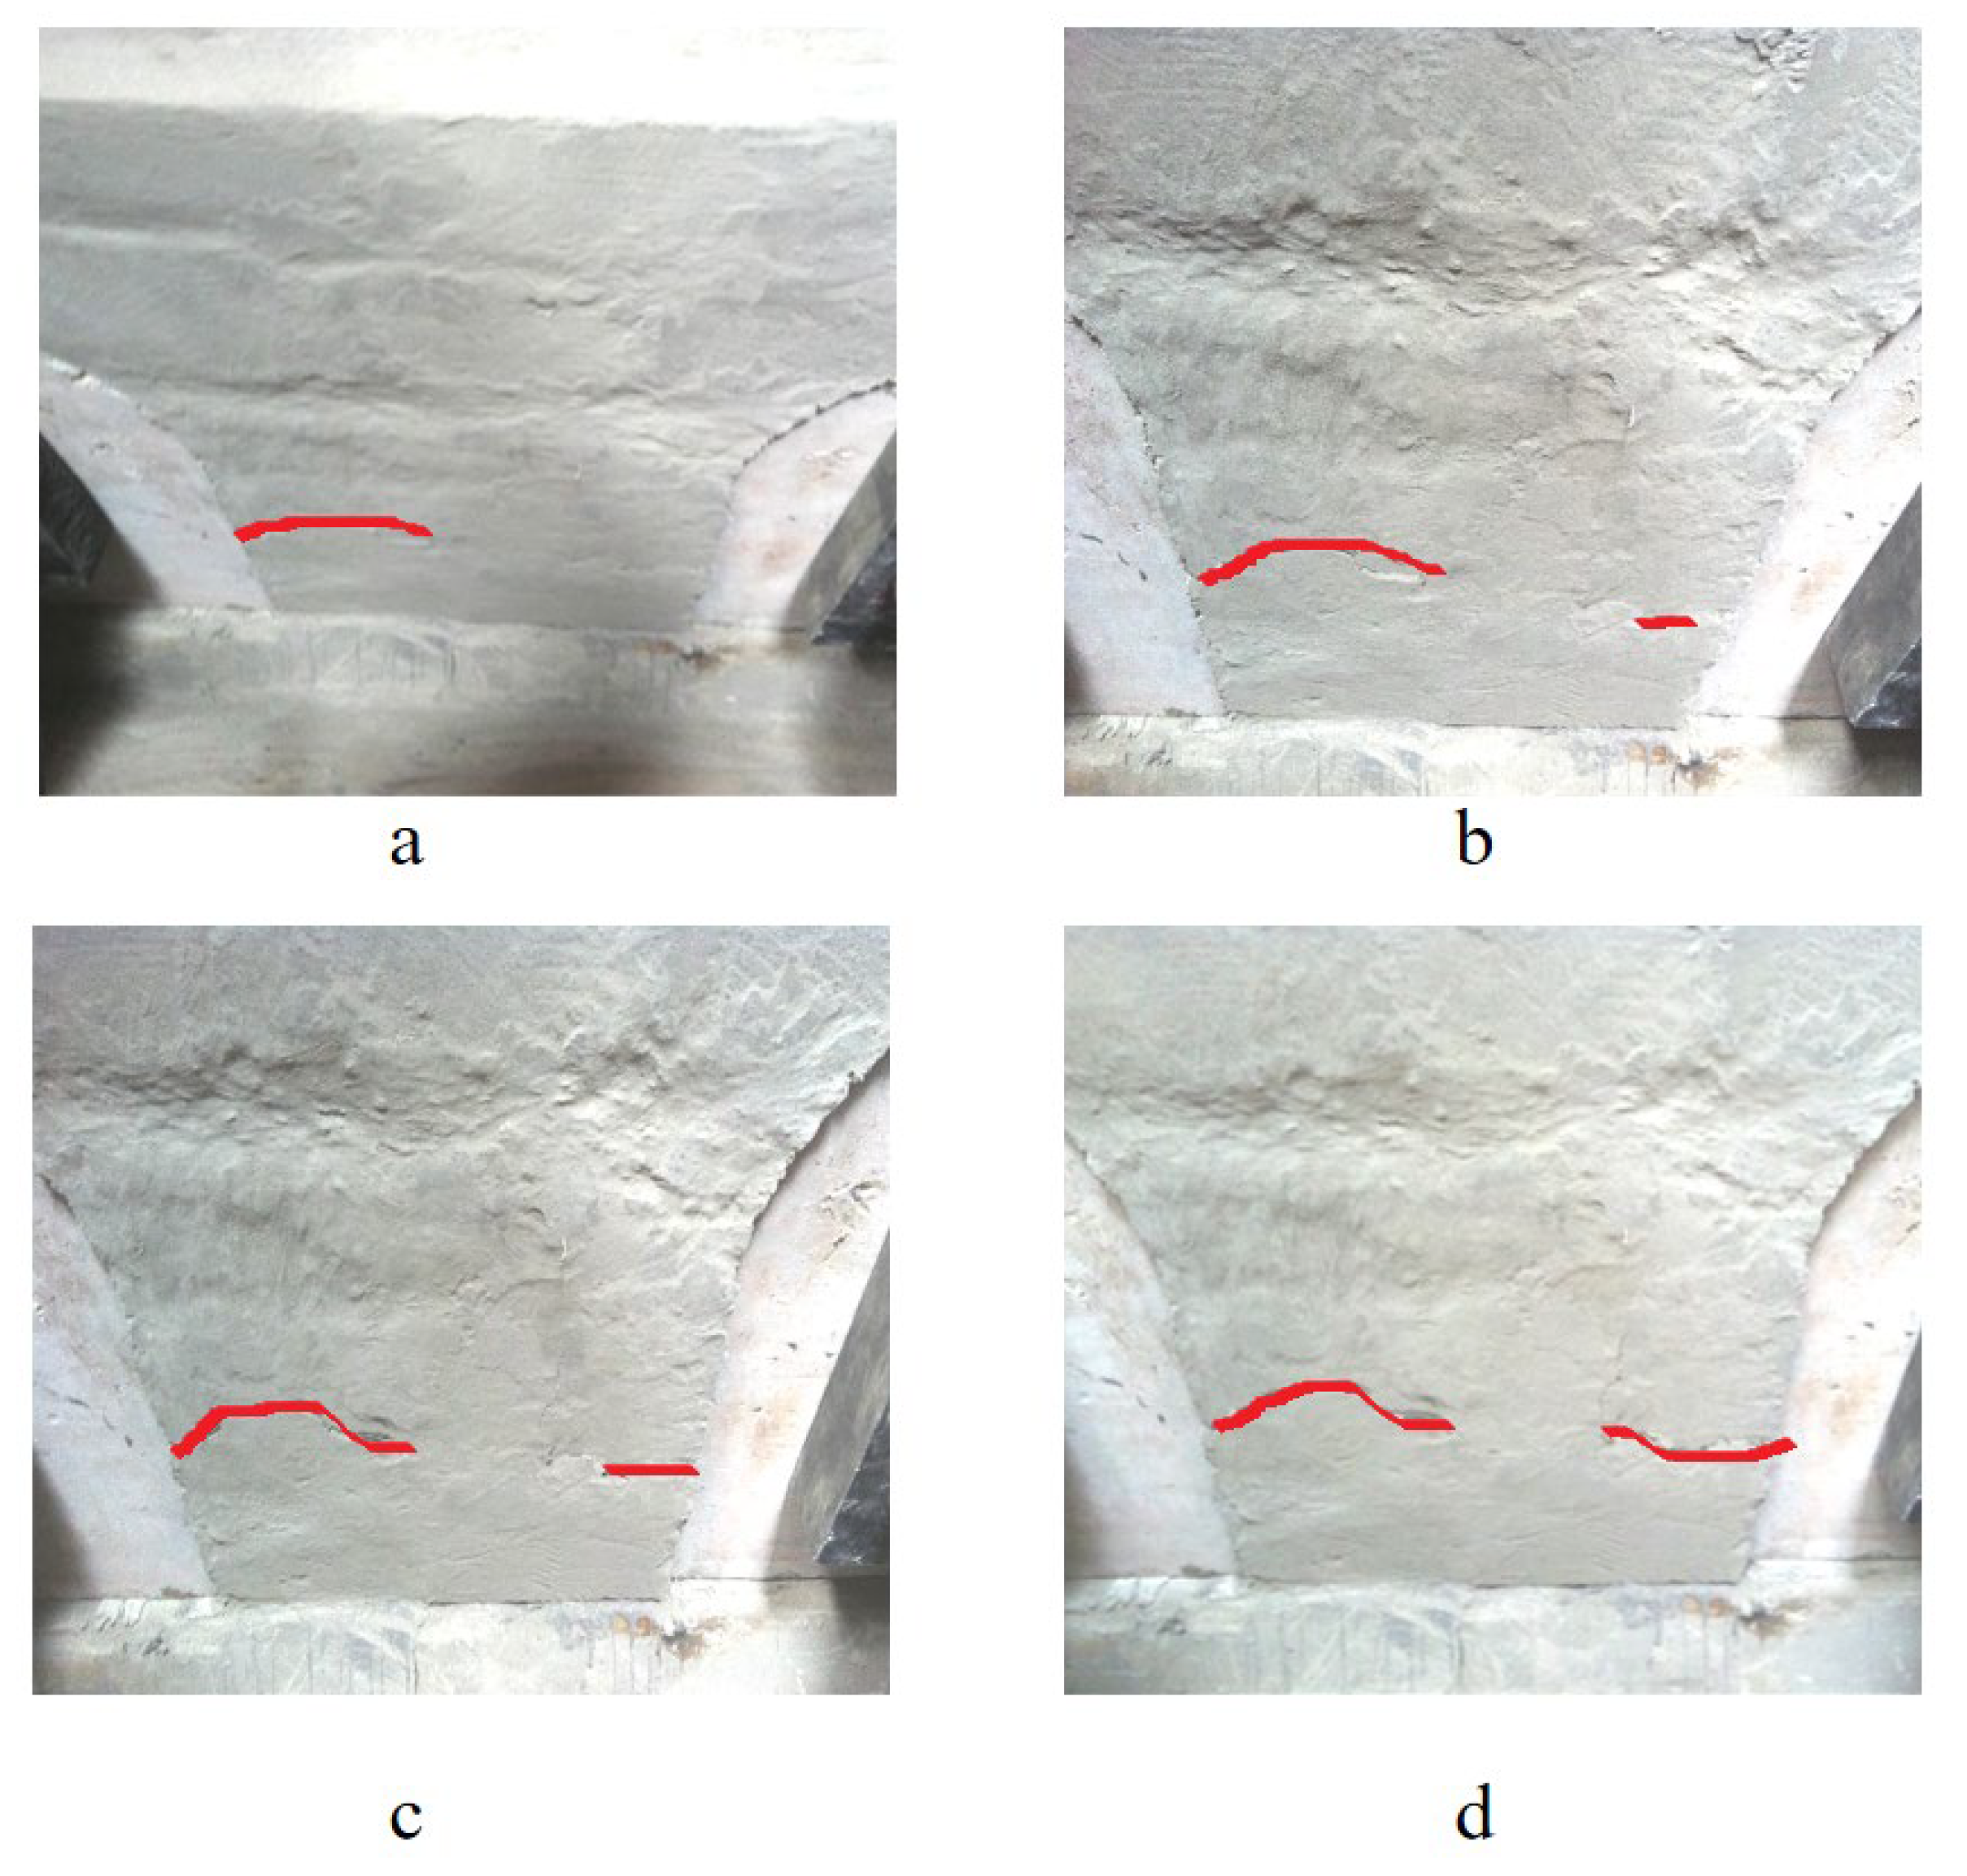
Figure 13a. Under sustained loading for 30 min, these cracks propagated vertically into deeper regions. Simultaneously, shear-induced microcracks developed in the inter-anchorage surrounding rock, detailed in
Figure 14a.
After the load increased to 12P, the model underwent elastoplastic deformation, with cracks progressively propagating and expanding. When the load was raised to 13P, branching cracks emerged from the pre-existing cracks on the model’s top surface, and the width of the primary cracks further increased, as detailed in
Figure 13b. Simultaneously, shear-induced cracks between the dual anchors continued to develop laterally, accompanied by an increase in fine secondary fissures. The two main cracks exhibited a tendency to interconnect, as illustrated in
Figure 14b.
When the load increased to 15P, the cracks on the top surface continued to propagate, with their apertures showing significant widening. Branching cracks began to develop laterally (as shown in
Figure 13c) at a rapid rate, while the depth of the primary cracks also increased sharply. The front surface cracks extended to approximately mid-depth of the rock mass. Between the dual anchors, the transverse cracks further expanded, nearly interconnecting, with crack apertures continuing to widen and minor secondary fissures proliferating. Shear displacement along the cracks intensified, as detailed in
Figure 14c.
After the load was increased to 17P, difficulties in load stabilization and application were observed. The crack openings at the top of the tunnel anchorage rock mass further expanded, with noticeable propagation. Transverse development of cracks became evident, as existing branch cracks continued to extend and generate new branches. The main fracture had essentially penetrated through the depth, with the front-face crack depth reaching two-thirds of the thickness. The transverse shear crack between the dual anchors had completely penetrated, showing rapid expansion, while new vertical shear cracks emerged and developed swiftly. For details, refer to
Figure 13d,
Figure 14d and
Figure 15.
From the analysis of crack morphology, the rock mass between the dual anchors exhibited tension–shear composite failure. The anchorages dragged the surrounding rock mass forward during deformation. Due to the inclined orientation of the anchors, the lower inter-anchorage surrounding rock was subjected to geometric constraints, resulting in localized shear deformation. This phenomenon was previously revealed in the deformation patterns observed in inclinometer boreholes during 1:12 scaled physical model tests. As the load-induced shear deformation accumulated, cracks initiated and progressively interconnected.
Based on the deformation characteristics of fractures, a tension–shear failure zone exists in the rock mass above the anchorage. When the load increases to a critical threshold, the anchorage undergoes substantial displacement. Due to its wedge-shaped geometry, the forward sliding of the anchorage generates significant compressive stress in the overlying rock mass. Under end constraints, the top rock mass deforms in a manner analogous to a beam or slab: when subjected to central loading, tensile stresses develop at the bottom surface, leading to crack initiation and propagation.
Except for minor cracking along the mortar joints in the surrounding rock at the top, no mortar joint cracking was observed in the anchor intervals or other areas. When the load was less than 9P, the deformation of the surrounding rock remained in the elastic state, indicating that the sandstone bands in the K1l1 stratum had little impact on the uplift resistance of the tunnel anchor.
5. Conclusions
Based on field data, this study conducted an indoor physical model test of tunnel anchorage under simulated stratigraphic conditions using a 1:40 scale. The test series included design load tests, 5P overload tests, and failure tests, yielding the following conclusions.
5.1. Deformation Response and Failure Evolution Under Loading
Under the 1P design load, the deformation of the anchorage and surrounding rock exhibited a near-symmetric “double-hump” shape, with the anchor body experiencing the maximum displacement. The deformation of the surrounding rock decayed exponentially with increasing distance (1–2 times the rear anchor face width), indicating that the load was primarily transmitted axially through the rear anchor face, with rapid transverse stress attenuation. At 5P loading, the deformation pattern remained similar to the 1P stage, but the displacement difference between the front and rear anchor faces significantly increased, revealing the dominant role of the rear rock clamping effect in the anti-pull mechanism. Overload tests identified 9P as the safety threshold: below 9P, deformation increased linearly, with the surrounding rock in an elastic state; between 9P and 11P, nonlinear deformation surges occurred, accompanied by microcracks at the rear anchor face and between the dual anchors; beyond 11P, cracks propagated rapidly (exhibiting shear-tensile failure between anchors and tensile failure at the crown), leading to system instability at 17P with complete load loss.
5.2. Anchorage–Rock Interaction Mechanism and Failure Modes
The anti-pull capacity of the anchorage relies on the clamping effect of the rear rock mass, concentrated within 1–2 times the rear anchor face width. The load transfers axially into deeper strata with limited transverse diffusion. The failure process displayed distinct zonal characteristics: the rock between dual anchors underwent shear-tensional composite failure due to anchor dragging and geometric constraints, while the crown rock failed in tension via a beam-slab bending mechanism. The tests revealed negligible influence of sandstone strips on anti-pull performance and minimal joint cracking, suggesting limited impact of formation heterogeneity on overall stability.
5.3. Engineering Safety Threshold and Design Implications
The results recommend an overload safety factor of 9P for tunnel anchorage design, with operational loads controlled within this range to prevent plastic damage. Reinforcement efforts should prioritize the 1.5× rear anchor face width core zone (stress concentration area) and the inter-anchor rock mass (shear-tension sensitive zone), while tensile crack propagation at the crown requires mitigation. The low sensitivity of sandstone strips permits simplified local reinforcement, optimizing resource allocation. These findings provide critical parameters and theoretical support for anchorage design, monitoring, and risk management.
5.4. Design Optimization and Monitoring Strategies Based on Failure Mechanisms
Based on the observed deformation response and failure modes, this study proposes the following targeted recommendations for the design, reinforcement, and monitoring of tunnel anchorages: Definition of Critical Reinforcement Zones and Thresholds: The core load-bearing area is definitively confined within 1.5 times the width of the rear anchor face (B). Design and reinforcement must prioritize this zone. The rock mass between the dual anchors is identified as a “shear–tensile sensitive zone”, requiring enhanced resistance against composite failure. The crown area above the anchorage is a “tensile fracture zone”, where measures to control bending-induced tensile cracking are critical. Design Optimization Suggestions: Reinforcement structures (such as rock bolts or grouting) should be concentrically arranged within the core zone (1.5B) to maximize the clamping effect. A specific structural reinforcement design (e.g., employing high-strength micro-piles or oblique grouting) is recommended for the inter-anchor rock mass to improve its shear and tensile resistance. For the crown, the application of pre-stressed anchor cables is suggested to suppress the formation and propagation of tensile cracks. The confirmed minimal impact of sandstone strips allows for the optimization of reinforcement layout, concentrating resources on the aforementioned critical zones, thereby enhancing cost-effectiveness. Operational Monitoring and Early-Warning Strategy: Real-time monitoring systems should be deployed to track displacement at the front and rear anchor faces. A sustained nonlinear increase in the displacement difference between the front and rear faces serves as a key indicator of the weakening of the rear rock mass’s clamping effect and the onset of plasticity. Acoustic emission or microseismic monitoring should be focused on the rear of the anchorage and the area between anchors; a sudden surge in event counts provides an early warning for crack initiation (around the 9P threshold). Regular visual inspections should specifically examine the crown for signs of tensile cracking. Setting a displacement growth rate alarm threshold at 80% of the 9P load level is recommended to ensure sufficient warning time for intervention.

