Article

Influence of the Process-Related Surface Structure of L-PBF Manufactured Components on Residual Stress Measurement Using the Incremental Hole Drilling Method

1
Faculty of Electrical Engineering, Mechanical Engineering, Industrial Engineering, HS Anhalt University of Applied Sciences, Bernburger Straße 55, 06366 Koethen, Germany
2
Faculty of Mechanical Engineering, OTH Regensburg, Seybothstraße 2, 93053 Regensburg, Germany
*
Author to whom correspondence should be addressed.
Appl. Sci. 2025, 15(18), 9861; https://doi.org/10.3390/app15189861
Submission received: 14 July 2025 / Revised: 15 August 2025 / Accepted: 2 September 2025 / Published: 9 September 2025

Abstract

Laser Powder Bed Fusion (L-PBF) parts combine geometric freedom with process-induced rough surfaces that challenge residual-stress metrology. We evaluated the accuracy of the incremental hole-drilling (IHD) method with electronic speckle pattern interferometry (ESPI) by applying defined stresses via four-point bending to stress-relieved AlSi10Mg coupons, rather than measuring unknown process stresses. Flat specimens (2 mm, thin per ASTM E837) were analyzed on up-skin, side-skin, and CNC-milled surfaces; thin-specimen calibration coefficients were used. After a preliminary inter-specimen check (three specimens per surface; spread < 8 MPa), one representative specimen per surface was tested with three drill sites to assess intra-specimen uniformity. Measured IHD–ESPI stresses agreed best at 70 MPa: deviations were ~4.1% (up-skin), 6.0% (side-skin), and 6.24% (CNC-milled). At 10 MPa the relative errors increased (23.6%, 18.4%, and 1.40%), consistent with reduced ESPI signal-to-noise and fixture compliance in the low-stress regime. At 140 MPa, deviations rose again (21.1%, 14.3%, and 13.1%), reflecting operation near the ~60% Rp0.2 elastic limit of hole-drilling and potential local plasticity. Surface-dependent artifacts also mattered as follows: the side-skin required no coating and performed comparably to CNC-milled, whereas the up-skin’s roughness plus matting spray introduced fringe distortions and chip/coating debris near the hole. This controlled study indicates that IHD–ESPI can provide reliable results on L-PBF AlSi10Mg in the mid-stress range when surface preparation, coating, and rig compliance are carefully managed. Limitations include excluding down-skin surfaces and testing only one specimen per condition; thus, results should be generalized cautiously.

1. Introduction

Laser powder bed fusion (L-PBF) is a key technology in additive manufacturing with metals and has become particularly well established in aerospace and medical technology. The technology is characterized by a high degree of design freedom and a wide range of materials, which means that even complex and bionic structures can be realized without tool-related restrictions [1,2]. The advantages include material and weight savings as well as shorter production cycles, especially for small production batches.
Despite these advantages, L-PBF components face challenges such as high residual stresses and insufficient surface quality. These residual stresses result from rapid, localized cooling processes and can lead to deformation or cracking [3]. Residual stresses also influence component strength depending on their magnitude and direction [4,5,6]. Thermal gradients during the L-PBF process lead to complex stress distributions [7]. Residual stresses are mechanical stresses without external loading that arise due to inhomogeneous shape changes [3,8]. They are divided into three types according to their spatial scale [9,10]:
-
Type I (macro residual stresses):
Macroscopic stresses that can lead to distortion.
-
Type II (micro residual stresses):
Stresses between microstructural areas, e.g., grains.
-
Type III (micro residual stresses):
Local stresses within the crystal structure.
The analysis of macro residual stresses is particularly relevant in terms of measurement technology, as these stresses can promote component deformation or cracks [3]. Destructive, semi-destructive, and non-destructive methods are available for analyzing residual stresses [10,11]. Destructive methods such as the contour method are used to determine stresses by mechanical release [12]. Other destructive methods include the crack compliance method and layer peeling. However, these methods usually only provide local or qualitative information and require extensive mechanical processing of the test parts [12,13].
Semi-destructive methods, which require only minimal intervention in the component structure, are frequently used in practice. One of the most commonly used methods is incremental hole drilling (IHD) according to ASTM E837 [14]. In this method, a small borehole is drilled into the surface to be examined and deepened in several steps. This mechanical intervention in the stress equilibrium results in a partial reduction in the surrounding residual stresses with the consequence of a strain release.
To record the local strain field induced by this, a strain gauge rosette can be positioned around the drill hole. The strain changes recorded during the drilling process enable the original residual stresses in the area around the hole to be calculated using calibration functions [15,16].
Nevertheless, the reliability of the IHD method depends on a number of factors. The correct application of the strain gauge rosette is contingent upon a flat and smooth surface, since high surface roughness has been shown to disrupt the symmetry of stress release and impair the complete force transmission of the strain gauge. Furthermore, precise drill hole alignment and depth, as well as homogeneous material properties, are crucial to ensure reproducible and accurate measurement results [16].
Furthermore, diffraction methods have become established for semi-destructive residual stress analysis. In laboratory environments, X-ray diffraction (XRD) is the most widely used method, as it enables stress calculation based on changes in lattice plane distances using Bragg diffraction [17]. Due to the low penetration depth of X-rays, XRD is mainly suitable for measuring surface stresses and, after local removal, for stresses close to the surface [10]. In addition, non-destructive methods such as neutron diffraction, ultrasonic methods, and magnetic stress analysis are used, but less frequently for L-PBF components due to their lower spatial resolution [18].
Strain gauges are conventionally employed to measure the strains released by IHD. However, strain gauges have been observed to reach their limits on rough surfaces due to adhesion problems and increased signal noise. Electronic speckle pattern interferometry (ESPI) has been identified as a potentially viable alternative [18,19]. As with strain gauges, ESPI is utilized for the purpose of measuring the strains that have been released, thereby enabling the calculation of residual stresses. ESPI is an optical measurement method based on laser interferometry. The presented technology enables the non-contact, full-field detection of displacements and deformations with high sensitivity. This method utilizes the interference of laser light reflected from the component surface. When a coherent laser beam is directed towards an optically rough surface, the microscopic irregularities present on the surface generate a distinctive speckle pattern, a phenomenon that arises from the interplay of constructive and destructive interference [19,20]. The digital recording of the speckle pattern of the unloaded sample is facilitated by ESPI. In the event of component deformation, a shift in the pattern is observed, attributable to the alteration in optical path lengths. Interference with a reference beam, or the comparison of images before and after deformation, produces correlation fringes that are proportional to the displacement gradients on the surface. Phase maps can be calculated from the density and arrangement of these stripes, and the displacement or strain fields in all spatial directions can then be determined [18,19]. ESPI offers several advantages over other methods mentioned. Firstly, it achieves a higher resolution than digital image correlation (DIC), for example, as displacements down to the nanometer range can be detected. Secondly, ESPI captures the deformation field holistically (full-field), i.e., without being limited to individual measuring points. The method is also contactless and therefore particularly suitable for thin-walled or sensitive surfaces, as no mechanical sensors (such as strain gauges) need to be glued on. In residual stress analysis, ESPI is often used in combination with relaxation methods, e.g., as an optical evaluation technique for the IHD method [3,18]. Despite these advantages, ESPI has some limitations. As an optical interferometry method, it is sensitive to environmental conditions and requires a sufficiently diffuse reflection of the surface. Surface roughness plays an ambivalent role here. On the one hand, ESPI requires a certain roughness in order to generate a speckle pattern at all—a highly polished surface would hardly provide any diffuse scattered light components [21]. On the other hand, very high roughness can impair fringe quality and evaluability. Highly textured or porous surfaces, for example, result in intensive light scattering in many directions, which can reduce the signal-to-noise ratio. Furthermore, the roughness can lead to residual stresses already being partially relieved at surface peaks even before the measurement takes place—a gradient is created that rises from the rough surface to the smoother interior of the material. This complicates the interpretation of optical measurement data on rough surfaces [21,22]. Recent studies show that the ESPI-assisted IHD method reliably detects residual stresses in L-PBF fabricated AlSi10Mg [18,23,24]. Despite initial successes, there are still research gaps with regard to measurement accuracy under different surface conditions. There is a lack of systematic investigations into whether and to what extent the surface structure of L-PBF components influences the accuracy of residual stress measurement using ESPI, especially since these components are known for high residual stresses and pronounced roughness.
The aim of this study is to systematically investigate the influence of characteristic surface structures of L-PBF-manufactured AlSi10Mg flat samples (up-skin, side-skin) on residual stress measurement using the ESPI and IHD methods. The down-skin surface condition was not included in the present study, as the experimental design focused exclusively on as-built surfaces that can be used without mechanical post-processing. In the cubic specimen design used here, the down-skin would correspond to a horizontal surface with a 0° overhang angle. In L-PBF, such surfaces inherently require support structures, which leave mechanical contact marks upon removal. These marks must be eliminated through post-processing such as grinding or milling [25], resulting in a surface morphology comparable to CNC-machined finishes. Therefore, investigating a down-skin condition would not have provided additional insight beyond the CNC-machined reference surface in this study. For this purpose, stress-relieved annealed samples are loaded under defined mechanical loads using the four-point bending test and load stresses were measured by IHD method.
The measurement results obtained are analyzed in relation to the surface characteristics and compared with both a CNC-milled reference surface and a numerically determined FE model in order to identify potential measurement deviations due to the additive surface morphology.

2. Materials and Methods

2.1. Material and Sample Production

AlSi10Mg powder purchased from Nikon SLM Solutions AG (Luebeck, Germany) was used in the present investigations. The powder complies with the DIN EN 1706 (EN AC-43000) [26] and ASTM F3318 [27] standards and has a spherical particle shape and a particle size distribution of 20–63 μm. The mass density is around 2.67 g/cm3. According to the manufacturer, the chemical composition consists of 9.00–11.00% Si and 0.20–0.45% Mg, with aluminum forming the residual component [28]. Only fresh powder was used for production.
The samples were produced using powder bed-based laser beam melting (L-PBF) on an Nikon SLM 280 HL, (Nikon SLM Solutions AG, Luebeck, Germany) with a single laser system. Manufacturer-specific standard process parameters were used: Layer thickness 30 µm, laser power 400 W, scanning speed 1200 mm/s, hatch distance 0.17 mm and scanning strategy with 67° rotation between layers. The build plate made of an Al alloy was used without a separating layer, at a constant temperature of 150 °C in a process chamber purged with argon 4.6 (oxygen content < 0.1% by volume).
Two types of vertically oriented samples were prepared for the tests: one representing the untreated side-skin and up-skin, and one with a CNC-milled surface. Prior to the main comparative four-point bending tests, a preliminary study was conducted to evaluate the repeatability between different specimens. Three specimens per surface condition (up-skin, side-skin, and CNC-machined) were produced within the same build job. Each specimen was loaded to a reference stress of 70 MPa and drilled at the same coordinate position (x = 10 mm, y = 0 mm). The resulting residual stress values exhibited a high correlation within each group, with a maximum deviation of <8 MPa. This confirms that the stress response was reproducible across specimens and that larger manufacturing-induced variations could be excluded.
For the main study, one representative specimen per surface condition was selected from this validated specimen portfolio. To assess intra-sample uniformity and reduce measurement uncertainty, three independent hole-drilling measurements were performed at different positions on each selected specimen. This approach ensured consistent load application and minimized the effects of bending rig compliance and initial seating [29], thereby increasing the reproducibility of the results.
The geometry of the specimens was designed to ensure both a uniform load in the measuring area and interference-free optical measurement on the target surface. The specimens measure 130 mm × 30 mm × 2 mm (length × width × thickness) and have CNC-milled edges and a CNC-milled back to ensure reproducible measurement conditions. Owing to the small specimen thickness of 2 mm, which is classified as a “thin workpiece” according to ASTM E837:2020 [15], the thickness-dependent calibration coefficients for thin specimens were applied in the residual stress calculation. These parameters were set accordingly in the evaluation software to avoid systematic errors that would arise from using standard coefficients for thick workpieces [15].
Tensile tests on stress-relieved AlSi10Mg specimens from the same build job (n = 5), performed according to ISO 6892-1 [30], yielded a 0.2% proof strength (Rp0.2) of 242 ± 2 MPa. The highest applied load level of 140 MPa corresponded to ~57.9% of Rp0.2, thus approaching the ~60% limit (~145 MPa) recommended by ASTM E837 and the NPL guideline [15]. This level was chosen to evaluate the IHD–ESPI method near its upper recommended measurement range.

2.2. Sample Preparation

Double-grid strain gauges of type ME-Systeme K-DA13K3/350_LE (ME-Systeme GmbH, Hennigsdorf, Germany) were used to determine the load stresses under bending load. These are configured in a full bridge circuit, whereby two active strain gages (R1 and R3) are placed on the sample to be tested and two passive strain gages (R2 and R4) on a non-loaded, material-identical reference sample. The active strain gages are located centrally on the back of the specimen (see Figure 1) and record the strain along the longitudinal axis of the specimen (see Section 3 for justification of the measurement direction). To minimize external influences, the strain gauges are additionally coated.
A Keyence VK-X3000 confocal microscope (Keyence Corporation, Osaka, Japan) was used to characterize the surface properties. The surface images were taken at 100× g magnification and extended depth of field in order to image the microstructure in detail (see Table 1). In addition, the surface roughness was determined by an optical multiple line roughness measurement in the X- and Y-planes. Ten parallel measurement lines with an offset of 0.1 mm were used to ensure comprehensive recording of the roughness parameters.
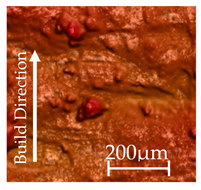
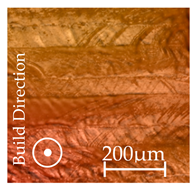
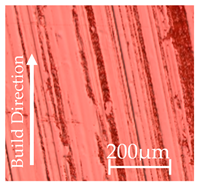
The analysis of the surface structures shows significant differences (see Table 1).
-
Side-skin surface:
Coarse, sand casting-like structure with fused metal particles and metallic rough sheen.
-
Up-skin surface:
Fine line structure whose line width roughly corresponds to the scan width of the manufacturing process, with a metallic sheen.
-
CNC-milled reference surface:
Smooth, even surface with a clear, shiny metallic appearance.
In order to ensure homogeneous heat transfer and minimize thermal gradients during the annealing process, the samples remained on the substrate plate after L-PBF production. The isothermal heat post-treatment was carried out at a temperature of 300 °C for 2 h, followed by slow cooling at a reduction rate of 20 °C/h to 40 °C. The combination of process-integrated preheating (150 °C) during production and the subsequent post-heat treatment made it possible to achieve an almost stress-free condition, which was verified by a removal method with deformation measurement [31,32]. For this purpose, reference parts in the form of cantilever geometries in an orthotropic build orientation were produced, subjected to the same heat treatment as the test specimens, and subsequently separated from the base plate by electrical discharge machining. The measured maximum deflections were below 0.17 mm. Back-calculation of these values using finite element analysis yielded resulting residual stresses of less than 2.4 MPa, confirming a nearly stress-free state.
After completion of the heat treatment, the samples were separated from the substrate plate by a vertical saw cut with coolant supply. This procedure minimizes mechanically induced residual stresses during the separation process and ensures the structural integrity of the samples.

2.3. Test Setup and Verification

The samples were subjected to quasi-static four-point bending, as this test arrangement ensures a more uniform and defined stress distribution in the central test area compared to three-point bending. As a result, a homogeneous stress in the measurement zone is achieved, which increases the measurement precision.
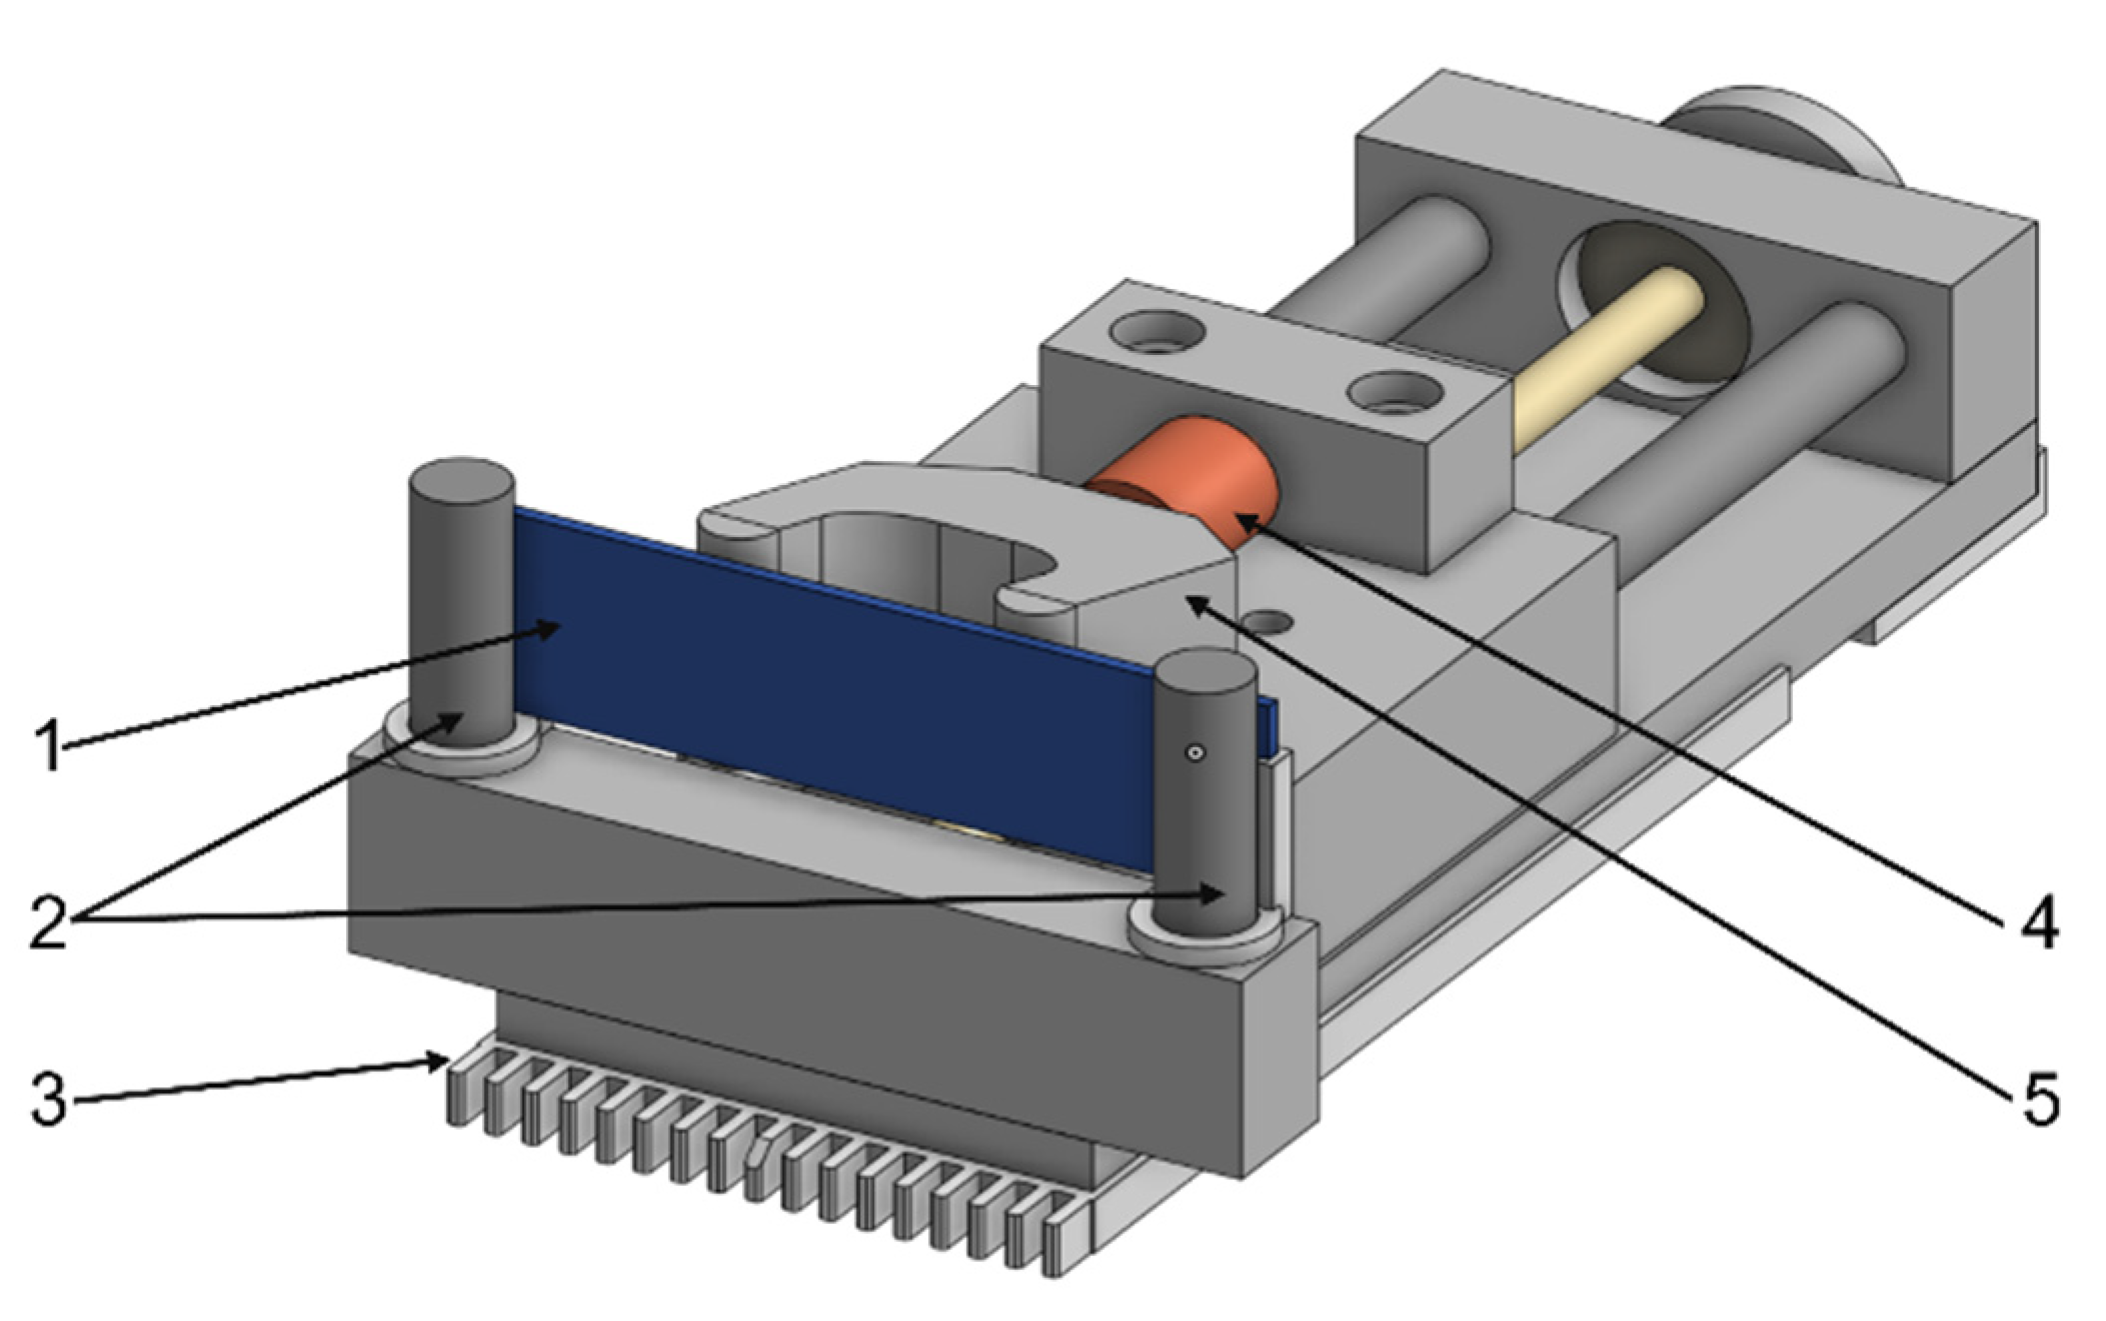
The test setup consists of several components (see Figure 2):
-
Test samples (position 1): Central element of the load test.
-
Counter bearing (position 2): Fixes and supports the sample.
-
Grid system (position 3): Manual grid with a horizontal step width of 2.5 mm and height adjustment in 2.5 mm steps to ensure a close-meshed measuring point grid system with a maximum deviation of 0.1 mm.
-
Force measuring sensor (position 4): Type ME-Systems KM16z 2 kN (ME-Systeme GmbH, Hennigsdorf, Germany), for real-time monitoring of the applied forces.
-
Load fork (position 5): Manual adjustment to avoid control errors due to servo or stepper motors.
To ensure measurement accuracy, strain gages are attached to the side of the samples opposite the ESPI measuring field. These record the local strain under mechanical load. As the stress symmetry to the neutral bending fiber is given, the strain gauge data can be used to calculate the load stress depth distribution at the ESPI measuring side.
The strain and stress fields are recorded and calculated, resp., with the ESPI using the Stresstech Prism S system (Stresstech Oy, Jyväskylä, Finland). This method enables the high-resolution detection of displacements in both the normal and in-plane directions using a precise laser interferometer system (see Figure 3).
The measurement is performed on a sample mounted in the four-point bending unit (position 3). The measuring method is based on drilling holes at equidistant intervals along the sample to determine the stress depth distribution.
For this purpose, a pneumatically operated high-frequency spindle with a double-edged cutter and a cutter diameter of 0.5 mm with an integrated feed unit (position 5) is used.
The removal of chips produced during drilling is ensured by a compressed air nozzle (position 4).
The speed of the drill can be adjusted manually via the drilling control unit. To ensure precise cylindrical drilling, end mills with a cylindrical shank are used. The entire system is controlled centrally via a control unit, which also includes the laser. To measure the strain, the area surrounding the hole is irradiated with laser light, which is projected onto the sample surface by the projection unit (position 2).
Due to the surface roughness, a speckle pattern is created, which is recorded by the camera (position 1). The camera is designed to combine reference and object beams. The reference beam enters from the back of the camera and is directed to the CCD chip, while the object beam is captured by the lenses of the objective. In this way, the topography of the surface is determined using the reference beam.
The base plate (position 6) serves as a stable base and enables exact positioning of the four-point bend. The grid connection system ensures precise and repeatable fixation.
To ensure accurate measurement, the entire measuring system was aligned with the sample in accordance with the manufacturer’s specifications. To minimize external interference such as temperature fluctuations, air currents, and vibrations, the test setup is vibration-isolated and shielded by an opaque housing. In addition, the measurement is carried out in an air-conditioned room at a constant temperature.
The numerical model of the bending calibration unit was developed using ANSYS Workbench 2024 R2 simulation software in order to calculate the load stress depth distribution on the samples under defined boundary conditions. To make the modeling efficient, spacers and counter bearings were modeled as a single assembly. To increase the simulation accuracy, the mesh was refined in specific areas, particularly in the contact and result evaluation areas (see Figure 4).
Friction-prone contacts with a coefficient of friction of 0.2 were defined between bearing rods, spacer sleeves, and the metal sample, while the force application was modeled in an idealized manner using friction-free contacts. The rear wall of the counter bearing was completely fixed in order to represent realistic rigid boundary conditions [33].
The calculations were performed in several load steps. First, a displacement-controlled load increase was performed to facilitate contact finding, before a force-controlled calculation was performed with five load steps up to a maximum load of 196 N (see Figure 5).
The simulation is based on samples made of AlSi10Mg (Young’s Modulus = 73.4 GPa, Poisson’s Ratio: ≈0.33) with a sheet thickness of 2 mm, whereby the material behavior was considered as ideal elastic [28].
The simulation results show the stress and deformation distributions along the top and bottom sides of the samples. These results were analyzed along the Y- and Z-axes and provide a basis for evaluating the stress fields and validating the experimental setup.
Careful modeling and detailed analysis of the system provided important insights into the homogeneity of the stress fields and the reliability of the experimental setup. This numerical model thus provides a valid basis for optimizing the bending calibration unit and investigating the stresses of the samples.
To validate the numerical model, the maximum bending stress around the transverse direction was calculated using an analytical approach (see Equation (1)) and compared with the numerical results:
σ Y   A n a l y t i c a l = F × ( L i n × L o u t ) 4 × h 2 × l
The linear actuator is designed for a maximum force of 196 N, which is the force used to calibrate the system. The analytical calculation resulted in a maximum bending stress of σy Analytical = 147 MPa. In comparison, the numerical simulation showed a bending stress of σy Numerical = 145.3 MPa, which corresponds to a deviation of 1.16%.
To verify the applied bending stresses as basis for the later IHD measurement, the stress values determined by the strain gauge circuit were compared with the numerically and analytically calculated reference values, resp. Under the defined bending force of 196 N, the stress of σy Strain Gauges ≈ 145.4 MPa agrees well with both. The detailed stresses depending on the surface condition of the samples compared to the numerically calculated values are given in Table 2.

2.4. Test Procedure

To investigate the residual stresses in L-PBF-manufactured parts with different surface structures, an IHD system was used in combination with an ESPI measurement system and a four-point bending device. With the bending device a known load stress depth distribution is applied to verify the accuracy of the IHD method with ESPI on these stresses at additively manufactured samples. To ensure precise vertical and horizontal alignment, the test setup was adapted to the Stresstech system (see Figure 6). The samples were fixed in the four-point bending device and stabilized by a preload of 10 MPa. This preload served to secure the samples and prevent them from slipping during the milling and measurement processes.
The ESPI measuring system was then calibrated. First, the illumination intensity of the laser beam was set to a value between 15 and 20 lux. At the same time, the intensity of the reference beam was adjusted to achieve a 1:1 ratio between the illumination and reference beams (see Figure 3, right). The calibration was carried out in accordance with the manufacturer’s specifications provided by Stresstech. This setting is necessary to ensure optimal interference in the speckle pattern. To create the conditions for a uniform speckle pattern, the surfaces of the up-skin samples and the CNC-milled samples were coated with a thin matting spray. This treatment reduced the reflectance of the surface and improved light scattering, which significantly increased the image quality and thus the measurement accuracy of the ESPI system.
After activating the compressed air and the milling cutter, the milling unit was moved into position at a feed rate of 0.01 mm/s for initial adjustment. The drilling zero point (z = 0) was determined using an optically assisted detection method with a high-precision linear drive. The cutter was advanced toward the specimen surface in controlled steps of 10 µm under continuous optical observation via a high-magnification live camera feed. The zero position was defined at the moment of first optical contact, indicated by a detectable change in the speckle pattern. This process is the standard method in the employed system [34]. Potential misindications of the zero point, such as excessive surface penetration prior to depth recording, were excluded by visual inspection of the recorded images during setup. The milling cutter was then moved back to its rear end position before the automatic measuring program was started.
The drilling process was carried out step by step in increments of 0.03 mm. After each milling step, the distribution of the released deformation was measured using ESPI and the corresponding stress was calculated. This procedure was carried out for different bending stresses applied in the homogeneous stress zone between the load points. The stresses investigated were 10 MPa, 70 MPa, and 140 MPa in order to represent different stress states:
-
10MPa: This preload was used to fix the sample and to check that the residual stresses caused by the manufacturing process were significantly reduced by the heat treatment.
-
70MPa: This value represents typical residual stresses that occur in L-PBF-manufactured components of AlSi10Mg [35].
-
140MPa: Chosen to assess the IHD–ESPI method near its upper recommended range (see Section 2.1 for yield strength and guideline limit).
The drilling coordinates were selected specifically on the basis of the numerical evaluation of the drilling zones (see Section 3). A total of nine measurements were carried out, which were arranged within three load ranges (see Figure 6).
Table 3 lists the coordinates of the individual measurements for a measurement depth of 60 µm. This systematic arrangement enables representative recording of the load stress distributions under various load conditions applied.
The measurement was deliberately performed on the surface of the region subjected to maximum loading by four-point bending, where the highest bending stresses occur. This is essential for accurately assessing the influence of surface roughness in the side-skin and up-skin areas. In doing so, both the relevant stress states in the critical edge zone can be captured and potential deviations caused by roughness-induced variations can be identified.

3. Results

3.1. Numerical Results

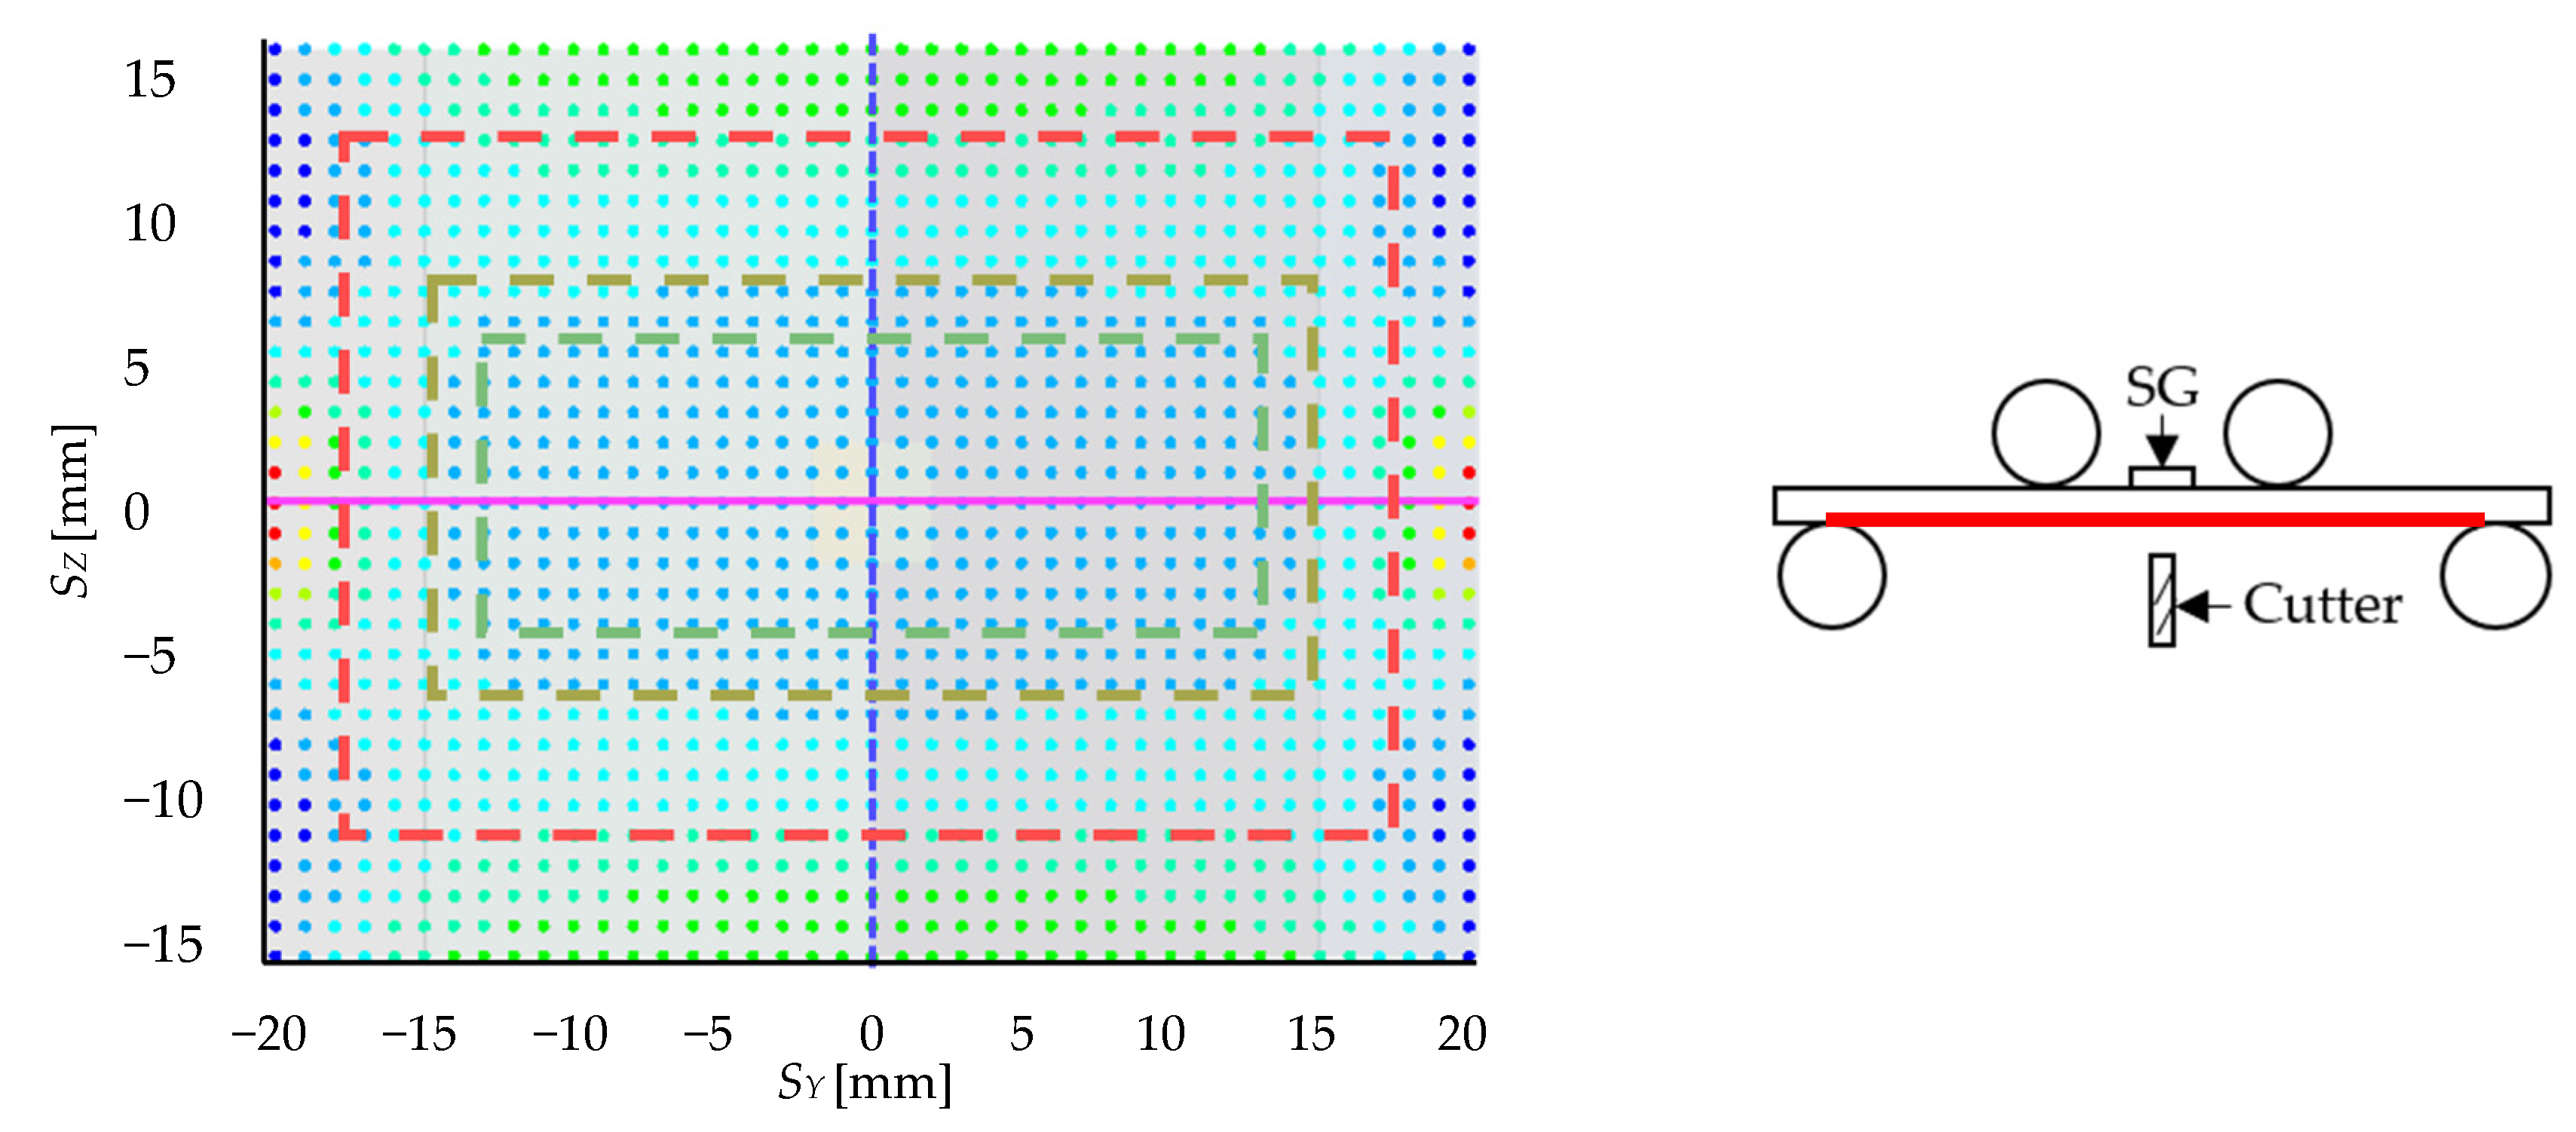
The finite element analysis performed shows a characteristic distribution of normal bending stresses in the bending direction (y-direction) and transverse to the bending direction (z-direction). The reference point for the calibration of the measuring system is located centrally in the middle of the specimen at SY = 0 mm and SZ = 0 mm (see Figure 7). At this point, the stress at the surface in y-direction corresponding to a preload force of 196 N is 139.58 MPa. Starting from the reference point, the node results were evaluated and divided into rectangular areas (see Figure 7).
It was found that the normal bending stress in the z-direction is only 3.4% of that in the y-direction. Due to these characteristic lower stresses, both the calibration and the stress measurements focused on the normal stresses in y-direction.
The areas shown in Figure 7 were grouped according to percentage deviations from the stress at the reference point:
-
Inside green border: 1% deviation
-
Inside yellow border: 2% deviation
-
Inside red border: 5% deviation
The area with a maximum deviation of 1% extends in the y-direction over 24 mm and in the z-direction over 12 mm. This area provides a suitable basis for the drill pattern arrangement and the verification of the measurements.

3.2. Experimental Results

The three samples investigated were subjected to bending stress levels of 10 MPa, 70 MPa, and 140 MPa, resp. Three measured values by the IHD ESPI method are available for each stress level.
Figure 8 shows the average stress values measured by the IHD ESPI method for the three surface types, side-skin, up-skin, and CNC-milled, at applied bending stress levels of 10 MPa, 70 MPa, and 140 MPa, resp.
The measured stresses show a good agreement with the applied bending stresses. At an applied stress of 70 MPa, the deviations are approx. +4% for the up-skin and +6% for the side-skin, which indicates a high degree of measurement accuracy (see Table 4). At stress levels applied of 10 MPa and 140 MPa, however, the deviations are somewhat larger, especially on the up-skin surfaces.
These deviations can be attributed to the surface condition of the up-skin samples. In contrast to the CNC-milled and side-skin surfaces, the up-skin samples required an additional coating to reduce reflectivity for the ESPI measurement. The side-skin surface, however, exhibited sufficiently diffuse reflection and did not require coating. Down-skin samples were not included in this investigation due to their extremely rough surface and the adhesion of support structures, which makes them unsuitable for as-built use and unreliable for residual stress evaluation. In the case of the up-skin surface, the combination of coating and pronounced surface roughness led to measurement issues: during the hole drilling process, coating particles and drilling chips detached and became trapped in the surface irregularities. These could not be fully removed by the standard pneumatic cleaning process. Remaining particles interfered with the interferometric image acquisition, causing increased pixel blur in the ESPI analysis. These disturbances can be mitigated by improving chip removal, for example, through a dual-nozzle air cleaning system with flow-guiding elements to reduce cleaning blind spots. Despite these influences, a good correlation was observed between the applied bending stresses and the stresses measured using the IHD ESPI method.

4. Discussion

The bending stress measurements conducted in this study on stress-relieved, L-PBF-manufactured AlSi10Mg specimens indicate that the IHD method, when combined with ESPI, can achieve a close agreement between applied and measured stresses within the residual stress range typical for L-PBF components.
The decision to employ four-point bending in this study offers methodological advantages over the direct analysis of process-induced residual stresses. By generating well-defined and homogeneous stresses within the central measurement zone, reproducible stress states can be established, allowing the isolation and evaluation of method-related effects. Variability arising from manufacturing, such as differences in thermal history or local material inhomogeneities, is thus largely minimized.
However, this approach has inherent limitations. Since no complex, process-induced residual stress distributions are measured, potential interactions between the measurement technique and typical L-PBF-related stress gradients, internal defects, or localized plastic zones cannot be fully captured. The transferability of the results to real components must therefore be critically assessed in light of these limitations.
In the mid-load range, particularly at 70 MPa, the measured values were close to the target values. At both the lower and upper extremes of the load spectrum, however, larger deviations were observed, attributable to a combination of inherent methodological limitations and experiment-specific influencing factors.
At the lowest load level of 10 MPa, relative deviations amounted to 23.6% for the up-skin surface and 18.4% for the side-skin surface (Table 4). These comparatively large errors likely result from multiple interacting factors. At such low stress, surface deformations approach the detection threshold of the ESPI system, which inherently reduces the signal-to-noise ratio (SNR) and increases phase-evaluation uncertainty [36,37]. Additional contributions may arise from environmental vibrations, camera sensor noise, and fringe-contrast fluctuations [37,38]. Local contamination from metallic particles as well as speckle-pattern distortions in the vicinity of the hole can further degrade fringe quality [39]. A particularly relevant influence in the low-force regime is the mechanical compliance of the four-point bending fixture, including bearing flexibility and potential backlash. These effects can lower the actual surface stress in the measurement zone compared to the nominal value, thereby inflating the calculated deviation between applied and measured stresses. Such compliance-induced errors can be mitigated by determining a system-specific correction factor using stiff reference specimens, calibrating the rig with displacement or strain sensors positioned near the measurement area, and/or employing preloaded bearings to suppress micro-movements [29].
In addition, out-of-plane displacements pose a particular challenge in ESPI-based measurements. Large in-plane displacements, such as those induced by bending, can impair out-of-plane phase tracking due to speckle decorrelation and phase loss [40]. Previous studies have shown that such effects can lead to misinterpretations of displacement fields and incorrect stress values unless corrected by advanced image reconstruction algorithms. In the present work, these effects are assumed to have contributed to the increased measurement uncertainty at 10 MPa, particularly on rough surfaces. The high relative errors in this load range therefore primarily reflect the fundamental sensitivity limits of the IHD–ESPI approach in the low-stress regime.
At 70 MPa, corresponding to typical process-induced residual stress levels in L-PBF AlSi10Mg components [35], the results showed overall good agreement with the target values. However, not all surfaces exhibited low deviations: while the side-skin surface, which required no coating due to its diffuse reflectivity, showed the smallest deviation, the CNC-machined surface, despite its high surface quality, exhibited a higher error. This is likely due to the required application of a matting spray to reduce reflectivity for ESPI. Such coatings introduce an additional, uncontrolled variable, as uneven adhesion, local cracking, or optical distortion may influence the interpretation of interference fringes. These spray-related artifacts were absent on the uncoated side-skin sample and may have contributed to its better performance [40].
At 140 MPa, deviations increased again. This stress level was deliberately chosen to investigate the stability and applicability of the method near its operational limit, as residual stresses exceeding 60% of Rp0.2 can occur in L-PBF components under adverse process or service conditions [41]. The tensile test data indicate that the applied 140 MPa stress level was close to the upper measurement limit specified by ASTM E837 and NPL (~145 MPa). Although formally within the validity range, operation near this threshold increases the likelihood of local plastic deformation around the drilled hole. Such effects violate the linear-elastic assumptions of the IHD method and may lead to systematic over- or underestimation of stresses. Grant et al. [15,42] emphasized that plasticity becomes particularly critical when stress concentrations at the drill edge approach or exceed the yield limit.

5. Conclusions

As part of this study, residual stress measurements were performed on stress-relieved, L-PBF-manufactured AlSi10Mg specimens with different L-PBF-specific surface structures. Defined bending stresses were applied to stress-free reference specimens to evaluate the measurement accuracy of the combined ESPI and IHD method. The objective was to systematically analyze the influence of typical as-built and post-processed L-PBF surface morphologies on measurement accuracy.
The results demonstrate that surface structure can influence measurement accuracy—particularly at the lower (10 MPa) and upper (140 MPa) ends of the investigated stress range. The largest deviations were observed for the up-skin surface and are attributable to a combination of rough surface morphology and coating-related artifacts. In the mid-load range, around 70 MPa—representative of typical residual stress levels in L-PBF components—the agreement between target and measured values for all surface conditions was within ±7%, indicating reliable applicability of the method in this range under the tested conditions.
Finite element simulations performed to validate the experimental results showed only minor deviations from analytical bending stress calculations, thereby supporting the validity of both the experimental setup and the numerical approach.
Within the scope of the present investigation, the IHD–ESPI method can be considered suitable for assessing residual stresses in additively manufactured components with minimal or no surface post-processing, provided that potential influencing factors—such as surface roughness, coating process, and rig compliance—are carefully controlled. The present findings confirm the fundamental suitability of the method for residual stress analysis in L-PBF components and provide robust data that can be directly applied to real part assessments.
Future research should focus on optimizing the interaction between surface preparation, coating processes, and measurement technology to improve accuracy, particularly on rough as-built surfaces. For example, the use of pneumatic dual-nozzle cleaning systems or optimized coating materials could reduce measurement artifacts and enhance reliability.

Author Contributions

Methodology, S.G.; Writing—original draft, S.G.; Writing—review & editing, U.N., C.S. and J.B.; Visualization, S.G.; Supervision, J.B.; Project administration, S.G. All authors have read and agreed to the published version of the manuscript.

Funding

The machine used for the investigations was funded by the European Regional Development Fund (ERDF) and the state of Saxony-Anhalt under grant number ZS/2018/06/93168. The authors gratefully acknowledge financial support from the funding program Sachsen-Anhalt WISSENSCHAFT Forschung und Innovation (ERDF) under grant number ZS/2024/04/186252, project title: “Entwicklung von warmfesten Aluminiumlegierungen für 3D-gedruckte Komponenten für Wasserstoffmotoren”. This project was co-financed by the European Union and the state of Saxony-Anhalt. The article processing charge (APC) was funded by the Open Access Publishing Fund of Anhalt University of Applied Sciences.

Institutional Review Board Statement

Not applicable.

Informed Consent Statement

Not applicable.

Data Availability Statement

The original contributions presented in this study are included in the article. Further inquiries can be directed to the corresponding author.

Conflicts of Interest

The authors declare no conflict of interest.

Abbreviations

AlSi10MgAluminum-Silicon-Magnesium Alloy
ASTMAmerican Society for Testing and Materials
CCDCharge-Coupled Device
CNCComputerized Numerical Control
DICDigital Image Correlation
DINDeutsches Institut für Normung (German Institute for Standardization)
ENEuropean Standard
ESPIElectronic Speckle Pattern Interferometry
FEFinite Element
HLHigh Laser (Machine-Specific Designation, e.g., SLM 280 HL)
IHDIncremental Hole Drilling
L-PBFLaser Powder Bed Fusion
MPaMegapascal
NPLNational Physical Laboratory (United Kingdom)
Ra/RzRoughness Average/Maximum Height of the Roughness Profile
SNRSignal-to-Noise Ratio
XRDX-ray Diffraction

References

  1. Elkaseer, A.; Charles, A.; Schneider, S.; Scholz, S.G. Part tailoring in metal-additive manufacturing: A step towards functionally graded customized stainless-steel components using laser powder bed fusion. Appl. Sci. 2022, 12, 6193. [Google Scholar] [CrossRef]
  2. Staub, A.; Scherer, M.; Zehnder, P.; Spierings, A.B.; Wegener, K. Residual Stresses Measurements in Laser Powder Bed Fusion Using Barkhausen Noise Analysis. Materials 2022, 15, 2676. [Google Scholar] [CrossRef]
  3. Serrano-Munoz, I.; Fritsch, T.; Mishurova, T.; Trofimov, A.; Apel, D.; Ulbricht, A.; Kromm, A.; Hesse, R.; Evans, A.; Bruno, G. On the interplay of microstructure and residual stress in LPBF IN718. J. Mater. Sci. 2021, 56, 5845–5867. [Google Scholar] [CrossRef]
  4. Nielsen, M.A. Analyse von Mikrostruktur und Eigenspannungszuständen in mit Selektivem Laserstrahlschmelzen Gefertigten Materialien Mittels Hochenergetischer Röntgenstrahlung. Ph.D. Thesis, Christian-Albrechts-Universität zu Kiel, Kiel, Germany, 2023. [Google Scholar]
  5. Kremer, R. Experimentelle und simulative Untersuchung der Kristallstruktur und Eigenspannungen an Selektiv Lasergeschmolzenen Bauteilen aus CuSn10. Master’s Thesis, Fachhochschule Dortmund, Dortmund, Germany, 2022. [Google Scholar]
  6. Töppel, T.; Müller, B.; Hoeren, K.P.; Witt, G. Eigenspannungen und Verzug bei der additiven Fertigung durch Laserstrahlschmelzen. Schweißen Und Schneid. 2016, 4, 176–187. [Google Scholar]
  7. Kaess, M.; Werz, M.; Weihe, S. Residual Stress Formation Mechanisms in Laser Powder Bed Fusion—A Numerical Evaluation. Materials 2023, 16, 2321. [Google Scholar] [CrossRef] [PubMed]
  8. Sobolevski, E.G.; Scholtes, B. Residual Stress Analysis of Components with Real Geometries Using the Incremental Hole-Drilling Technique and a Differential Evaluation Method; Kassel University Press GmbH: Kassel, Germany, 2007; pp. 14–39. ISBN 978-3-89958-343-4. [Google Scholar]
  9. Macherauch, E.; Kloos, K.H. Origin, Measurement and Evaluation of Residual Stresses. In Residual Stresses in Science and Technology; DGM-Informationsgesellschaft: Oberursel, Germany, 1987; pp. 3–26. [Google Scholar]
  10. Withers, P.J.; Bhadeshia, H.K.D.H. Residual Stress Part 1-Measurement Techniques. Mater. Sci. Technol. 2001, 17, 355–365. [Google Scholar] [CrossRef]
  11. Clyne, T.W.; Gill, S.C. Residual stresses in thermal spray coatings and their effect on interfacial adhesion: A review of recent work. J. Therm. Spray Technol. 1996, 5, 401–418. [Google Scholar] [CrossRef]
  12. Molina-Ballinas, A.; Urriolagoitia-Sosa, G.; Urriolagoitia-Calderón, G.; Hernández-Gómez, L.H.; Verduzco-Cedeño, V.F.; Torres-Franco, D.; Torres-San Miguel, C.R.; Romero-Ángeles, B. Determination of Residual Stresses Originated in a Die Process Using the Crack Compliance Method. In Proceedings of the World Congress on Engineering 2011, London, UK, 6–8 July 2011; Volume III, pp. 1–5, ISSN 2078-0966. [Google Scholar]
  13. Urriolagoitia-Sosa, G.; Urriolagoitia-Calderon, G.; Romero-Ángeles, B.; Torres-Franco, D.; Hernández-Gómez, L.H.; Molina-Ballinas, A.; Torres-San Miguel, C.R.; Campos-López, J.P. Using fracture mechanics for determining residual stress fields in diverse geometries. Ing. Investig. 2012, 32, 19–26. [Google Scholar] [CrossRef]
  14. Valentini, E.; Bertelli, L.; Benincasa, A. Improvements in the hole-drilling test method for determining residual stresses in polymeric materials. Mater. Perform. Charact. 2018, 7, 446–464. [Google Scholar] [CrossRef]
  15. ASTM International. E837–20 Standard Test Method for Determining Residual Stresses by the Hole-Drilling Strain-Gage Method; ASTM International: West Conshohocken, PA, USA, 2020. [Google Scholar]
  16. Schajer, G.S.; Whitehead, P.S. Measurement Good Practice Guide No. 53-Issue 2: The Measurement of Residual Stresses by Incremental Hole Drilling Technique; Vishay Precision Group: Malvern, PA, USA, 2009; pp. 47–68. [Google Scholar]
  17. Kim, J.H.; Baek, C.H.; Lee, S.K.; Kang, J.H.; Park, J.H.; Ko, D.C. Effect of a multiple reduction die on the residual stress of drawn wires. Materials 2021, 14, 1358. [Google Scholar] [CrossRef]
  18. Rahimi, S.; Violatos, I. Comparison Between Surface and Near-Surface Residual Stress Measurement Techniques Using a Standard Four-Point-Bend Specimen. Exp. Mech. 2022, 62, 223–236. [Google Scholar] [CrossRef]
  19. Kaufmann, G.H.; Albertazzi, A., Jr. Speckle interferometry for the measurement of residual stresses. In New Direction in Holography and Speckle; Caulfield, H.J., Vikram, C.S., Eds.; American Scientific Publishers: Valencia, CA, USA, 2008; pp. 1–22. [Google Scholar]
  20. Schajer, G.S.; Steinzig, M. Full-field calculation of hole drilling residual stresses from electronic speckle pattern interferometry data. Exp. Mech. 2005, 45, 526–532. [Google Scholar] [CrossRef]
  21. Prabhathan, P.; Song, C.; Haridas, A.; Prasad, G.; Chan, K.; Murukeshan, V.M. Experimental investigations and parametric studies of surface roughness measurements using spectrally correlated speckle images. In Proceedings of SPIE-Fifth International Conference on Optical and Photonics Engineering, Singapore, 4–7 April 2017; Volume 10449, p. 1044913. [Google Scholar] [CrossRef]
  22. Nicklawy, M.; Hassan, A.F.; Bahrawi, M.; Farid, N.; Sanjid, A.M. Characterizing surface roughness by speckle pattern analysis. J. Sci. Ind. Res. 2009, 68, 118–121. [Google Scholar]
  23. Lim, C.H. Novel heat treatment methodology for residual stress relieve of AlSi10Mg without compromise of mechanical strength. Mater. Perform. Charact. 2022, 70, 45–49. [Google Scholar] [CrossRef]
  24. Salmi, A.; Atzeni, E.; Iuliano, L.; Galati, M. Experimental Analysis of Residual Stresses on AlSi10Mg Parts Produced by Means of Selective Laser Melting (SLM). Procedia Cirp 2017, 62, 458–463. [Google Scholar] [CrossRef]
  25. Cao, Q.; Bai, Y.; Zheng, Z.; Zhang, J.; Fuh, J.Y.H.; Wang, H. Support Removal on Thin-Walled Parts Produced by Laser Powder Bed Fusion. 3D Print. Addit. Manuf. 2023, 10, 762–775. Available online: https://pmc.ncbi.nlm.nih.gov/articles/PMC10440680/ (accessed on 10 August 2025). [CrossRef]
  26. DIN EN 1706:2020-12; Aluminium and Aluminium Alloys—Castings—Chemical Composition and Mechanical Properties. Beuth: Berlin, Germany, 2020.
  27. ASTM F3318-18; Standard Specification for Additive Manufacturing Titanium-6 Aluminum-4 Vanadium with Powder Bed Fusion. ASTM International: West Conshohocken, PA, USA, 2018.
  28. SLM Solutions Group AG. Material Data Sheet-AlSi10Mg (Version 2024-04.1). Available online: https://nikon-slm-solutions.com/wp-content/uploads/2025/02/mds5123.pdf (accessed on 17 April 2025).
  29. Meyer, P.; Risse, J.; Tjiong, M.; Wieder, P.; Becker, N.; Müssigbrodt, L. Test Methods for the Mechanical Characterization of Variable Cross-Section Flexure Hinges. Exp. Mech. 2023, 64, 753–766. [Google Scholar] [CrossRef]
  30. ISO 6892-1:2019; Metallic Materials—Tensile Testing—Part 1: Method of Test at Room Temperature. International Organization for Standardization: Geneva, Switzerland, 2019.
  31. Görres, F.; Widuch, A.; Löwisch, G.; Brenner, S.; Nedeljkovic-Groha, V. Wärmebehandlung additiv gefertigter Teile aus Al-Si10Mg. In Proceedings of the 4th Meeting of the Working Group on Additively Manufactured Components and Structures, Berlin, Germany, 6–7 November 2019; pp. 1–6, DVM—Deutscher Verband für Materialforschung und-prüfung e.V.. ISSN 2509-8772. [Google Scholar]
  32. Lim, C.H.; Li, H.; Krishnan, M.; Chen, K.; Li, J. Investigation of the transition heat treatment temperature of AlSi10Mg manufactured by selective laser melting and the effect on the compressive strength. Mater. Today Proc. 2022, 70, 45–49. [Google Scholar] [CrossRef]
  33. Verein Deutscher Ingenieure. VDI 2230 Part 1: Systematic Calculation of High Duty Bolted Joints—Joints with One Cylindrical Bolt; VDI: Düsseldorf, Germany, 2015. [Google Scholar]
  34. Bobzin, K.; Wietheger, W.; Knoch, M.A.; Schacht, A.; Reisgen, U.; Sharma, R.; Oster, L. Comparison of Residual Stress Measurements Conducted by X-ray Stress Analysis and Incremental Hole Drilling Method. J. Therm. Spray Technol. 2020, 29, 1218–1228. [Google Scholar] [CrossRef]
  35. Gersch, S.; Schulz, C.; Bagdahn, J. Impact of Hatching Strategy on Mechanical Properties and Residual Stresses in Additively Manufactured AlSi10Mg Components. In TMS 2025 154th Annual Meeting & Exhibition Supplemental Proceedings, ser. The Minerals, Metals & Materials Series; Springer: Cham, Switzerland, 2025. [Google Scholar] [CrossRef]
  36. Hack, T. Residual stress measurement by ESPI hole drilling and XRD. In Proceedings of the 13th International Conference on Shot Peening, Montreal, QC, Canada, 18–21 September 2017; pp. 181–186. Available online: https://www.shotpeener.com/library/pdf/2017044.pdf (accessed on 10 August 2025).
  37. Pruss, L.S. Field Guide to Displacement Measuring Interferometry; SPIE Press: Bellingham, WA, USA, 2012; Available online: https://www.spiedigitallibrary.org/ebooks/FG/Field-Guide-to-Displacement-Measuring-Interferometry/eISBN-9780819498007/10.1117/3.1002328 (accessed on 10 August 2025).
  38. Pooser, R.C.; Lawrie, B.J. Ultrasensitive Measurement of Microcantilever Displacement Below the Shot-Noise Limit. Science.gov. 2015. Available online: https://www.science.gov/topicpages/s/sensitive+displacement+measurement (accessed on 10 August 2025).
  39. Barile, C.; Casavola, C.; Pappalettera, G.; Pappalettere, C. Remarks on Residual Stress Measurement by Hole-Drilling and Electronic Speckle Pattern Interferometry. Sci. World J. 2014, 2014, 487149. [Google Scholar] [CrossRef]
  40. Martinez-Celorio, R.A.; Kaufmann, G.H.; Kujawinska, M. Out-of-plane displacement measurement by electronic speckle pattern interferometry in presence of large in-plane displacement. Opt. Commun. 2002, 208, 17–24. [Google Scholar] [CrossRef]
  41. Marola, S.; Bosia, S.; Veltro, A.; Fiore, G.; Manfredi, D.; Lombardi, M.; Amato, G.; Baricco, M.; Battezzati, L. Residual stresses in additively manufactured AlSi10Mg. Mater. Des. 2021, 202, 109550. Available online: https://www.sciencedirect.com/science/article/pii/S0264127521001039 (accessed on 10 August 2025). [CrossRef]
  42. Grant, P.V.; Lord, J.D.; Whitehead, P.S. The Measurement of Residual Stresses by the Incremental Hole Drilling Technique; National Physical Laboratory: Teddington, UK, 2006; pp. 21–22. [Google Scholar]
Figure 1. Position of the active strain gages on the test specimen (left); Schematic top view of the strain gauge (SG) positions on the specimen in the four-point bending test (right).
Applsci 15 09861 g001
Figure 2. Four-point bending device for targeted loading of the sample (1 → test samples, 2 → counter bearing, 3 → grid system, 4 → force measuring sensor, 5 → load fork).
Applsci 15 09861 g002
Figure 3. Measuring system for stress measurement using ESPI and the hole drilling method with the Prism-System from Stresstech (1 → camera-recorded speckle pattern, 2 → Laser projection unit, 3 → test samples, 4 → air nozzle, 5 → high-frequency spindle, 6 → base plate). Left: schematic of the Prism S system; Right: actual experimental setup.
Applsci 15 09861 g003
Figure 4. Numerical model with mesh design of the bending calibration unit.
Applsci 15 09861 g004
Figure 5. Load stress at the measurement area for an applied bending force of 196 N calculated by FE analysis (left), Schematic top view of the measurement area (right).
Applsci 15 09861 g005
Figure 6. Schematic representation of the hole drilling positions in the bending sample with the reference coordinate system in x- and y-direction.
Applsci 15 09861 g006
Figure 7. Distribution of bending stresses in bending direction (y-direction) at the surface calculated by finite element analysis (left). Inside the colored boxes the values differ to the reference point (SY = 0, SZ = 0) for 1% (green), 2% (yellow) and 5% (red), resp., Schematic top view of the measurement area (right).
Applsci 15 09861 g007
Figure 8. Average IHD-ESPI stress values for different surface conditions and applied bending stresses. Error bars show mean ± 1 SD (n = 3).
Applsci 15 09861 g008
Table 1. Surface of the metal samples investigated.
Side-Skin
Surface
Up-Skin
Surface
CNC-Milled
Surface
Applsci 15 09861 i001Applsci 15 09861 i002Applsci 15 09861 i003
Roughness Ra/Rz Horizontal [µm]
9.15/51.028.79/34.101.02/9.32
Roughness Ra/Rz Vertical [µm]
7.58/50.1915.51/58.40.71/6.72
Table 2. Validation of measured bending stresses with numerical results.
SurfaceMeasured Stress
σy Strain Gauges
Deviation FE-Value [%]
Between σyStrain Gauges
and σy Numerical
Side-skin145.5 MPa0.14
Up-skin146.2 MPa0.62
CNC-milled144.6 MPa0.48
Table 3. Coordinates of the individual measurements.
Applied Bending StressX_n [mm]Y_1_2_3 [mm]
10 MPa_1/_2/_3−55/0/−5
70 MPa_1/_2/_305/0/−5
140 MPa_1/_2/_355/0/−5
Table 4. Results and comparison of the measured stresses with the applied bending stresses.
Surface ConditionApplied Bending Stress [MPa]
σy Strain Gauges
Stress Measured by Stresstech IHD ESPI Method [MPa]Deviation (%)
Side-skin108.1618.4
7065.776.04
140120.0014.29
Up-skin107.6423.6
7067.104.14
140110.4721.09
CNC-Milled109.861.40
7065.636.24
140121.6713.09
Disclaimer/Publisher’s Note: The statements, opinions and data contained in all publications are solely those of the individual author(s) and contributor(s) and not of MDPI and/or the editor(s). MDPI and/or the editor(s) disclaim responsibility for any injury to people or property resulting from any ideas, methods, instructions or products referred to in the content.