Article

Light Modulation and Biophoton Emissions: A Proof-of-Principle Study of Direct and Proximal Cellular Effects

Behavioural Neuroscience & Biology Programs, School of Natural Science, Laurentian University, Sudbury, ON P3E2C6, Canada
*
Author to whom correspondence should be addressed.
Appl. Sci. 2025, 15(18), 9858; https://doi.org/10.3390/app15189858
Submission received: 10 June 2025 / Revised: 3 September 2025 / Accepted: 5 September 2025 / Published: 9 September 2025

Abstract

Ultraweak photon emissions (UPEs) are a consistent feature of cellular metabolism, yet their potential role in mediating communication between cells remains poorly defined. This study examined whether temporally patterned light can produce biological effects not only in directly exposed malignant cells but also in neighboring, unexposed populations. B16-BL6 and MCF-7 cell lines were exposed to blue LED stimulation structured by a physiologically relevant temporal pattern, and photon emissions were quantified using a photomultiplier tube. Both cell lines showed increased viability and elevated photon emission centered near 21 Hz following direct exposure (p < 0.05). Importantly, B16-BL6 cultures that were never directly exposed but later housed in proximity to the stimulated cells displayed similar changes in both viability and emission frequency. These findings provide proof-of-principle evidence that patterned light can alter biophoton emissions and viability not only in directly stimulated cancer cells but also in proximal, unexposed populations, supporting the possibility of photonic propagation effects under controlled conditions.

1. Introduction

Biological systems interact with their environment and adjacent cells through a range of signaling mechanisms, some of which remain incompletely characterized [1,2,3,4]. Intercellular communication is critical for coordinating complex biological functions that exceed the capacity of individual cells. Traditionally, communication between cells is described via electrochemical signaling mechanisms. These mechanisms are well understood and provide a context for understanding both neuroscience and biological communication more broadly. Non-electrochemical interactions are increasingly hypothesized to contribute to both direct and indirect cell communication [2,5]. As an example, quorum sensing is a well-characterized communication mechanism in simple organisms [6]. Verma et al. [6] demonstrated that the bacterial species Aliivibrio fischeri initiates bioluminescence through quorum sensing, which involves releasing the signaling molecule autoinducer 3OC6-HSL. This molecule binds to the LuxR protein receptor, subsequently upregulating genes responsible for luminance. Additionally, Tessaro et al. (2018) demonstrated that bacterial cultures use biophoton emissions to convey information about environmental stress [1]. Their results showed that Escherichia coli and Serratia marcescens emit biophotons with species-specific peak frequencies in response to stress, hypothesizing that bacteria use biophotons for non-local communication. The present work was designed as a proof-of-principle investigation, intended to test whether patterned light can produce not only direct effects on cells but also measurable changes in unexposed, proximal populations.
These results suggest that light emitted from cells has the potential to influence surrounding biomolecules and cells endogenously. While chemical messenger communication is intriguing, the possibility of simple organisms communicating through emitted light is equally fascinating. Photons emitted from biological life, known as biophotons, have been observed in various organisms, including microorganisms, plants, and human cells [7,8,9,10]. Biophotons typically emit in the range of 200–800 nm and are often observed as ultraweak photon emission (UPE) [11]. UPE, distinct from light with a short wavelength (100–400 nm), and chemiluminescence, which is detectable without the use of ultrasensitive photodetectors, originate from metabolic processes or oxidative stress [12,13].
Malignant cell lines, such as B16-BL6 cells, have been shown to produce significantly more biophotons than non-cancerous cells, particularly at wavelengths of 420 nm and 500 nm [10]. For this reason, we selected B16-BL6 and MCF-7 cells not because of their malignancy per se, but because their elevated baseline photon emissions maximize the likelihood of detecting both direct and proximal effects in this proof-of-principle design. Additionally, biophoton emission from malignant cells shows prominent frequencies near 20 Hz [14]. It has also been demonstrated that application of a 20 Hz mechanical vibration through anisotropic magnetic micro/nanoparticles induces cell death in malignant cell lines, further demonstrating a relationship between this frequency and malignancy [15]. If cells are sensitive to vibratory stimulation at 20 Hz and also emit biophotons, could the same frequency, when delivered as light, produce a similar biological effect? The extent to which cancer cells influence the behavior of neighboring cells through biophoton emission remains unclear and is the focus of ongoing investigation.
This raises a more specific question: can patterned light, delivered at biologically relevant frequencies, mediate signaling between cells in vitro? To explore this, we conducted a series of controlled in vitro experiments. We compared two distinct cell lines (MCF-7 and B16-BL6) with respect to their responses under direct and indirect exposure to LED light sources. In this experiment, direct exposure refers to cells being placed directly in the path of the light source, such as a blue LED, thereby receiving the full light intensity. Conversely, indirect exposure refers to cells that were not exposed to the light source themselves but were placed on top of the previously exposed direct exposure cell culture. This setup examines whether secondary exposure, despite lacking direct light, can still influence cellular viability and biophoton emission dynamics. By comparing the outcomes of direct and indirect exposure, this proof-of-principle study aimed to assess whether patterned LED stimulation can alter biophoton emissions and viability in cancer cell lines and whether such effects extend to proximal, unexposed populations.

2. Materials and Methods

2.1. Cells

2.1.1. B16-BL6

This experiment utilized two malignant cell lines, the first of which was B16-BL6 cells derived from mouse melanoma cells obtained through the American Type Culture Collection (Manassas, VA, USA). Initially, the cells were cultured on 100 × 15 mm medium-adherence culture plates, which contained 11 mL of DMEM/high-glucose media (Hyclone; Thermo Fisher, Mississauga, ON, Canada), with the addition of 10% fetal bovine serum and 1% antibiotic and antimycotic (A + A) solution. In addition, 100 × 15 mm medium-adherence culture plates were sub-cultured twice a week at a ratio of 1:5 and maintained in a 37 °C incubator with a CO2 concentration of 5% and 100% humidity. Before initiation of an experiment, 60 × 15 mm medium-adherence plates were cultured overnight with approximately 200,000 cells.

2.1.2. MCF-7 Cells

The second malignant cell line utilised in this experiment was wild-type MCF-7 cells derived from breast cancer cells obtained through HSNRi donated by Dr. Parassenti. Initially, the cells were prepared in T75 venting tissue culture flasks, which contained 11 mL of DMEM/high-glucose media (Hyclone; Thermo Fisher, Mississauga, ON, Canada), with the addition of 10% fetal bovine serum and 1% antibiotic and antimycotic (A + A) solution. These same culture flasks were sub-cultured twice a week at a ratio of 1:4 and maintained in a 37 °C incubator with a CO2 concentration of 5%, and 100% humidity. Before initiation of the experiment, 60 × 15 mm medium-adherence plates were cultured overnight with approximately 200,000 cells.

2.2. Equipment

2.2.1. Application of LED

Each LED matrix comprised 8 individual LEDs that produce light at the same wavelength (430 nm or 645 nm). The LED matrix was connected to a digital-to-analogue converter (DAC) that received information from an IBM XT computer programed with Complex2© software. LEDs were either pulsed with a temporally oscillating pattern known as the “Thomas” pattern or remained turned on in a static fashion. The digital file containing the “Thomas” pattern is composed of 849 points with corresponding values from 1 to 256. This pattern contains 18 doublet peaks which gradually decrease in frequency, ranging from a 3 ms interval for the first 5 repeats (25 Hz) to a 120 ms interval (6 Hz) for the final 5 repeats. This pattern was used because of its ability to produce physiological changes in biological systems through application of LEDs or EMFs. The Thomas pattern can be seen in Figure 1.

2.2.2. Photomultiplier Tube (PMT)

To quantify the number of photons released from a cell plate of B16-BL6 and MCF-7 cells, a Model DM0090C digital photomultiplier tube (PMT) was utilised (SENS-TECH Sensory Technologies, Surrey, UK). This PMT model has a spectral response range of 280 to 630 nm and a peak Quantum Efficiency (QE) of 400 nm. This PMT is housed in a dark box contained inside a dark room. The dark box is composed of wood that has been painted black and has dimensions of 15 × 15 × 15 cm. This box opens at the top portion to allow cells to be placed inside over the PMT. The PMT is connected via a USB to a laptop placed adjacent to the dark box, where photon measures are recorded by utilizing Counter Timer software installed on the laptop. The PMT is capable of measuring photons with a sample rate ranging from 0.4 Hz to 100 Hz and can record between 1 and 32,000 points within a single measure. For the purpose of this experiment, a sample rate of 20 milliseconds (50 Hz) was always utilized, for a total of 9000 measures, resulting in 3 min photon recordings.

2.3. Exposure Protocol

The exposure protocol was identical for each cell type. Initially, two plates of cells were split from a stock. One day later, each plate was measured over the PMT to obtain a baseline of its photon emission. Following these baseline measures, a single plate was exposed to a blue (430 nm) Thomas-patterned LED or a constant, non-patterned, blue (430 nm) LED for approximately 20 min. Because it was directly exposed to the LED conditions, this plate was termed the direct exposure condition. Following this, the direct exposure plate was left to rest on top of the unexposed plate inside the incubator for the duration of the experiment (approximately 72 h, until viability counts were assessed). This indirect exposure period was held constant across experiments to allow consistent comparison of post-exposure effects; no variations in indirect exposure time were tested in the present study. This period acted as the second plate’s indirect exposure to the blue Thomas-patterned LED; as such, it was termed the indirect exposure group. After each plate’s respective exposure period (direct or indirect), it was placed on the photomultiplier tube (PMT) to measure the biophotons emitted. Biophoton recordings were also obtained once a day for the subsequent three days, at a duration of three minutes with a sampling rate of 50 Hz. To control for the likelihood of alpha error, only PMT data 24 h post exposure was analyzed. In each experimental run, a control plate that received no exposure (neither direct nor indirect) was maintained alongside the experimental plates, but positioned separately to avoid unintended proximity effects. The experiment was considered complete once the control plate reached approximately 95% confluence. This consistently occurred 3 to 4 days after seeding, at which point, all plates were assessed for cell viability.

2.4. Viability Assessment

2.4.1. Obtaining Cell Pellet

After three days of consecutive PMT measures, the cells were harvested (four days post cell splitting). Viable and non-viable cell counts were obtained using a standard hemocytometer protocol. First, the cell media were dumped from each Petri dish, which was then washed with phosphate buffer solution (PBS) to remove any remaining media. Next, 1.0 mL of Trypsin was added to each Petri dish before being placed in the incubator for 5 min to detach the cells from the Petri dish. Following incubation, 1.0 mL of media was added to each Petri dish, which was then aspirated and used to wash the surface of the plate to collect any remaining cells. Once the solution was collected in 2.0 mL Eppendorf tubes, they were centrifuged at 500 RPM for 5 min to obtain a cell pellet. The supernatant (media and trypsin) was then dumped, and the cell pellet was re-suspended in 1.0 mL of new media. From here, 100 µL of the cell solution was collected and moved to a new Eppendorf tube, where it was mixed with 100 µL of Trypan Blue. This dye stained non-viable cells blue and was unable to penetrate the membrane of viable cells, leaving them white in appearance.

2.4.2. Cell Counting with a Hemocytometer

Two portions of 10 µL were then obtained from the dyed cell solution before being placed on the two grids of the hemocytometer. After the cover slip is placed over the dyed solution, cell counting may begin. Cells were counted from left to right before moving down to the next row of the grid and using a counter clicker to enhance accuracy. Four grids were counted for both viable and non-viable cells, which were then averaged to obtain a number for a given plate. This number was then doubled to account for the dilution of Trypan Blue in addition to being multiplied by 10,000 to scale up a square from a hemocytometer grid and obtain the number of viable and non-viable cells per milliliter.

2.4.3. Cell Counting with CountessTM

Towards the end of data collection, plates of cells were counted using the Invitrogen Countess™ Automated Cell Counter. Plates counted with the Countess™ were processed in the same manner as those counted with a hemocytometer; however, instead of adding 10 µL of the dyed cell solution to the hemocytometer grid, it was added to a well of a reusable Countess™ Cell Counting Chamber Slide before being inserted into the machine. This device had a cell sample range of 1 × 10⁴ to 1 × 10⁷ cells per milliliter and assessed viable and non-viable cells using Countess™ software.

2.5. Statistical Analysis

All data obtained from experimentation with each cell line was processed using IBM SPSS statistical analysis software version 29 (IBM, Markham, ON, Canada) and Graph Pad Prism version 10.2.2 for Mac OS X, GraphPad Software, Boston, MA, USA, www.graphpad.com. Observed viable cell counts were converted to viable cells per millilitre using a formula listed under the Sigma-Aldrich protocol (2022). All data was found to be normally distributed using Graph Pad Prism through the Kolmogorov–Smirnov and Shapiro–Wilk tests, which assessed the homogeneity of variance of the number of viable cells per millilitre, and spectrally analyzed photon emission data. One-way ANOVAs were conducted, followed by independent samples t-tests to compare subsets of all normally distributed data. Raw photon emission readings were standardized and spectrally analyzed before being sorted into 0.1 Hz bins including all frequencies up to 25.0 Hz. This data contains all recorded values with the removal of no outliers. An a priori criterion was established for reporting and interpreting significance. For any result to be considered significant, a statistically significant ANOVA was required, along with a significant Tukey’s HSD post hoc test (controlling for multiple comparisons) and a Cohen’s d of at least 0.5.

3. Results

3.1. Increase in Viable Cells/mL After Exposure to the Blue Thomas-Patterned LED

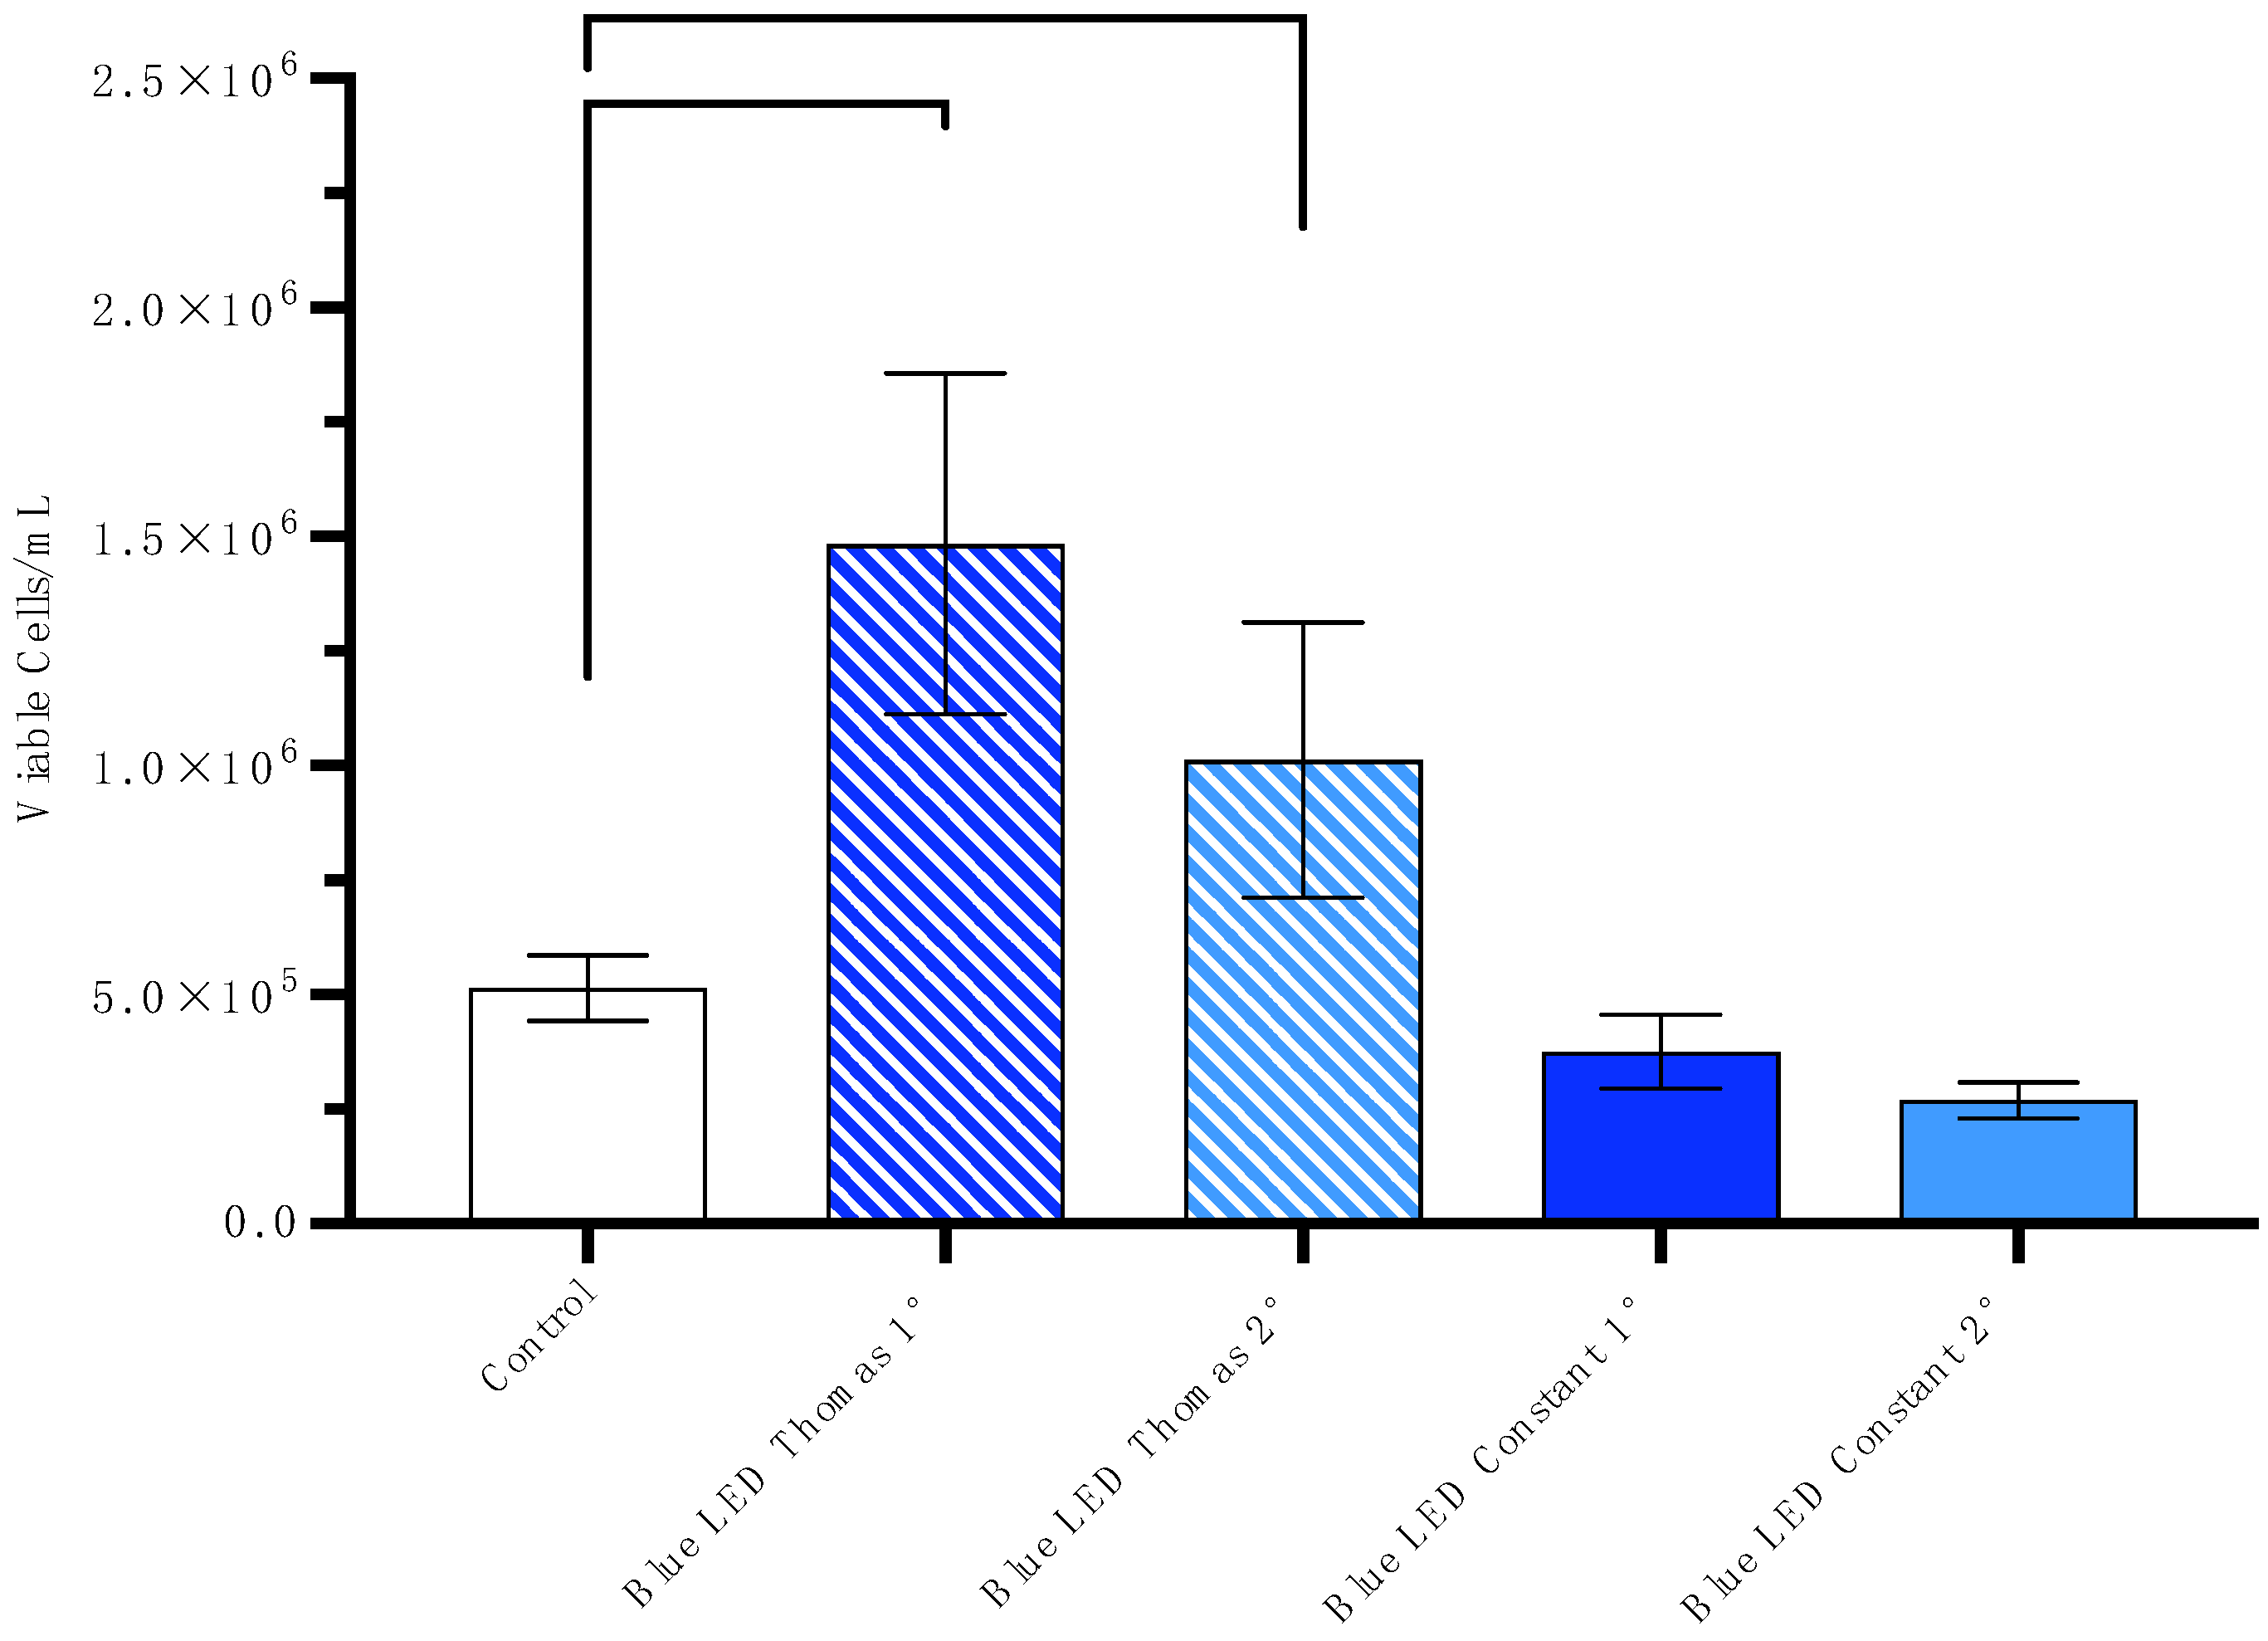
For figure clarity, directly and indirectly exposed plates are referred to as primary (1°) and secondary (2°), respectively. An ANOVA was conducted on B16-BL6 cell viability across all conditions. A significant effect for viability was observed [F(4, 45) = 2.679, p = 0.044]. Post hoc analysis revealed a significant increase in the number of viable B16-BL6 cells per milliliter, which was observed after direct exposure to the blue Thomas-patterned LED [t(27) = 2.792, p = 0.009, Cohens’ D = 0.999307]. Additionally, a significant increase in viable cells was observed for cells indirectly exposed to the blue Thomas-patterned LED [t(26) = 2.156, p = 0.040, Cohen’s D = 0.757884]. These results can be seen in Figure 2. Additionally, this same increase in viable cells per milliliter was also found for MCF-7 cells [F(4, 33) = 7.270, p < 0.001]. It was found that when MCF-7 cells were directly exposed to the blue Thomas-patterned LED, there was a significant increase in cell viability [t(21) = 4.214, p < 0.001, Cohen’s D = 1.548181]. Additionally, a significant increase in viable cells was observed for cells indirectly exposed to the blue Thomas-patterned LED [t(21) = 2.452, p = 0.012, Cohen’s D = 0.955048]. These results can be seen in Figure 3.

3.2. SPD of Photon Emission 24 h After Cells Are Exposed to the Blue Thomas-Patterned LED

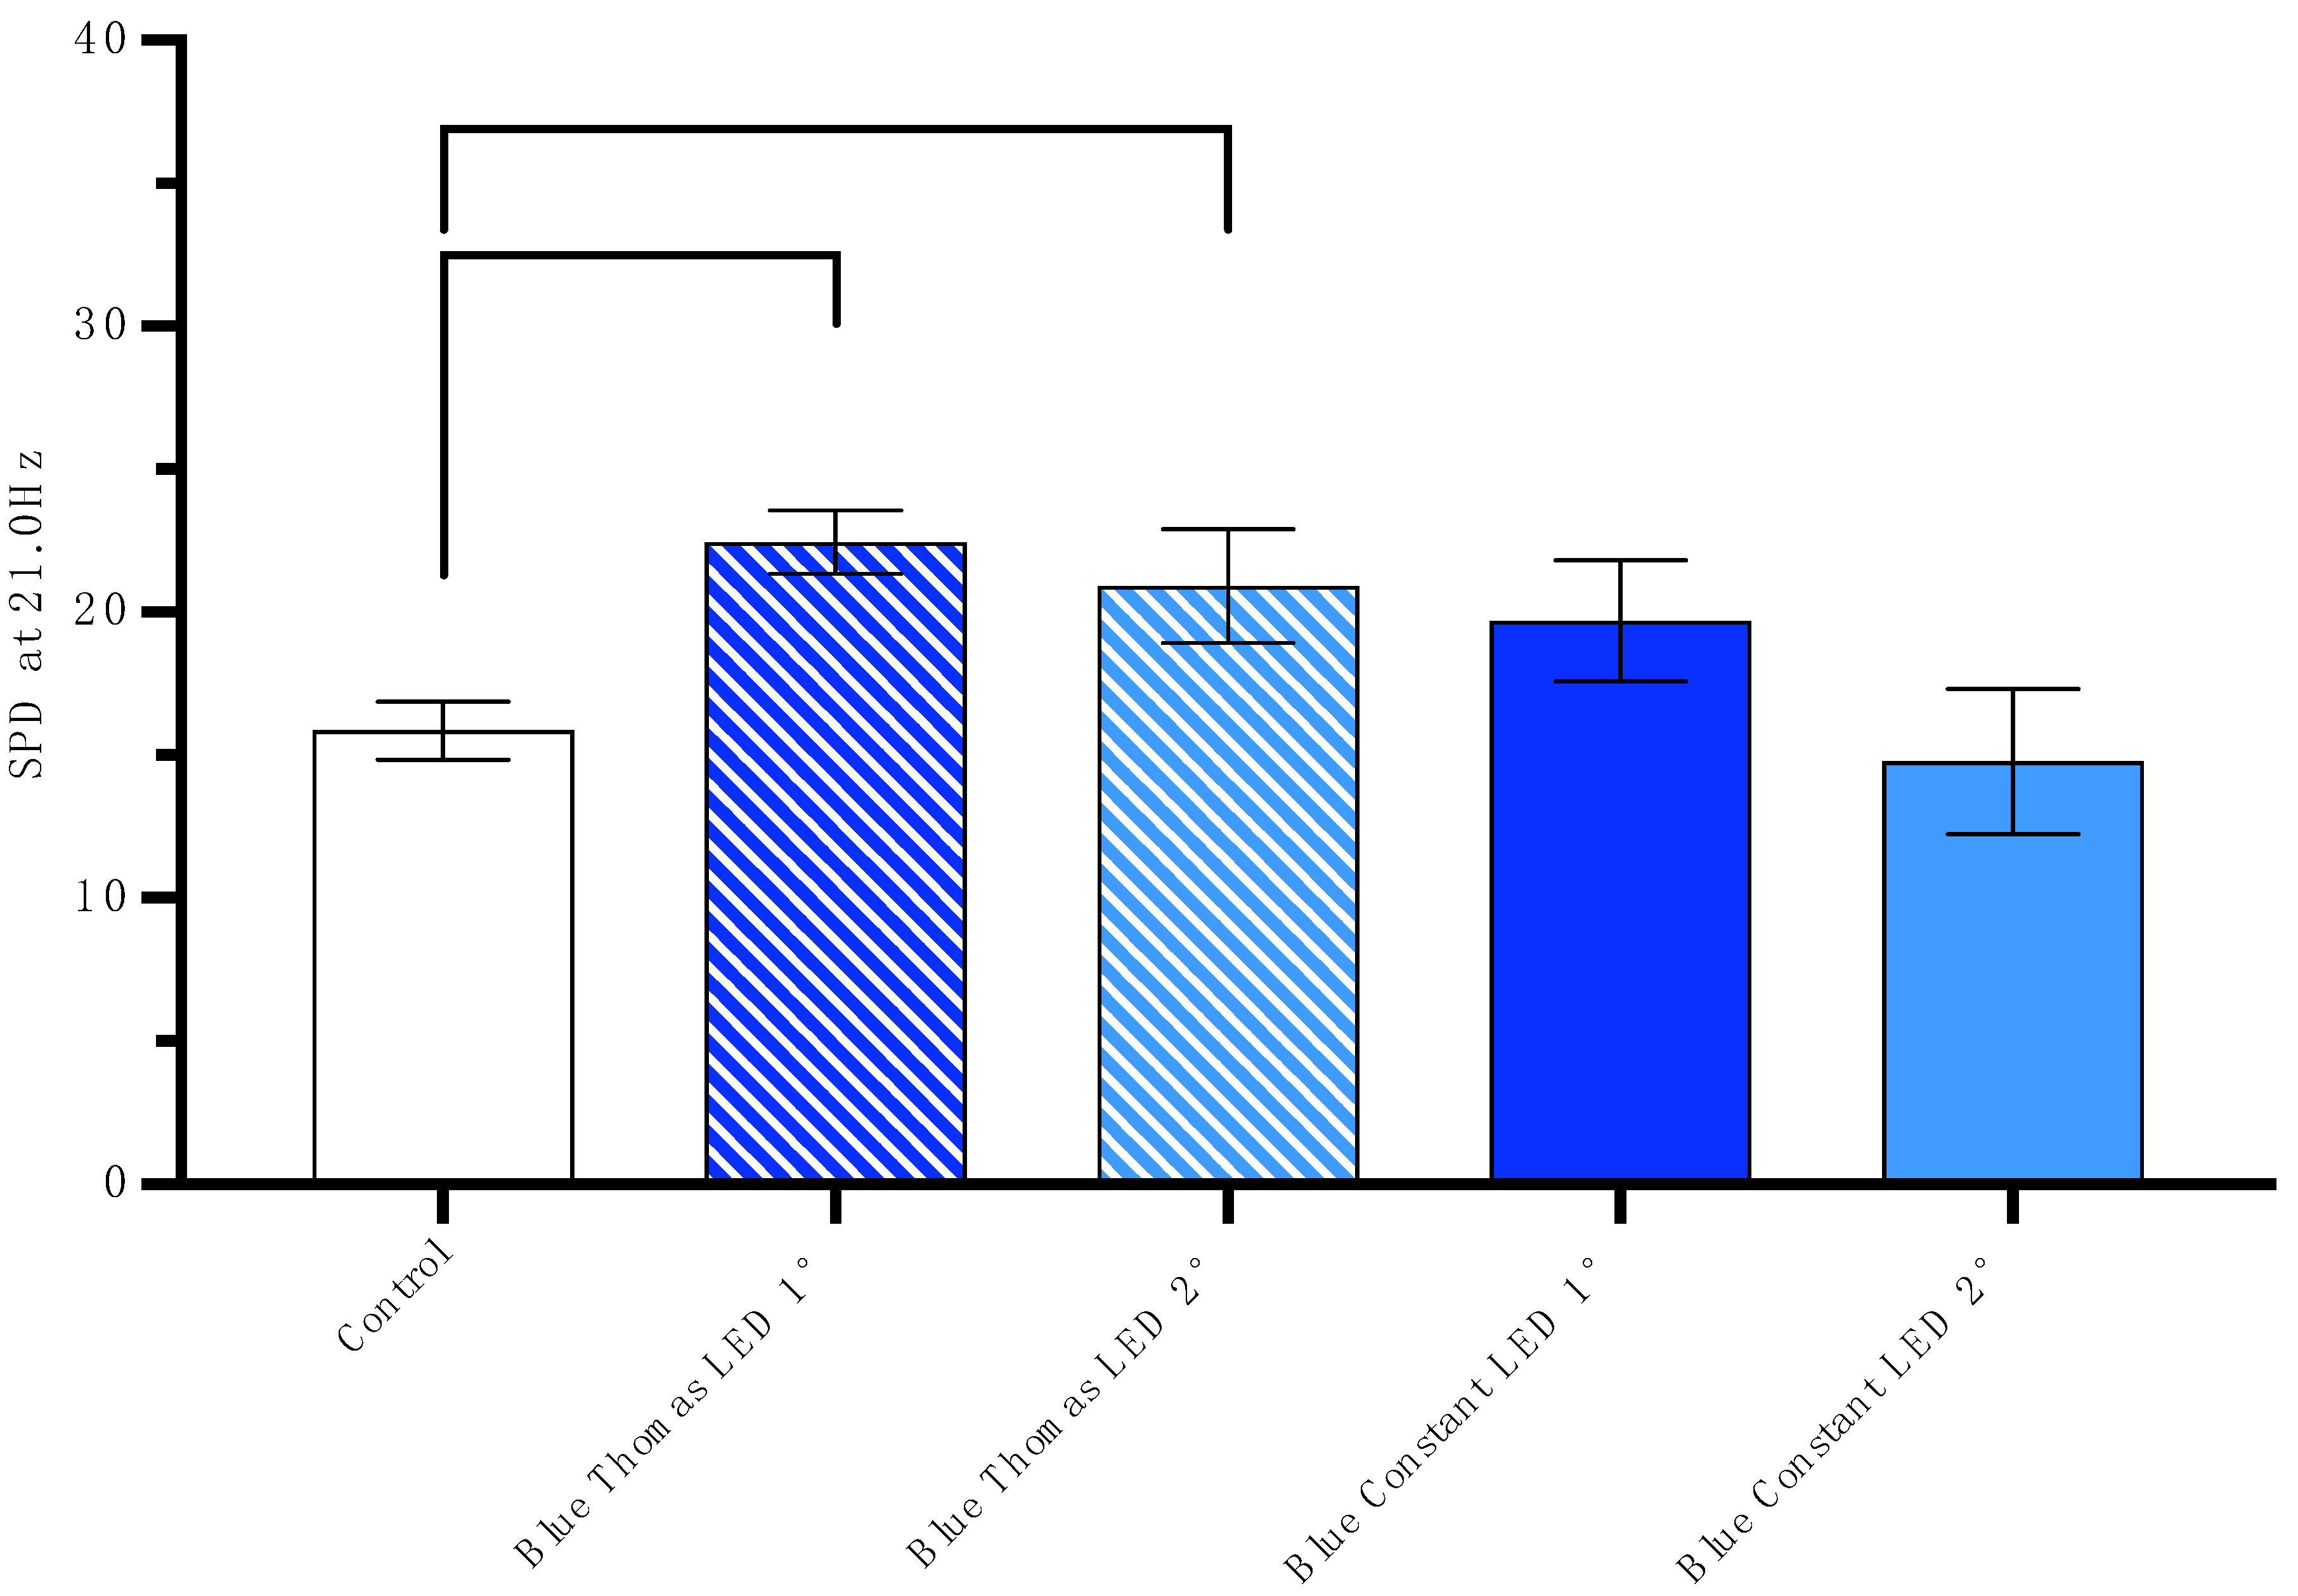
Twenty-four hours post-exposure, a significant increase in the spectral power density (SPD) of photon emission was recorded for B16-BL6 cells directly exposed to the blue Thomas-patterned LED [F(4, 45) = 4.475, p = 0.004]. Post hoc analysis revealed that both the direct and indirect exposed conditions showed increased SPD at 21 Hz compared to controls when exposed to blue light only [t(26) = 4.368, p < 0.001, Cohen’s D = 1.675584] [t(25) = 2.466, p = 0.021, Cohen’s D = 0.920261]. This can be seen in Figure 4. However, a significant increase in SPD was not observed in MCF-7 cells across conditions [F(4, 33) = 1.500, p = 0.225]. Post hoc analysis revealed that only the direct exposed condition showed increased SPD at 21.2 Hz compared to controls when exposed to blue light only [t(21) = 2.165, p = 0.042, Cohen’s D = 1.35055]. This can be seen in Figure 5.

4. Discussion

This study demonstrates a significant increase in the viability of B16-BL6 cells following both direct and indirect exposure to blue Thomas-patterned LED light. A similar effect was observed in MCF-7 cells under the same conditions. These effects were not observed under constant blue light exposure, indicating that temporal patterning plays a critical role in modulating viability. While prior studies have shown that blue light can influence cancer cell proliferation, the pattern-specific and proximity-based effects observed here suggest a more selective and structured mechanism of action [16,17,18,19]. The replication of this effect in indirectly exposed B16-BL6 cells raises the possibility that emitted signals, potentially photonic, may contribute to intercellular communication.
While both B16-BL6 and MCF-7 cells exhibited increased viability following direct and indirect exposure to patterned blue light, only B16-BL6 cells showed a significant increase in photon emission (SPD) under indirect exposure conditions. MCF-7 cells, by contrast, demonstrated increased viability in the indirect condition but did not exhibit changes in SPD. This divergence suggests that, although both cell lines respond to patterned light at the level of viability, their photonic output in non-illuminated contexts may depend on intrinsic biophysical or metabolic features. These differences highlight the importance of cell-type specific factors in mediating not just responsiveness to light but also the potential for light-based signaling between cell populations. Such differences may in part reflect the cells’ distinct tissue origins. Melanoma cells, derived from pigment-producing skin cells, are naturally exposed to light in vivo and may possess photoreceptive and photoprotective mechanisms that modulate their response to patterned blue light. By contrast, breast epithelial-derived cells such as MCF-7 are not typically light-exposed in their native environment and may rely on different signaling pathways when stimulated. These intrinsic differences could contribute to the divergent photonic and viability profiles observed in this study.
Previous work by Peidaee et al. demonstrated a differential responses of breast and skin cells post exposure to infrared and visible spectrum LEDs that may lend incite to the varied spectral response of B16-BL6 and MCF-7 cells [20]. However, it should be noted that this study compared cancerous breast cells (MCF-7) to non-cancerous skin cells (HEM), adding an additional explanation for the observed difference exhibited by breast and skin cells post LED application. Although speculative, the differential response observed between cell types may be influenced by underlying biophysical properties such as cytoskeletal resonance or redox-sensitive signaling pathways, both of which have been shown to respond to electromagnetic or photonic stimulation in other contexts [21,22]. B16-BL6 cells, as a melanoma line, often exhibit altered cytoskeletal organization, including changes to microtubule dynamics, which play key roles in intracellular signaling and responsiveness to environmental stimuli [23,24]. These features may contribute to their heightened sensitivity to patterned blue light, even in the absence of direct illumination. In addition, both B16-BL6 and MCF-7 cells have been reported to show increased reactive oxygen species (ROS) activity mediated by NADPH oxidase, an enzyme complex that has been implicated in light-responsive signaling pathways [25,26]. While this study did not directly assess these molecular systems, they represent plausible mechanisms for the pattern- and proximity-dependent effects observed here and warrant further targeted investigation.
A notable observation across both cell lines was the emergence of photon emission peaks centered near 21 Hz following exposure to the Thomas-patterned field, which itself is driven at 20 Hz. This shift may reflect the way cellular systems entrain to external rhythmic input, producing output that echoes but does not perfectly match the stimulation frequency. In B16-BL6 cells, the 21 Hz signal was observed even under indirect exposure conditions, whereas in MCF-7 cells, it was only present following direct exposure. This distinction supports the possibility that specific cellular features, such as structural or metabolic resonance properties, may influence the ability to sustain photonic activity in response to external patterned light. While the exact mechanism remains unclear, the consistency of this shifted frequency response suggests a non-random, potentially tunable interaction between the stimulation pattern and intracellular dynamics. All exposures were delivered at the fixed output of the LED arrays used in this study, and no adjustments to irradiance were made. Although the present results demonstrate clear effects under these standardized conditions, the viability and photon-emission changes observed here may depend on the intensity of the primary exposure. Future work incorporating controlled variation in irradiance will be important to determine whether these effects exhibit an optimal dose window or biphasic response profile. In addition to irradiance, the temporal profile of the viability effect remains to be characterized. The present work employed a fixed 72-h post-exposure endpoint to ensure consistent comparison across conditions. However, repeated viability measurements at earlier and later timepoints could reveal whether the effect emerges rapidly, accumulates gradually, or follows a biphasic trajectory. Mapping these dynamics, along with systematically varying exposure parameters, will be important for defining the conditions under which patterned light produces maximal biological impact.
While the results suggest a pattern-specific and proximity-dependent influence of light on cell behavior, several limitations must be acknowledged. The present study did not attempt to identify the precise molecular mechanisms underlying the observed effects; mechanistic investigations, including assays of intracellular signaling cascades, gene expression, and protein-level changes, are planned as part of ongoing work. These experiments will require an extended timeline but will be essential for determining how temporally patterned light produces both direct and proximity-mediated cellular responses. Future work should also incorporate physical light-blocking barriers, additional wavelengths and LED patterns, and inter-laboratory replication to further validate the findings. Additionally, while the present study maintained a fixed indirect exposure duration of approximately 72 h to standardize conditions, the temporal dynamics of this effect remain unknown. Shorter or longer indirect exposures may modulate the magnitude or onset of viability and photonic changes, and systematically varying durations will be an important next step. Finally, the experiments were limited to two malignant cell lines with high baseline UPE, chosen to maximize the probability of detecting both direct and proximity effects. Whether similar responses occur in normal, non-malignant cells remains unknown, and incorporating such controls will be essential to determine the specificity of these effects to cancer cell physiology. Despite these limitations, the observed changes in viability and photon emission were consistent across replicates and conditions, adding to growing evidence that light-based signaling may contribute to intercellular communication under certain conditions. These findings provide a necessary foundation for more detailed mechanistic work.

5. Conclusions

This study demonstrates that patterned blue LED exposure significantly increases cell viability and alters ultraweak photon emission dynamics in two malignant cell lines, B16-BL6 and MCF-7. These effects were specific to temporally patterned stimulation and were not observed under constant blue light exposure, highlighting the importance of light structure in modulating biological activity. More notably, the same effects were observed in B16-BL6 cells that were not directly exposed to the light source but were instead positioned in proximity to previously illuminated cultures. These indirectly exposed cells exhibited the exact same effect of increased viability and altered photon emission periodicities, including a specific spectral peak near 21 Hz. This frequency is closely aligned with the dominant frequency of the patterned field. This response, replicated without direct stimulation, suggests the possibility of a non-contact, photonic communication mechanism between cell populations.
Taken together, these findings point to a resonance-dependent, pattern-specific influence of light on malignant cell behavior and raise the potential for biophoton-based signaling to contribute to intercellular communication under controlled conditions. Future work should further isolate and characterize this indirect effect to determine whether emitted photons play a functional role in modulating biological responses in nearby, unexposed cells.

Author Contributions

Conceptualization, S.J.L. & B.T.D.; methodology, S.J.L. & B.T.D.; formal analysis, S.J.L. & B.T.D.; investigation, S.J.L.; resources, B.T.D.; data curation, S.J.L.; writing—original draft preparation, S.J.L. & B.T.D.; writing—review and editing, S.J.L. & B.T.D.; visualization, S.J.L.; supervision, B.T.D. All authors have read and agreed to the published version of the manuscript.

Funding

This research received no external funding.

Data Availability Statement

The datasets used and/or analyzed during the current study available from the corresponding author on reasonable request.

Conflicts of Interest

The authors declare no conflicts of interest.

Abbreviations

%Percent
A + AAntibiotic and Antimycotic Cell Culture Solution
ANOVAAnalysis of Variance
B16-BL6B16-BL6 Mouse Melanoma Cells
cmCentimeter
CO2Carbon Dioxide
DACDigital-to-Analogue Converter
EMFElectromagnetic Field
HzHertz
LEDLight-emitting Diode
LTPLong-term Potentiation
MCF-7MCF-7 Human Cancerous Breast Cell
mLMilliliter
mmMillimeter
NADPHNicotinamide Adenine Dinucleotide Phosphate Hydrogen
nmNanometer
PMTPhotomultiplier Tube
ROSReactive Oxygen Species
SEMStandard Error of the Mean
UPEUltraweak Photon Emission
μLMicroliter
μTMicro Tesla

References

  1. Tessaro, L.W.; Dotta, B.T.; Persinger, M.A. Bacterial biophotons as non-local information carriers: Species-specific spectral characteristics of a stress response. MicrobiologyOpen 2018, 8, e00761. [Google Scholar] [CrossRef]
  2. Fels, D. Correction: Cellular communication through light. PLoS ONE 2009, 4, e5086. [Google Scholar] [CrossRef]
  3. Cifra, M.; Fields, J.Z.; Farhadi, A. Electromagnetic cellular interactions. Prog. Biophys. Mol. Biol. 2011, 105, 223–246. [Google Scholar] [CrossRef] [PubMed]
  4. Tafur, J.; Van Wijk, E.P.A.; Van Wijk, R.; Mills, P.J. Biophoton detection and low-intensity light therapy: A potential clinical partnership. Photomed. Laser Surg. 2010, 28, 23–30. [Google Scholar] [CrossRef] [PubMed]
  5. Kučera, O.; Cifra, M. Cell-to-cell signaling through light: Just a ghost of chance? Cell Commun. Signal. 2013, 11, 87. [Google Scholar] [CrossRef]
  6. Verma, S.; Miyashiro, T. Quorum sensing in the squid-vibrio symbiosis. Int. J. Mol. Sci. 2013, 14, 16386–16401. [Google Scholar] [CrossRef]
  7. Niggli, H.J. Biophoton re-emission studies in carcinogenic mouse melanoma cells. In Recent Advances in Biophoton Research and Its Applications; World Scientific: Singapore, 1992; pp. 231–242. [Google Scholar] [CrossRef]
  8. Sun, Y.; Wang, C.; Dai, J. Biophotons as neural communication signals demonstrated by in situ Biophoton autography. Photochem. Photobiol. Sci. 2010, 9, 315–322. [Google Scholar] [CrossRef]
  9. Van Wijk, R.; Kobayashi, M.; Van Wijk, E.P.A. Anatomic characterization of human ultra-weak photon emission with a moveable photomultiplier and CCD imaging. J. Photochem. Photobiol. B Biol. 2006, 83, 69–76. [Google Scholar] [CrossRef]
  10. Dotta, B.T.; Buckner, C.A.; Lafrenie, R.M.; Persinger, M.A. Photon emissions from human brain and cell culture exposed to distally rotating magnetic fields shared by separate light-stimulated brains and cells. Brain Res. 2011, 1388, 77–88. [Google Scholar] [CrossRef]
  11. Popp, F.-A.; Gu, Q.; Li, K.-H. Biophoton emission: Experimental background and theoretical approaches. Mod. Phys. Lett. B 1994, 8, 1269–1296. [Google Scholar] [CrossRef]
  12. Cifra, M.; Pospíšil, P. Ultra-weak photon emission from biological samples: Definition, mechanisms, properties, detection and applications. J. Photochem. Photobiol. B Biol. 2014, 139, 2–10. [Google Scholar] [CrossRef] [PubMed]
  13. Chang, J.J.; Popp, F.A. Biological Organization: A possible mechanism based on the coherence of “biophotons”. In Biophotons; Springer: Berlin/Heidelberg, Germany, 1998; pp. 217–227. [Google Scholar] [CrossRef]
  14. Murugan, N.J.; Persinger, M.A.; Karbowski, L.M.; Dotta, B.T. Ultraweak photon emissions as a non-invasive, early-malignancy detection tool: An in vitro and in vivo study. Cancers 2020, 12, 1001. [Google Scholar] [CrossRef] [PubMed]
  15. Leulmi, S.; Chauchet, X.; Morcrette, M.; Ortiz, G.; Joisten, H.; Sabon, P.; Livache, T.; Hou, Y.; Carrière, M.; Lequien, S.; et al. Triggering the apoptosis of targeted human renal cancer cells by the vibration of anisotropic magnetic particles attached to the cell membrane. Nanoscale 2015, 7, 15904–15914. [Google Scholar] [CrossRef] [PubMed]
  16. Li, C.; Zhu, G.; Cui, Z.; Zhang, J.; Zhang, S.; Wei, Y. The strong inhibitory effect of combining anti-cancer drugs AT406 and rocaglamide with blue led irradiation on colorectal cancer cells. Photodiagnosis Photodyn. Ther. 2020, 30, 101797. [Google Scholar] [CrossRef]
  17. Nishio, T.; Kishi, R.; Sato, K.; Sato, K. Blue light exposure enhances oxidative stress, causes DNA damage, and induces apoptosis signaling in B16F1 melanoma cells. Mutat. Res. Genet. Toxicol. Environ. Mutagen. 2022, 883–884, 503562. [Google Scholar] [CrossRef]
  18. Oh, P.-S.; Na, K.S.; Hwang, H.; Jeong, H.-S.; Lim, S.; Sohn, M.-H.; Jeong, H.-J. Effect of blue light emitting diodes on melanoma cells: Involvement of apoptotic signaling. J. Photochem. Photobiol. B Biol. 2015, 142, 197–203. [Google Scholar] [CrossRef]
  19. Ohara, M.; Kawashima, Y.; Katoh, O.; Watanabe, H. Blue light inhibits the growth of B16 Melanoma Cells. Jpn. J. Cancer Res. 2002, 93, 551–558. [Google Scholar] [CrossRef]
  20. Peidaee, P.; Almansour, N.; Shukla, R.; Pirogova, E. The cytotoxic effects of low intensity visible and infrared light on Human breast cancer (MCF7) cells. Comput. Struct. Biotechnol. J. 2013, 6, e201303015. [Google Scholar] [CrossRef]
  21. Forman, H.J.; Torres, M.; Fukuto, J. Redox signaling. Mol. Cell. Biochem. 2002, 234–235, 49–62. [Google Scholar] [CrossRef]
  22. Binhi, V.N.; Chernavskii, D.S. Stochastic dynamics of magnetosomes in Cytoskeleton. Europhys. Lett. (EPL) 2005, 70, 850–856. [Google Scholar] [CrossRef]
  23. Roncato, F.; Regev, O.; Yadav, S.K.; Alon, R. Microtubule destabilization is a critical checkpoint of chemotaxis and transendothelial migration in melanoma cells but not in T cells. Cell Adhes. Migr. 2021, 15, 166–179. [Google Scholar] [CrossRef]
  24. Borys, F.; Joachimiak, E.; Krawczyk, H.; Fabczak, H. Intrinsic and extrinsic factors affecting microtubule dynamics in normal and cancer cells. Molecules 2020, 25, 3705. [Google Scholar] [CrossRef]
  25. Bonmati-Carrion, M.; Álvarez-Sánchez, N.; Hardeland, R.; Madrid, J.; Rol, M. A comparison of B16 melanoma cells and 3T3 fibroblasts concerning cell viability and Ros production in the presence of melatonin, tested over a wide range of concentrations. Int. J. Mol. Sci. 2013, 14, 3901–3920. [Google Scholar] [CrossRef]
  26. Lim, S.-L.; Voon, C.P.; Guan, X.; Yang, Y.; Gardeström, P.; Lim, B.L. In Planta study of photosynthesis and photorespiration using NADPH and NADH/NAD+ fluorescent protein sensors. Nat. Commun. 2020, 11, 3238. [Google Scholar] [CrossRef]
Figure 1. Visualization of the Thomas pattern: the y-axis represents the current in the solenoids (measured in voltage), and the x-axis represents time.
Applsci 15 09858 g001
Figure 2. Viable B16-BL6 cells by LED condition. A T-test revealed a significant increase when cells were exposed to the blue Thomas-patterned LED (dark blue slash) compared to controls (white) A significant increase was also observed when cells were indirectly exposed to the blue Thomas-patterned LED (light blue slash) compared to controls (white). Error bars represent SEM. Direct exposure (1°); indirect exposure (2°).
Applsci 15 09858 g002
Figure 3. Viable MCF-7 cells by LED condition. A T-test revealed a significant increase in the number of viable cells directly exposed to the blue Thomas-patterned LED (dark blue slash) when compared to controls (white). A significant increase was also observed when cells were indirectly exposed to the blue Thomas-patterned LED (light blue slash) compared to controls (white) [T(21) = 2.452, p = 0.023]. By contrast, MCF-7 cultures exposed to constant blue light did not differ from controls (post hoc comparisons n.s.). Error bars represent SEM. Direct exposure (1°); indirect exposure (2°).
Applsci 15 09858 g003
Figure 4. Spectral power density (SPD) of raw PMT measures at a frequency of 21.0 Hz from B16-BL6 cells one day after exposure to various LEDs. T-tests revealed a significant increase in SPD from B16-BL6 cells directly (dark blue slash) and indirectly (light blue slash) exposed to a blue Thomas-patterned LED at a frequency of 21.0 Hz when compared to control B16-BL6 cells (white) respectively. Error bars represent SEM. Direct exposure (1°); indirect exposure (2°).
Applsci 15 09858 g004
Figure 5. Spectral power density (SPD) of raw PMT measures at a frequency of 21.2 Hz from MCF-7 cells one day after exposure to various LEDs. T-tests revealed a significant increase in SPD from MCF-7 cells directly (dark blue slash) exposed to a blue Thomas-patterned LED at a frequency of 21.2 Hz when compared to control MCF-7 cells (white) Error bars represent SEM. Direct exposure (1°); indirect exposure (2°).
Applsci 15 09858 g005
Disclaimer/Publisher’s Note: The statements, opinions and data contained in all publications are solely those of the individual author(s) and contributor(s) and not of MDPI and/or the editor(s). MDPI and/or the editor(s) disclaim responsibility for any injury to people or property resulting from any ideas, methods, instructions or products referred to in the content.