Article

Assessing Carbon Emissions and Reduction Potential in Ecological and Concrete Slope Protection: Case of Huama Lake Project

1
Key Laboratory of Health Intelligent Perception and Ecological Restoration of River and Lake, Ministry of Education, Hubei University of Technology, Wuhan 430068, China
2
School of Civil Engineering, Architecture and Environment, Hubei University of Technology, Wuhan 430068, China
3
Geological Environmental Center of Hubei Province, Wuhan 430068, China
*
Author to whom correspondence should be addressed.
Appl. Sci. 2025, 15(18), 10169; https://doi.org/10.3390/app151810169
Submission received: 7 August 2025 / Revised: 15 September 2025 / Accepted: 16 September 2025 / Published: 18 September 2025

Abstract

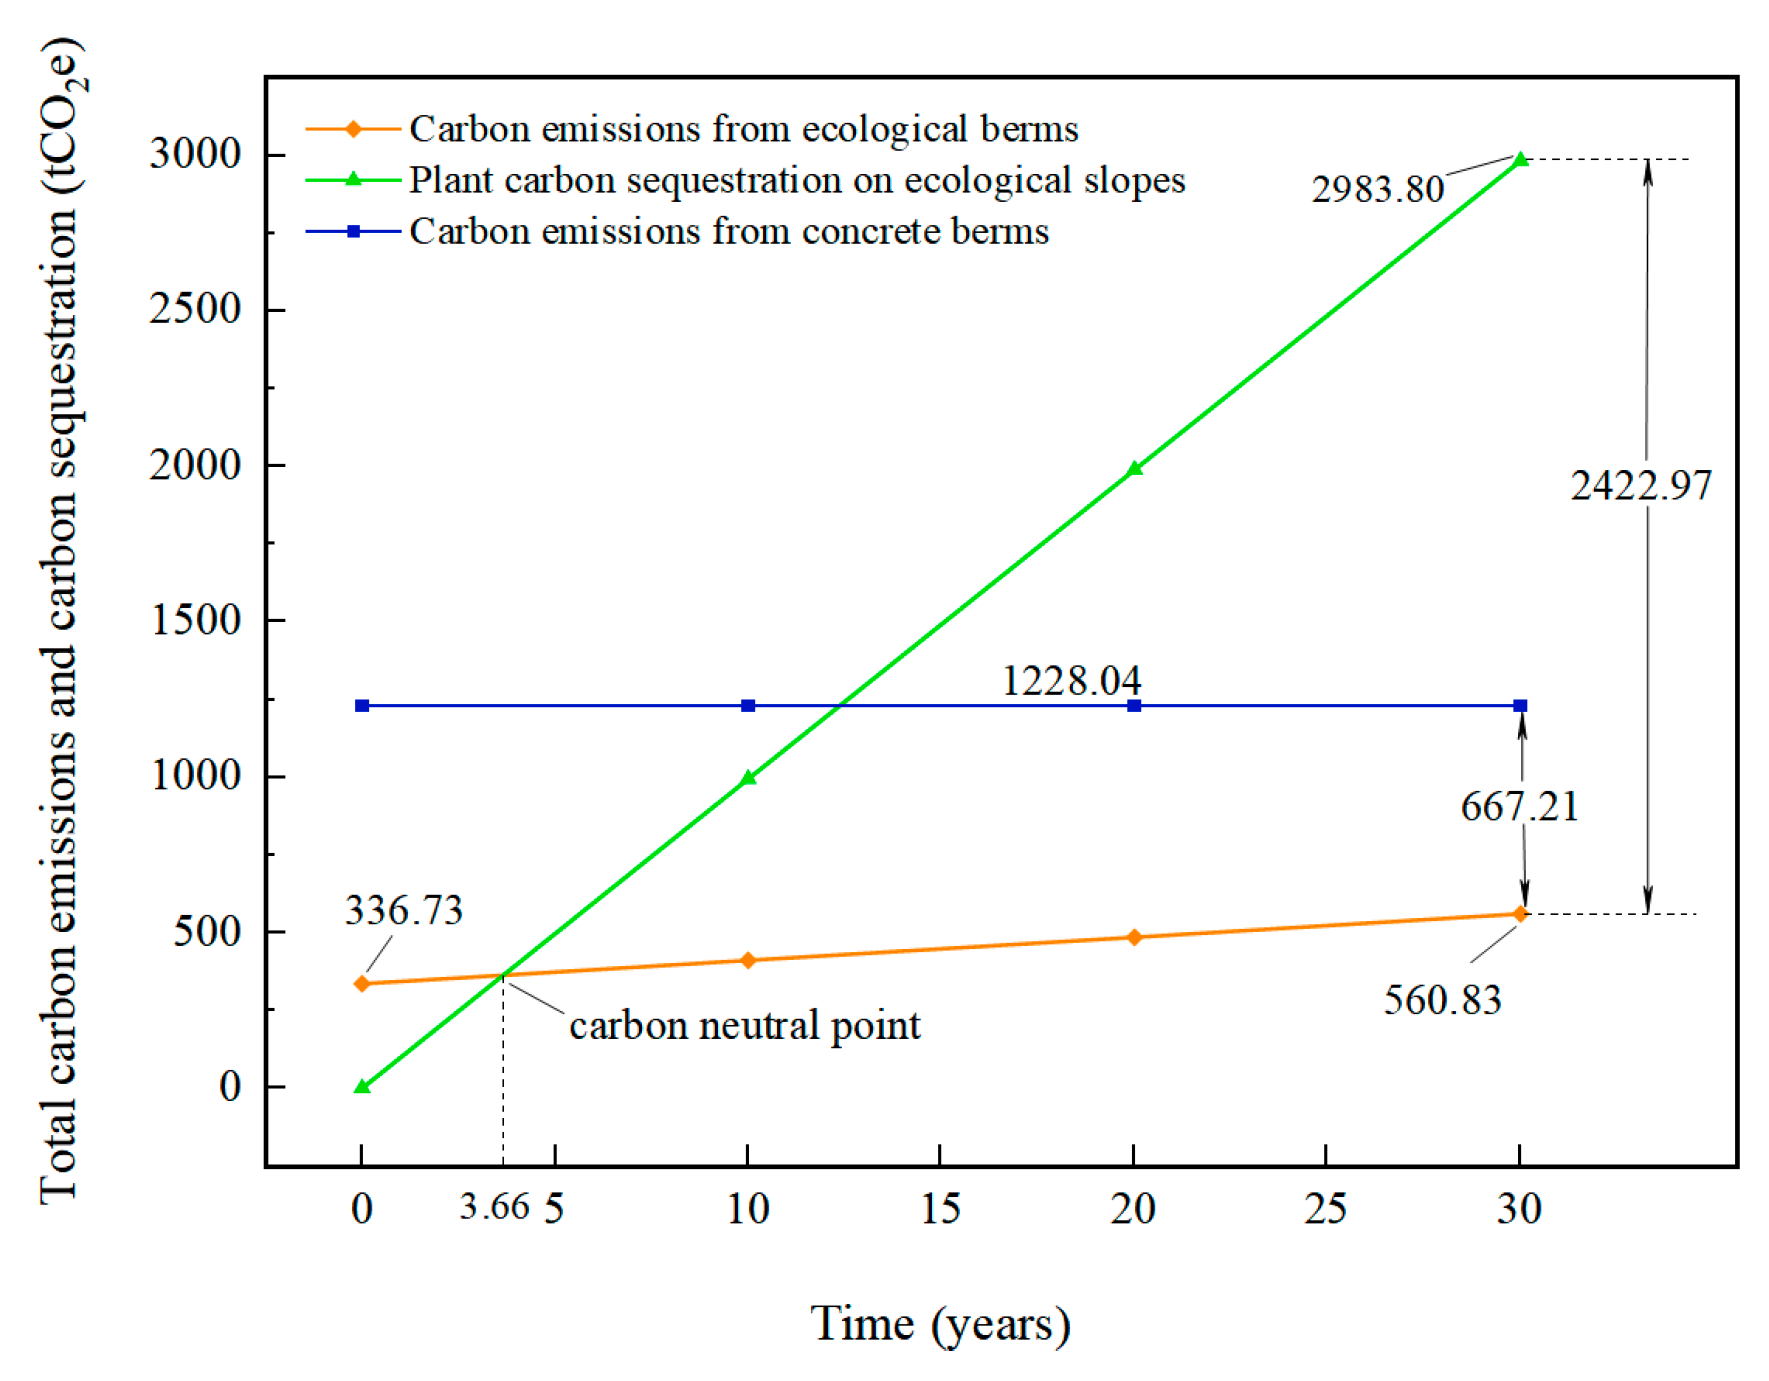
This study aims to evaluate and compare the carbon emissions and reduction strategies of two different slope construction methods—concrete slope protection and ecological sprayed-soil slope protection—using a life-cycle assessment (LCA) approach. The research focuses on identifying key carbon emission sources throughout each stage of the construction, from material production to transportation, construction, and maintenance, with a particular emphasis on the ecological benefits of vegetation in reducing carbon footprints. Results indicate that the ecological slope protection scheme significantly outperforms the concrete scheme, reducing total carbon emissions by 667.21 tons. Furthermore, the ecological solution, due to its carbon sequestration capabilities, is projected to achieve carbon neutrality within 3.66 years after completion, offering a net carbon sequestration benefit of 2422.97 tons over its lifecycle. Optimization strategies across various stages—material production, transportation, construction, and maintenance—further reduce emissions by 56.8%, underscoring the potential for ecological slope protection to contribute to sustainable construction practices. This study not only provides valuable insights into low-carbon construction methods but also highlights the importance of integrating ecological and engineering technologies to meet global carbon reduction goals.

1. Introduction

In recent years, climate change has altered rainfall patterns, with frequent heavy rainfall penetrating exposed slope soils. This increases the weight and saturation of the soil, thereby reducing its strength and significantly decreasing slope stability, making it more prone to disasters like collapses and landslides [1,2]. Although traditional riverbank slope protection (concrete slope protection) can enhance slope stability, reduce erosion, and provide flood control, its stability generally deteriorates over time. The slope safety factor steadily decreases by 2.3% to 2.4% annually, impacting its protective function [3,4]. Moreover, rigid materials block the exchange of matter and energy between the water and the slope soil matrix, significantly weakening the ecological effects of slope protection. This neglects the river ecosystem and its environment for plants, animals, and microorganisms, disrupting the water ecological cycle [5]. Additionally, concrete slope protection relies heavily on high-carbon materials like cement, concrete, and steel, increasing carbon dioxide concentrations, which exacerbate global warming and environmental issues, such as natural disasters [6]. This construction method has highlighted its contradiction with the goal of sustainable development.
According to the Copernicus Climate Change Service’s meteorological monitoring report, 2024 is projected to be the hottest year on record, with the global average temperature surpassing the 1.5 °C threshold set by the Paris Agreement for pre-industrial levels. This poses a significant challenge to global climate efforts [7]. Considering the construction industry’s substantial impact on greenhouse gas emissions and the increasing global attention on climate change, the sector has become a central focus in the transition to sustainable building practices [8]. To align with ecological sustainability goals and reconcile slope stability with ecological benefits, the concept of ecological protection has been increasingly applied to artificial slope construction and management [9]. Unlike traditional riverbank slope protection methods, ecological slope protection strengthens the soil through an intricate network of plant roots, significantly increasing the shear strength of the slope’s shallow soil layer. Deep-rooted anchorage and lateral root traction further enhance the overall stability of the slope. Furthermore, vegetation slows surface runoff, reduces the erosive impact of rainwater on the slope, and decreases soil erosion, aiding in water conservation and soil stabilization. This innovative integration of civil engineering and plant materials is increasingly applied in modern slope protection projects [10,11,12]. Ecologically friendly slope construction methods prioritize natural materials like soil, plant roots, and gravel, reducing reliance on high-energy materials. This leads to a simpler construction process, shorter cycles, and reduced machinery use, among other benefits. Consequently, carbon emissions from constructing ecological slopes are significantly lower than those from structural slopes [13]. In response to climate change, ecological slope protection harnesses the carbon sequestration and oxygen release capabilities of plants to absorb carbon dioxide, offsetting emissions from slope construction. This provides the project with carbon neutrality potential and enables significant carbon sequestration over its lifecycle [14].
However, it is crucial to acknowledge that these sustainability benefits are not without potential trade-offs. As noted, ecological slope protection also presents limitations. In canal rivers exposed to flash floods or high-velocity flows, vegetation cover and soil substrates are vulnerable to erosion before root systems are sufficiently developed. Severe flooding may compromise slope integrity, leading to partial or complete failure. Such failures often require costly maintenance or reconstruction, which can offset anticipated carbon benefits by generating additional emissions [15]. Therefore, a comprehensive evaluation of ecological slope protection must extend beyond its carbon sequestration potential to include its resilience and durability under extreme conditions. From a life-cycle perspective, optimizing design and construction is essential to improve performance and minimize carbon footprints across all project stages, even under disruptive events.
Although a life-cycle perspective is essential, most studies on slope-related carbon emissions analyze a single construction method in isolation and rarely compare processes or quantify stage-specific abatement potential. To address this gap, this study examines a built riverbank protection project and, using LCA, compares both stage-wise and total emissions across alternative construction schemes. The analysis identifies effective abatement strategies and translates them into targeted design and construction optimizations, thereby strengthening the methodological basis for life-cycle carbon assessment of ecological slope protection.

2. Study Area

The Huama Lake Water System Connecting Canal Ecological Slope Protection Project is situated in Xinyuan Village, Shawo Township, Ezhou City, Hubei Province. The total length of the Xinyuan section is 1.0564 km (from LT3+000 to LT3+256.4 and YJ0+000 to YJ0+800). The lake spans 20.07 km2, with a total length of 2.2 km, a design flow rate of 80 m3/s, a slope range of 15–80°, and a water storage depth of 4.3 m. The canal also passes through two peaks over 50 m high. The slopes along the canal are typical steep rock slopes, with some sections comprising mixed rock-soil and soil slopes.
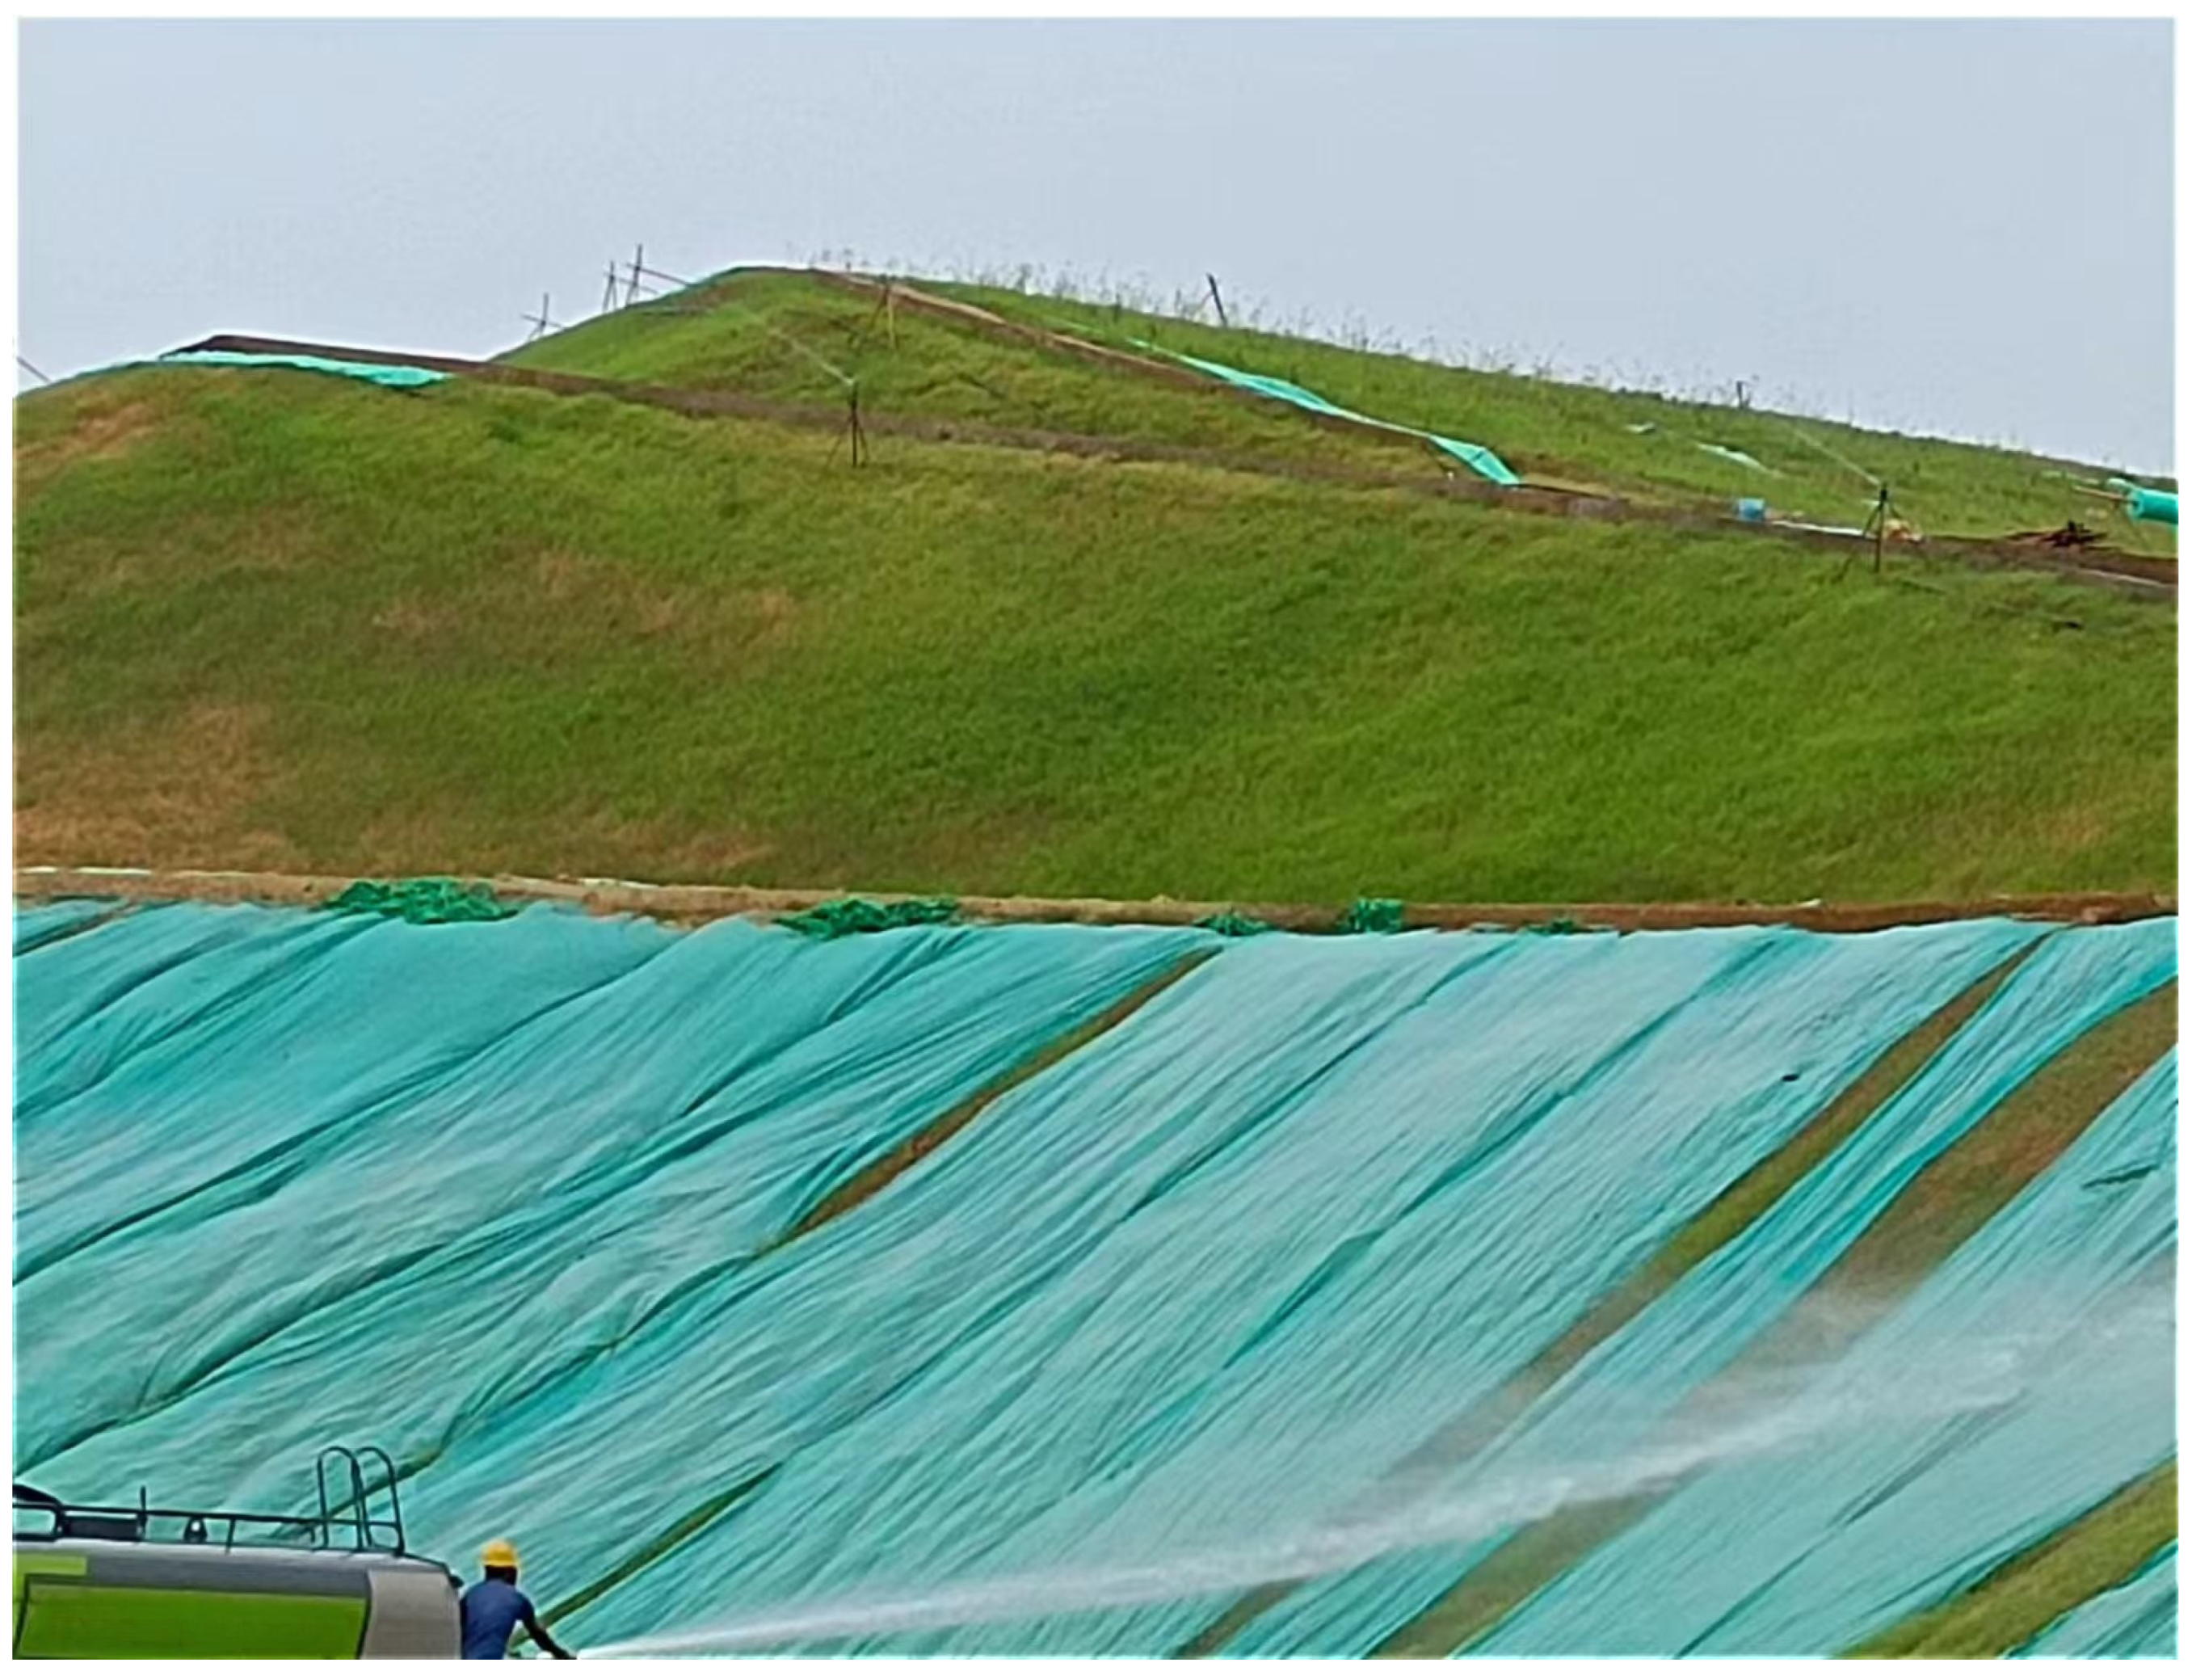
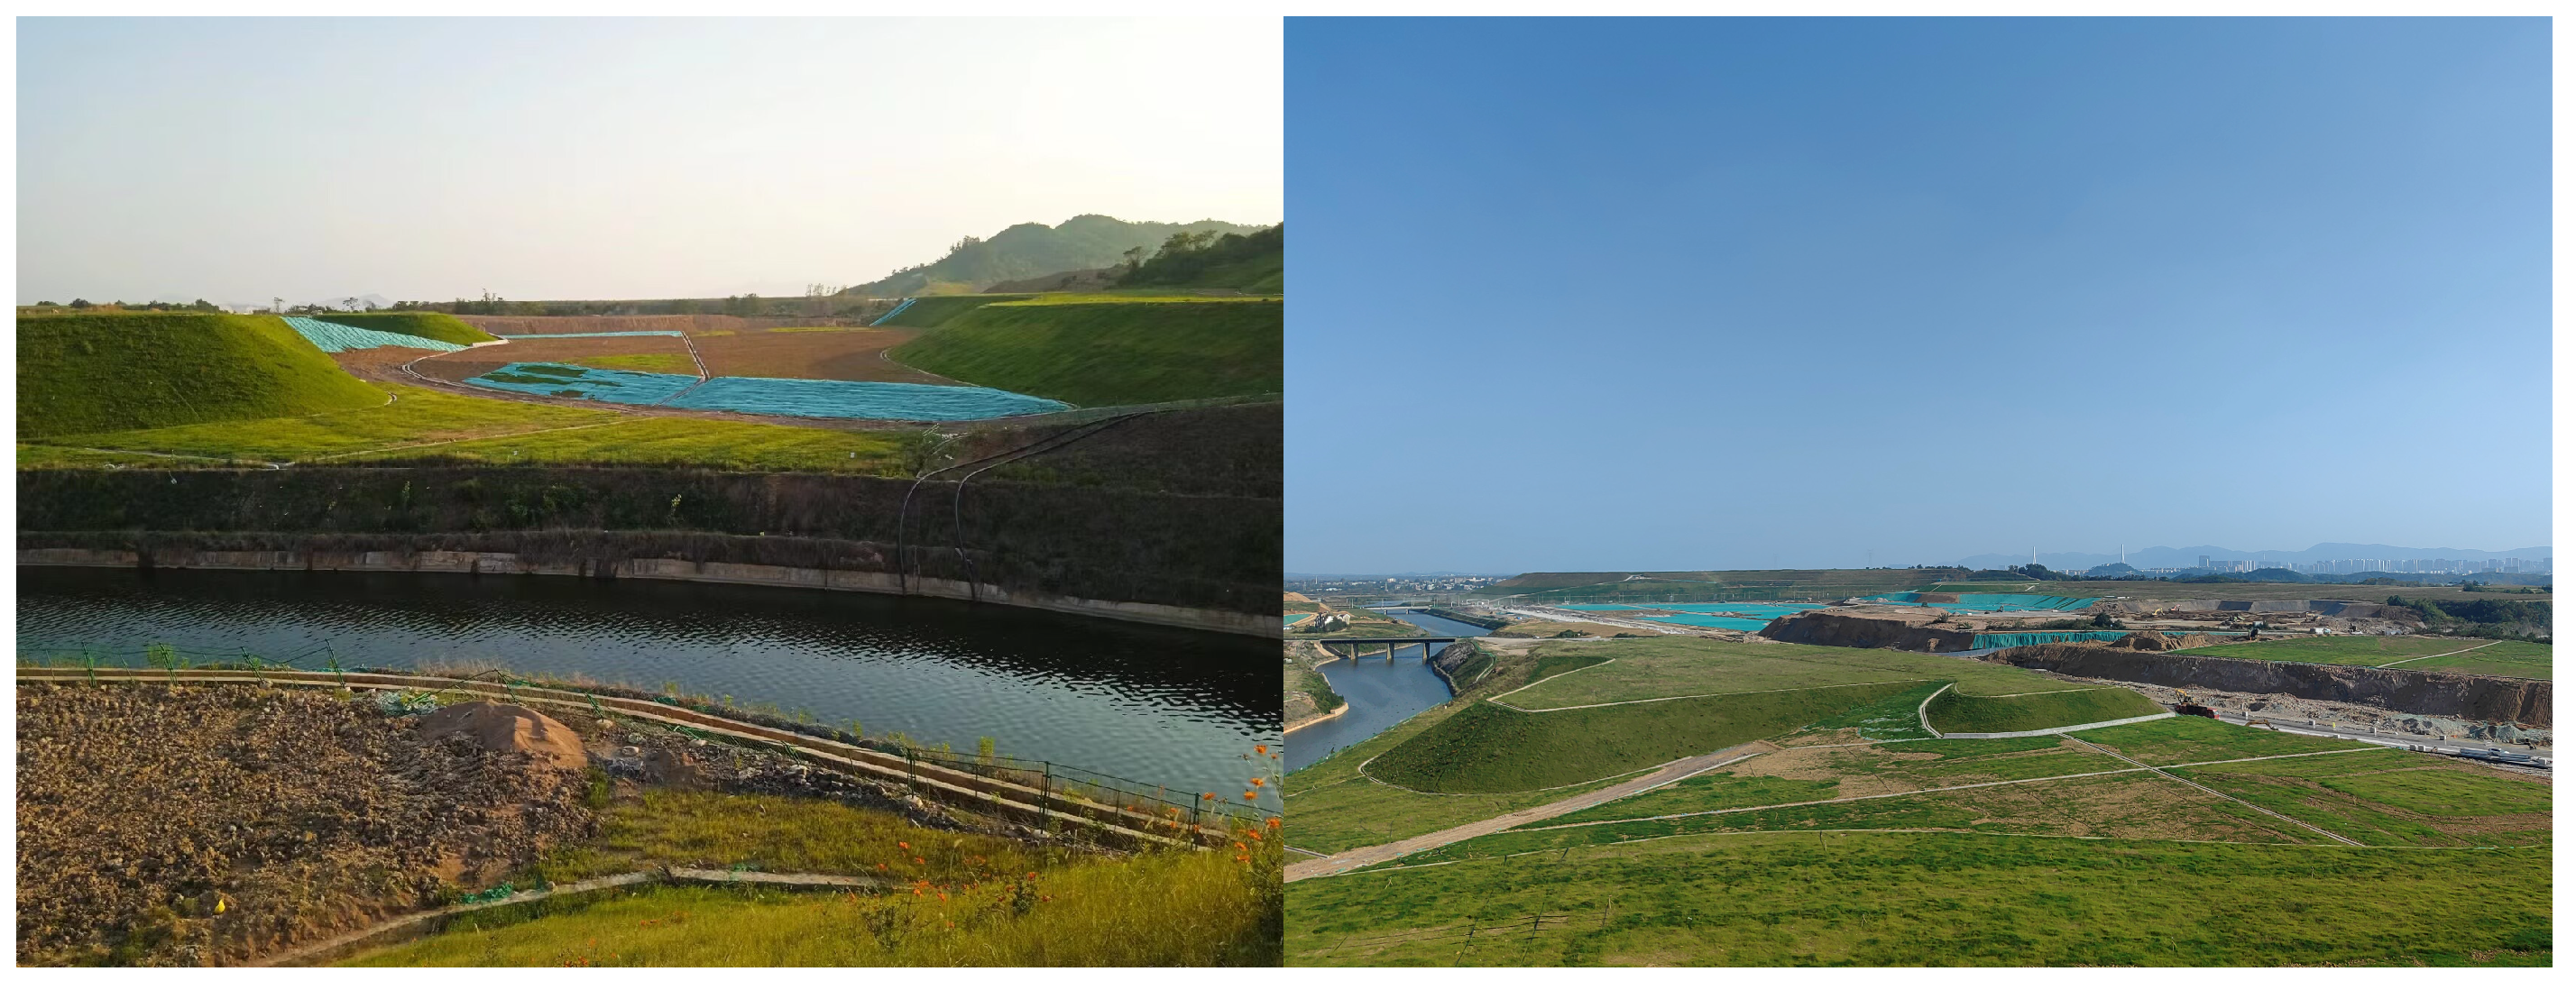
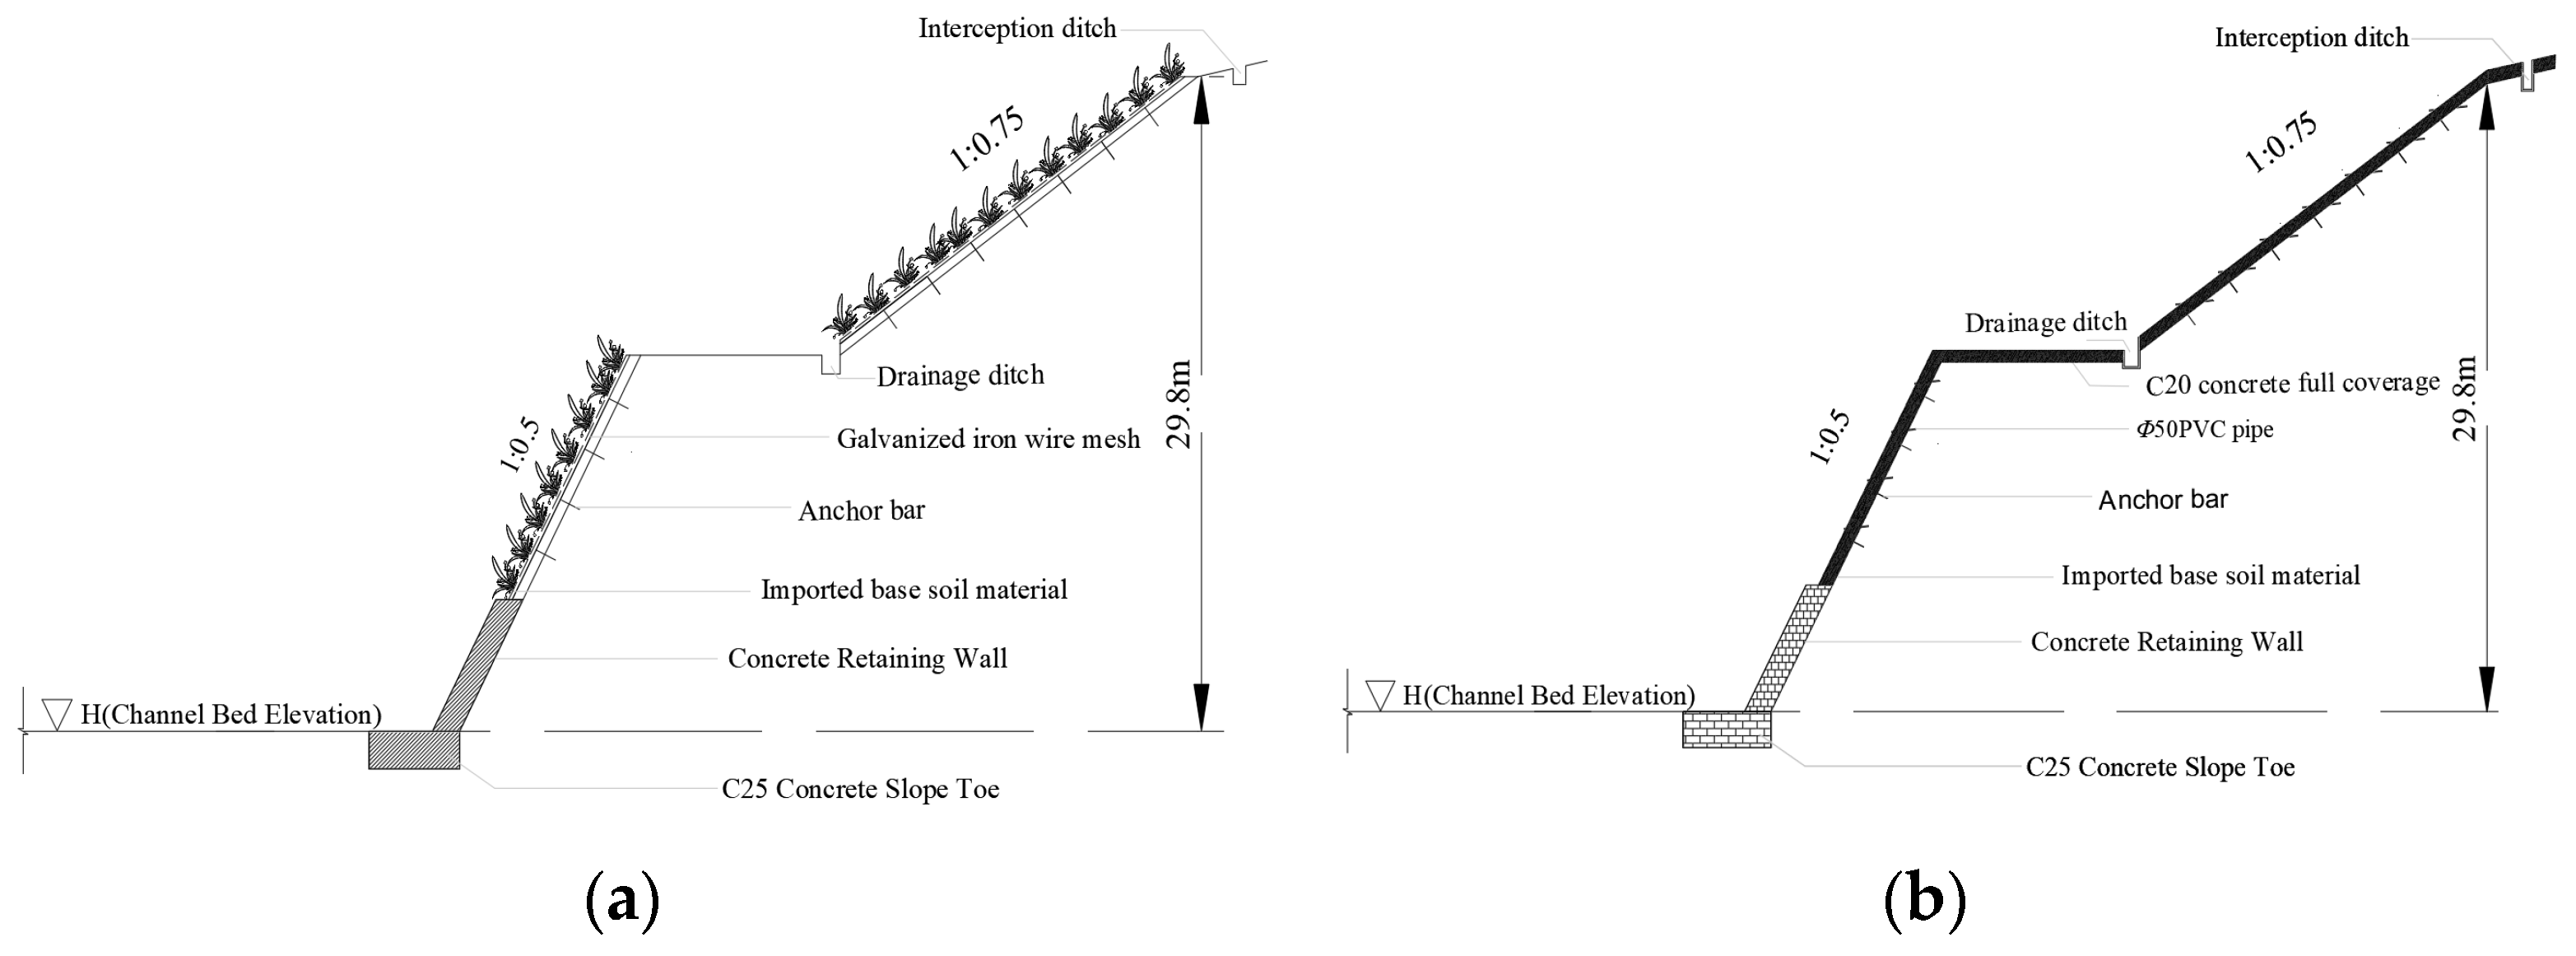
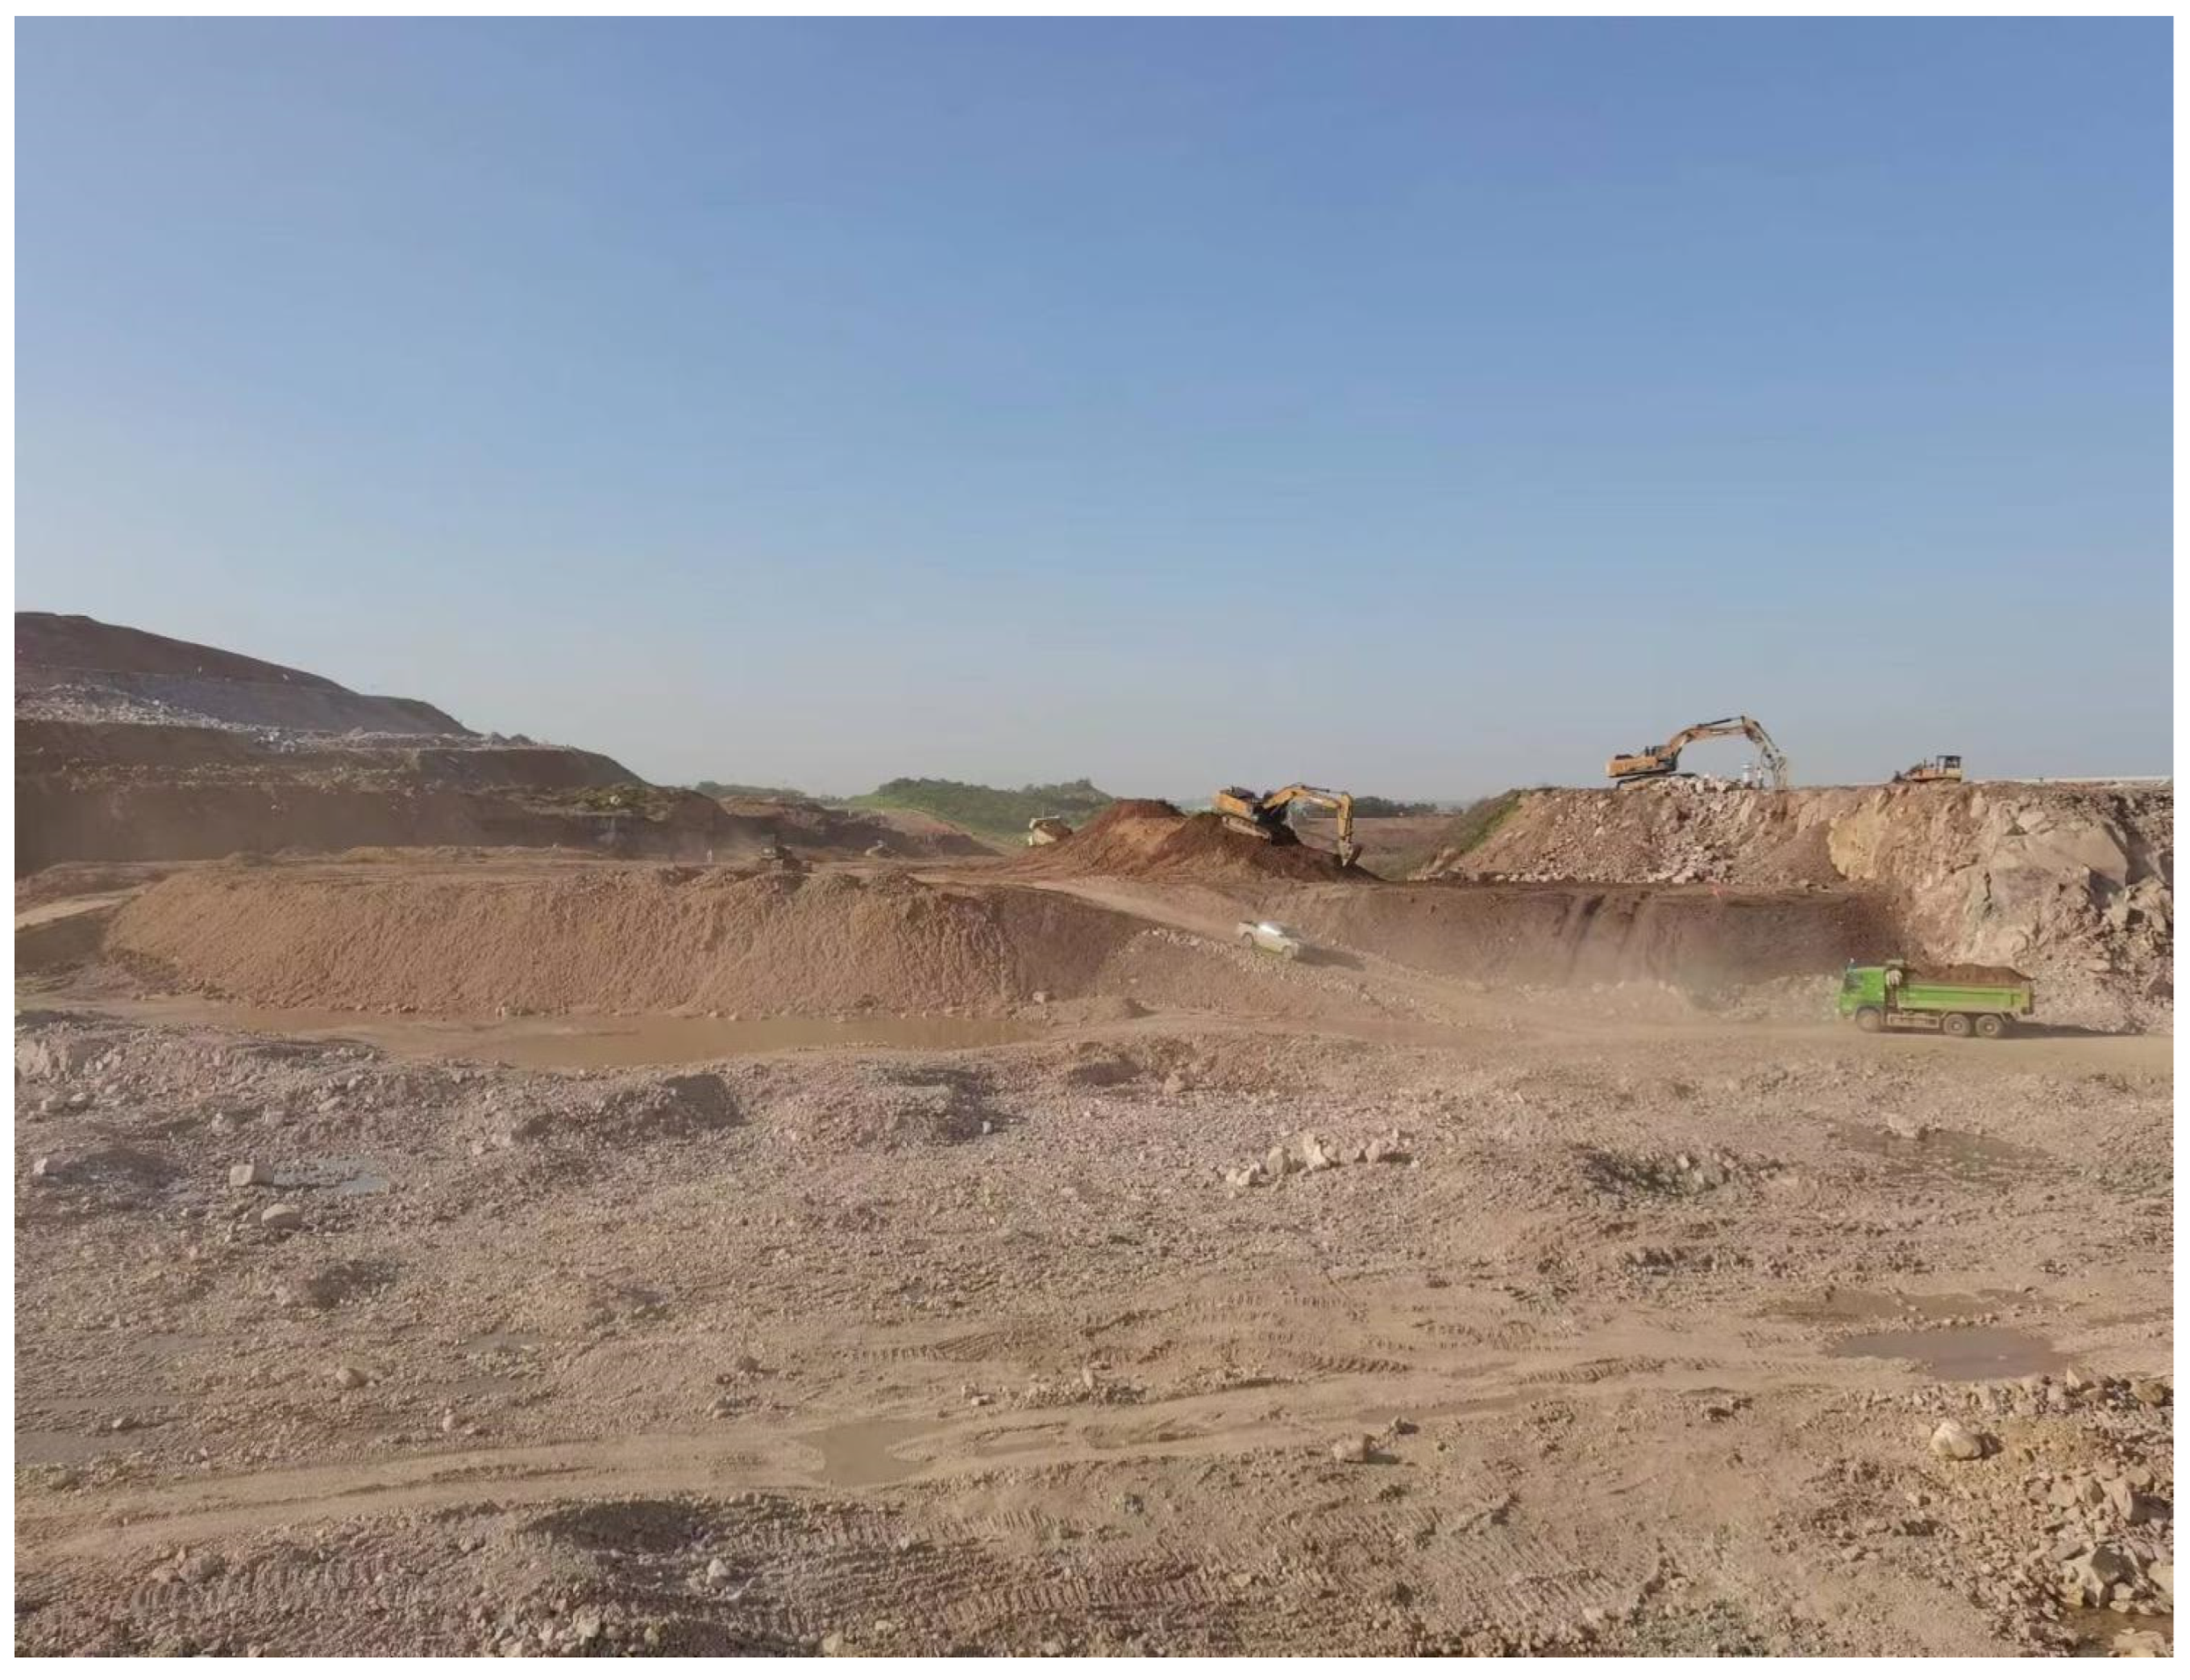
This study takes the Xinwan section (YJ0+000–YJ0+800)—Phase I of the Huama Lake project—as the object of analysis. This section consists of typical steep rock slopes, with slope gradients of approximately 40–75°. The elevation difference from the canal bed to the intercepting ditch at the slope crest ranges from 5 to 67 m, and the protected slope area is about 31,000 m2. At the design stage, a fully paved C20 concrete slope protection scheme was originally planned for this section. However, in view of ecological conservation and landscape requirements, the final implementation adopted a combined form: a cast-in-place concrete retaining wall at the lower part and sprayed-soil ecological slope protection at the upper part. The main construction procedures included the following: installing crest intercepting ditches and slope drainage ditches (cross-section 60 cm × 60 cm); placing long and short anchor rods on the slope surface with wire mesh or local rebar mesh (Φ6.5 mm, 500 mm × 500 mm); and then spraying a 10–12 cm thick soil substrate to form the ecological slope protection. Figure 1 illustrates the sprayed-soil ecological slope protection scheme; Figure 2 shows the early-stage construction process; Figure 3 depicts vegetation watering and maintenance during the later stage; and Figure 4 presents the vegetation restoration after completion.
The project features typical geological conditions of riverbank slope protection in central China and simultaneously incorporates both the originally designed concrete slope protection scheme and the actually implemented ecological slope protection scheme. Because the two schemes are comparable under the same geographical conditions and functional requirements, this project provides a unique context for conducting a life-cycle carbon emission comparison of different slope protection approaches and offers substantial practical reference value. This study selects the Huama Lake Phase I project as the case for three reasons: (1) the same slope was constructed using two different schemes, which naturally controls for external differences such as geological and hydrological conditions and thereby enhances the comparability and validity of the quantified carbon-emission contrast; (2) the case has a well-defined system boundary and clear stage delineation, and data on energy and material consumption at each stage can be obtained from the project budget, construction logs, and material lists, ensuring empirical robustness and operability; and (3) under these conditions, a standardized analytical workflow and methodology can be established within a consistent boundary and accounting framework, providing a replicable pathway for life-cycle carbon-emission assessments of other types of scheme changes.

3. Methods

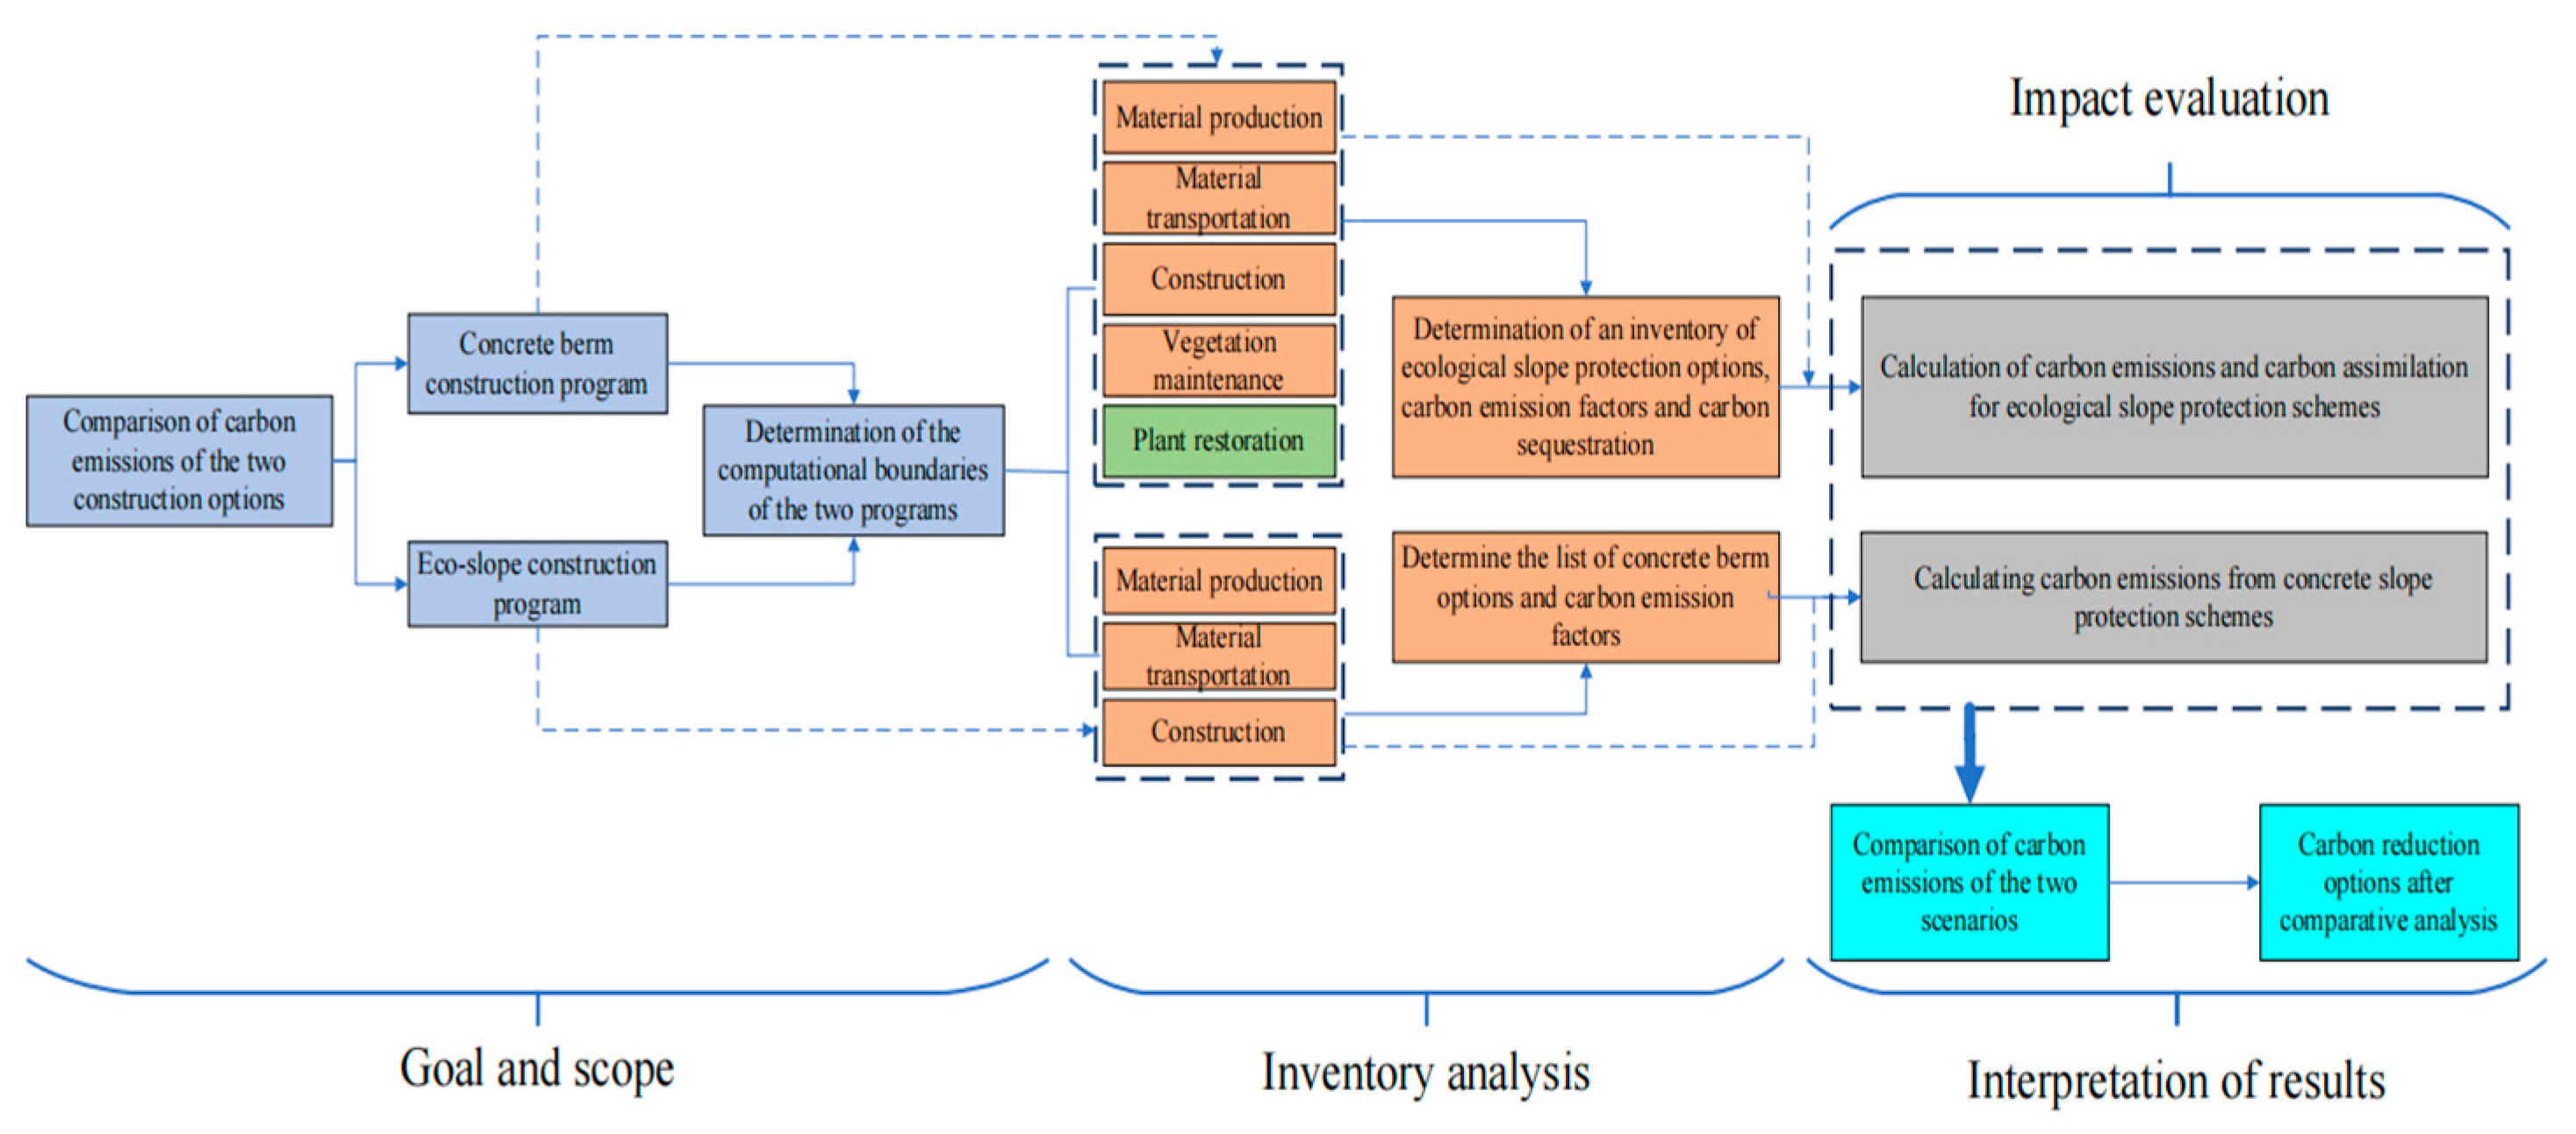
Life Cycle Assessment (LCA), as a methodological tool, is not a simple “yes/no” decision-making instrument but rather a sophisticated analytical framework. It employs systematic, quantitative approaches to reveal the potential environmental impacts of a product, service, or process throughout its entire life cycle [16,17]. LCA is widely applied across various industries for environmental performance evaluation. In this study, LCA is applied to quantify the carbon emissions of two different slope construction schemes. A LCA framework tailored to the characteristics of the slope is established.
The LCA methodology is structured into four key steps, which together form the complete framework for this analysis:
(1)
Goal and Scope Definition: Establishing the purpose of the assessment and defining the system boundaries for the study.
(2)
Life-Cycle Inventory (LCI): Collecting data on the inputs and outputs associated with each phase of the slope construction projects.
(3)
Life-Cycle Impact Assessment (LCIA): Analyzing the potential environmental impacts of the collected data, with a focus on carbon emissions.
(4)
Interpretation: Reviewing the results to identify the main sources of emissions and proposing optimization measures to reduce carbon output.
This LCA framework is illustrated in Figure 5 and is applied throughout the study to assess the environmental impacts of the two slope construction schemes.

3.1. Life-Cycle Assessment

According to the ISO 14040 international standard, LCA is defined as a standardized methodological framework for compiling and evaluating the inputs, outputs, and potential environmental impacts of a product system throughout its entire life cycle [18]. Its core lies in establishing unified principles and system boundaries to provide scientific and comprehensive support for environmental decision-making. It consists of several key components [19,20].

3.1.1. Goal and Scope

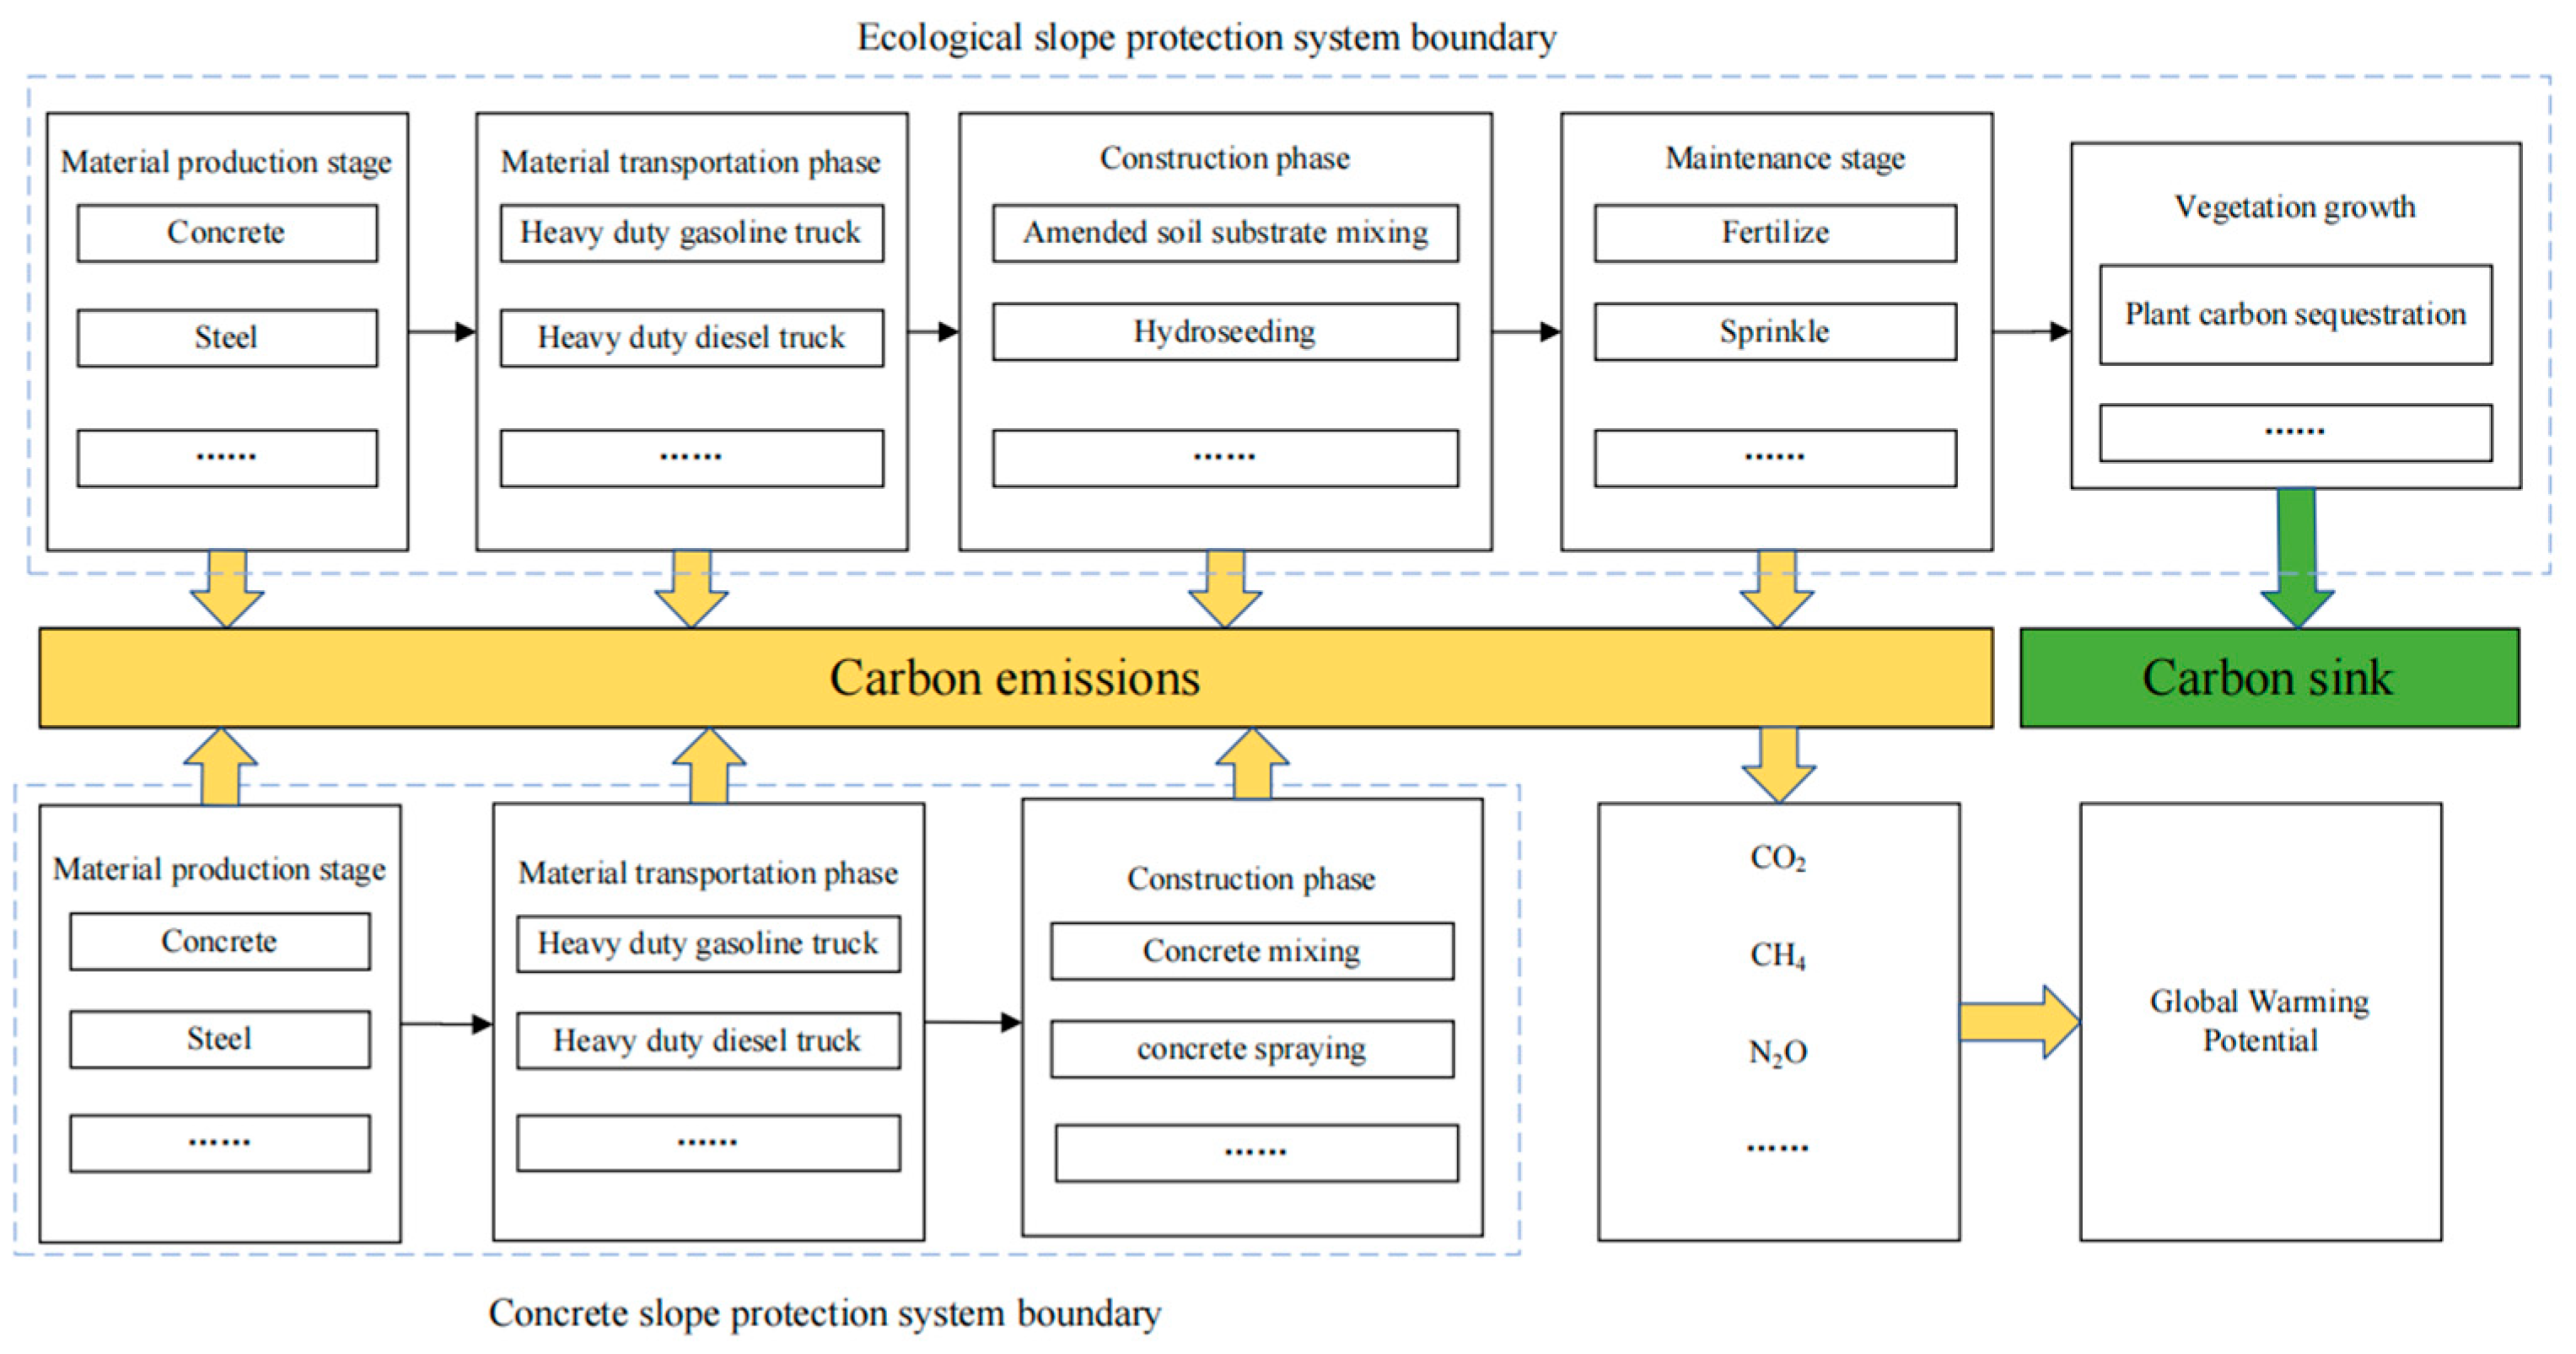
The slope protection structures are designed to achieve a longer service life with minimal maintenance after construction, making it reasonable to set the time boundary for evaluating such structures at 30 years. Furthermore, even after reaching the designed service life, these structures often undergo maintenance and reinforcement, so the demolition phase is not included in the life-cycle analysis of the slope. The purpose of this study is to calculate the carbon emissions generated at each stage during the construction of two different slope construction schemes, compare and analyze the key emission sources, and propose corresponding carbon reduction optimization measures. The system boundaries for the two slope construction schemes are shown in Figure 6.

3.1.2. Life-Cycle Inventory (LCI)

This study employs a process-based LCA method to collect and quantify input and output data for each stage of the slope protection projects. The resources required for activities in each stage of the protection schemes are clearly defined [16] Carbon emissions and carbon sequestration values are calculated using a modeling approach, providing accurate inputs for subsequent impact evaluation. The data used in this study primarily comes from engineering design documents, construction records, material procurement lists, IPCC guidelines, and relevant literature. Specifically, it includes material consumption (cement, geosynthetic soil material), transportation volumes (transportation ton-kilometers for each material), energy consumption of machinery used during construction, resources required during maintenance (water, fertilizers), and the average annual carbon sequestration rates of various vegetation.

3.1.3. Life-Cycle Impact Assessment (LCIA)

LCIA aims to evaluate the potential environmental impacts of the data collected in the LCI. In this study, the primary goal of LCIA is to convert the carbon emissions at each stage into a unified environmental impact indicator. By comparing the concrete slope protection scheme and the ecological slope protection scheme, the environmental impact differences across the stages can be clearly identified, providing a basis for subsequent emission reduction optimization.
(1)
Selection of Impact Category and Characterization Model
In this study, carbon emissions refer to the release of greenhouse gases (GHGs). The environmental impact of the construction industry primarily considers the emissions of gases such as carbon dioxide (CO2), methane (CH4), and nitrous oxide (N2O) [21]. To facilitate quantification and comparison, the emissions of all greenhouse gases are converted into carbon dioxide equivalents (CO2e). In accordance with the ISO 14040 standard, the conversion formula is shown in Equation (1):
C O 2 e q i = M i G W P i
In Equation (1), M i denotes the mass of the i-th greenhouse gas, while G W P i refers to the global warming potential (GWP) of that gas. As defined by the Intergovernmental Panel on Climate Change (IPCC), the GWP values of various greenhouse gases over a 100-year reference period are presented in Table 1. The use of these GWP values allows the emissions of different greenhouse gases to be converted into CO2 equivalents, facilitating comprehensive assessments and comparisons [22].
(2)
Carbon Emission Calculation
To calculate the carbon emissions of different slope protection schemes, this study employs the carbon emission factor method [23]. This method estimates the carbon emissions at each stage by multiplying the emission factors from the IPCC guidelines with the activity data. In this process, in addition to calculating the carbon emissions, we also calculate the carbon sequestration, which refers to the amount of carbon absorbed through vegetation growth.
C = C M + C T + C E + ( C W C S ) Y
In Equation (2), C represents the total carbon emissions over the life cycle of the slope protection project, measured in (tCO2); C M represents the carbon emissions from the material production stage, measured in (tCO2); C T represents the carbon emissions from the material transportation stage, measured in (tCO2); C E represents the carbon emissions from the construction phase machinery energy consumption, measured in (tCO2); C W represents the carbon emissions from the ecological slope maintenance phase, measured in (tCO2/a); C S represents the annual average carbon sequestration of various vegetation within the ecological slope project area, measured in (tCO2/a); and Y represents the service life of the ecological slope, measured in (a).
The detailed calculation formula for C M is as follows:
C M = i = 0 n M z i G z i
where M z i represents the consumption of the i -th material (in t or m3); G z i represents the carbon emission factor of the i -th material (in kgCO2e/t or kgCO2e/m3).
The detailed calculation formula for C T is as follows:
C T = i = 0 n T i L i G x i
where T i represents the transportation quantity of the i -th material (in t); L i represents the transportation distance of the i-th material (in km); G x i represents the carbon emission factor for the transportation method used for the i -th material (in kgCO2e/t·km).
The detailed calculation formula for C E is as follows:
C E = i = 0 n D i F i
where D i represents the energy consumption of the i -th machinery (in kg or kWh); F i represents the carbon emission factor for the energy type consumed by the i -th machinery (in kgCO2e/kg or kgCO2e/kWh).
The detailed calculation formula for C W is as follows:
C W = i = 0 n K i O i
where K i represents the energy consumption for the i -th plant maintenance activity (in units); O i represents the carbon emission factor corresponding to the i -th maintenance activity (in kgCO2e/unit·a).
The detailed calculation formula for C S is as follows:
C S = i = 0 n P i J i
where P i represents the number of the i -th woody plant or the area of the i-th herbaceous plant (in plants or m2); J i represents the annual average carbon sequestration per unit of the i -th woody or herbaceous plant (in kgCO2e/unit·a) [24].

3.1.4. Interpretation

Based on the results of the impact assessment, this study will further analyze the carbon emission sources of different schemes, identify the stages with higher emissions, and provide recommendations for improving the design and construction plans to optimize carbon reduction.

4. Results and Discussion

4.1. Calculation Results of Carbon Emissions

This study quantifies the carbon emissions of key materials used in various slope construction schemes, including emissions from raw material extraction and production processes. Material consumption in the ecological slope protection scheme was based on engineering data, while that in the concrete slope protection scheme was determined from the original design material list, as shown in Table 2. It is important to note that the material quantities presented for each scheme are categorized based on their final application rather than being treated as raw components for a single product. Specifically, the large quantities of ready-mix concrete (C20 and C25) were used for the primary slope structures, including full-area coverage and retaining walls. In contrast, materials such as cement, medium sand, crushed stone, and sand gravel were employed on site for the construction of auxiliary facilities, such as drainage ditches and interception drains. Carbon emission factors for various materials were sourced from the China Building Carbon Emission Calculation Standard [25], the China Product Carbon Footprint Database [26], and relevant literature [27,28,29,30]. Additionally, the soil used in the project was tested to meet sandy loam standards. The primary base material, sandy loam, in the sprayed-soil ecological slope protection scheme was sourced from the site’s earthworks. It was processed using a soil crusher and screen to achieve appropriate particle sizes for subsequent use. Therefore, carbon emissions from this material stage are not considered.
Table 3 shows the carbon emission calculation results for the transportation phase of both construction schemes. Weight and distance data for material transportation in the ecological slope protection scheme were obtained from construction logs. Since sandy loam was sourced from the project’s earthworks, its transportation emissions are excluded from the calculation. The concrete slope protection scheme is only in the design phase and has not been implemented; therefore, the transportation distance for its materials was taken from default values in the China Building Carbon Emission Calculation Standard [25]. Specifically, the default transportation distance for concrete is 40 km, and for other materials, it is 500 km. Carbon emission factors for the transportation phase in both construction schemes are derived from this standard.
During the construction phase, carbon emissions mainly arise from the energy consumption of construction machinery, as detailed in Table 4. For the ecological slope protection scheme, the energy consumption and types of construction equipment are determined from the construction logs. In contrast, for the concrete slope protection scheme, equipment selection is based on the original design processes, including tasks such as anchor bolt installation, mesh installation, formwork setup, concrete mixing, and pouring. Energy consumption is calculated using the equipment’s rated power in accordance with the “Building Project Budget Quota” standards. The carbon emission factor for diesel, a primary energy source, is sourced from relevant literature [31]. Additionally, the 2023 national and regional average carbon emission factor for electricity, as calculated by the Ministry of Ecology and Environment, the National Bureau of Statistics, the National Energy Administration, and the China Electric Power Enterprise Federation, is provided. For the project located in Central China, the carbon emission factor for electricity is 0.5395 kgCO2e/kWh.
Carbon emissions during the ecological slope protection maintenance phase primarily result from vegetation management, including replanting, pruning, irrigation, fertilization, and pest and disease control. Resource input during maintenance is based on construction quotas, as shown in Table 5, with corresponding carbon emission factors sourced from relevant literature [32]. The carbon emission factor for labor is derived from [33] statistical data on China’s annual per capita energy consumption, which indicates 0.5 metric tons of standard coal per capita. Using [34] data, the carbon emission factor for standard coal is calculated as 2.460 tCO2e/t. Based on 365 working days per year, with 8 h of work per day, the carbon emission factor for labor is 1.123 kgCO2e/day.
Ecological slope protection includes a plant growth phase, during which plants absorb CO2 through photosynthesis and fix carbon in both the plants and soil, thereby reducing atmospheric carbon concentration. The project uses native plant species with strong carbon sequestration abilities. The planting follows a tree-shrub-grass structure to maximize the plants’ carbon sequestration and oxygen release capabilities. The numbers and areas of the plants used are shown in Table 6, with corresponding carbon sequestration abilities referenced from relevant literature [35,36].
Based on comprehensive data and a life-cycle perspective, as shown in Figure 7, total carbon emissions for the sprayed-soil slope protection scheme (560.83 t) are significantly lower than those for the concrete slope protection scheme (1228.04 t). Additionally, due to the long-term carbon sequestration potential of vegetation, the ecological slope protection project achieves carbon neutrality within 3.66 years of construction completion, contributing a net carbon sequestration benefit of 2422.97 t over its life cycle.
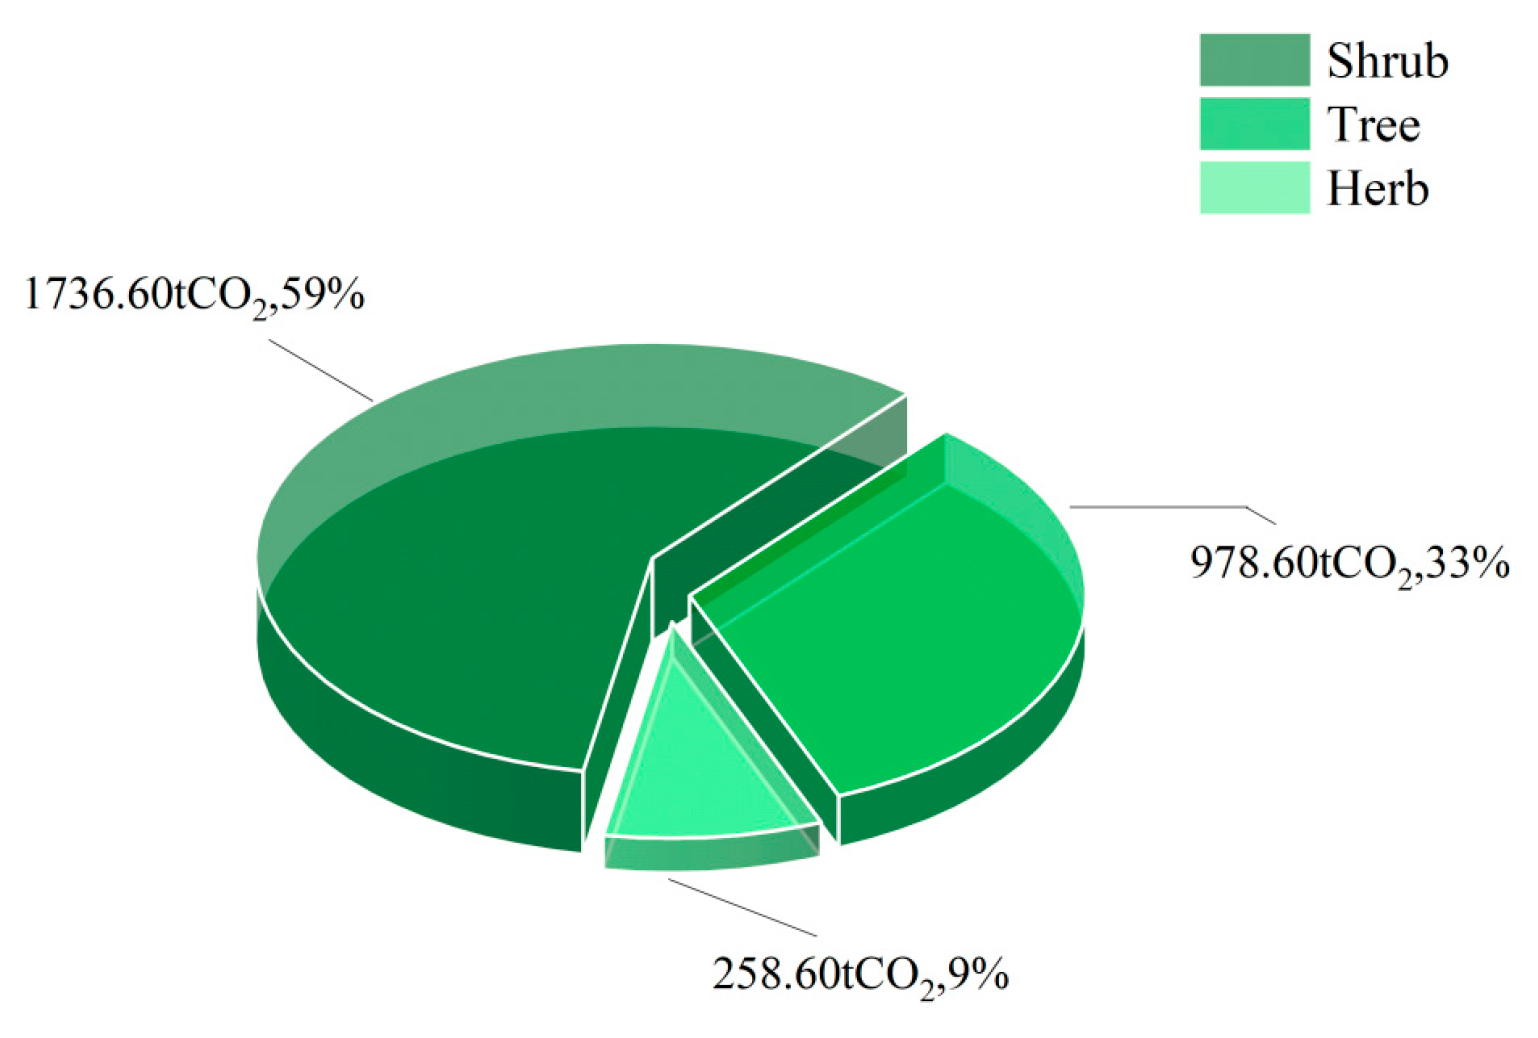
As illustrated in Figure 8, the material production phase contributes the largest share of total life-cycle carbon emissions in both the concrete slope protection (90%) and sprayed-soil slope protection (53%) schemes. The main materials in both construction schemes are cement, concrete, and steel. While emissions from the transportation and construction phases constitute a smaller percentage of the total life cycle emissions for both schemes, they still require consideration. Notably, carbon emissions from the maintenance phase of the sprayed-soil slope protection scheme account for 40% of the total, as plant maintenance is a long-term activity. Over time, carbon emissions during the maintenance phase continue to rise. Meanwhile, the plant growth phase sequesters a significant amount of carbon through the plants’ long-term carbon absorption capacity. Figure 9 illustrates the carbon sequestration potential throughout the life cycle of different plant types. Generally, a single tree has a higher carbon sequestration capacity than shrubs. However, in this project, the number and types of shrubs greatly exceed those of trees, resulting in higher total carbon absorption by shrubs than trees. The carbon absorption for shrubs is 1746.60 tCO2 (59%), while for trees, it is 978.60 tCO2 (33%). Although herbaceous plants are the most numerous, their per-unit-area carbon absorption capacity is limited, making their contribution to total carbon sequestration the smallest, at 258.60 tCO2 (9%). The ecological slope protection project, through the strategic arrangement of trees, shrubs, and herbaceous plants, enhances its carbon sequestration capacity while also promoting ecological diversity, thereby providing significant support for mitigating global climate warming.

4.2. Carbon Reduction Strategies

The sprayed-soil slope protection scheme for Phase I of the Huama Lake project has been selected as the optimal carbon reduction strategy due to its lower overall carbon footprint compared to conventional methods. This study thoroughly analyzes key carbon sources across the entire life cycle and proposes targeted reduction strategies at each stage.
In the material production phase, cement, concrete, and steel emerge as the primary carbon sources, accounting for a significant portion of total emissions. To mitigate these emissions, strategies such as using low-carbon cement, recycled materials, and alternative, more sustainable construction materials are recommended.
In the transportation phase, carbon emissions primarily stem from the use of transportation equipment. Optimization efforts here include adopting electric or low-emission vehicles, improving logistics efficiency, and reducing transport distances where possible.
The dominant source of carbon emissions during the construction phase is the operation of machinery powered by electricity. Strategies to reduce emissions in this phase include transitioning to electric or hybrid machinery, optimizing construction processes to minimize machinery usage, and utilizing renewable energy sources where feasible.
In the maintenance phase, fertilization and manual irrigation activities represent the main carbon sources. To address these, the study proposes the use of organic fertilizers, rainwater harvesting systems for irrigation, and the incorporation of more efficient irrigation techniques to minimize water and energy consumption.
Optimization strategies have been developed for each of these four phases, with a focus on implementing practical and cost-effective measures to significantly reduce the carbon footprint throughout the project’s life cycle.

4.3. Optimization Strategies

4.3.1. Optimization Strategies for the Material Production Phase

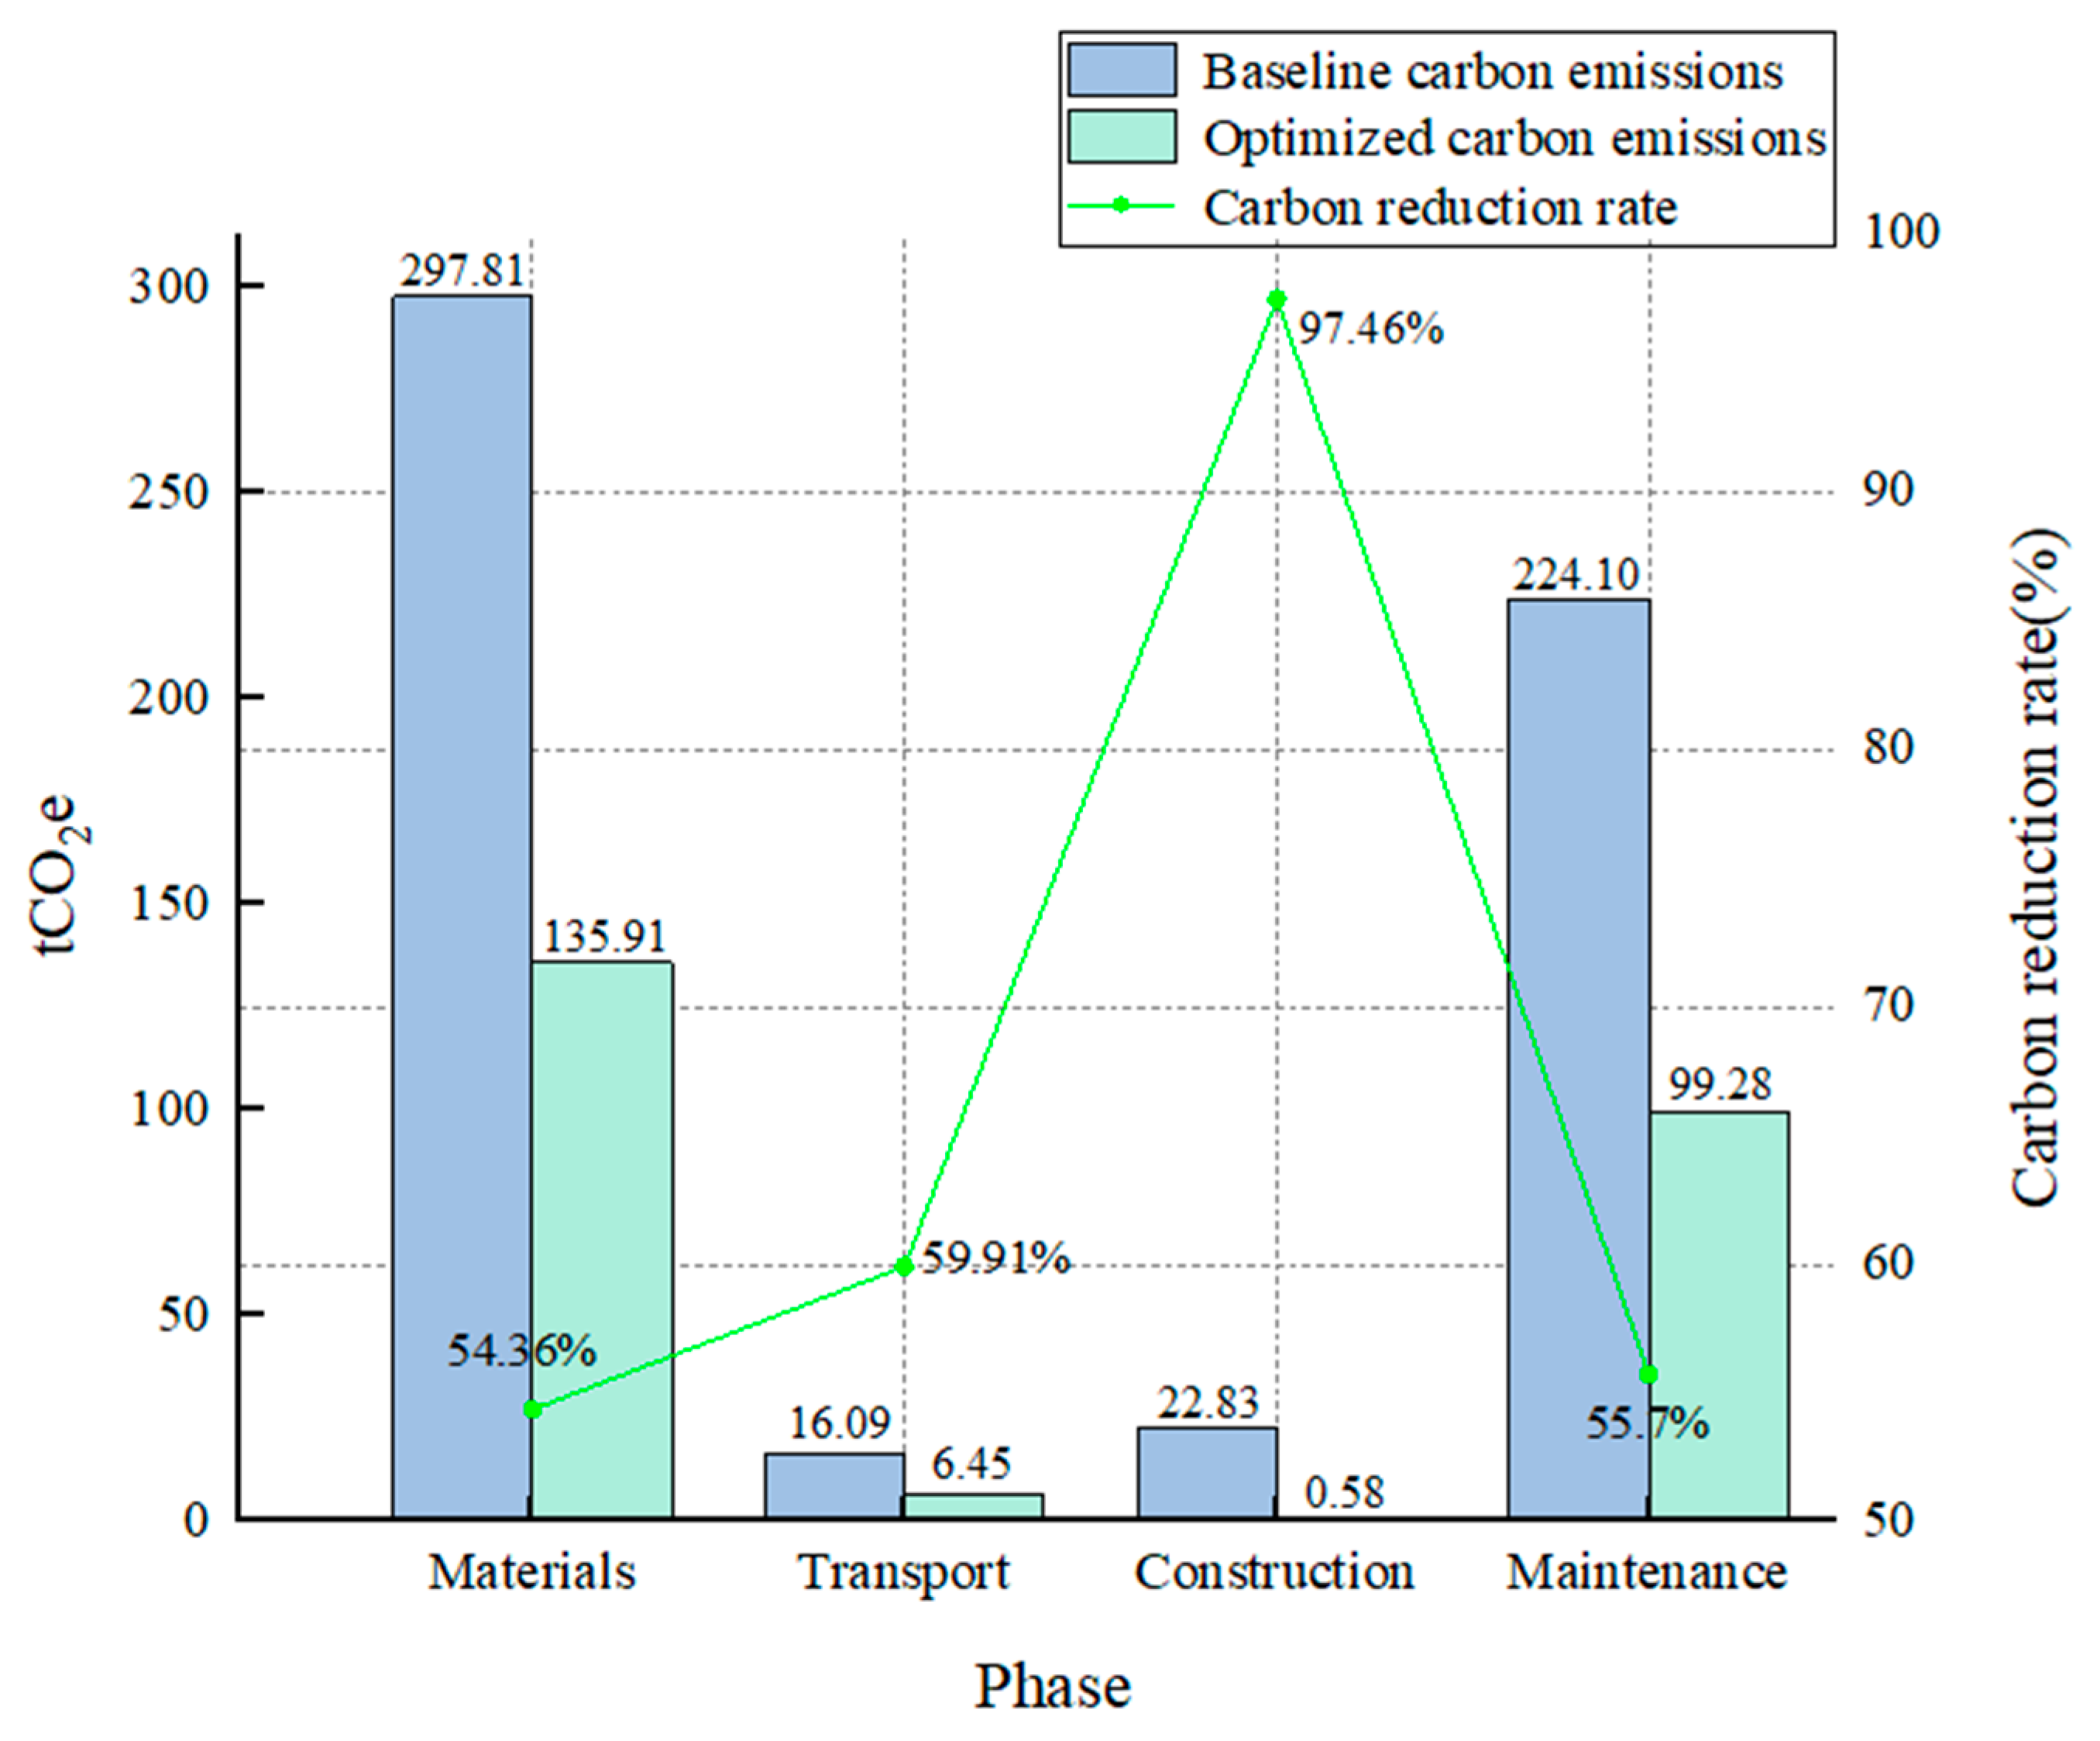
The carbon emissions in the material production phase primarily arise from the use of steel (e.g., anchor bolts and galvanized wire mesh). To mitigate these emissions, this study proposes the use of recycled steel as a substitute for traditional virgin steel. Recycled steel is produced by utilizing discarded steel as raw material, with a carbon emission factor of 578.36 kgCO2/t, significantly lower than that of virgin steel, and is already widely applied in the construction industry [37]. As shown in Table 7, this substitution measure results in the most significant emission reduction, achieving a reduction of 142.49 tons of CO2 equivalent. Furthermore, this study suggests the use of recycled concrete and new low-carbon cement as technically mature alternatives. Compared to conventional concrete, recycled concrete not only possesses excellent mechanical properties to meet construction requirements but also has a carbon emission of only 39.54% of that of ordinary concrete [38]. New low-carbon cement, a promising alternative to traditional Portland cement, can reduce carbon emissions by 30% compared to conventional concrete [39]. The application of these materials in the construction industry is growing and is supported by green building policies. The substitution of these materials for traditional ones can achieve additional emission reductions of 10.67 tons and 8.74 tons of CO2 equivalent, respectively, as shown in Table 7. It is worth noting that Table 7 only shows the emission reductions from optimizing the key carbon sources in each phase, while the summary data presented in Figure 10 includes the combined values of both the optimized and unoptimized portions.

4.3.2. Optimization Strategies for the Transportation Phase

The carbon emissions in the transportation phase are primarily attributed to the use of heavy gasoline and diesel trucks. The optimization strategy leverages China’s position as a global leader in the electric vehicle market, with the share of electric vehicles accounting for 50% of the global total [40]. The carbon emission factor for electric freight vehicles is 0.046 kgCO2e/t·km [31]. By replacing gasoline and diesel trucks with electric vehicles for transportation, this transition reduces transportation carbon emissions from 16.09 tCO2e to 6.45 tCO2e, as shown in Table 7.

4.3.3. Optimization Strategies for the Construction Phase

The carbon emissions in the construction phase are primarily indirect, originating from the electricity grid, which is predominantly powered by coal-fired power plants, to supply electric construction machinery. Research indicates that wind power generation offers low emission intensity and high carbon reduction benefits, with emissions reduced by 97.44% compared to coal-fired power generation [41]. This strategy does not require changes to on-site construction methods but advocates for emission reductions through clean energy generation (e.g., wind power) on the grid side. China’s substantial investments in renewable energy make this strategy highly feasible. The implementation of this approach will reduce construction-related carbon emissions from 22.83 tCO2e to 0.58 tCO2e, as shown in Table 7.

4.3.4. Optimization Strategies for the Maintenance Phase

The carbon emissions in the maintenance phase primarily arise from the long-term application of compound fertilizers, as shown in Table 5. Recent studies indicate that the carbon emissions from the production and use of synthetic organic fertilizers are only 23% of those from traditional compound fertilizers [42]. By adopting organic fertilizers as the primary fertilization method, carbon emissions from fertilizer inputs can be reduced from 149.40 tCO2e to 34.36 tCO2e. Additionally, the current practice of manually irrigating plants with tap water generates notable carbon emissions. The project site is located in a subtropical monsoon climate with an annual average precipitation of 1282.8 mm, providing ample rainfall. By constructing a rainwater harvesting system with storage tanks and installing drip irrigation, the collected rainwater can completely replace tap water for irrigation, thereby eliminating associated carbon emissions. This strategy will reduce carbon emissions from maintenance-related water use from 7.80 tCO2e to zero. Furthermore, according to the “Hubei Province Urban Landscaping Maintenance Consumption Quotas and Full-Cost Pricing Table,” the use of an automatic irrigation system allows for the adjustment of manual maintenance requirements to 70% of the original quota, further reducing indirect emissions caused by manual labor. This approach will reduce carbon emissions from manual operations from 6.60 tCO2e to 4.62 tCO2e. The carbon reduction potential of the optimized maintenance plan is detailed in Table 7.
As shown in Figure 10, after implementing all the optimization strategies, the total carbon emissions of the project were significantly reduced from 560.83 tCO2e to 242.22 tCO2e, achieving an overall emission reduction rate of 56.8%. This result clearly demonstrates the effectiveness of the multi-stage, multi-measure collaborative optimization strategy. More importantly, by leveraging the unique carbon sequestration capacity of the ecological slope protection, the project is expected to achieve carbon neutrality ahead of schedule, showcasing the immense advantages and forward-looking potential of integrating ecological and engineering technologies in carbon reduction.

4.4. Discussion on Optimization Strategies

4.4.1. Potential of Advanced Alternatives

The low-carbon materials employed in this study, such as low-carbon cement, recycled aggregate concrete, and reclaimed steel, represent mature, technically feasible, and commercially available solutions for emission reduction. In contrast, more advanced carbon reduction technologies, such as Carbon Capture and Utilization in Cement (CCUS), offer substantial potential for further reducing carbon emissions [43]. CCUS technology captures CO2 produced during cement manufacturing and either sequesters it or uses it in concrete production, thereby achieving near-zero carbon emissions. This technology is considered a key component for the sustainable development of the cement industry in the future. However, despite its considerable emission reduction potential, the high initial investment and operational costs make it challenging for widespread application in the short term. While CCUS has been initially implemented in pilot projects in developed countries, its deployment in ecological slope protection projects remains limited.
In addition to the adoption of electric vehicles, hydrogen-powered heavy-duty trucks show significant promise for long-haul, heavy-load transportation as zero-emission vehicles, offering a substantial reduction in carbon emissions during transport [44,45]. However, due to their high purchase cost and the underdeveloped hydrogen refueling infrastructure, their application in short-distance transportation remains constrained, limiting their widespread adoption. Thus, while hydrogen-powered heavy-duty trucks hold significant potential for future green transportation, further technological advancements and policy support are essential for their broader implementation.
In the construction phase, in addition to using clean energy for power generation, photovoltaic (PV) systems serve as another effective emission reduction measure, significantly reducing energy consumption during construction [46]. By harnessing solar power to supply electricity for construction equipment, tools, and lighting, PV systems reduce dependence on traditional fossil fuel-based power generation and lower carbon emissions at the construction site. Although the initial investment in PV systems can be high, their zero operating costs and long-term savings on electricity bills make them an ideal choice for reducing energy consumption in construction projects.

4.4.2. Economic Viability of Optimization Strategies

(1) Although this part of the study provides a quantitative analysis of the carbon reduction benefits of optimizing the ecological slope protection scheme using soil spraying, its economic feasibility is undoubtedly the key factor determining whether these strategies can be adopted in actual engineering projects. A comprehensive life-cycle cost-effectiveness analysis (LCCA) serves as an important bridge connecting environmental benefits with engineering practices and will be a critical direction for future research. We offer a preliminary qualitative discussion of the economic outlook for each strategy, providing valuable insights for decision-makers.
(2) In the material production phase, the use of low-carbon materials such as low-carbon cement, recycled concrete, and recycled steel generally incurs a “green premium,” meaning higher initial procurement costs compared to conventional materials. The economic viability of such strategies is highly dependent on local market prices, potential government subsidies or carbon tax policies, and cost savings from reduced waste disposal. The return on investment typically manifests over the long term through operational savings, improved environmental credentials, and compliance with increasingly stringent environmental regulations.
(3) In the transportation phase, the transition to an all-electric truck fleet represents a shift from operational expenditure to capital expenditure. The current high purchase cost of electric vehicles is the primary barrier. However, this disadvantage can be partially offset by the much lower electricity costs compared to diesel, lower maintenance requirements, and longer lifespan. For projects requiring long transportation distances, the total cost of ownership is likely to become more economically attractive as battery costs continue to decline.
(4) In the construction phase, converting the energy for construction machinery to clean electricity primarily reduces operational costs associated with energy consumption. The economic benefits are directly related to the fluctuating price difference between renewable energy and traditional grid electricity. If on-site photovoltaic (PV) power generation is adopted, its economic feasibility is similar, requiring an evaluation of the balance between initial equipment investment and long-term electricity cost savings. The return on investment period depends on local sunlight conditions and electricity price levels.
(5) In the maintenance phase, the optimization strategies are expected to generate positive economic benefits. Replacing compound fertilizers with organic fertilizers and using collected rainwater for drip irrigation directly reduce long-term material and utility costs. The initial investment in rainwater collection and drip irrigation systems will be offset through continuous operational savings over the project lifecycle, and it is likely to result in net economic gains.

5. Discussion

The research results show that the ecological slope protection scheme has an additional carbon emission source during the maintenance phase compared to the concrete slope protection scheme. However, its total carbon emissions are significantly lower than those of the concrete slope protection scheme. This is due to the use of more natural materials, such as local soil, plant fibers, and organic matter, reducing reliance on high-carbon materials like steel and concrete. Since the material production phase accounts for the largest share of carbon emissions, the total emissions are reduced. Additionally, carbon emissions generated during the ecological slope protection maintenance phase are offset by carbon sequestration during the plant growth phase, achieving the goal of “reducing carbon emissions and increasing carbon sequestration.” Furthermore, one month after completion of the ecological slope protection, plant coverage exceeds 90%, and slope stability is significantly improved through the action of plant roots [47,48]. This aligns with the current concept of green transformation in building structures and confirms the feasibility of ecological slope protection as a low-carbon, ecologically stable construction solution.
The research found that while ecological slope protection offers a significant carbon emission advantage over concrete slope protection, there is still substantial potential for further carbon reduction optimization. The proposed optimization plan includes improvements in material selection, transportation equipment, energy models, and vegetation maintenance, further reducing the carbon footprint of ecological slope protection. It is acknowledged that ecological solutions may introduce increased maintenance activities, such as monitoring plant health and managing irrigation systems, compared to inert concrete structures. The proposed optimizations are precisely aimed at mitigating these additional labor demands and their associated carbon costs. These optimization strategies can promote the widespread application of low-carbon buildings and infrastructure, aiding in the achievement of stricter carbon emission targets.
From a carbon sequestration perspective, plants are crucial for achieving negative carbon emissions. The ecological slope protection plan prioritizes native plants that are highly adaptable and possess strong carbon sequestration potential. In Northeast and North China, shrubs with strong carbon sequestration potential, such as sea buckthorn, common lespedeza, and black locust, are commonly used. These are combined with trees and herbaceous plants to create a “tree-shrub-herb” three-dimensional slope protection structure. This structure enhances slope stability and erosion resistance while providing the ecological slope protection plan with the practical potential to achieve “carbon neutrality” and even a “carbon surplus.” In contrast, invasive plants suppress the potential for carbon sequestration through biological interactions. However, they exhibit greater tolerance to harsh slope environments, such as saline-alkali, drought, or nutrient-poor conditions [49,50]. Therefore, based on specific slope conditions, strategically introducing invasive plants can enhance carbon sequestration benefits and ecological stability in slope protection.
This study proposes carbon reduction optimization measures for the ecological slope protection maintenance phase, including the introduction of a rainwater collection and drip irrigation system to reduce reliance on tap water. Additionally, precise irrigation techniques are employed to reduce water consumption, energy usage, and labor-related carbon emissions [51]. The rainwater collection system effectively stores rainfall, providing an irrigation water source for ecological slope protection and reducing demand for municipal water supply. This reduces tap water usage and associated human-induced carbon emissions. However, in arid regions, the effectiveness of this solution is limited. Due to scarce precipitation in these regions, the collected rainwater is insufficient to meet plant needs, causing the drip irrigation system to function intermittently and reducing overall carbon reduction effectiveness. In regions with limited water resources, operating the drip irrigation system may increase energy consumption, potentially offsetting the carbon reduction benefits of the technology. Therefore, in arid regions, future optimization during the maintenance phase should combine multiple water source allocation and soil moisture management techniques to improve water use efficiency and vegetation growth stability. The economic and environmental feasibility of these measures must be evaluated against the long-term benefits, with region-specific cost-benefit analysis being crucial.
In the material production phase of ecological slope protection, low-carbon materials such as low-carbon cement, recycled concrete, and recycled steel are utilized as optimization strategies. These low-carbon materials significantly reduce carbon emissions during the construction phase while maintaining the structure’s strength. Research has shown that the carbon reduction rate using these materials can reach up to 54.36%. However, despite their excellent carbon reduction performance, their economic feasibility in practical applications must also be considered. For example, recycled concrete is 0–10% more expensive than virgin concrete [52]. For some projects, low-carbon materials may be an efficient and environmentally friendly option, but their high initial cost may need to be recovered through long-term energy savings and emission reduction benefits. To ensure their feasibility, project decision-makers must assess whether the use of these materials aligns with budget requirements while considering long-term environmental benefits and economic returns. Therefore, when implementing low-carbon materials, balancing carbon emission reduction with cost control is a key issue that must be addressed. Overall, the cost of the sprayed-soil ecological slope protection scheme is approximately 740,000 RMB, while the cost of the concrete slope protection scheme is around 1,680,000 RMB. This is due to the shorter construction period of the ecological slope protection scheme, which results in lower labor and equipment costs, as well as differences in material selection. This indicates that the sprayed-soil ecological slope protection scheme is more cost-effective. However, it should be noted that a concrete slope-protection scheme requires only light watering for curing after completion and can be put into service once it hardens. In contrast, a sprayed-topsoil ecological slope requires vegetation maintenance during the first few years after completion, with maintenance costs of approximately RMB 86,034 per year, which gradually decrease as the vegetation becomes established and stabilized. Therefore, the ecological slope-protection scheme still demonstrates cost suitability.
As global attention on climate change increases, carbon trading markets are gradually maturing. Governments and international organizations have established carbon emission trading mechanisms, providing economic incentives for emission reduction projects through market-based approaches. Ecological slope protection, as an effective low-carbon construction solution, can quantify and certify the net carbon sequestration within the vegetation’s lifecycle. The project can convert this carbon sequestration into carbon credits and participate in market trading, offsetting the initial investment and potentially higher maintenance costs and achieving long-term economic returns, thereby promoting a positive cycle between environmental and economic benefits. As the project’s operational lifespan extends, the carbon sequestration effect continues to accumulate, and its ecological value becomes more evident. Economic returns also grow over time, further enhancing the project’s sustainability and investment appeal. Furthermore, the carbon trading mechanism provides a practical incentive scheme for low-carbon construction approaches, such as ecological slope protection. This not only expands financing opportunities for green projects but also provides valuable insights for other infrastructure projects undergoing low-carbon transformation, highlighting the important role of ecological governance in addressing climate change and promoting environmental sustainability. Although vegetation carbon sequestration gives ecological slope protection the potential to be converted into carbon credits and enter the market, converting it into tradable and certifiable credits requires several key conditions: clearly defined accounting boundaries and time horizons (e.g., 20–30 years); a robust and verifiable monitoring–reporting–verification (MRV) system; demonstration of baseline and additionality; management of permanence risks and leakage; and compliance with recognized third-party certification standards. In addition, the market value of carbon credits must be the net of monitoring, verification, registration, and transaction costs, with a risk buffer reserved. As this represents only a potential opportunity, this study offers only a qualitative discussion of the issue.
In our project design, we also considered a range of construction solutions, including wet-sprayed vegetated shotcrete slope protection, lattice-beam (frame) slope protection, and eco-bag slope protection. Based on a common functional requirement, we evaluated wet-sprayed vegetated concrete, lattice-beam frameworks, eco-bag systems, and sprayed-topsoil ecological protection. The wet-sprayed facing provides higher initial stiffness and better erosion control, but it increases carbon emissions during material production and fabrication and restricts deep-root growth. The lattice-beam solution enhances confinement yet does so at the cost of greater concrete/steel demand, added construction complexity, and a larger footprint. Eco-bags are flexible but require additional setback space and careful drainage, and they face durability and maintenance challenges under heavy rainfall. Given the site’s controllable geometry and exposure—and the absence of a requirement for immediate ultra-low-deformation performance—the sprayed-topsoil scheme, using locally blended materials, can rapidly establish vegetation cover and benefit from root reinforcement, offering the most appropriate balance for this project.
The main limitations of this study include the following: (1) When comparing the carbon emissions of different slope construction schemes, the concrete slope protection scheme is only a preliminary design and has not been implemented. Its transportation distance and construction equipment energy consumption are based on default values from engineering quotas and the China Building Carbon Emission Calculation Standard (GB/T 51366-2019), meaning that the results from comparing its carbon emissions with those of the ecological slope protection scheme may not reflect actual conditions [25]. (2) In the plant carbon sequestration assessment, annual average carbon sequestration data for the plants were referenced from existing literature, representing the carbon absorption capacity of the plants in a stable growth state. However, the carbon sequestration benefits of plants are influenced by environmental factors, slope gradients, and interspecies competition. In actual ecological slope protection projects, the carbon absorption capacity of plants may vary due to these factors. (3) This study does not include the potential carbon emissions from the proposed reservoir and irrigation pipeline network within the LCA boundaries. The idea of introducing rainwater collection and drip irrigation is aimed at reducing dependence on tap water and carbon emissions. However, the construction of the water storage tank and related infrastructure may also result in additional carbon emissions. This impact should be considered in a comprehensive LCA to determine whether the overall carbon reduction benefits are truly achieved or whether they are offset by the construction and maintenance of these systems. (4) The decarbonized concrete slope protection construction solution, as a combination of structural stability and ecological integration, cannot be quantified as a complete new solution in this study due to the inability to obtain localized LCI data for specific decarbonized concrete. In the future, a LCA should be conducted for decarbonized concrete projects to enable a comparative analysis with other construction solutions. (5) Research on low-carbon materials, new types of transportation equipment, and energy structures is currently limited, with corresponding data sources for carbon emission factors related to low-carbon footprint elements being scarce. This limits the accuracy of the carbon reduction optimization analysis.

6. Conclusions

(1) This research extensively examines the carbon reduction potential of Phase I of the Huama Lake ecological slope protection project, comparing the ecological slope protection approach with the conventional concrete slope protection method through LCA. A detailed analytical framework was established to monitor the carbon footprint of both construction options. The findings reveal that the ecological slope protection scheme outperforms the concrete one, reducing emissions by 667.21 tons. The project is expected to achieve carbon neutrality within 3.66 years through long-term carbon absorption by the plants. The study found that in the ecological slope protection scheme, the carbon sequestration capacity of the plants is the core driving force behind carbon reduction, a factor that may have been underestimated in slope carbon emission studies.
(2) During the first three months after the construction of the sprayed-soil ecological slope protection, the sprayed layer underwent four heavy rainfall events, with the maximum rainfall exceeding 100 mm. Despite several storms, the substrate successfully covered the majority of the slope surface and wire mesh. Some localized areas, such as steep slopes (e.g., inverted slopes or areas with water infiltration), experienced some runoff and detachment. The issue of the wire mesh not being fully covered was addressed by rerouting water flow and supplementary spraying. The intercepting ditches at the top of the slope successfully captured rainwater from the surrounding mountains, preventing direct water flow erosion on the slope. Between the completion of the sprayed layer and plant germination, the slope experienced minor surface erosion and rill formation (with an average depth of approximately 1–2 mm) during heavy rainfall events. However, as vegetation rapidly grew, the plant cover increasingly strengthened, reducing the impact of rainwater erosion. Additionally, the reinforcing effect of plant root systems further enhanced the substrate’s resistance to erosion. After two months, the slope exhibited excellent water and soil retention, with clear runoff during heavy rainfall events. This demonstrates the long-term effectiveness of the sprayed-soil ecological slope protection solution.
(3) Additionally, this study explores methods for further reducing carbon emissions in the ecological slope protection scheme. The carbon reduction optimization plan addresses various stages that generate carbon emissions, focusing on the primary carbon sources at each stage. Practical carbon reduction measures were summarized, including low-carbon cement, recycled concrete, and recycled steel, as well as electric transport vehicles, clean energy generation, organic fertilization methods, and rainwater collection for drip irrigation. The results show that implementing these carbon reduction strategies can further reduce carbon emissions by 318.6 tons, building on the ecological slope protection scheme’s existing carbon reduction benefits. This provides significant support for global climate change mitigation and offers valuable insights for constructing other low-carbon projects.
(4) The study also emphasizes that ecological slope protection projects, as part of civil engineering, are intrinsically linked to climate and environmental changes. By integrating modern technologies and innovative methods, future ecological slope protection projects can leverage technologies such as the Internet of Things (IoT) and Geographic Information Systems (GIS) to monitor key variables in real-time, including plant growth, soil moisture, and climate change. This enables a more precise assessment of the project’s carbon sequestration effects and provides scientifically informed spatial planning solutions for its implementation. Through interdisciplinary collaboration across civil engineering, climate science, and environmental economics, comprehensive solutions can be developed to promote the green transformation of civil engineering projects and strengthen responses to climate change.
(5) In addition to the explored solutions, emerging alternatives such as concrete with carbon sequestration or decarbonation capabilities are worth considering. These alternatives present exciting potential for further reducing carbon emissions in construction projects. As research in this field advances, the integration of such materials could provide more opportunities for carbon mitigation. Future studies could explore how these advanced materials compare to traditional ecological and concrete slope protection methods, offering more sustainable solutions for long-term construction projects.
Supplementary Materials

The following supporting information can be downloaded at: https://www.mdpi.com/article/10.3390/app151810169/s1, Table S1: Material carbon emission factors using in the LCA method; Table S2: Carbon emission factors for common modes of transportation; Table S3: Energy carbon emission factors using in the LCA method; Table S4: The carbon emission factor of maintenance resource input in LCA method; Table S5: Carbon assimilation capacity of plants commonly used for slope protection.

Author Contributions

Conceptualization, K.L. and J.Y.; methodology, Y.L.; validation, W.X.; formal analysis, X.L.; investigation, W.X. and X.L.; data curation, W.X.; writing—original draft preparation, K.L.; writing—review and editing, J.Y.; visualization, W.X. All authors have read and agreed to the published version of the manuscript.

Funding

This research received no external funding.

Institutional Review Board Statement

Not applicable.

Informed Consent Statement

Not applicable.

Data Availability Statement

The original contributions presented in this study are included in the article/Supplementary Material. Further inquiries can be directed to the corresponding author.

Acknowledgments

The authors want to thank the editor and anonymous reviewers for their valuable suggestions for improving this paper.

Conflicts of Interest

The authors declare no conflicts of interest.

References

  1. Ishikawa, T.; Zhang, T.; He, W.; Zhu, Y.; Kawamura, S. Role of road network for prevention and mitigation of runoff-induced geo-disaster under climate change. Transp. Geotech. 2024, 47, 101283. [Google Scholar] [CrossRef]
  2. Cai, J.S.; Yeh, T.C.J.; Yan, E.C.; Tang, R.-X.; Hao, Y.-H.; Huang, S.-Y.; Wen, J.-C. Importance of variability in initial soil moisture and rainfalls on slope stability. J. Hydrol. 2019, 571, 265–278. [Google Scholar] [CrossRef]
  3. Rahayu, W.; Ramadhan, R.I.; Adinegara, A.W.; Adiguna, G.A.; Hamdany, A.H.; Wijaya, M.; Prakoso, W.A.; Sagitaningrum, F.H.; Satyanaga, A. Effect of slope protection using concrete waste on slope stability during rainfall. Results Eng. 2024, 24, 103244. [Google Scholar] [CrossRef]
  4. Ye, W.; Ma, Y.; Qin, C.; Wang, H.; Li, C.; Ding, Z. Effects of degraded durability on the long-term stability of in-service slopes with reinforced concreted support structures. Sci. Rep. 2024, 14, 21297. [Google Scholar] [CrossRef] [PubMed]
  5. Su, H.; Wu, D.; Lu, Y.; Peng, X.; Wang, X.; Chen, W.; Wang, S. Experimental and numerical study on stability performance of new ecological slope protection using bolt-hinge anchored block. Ecol. Eng. 2021, 172, 106409. [Google Scholar] [CrossRef]
  6. Li, C.; Bi, K.; Hao, H.; Li, C. Comparative studies on the seismic performances of precast segmental columns with different concrete, reinforcement and tendon materials. Structures 2024, 67, 106963. [Google Scholar] [CrossRef]
  7. Wen, X.; Han, D. Global warming accelerates: 2024 becomes the hottest year on record. Ecol. Econ. 2025, 41, 1–4. [Google Scholar]
  8. Gibbs, D.; O’Neill, K. Building a green economy? Sustainability transitions in the UK building sector. Geoforum 2015, 59, 133–141. [Google Scholar] [CrossRef]
  9. Liu, L.; Qiu, W.; Xu, W.; Sun, C.; Guo, P. Discussion on traditional slope protection and ecological slope protection technology. J. China Three Gorges Univ. (Nat. Sci.) 2007, 29, 528–532. [Google Scholar]
  10. Abdi, E.; Saleh, H.R.; Majnonian, B.; Deljouei, A. Soil fixation and erosion control by Haloxylon persicum roots in arid lands, Iran. J. Arid. Land 2019, 11, 86–96. [Google Scholar] [CrossRef]
  11. Chen, F.; Shi, K.; Qian, Q.; Te, L. Research progress on shear strength characteristics of root-soil composite materials. Nonferr. Met. Sci. Eng. 2021, 12, 96–104. [Google Scholar]
  12. Jiang, T.; Li, L.; Xue, L.; Huang, K.; Zhao, J.; Wang, L.; Wan, L.; Ding, H. Study on synergistic characteristics of accumulation landslides supported by arbor species. Forests 2022, 13, 1610. [Google Scholar] [CrossRef]
  13. Cao, W. Watershed ecological and environmental protection planning under the ‘dual carbon’ goals: Concept renewal and measure adjustment. China Popul. Resour. Environ. 2022, 32, 31–40. [Google Scholar]
  14. Yin, J.P.; Zhang, Y.X.; Fu, Y.; Wang, X.J. Research of carbon emission and carbon sequestration potential of forest vegetation in China. For. Resour. Manag. 2021, 3, 53–61. [Google Scholar] [CrossRef]
  15. Nishimura, S.; Takeshita, Y.; Nishiyama, S.; Suzuki, S.; Shibata, T.; Shuku, T.; Komatsu, M.; Kim, B. Disaster report of 2018 July heavy rain for geo-structures and slopes in Okayama. Soils Found. 2020, 60, 300–314. [Google Scholar] [CrossRef]
  16. Rebitzer, G.; Ekvall, T.; Frischknecht, R.; Hunkeler, D.; Norris, G.; Rydberg, T.; Schmidt, W.-P.; Suh, S.; Weidema, B.P.; Pennington, D.W. Life cycle assessment: Part 1: Framework, goal and scope definition, inventory analysis, and applications. Environ. Int. 2004, 30, 701–720. [Google Scholar] [CrossRef] [PubMed]
  17. Buyle, M.; Braet, J.; Audenaert, A. Life cycle assessment in the construction sector: A review. Renew. Sustain. Energy Rev. 2013, 26, 379–388. [Google Scholar] [CrossRef]
  18. ISO 14040:2006; Environmental Management—Life Cycle Assessment—Principles and Framework. International Organization for Standardization: Geneva, Switzerland, 2006.
  19. Tam, V.W.Y.; Zhou, Y.; Illankoon, C.; Le, K.N. A critical review on BIM and LCA integration using the ISO 14040 framework. Build. Environ. 2022, 213, 108865. [Google Scholar] [CrossRef]
  20. Finkbeiner, M.; Inaba, A.; Tan, R.; Christiansen, K.; Klüppel, H.-J. The new international standards for life cycle assessment: ISO 14040 and ISO 14044. Int. J. Life Cycle Assess. 2006, 11, 80–85. [Google Scholar] [CrossRef]
  21. Chou, J.S.; Yeh, K.C. Life cycle carbon dioxide emissions simulation and environmental cost analysis for building construction. J. Clean. Prod. 2015, 101, 137–147. [Google Scholar] [CrossRef]
  22. Kendall, A. Time-adjusted global warming potentials for LCA and carbon footprints. Int. J. Life Cycle Assess. 2012, 17, 1042–1049. [Google Scholar] [CrossRef]
  23. Mei, Y.; Zhou, D.; Wang, H.; Ke, X.; Liu, Z.; Tian, X.; Wang, Z. Study on carbon emission calculation during the materialization phase of subway stations and comparative analysis of carbon emissions from various construction methods. Case Stud. Constr. Mater. 2024, 21, e03923. [Google Scholar] [CrossRef]
  24. Zhao, C.; Sander, H.A. Quantifying and mapping the supply of and demand for carbon storage and sequestration service from urban trees. PLoS ONE 2015, 10, e0136392. [Google Scholar] [CrossRef] [PubMed]
  25. GB/T 51366-2019; Standard for Building Carbon Emission Calculation. Ministry of Housing and Urban-Rural Development of the People’s Republic of China. China Architecture & Building Press: Beijing, China, 2019.
  26. CPCD 2025 China Product Carbon Footprint Factor Database. Available online: http://lca.cityghg.com/ (accessed on 2 April 2025).
  27. Chen, J.; Wang, X.; Wang, X.; Ma, X.; Chen, Y. Calculation of carbon dioxide emissions in the life cycle of high-speed railway. J. China Railw. Soc. 2016, 38, 47–55. [Google Scholar]
  28. Li, J.G. Study on Low-Carbon Optimization of Regional Highway Roadbed. Ph.D. Thesis, Xi’an Technological University, Xi’an, China, 2024. [Google Scholar]
  29. Shi, M.Y.; Wang, Z.J.; Yang, G.Q.; Li, D. Calculation and evaluation of carbon emission from different types of retaining structures. Railw. Investig. Surv. 2020, 46, 41–48. [Google Scholar]
  30. Guo, T.T.; Huang, Y.P.; Qian, H.; Shao, F.; Wang, B.; Fu, D.; Zhang, Y. Carbon budget of typical artificial plant communities in the parks around the West Lake in Hangzhou. J. Zhejiang For. Sci. Technol. 2023, 43, 82–92. [Google Scholar]
  31. Song, X.C.; Du, S.; Deng, C.N.; Shen, P.; Zhu, F.; Xie, M. Comparative study on carbon footprint of sludge ceramsite and fly ash ceramsite. China Environ. Sci. 2025, 45, 583–592. [Google Scholar]
  32. Xue, S.Y.; Zhu, J.J.; Hu, C.X. Study on carbon emission calculation and carbon reduction strategy in landscape planting and maintenance stage of residential community: Taking a district in Jiangning District of Nanjing City as an example. Constr. Sci. Technol. 2022, 10, 66–69. [Google Scholar]
  33. CEIC. Energy Consumption per Capita in China. 2022. Available online: https://www.ceicdata.com/zh-hans/china/energy-consumption-percapita (accessed on 2 April 2025).
  34. Institute for Global Environmental Strategies. Good Practice Guidance and Uncertainty Management in National Greenhouse Gas Inventories. In IPCC 2006 Guidebook; Institute for Global Environmental Strategies: Kanagawa, Japan, 2006. [Google Scholar]
  35. Long, S.Y.; Shen, J.C.; Zhao, H.; Dong, H.H. Study on carbon sequestration of vegetation in expressway area. Heilongjiang J. Transp. Sci. Technol. 2022, 45, 149–157. [Google Scholar] [CrossRef]
  36. Tianjin Municipal Commission of Housing and Urban-Rural Development. Tianjin Urban Green Space Carbon Sink Design Guidelines (Trial Implementation). Tianjin Constr. Sci. Technol. 2022, 32, 22. [Google Scholar]
  37. Mao, X.K. Study on Building Life Cycle Carbon Emissions Prediction Model—Taking Residential Buildings in Tianjin as Examples. Ph.D. Thesis, Tianjin University, Tianjin, China, 2018. [Google Scholar]
  38. Xia, D.T.; Yu, S.T.; Li, B.; Wang, Y.; Wu, C. Mechanical properties and carbon emission assessment of steel fiber-reinforced alkali-activated slag recycled aggregate concrete. J. Build. Mater. 2024, 27, 938–945. [Google Scholar]
  39. Fu, L.J. Application Prospects of New Low-Carbon Cement LC3. China Cem. 2020, 9, 98–102. [Google Scholar]
  40. Chen, Q.; Lai, X.; Gu, H.; Tang, X.; Gao, F.; Han, X.; Zheng, Y. Investigating carbon footprint and carbon reduction potential using a cradle-to-cradle LCA approach on lithium-ion batteries for electric vehicles in China. J. Clean. Prod. 2022, 369, 133342. [Google Scholar] [CrossRef]
  41. Du, W.J.; Guan, M.X.; Jiang, Y.; Cao, P.H.; Wang, Z.; Kang, M.Y. Whole lifecycle assessment of carbon reduction benefits of wind power in Xinjiang. Acta Ecol. Sin. 2024, 44, 3293–3302. [Google Scholar]
  42. Li, Y.Y.; Tang, H. Research on the carbon balance of the whole life cycle of residential landscape under the concept of low carbon. Chin. Landsc. Archit. 2024, 41, 111–118. [Google Scholar]
  43. Ojeda-Paredes, A.Y.; Mitsos, A.; Dahmen, M. Retrofitting Ordinary Portland cement production for reduced greenhouse gas emissions. Comput. Chem. Eng. 2025, 201, 109200. [Google Scholar] [CrossRef]
  44. Sgaramella, A.; Pastore, L.M.; Basso, G.L.; de Santoli, L. Conversion of an existing diesel depot into an on-site hydrogen refuelling station for heavy-duty vehicles: A multi-objective optimisation. Energy Convers. Manag. 2025, 337, 119916. [Google Scholar] [CrossRef]
  45. Yan, J.; Wang, G.; Chen, S.; Zhang, H.; Qian, J.; Mao, Y. Harnessing freight platforms to promote the penetration of long-haul heavy-duty hydrogen fuel-cell trucks. Energy 2022, 254, 124225. [Google Scholar] [CrossRef]
  46. Zhang, B.; Zhang, R.; Li, Y.; Wang, S.; Xing, F. Ignoring the effects of photovoltaic array deployment on greenhouse gas emissions may lead to overestimation of the contribution of photovoltaic power generation to greenhouse gas reduction. Environ. Sci. Technol. 2023, 57, 4241–4252. [Google Scholar] [CrossRef] [PubMed]
  47. Ye, J.J.; Chen, Y.Y.; Huang, T. Application of ecological slope protection technology of wet-spraying vegetation-compatible concrete in channel slope. Bull. Soil Water Conserv. 2020, 40, 228–235. [Google Scholar]
  48. Li, X.Y.; Qin, Z.P.; Tian, Y.; Zhang, H.; Zhao, H.; Shen, J.; Shao, W.; Jiang, G.; Guo, X.; Zhang, J. Study on stability and ecological restoration of soil-covered rocky slope of an abandoned mine on an island in rainy regions. Sustainability 2022, 14, 12959. [Google Scholar] [CrossRef]
  49. Zhang, H.B.; Xiao, L.; Liu, Y.J. Effects of artificial light at night on the diversity and growth of invasive alien and native plants. Biodivers. Sci. 2025, 33, 24553. [Google Scholar]
  50. Waller, L.P.; Allen, W.J.; Barratt, B.I.P.; Condron, L.M.; França, F.M.; Hunt, J.E.; Koele, N.; Orwin, K.H.; Steel, G.S.; Tylianakis, J.M.; et al. Biotic interactions drive ecosystem responses to exotic plant invaders. Science 2020, 368, 967–972. [Google Scholar] [CrossRef]
  51. Deng, W.H.; Song, K.C.; Zhang, H.; Guan, S.Y.; Yong, J.Y.; Hu, H.Y. Structure and diversity characteristics of the rhizosphere microbial community of dominant plants on the desert steppe under changing precipitation. Acta Pratacult. Sin. 2025, 34, 12–26. [Google Scholar]
  52. Ma, M.; Tam, V.W.Y.; Le, K.N.; Osei-Kyei, R. Factors affecting the price of recycled concrete: A critical review. J. Build. Eng. 2022, 46, 103743. [Google Scholar] [CrossRef]
Figure 1. Schematic diagram of ecological slope protection and concrete slope protection structures. Note: (a) represents soil-sprayed ecological slope protection; (b) represents concrete slope protection.
Applsci 15 10169 g001
Figure 2. Initial stage construction process of ecological slope protection.
Applsci 15 10169 g002
Figure 3. Vegetation maintenance diagram after completion of the ecological slope protection project.
Applsci 15 10169 g003
Figure 4. Vegetation restoration status after completion of ecological slope protection.
Applsci 15 10169 g004
Figure 5. Life-cycle assessment of various slope construction schemes.
Applsci 15 10169 g005
Figure 6. Carbon emission calculation boundaries for ecological and concrete slope protection.
Applsci 15 10169 g006
Figure 7. Cumulative carbon emissions and plant-based carbon sequestration over the entire life cycle of different slope construction schemes.
Applsci 15 10169 g007
Figure 8. Carbon emission percentage for each stage of the two construction schemes. Note: The left side represents the ecological slope protection, and the right side represents the concrete slope protection.
Applsci 15 10169 g008
Figure 9. Carbon sequestration of different plant types over their life cycle.
Applsci 15 10169 g009
Figure 10. Comparison of carbon emissions before and after ecological slope protection optimization.
Applsci 15 10169 g010
Table 1. Global warming potential (GWP) of greenhouse gases.
Greenhouse GasGWP-100
CO21
CH428
N2O265
Table 2. Carbon emissions from the material production phase for both construction schemes.
Type of SlopeCategoryUnitAmountEmission FactorCarbon Emission (tCO2e)
Concrete slopeCementTon48.4735 kgCO2e/t35.57
Medium sandTon67.32.51 kgCO2e/t0.17
Crushed stoneTon203.282.18 kgCO2e/t0.44
C25 concretem366.9216 kgCO2e/m314.45
C20 concretem34156193 kgCO2e/m3802.11
AnchorTon48.32600 kgCO2e/t125.58
Galvanized wire meshTon68.81230 kgCO2e/t84.62
Sand gravelTon1474.27 kgCO2e/t0.63
PVC pipeTon152430 kgCO2e/t36.45
Total carbon emissions 1100.02
Ecological slopeCementTon48.4735 kgCO2e/t35.57
Medium sandTon67.32.51 kgCO2e/t0.17
Crushed stoneTon203.282.18 kgCO2e/t0.44
Sand gravelTon1474.27 kgCO2e/t0.63
C25 Concretem366.9216 kgCO2e/m314.45
AnchorTon48.32600 kgCO2e/t125.58
Galvanized wire meshTon68.81230 kgCO2e/t84.62
AdhesivesTon64.6181 kgCO2e/t11.69
Sandy loamm3235600.00
Organic fertilizerTon6272.7 kgCO2e/t4.51
Grass fiberTon37.283 kgCO2e/t3.09
Water retainerkg4963.062 kgCO2e/t1.52
Compound fertilizerkg9922.47 kgCO2e/t2.45
Long-lasting fertilizerkg14887.76 kgCO2e/t11.55
Non-woven fabrickg4033.82 kgCO2e/t1.54
Total carbon emissions 297.81
Table 3. Carbon emissions during the material transportation phase for the two construction schemes.
Type of SlopeCategoryWeight (ton)Distance (km)Emission Factor (kgCO2e/t·km)Carbon Emission (tCO2e)
Concrete slopeCement48.45000.1042.52
Medium sand67.35000.1043.50
Crushed stone203.285000.10410.57
Sand gravel1475000.1047.64
C25 concrete160.565000.1040.67
C20 concrete9974.4400.10441.49
Anchor48.3400.1293.12
Galvanized wire mesh68.85000.1294.44
PVC pipe155000.1290.97
Total carbon emissions 74.92
Ecological slopeCement48.4300.104 0.15
Medium sand67.3300.104 0.21
Crushed stone203.282000.104 4.23
Sand gravel1472000.104 3.06
C25 Concrete160.56400.104 0.67
Anchor48.33000.129 1.87
Galvanized wire mesh68.83000.129 2.66
Adhesives64.61500.129 1.25
Sandy loam353400.00 0.00
Organic fertilizer621500.129 1.20
Grass fiber37.21500.129 0.72
Water retaining agent0.4961500.129 0.01
Compound fertilizer0.9921500.1290.02
Long-lasting fertilizer1.4881500.1290.03
Non-woven fabric0.4031600.129 0.01
Total carbon emissions 16.09
Table 4. Carbon emissions from energy consumption in both construction schemes.
Type of SlopeCategoryTypeConsumptionEmission FactorCarbon Emission (tCO2e)
Concrete slopeForced mixerElectricity4200 kWh0.5395 kgCO2e/kWh2.27
Concrete pumpDiesel3260 kg3.72 kgCO2e/kg12.13
Anchor drilling rigDiesel4100 kg3.72 kgCO2e/kg15.25
Vibratory plate compactorDiesel1050 kg3.72 kgCO2e/kg3.91
LoaderDiesel2683 kg3.72 kgCO2e/kg9.98
Air compressorDiesel1320 kg3.72 kgCO2e/kg4.91
Insertion vibratorDiesel1250 kg3.72 kgCO2e/kg4.65
Total carbon emissions 53.10
Ecological slopeForced mixerElectricity3624 kWh0.5395 kgCO2e/kWh1.96
Soil grinderElectricity5483.2 kWh0.5395 kgCO2e/kWh2.96
Vibratory screening machineElectricity1642.5 kWh0.5395 kgCO2e/kWh0.89
Handheld electric drillElectricity5379.17 kWh0.5395 kgCO2e/kWh2.90
Hydraulic seeding machineElectricity1183.95 kWh0.5395 kgCO2e/kWh0.64
Air compressorDiesel1150 kg3.72 kgCO2e/kg4.28
LoaderDiesel2473.14 kg3.72 kgCO2e/kg9.20
Total carbon emissions 22.83
Table 5. Carbon emissions in the ecological slope protection maintenance phase.
Conservation Resource InputsUnitAmountEmission Factor (kgCO2e/unit·a)Annual Carbon Emission (tCO2e/a)
Compound fertilizerKg1823.372.734.98
InsecticideKg113.947.730.88
Piped waterTon853.580.30.26
LaborDay192.111.1230.22
GasolineKg3183.561.13
Total Annual Carbon Emissions 7.47 tCO2
Life Cycle Carbon Emissions 224.10 tCO2
Table 6. Carbon sequestration by vegetation in ecological slope protection.
Latin NameCategoryAmountCarbon Assimilation Capacity (kgCO2e/unit·a)Annual Carbon Assimilations (tCO2/a)
Magnolia Grandiflora LinnTree105151.3915.90
Cinnamomum camphoraTree31652.9216.72
Nerium oleanderShrub84623.6420.00
Camellia japonicaShrub126916.4520.88
Ligustrum quihoui CarrShrub169210.2517.34
Zoysia japonicaHerb1250.41.191.49
Poa annuaHerb2875.91.23.45
Local wildflower combinationHerb5001.60.7333.68
Total Annual Carbon Assimilations 99.46 tCO2/a
Life Cycle Carbon Assimilations 2983.80 tCO2
Table 7. Carbon emission reductions for each stage after optimization.
PointTypologyCarbon Emission (tCO2e)Optimization TypeCarbon Emission (tCO2e)Carbon Emission Reduction (tCO2e)
Material Production PhaseCement35.57Low-Carbon Cement24.9010.67
C25 Concrete14.45Recycled Concrete5.718.74
Steel210.20Recycled Steel67.72142.49
Transportation PhaseHeavy Gasoline Truck832All-Electric Heavy Truck3.684.64
Heavy Diesel Truck7.772.775
Construction PhaseThermal Power Generation22.83Clean Energy Power Generation0.5822.25
Maintenance PhaseCompound Fertilizer149.40Organic Fertilizer34.36115.04
Tap Water7.80Rainwater07.80
Manual Water Spraying6.60Drip irrigation4.621.98
Disclaimer/Publisher’s Note: The statements, opinions and data contained in all publications are solely those of the individual author(s) and contributor(s) and not of MDPI and/or the editor(s). MDPI and/or the editor(s) disclaim responsibility for any injury to people or property resulting from any ideas, methods, instructions or products referred to in the content.