Abstract
Table tennis (TT) is a high-speed sport requiring integrated cognitive and motor skills. However, the existing assessment tools have failed to replicate its sport-specific demands. Therefore, this study aimed to evaluate the validity and reliability of the Reactive Table Tennis test designed to assess cognitive–motor performance in TT. Sixty athletes were recruited from TT, combat sports (CS), team sports (TS), and track and field (TF). Participants were required to react to 10 visual stimuli randomly emitted from three devices placed 3 m frontally by performing 1.5 m lateral or frontal displacements. Athletes passed through a timing gate using either both hands (B) or only one hand (O) under two conditions: with consecutive stimulus presentation (C) and with a 0.8 s delay between stimuli (D), simulating the typical inter-shot time observed during the rallies. Each participant completed three trials per condition on three non-consecutive days. Results showed the highest reliability under the delayed conditions (ICCBD = 0.969; ICCOD = 0.961), along with lower coefficients of variation than for the consecutive conditions. TT players performed significantly faster (p < 0.05) than other athletes under BD, OD, and BC but not under OC conditions. The mean of three trials is recommended for more accurate assessments. The proposed test proved to be a valid and reliable tool, especially under the both hand-delay condition, and is suitable for large-scale use in TT.
1. Introduction
Table tennis is a high-speed sport that requires a unique combination of cognitive and motor skills. Players must rapidly perceive visual stimuli and execute quick and multidirectional movements in a very short time. Among these, frontal and lateral displacements are the most common movement patterns, mainly due to the limited range of motion required and the need to constantly maintain a frontal orientation relative to the table [1]. In particular, the one-step technique, used to perform forward displacements, is the most frequent movement (35.6% in males, 21.9% in females), followed by the chassé-step technique, employed for lateral displacements (19.7% in males, 21.7% in females) [1]. These movements require specific footwork techniques which are selected in response to the opponent’s stroke and the trajectory of the ball [2].
The complex interaction between cognitive and motor components highlights the need for an assessment tool that accurately reflects the sport-specific demands of table tennis. To date, the literature reports only one validated test for the evaluation of reaction abilities and multidirectional movement patterns in table tennis players [3]. However, this test does not accurately replicate the typical footwork of table tennis performance. In fact, the test requires only lateral displacements, and the distances covered are considerably longer than those required in actual play. Additionally, the presence of an operator administering the stimuli may affect the reliability of the test. Alternative tests introducing lighting devices have been proposed to enhance the precision and standardization of cognitive–motor performance assessment in table tennis [4,5]. However, these approaches present some limitations. Specifically, the distances covered and the footwork required do not simulate real-game scenarios, and the lack of a repeated sequence of stimuli limits the test’s capability to replicate the dynamic nature of table tennis [4]. In addition, the excessive number of stimuli and their non-frontal presentation fail to accurately reflect the perceptual and spatial demands of real-game situations [5]. Furthermore, a response time test has also been validated for agility-based sports [6]. Nevertheless, this test is not suitable for table tennis, as it involves peripheral stimuli and lacks repeated reactions, both of which are essential features of this sport.
In this context, we developed a novel repeated reactive test that reflects the distinctive characteristics of table tennis and aim to assess its specific cognitive–motor demands. As with any new assessment tool, investigating the reliability and validity of the test is an essential phase. Reliability can be defined as the consistency of an individual’s performance on a test [7]. Two types of reliability were considered: relative and absolute [8]. Relative reliability concerns the consistency of individuals’ positions within a group, and it can be defined as the degree to which individuals maintain their ranking within a sample across repeated measurements [7,9]. Absolute reliability refers to the consistency of individuals’ scores, indicating the degree of variability in repeated measures for each individual [7,9]. To determine whether changes in performance are meaningful (usefulness), the smallest worthwhile change (SWC) in a performance indicator is often compared with the uncertainty or noise in the results or measurements [10,11]. Validity is defined as the extent to which a concept is accurately measured in a quantitative study [12]. There are three types of validity, one of which is construct validity [13]. It concerns the extent to which a protocol measures a hypothetical construct, and it can be compared by measuring different groups of subjects with different abilities [13].
An additional methodological issue in performance assessment is determining whether the mean of multiple trials or the single best performance provides a more accurate measure. The literature presents a heterogeneous approach: some studies reported only the best trial [14,15,16,17,18,19]; others used the mean of several attempts [6,20,21]. Some studies have compared these methods to establish which offers greater reliability and validity [22,23]. While Buchheit and colleagues [22] reported very similar results between the two approaches, Impellizzeri and colleagues [23] supported the use of the mean as a more reliable measure. They found that, the test (a repeated shuttle-sprint ability test for football players) showed acceptable relative and absolute reliability only when considering the mean of multiple attempts, particularly in the intraclass correlation coefficient (ICCmean = 0.81, ICCbest = 0.15). Finally, other authors use either the best or both the mean and the best trial, depending on the type of performance test [24]. Specifically, they considered only the best trial for vertical jump tests, and both the mean and best trials for repeated sprint tests.
Accurate and sport-specific assessment tools are essential for both researchers and pratictioners, as they allow precise evaluation of the athletes. As current assessment tools for reactive and multidirectional performance are not tailored to the specific demands of table tennis, the purposes of the present study were (1) to evaluate the reliability of a Reactive Table Tennis test and its capability to discriminate between athletes of different sport groups (i.e., construct validity), and (2) to explore whether the average or the best performance across multiple trials provides a more appropriate measure for performance assessment. Accordingly, this study aims to propose a standardized and practical assessment protocol for researchers, coaches, and practitioners that can be applied to monitor training progress, design targeted interventions, and investigate performance determinants in table tennis. We hypothesyzed that the proposed Reactive Table Tennis test is both reliable and valid for assessing cognitive–motor performance in table tennis players.
2. Materials and Methods
An observational study design was used to determine the reliability and validity of the Reactive Table Tennis test.
This study was approved by the Research Ethics Board of the University of Parma (Parma, Italy, reference number: 0198249-18/07/2023) and conducted in accordance with the Declaration of Helsinki. Written informed consent was obtained from all participants aged older than 18 years. For participants under the age of 18, informed consent was provided by their legal representatives.
2.1. Participants
To ensure adequate precision in the estimation of reliability, a sample of around 50 participants and at least three repeated measurements are generally recommended [25]. Therefore, sixty experienced male athletes (age = 22.8 ± 5.2 years; height = 176.1 ± 6.2 cm; body mass = 69.3 ± 9 kg) were recruited for the study. Participants were distributed across four sport categories: table tennis ([TT] n = 15), combat sports ([CS] n = 15), team sports ([TS] n = 15), and track and field sports ([TF] n = 15). A post hoc power analysis was conducted using G*Power software (version 3.1.9.7). Participants belonged to the Tier 4 (elite/international level) (10%), Tier 3 (highly trained/national level) (56%), and Tier 2 (trained/developmental) (34%) levels [26]. Eligibility was determined in accordance with the following inclusion criteria: (a) age between 15 and 39 years; (b) a minimum of 3 years of experience in their respective sport; (c) currently active competitive athletes (international, national, regional, or local level); (d) not involved in other racket sports, such as tennis, badminton, padel, squash, or pickleball, either at competitive or recreational levels; (e) absence of known cardiovascular, pulmonary, metabolic, bone, or joint disorders; (f) no musculoskeletal injuries in the six months prior to testing. Participants were required to avoid exercising for 24 h and caffeine and alcohol intake for 12 h prior to each experimental session. Participants were asked to wear indoor sports shoes.
2.2. Procedures
Participants took part in three experimental sessions, each separated by a 48 h resting period, conducted at the ASD Tennistavolo San Polo’s venue (Parma, Italy), during the competitive season between April and September 2024. During the first session, participants’ height (cm) and body mass (kg) were measured to the nearest decimal, and information on sport type and playing experience was collected. To avoid the learning effect, participants were familiarized with the testing procedures and performed several practice attempts until they reach a performance plateau. Before each session, a standardized warm up was carried out, consisting of 3 min of rope skipping followed by specific reactive and multidirectional exercises. To reduce diurnal variation, all sessions for each participant were scheduled at the same time of the day. All procedures related to test administration were conducted by the same researchers, who were blinded to the participants’ group allocation. The experimental sessions were conducted in a single sport venue to ensure the use of the same floor, TT table, and experimental settings to guarantee the replicability of testing procedures.
2.2.1. Test Setup
A Reactive Table Tennis test reflecting the specific cognitive–motor demands of table tennis performance was developed (Figure 1). Three lighting devices (WittySEM system, Microgate Srl, Bolzano, Italy) were positioned centrally on the table, immediately behind the net and 20 cm from each other. Starting from a central position in front of a TT table, participants were required to react to 11 random and repeated visual green light stimuli by performing a 1.5 m displacement forward, to the left, or to the right in response to the lighted device. The 1.5 m displacement corresponds to the width of the table [27] and represents the distance usually covered by the players when moving from backhand to forehand corner (and vice versa), or when reaching a short ball under the net. The starting point was located centrally in front of the table, 3 m away from the light-emitting devices, which approximately represents the distance between players during rallies. The first stimulus served only to start the timing, with the participant’s reaction time being measured for a total of 10 stimuli. Three timing gates (Witty timing system, Microgate Srl, Bolzano, Italy), connected with the light-emitting devices via AUX cables, were used to register each interval and the total time. Participants triggered the gates by breaking the infrared beam with their hands. After each gate interruption, the light on the devices turned off, and a new stimulus was presented. All devices and gates were positioned at a height of 1.20 m above the ground.
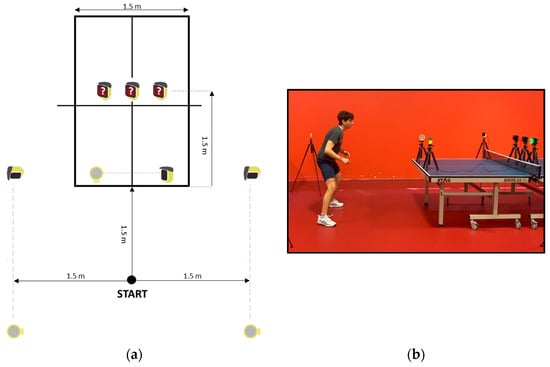
Figure 1.
Reactive Table Tennis test configuration. (a) Schematic illustration; (b) real illustration. The question marks indicate the unpredictability of the stimuli presentation.
The test was conducted under four different conditions:
- Both Hands-Consecutive (BC): participants reached the timing gates using both hands (right when moving to the right, left when moving to the left, and their preferred hand when moving forward);
- One Hand-Consecutive (OC): participants reached the timing gates always using their preferred hand, regardless of direction;
- Both Hands-Delay (BD): participants used both hands as in the BC condition, but stimuli were presented with a 0.8 s delay in between;
- One Hand-Delay (OD): participants used only their preferred hand, with a 0.8 s delay between stimuli, as in the BD condition.
The 0.8 s interval among stimuli under the delay conditions reflects the inter-shot time typically observed during the rallies, simulating realistic game scenarios [28,29,30,31]. Under the consecutive conditions, participants could move directly to the next gate without returning to the starting point. In contrast, under the delay conditions, they were required to return to the starting point after each stimulus.
2.2.2. Data Collection
Three trials for each condition were registered for each experimental session, with a 2 min resting period between trials to minimize the effect of fatigue. For every trial, the time taken for each response and the total time were registered. The mean and the best performance of the three trials for each condition were considered for the analysis. Trials were repeated if any execution error occurred during test administration, such as taking the wrong direction or failing to trigger the timing gate.
2.3. Statistical Analysis
Data were analyzed using the Statistical Package for the Social Sciences, version 28.0.1.1 (SPSS Inc., Chicago, IL, USA). The level of statistical significance was set at p < 0.05 for all computations. Prior to the analysis, the Kolmogorov–Smirnov test was applied to ascertain the normality of data distribution.
The presence of heteroscedasticity or homoscedasticity was detected by calculating the Pearson’s r correlation between the absolute differences among measurements and the respective means [16].
To assess systematic bias, a repeated measures ANOVA was conducted, followed by Bonferroni corrected post hoc multiple comparison [7].
The intraclass correlation coefficients (ICCs) (3,3) and the 95% confidence intervals (CIs) were used for the analysis of inter-day test–retest reliability (relative reliability) [7,9]. The model 3,3 corresponds to a two-way mixed effect, absolute agreement, and multiple (three) raters/measurements [32]. ICC 95% CI values less than 0.5, between 0.5 and 0.75, between 0.75 and 0.9, and greater than 0.9 reveal poor, moderate, good, and excellent reliability, respectively [29]. Absolute reliability is the degree to which repeated measurements vary for individuals and was evaluated using coefficient of variation (CV) and standard error of measurement (SEM) [7,9,25]. Individual CVs were calculated by dividing the standard deviation (SD) by the mean and multiplying the result by 100. The overall CV for the total sample was obtained by averaging the individual CVs [7]. SEM was calculated from the means square error term (MSE) in a repeated measures ANOVA of the three trials using the following equation [9]:
The usefulness of the test was evaluated by comparing the SEM with the SWC of the total time [10,33,34]. The SWC was determined by multiplying the between subject SD by 0.2 [6,10,11,22]. When the SEM was lower than the SWC, the test was rated as “good”; when the SEM had comparable values to the SWC, it was rated as “acceptable”; when the SEM was higher than the SWC, it was rated as “marginal” [6,10,11,22].
The minimal detectable change at the 95% confidence level (MDC95), that is, the minimal amount of change that is not likely to be attributed in measurement error, was calculated using the following equation [9,35]:
For the construct validity analysis, one-way ANOVA was applied to ascertain the main effect of sport type in the investigated variable. The effect size for the main effect was calculated as partial eta squared (ηp2) and interpreted as small (<0.06), medium (0.06–0.14), and large effects (>0.14) [36]. In case of a significant main effect, Bonferroni post hoc correction was applied for multiple comparisons. Cohen’s d effect sizes (d) for each comparison were calculated and interpreted as trivial (<0.19), small (0.20–0.59), moderate (0.60–1.19), large (1.20–1.99), very large (2.00–4.00), and extremely large (>4.0) [37].
3. Results
3.1. Participants’ Characteristics
A significant main effect emerged for age (F = 3.124, p = 0.033, ηp2 = 0.143), body mass index (BMI) (F = 6.582, p < 0.001, ηp2 = 0.261), and experience (F = 8.046, p < 0.001, ηp2 = 0.301). Post hoc comparisons among sport types are shown in Table 1.

Table 1.
Participants’ characteristics (mean ± SD).
3.2. Reliability
Table 2 summarizes the outcomes of both relative and absolute reliability analysis, including results based on the mean and the best performance of each session.
Table 2.
Reliability of the test for the measurement of total time (mean ± SD) across the three experimental sessions in the overall sample.
When considering the mean of the three trials of each session, the measurement of total time demonstrated an “excellent” reliability (ICC and 95% CI) under the delay conditions (for both hand and one hand), while the consecutive conditions (for both hand and one hand) showed lower values, for both ICC and 95% CI. Similarly, CV, SEM, and MDC95 values were lower for delay conditions compared with consecutive conditions. SWC demonstrated similar values across all conditions.
Considering only the best trial of each session, the test demonstrated a lower reliability (for both relative and absolute parameters) in respect to the mean of the three trials for both delay and consecutive conditions, while usefulness showed similar results. Conversely, MDC95 results were higher when considering only the best trial.
3.3. Construct Validity
When considering the mean of the three trials of each session, a significant main effect emerged for all conditions (BC: F = 8.531, p < 0.001, ηp2 = 0.314; OC: F = 7.831, p < 0.001, ηp2 = 0.296; BD: F = 14.672, p < 0.001, ηp2 = 0.440; OD: F = 12.670, p < 0.001, ηp2 = 0.404). Post hoc comparison revealed significant differences between TT and other sport groups (Figure 2). Specifically, under the BC condition, the TT group (9.01 ± 0.42 s) was significantly faster than the CS (10.21 ± 0.72 s; p < 0.001, d = 2.04), TS (9.74 ± 0.79 s; p = 0.025, d = 1.16), and TF (9.86 ± 0.68 s; p = 0.006, d = 1.50) groups. Under the OC condition, significant differences were observed between the TT (9.24 ± 0.59 s) and CS (10.48 ± 0.79 s; p < 0.001, d = 1.78) groups and between the TT and TF (10.01 ± 0.81 s; p = 0.027, d = 1.09) groups. Under the BD condition, the TT group (15.96 ± 0.51 s) showed faster times than did the CS (17.45 ± 0.61 s; p < 0.001, d = 2.65), TS (16.92 ± 0.78 s; p < 0.001, d = 1.46), and TF (16.77 ± 0.55 s; p = 0.005, d = 1.53) groups. Similarly, under the OD condition, the TT group (16.19 ± 0.52 s) performed significantly better than did the CS (17.63 ± 0.65 s; p < 0.001, d = 2.45), TS (17.01 ± 0.79 s; p = 0.005, d = 1.23), and TF (16.90 ± 0.58 s; p = 0.025, d = 1.29) groups.
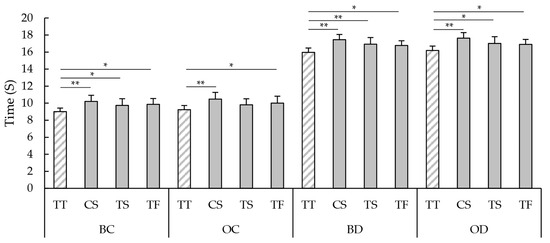
Figure 2.
Graphical representation of the construct validity analysis based on the mean value for each session. TT = table tennis; CS = combat sport; TS = team sport; TF = track and field; BC = both hands-consecutive; OC = one hand-consecutive; BD = both hands-delay; OD = one hand-delay; * p < 0.05; ** p < 0.001.
When considering only the best of the three trials of each session, a significant main effect emerged for all conditions (BC: F = 6.968, p < 0.001, ηp2 = 0.272; OC: F = 5.988, p = 0.001, ηp2 = 0.243; BD: F = 13.661, p < 0.001, ηp2 = 0.423; OD: F = 12.154, p < 0.001, ηp2 = 0.394). Post hoc comparison revealed significant differences between the TT and other sport groups (Figure 3). Specifically, under the BC condition, the TT group (TT = 8.42 ± 0.42 s) was significantly faster than the CS (9.54 ± 0.75 s; p < 0.001, d = 1.84) and TF (9.22 ± 0.67 s; p = 0.014, d = 1.43) groups. Under the OC condition, significant differences were observed only between the TT (8.71 ± 0.49 s) and CS (9.84 ± 0.81 s; p < 0.001, d = 1.69) groups. Under the BD condition, the TT group (15.73 ± 0.52 s) showed faster times than did the CS (17.16 ± 0.63 s; p < 0.001, d = 2.48), TS (16.67 ± 0.76 s; p < 0.001, d = 1.44), and TF (16.50 ± 0.55 s; p = 0.008, d = 1.44) groups. Similarly, under the OD condition, the TT group (15.96 ± 0.54 s) performed significantly better than the CS (17.35 ± 0.60 s; p < 0.001, d = 2.44), TS (16.73 ± 0.79 s; p = 0.009, d = 1.14;), and TF (16.62 ± 0.58 s; p = 0.037, d = 1.17) groups.
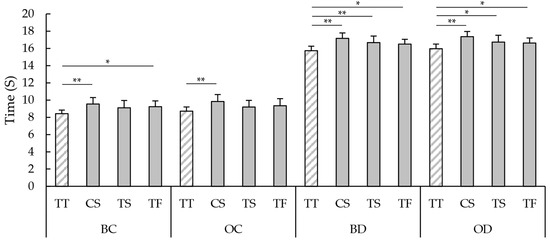
Figure 3.
Graphical representation of the construct validity analysis based on the best value for each session. TT = table tennis; CS = combat sport; TS = team sport; TF = track and field; BC = both hands-consecutive; OC = one hand-consecutive; BD = both hands-delay; OD = one hand-delay; * p < 0.05; ** p < 0.001.
4. Discussion
The complex interaction between the cognitive and motor demands of table tennis highlights the necessity of assessment tools specifically designed for this sport. Previous tests employed by researchers to evaluate cognitive–motor performance in table tennis failed to replicate the actual demands of the game due to factors such as excessive displacement distances and non-specific footwork patterns [3,4], the absence of repeated stimuli [4,5,6], or not-frontal stimuli presentation [5,6]. Therefore, the aim of this study was to develop a new repeated reactive test that reflects the distinctive characteristics of table tennis and to examine its reliability and validity. Moreover, given the varying approaches reported in the literature [6,14,15,16,17,18,19,20,21,22,23,24], we aimed to explore whether using the average or the best performance across multiple trials yields a more appropriate method for performance assessment.
In this context, the Reactive Table Tennis test was specifically designed to replicate the key demands of the sport: (1) reaction to frontally presented visual stimuli; (2) execution of short frontal or lateral displacements; (3) randomized and repeated stimuli presentation; (4) inclusion of a realistic inter-shots interval time between stimuli. The test was performed either with or without the interval time and using either both hands or only the preferred hand to reach the timing gates. These different conditions were designed to assess whether the stimulus randomization and a more realistic setup would influence execution time and consequently, the reliability and validty of the test.
Reliability can be defined as the consistency of measurements, or of an individual’s performance, on a test [7]. No significant difference emerged between the three experimental sessions under any conditions, suggesting the absence of large systematic bias and supporting the assumption of an acceptable measurement error of the test [7]. In terms of relative reliability, that is, the degree to which individuals maintain their ranking within a sample across repeated measurements [7,9], the “excellent” intraclass correlation coefficient (ICC) values observed under the delay conditions when considering the mean of three trials indicate the high reliability of these configurations, which decrease to “good” when only the best trial is considered. In contrast, both the consecutive conditions (i.e., one hand and both hands) showed lower ICC values, ranging from “good” to “moderate” considering the mean or the best trial, respectively. To analyze the absolute reliability, that is, the degree of variability in repeated measures for each individual [7,9], the coefficient of variation (CV) was considered a more appropriate index due to the heteroscedasticity detected in the data [7]. All conditions demonstrated acceptable absolute reliability, whether based on the mean or the best trial, with CV values below the 10% threshold commonly adopted in previous studies [6,38,39]. Notably, both the delay conditions showed values around 1%, with slightly lower values when considering the mean of the three trials, indicating a better absolute reliability. The usefulness of a test, defined as whether observed changes in performance are meaningful, is usually determined by comparing the SWC and the SEM [10,33,34]. In our study, the usefulness of the delay conditions can be rated as “acceptable”, especially when considering the mean of three trials, whereas it is “marginal” under the consecutive conditions. In fact, the SEM of the delay conditions (SEMBD = 0.25 s = 1.49%; SEMOD = 0.28 s = 1.65%) is comparable to the SWC (SWCBD = 0.16 s = 0.95%; SWCOD = 0.17 s = 1.00%). These results highlight the superior reliability of the test under the delay conditions, especially when the average of three trials in considered. This difference among the conditions can be explained by the randomized and uneven distribution of stimulus presentation. Under the consecutive conditions, when lateral stimuli were presented in sequence, athletes were required to perform longer displacements (3 m) because they did not have time to return to the starting position. This did not occur under the delay conditions, as athletes were able to use the delay time to return to the starting point. This variability likely contributed to the lower test–retest reliability observed under the consecutive conditions compared with the delay conditions, although overall results remained acceptable. Additionally, the similarity in ICC and CV values between the both hands and the one hand conditions further indicates that hand configuration did not impact on the reliability across sessions.
The MDC95, defined as the minimal amount of change that is not likely to be attributed to measurement error, represents a key parameter in applied sport science, as it allows researchers and practitioners to determine whether an observed change in performance can be considered real [9,35]. In the present study, the MDC95 values of the test under each condition are reported in Table 2, providing meaningful reference values to monitor athletes’ improvements.
Construct validity is typically assessed by comparing different groups of subjects with different abilities [12]. Therefore, to evaluate the construct validity of the Reactive Table Tennis test, we compared performance across four different sport disciplines (table tennis, combat sports, team sports, track and field sports) which differ in terms of cognitive–motor demands. This design aimed to verify whether the test could effectively discriminate table tennis players from those with different performance profiles. Overall, the strongest and most consistent results were obtained when considering the mean of three trials rather than the single best performance. Table tennis players emerged as the fastest group across all tested conditions. The higher BMI levels of the CS group compared with those of the TT and TF groups could represent a disadvantage for them, potentially leading to poorer quickness [40]. Among these configurations, those with the delayed stimulus presentation showed the strongest results, with higher significant differences and larger effect sizes, indicating a strong discriminative power of the test. This suggests that the delay may better simulate realistic game demands, thereby enhancing the test’s construct validity. Moreover, the both hand-consecutive condition also effectively distinguished table tennis players from athletes in the other groups when considering the mean of three trials. However, the both hand-delay condition yielded slightly better results compared to the others. Nevertheless, a possible overlapping in cognitive-motor skills across the recruited sports groups cannot be completely excluded. In this regard, athletes involved in other racket sports, such as tennis, badminton, padel, squash, or pickleball, were not considered eligible for the current study to reduce the potential overlapping in cognitive–motor skills with those of table tennis players. Considering an effect size derived from the highest partial eta squared (ηp2 = 0.440), the post hoc power analysis revealed a high level of power (0.999) for the present study involving four groups and 60 athletes. Even when the effect size was calculated from the lowest partial eta squared (ηp2 = 0.243), the level of power of the study remained high (0.959). Therefore, the both hand-delay condition may represent the most appropriate configuration for the evaluation of cognitive–motor performance in table tennis due to its high sensitivity to intergroup differences.
The literature does not provide clear guidance regarding whether the mean or the best performance of multiple trials should be considered in performance assessments of different abilities such as sprinting, jumping, and agility. Even in studies focused on validity and reliability, there is no agreement regarding the preferred approach. Most authors have chosen to report the best performance [13,14,15,16,17,18], while others have relied on the mean value [6,19,20]. Although some studies have found similar levels of validity and reliability when using the mean or the best trial [21], others support the use of the average as a more reliable measure [22]. In some cases, the choice between the two approaches depends on the type of performance test [23]. Despite this, our findings support the use of the mean of three trials, which showed slightly better outcomes in terms of both relative and absolute reliability, as well as construct validity. In fact, considering only the best attempt may overestimate the actual performance level and reduce the test’s reliability and validity.
The findings of this study suggest that the proposed Reactive Table Tennis test is a reliable and valid tool for the assessment of cognitive–motor performance in table tennis players. Among the different test configurations, the delayed conditions, especially the both hands-delay condition, showed the highest reliability and strongest capability to discriminate table tennis players from the other participants. Its sport-specific design, which includes short multidirectional displacements, repeated stimuli, frontal visual input, and realistic inter-stimuli interval time makes it particularly suitable for replicating the specific demands of the game. Therefore, the best outcomes were consistently obtained when considering the mean of the three trials for each testing session, supporting the use of averaged results for more accurate assessments.
The proposed test offers researchers, coaches, and athletes a valid protocol for the assessment of cognitive–motor performance in table tennis. It can be used to monitor players’ progress by detecting performance improvements and training effects over time. In particular, coaches can use the Reactive Table Tennis test as a practical tool to evaluate whether physical training interventions are effectively transferring to the sport-specific motor performance. Furthermore, the test can provide useful information for designing personalized and targeted training programs, since it can discriminate athletes based on their visuomotor integration system [41]. In this sense, by using the test results to identify individual strengths and weaknesses, coaches can therefore tailor training sessions to each athlete’s needs. Finally, it should be integrated into talent identification processes and used to assess sport-specific cognitive–motor abilities. The test could help coaches and scouts to recognize young athletes with outstanding sport-specific cognitive–motor abilities in their early development, complementing traditional technical assessment and physical evaluations. Future study will include table tennis players of different competitive levels to further evaluate the test’s capability to differentiate table tennis players based on their competencies and abilities. Moreover, further development of the test could consider specific adjustments for its applications in Paralympic table tennis to test Paralympic athletes based on their performance model [42].
Some limitations should be acknowledged. First, the test does not allow for the separation of the measure of reaction time and movement time, thus preventing a more detailed analysis of the perceptual-motor process. In particular, we cannot determine whether the between group differences originate from perceptual–decision processes, from movement executions, or from a combination of both. Therefore, without such separation, it is not possible to identify whether athletes differ mainly in their cognitive or motor abilities. Second, although the stimuli were presented frontally, the use of generic light visual stimuli not generated through sport-specific actions may not fully replicate the complex anticipatory cues involved in real-match situations (e.g., opponent’s body–racket kinematics and timing relative to ball–racket contact). In table tennis, anticipatory processes play a central role, as experienced players demonstrate superior anticipatory abilities compared to those of novices, relying on advanced kinematic information to predict ball trajectory and prepare appropriate responses [43]. By removing these anticipatory skills, the test may underestimate the advantage conferred by anticipation of real game scenarios. Moreover, although the sample included athletes from different competitive levels, the small number of participants at each level prevented us from creating separate subgroups and analyzing potential differences. Finally, because the study involved only male participants, the findings should be interpreted with caution for female athletes.
5. Conclusions
The Reactive Table Tennis test offers a feasible and standardized solution for a sport-specific cognitive–motor assessment, thanks to its high reliability and validity, and it could be applied on a large scale in table tennis. Researchers, coaches, and practitioners can use it to monitor players’ progress and training effects, to design personalized training programs, and integrate it into talent identification processes. The mean of at least three trials is recommended for more accurate assessments. Further research studies should investigate the test’s applicability across different genders, age categories, and performance levels.
Author Contributions
Conceptualization, A.G. and G.C.; methodology, A.G. and G.C.; formal analysis, A.G.; investigation, A.G., F.L. and S.M.; data curation, A.G.; writing—original draft preparation, A.G.; writing—review and editing, A.G., F.L., S.M., V.P. and G.C.; supervision, V.P. and G.C.; project administration, V.P. and G.C. All authors have read and agreed to the published version of the manuscript.
Funding
This research received no external funding.
Institutional Review Board Statement
The study was conducted in accordance with the Declaration of Helsinki and approved by the Institutional Ethics Board of the University of Parma (protocol code: 0198249-18/07/2023).
Informed Consent Statement
Informed consent was obtained from all subjects involved in the study.
Data Availability Statement
The data presented in this study are available on request from the corresponding author. The data are not publicly available due to privacy restrictions.
Acknowledgments
We thank all the participants and the ASD Tennistavolo San Polo sport club for their valuable contributions.
Conflicts of Interest
The authors declare no conflicts of interest.
Abbreviations
The following abbreviations are used in this manuscript:
| TT | Table Tennis |
| CS | Combat Sports |
| TS | Team Sports |
| TF | Track and Field Sports |
| BC | Both Hands-Consecutive |
| OC | One Hand-Consecutive |
| BD | Both Hands-Delay |
| OD | One Hand-Delay |
References
- Malagoli Lanzoni, I.; Katsikadelis, M.; Straub, G.; Djokic, Z. Footwork technique used in elite table tennis matches. Int. J. Racket Sports Sci. 2019, 1, 44–48. [Google Scholar] [CrossRef]
- Malagoli Lanzoni, I.; Di Michele, R.; Merni, F. A notational analysis of shot characteristics in top-level table tennis players. Eur. J. Sport. Sci. 2014, 14, 309–317. [Google Scholar] [CrossRef]
- Bandi Utama, A.M.; Tomoliyus, T.; Fauzi, R.A.; Widodo, H. Modification of Reactive Agility Test Measuring Instrument for Table Tennis Performance: Aiken’s Validity and Retest Reliability Test. Turk. J. Comput. Math. Educ. 2021, 12, 3214–3220. [Google Scholar]
- Castellar, C.; Pradas, F.; Carrasco, L.; La Torre, A.D.; González-Jurado, J.A. Analysis of reaction time and lateral displacements in national level table tennis players: Are they predictive of sport performance? Int. J. Perform. Anal. Sport. 2019, 19, 467–477. [Google Scholar] [CrossRef]
- Horníková, H. Determinants of Reactive Agility Performance in Table Tennis Players. Stud. Sportiva 2022, 16, 15–23. [Google Scholar] [CrossRef]
- Pojskic, H.; Pagaduan, J.; Uzicanin, E.; Separovic, V.; Spasic, M.; Foretic, N.; Sekulic, D. Reliability, validity and usefulness of a new response time test for agility-based sports: A simple vs. complex motor task. J. Sports Sci. Med. 2019, 18, 623–635. [Google Scholar]
- Atkinson, G.; Nevill, A.M. Statistical methods for assessing measurement error (reliability) in variables relevant to sports medicine. Sports Med. 1998, 26, 217–238. [Google Scholar] [CrossRef]
- Baumgarter, T.A. Norm-referenced measurement: Reliability. In Measurement Concepts in Physical Education and Exercise; Safrit, M.J., Wood, T.M., Eds.; Human Kinetics: Champaign, IL, USA, 1989; pp. 45–72. [Google Scholar]
- Weir, J.P. Quantifying test-retest reliability using the intraclass correlation coefficient and the SEM. J. Strength Cond. Res. 2005, 19, 231–240. [Google Scholar] [PubMed]
- Hopkins, W.G. How to interpret changes in an athletic performance test? Sport. Sci. 2004, 8, 1–7. [Google Scholar]
- Buchheit, M.; Lefebvre, B.; Laursen, P.B.; Ahmaidi, S. Reliability, usefulness, and validity of the 30–15 intermittent ice test in young elite ice hockey players. J. Strength Cond. Res. 2011, 25, 1457–1464. [Google Scholar] [CrossRef]
- Heale, R.; Twycross, A. Validity and reliability in quantitative studies. Evid. Based Nurs. 2015, 18, 66–67. [Google Scholar] [CrossRef] [PubMed]
- Currell, K.; Jeukendrup, A.E. Validity, reliability and sensitivity of measures of sporting performance. Sports Med. 2008, 38, 297–316. [Google Scholar] [CrossRef] [PubMed]
- Brini, S.; Boullosa, D.; Calleja-González, J.; Delextrat, A. Construct Validity and Reliability of a New Basketball Multidirectional Reactive Repeated Sprint Test. Int. J. Environ. Res. Public Health 2021, 18, 10695. [Google Scholar] [CrossRef]
- Darrall-Jones, J.D.; Jones, B.; Roe, G.; Till, K. Reliability and usefulness of linear sprint testing in adolescent rugby union and league players. J. Strength Cond. Res. 2016, 30, 1359–1364. [Google Scholar] [CrossRef]
- do Amaral Vasconcellos, F.V.; Fonseca, R.T.; Dantas, E.H.M. Validity and reproducibility of the sargent jump test in the assessment of explosive strength in soccer players. J. Hum. Kinet. 2012, 33, 115–121. [Google Scholar] [CrossRef]
- Hachana, Y.; Chaabène, H.; Nabli, M.A.; Attia, A.; Moualhi, J.; Farhat, N.; Elloumi, M. Test-retest reliability, criterion-related validity, and minimal detectable change of the Illinois agility test in male team sport athletes. J. Strength Cond. Res. 2013, 27, 2752–2759. [Google Scholar] [CrossRef] [PubMed]
- Hachana, Y.; Chaabene, H.; Ben Rajeb, G.; Khlifa, R.; Aouadi, R.; Chamari, K.; Gabbett, T.J. Validity and reliability of new agility test among elite and subelite under 14-soccer players. PLoS ONE 2014, 9, e95773. [Google Scholar] [CrossRef]
- Sattler, T.; Sekulic, D.; Hadzic, V.; Uljevic, O.; Dervisevic, E. Vertical jumping tests in volleyball: Reliability, validity, and playing-position specifics. J. Strength Cond. Res. 2012, 26, 1532–1538. [Google Scholar] [CrossRef]
- Condello, G.; Khemtong, C.; Lee, Y.H.; Chen, C.H.; Mandorino, M.; Santoro, E.; Liu, C.; Tessitore, A. Validity and reliability of a photoelectric cells system for the evaluation of change of direction and lateral jumping abilities in collegiate basketball athletes. J. Funct. Morphol. Kinesiol. 2020, 5, 55. [Google Scholar] [CrossRef]
- Rodríguez-Rosell, D.; Mora-Custodio, R.; Franco-Márquez, F.; Yáñez-García, J.M.; González-Badillo, J.J. Traditional vs. sport-specific vertical jump tests: Reliability, validity, and relationship with the legs strength and sprint performance in adult and teen soccer and basketball players. J. Strength Cond. Res. 2017, 31, 196–206. [Google Scholar] [CrossRef]
- Buchheit, M.; Spencer, M.; Ahmaidi, S. Reliability, usefulness, and validity of a repeated sprint and jump ability test. Int. J. Sports Physiol. Perform. 2010, 5, 3–17. [Google Scholar] [CrossRef]
- Impellizzeri, F.M.; Rampinini, E.; Castagna, C.; Bishop, D.; Bravo, D.F.; Tibaudi, A.; Wisloff, U. Validity of a repeated-sprint test for football. Int. J. Sports Med. 2008, 29, 899–905. [Google Scholar] [CrossRef]
- Rampinini, E.; Bishop, D.; Marcora, S.M.; Bravo, D.F.; Sassi, R.; Impellizzeri, F.M. Validity of simple field tests as indicators of match-related physical performance in top-level professional soccer players. Int. J. Sports Med. 2007, 28, 228–235. [Google Scholar] [CrossRef]
- Hopkins, W.G. Measures of reliability in sports medicine and science. Sports Med. 2000, 30, 1–15. [Google Scholar] [CrossRef] [PubMed]
- Stellingwerff, T.; Smith, E.S.; Martin, D.T.; Mujika, I.; Goosey-Tolfrey, V.L.; Sheppard, J.; Burke, L.M. Defining training and performance caliber: A participant classification framework. Int. J. Sports Physiol. Perform. 2021, 17, 317–331. [Google Scholar] [CrossRef]
- The International Table Tennis Federation. Statutes. 2025. Available online: www.ittf.com (accessed on 1 January 2025).
- de Mello Leite, J.V.; Barbieri, F.A.; Miyagi, W.; de Souza Malta, E.; Zagatto, A.M. Influence of game evolution and the phase of competition on temporal game structure in high-level table tennis tournaments. J. Hum. Kinet. 2017, 55, 55–63. [Google Scholar] [CrossRef] [PubMed]
- Loh, T.C.; Krasilshchikov, O. Competition performance variables differences in elite and U-21 international men singles table tennis players. J. Phys. Educ. Sport. 2015, 15, 829–833. [Google Scholar] [CrossRef]
- Milioni, F.; de Mello Leite, J.V.; Beneke, R.; De Poli, R.A.B.; Papoti, M.; Zagatto, A.M. Table tennis playing styles require specific energy systems demands. PLoS ONE 2018, 13, e0199985. [Google Scholar] [CrossRef]
- Zagatto, A.M.; Morel, E.A.; Gobatto, C.A. Physiological responses and characteristics of table tennis matches determined in official tournaments. J. Strength Cond. Res. 2010, 24, 942–949. [Google Scholar] [CrossRef]
- Koo, T.K.; Li, M.Y. A guideline of selecting and reporting intraclass correlation coefficients for reliability research. J. Chiropr. Med. 2016, 15, 155–163. [Google Scholar] [CrossRef]
- Finlay, M.J.; Page, R.M.; Greig, M.; Bridge, C.A. Test-retest reliability and sensitivity of senior elite amateur boxers maximal punch force, as quantified by a vertically mounted force plate. PLoS ONE 2023, 18, e0289791. [Google Scholar] [CrossRef]
- Rago, V.; Nakamura, F.Y.; Suarez-Balsera, C.; Arnaiz-Lastras, J.; Figueiredo, P. Isometric midthigh-pull testing: Reliability and correlation with key functional capacities in young soccer players. Int. J. Sports Physiol. Perform. 2024, 19, 1400–1408. [Google Scholar] [CrossRef] [PubMed]
- Haley, S.M.; Fragala-Pinkham, M.A. Interpreting change scores of tests and measures used in physical therapy. Phys. Ther. 2006, 86, 735–743. [Google Scholar] [CrossRef]
- Richardson, J.T.E. Eta squared and partial eta squared as measures of effect size in educational research. Educ. Res. Rev. 2011, 6, 135–147. [Google Scholar] [CrossRef]
- Cohen, J. Statistical Power Analysis for the Behavioral Sciences, 2nd ed.; Routledge: London, UK, 1988. [Google Scholar] [CrossRef]
- Clark, R.A.; Bryant, A.L.; Reaburn, P. The acute effects of a single set of contrast preloading on a loaded countermovement jump training session. J. Strength Cond. Res. 2006, 20, 162–166. [Google Scholar] [CrossRef] [PubMed]
- Cormack, S.J.; Newton, R.U.; McGuigan, M.R.; Doyle, T.L. Reliability of measures obtained during single and repeated countermovement jumps. Int. J. Sports Physiol. Perform. 2008, 3, 131–144. [Google Scholar] [CrossRef]
- Hidayat, M.Y.; Saraswati, P.A.S.; Widnyana, M.; Kinandana, G.P. Correlation between body mass index towards agility football athletes in melawi regency. Sport. Fit. J. 2022, 10, 215–222. [Google Scholar] [CrossRef]
- Presta, V.; Vitale, C.; Ambrosini, L.; Gobbi, G. Stereopsis in Sports: Visual Skills and Visuomotor Integration Models in Professional and Non-Professional Athletes. Int. J. Environ. Res. Public Health 2021, 18, 11281. [Google Scholar] [CrossRef]
- Guarnieri, A.; Presta, V.; Gobbi, G.; Ramazzina, I.; Condello, G.; Malagoli Lanzoni, I. Notational analysis of wheelchair paralympic table tennis matches. Int. J. Environ. Res. Public Health 2023, 20, 3779. [Google Scholar] [CrossRef]
- Zhao, Q.; Lu, Y.; Jaquess, K.J.; Zhou, C. Utilization of cues in action anticipation in table tennis players. J. Sports Sci. 2018, 36, 2699–2705. [Google Scholar] [CrossRef]
Disclaimer/Publisher’s Note: The statements, opinions and data contained in all publications are solely those of the individual author(s) and contributor(s) and not of MDPI and/or the editor(s). MDPI and/or the editor(s) disclaim responsibility for any injury to people or property resulting from any ideas, methods, instructions or products referred to in the content. |
© 2025 by the authors. Licensee MDPI, Basel, Switzerland. This article is an open access article distributed under the terms and conditions of the Creative Commons Attribution (CC BY) license (https://creativecommons.org/licenses/by/4.0/).