Article

Identification of Vibration Source Influence Intensity in Combine Harvesters Using Multivariate Regression Analysis

by
Petru Cârdei
1,
Nicolae-Valentin Vlăduț
1,*,
Sorin-Ștefan Biriș
2,*,
Teofil-Alin Oncescu
3,*,
Nicoleta Ungureanu
2,
Atanas Zdravkov Atanasov
4,
Florin Nenciu
1,
Gheorghe Matei
5,
Sorin Boruz
5,
Lorena-Diana Popa
6,
Gabriel-Ciprian Teliban
7,
Oana-Elena Milea
1,
Ștefan Dumitru
1,
Ana-Maria Tăbărașu
1,
Nicoleta Vanghele
1,
Melania Cismaru
1,
Cristian Radu
5 and
Simona Isticioaia
6
1
Department of Research, Development, and Innovation, National Institute of Research and Development for Machines and Installations Designed for Agriculture and Food Industry (INMA) Bucharest, 013813 Bucharest, Romania
2
Department of Biotechnical Systems, Faculty of Biotechnical Systems Engineering, National University of Science and Technology Politehnica Bucharest, 060042 Bucharest, Romania
3
Technology and Business Incubator INMA, National Institute of Research and Development for Machines and Installations Designed for Agriculture and Food Industry (INMA) Bucharest, 013811 Bucharest, Romania
4
Department of Agricultural Machinery, Agrarian and Industrial Faculty, University of Ruse Angel Kanchev, 7017 Ruse, Bulgaria
5
Faculty of Agronomy, University of Craiova, 200585 Craiova, Romania
6
Agricultural Research and Development Station Secuieni, 617415 Secuieni, Romania
7
Department of Horticulture, “Ion Ionescu de la Brad” Iasi University of Life Sciences, 700490 Iași, Romania
*
Authors to whom correspondence should be addressed.
Appl. Sci. 2025, 15(18), 10159; https://doi.org/10.3390/app151810159
Submission received: 4 August 2025 / Revised: 12 September 2025 / Accepted: 12 September 2025 / Published: 17 September 2025

Abstract

This study presents a multivariate regression-based analysis aimed at quantifying the influence of key vibration-generating components in two types of grain combines—C110H (with straw walker) and CASE IH (axial flow)—on the operator’s seat (OS). Using triaxial accelerometers, vibrational measurements were performed under both stationary and operational working mode. RMS acceleration values were recorded for major subsystems (engine, threshing unit, chassis, chopper/header) and processed via multiple linear regression. The models generated for each combine and axis (Ox, Oy, Oz) revealed high coefficients of determination (R2 > 0.85), confirming the linear model’s validity. Influence maps and standardized coefficients were used to rank the sources of vibration. Results indicate that the straw walker dominates vibration transmission in the C110H, while the header and threshing system are more significant in the CASE IH. The findings support the development of predictive algorithms for real-time vibration monitoring and ergonomic improvements in combine design. Moreover, the proposed methodology provides a cost-effective diagnostic tool for early fault detection, targeted maintenance, and the long-term reduction of operator fatigue and injury risks.

1. Introduction

As detailed in specialized literature [1,2], regression provides a robust framework for inferential analysis, which is essential in decision-making, forecasting, and the diagnosis of technical systems. Multiple linear regression allows for the simultaneous examination of the influence of several factors on a measurable quantity, offering a clear hierarchy of their importance through estimated coefficients and statistical significance tests.
By applying these principles to the field of vibration mechanics, it becomes possible to quantitatively evaluate the impact exerted by various sources of mechanical excitation on a specific subsystem—in this case, the operator’s seat (OS) of a grain harvesting combine. Thus, regression analysis becomes a useful tool not only for phenomenological investigation but also for the functional optimization of agricultural machinery.
Linear regression can be classified as either simple, when the model includes a single explanatory variable, or multiple, when two or more independent variables are analyzed simultaneously. The simple model involves an intercept and a slope coefficient, while the multiple models assign coefficients to each included predictor [3]. Multiple regression is frequently used in applied studies, even under limited data conditions, particularly when variable selection is essential for prediction accuracy [4,5]. In parallel, simple regression remains useful for analyzing fundamental relationships, with an emphasis on proper sample sizing [6].
Multivariate linear regression extends classical analysis by simultaneously modeling multiple correlated dependent variables, providing a more accurate representation of complex processes. This method enables not only the prediction of multiple response values but also the identification of the proportion of their variation that can be explained by the predictor variables [7]. In fields such as vibration analysis or predictive maintenance, this approach has proven effective in capturing the multidimensional relationships between excitation sources and the dynamic responses of the system [8,9,10]. In this regard, efficient variable selection and multicollinearity diagnostics become critical steps in constructing a robust and interpretable model [6,11,12,13].
Regression models are frequently used in forecasting energy consumption, supply chain demand, or time series prediction in agriculture and tourism, demonstrating their relevance in complex applied contexts [14,15,16,17]. Moreover, the proper handling of phenomena such as multicollinearity contributes to the increased robustness and interpretability of regression models [18].
In the study of mechanical vibrations and their effects on various categories of receivers, including the human body, the use of regression analysis and coherence analysis represents a set of methodological tools frequently applied in practice [19,20,21,22,23,24,25,26,27,28,29,30,31,32,33]. In the case of grain harvesting combines, determining the main sources of vibration is essential for understanding their interaction with the natural frequencies of the supporting structure and chassis to avoid resonance phenomena and premature functional degradation [34,35,36].
In the field of agricultural vibration ergonomics, the present study is grounded in a comprehensive body of literature that highlights the physiological and operational consequences of prolonged exposure to whole-body vibrations (WBVs) among machinery operators. Previous studies have emphasized the need to identify and mitigate the transmission paths of harmful vibrational energy, particularly at the operator–machine interface, where comfort, safety, and long-term health outcomes are significantly affected [37,38,39,40,41,42]. By aligning with these research directions, the current work addresses the vibration exposure specific to combine harvesters, offering an engineering-based perspective for assessing and reducing operator discomfort through statistical modeling and predictive analysis.
Theoretically, these relationships can be modeled using advanced dynamic approaches, as found in the specialized literature [43].
This study utilizes experimental data previously obtained for two models of grain harvesting combines—C110H (with straw walker) and CASE IH (with axial flow)—as described in detail in [44]. The prior study had a comparative character and aimed to estimate the influence of the main vibration sources—the threshing mechanism, chassis, header, and, in the case of the conventional combine, the straw walker—on the OS, considered the main receiver. Spectral recordings of the sources and the receiver were carried out in accordance with ISO 2631-1:2001 and ISO 2631-5:2018 standards [45,46], and the evaluation of influence was based on interspectral correlation analysis and influence coefficients.
Building upon this experimental foundation, the present study deepens the investigation of the C110H combine by applying the multiple linear regression method, aiming to quantitatively and predictively determine the contribution of each vibration source to the signals received at the OS. The analysis focuses on the root mean square (RMS) values of accelerations measured over frequency bands, thus providing an integrated perspective on the relationship between vibrational emissions and the effects experienced by the operator.
Identifying the main sources of vibrations in grain harvesting combines is essential for analyzing their interaction with the natural frequency spectrum of the chassis and structural frame to prevent dangerous resonance phenomena [34]. Recent studies emphasize that the engine, threshing system, transmission, and chopper are among the primary sources of mechanical excitation affecting the OS [44].
The integration of this method with modal analysis and structural optimization contributes to the development of technical solutions aimed at reducing vibration exposure and improving operator ergonomics [36]. These contributions underscore the necessity of a systematic and predictive approach to vibration analysis based on rigorous algorithms and relevant experimental data. During the operation of agricultural combines, the complex interaction between component assemblies (the internal combustion engine, threshing system, chopping mechanism, and power transmission) generates a wide spectrum of mechanical vibrations with varying intensities and frequencies, which are transmitted to the supporting structure and cabin.
A relevant and current research direction is the precise evaluation of how these vibrations propagate to the OS, affecting comfort, safety, and operational efficiency.
Thus, the use of modern regression analysis techniques enables not only the quantification of these influences but also the identification of dominant vibration sources, providing a valuable framework for engineering interventions aimed at their reduction. The integration of experimental modal analysis with multivariate regression is particularly important for understanding the relationships between excitation parameters (such as engine speed, transmitted torque, and accelerator position) and the acceleration levels experienced by the operator along the three axes (X, Y, Z). Furthermore, obtaining a statistically significant regression predictive model can contribute to the development of real-time active monitoring algorithms integrated into modern combines.
In the context of mechanical vibration analysis generated by the functional assemblies of agricultural combine harvesters, the application of multiple linear regression provides a predictive and integrative approach for quantifying the influence exerted by each excitation source on the operator’s seat (OS), regarded as the primary vibration receiver. Compared to conventional methods based on spectral correlation or coherence analysis, regression enables the functional modeling of relationships between independent variables (vibration sources) and the dependent variable (triaxial acceleration at the OS) while also identifying statistically significant predictors.
The novelty of this study lies in the application of a multivariate regression structure to experimental data collected from a conventional combine harvester (C110H) operating under real-world conditions. By relating the RMS values of accelerations measured across frequency bands to the corresponding excitation source values, a mathematical model is developed to describe and predict how each subsystem contributes to the vibration perceived by the operator. This approach supports structural and ergonomic optimization, as well as the implementation of active algorithms for vibration monitoring and exposure mitigation.
The motivation for adopting this method stems from the current need to develop rigorous analytical tools that support engineering decision-making in the design and operation of modern agricultural machinery, with a focus on operator protection and the enhancement of equipment functional durability.

2. Materials and Methods

The data used in this research originate from previous experiments conducted on two models of grain harvesting combines—C110H and CASE IH—as described in detail in our previous study [44]. The RMS acceleration spectrum was graphically represented for both the vibration-generating components and the OS, considered the primary receiver. For the C110H combine, the vibration sources considered were the straw walker, threshing mechanism, header, and chassis. In the case of the CASE IH combine, the analyzed components included the threshing mechanism, header, and chassis. For both combine types, measurements were also taken at the operator’s seat to determine the level of vibrations transmitted to the operator.
Vibration measurements were performed in terms of acceleration along the three reference axes: Ox (horizontal, in the forward direction), Oy (lateral, perpendicular to the direction of travel), and Oz (vertical). Data were collected for each source component and for the OS along these three directions, according to the illustrative figures presented in the scientific study [44].
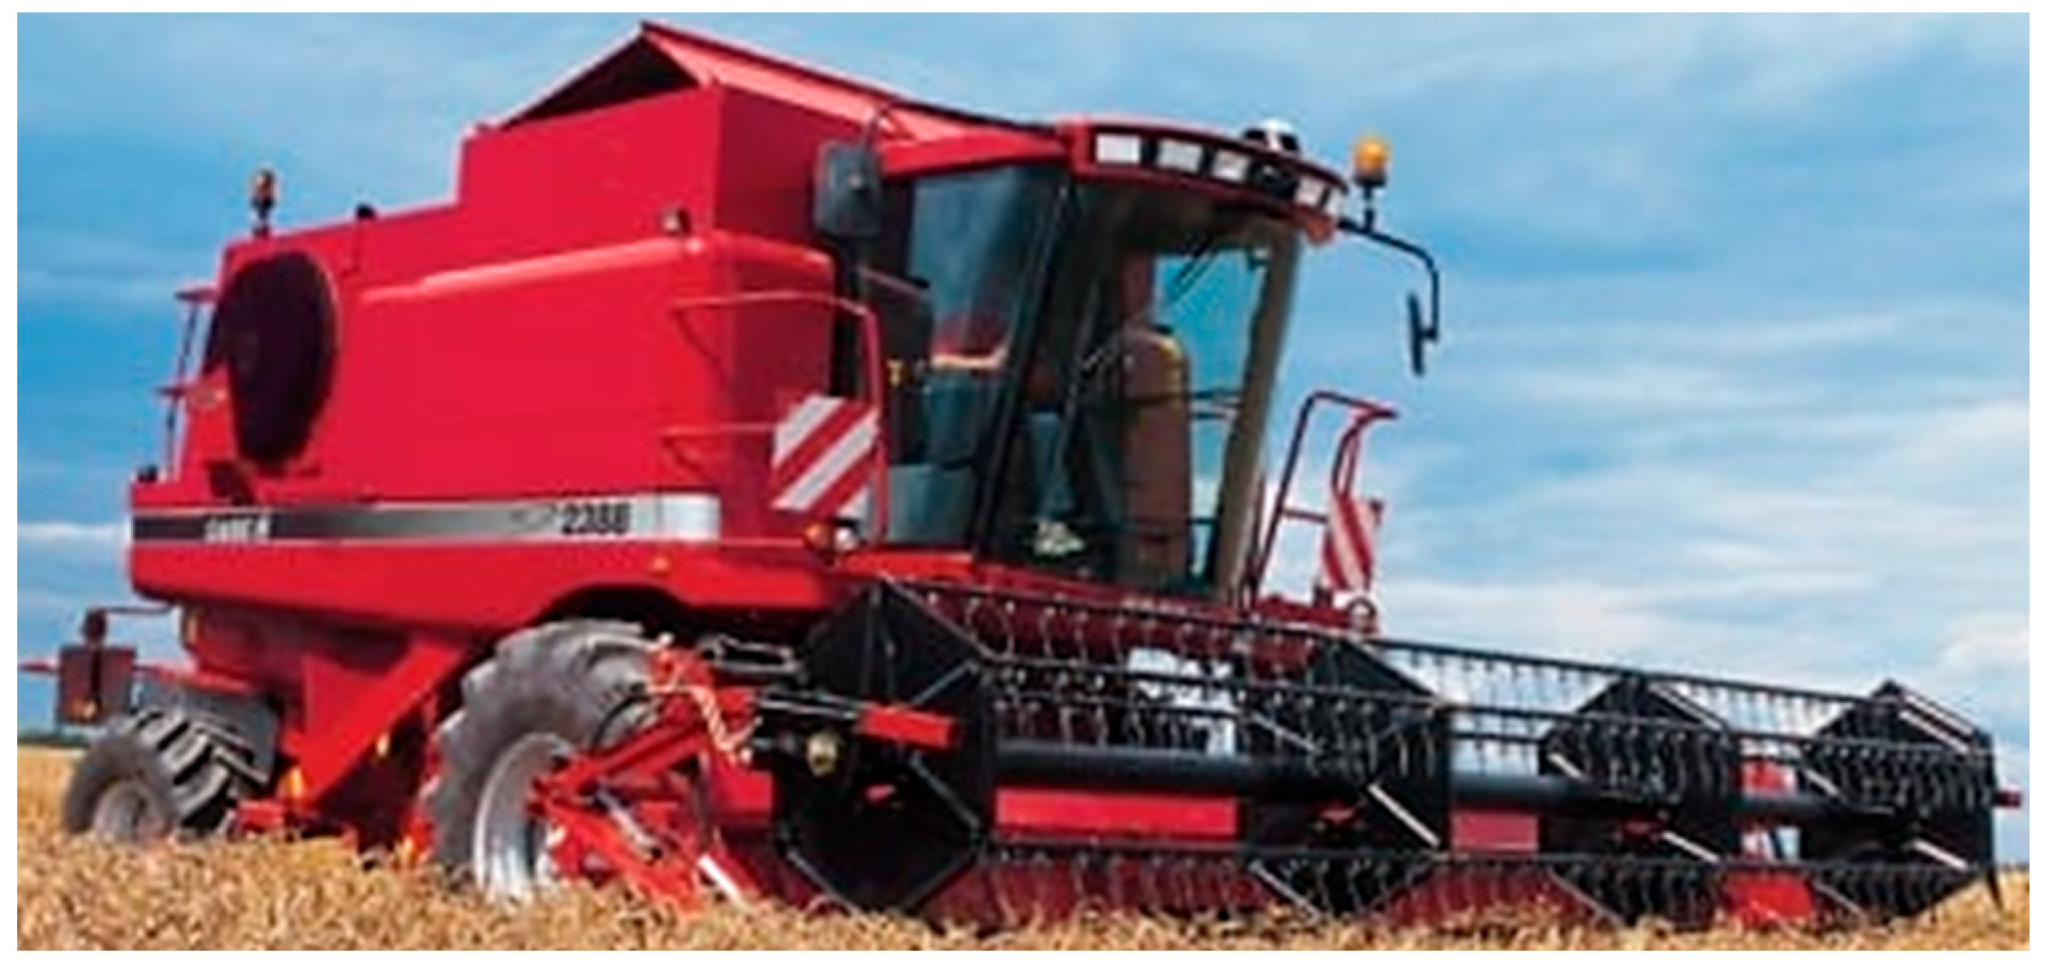
The relevant operating conditions of the two combine harvesters used In the study are illustrated in Figure 1 and Figure 2 and were maintained constant throughout the entire measurement period.
The experimental measurements were carried out in 2024 at the National Institute of Research–Development for Machines and Installations Designed for Agriculture and Food Industry (INMA) Bucharest, Romania, at the institute’s testing facilities, which include both a concrete test track and an adjacent experimental agricultural field (geographical coordinates: 44.5006742 N, 26.0724372 E). The field tests were performed in a wheat crop at the stubble stage, with an average plant height of 86 cm and a mean plant density of 421 plants/m2. The machine operated at an average working speed of 6.2 km/h during the vibration recordings. The atmospheric conditions recorded during the testing sessions were: ambient temperature of 34.6 °C, relative humidity of 43.8%, wind speed of 0.45 m/s, and atmospheric pressure of 754.6 mmHg. These environmental parameters were monitored to ensure consistency in experimental conditions and to support the reproducibility of the vibration measurements.
The evaluation of the influence of vibration-generating components on the operator’s seat can be performed using several methods:
  • Linear analysis, separately on each axis, based on the vibratory components corresponding to that axis;
  • Linear analysis on all axes simultaneously;
  • Nonlinear analysis, axis by axis;
  • Multidirectional nonlinear analysis.
In addition to these approaches, other complementary methods are also possible. In the present study, the influence of vibration sources on the OS is analyzed separately for two operating modes of the machine: stationary and working, in accordance with the initially established experimental design.
The obtained vibration spectra are graphically expressed in frequency—RMS acceleration coordinates, as described in study [44]. The notations used in the regression analysis are systematically presented in Table 1.
The data processing method consists of applying multiple linear regression analysis to the numerical files extracted from the graphical representations of the experimental data described in [44]. The regression is classified as multiple because, for each of the three components of the RMS acceleration recorded at the OS, the corresponding RMS acceleration components from the vibration sources were considered (four in the case of the C110H combine and three in the case of the CASE IH combine).
The model was constructed under the assumption of a first-order linear relationship between the explanatory variables (source accelerations) and the response variable (acceleration at the OS). This assumption was considered reasonable for two main reasons:
  • It provides an accessible and interpretable analytical framework;
  • There is no significant experimental evidence to justify the assumption of major nonlinearities in the transmission of vibrations from the source to the receiver in the analyzed configurations.
Regression analysis was performed using the software application specified in [47], and the validation of the results was conducted through the program indicated in [48]. The high values of the coefficient of determination R2 confirm the adequacy of the chosen linear model for evaluating the influence of vibration-generating sources on the OS.
In this study, by hypothesis, the dependent variables are the three components of the RMS acceleration measured at the OS, denoted as aRMSSx, aRMSSy, and aRMSSz. The independent variables (predictors) are represented by the three RMS acceleration components associated with each vibration source. Thus, in the case of the C110H combine, 12 independent variables are analyzed (corresponding to sources 1–4, 6–9, 11–14), while for the CASE IH combine, 9 variables are considered (corresponding to labels 2–4, 7–9, 12–14), according to the structure presented in Table 1.
Thus, the working statistical hypothesis assumes that the 3 dependent variables—the RMS acceleration components recorded at the OS—are functions of a set of 12 independent variables in the case of the C110H combine and 9 independent variables in the case of the CASE IH combine.
The software used for the multiple linear regression analysis automatically performs the selection of statistically significant independent variables for each regression equation, retaining only the relevant predictors in the final model form. The calculation of the coefficient of determination R2 for each relationship allows the assessment of the extent to which the selected independent variables explain the variation of the dependent variables.

3. Results

3.1. C110H Combine

3.1.1. Case of Stationary Operating Mode

In the stationary mode, where all vibration-generating components operate idly without the movement of the machine, an almost perfect linear relationship was identified between the RMS value of the acceleration measured at the operator’s seat along the Ox direction and the vibration along the same direction of the chassis.
This significant dependence is highlighted by the regression coefficients calculated using the multiple analysis algorithm available within the Stats Kingdom software [47], which was used for data processing and coefficient estimation. Mathematically, this statement is expressed by Equation (1):
a R M S S x = 0.0021434 4.348422 a R M S T h x + 0.804587 a R M S T h y 1.388706 a R M S C h y + 0.845321 a R M S H y + 1.32383 a R M S S h z
The results of the multiple linear regression analysis indicated a significant collective effect among the variables aRMSShx, aRMSThx, aRMSChx, aRMSHx, aRMSShy, aRMSThy, aRMSChy, aRMSHy, aRMSShz, aRMSThz, aRMSChz, aRMSHz, and aRMSSx. The coefficient of determination obtained from Equation (1) is R2 = 0.96 (very close to 1). Under these conditions, the F statistic has a value of F(5,14) = 66.42, with a probability of p < 0.001. For evaluating the statistical significance of regression models, ANOVA analysis provides essential tools, particularly through the F statistic and the associated p-value. The F value expresses the ratio between the variation explained by the model and the residual variation, indicating whether the regression model significantly explains the variation of the dependent variable. On the other hand, the p-value associated with the F test reflects the probability that an observed relationship occurred by chance. Generally, p-value < 0.05 indicates high statistical significance, justifying the retention of the model (or variables) in the final analysis. For further theoretical details and applied examples regarding the interpretation of the F value and p-value in the context of ANOVA, references [48,49,50] may be consulted. The software referenced in [47] selects as significant predictors those that appear in the structural Equation (1) for the dependent variable aRMSSx (acceleration in the forward direction of the combine, Ox). The coefficient of determination indicates that the five predictors selected by the multiple regression analysis explain 96% of the variation in longitudinal acceleration (Ox) at the operator’s seat in stationary mode.
For the lateral component of the RMS acceleration at the operator’s seat in stationary mode, the multiple regression analysis performed according to the procedure described in [47] led to regression Equation (2). The calculations were carried out using the Stats Kingdom platform [47], with the application’s default settings: medium effect size (f), effect size of 0.39, and numerical precision of six decimal places for the regression coefficients.
a R M S S y = 0.00372845 0.593186 a R M S H x + 0.793287 a R M S S h y 0.985051 a R M S T h z 1.036009 a R M S C h z + 2.422973 a R M S H z
The results of the multiple linear regression analysis indicated a significant collective effect among aRMSShx, aRMSThx, aRMSChx, aRMSHx, aRMSShy, aRMSThy, aRMSChy, aRMSHy, aRMSShz, aRMSThz, aRMSChz, aRMSHz, and aRMSSy.
The coefficient of determination obtained from Equation (2) is R2 = 1.00. Under these conditions, the F statistic has a value of F(5,14) = 1208.03, with a probability of p < 0.001. The software tool referenced in [47] identifies as statistically significant predictors those that appear in the structural Equation (2) for the dependent variable aRMSSy (acceleration in the lateral direction relative to the combine’s forward motion, Oy). The coefficient of determination for the model obtained for the lateral component (Oy) of the RMS acceleration at the operator’s seat in stationary mode indicates that the five predictors selected through multiple regression analysis explain 100% of the recorded signal variation. This result reflects an excellent correspondence between the model and the experimental data, confirming the relevance of the predictors included in the equation.
For the vertical component (Oz) of the RMS acceleration at the OS in the same operating mode (stationary), the Stats Kingdom software [47] generated the structural Equation (3), highlighting the relevant linear relationships between the vibration sources and the mechanical response measured at the operator’s level:
a R M S S z = 0.0127511 5.386504 a R M S T h x 0.517121 a R M S H x + 0.943862 a R M S T h y 1.396184 a R M S C h y + 1.660118 a R M S S h z + 2.284598 a R M S H z
The results of the multiple linear regression analysis indicated a significant collective effect among a R M S S h x , a R M S T h x , a R M S C h x , a R M S H x , a R M S S h y , a R M S T h y , a R M S C h y , a R M S H y , a R M S S h z , a R M S T h z , a R M S C h z , a R M S H z , and a R M S S z . The coefficient of determination obtained from Equation (3) is R2 = 0.98. Under these conditions, the F statistic has a value of F(6,13) = 95.68, with a probability of p < 0.001. The software referenced in [47] selects as statistically significant predictors those that appear in the structural Equation (3) for the dependent variable a R M S S z (acceleration in the vertical direction of the combine, Oz). The coefficient of determination shows that the five predictors selected through multiple regression analysis explain 98% of the variation in vertical acceleration (Oz) at the OS in stationary mode.
Appendix A.1.1 provides the graphical representations associated with Figure A1a–c, illustrating the root mean square (RMS) acceleration components along the three orthogonal axes (X, Y, and Z) measured for the C110 H combine harvester under stationary operating conditions. The figures depict both the directional RMS values and the resultant global acceleration, computed through the vectorial synthesis of the tri-axial components.
From an analytical perspective, these representations characterize the baseline dynamic response of the combine under stationary conditions, when excitation is mainly generated by inertial unbalances of rotating subassemblies and structural interactions transmitted through the chassis. The triaxial RMS decomposition reveals anisotropic vibration patterns, with higher magnitudes typically along the vertical (Oz) axis due to structural and gravitational effects. The resultant RMS acceleration, computed through Euclidean synthesis, provides an integrative indicator of whole-body vibration exposure, in line with ISO 2631-1:2001 and ISO 2631-5:2018 standards, and facilitates the identification of potential resonance intervals within the critical 20–60 Hz frequency range.
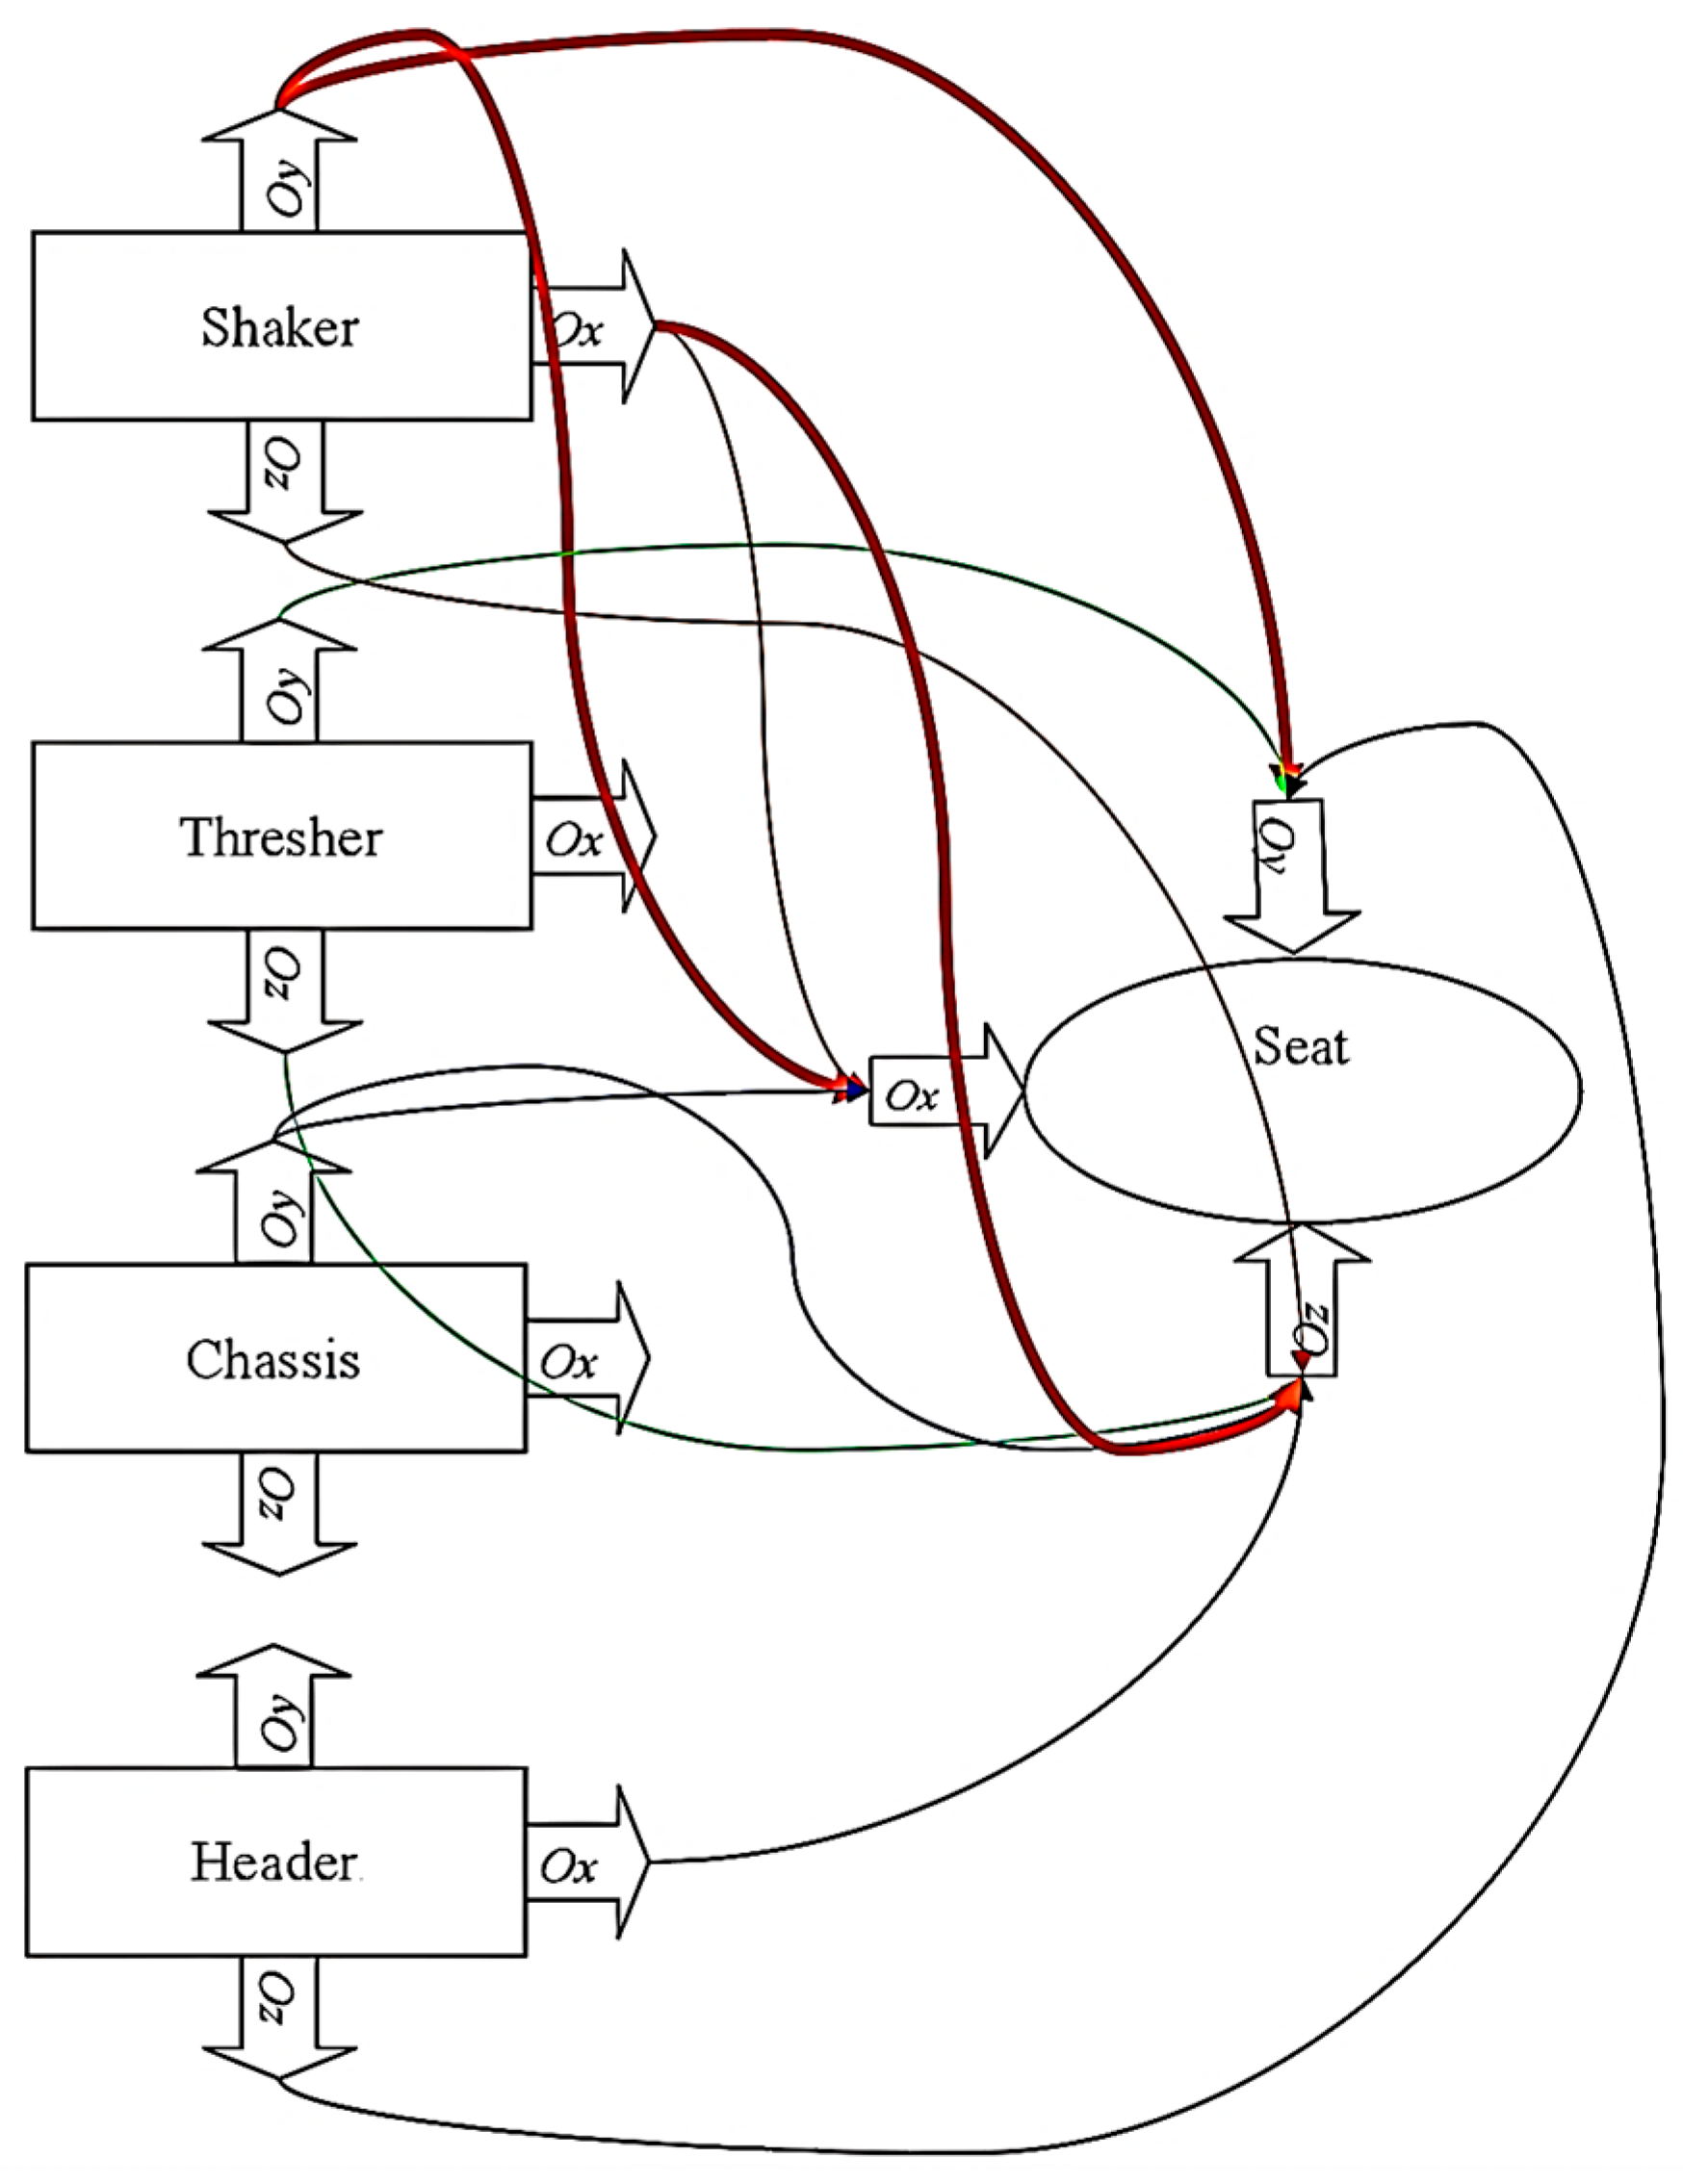
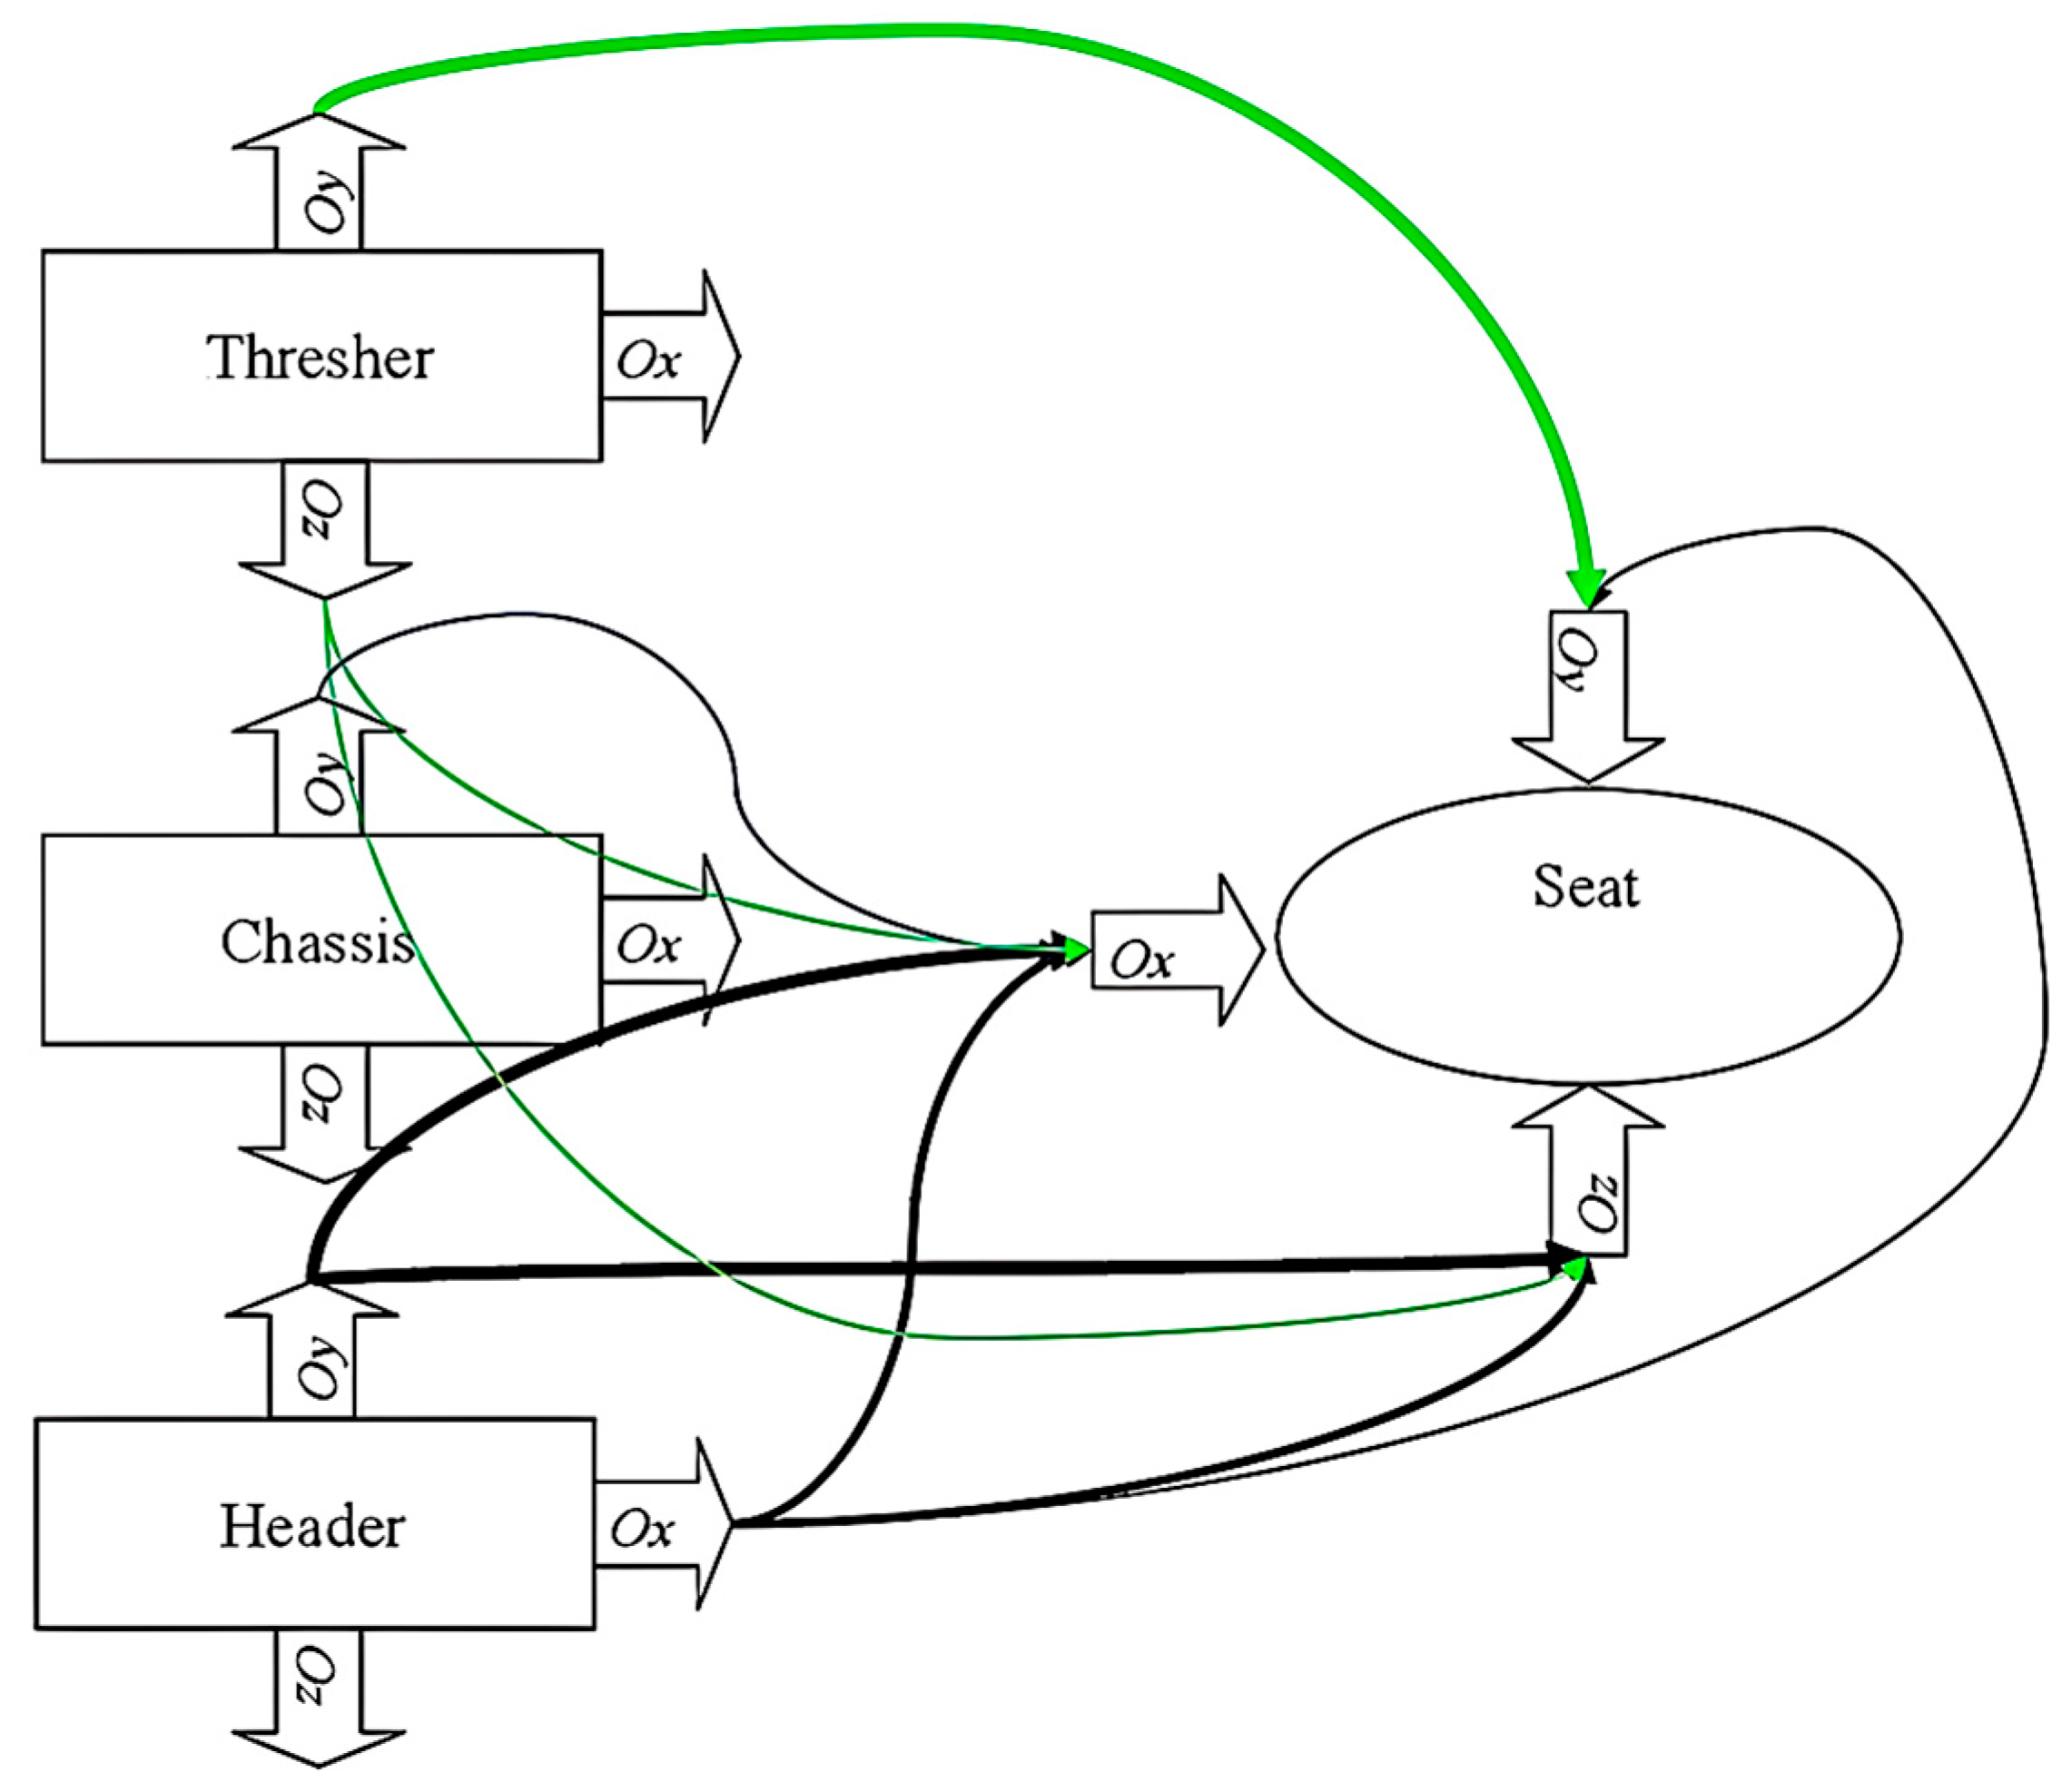
In this context, Figure 3 presents the influence map of the C110H combine under stationary mode, synthesizing the regression-derived coefficients to highlight the relative contributions of each source (straw walker, threshing system, chassis, header) to the operator’s seat vibrations. Such maps offer both a quantitative ranking of influences and a practical diagnostic tool for guiding structural optimization and ergonomic interventions aimed at reducing operator exposure.

3.1.2. Case of Working Operating Mode

For the working operating mode, in which the combine performs actual harvesting operations and all vibration-generating components operate simultaneously under load, the multiple regression analysis software Stats Kingdom [47] was used to determine the functional relationships between the RMS acceleration values recorded at the OS and the corresponding acceleration values of the vibration sources.
The obtained results are expressed by structural Equations (4)–(6), which describe the linear dependencies of each component (Ox, Oy, Oz) of the RMS acceleration at the operator’s seat on the relevant acceleration components of the vibration generators.
a R M S S x = 0.0728602 0.834345 a R M S S h x + 0.580065 a R M S S h y 0.533179 a R M S C h y
The results of the multiple linear regression analysis indicated a significant collective effect among a R M S S h x , a R M S T h x , a R M S C h x , a R M S H x , a R M S S h y , a R M S T h y , a R M S C h y , a R M S H y , a R M S S h z , a R M S T h z , a R M S C h z , a R M S H z , and a R M S S x . The coefficient of determination obtained from Equation (4) is R2 = 0.96 (very close to 1). Under these conditions, the F statistic has a value of F(3,16) = 129.62, with a probability of p < 0.001.
The software referenced in [47] selects as significant predictors those appearing in the structural Equation (4) for the dependent variable a R M S S x (acceleration in the forward direction of the combine, Ox). The coefficient of determination indicates that the three predictors selected by the multiple regression analysis explain 96% of the variation in longitudinal acceleration (Ox) at the OS in the working (harvesting) mode.
a R M S S y = 0.0398874 + 0.450284 a R M S S h y + 0.286636 a R M S T h y 0.536784 a R M S H z
The results of the multiple linear regression analysis indicated a significant collective effect among a R M S S h x , a R M S T h x , a R M S C h x , a R M S H x , a R M S S h y , a R M S T h y , a R M S C h y , a R M S H y , a R M S S h z , a R M S T h z , a R M S C h z , a R M S H z , and a R M S S y . The coefficient of determination obtained from Equation (5) is R 2 = 0.97. Under these conditions, the F statistic has a value of F(3,16) = 193.96, with a probability of p < 0.001. The software referenced in [47] selects as significant predictors those appearing in structural Equation (5) for the dependent variable a R M S S y (acceleration in the lateral direction relative to the forward direction of the combine, Oy) in working mode. The coefficient of determination indicates that the three predictors selected by the multiple regression analysis explain 97% of the variation in lateral acceleration (Oy) at the OS during working mode.
a R M S S z = 0.0936682 + 2.386383 a R M S S h x 0.241027 a R M S H x 0.397579 a R M S C h y + 0.273108 a R M S S h z + 1.977262 a R M S T h z
The results of the multiple linear regression analysis indicated a significant collective effect among a R M S S h x , a R M S T h x , a R M S C h x , a R M S H x , a R M S S h y , a R M S T h y , a R M S C h y , a R M S H y , a R M S S h z , a R M S T h z , a R M S C h z , a R M S H z , and a R M S S z . The coefficient of determination obtained from Equation (6) is R 2   = 0.98. Under these conditions, the F statistic has a value of F(5,14) = 164.47, with a probability of p < 0.001. The software referenced in [47] selects as significant predictors those appearing in structural Equation (6) for the dependent variable a R M S S z (acceleration in the vertical direction of the combine, Oz, in working mode). The coefficient of determination indicates that the five predictors selected by the multiple regression analysis explain 98% of the variation in vertical acceleration (Oz) at the OS during working mode.
Appendix A.1.2 presents the graphical representations corresponding to Figure A2a–c, which highlight the root mean square (RMS) acceleration components along the three orthogonal directions (X, Y, and Z), recorded for the C110 H combine harvester during active operational mode.

3.1.3. Identification of the Maximum RMS Resultant Acceleration at the Operator’s Seat

Identification of the maximum resultant acceleration values at the OS reveals the frequencies at which the reception of vibrational influences is most intense.
The resultant acceleration at the OS is calculated using the Euclidean norm formula for the RMS acceleration vector:
a R M S S r e z = a R M S S x 2 + a R M S S y 2 + a R M S S z 2
In Equations (1)–(3), the expressions for the RMS acceleration components at the OS are constructed based on the derived regression relationships, where each term on the right-hand side depends on the signal frequency. This dependency directly implies that the RMS value of the total resultant acceleration at the OS is also frequency-dependent.
Therefore, by using the frequency network defined for the experimental recordings, it is possible to graphically represent the spectral variation for each component of the RMS acceleration (Ox, Oy, Oz), as well as for the total resultant acceleration, according to relation (7).
Figure 4 presents the influence map of the vibratory components of the C110H combine harvester on the OS during the working operating mode. This visual representation synthesizes the relative contributions of the vibration-generating sources (the threshing system, straw walkers, header, and chassis) to the measured acceleration values at the OS, along each of the three directions (Ox, Oy, Oz). In working mode, vibration transmission results from both the rotating subsystems and their interaction with crop flow, soil–machine contact, and forward motion, leading to stochastic fluctuations superimposed on deterministic excitations. The triaxial analysis shows that vertical accelerations (Oz) dominate due to structural coupling and soil reaction, while lateral (Oy) and longitudinal (Ox) components are largely influenced by the threshing and separation units. The straw walker remains a critical vibration source, while the header gains importance during crop engagement. The influence map thus provides a realistic diagnostic of vibration propagation, enabling the identification of dominant sources and critical frequency ranges (20–60 Hz) relevant for resonance, and guiding engineering measures such as structural reinforcement, improved balancing, and vibration isolation to reduce operator exposure.
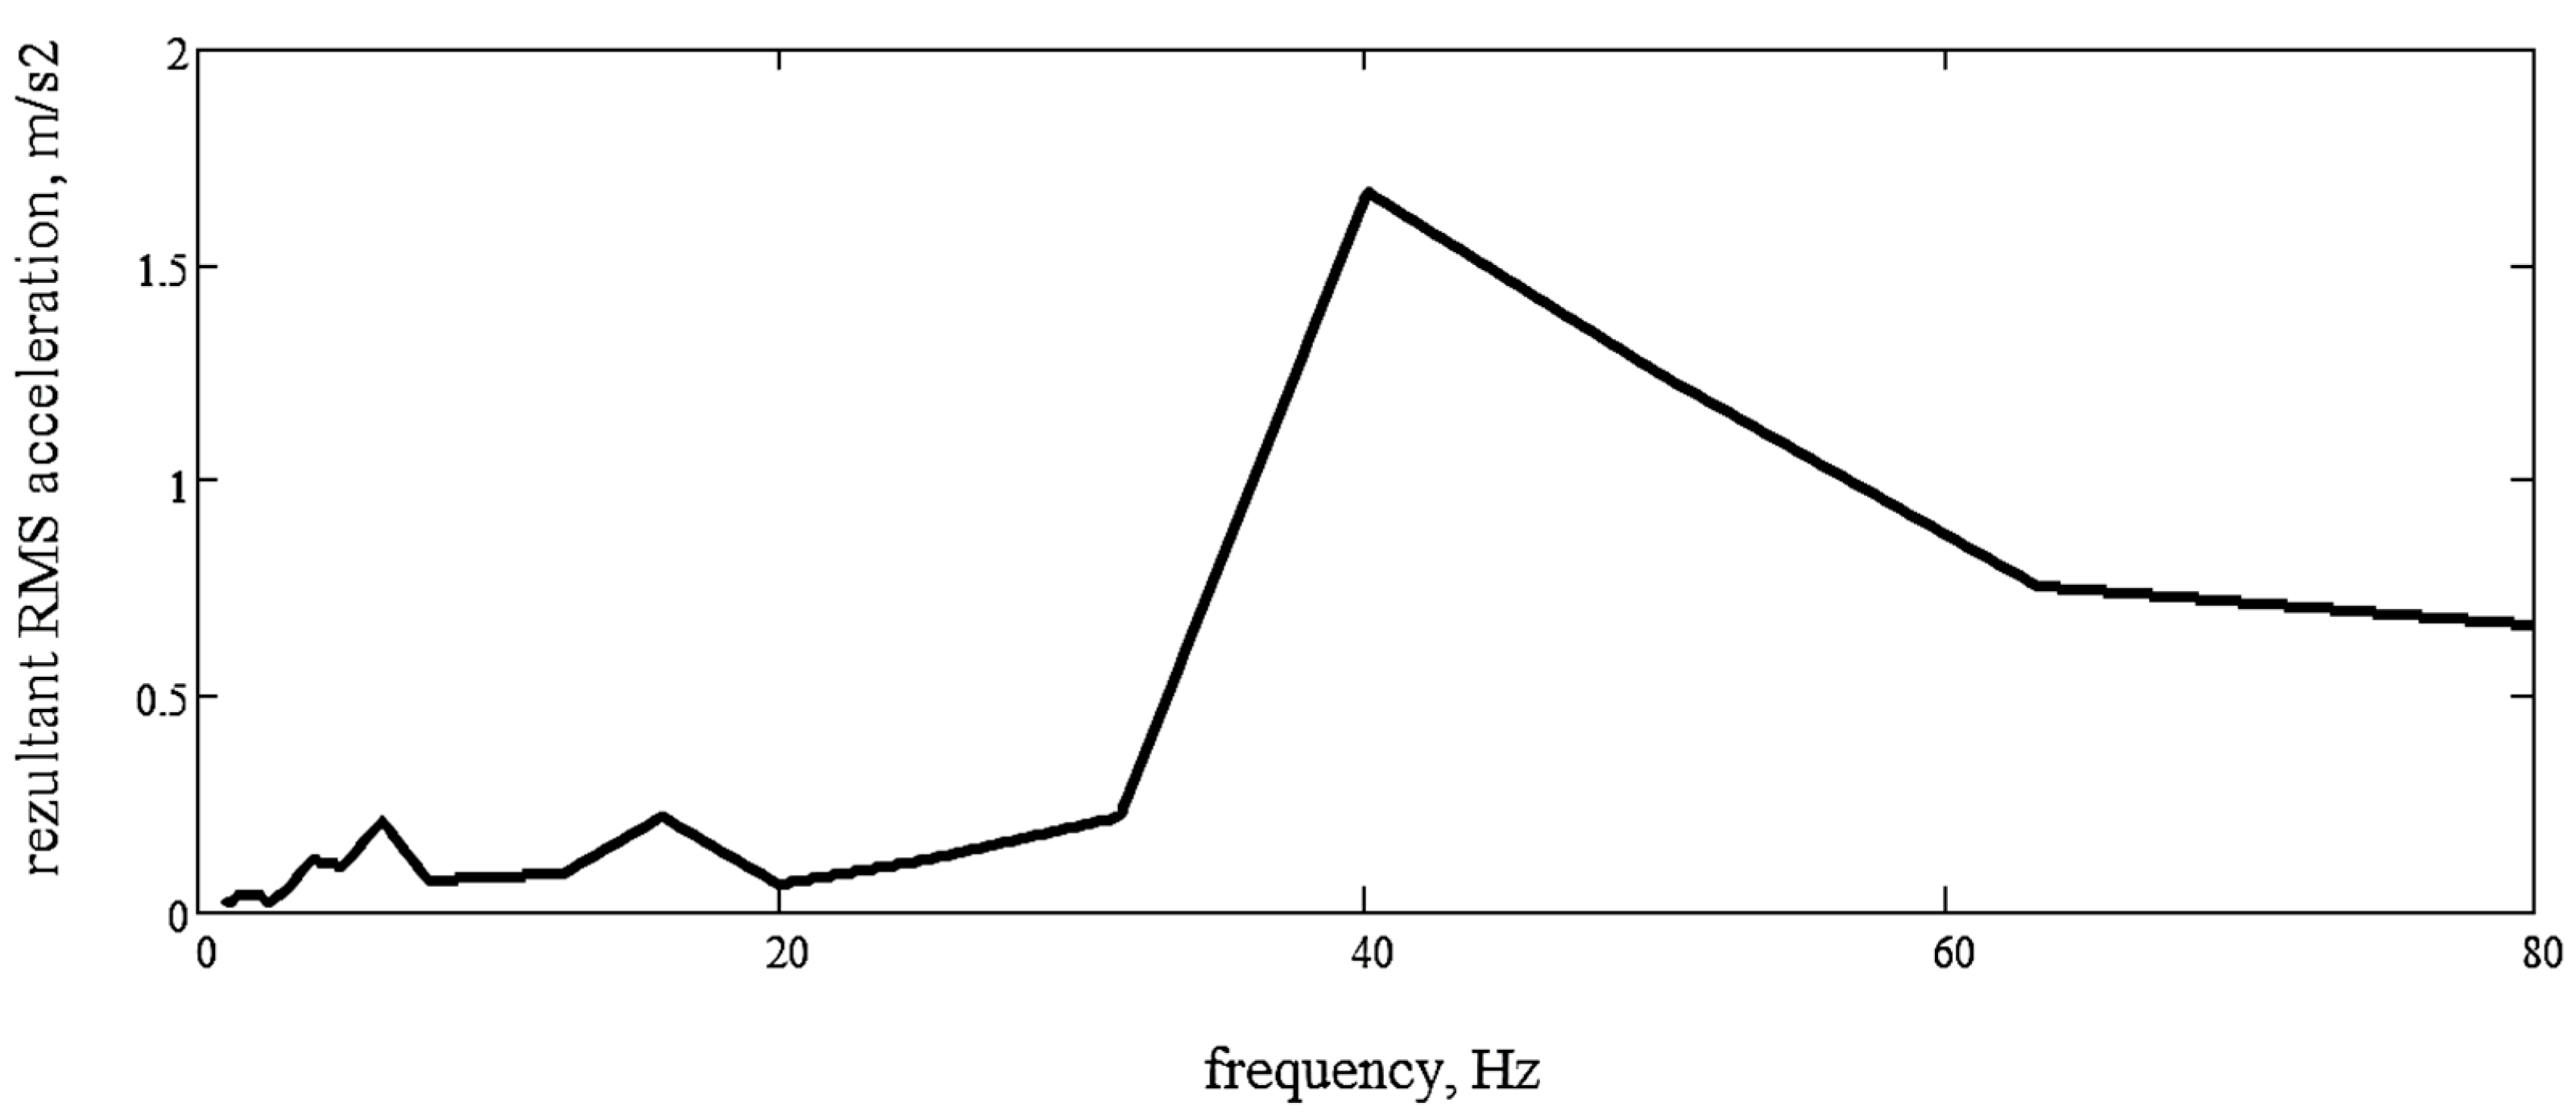
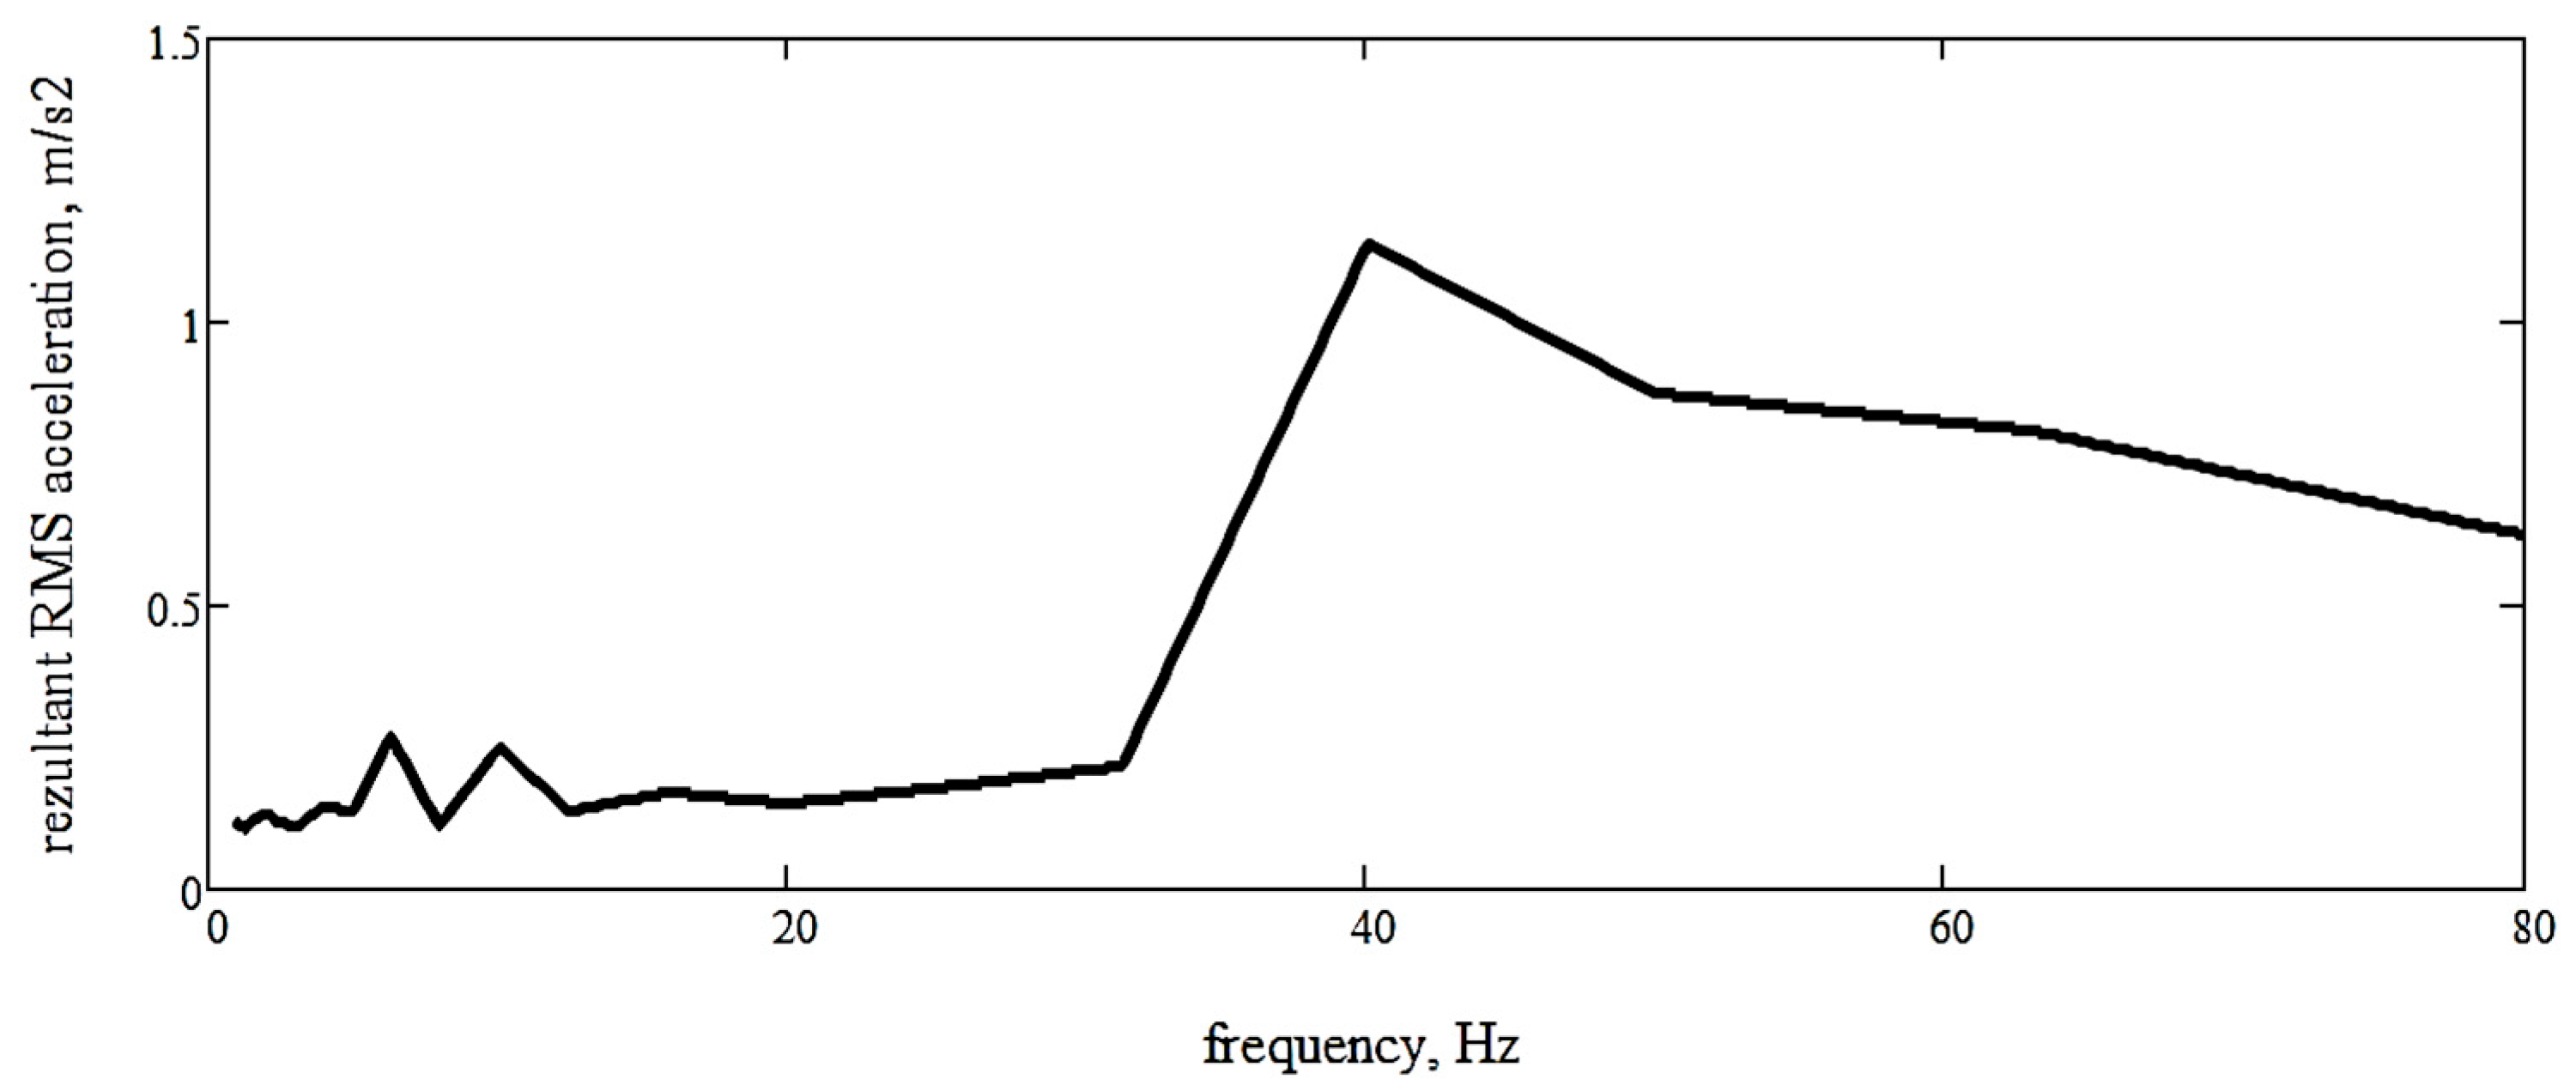
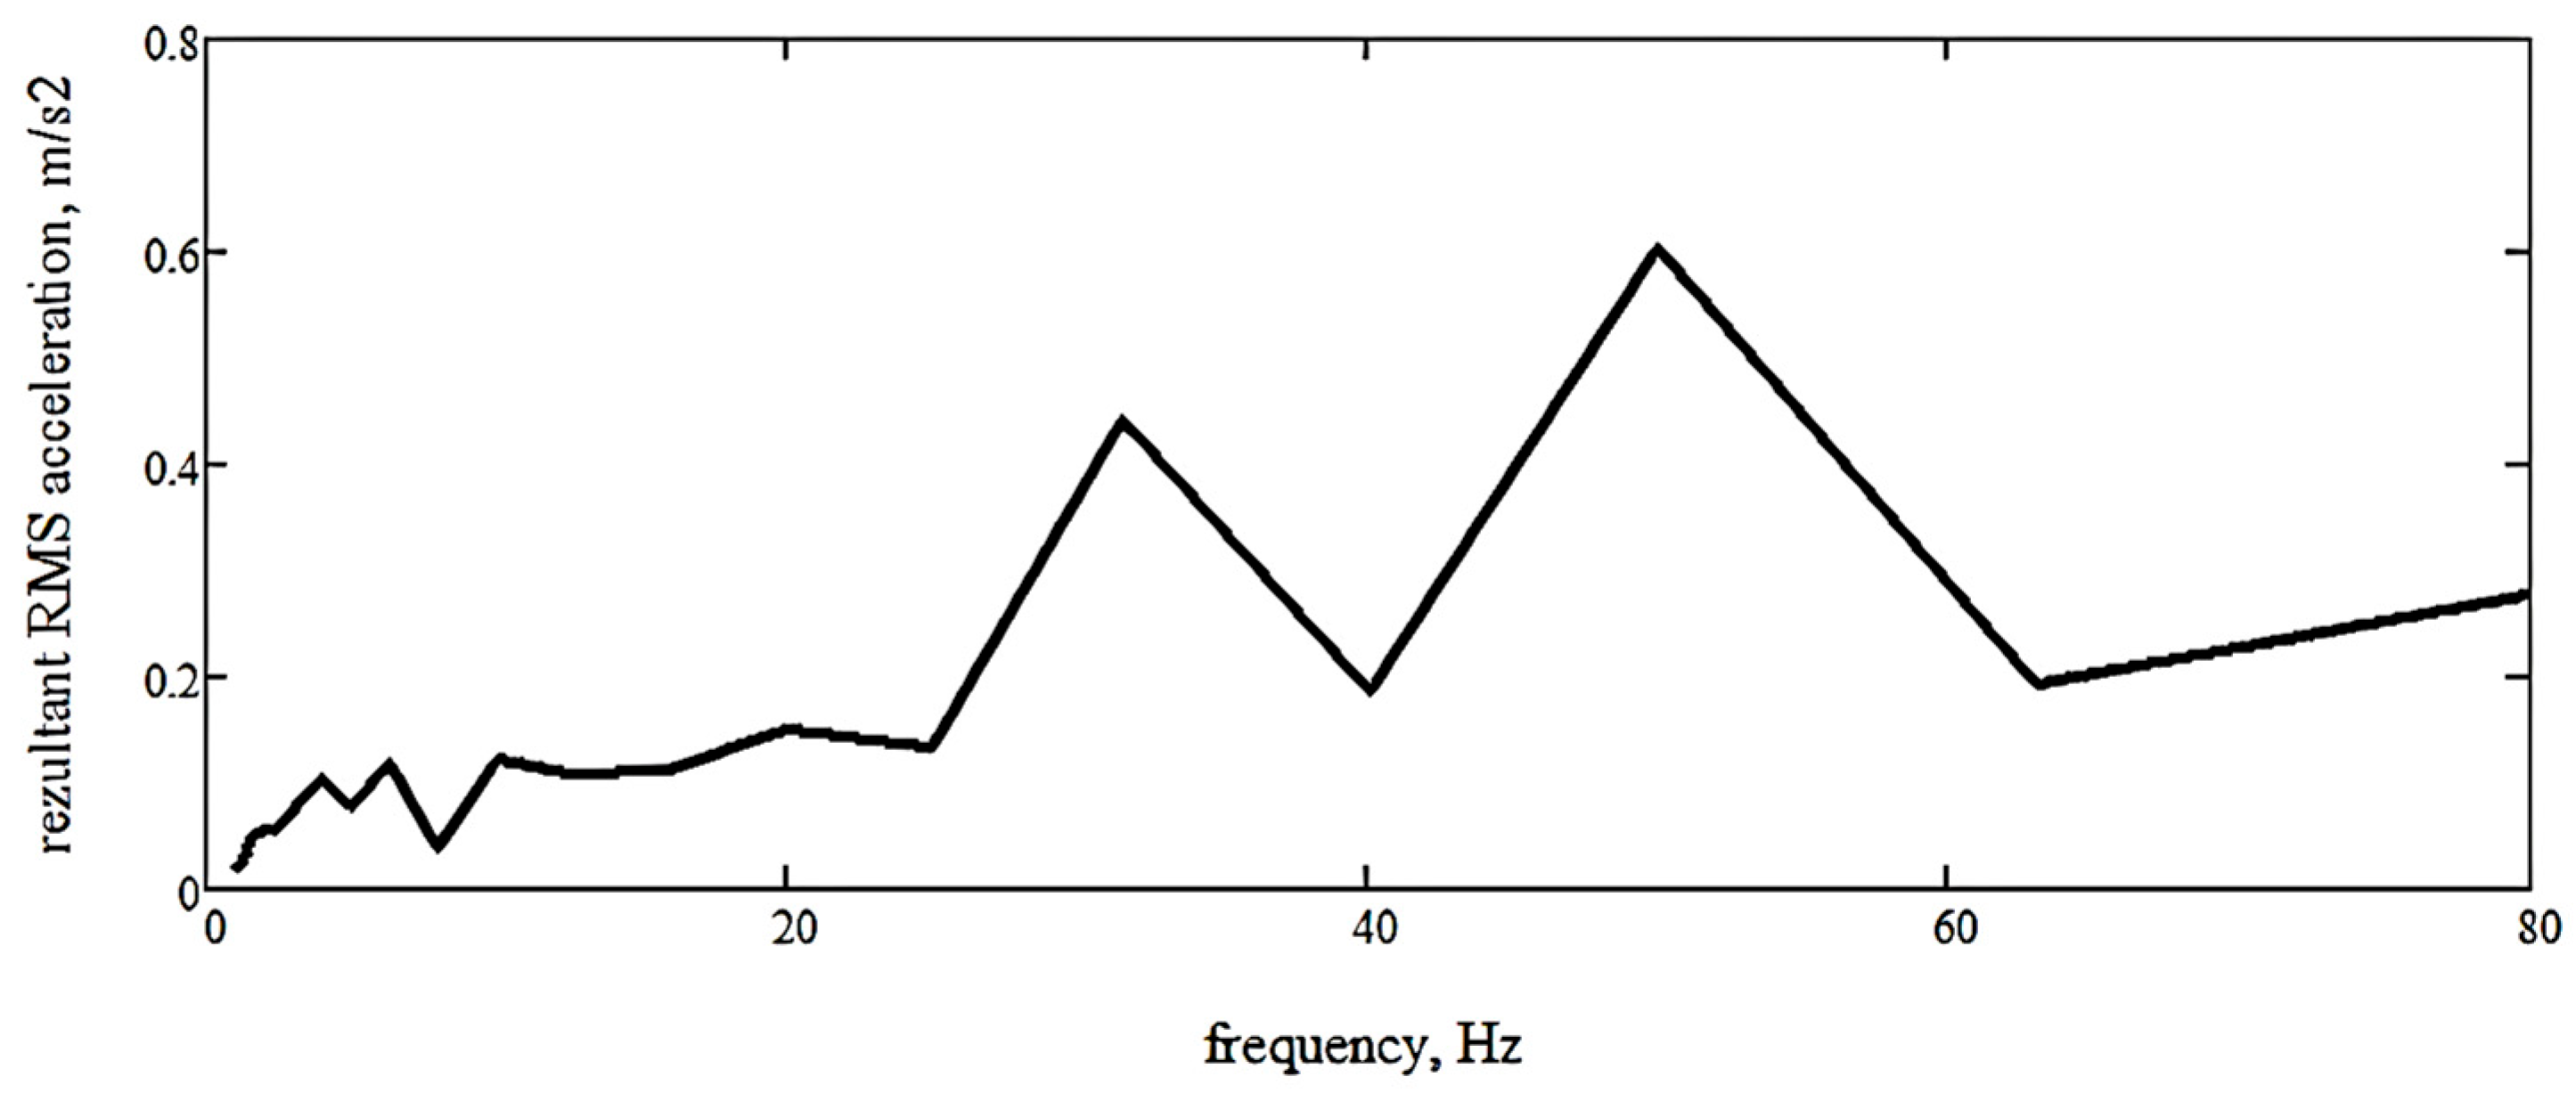
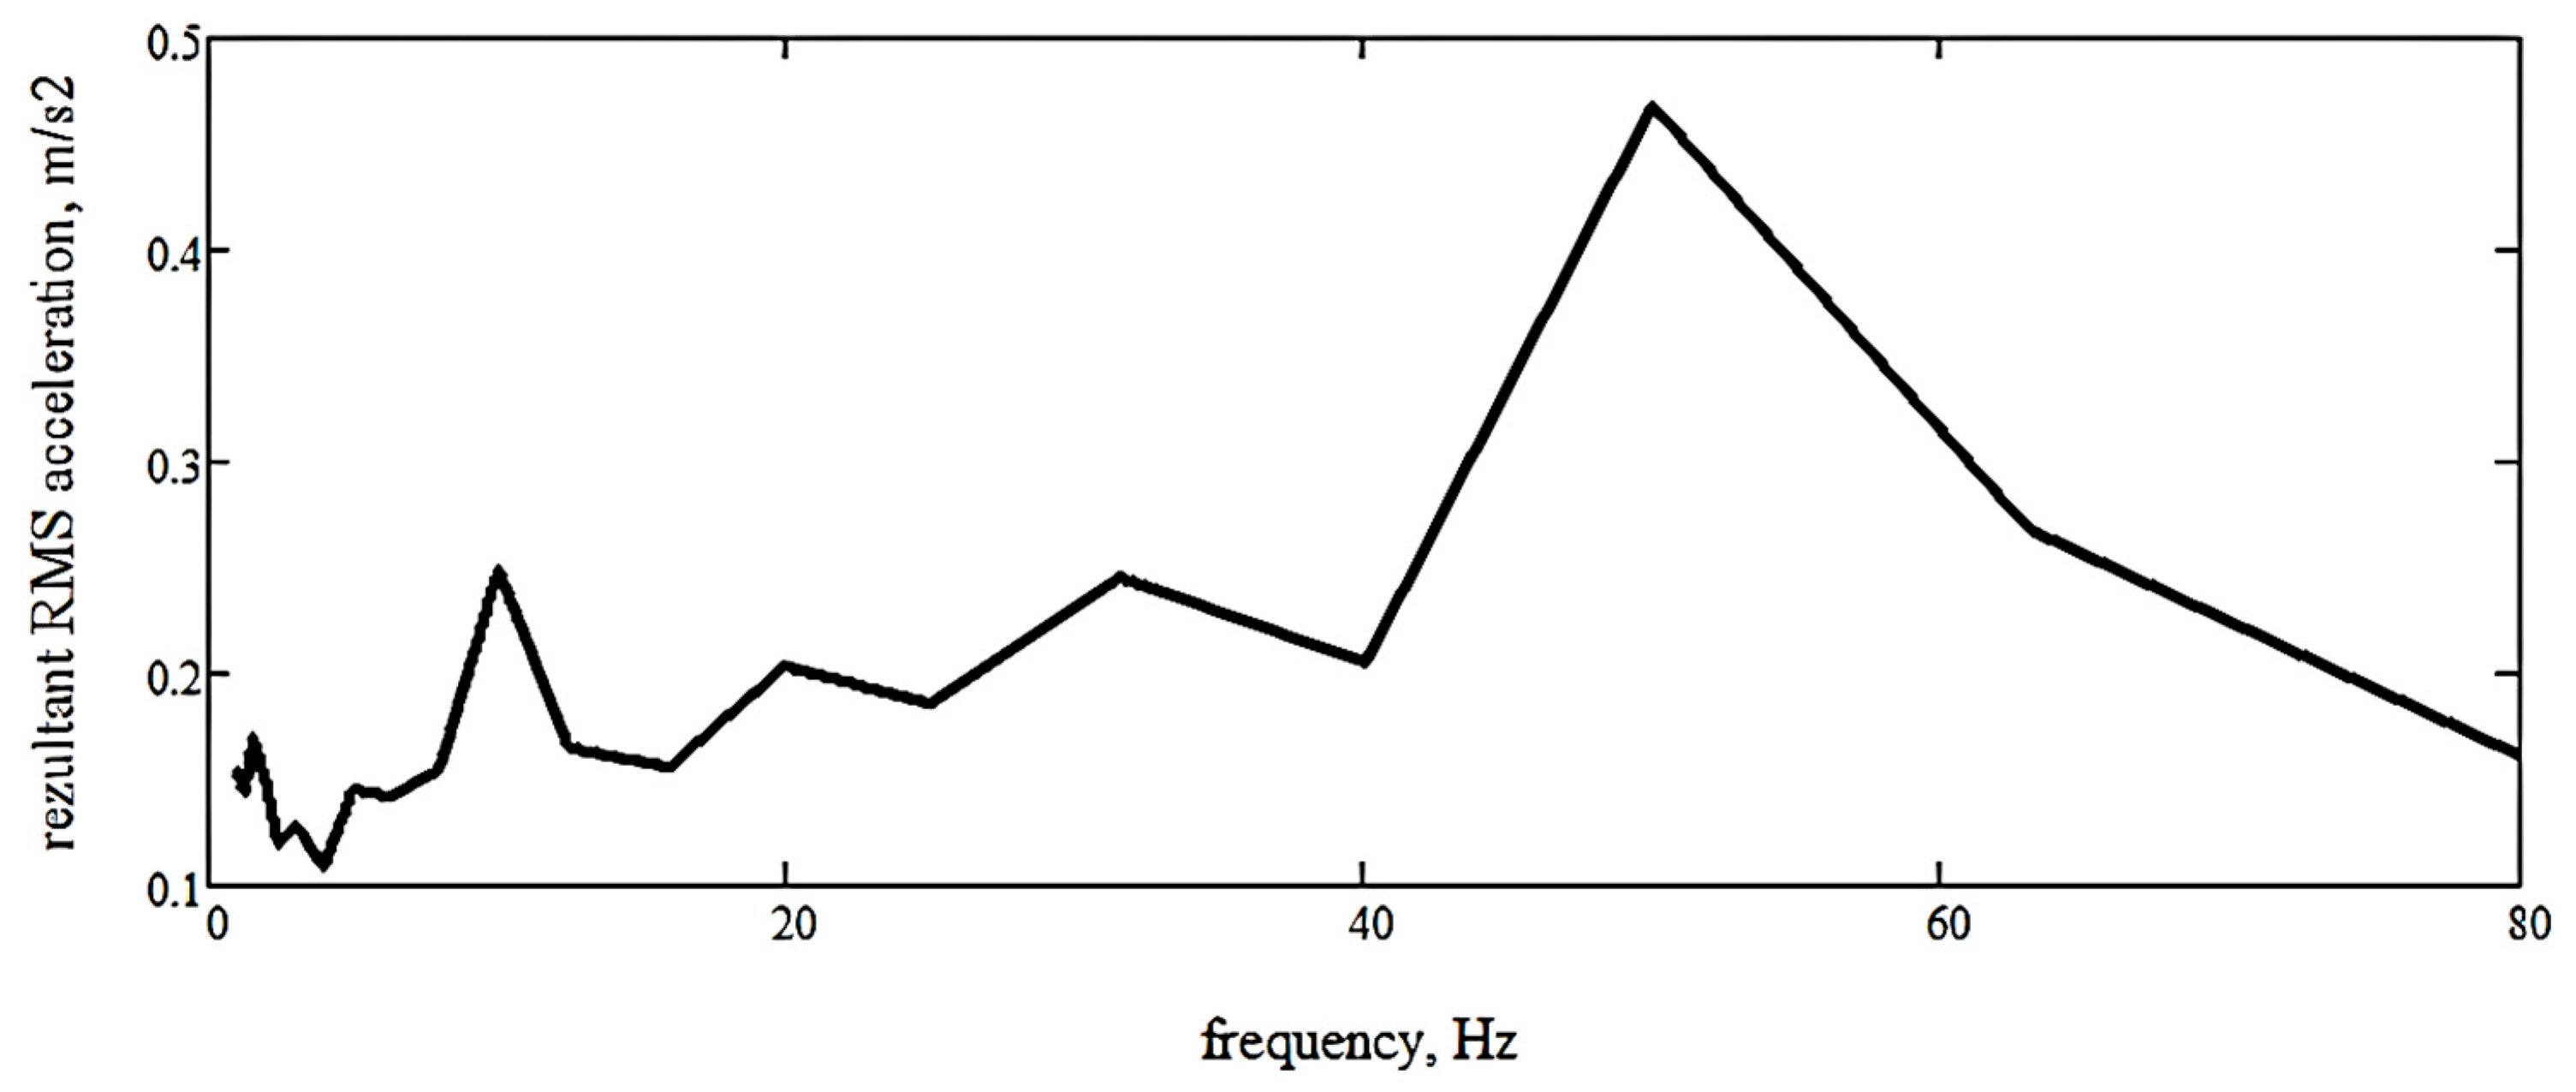
Figure 5 highlights the intensity peaks and the dominant excitation zones as a function of frequency. The frequency spectrum analysis of the resultant acceleration recorded at the OS indicates that the dominant vibration range lies between 20 and 60 Hz, with a pronounced peak around 40 Hz, an aspect also confirmed in the specialized literature, for example in [51]. This spectral distribution remains consistent across both operating modes analyzed: stationary (Figure 5) and working (Figure 6).
It is also observed that the maximum value of the total RMS acceleration is approximately 46% higher in stationary mode compared to the working operating mode. This phenomenon can be interpreted as a damping effect of the vibrations generated by the structural components of the machine when transitioning from idle operation to operation under load. Thus, entering the actual working mode leads to a partial dissipation of vibrational energy through contact with the ground, the crop mass, and other functional factors (travel speed, soil conditions, combine adjustment parameters) specific to the adopted experimental setup.

3.2. CASE IH Combine

In the case of the CASE IH combine, which operates based on the axial-flow principle, acceleration measurements were conducted for only four components: the threshing system, chassis, header, and operator’s seat.
Unlike the conventional C110H combine, this design type is not equipped with a straw walker, a component found only in combines with a conventional separation system.

3.2.1. Case of Stationary Operating Mode

For the CASE IH combine, under stationary operating conditions, multiple regression analysis was performed using the same methodology and statistical computation platform previously mentioned, Stats Kingdom [47]. By applying this approach to the experimental data obtained, regression Equations (8)–(10) were generated, describing the linear relationships between the RMS components of the acceleration measured at the OS and the corresponding accelerations of the three vibration-generating sources: the threshing system, chassis, and header.
A R M S S x = 0.0132446 2.270205 a R M S T h x + 1.345614 a R M S H x + 1.221719 a R M S C h z
The results of the multiple linear regression analysis indicated a significant collective effect among a R M S T h x , a R M S C h x , a R M S H x , a R M S T h y , a R M S C h y , a R M S H y , a R M S T h z , a R M S C h z , a R M S H z , and a R M S S x . The coefficient of determination obtained using Equation (8) is R2 = 0.98. The F-statistic value F(3,16) = 248.37 and the associated p-value (p < 0.001) indicate that the model is statistically significant and the predictor coefficients are reliable. The program from source [47] selects as significant predictors those included in the structural Equation (8) for the dependent variable a R M S S x (acceleration along the combine’s forward direction, Ox).
The coefficient of determination shows that the three predictors selected through multiple regression analysis explain 98% of the longitudinal acceleration (Ox) variation at the OS under stationary operating conditions.
For the lateral component of the RMS acceleration at the OS under stationary operating conditions, regression (9) is obtained according to [47]:
a R M S S y = 0.00976259 1.945658 a R M S T h x + 3.996885 a R M S C h x 0.116424 a R M S T h y + 0.343817 a R M S T h z
The results of the multiple linear regression analysis indicated a significant collective effect among the independent variables a R M S T h x , a R M S C h x , a R M S H x , a R M S T h y , a R M S C h y , a R M S H y , a R M S T h z , a R M S C h z , a R M S H z , and the dependent variable a R M S S y . The coefficient of determination obtained from Equation (9) is R2 = 0.69. Under these conditions, the F-statistic value is F(4,15) = 8.53, with a probability of p < 0.001. The program from [47] selects as significant predictors those appearing in the structural Equation (9) for the dependent variable a R M S S y (acceleration in the lateral direction relative to the combine’s forward direction, Oy). The coefficient of determination shows that the four predictors selected by the multiple regression analysis explain 69% of the variation in lateral acceleration (Oy) at the OS under stationary conditions.
For the RMS acceleration component along the Oz axis of the OS in stationary mode, Ref. [47] provides structural Equation (10):
a R M S S z = 0.0378521 2.421584 a R M S T h x + 1.910592 a R M S H x 0.297716 a R M S C h y + 0.812542 a R M S H y + 0.186563 a R M S T h z + 1.245875 a R M S C h z 0.600474 a R M S H z
The results of the multiple linear regression analysis indicated a significant collective effect among a R M S T h x , a R M S C h x , a R M S H x , a R M S T h y , a R M S C h y , a R M S H y , a R M S T h z , a R M S C h z , a R M S H z , and a R M S S z . The coefficient of determination obtained from Equation (10) is R2 = 0.99.
Under these conditions, the F-statistic value is F(7,12) = 150.51, with a probability of p < 0.001. The program from source [47] selects as significant predictors those included in the structural Equation (10) for the dependent variable a R M S S z (acceleration in the vertical direction of the combine, Oz). The coefficient of determination shows that the five predictors selected by the multiple regression analysis explain 99% of the variation in vertical acceleration (Oz) at the OS under stationary operating conditions.
Appendix A.1.3 presents the graphical representations corresponding to Figure A3a–c, which illustrate the root mean square (RMS) acceleration components along the three orthogonal axes (X, Y, and Z), recorded for the CASE IH combine harvester under stationary operating conditions.
Figure 7 presents the influence map of the vibratory components of the CASE IH combine on the OS under stationary operating conditions. This graphical representation integrates the regression-derived coefficients to highlight the relative contributions of the threshing system, chassis, and header to the triaxial RMS accelerations (Ox, Oy, Oz) recorded at the operator’s seat. In stationary mode, vibrations are mainly generated by inertial unbalances of rotating assemblies and structural interactions, in the absence of crop load and forward motion. The influence map in Figure 7 quantifies how each subsystem transmits vibrational energy to the operator’s seat, serving as a baseline for comparison with working conditions. Vertical accelerations (Oz) dominate due to structural coupling, while the threshing mechanism and chassis contribute significantly to the longitudinal (Ox) and lateral (Oy) components. From an ergonomic perspective, such maps are essential for identifying dominant transmission paths and resonance-prone frequency bands (20–60 Hz), thus supporting targeted design optimizations—such as isolation systems, structural reinforcements, and improved balancing—aimed at reducing operator whole-body vibration.

3.2.2. Case of Working Operating Mode

For the working operating mode of the CASE IH combine, multiple regression analysis performed using the Stats Kingdom platform [47] allowed the determination of dependency relationships between the RMS values of accelerations measured at the operator’s seat and the corresponding RMS values of accelerations recorded at the vibration-generating components. These relationships are formally expressed in Equations (11)–(13), corresponding to the three directions of analysis: longitudinal (Ox), lateral (Oy), and vertical (Oz).
a R M S S x = 0.00331524 + 1.527482 a R M S H x + 0.45565 a R M S C h y + 0.604215 a R M S H y 1.007575 a R M S T h z
The results of the multiple linear regression indicated a significant collective effect among a R M S T h x , a R M S C h x , a R M S H x , a R M S T h y , a R M S C h y , a R M S H y , a R M S T h z , a R M S C h z , a R M S H z , and a R M S S x . The coefficient of determination obtained from Equation (11) is R2 = 0.85. Under these conditions, the F-statistic value is F(4,15) = 20.78, with a probability of p < 0.001. The program from [47] selects as significant predictors those included in structural Equation (11) for the dependent variable a R M S S x (acceleration in the forward direction of the combine, Ox). The coefficient of determination shows that the four predictors selected by the multiple regression analysis explain 85% of the variation in longitudinal acceleration (Ox) at the operator’s seat under working (harvesting) conditions.
For the lateral component of the RMS acceleration at the OS, the program from [47] provides the structural model given by Equation (12):
a R M S S y = 0.179218 1.896722 a R M S H x + 0.173787 a R M S T h y
The results of the multiple linear regression analysis indicated a significant collective effect among a R M S T h x , a R M S C h x , a R M S H x , a R M S T h y , a R M S C h y , a R M S H y , a R M S T h z , a R M S C h z , a R M S H z , and a R M S S y . The coefficient of determination obtained from Equation (12) is R2 = 0.31. Under these conditions, the F-statistic value is F(2,17) = 3.82, with a probability of p < 0.001. The program from [47] selects as significant predictors those included in structural Equation (12) for the dependent variable a R M S S y (acceleration in the lateral direction relative to the combine’s forward direction, Oy), under working operating conditions. The coefficient of determination shows that the three predictors selected by the multiple regression analysis explain 31% of the variation in lateral acceleration (Oy) at the OS under working conditions.
For the vertical component of the RMS acceleration at the OS, the program from [41] provides the structural model given by Equation (13):
a R M S S z = 0.068286 + 1.16962 4 a R M S H x + 0.394019 a R M S H y 0.264484 a R M S T h z
The results of the multiple linear regression analysis indicated a significant collective effect among a R M S T h x , a R M S C h x , a R M S H x , a R M S T h y , a R M S C h y , a R M S H y , a R M S T h z , a R M S C h z , a R M S H z , and a R M S S z . The coefficient of determination obtained from Equation (13) is R2 = 0.58. Under these conditions, the F-statistic value is F(3,16) = 7.42, with a probability of p < 0.001. The program from [47] selects as significant predictors those included in structural Equation (13) for the dependent variable a R M S S z (acceleration in the vertical direction of the combine, Oz, under working operating conditions).
The coefficient of determination shows that the three predictors selected by the multiple regression analysis explain 58% of the variation in vertical acceleration (Oz) at the OS under working conditions.
Appendix A.1.4 presents the graphical representations corresponding to Figure A4a–c, which highlight the root mean square (RMS) acceleration components along the three orthogonal directions (X, Y, and Z), recorded for the CASE IH combine harvester during active operational conditions.

3.2.3. Identification of the Maximum Resultant Accelerations at the Operator’s Seat

In this subsection, the calculations and graphical representations previously performed for the C110H combine are revisited, now applied to the dataset obtained from the CASE IH combine. Considering the methodological similarity, the generalities presented in Section 3.1.3 are not repeated here. In Figure 8, the Influence map of the vibratory components of the CASE IH combine on the operator’s seat during working operating mode is described and presented. The graphical representation of the RMS of the resultant acceleration at the operator’s seat under stationary operating conditions is illustrated in Figure 9. For the working operating mode, the same representation is shown in Figure 10.
The frequency spectrum analysis of the resultant acceleration at the operator’s seat of the CASE IH combine highlights that the dominant vibration range lies between 20 and 60 Hz, similar to the observations made for the C110H combine. According to [51], within this range there are two to three local maxima, located around 20 Hz, 31.5 Hz, and 50 Hz, applicable for both operating modes: stationary (Figure 9) and working (Figure 10).
Furthermore, the maximum value of the total RMS acceleration in stationary mode is approximately 46% higher than in working mode. This result can be attributed to the natural damping effect that occurs when the combine is operating effectively in the field. In this situation, the pure vibrations generated by the internal components are partially dissipated through interaction with the crop mass, the ground surface, and the operational parameters of the machine (speed, settings, soil conditions, etc.).

4. Possibilities for Ranking the Influences of the Combine’s Vibratory Components on the Operator’s Seat

In many studies from the specialized literature dedicated to vibration analysis, the RMS value is interpreted as an indirect measure of the energy transmitted from the vibration source (emitter) to the mechanical receptor, such as the operator of the agricultural machinery. Such approaches are mentioned, for example, in [52,53], where the RMS is associated with the energetic content of the vibrational signal. Building on these interpretations, this study introduces a complementary perspective in which the influence of each vibratory component of the combine on the operator’s seat is interpreted in terms of the mechanical energy transmitted to the operator’s body, derived from RMS acceleration values. This energetic interpretation allows the regression-derived influence coefficients to be understood as an energy-based ranking, expressing either the absolute energy transmitted or a mass-specific energy density, thus providing a more intuitive and ergonomically relevant evaluation of vibration exposure. By extension, the hierarchy of influences resulting from the regression analysis can also be considered an energetic ranking, expressing either the absolute level of energy transmitted or a mass-specific density of the mechanical energy applied to the operator’s body.
From this perspective, in this section, we developed a method to rank the contributions of the RMS values of accelerations recorded at the vibration-generating sources (threshing system, header, chassis, etc.) on each component (Ox, Oy, Oz) of the acceleration measured at the operator’s seat (OS). This ranking allows for a better mechanical understanding of vibration transmission as well as a foundation for technical decisions aimed at optimizing operator comfort. Based on the expressions obtained from the structural multiple linear regression models presented in Section 3.1 and Section 3.2, each contribution of the vibration-generating components to the RMS acceleration measured at the OS is quantified by an influence coefficient included in the structural equations. These Equations, (1)–(3), (4)–(6), (8)–(10) and (11)–(13), describe the RMS acceleration at the OS as a function of the RMS components of the respective sources’ accelerations.
According to the data presented in [44], each component of the RMS accelerations of the sources varies as a function of frequency.
This property allows the regression relationships to be expressed in a form dependent on a single variable, namely frequency, which facilitates a complete and interpretable graphical representation of the vibration transmission phenomenon.
Thus, both the RMS values of the source components and the RMS acceleration at the OS can be graphically represented as functions of frequency. By plotting the expressions derived from the structural models, representations are obtained that highlight the dominant components and their respective dominance ranges within the frequency spectrum. On the same graph, the evolution of the individual components alongside the total RMS at the OS can be visualized, allowing for a relevant visual comparison. Table 2 summarizes the static values of the coefficient of determination (R2) obtained from the regression equations for each relationship, allowing the assessment of the model’s explanatory power for both combines.
As a first validation criterion of the model, the positivity of the RMS values was verified for all considered frequencies, an observation confirmed for all analyzed signals. Following these procedures, the results summarized in Table 3 were obtained, which underpin the ranking and energetic interpretation of the influences transmitted to the operator.
An immediate and consistent observation, highlighted by the regression analysis and the corresponding graphical representations, is that the straw walker constitutes the main source of vibrations transmitted to the OS in the case of the C110H combine. This finding is supported by the dominant coefficients in the regression expressions as well as by the obtained spectra.
Furthermore, throughout all the calculations and graphical representations performed to obtain the results in Section 4, it is once again confirmed, consistent with the observations from Section 3.1.3 and Section 3.2.3, that all expressions derived from the structural models for the RMS components of acceleration at the operator’s seat are strictly positive, an essential aspect for the mathematical and physical validation of the model. This internal consistency of the solutions confirms the coherence of the assumptions underlying the adopted multivariate linear model.

5. Discussion

The regression analysis applied to the experimental data collected from the C110H and CASE IH combines allowed for the precise identification of the dominant sources of vibrations affecting the operator’s seat across each of the RMS acceleration components. The evaluation was conducted separately for the two operating modes analyzed: stationary and working.
Based on the structural equations obtained through multiple linear regression, considered as statistical models of vibrational transmission between the mechanical components of the machinery, a ranking of the contribution of each source to each acceleration component at the OS was performed.
These models, expressed by relations (1)–(3), (4)–(6), (8)–(10), and (11)–(13), were utilized in the form of influence maps presented in Figure 1, Figure 2, Figure 5 and Figure 6.
However, the obtained formulas may raise questions regarding the mathematical consistency of the models, especially in cases where the coefficients of certain terms are negative. Since RMS is by definition a positive quantity, the presence of these terms might suggest an apparent inconsistency. Nevertheless, the verifications carried out in Section 3.1.3, and Section 4 confirm that the results obtained are valid, with the estimated RMS values being positive for all analyzed frequencies.
From a physical standpoint, terms with negative coefficients can be interpreted as phase opposition effects between vibrational signals originating from different sources. Thus, these negative contributions may reflect a phenomenon of “phase damping,” where interferences among sources reduce the net vibration intensity perceived at the OS, without compromising the overall validity of the model.
The information obtained through regression analysis and organized in Table 2 clearly highlights the main sources of vibrations in the case of the two analyzed combines (C110H and CASE IH), allowing for the classification of the intensity of their influence on the OS.
The results not only indicate the dominant sources but also provide practical guidance regarding possible measures for isolation or reconfiguration of their mounting on the chassis, aimed at reducing vibration transmission.
For both types of combines, critical frequency ranges (20–60 Hz) were identified, within which the vibration intensity is significantly increased, including the occurrence of peak values.
Although our research focused on the effects on the (OS, the specialized literature reveals that within this frequency range are the natural frequencies of certain structural components of the combine, such as: bending of the fuel tank support beam (24.09 Hz, 35.75 Hz), torsion of the cabin frame (28.11 Hz, 39.11 Hz), bending of the threshing frame (43.07 Hz), and bending at the front part of the chassis (50.78 Hz).
According to [54], these structural frequencies can resonate with the internal excitation sources of the machinery, thereby amplifying the vibrations transmitted to the operator. The distribution of vibration frequencies at various points of a combine is presented in [51], confirming the frequency range for which the maximum RMS acceleration values at the OS were recorded, as obtained from the regression analysis in the present study. Additionally, a series of vibration-generating sources in cereal harvesting combines are listed in [55], which show that, at certain rotational speeds, the engine develops a characteristic frequency of approximately 90 Hz, the gearbox 50 Hz, and the countershaft 23.75 Hz, all within the critical range identified in our study (20–60 Hz). Study [56] complements this picture by providing additional data about vibration sources emitting in the lower part of the spectrum, frequencies which also appear in measurements performed on the C110H and CASE IH combines.
Consequently, the frequencies identified in this study agree with the specialized literature, reinforcing the validity of the conclusions obtained, especially in the context of applying statistical regression methods which, to our knowledge, have not been previously used in this form for the vibration analysis of combines.
In line with previous research on structural dynamics and vibration propagation in agricultural machinery, it is important to consider that the transmission of vibrational energy to the operator’s seat may be influenced by modal behavior and internal wave interference within the chassis and supporting frame. Modal analysis enables the identification of the natural frequencies and mode shapes of these structures, which may resonate with excitation frequencies from the engine, threshing system, or drivetrain. When such resonance conditions are met, even low-level excitations can lead to amplified seat vibrations.
Moreover, wave interference phenomena—particularly the superposition of waves traveling through multiple mechanical paths—can cause constructive or destructive interference, depending on the phase relationships. These phenomena may partially explain localized amplification or damping effects observed in the measured triaxial accelerations. Similar interpretations have been reported in [36,37,40], where modal interactions were shown to significantly affect the dynamic response of mobile machinery cabins.

6. Conclusions

The main conclusions of the statistical research based on the experimental data obtained from measuring the vibrations of the components of the C110H and CASE IH combines concern the influence of vibration sources on the OS. Four structural statistical models were developed, corresponding to the two types of combines, each analyzed under both stationary and working operating modes. These models, expressed through Equations (1)–(3), (4)–(6), (8)–(10) and (11)–(13), identify the vibration sources and directional components of the accelerations that exert significant influence on the vibrations perceived at the OS, according to the regression analysis results. The influence maps (Figure 1, Figure 2, Figure 5 and Figure 6) allow visualization of the impact of each source on each acceleration component. The influence ranking Table 3) highlights that, for the C110H combine, the straw walker is the component with the strongest vibrational contribution to the OS, while for the CASE IH combine, the header plays the dominant role, followed by the threshing system and chassis.
This study introduced a comprehensive multivariate regression modeling approach to evaluate vibration transmission to the operator’s seat in two types of combine harvesters (C110H and CASE IH). The analysis demonstrated that regression modeling provides a robust quantitative framework for ranking the contribution of individual components, such as the straw walker, header, and threshing system, to the overall whole-body vibration experienced by the operator. Unlike traditional methods, such as coherence or spectral analysis, which primarily focus on correlation strength in the frequency domain, this approach delivers numerical influence coefficients and predictive models that are applicable across both stationary and operational modes. Results also highlight a measurable vibration attenuation effect of approximately 46% in working conditions due to crop–soil interaction, offering valuable insight into machine–environment dynamics. Beyond validating the utility of regression modeling in agricultural vibration studies, this work establishes a methodological foundation for future research, including the integration of nonlinear modeling approaches, exploration of interaction effects, and coupling with modal and finite element simulations to strengthen structural interpretation. In future applied research, we will focus on expanding the experimental dataset to include additional machine components (e.g., engine, cabin, and grain tank) to further refine predictive modeling accuracy; investigating nonlinear regression models and interaction effects to capture more complex vibration dynamics; integrating regression modeling with modal and finite element simulations to validate experimental findings and strengthen structural analysis; developing real-time monitoring and diagnostic systems based on regression outputs to detect mechanical faults and optimize maintenance schedules; conducting comparative studies to benchmark this regression-based framework against traditional methods such as coherence and spectral analysis across different harvester platforms; exploring ergonomic interventions and design optimization strategies to minimize operator whole-body vibration exposure and improve occupational health outcomes.
Overall, this study contributes a novel, data-driven methodology to vibration ergonomics in agriculture, providing actionable insights for ergonomic design improvements, preventive maintenance planning, and enhanced operator health protection.

Author Contributions

Conceptualization, Conceptualization, P.C., N.-V.V., S.-Ș.B., T.-A.O., N.U., A.Z.A., F.N., G.M., S.B., L.-D.P., G.-C.T., O.-E.M., Ș.D., A.-M.T., N.V., M.C., C.R. and S.I.; methodology, P.C., N.-V.V., S.-Ș.B., T.-A.O., N.U., A.Z.A., F.N., G.M., S.B., L.-D.P., G.-C.T., O.-E.M., Ș.D., A.-M.T., N.V., M.C., C.R. and S.I.; software, P.C., S.-Ș.B., F.N., S.B., T.-A.O. and N.-V.V.; validation, T.-A.O., N.-V.V., A.Z.A., G.M., L.-D.P., G.-C.T., A.-M.T., M.C., S.I., F.N. and P.C.; formal analysis, P.C., N.-V.V., S.-Ș.B., T.-A.O., F.N., N.U., A.Z.A., G.M., S.B., L.-D.P. and G.-C.T.; investigation, P.C., N.-V.V., S.-Ș.B., T.-A.O., N.U., A.Z.A., F.N., G.M., S.B., L.-D.P., G.-C.T., O.-E.M., Ș.D., A.-M.T., N.V., M.C., C.R. and S.I.; resources, O.-E.M., L.-D.P., A.-M.T., C.R., Ș.D., M.C., N.V. and S.I.; data curation, P.C., N.-V.V., S.-Ș.B., T.-A.O., A.-M.T.; O.-E.M., Ș.D., N.V., M.C., C.R., S.I. and S.B.; writing—original draft preparation, P.C., N.-V.V., S.-Ș.B., T.-A.O., N.U., F.N., G.M., S.B., L.-D.P. and G.-C.T.; writing—review and editing, P.C., N.-V.V., S.-Ș.B., T.-A.O., N.U., A.-M.T., N.V., A.Z.A., F.N., S.B., L.-D.P., G.-C.T. and S.I.; visualization, P.C., N.-V.V., S.-Ș.B., T.-A.O., N.U., A.Z.A., F.N., G.M., S.B., L.-D.P., G.-C.T., O.-E.M., Ș.D., A.-M.T., N.V., M.C., C.R. and S.I.; supervision, P.C., N.-V.V., S.-Ș.B., T.-A.O., N.U., A.Z.A., F.N., G.M., S.B., L.-D.P., G.-C.T., O.-E.M., Ș.D., A.-M.T., N.V., M.C., C.R. and S.I.; project administration, P.C., N.-V.V., S.-Ș.B. and T.-A.O.; funding acquisition, S.-Ș.B. All authors have read and agreed to the published version of the manuscript.

Funding

The APC was funded by the National University of Science and Technology Politehnica Bucharest, Romania, within the Pub Art Program.

Institutional Review Board Statement

Not applicable.

Informed Consent Statement

Not applicable.

Data Availability Statement

The original contributions presented in this study are included in the article. Further inquiries can be directed to the corresponding authors.

Acknowledgments

This paper was supported by National Authority for Researches, the NUCLEU Program, Contract 9N/01.01.2023, Project PN 23 04 02 05 “Innovative technology for the superior use of inflorescences and seeds of medicinal plants” and European Union—Next Generation EU, through the National Recovery and Resilience Plan of the Republic of Bulgaria, project № BG-RRP-2.013-0001.

Conflicts of Interest

The authors declare no conflicts of interest.

Appendix A

Appendix A.1. Ranking of Vibration Intensity at the Operator’s Seat

The three RMS acceleration components acting on the OS, corresponding to the three directions of the absolute reference system, can be graphically represented together with all source components influencing each respective direction. This representation is made possible by the frequency dependence of each component, according to the spectral distributions described in [44]. Accordingly, this appendix illustrates, for each of the two analyzed combines, the spectral curves corresponding to the RMS acceleration components at the O for both stationary and working operating modes.

Appendix A.1.1. C110H Combine in Stationary Operating Mode
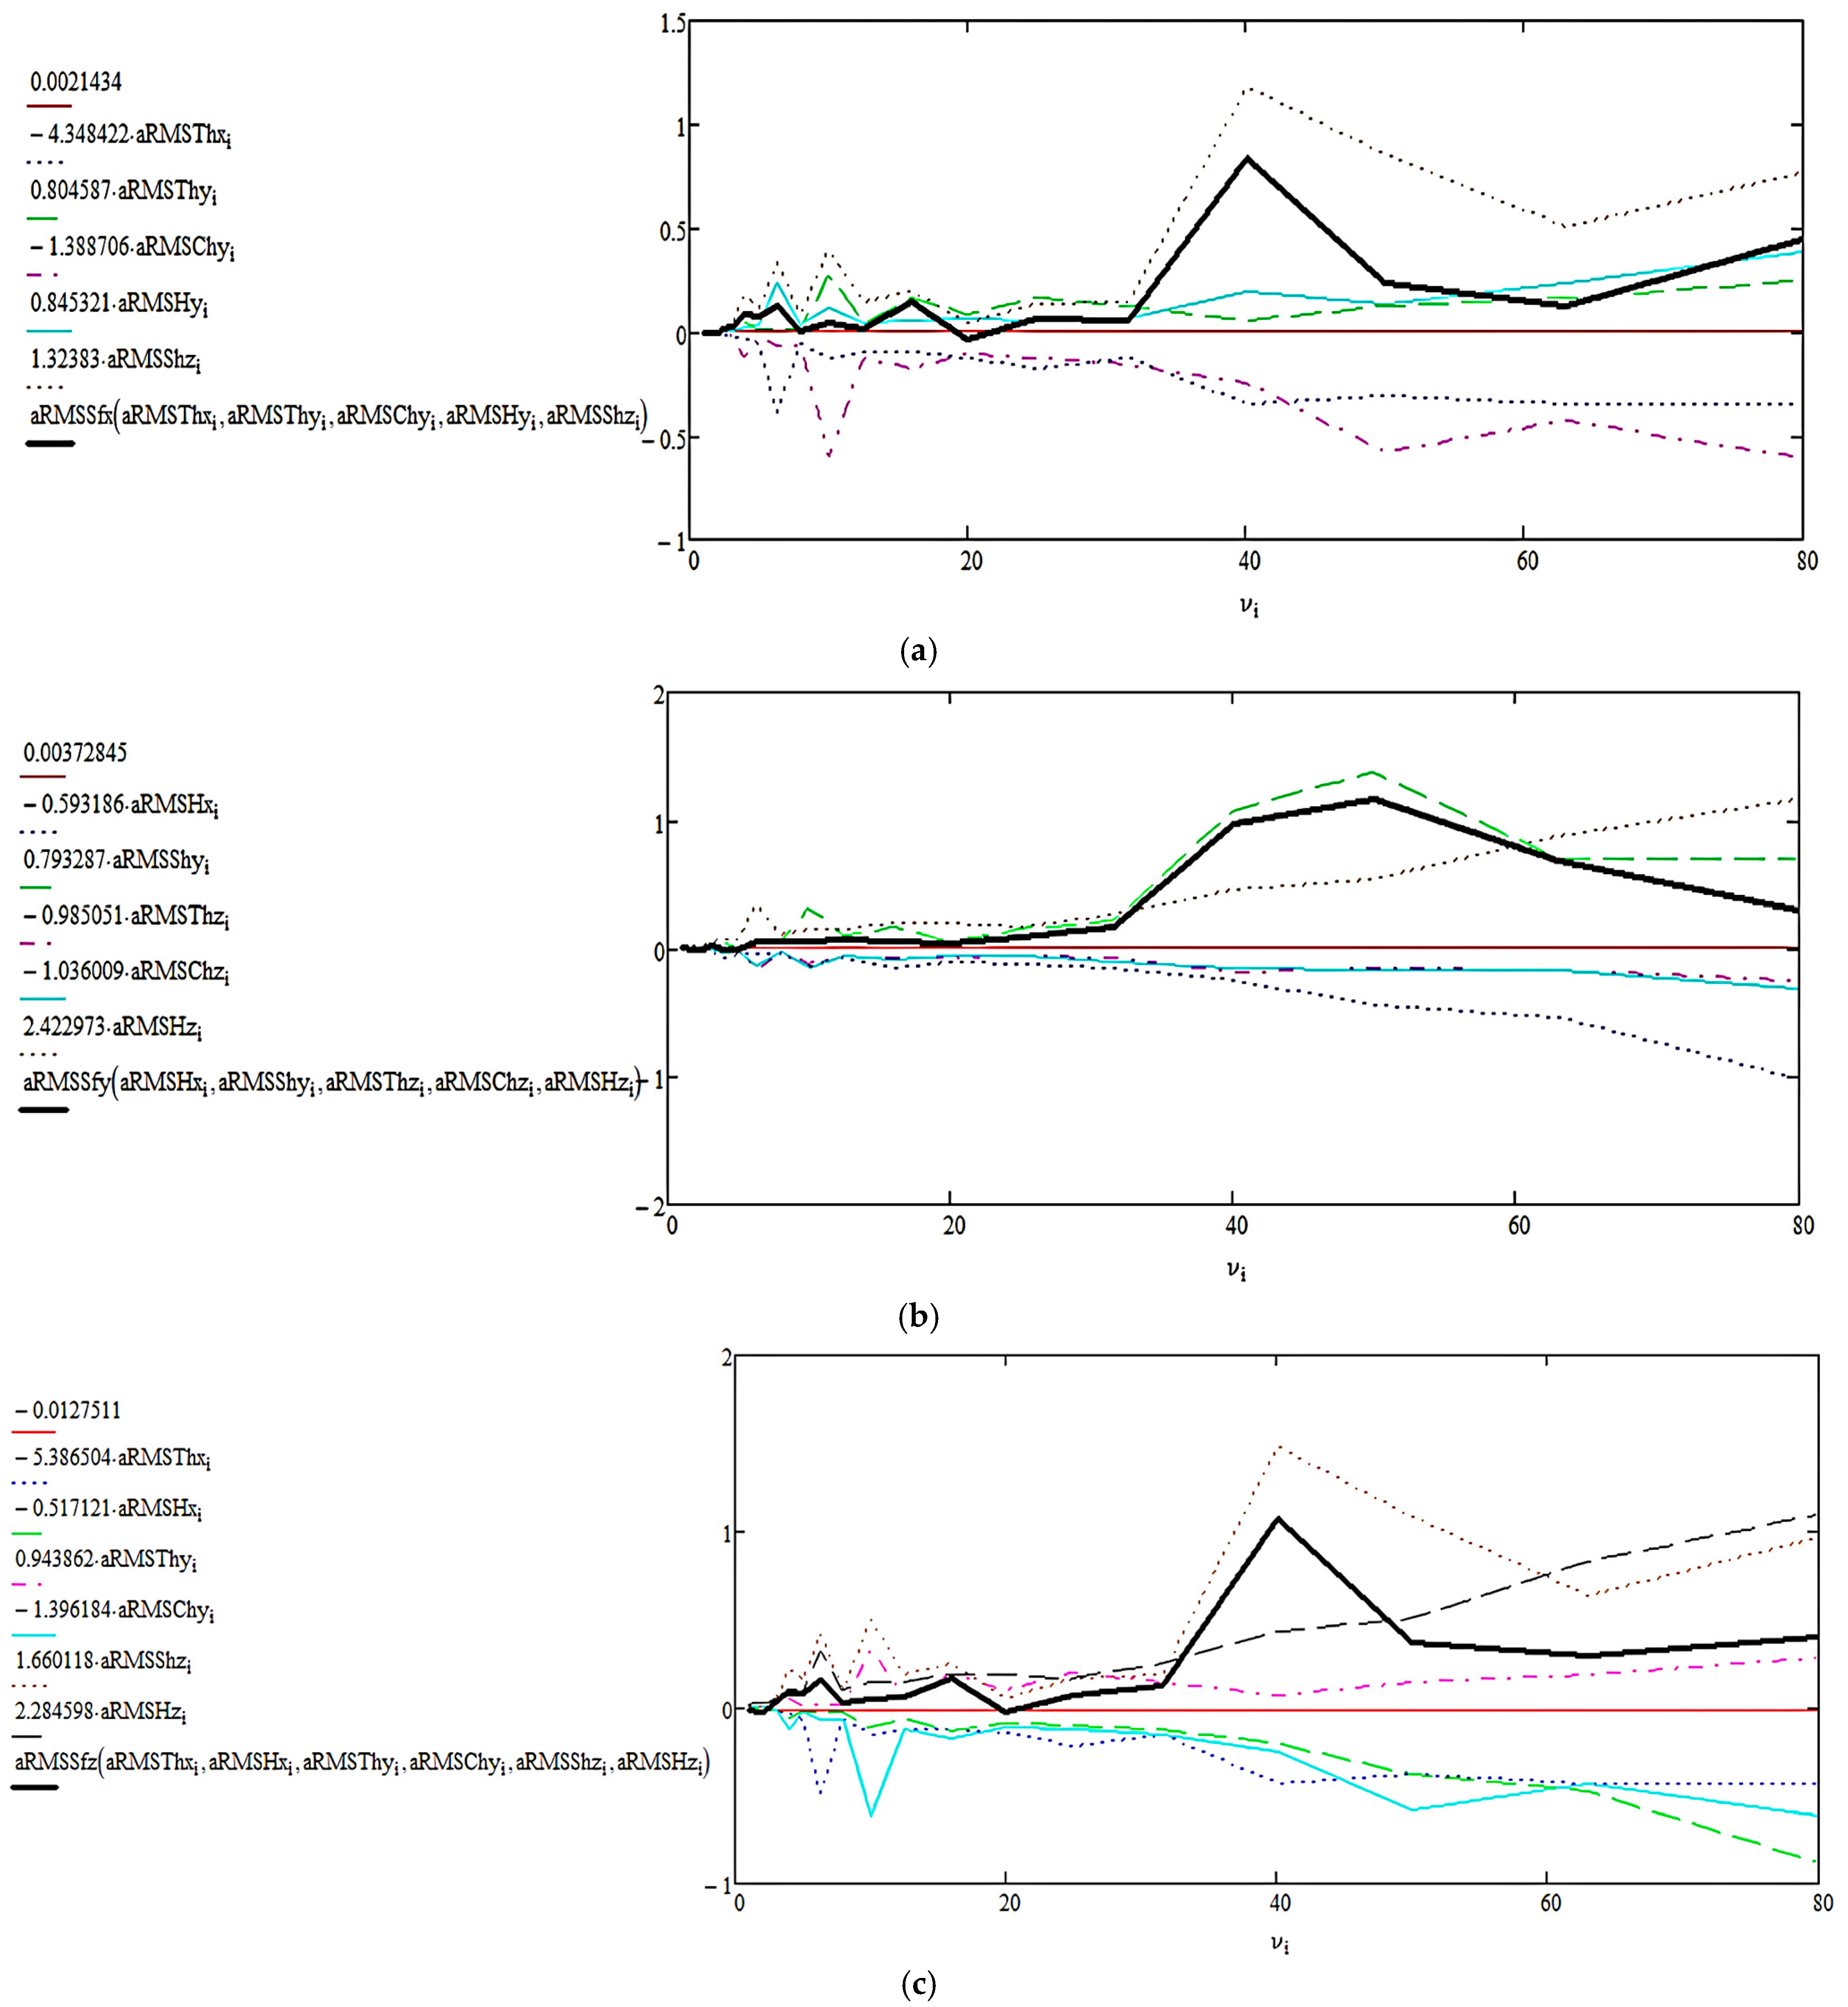
The graphical representations in Figure A1 are based on the structural Equations (1)–(3), obtained through the multilinear analysis described in Section 3.1.1. The horizontal axis represents the spectral frequency, while the vertical axis shows the RMS acceleration values, both total and component-wise (each being labeled in accordance with the structural Equations (1)–(3)). The dominant components (in terms of maximum value within the 0–80 Hz frequency range) can be identified and are listed in Table A1.
Figure A1. (a) Graphical and spectral representation of the RMS acceleration components on the Ox direction at the operator’s seat, C110H combine, in stationary operating mode. (b) Graphical and spectral representation of the RMS acceleration components on the Oy direction at the operator’s seat, C110H combine, in stationary operating mode. (c) Graphical and spectral representation of the RMS acceleration components on the Oz direction at the operator’s seat, C110H combine, in stationary operating mode.
Applsci 15 10159 g0a1
Table A1. Dominant components acting on the three directions at the operator’s seat of the C110H combine in stationary operating mode.
DirectionDominant Component
Ox a R M S S h z
Oy a R M S S h y
Oz a R M S S h z
The analysis can be further detailed by frequency intervals, through the definition of a ranking criterion for contributions. In this way, specific intervals can be identified where components other than those listed in Table A1 become dominant. Such an approach is particularly useful for identifying potential resonance sources and for optimizing the vibrational behavior of the assembly.
To clarify the legends that appear in each of the Figure A1a–c, Figure A2a–c, Figure A3a–c and Figure A4a–c, the meaning of each row in the legend, of each variable that appears in the legend, is explained below. The explanation is given only for Figure A1; for the rest, the explanations are similar. To understand the legend in Figure A1a, it is specified that on the horizontal axis the values of the discrete spectrum determined according to [18] are represented, v i representing the frequency with the index i ,   i = 1 80 , in Hz. The vertical axis of Figure A1 represents in order the values of the terms that appear in the Regression Formula (1) of the RMS at the driver’s seat, namely the free term (0.0021434), the term generated by the acceleration component on the Ox axis at the threshing mechanism 4.348422 a R M S T h x (see Table 1), the term generated by the acceleration component on the Oy axis at the threshing mechanism ( 0.804587 a R M S T h y ), the term generated by the acceleration component on the Oy axis at the chassis ( 1.388706 a R M S C h y ), the term generated by the acceleration component on the Oy axis at the header ( 0.845321 a R M S H y ), the term generated by the acceleration component on the Oz axis at the straw walker ( 1.32383 a R M S S h z ). The last row of the legend corresponds to the acceleration function on the Ox axis at the operator’s seat, a R M S S x from the left member of Equation (1). The legends in the other figures in the appendix are read similarly.

Appendix A.1.2. C110H Combine in Working Operating Mode
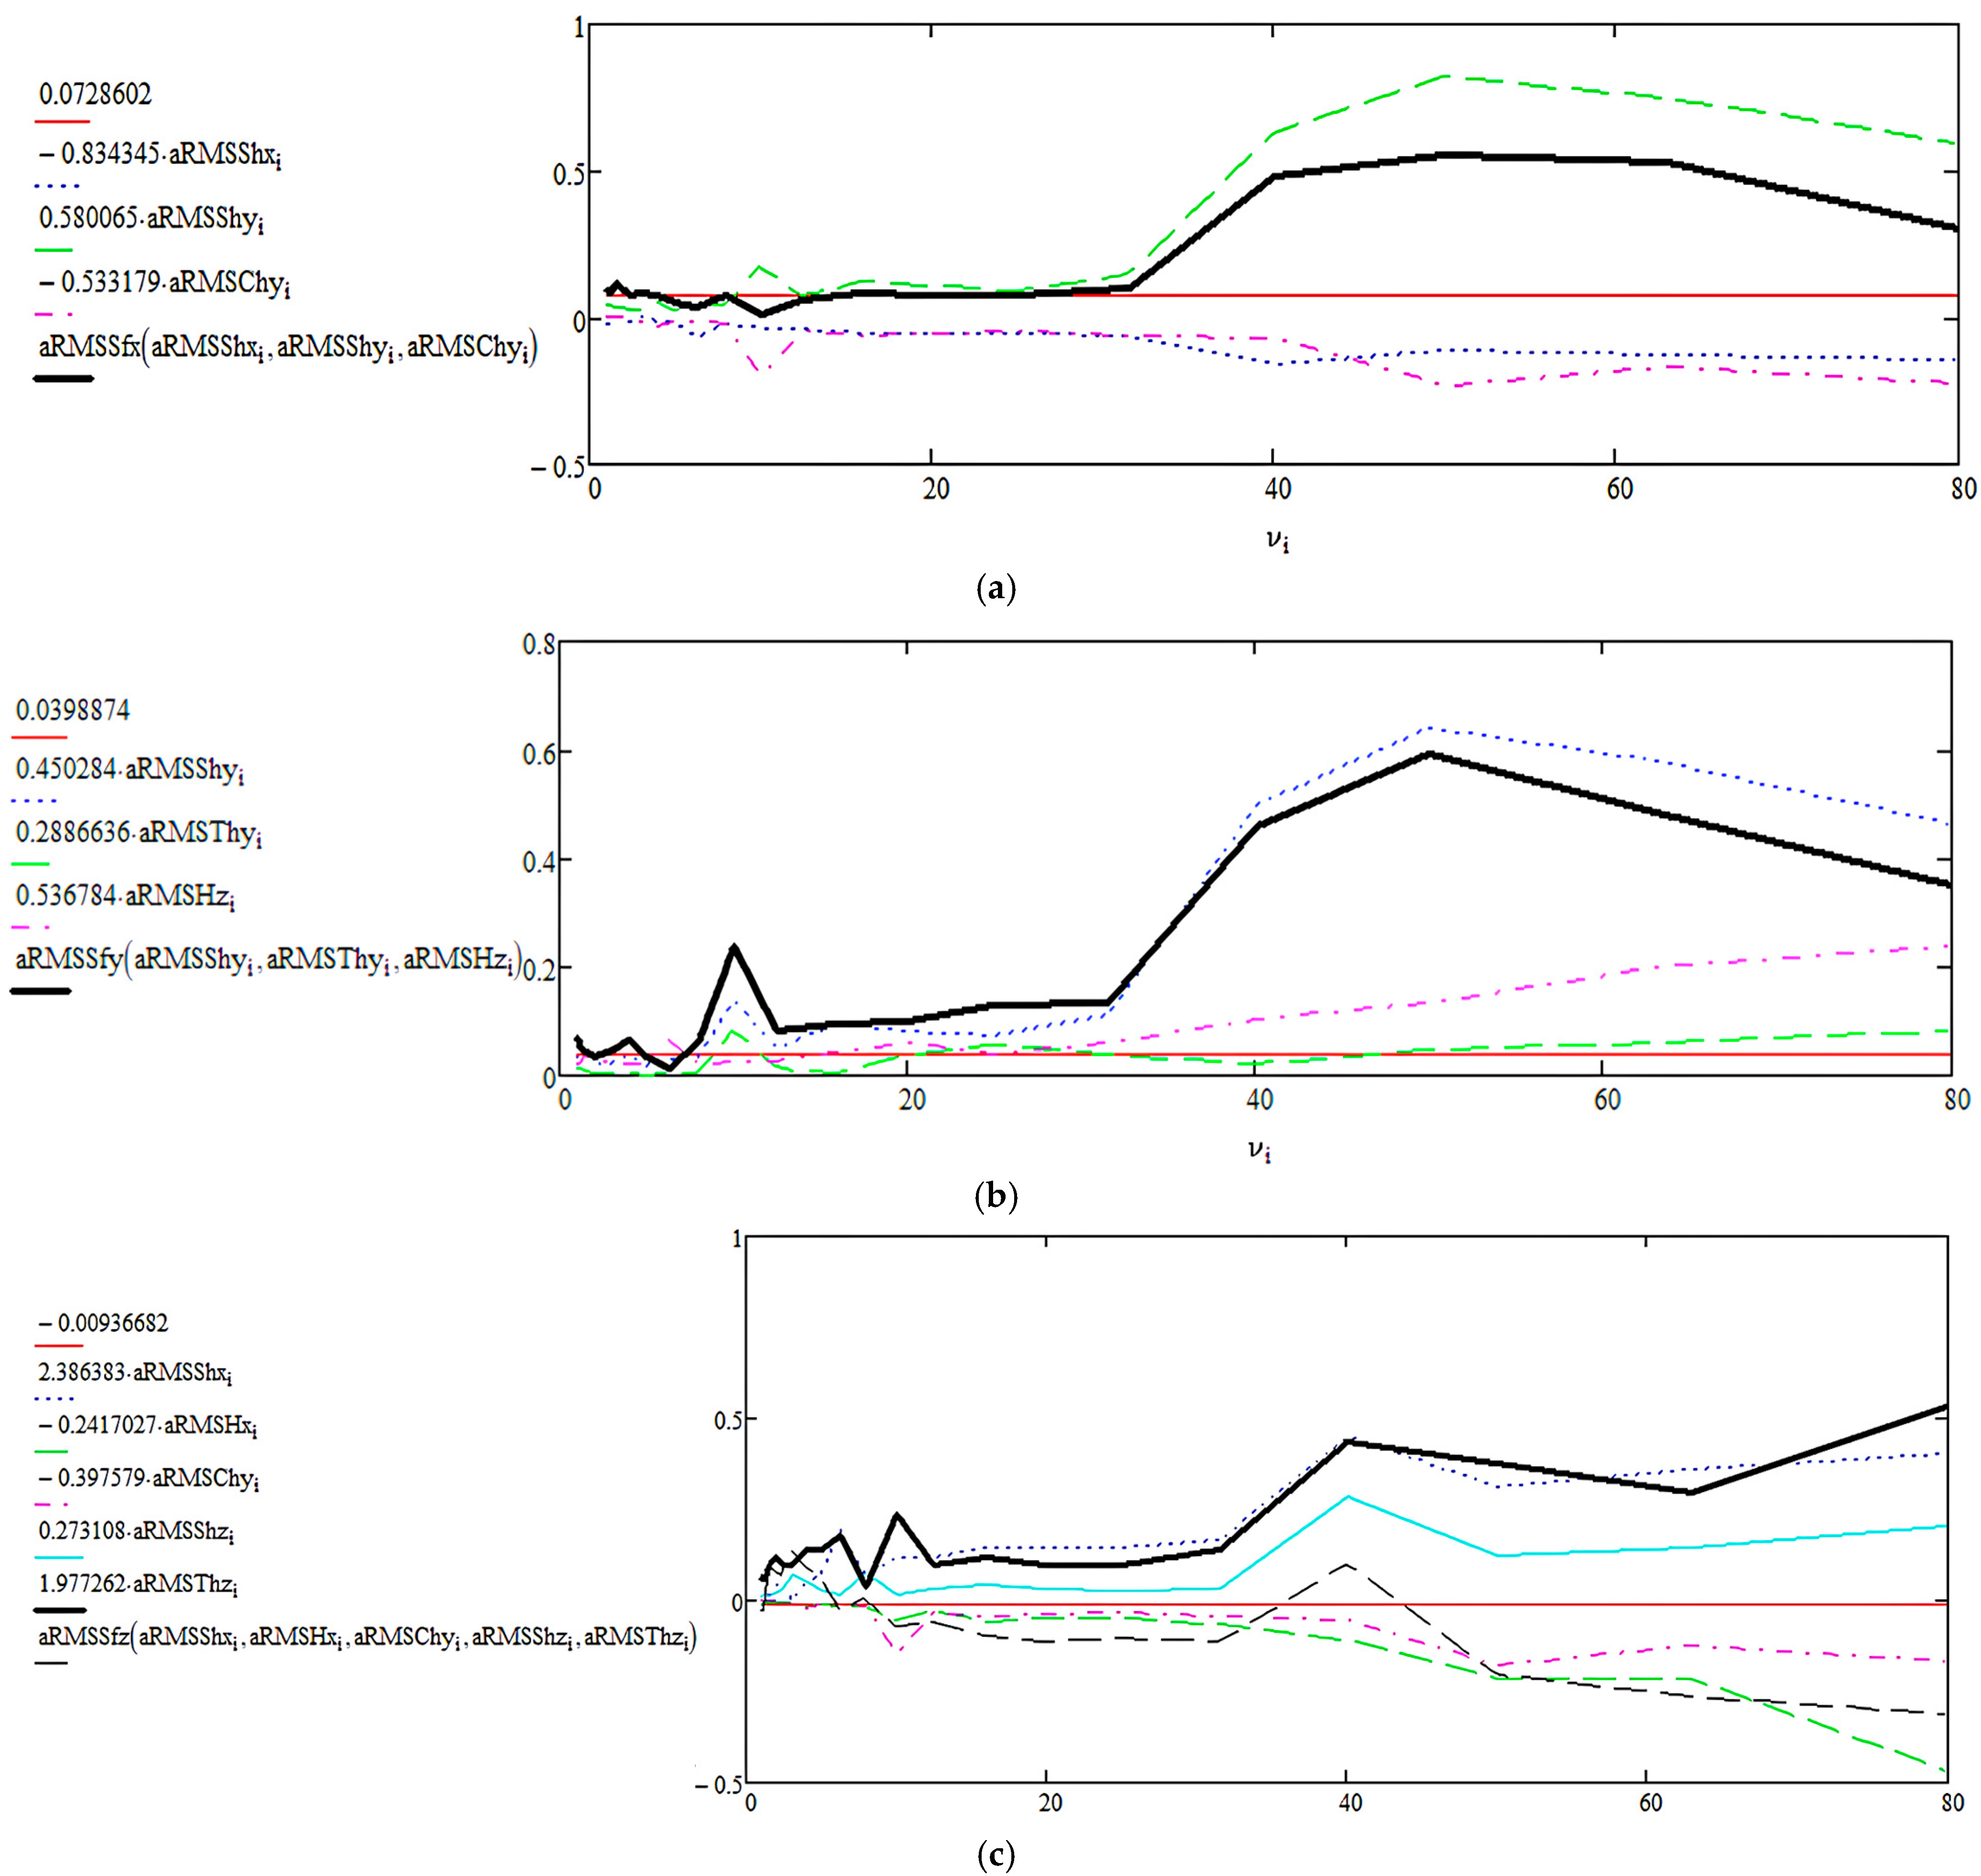
The graphical representations in Figure A2 are generated using the structural Equations (4)–(6), derived from the multilinear analysis in Section 3.1.2. The horizontal axis shows the spectral frequency, while the vertical axis displays the RMS acceleration values, both total and by components (each labeled clearly, matching the structural Equations (4)–(6)). The dominant components (in terms of maximum value within the 0–80 Hz frequency range) are identified in Table A2.
Figure A2. (a) Graphical and spectral representation of the RMS acceleration components on the Ox direction at the operator’s seat, C110H combine, in operating mode. (b) Graphical and spectral representation of the RMS acceleration components on the Oy direction at the operator’s seat, C110Hcombine, in operating mode. (c) Graphical and spectral representation of the RMS acceleration components on the Oz direction at the operator’s seat, C110H combine, in operating mode.
Applsci 15 10159 g0a2
Table A2. Dominant components acting on the three directions at the operator’s seat of the C110H combine in working operating mode.
DirectionDominant Component
Ox a R M S S h y
Oy a R M S S h y
Oz a R M S S h x
The analysis of vibration source influences can be further refined by segmenting the spectrum into frequency intervals and defining a criterion for ranking contributions. This approach allows for the identification of intervals where components other than those highlighted in Table A2 become dominant. Such an analysis is particularly recommended for detecting potential resonance sources.

Appendix A.1.3. CASE IH Combine in Stationary Operating Mode
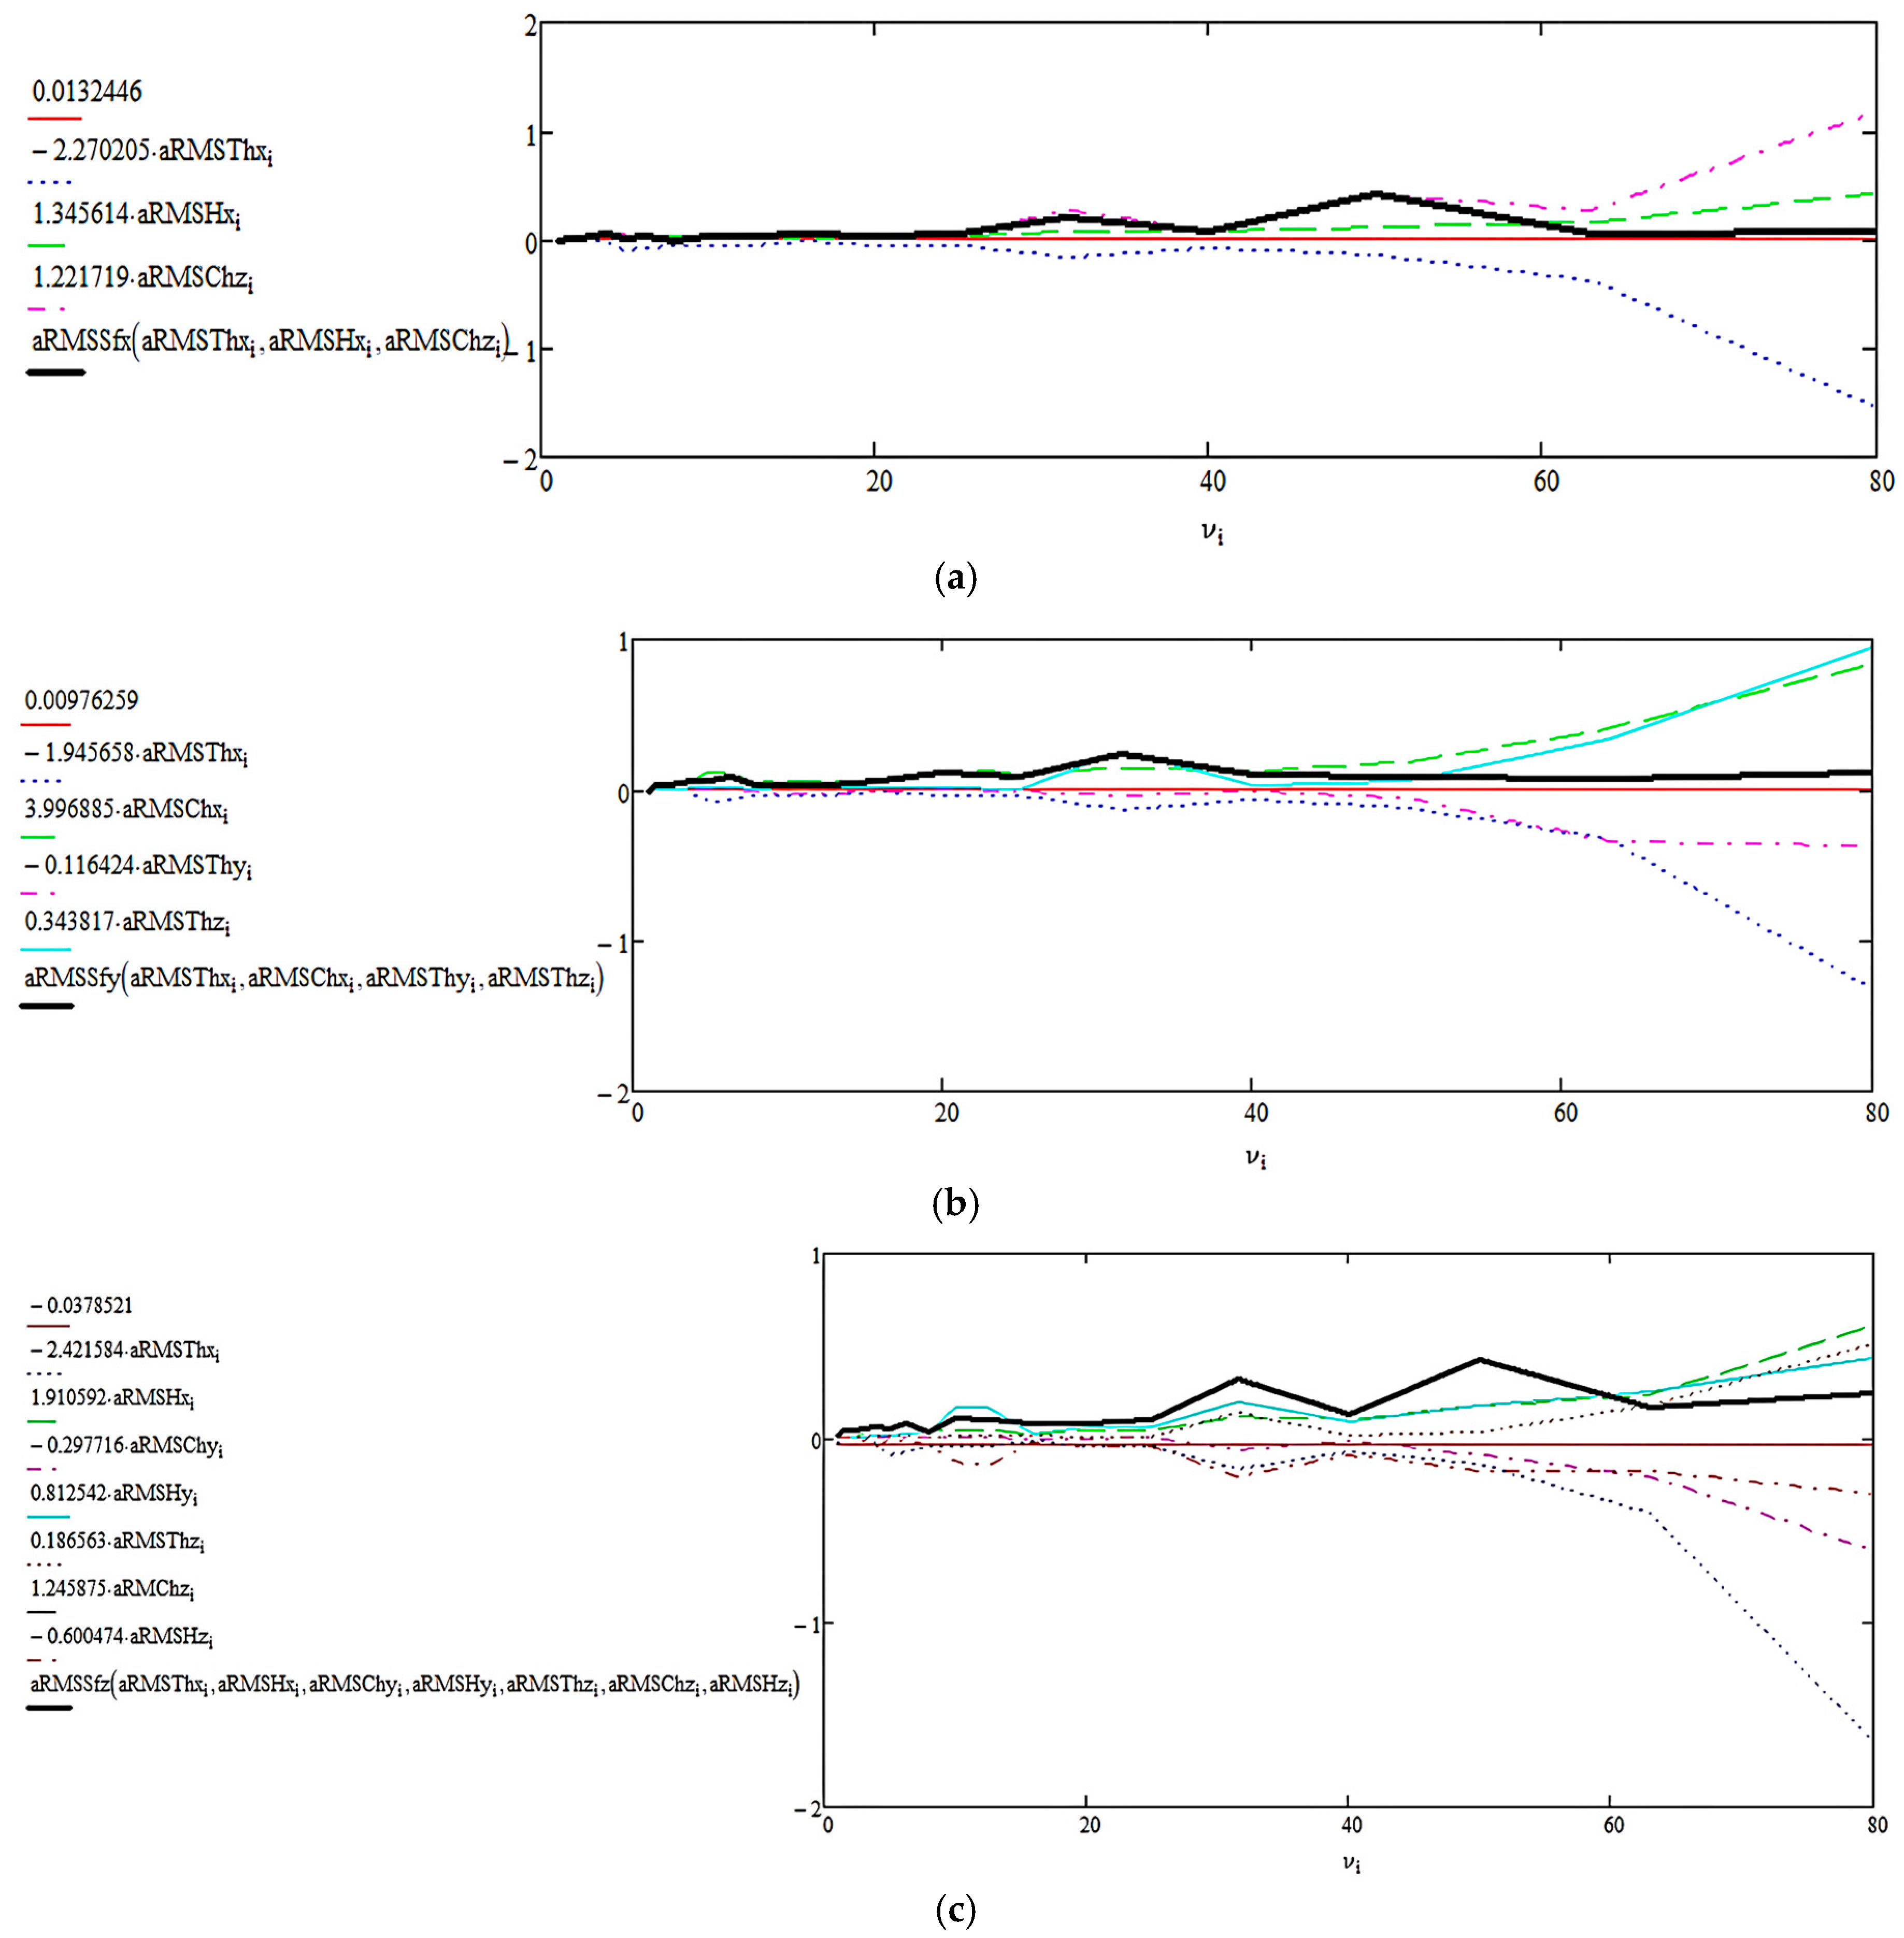
The graphical representations in Figure A3 are generated using the structural Equations (8)–(10), derived from the multilinear analysis in Section 3.2.1. The horizontal axis represents the spectral frequency, while the vertical axis shows the RMS acceleration values, both total and by components (each clearly labeled, in accordance with the structural Equations (8)–(10)). The dominant components (in terms of maximum value within the 0–80 Hz frequency range) are listed in Table A3.
Figure A3. (a) Graphical and spectral representation of the RMS acceleration components on the Ox direction at the operator’s seat, CASE IH combine, in stationary operating mode. (b) Graphical and spectral representation of the RMS acceleration components on the Oy direction at the operator’s seat, CASE IH combine, in stationary operating mode. (c) Graphical and spectral representation of the RMS acceleration components on the Oz direction at the operator’s seat, CASE IHcombine, in stationary operating mode.
Applsci 15 10159 g0a3
Table A3. Dominant components acting on the three directions at the operator’s seat of the CASE IH combine in stationary operating mode.
DirectionDominant Component
Ox a R M S C h z
Oy a R M S C h x ,   a R M S T h z
Oz a R M S H y ,   a R M S H x
The analysis of vibration source influences can be further detailed by segmenting frequency intervals using a well-defined ranking criterion. This approach allows the identification of frequency ranges where certain components, other than those highlighted in Table A3, become dominant. This method of analysis is particularly useful in the context of investigating resonance phenomena.

Appendix A.1.4. CASE IH Combine in Working Operating Mode
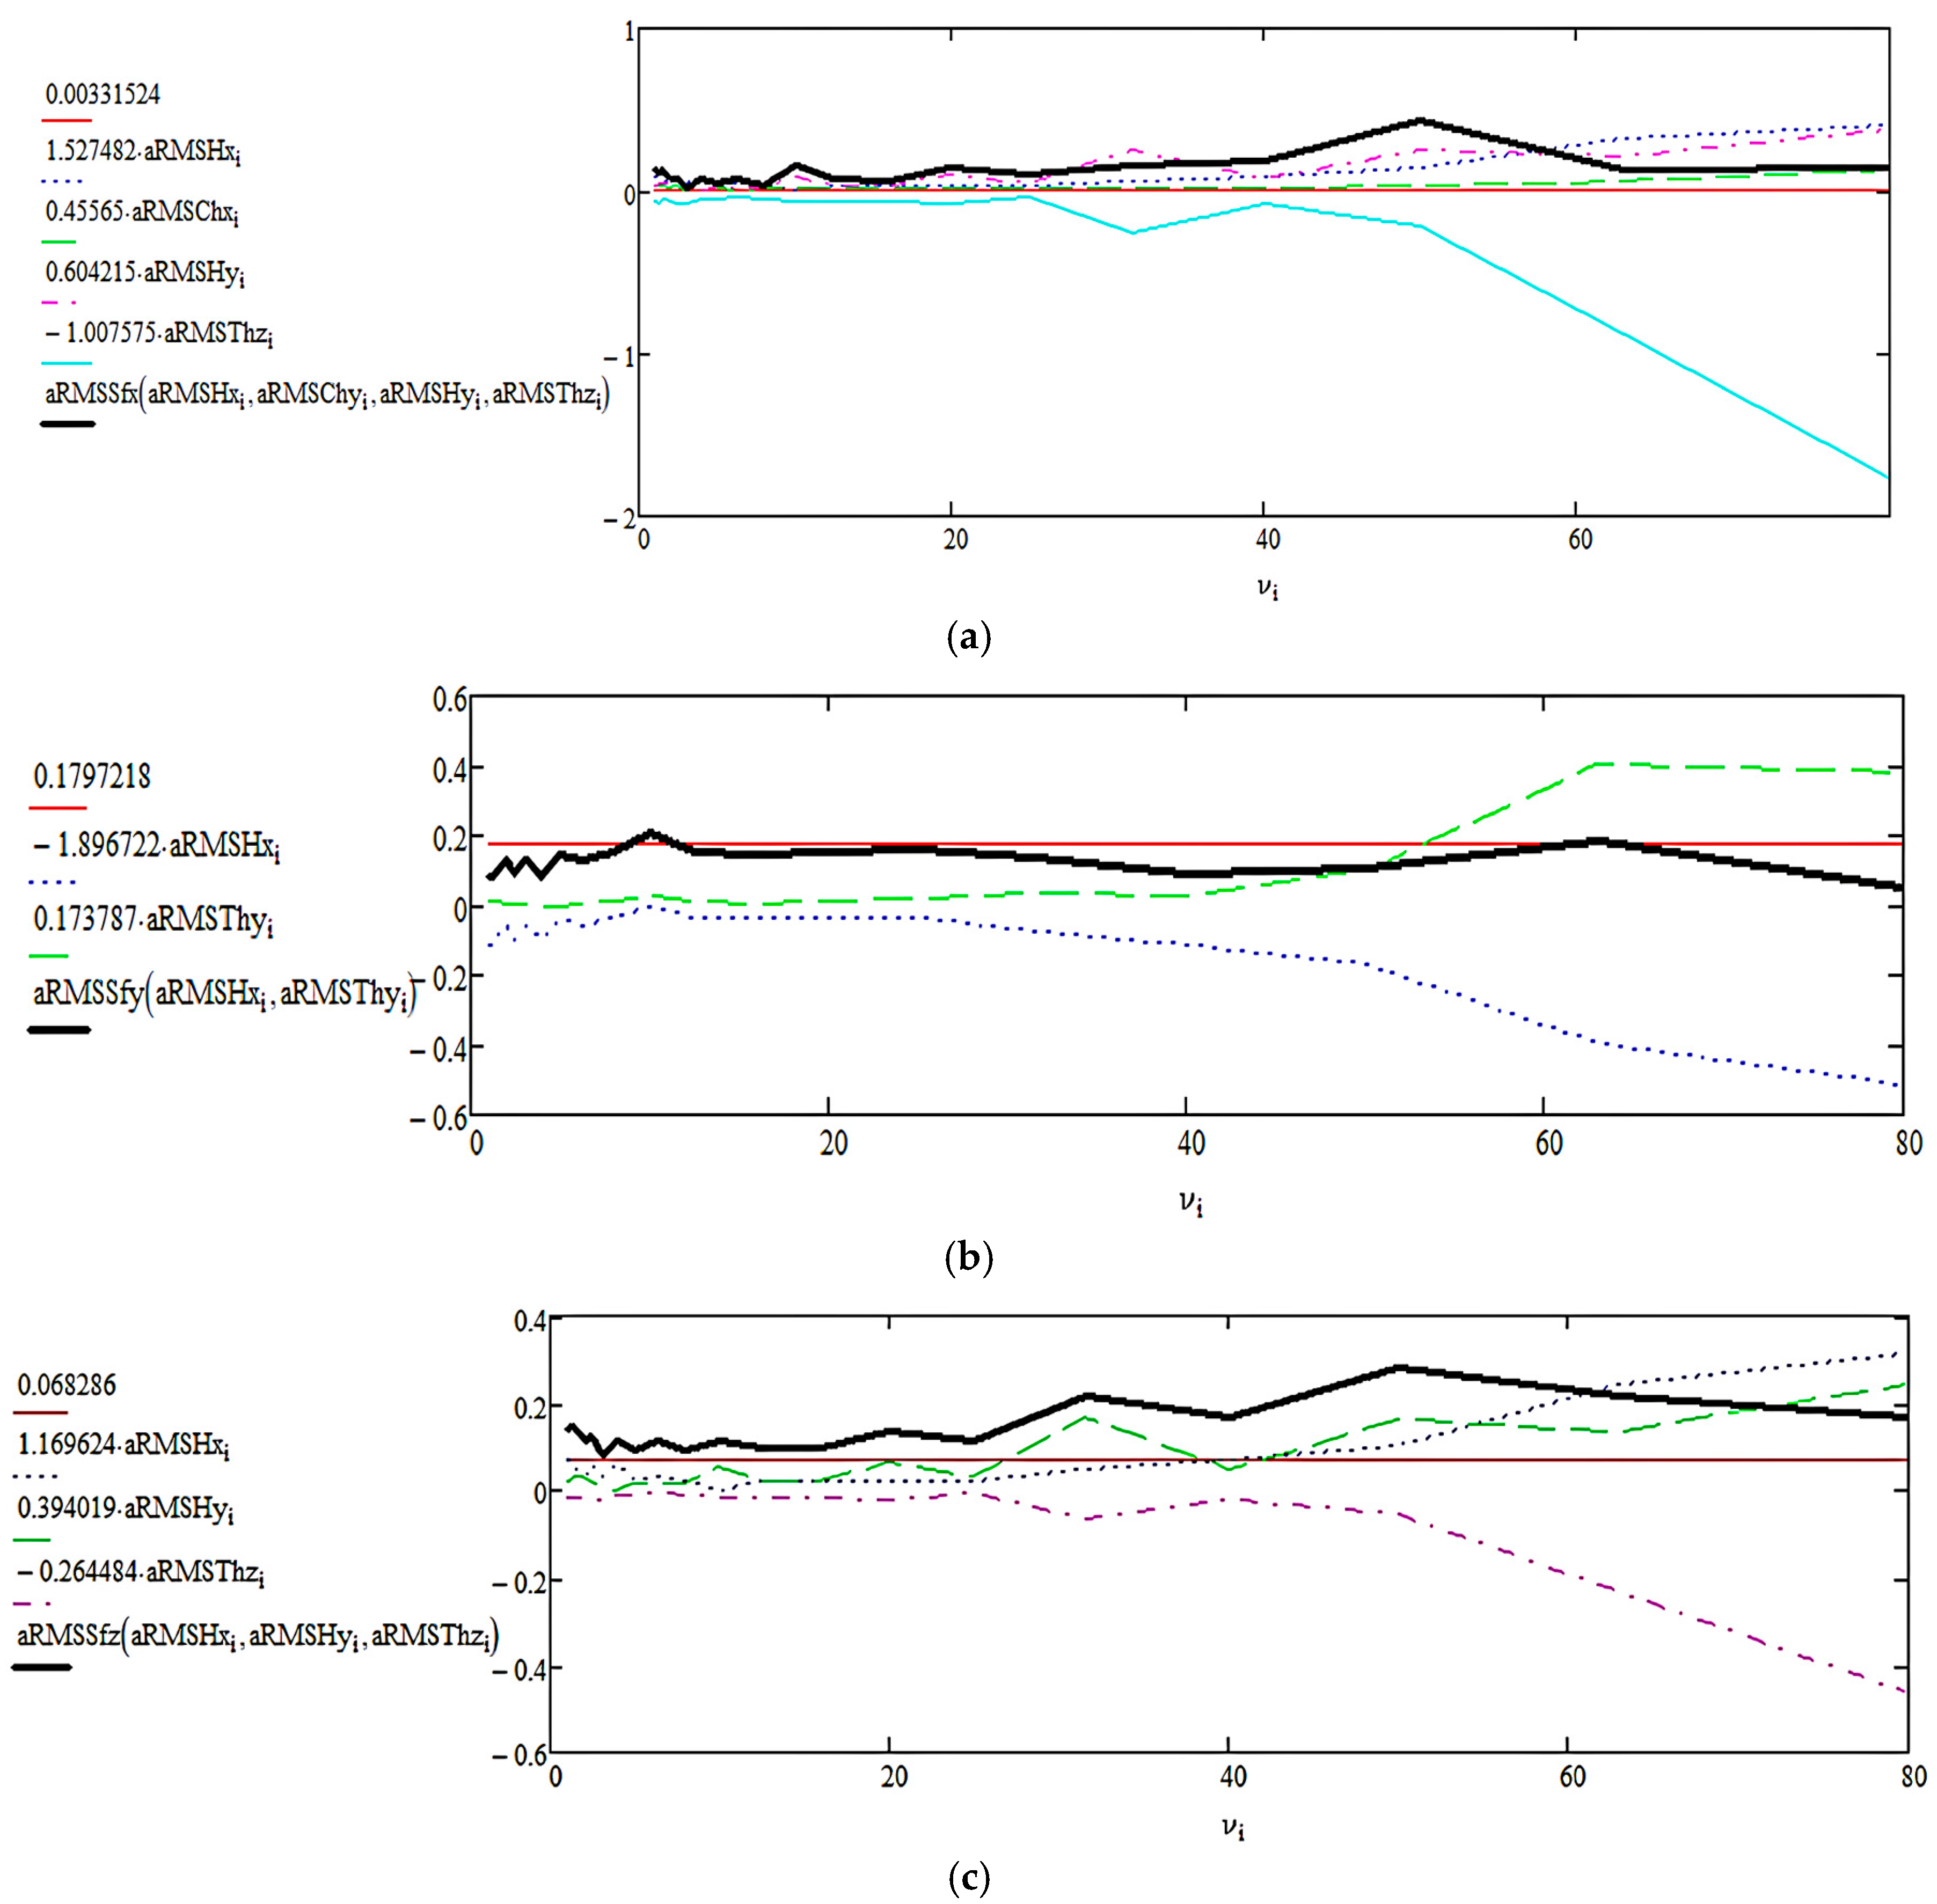
The graphical representations in Figure A4 are generated using the structural Equations (8)–(10), derived from the multilinear analysis in Section 3.2.2. The horizontal axis represents the spectral frequency, while the vertical axis shows the RMS acceleration values, both total and by components (each clearly labeled, matching the structural Equations (8)–(10)). The dominant components (in terms of maximum value within the 0–80 Hz frequency range) are listed in Table A3.
Figure A4. Representation of RMS acceleration components along Ox, Oy, and Oz directions at the operator’s seat, CASE IH combine, in working operating mode—individual components and total. (a) Graphical and spectral representation of the RMS acceleration components on the Ox direction at the operator’s seat, CASE IHcombine, in operating mode. (b) Graphical and spectral representation of the RMS acceleration components on the Oy direction at the operator’s seat, CASE IH combine, in operating mode. (c) Graphical and spectral representation of the RMS acceleration components on the Oz direction at the operator’s seat, CASE IH combine, in operating mode.
Applsci 15 10159 g0a4
Table A4. Dominant components acting on the three directions at the operator’s seat of the CASE IH combine in working operating mode.
DirectionDominant Component
Ox a R M S H y ,   a R M S H x
Oy a R M S T h y
Oz a R M S H y ,   a R M S H x
The analysis of vibration source influences can be extended through detailed investigation across frequency intervals using a well-defined ranking criterion. This approach enables the identification of specific intervals where certain components, different from those presented in Table A4, become predominant in terms of vibrational contribution. Such results are particularly valuable in the context of identifying potential resonance sources.

References

  1. Chapra, S.C. Applied Numerical Methods with MATLAB for Engineers and Scientists, 3rd ed.; McGraw-Hill: New York, NY, USA, 2023. [Google Scholar]
  2. Zaharie, D. Nonlinear Regression Models (Course); West University of Timisoara: Timisoara, Romania, 2023. [Google Scholar]
  3. Freedman, D.A. Statistical Models: Theory and Practice; Cambridge University Press: Cambridge, UK, 2009; p. 26. [Google Scholar]
  4. Dimitriadou, S.; Nikolakopoulos, K.G. Multiple linear regression models with limited data for the prediction of reference evapotranspiration of the Peloponnese, Greece. Hydrology 2022, 9, 124. [Google Scholar] [CrossRef]
  5. Liu, Y.; Wang, X. Combining variable selection and multiple linear regression for predicting soil nitrogen and organic carbon using NIR spectroscopy. Agronomy 2020, 12, 638. [Google Scholar] [CrossRef]
  6. Guan, T.; Alam, M.K.; Rao, M.B. Sample size calculations in simple linear regression. Entropy 2023, 25, 611. [Google Scholar] [CrossRef] [PubMed]
  7. Rencher, A.C.; Christensen, W.F. Methods of Multivariate Analysis, 3rd ed.; Wiley Series in Probability and Statistics; John Wiley & Sons: Hoboken, NJ, USA, 2012; p. 19. [Google Scholar]
  8. Yamauchi, A.; Imagawa, H.; Yokonishi, H.; Sakakibara, K.-I.; Tayama, N. Multivariate analysis of vocal fold vibrations on various voice disorders using high-speed digital imaging. Appl. Sci. 2021, 11, 6284. [Google Scholar] [CrossRef]
  9. Vulovic, M.; Prvulovic, S.; Tolmac, J.; Radisic, B.; Bajic, D.; Josimovic, M.; Sarenac, U.; Vulovic, S. Dynamic balancing and vibration analysis of rotor turbines: Methodologies and applications in predictive maintenance. Symmetry 2025, 17, 743. [Google Scholar] [CrossRef]
  10. Rehman, N.U.; Aftab, H. Multivariate variational mode decomposition. arXiv 2019, arXiv:1907.04509. [Google Scholar] [CrossRef]
  11. Frost, J. Multicollinearity in Regression Analysis: Problems, Detection and Remedies. Statistics by Jim. Available online: https://statisticsbyjim.com/regression/multicollinearity-in-regression-analysis/ (accessed on 24 February 2023).
  12. Lai, H.; Gao, X. Modified BIC criterion for model selection in linear mixed models. Mathematics 2023, 11, 2130. [Google Scholar] [CrossRef]
  13. Kim, W.; Jeon, J.; Jang, M.; Kim, S.; Lee, H.; Yoo, S.; Ahn, J. Developing a dynamic feature selection system (DFSS) for stock market prediction: Application to the Korean industry sectors. Appl. Sci. 2024, 14, 7314. [Google Scholar] [CrossRef]
  14. Piekutowska, M.; Niedbała, G.; Piskier, T.; Lenartowicz, T.; Pilarski, K.; Wojciechowski, T.; Pilarska, A.A.; Czechowska-Kosacka, A. The Application of Multiple Linear Regression and Artificial Neural Network Models for Yield Prediction of Very Early Potato Cultivars before Harvest. Agronomy 2021, 11, 885. [Google Scholar] [CrossRef]
  15. Lee, G.-C. A regression-based method for monthly electric load forecasting in South Korea. Energies 2024, 17, 5860. [Google Scholar] [CrossRef]
  16. Aldahmani, E.; Alzubi, A.; Iyiola, K. Demand forecasting in supply chain using uni-regression deep approximate forecasting model. Appl. Sci. 2024, 14, 8110. [Google Scholar] [CrossRef]
  17. Borrero, J.D.; Mariscal, J.; Vargas-Sánchez, A. A new predictive algorithm for time series forecasting based on Machine Learning techniques: Evidence for decision making in agriculture and tourism sectors. Stats 2022, 5, 1145–1158. [Google Scholar] [CrossRef]
  18. Lukman, A.F.; Kibria, B.M.G.; Nziku, C.K.; Amin, M.; Adewuyi, E.T.; Farghali, R. K-L estimator: Dealing with multicollinearity in the logistic regression model. Mathematics 2023, 11, 340. [Google Scholar] [CrossRef]
  19. Liang, R.; Liu, W.; Kaewunruen, S.; Zhang, H.; Wu, Z. Classification of external vibration sources data-driven models using hybrid CNNs and LSTMs. Struct. Control Health Monit. 2023, 2023, 1900447. [Google Scholar] [CrossRef]
  20. Wang, C. Load identification of acoustic and vibration sources following linear regression and least-squares of generalized matrix inverse method. J. Inf. Comput. Sci. 2014, 11, 3229–3239. [Google Scholar] [CrossRef]
  21. Li, S.M.; Jiang, X.X.; Lim, C.W. Research on Multi-Correlative Subsystems Analysis for Vibration Source Identification. In Vibration Engineering and Technology of Machinery; Sinha, J., Ed.; Mechanisms and Machine Science; Springer: Cham, Switzerland, 2015; Volume 23. [Google Scholar] [CrossRef]
  22. Fu, W.; Chen, H.; Kan, Z. Optimizing parameters on vibration breakshovel of radish harvester. Agric. Eng. 2011, 27, 46–50. [Google Scholar] [CrossRef]
  23. Zhang, Z.; Wang, X.; Li, J. Design and laboratory test of vibration excitation device for jujube harvester. In Proceedings of the 1st International Conference on New Materials, Machinery and Vehicle Engineering (NMMVE 2022); Volume 22: Advances in Transdisciplinary Engineering; Xu, J., Cai, Y., El Mansori, M., Eds.; IOS Press: Amsterdam, The Netherlands, 2022. [Google Scholar]
  24. Zhou, J.; Li, S.; Yang, D.; Zhong, J.; Mo, H.; Zhang, B.; Deng, X. Influence of sugarcane harvester cutterhead axial vibration on sugarcane ratoon cutting quality. Trans. Chin. Soc. Agric. Eng. 2017, 33, 16–24. [Google Scholar] [CrossRef]
  25. Al-Balhawi, A.; Zhang, B. Investigations of elastic vibration periods of tall reinforced concrete office buildings. Wind Struct. 2019, 29, 209–223. [Google Scholar] [CrossRef]
  26. Gao, R.; Yang, H.; Yang, Z. Evaluation of tractor driving vibrations fatigue based on multiple physiological parameters. PLoS ONE 2021, 16, e0254636. [Google Scholar] [CrossRef]
  27. Villibor, G.P.; Santos, F.L.; de Queiroz, D.M.; Guedes, D.M. Vibration levels and rear and front axles of a tractor in agricultural operations. Acta Sci. Technol. 2014, 36, 7–14. [Google Scholar] [CrossRef]
  28. Periasamy, B.; Mishra, A.K. Statistical modelling of the blast design parameters influencing ground vibrations in a limestone quarry using design-expert. Arab. J. Geosci. 2023, 16, 571. [Google Scholar] [CrossRef]
  29. Cvetković, M.M.; Desai, R.; de Winkel, K.N.; Papaioannou, G.; Happee, R. Explaining human body responses in random vibration: Effect of motion direction, sitting posture, and anthropometry. arXiv 2023, arXiv:2306.12115. [Google Scholar] [CrossRef]
  30. Chen, F.; Li, S.; Zhang, Y.; Wang, J. Detection of the vibration signal from human vocal folds using a 94-GHz millimeter-wave radar. Sensors 2017, 17, 543. [Google Scholar] [CrossRef] [PubMed]
  31. Vien, B.S.; Chiu, W.K.; Russ, M.; Fitzgerald, M. Modal frequencies associations with musculoskeletal components of human legs for extracorporeal bone healing assessment based on a vibration analysis approach. Sensors 2022, 22, 670. [Google Scholar] [CrossRef]
  32. Nguyen, H.T.P.; Woo, Y.; Huynh, N.N.; Jeong, H. Scoring of human body-balance ability on wobble board based on the geometric solution. Appl. Sci. 2022, 12, 5967. [Google Scholar] [CrossRef]
  33. Chu, W.; Yang, H.-C.; Chang, S.-F. The effect of whole-body vibration training on biomarkers and health beliefs of prefrail older adults. Appl. Sci. 2021, 11, 3557. [Google Scholar] [CrossRef]
  34. Grigorjeva, T.; Luta, G.; Vilkas, A. Experimental study of vibrations in agricultural combines with respect to operator seat and frame dynamics. Agronomy 2023, 13, 488. [Google Scholar] [CrossRef]
  35. Gusiatnikov, V.I.; Kuznetsov, I.N. Analysis of the vibration load of agricultural machines with increased operating speeds. Machines 2022, 10, 181. [Google Scholar] [CrossRef]
  36. Malakhov, D.; Miroshnichenko, D. Finite Element dynamic analysis of harvester frame under multisource vibration loading. Sensors 2021, 21, 3893. [Google Scholar] [CrossRef]
  37. Benos, L.; Tsaopoulos, D.; Bochtis, D. A Review on Ergonomics in Agriculture. Part II: Mechanized Operations. Appl. Sci. 2020, 10, 3484. [Google Scholar] [CrossRef]
  38. Vitale, E.; Vella, F.; Matera, S.; Rizzo, G.C.; Rapisarda, L.; Roggio, F.; Musumeci, G.; Rapisarda, V.; Romano, E.; Filetti, V. Precision Agriculture: Assessment of Ergonomic Risks of Assisted Driving System. Appl. Sci. 2024, 14, 3738. [Google Scholar] [CrossRef]
  39. Barač, Z.; Jurić, M.; Plaščak, I.; Jurić, T.; Marković, M. Assessing Whole-Body Vibrations in an Agricultural Tractor Based on Selected Operational Parameters: A Machine Learning-Based Approach. AgriEngineering 2025, 7, 72. [Google Scholar] [CrossRef]
  40. Oncescu, T.A.; Persu, I.C.; Bostina, S.; Biris, S.S.; Vilceleanu, M.V.; Nenciu, F.; Matache, M.G.; Tarnita, D. Comparative Analysis of Vibration Impact on Operator Safety 2 for Diesel and Electric Agricultural Tractors. AgriEngineering 2025, 7, 40. [Google Scholar] [CrossRef]
  41. Oncescu, T.A.; Costea, I.M.; Burciu, S.C.; Rentea, C.A. Evaluation of the Dynamic Behavior and Vibrations of the Operator-Vehicle Assembly in Electric Agricultural Tractor Operations: A Simulation Approach for Sustainable Transport Systems. Systems 2025, 13, 710. [Google Scholar] [CrossRef]
  42. Cutini, M.; Brambilla, M.; Bisaglia, C. Whole-Body Vibration in Farming: Background Document for Creating a Simplified Procedure to Determine Agricultural Tractor Vibration Comfort. Agriculture 2017, 7, 84. [Google Scholar] [CrossRef]
  43. Jahanbakhshi, A.; Ghamari, B.; Heidarbeigi, K. Vibrations Analysis of Combine Harvester Seat in Time and Frequency Domain. J. Mech. Eng. Sci. 2020, 14, 639–654. [Google Scholar] [CrossRef]
  44. Marin, E.; Cârdei, P.; Vlăduț, V.; Biriş, S.S.; Ungureanu, N.; Bungescu, S.T.; Voicea, I.; Cujbescu, D.; Găgeanu, I.; Popa, L.D.; et al. Researches on the influence of the main vibration-generating components in grain harvesters on the operator’s comfort. Inmateh Agric. Eng. 2024, 74, 800–823. [Google Scholar] [CrossRef]
  45. ISO 2631-1:2001; Mechanical Vibration and Shock. Evaluation of Human Exposure. Part 1: General Requirements. Available online: https://e-standard.eu/en/standard/26040 (accessed on 27 August 2025).
  46. ISO 2631-5:2018; Mechanical Vibration and Shock. Evaluation of Human Exposure to Whole-Body Vibration. Part 5: Method for Evaluation of Vibration Containing Multiple Shocks. Available online: https://www.iso.org/standard/50905.html (accessed on 27 August 2025).
  47. StatsKingdom. Available online: https://www.statskingdom.com/ (accessed on 27 August 2025).
  48. Statology. ANOVA F-Value and p-Value Explained. Available online: https://www.statology.org/anova-f-value-p-value (accessed on 27 August 2025).
  49. Bing Search. F-statistic, Meaning. Available online: https://www.bing.com/search?q=F-ststistic%2C+meaning (accessed on 27 August 2025).
  50. Zondervan-Zwijnenburg, M.A.J.; van de Schoot, A.G.J.; Hoijtink, H.J.A. Testing ANOVA Replications by Means of the Prior Predictive p-Value. Meta-Psychology 2022, 6, MP.2019.1615. [Google Scholar] [CrossRef]
  51. Yao, Y.; Li, X.; Yang, Z.; Li, L.; Geng, D.; Huang, P.; Li, Y.; Song, Z. Vibration characteristics of corn combine harvester with the time-varying mass system under non-stationary random vibration. Agriculture 2022, 12, 1963. [Google Scholar] [CrossRef]
  52. Endaq Blog. Vibration Measurements: Vibration Analysis Basics. Available online: https://blog.endaq.com/vibration-measurements-vibration-analysis-basics (accessed on 27 August 2025).
  53. Buzdugan, G.; Fetcu, L.; Radeș, M. Mechanical Vibrations; Didactic and Pedagogical Publishing House: Bucharest, Romania, 1982. [Google Scholar]
  54. Chen, S.; Zhou, Y.; Tang, Z.; Lu, S. Modal vibration response of rice combine harvester frame under multi-source excitation. Biosyst. Eng. 2020, 194, 177–195. [Google Scholar] [CrossRef]
  55. Li, Y.; Tang, Z.; Ren, H.; Zhou, Y. Vibration Response of Combine Harvester Chassis Undergoing Multisource Excitation Force Distribution. Math. Probl. Eng. 2021, 2021, 8856094. [Google Scholar] [CrossRef]
  56. Pang, J.; Li, Y.; Ji, J.; Xu, L. Vibration excitation identification and control of the cutter of a combine harvester using triaxial accelerometers and partial coherence sorting. Biosystem. Eng. 2019, 185, 25–34. [Google Scholar] [CrossRef]
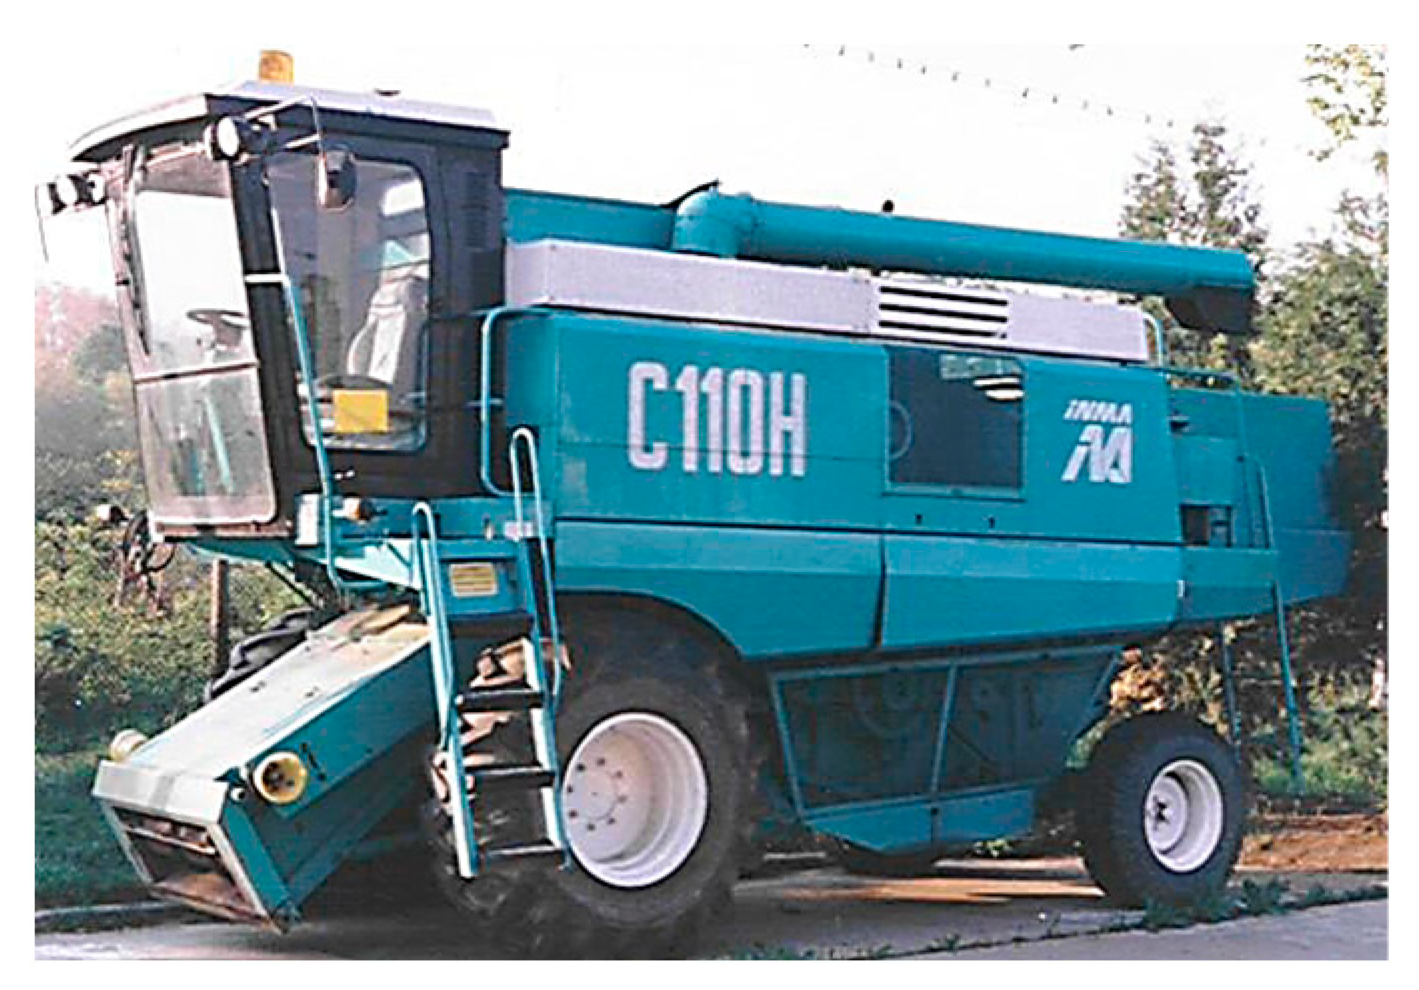
Figure 1. C 110H harvester, perspective view.
Applsci 15 10159 g001
Figure 2. CASE-IH harvester, perspective view.
Applsci 15 10159 g002
Figure 3. Influence map of the vibratory components of the C110H combine on the operator’s seat in stationary mode.
Applsci 15 10159 g003
Figure 4. Influence map of the vibratory components of the C110H combine harvester on the operator’s seat during working operation.
Applsci 15 10159 g004
Figure 5. Variation of the RMS resultant acceleration as a function of frequency in the stationary operating mode.
Applsci 15 10159 g005
Figure 6. Variation of the RMS resultant acceleration as a function of frequency in the working operating mode.
Applsci 15 10159 g006
Figure 7. Influence map of the vibratory components of the CASE IH combine on the operator’s seat in stationary operating mode.
Applsci 15 10159 g007
Figure 8. Influence map of the vibratory components of the CASE IH combine on the operator’s seat during working operating mode.
Applsci 15 10159 g008
Figure 9. Variation of the RMS resultant acceleration as a function of frequency in the stationary operating mode of the CASE IH combine.
Applsci 15 10159 g009
Figure 10. Variation of the RMS resultant acceleration as a function of frequency in the working operating mode for the CASE IH combine.
Applsci 15 10159 g010
Table 1. Notations of RMS acceleration components along the axes of the absolute coordinate system, for each measured vibratory component of the two combines.
No.NotationDefinition
1 a R M S S h x RMS acceleration component on the Ox axis at the straw walker
2 a R M S T h x RMS acceleration component on the Ox axis at the threshing mechanism
3 a R M S C h x RMS acceleration component on the Ox axis at the chassis
4 a R M S H x RMS acceleration component on the Ox axis at the header
5 a R M S S x RMS acceleration component on the Ox axis at the operator’s seat
6 a R M S S h y RMS acceleration component on the Oy axis at the straw walker
7 a R M S T h y RMS acceleration component on the Oy axis at the threshing mechanism
8 a R M S C h y RMS acceleration component on the Oy axis at the chassis
9 a R M S H y RMS acceleration component on the Oy axis at the header
10 a R M S S y RMS acceleration component on the Oy axis at the operator’s seat
11 a R M S S h z RMS acceleration component on the Oz axis at the straw walker
12 a R M S T h z RMS acceleration component on the Oz axis at the threshing mechanism
13 a R M S C h z RMS acceleration component on the Oz axis at the chassis
14 a R M S H z RMS acceleration component on the Oz axis at the header
15 a R M S S z RMS acceleration component on the Oz axis at the operator’s seat
Table 2. Summary of the static values of the coefficient of determination R2 resulting from the equations for each relationship allows the assessment for each combine.
Coefficient of DeterminationC110 H CombineCASE IH Combine
R2Equation (1)0.96Equation (8)0.98
R2Equation (2)1.00Equation (9)0.69
R2Equation (3)0.98Equation (10)0.99
R2Equation (4)0.96Equation (11)0.85
R2Equation (5)0.97Equation (12)0.31
R2Equation (6)0.98Equation (13)0.58
Table 3. Dominant components influencing operator’s seat vibration.
DirectionC110 H CombineCASE IH Combine
Operating modeStationaryWorkingStationary
Ox a R M S S h z a R M S S h y a R M S C h z
Oy a R M S S h y a R M S S h y a R M S C h x , a R M S T h z
Oz a R M S S h z a R M S S h x a R M S H y , a R M S H x
Disclaimer/Publisher’s Note: The statements, opinions and data contained in all publications are solely those of the individual author(s) and contributor(s) and not of MDPI and/or the editor(s). MDPI and/or the editor(s) disclaim responsibility for any injury to people or property resulting from any ideas, methods, instructions or products referred to in the content.