Article

Vibration Tracing Analysis and External Excitation Damping Method of Combine Harvester Based on Short-Time Fourier

1
School of Agricultural Engineering, Jiangsu University, Zhenjiang 212013, China
2
Key Laboratory of Modern Agricultural Equipment and Technology, Ministry of Education, Jiangsu University, Zhenjiang 212013, China
*
Author to whom correspondence should be addressed.
Appl. Sci. 2025, 15(18), 10134; https://doi.org/10.3390/app151810134 (registering DOI)
Submission received: 21 July 2025 / Revised: 3 September 2025 / Accepted: 10 September 2025 / Published: 17 September 2025
(This article belongs to the Special Issue State-of-the-Art Agricultural Science and Technology in China)

Abstract

The objective is to address the issue of excessive vibration in the cab of the combine harvester. This study addresses excessive cab vibration in the Linhai 4LZ-7.0 combine harvester by analyzing vibration signals under two working conditions using the Short-Time Fourier Transform. The results identified the vibrating screen and grass crusher as primary resonance sources, with maximum vibration along the X-axis. Simulation revealed that their first-order modal frequencies coincided with external excitation frequencies, causing resonance transmission to the cab. To resolve this, the driving pulleys of both components were redesigned and replaced. Post-modification testing showed a 90% reduction in the cab vibration level index from 1215 to 112, a 26% decrease in root mean square values, and the elimination of resonance peaks in frequency spectra. By modifying excitation frequencies to avoid structural resonance, cab vibration was effectively mitigated, significantly improving operational comfort. This paper is the first to pinpoint the primary resonance source and avert harvester resonance by altering its external excitation, delivering an effective, low-cost engineering fix for agricultural-machinery manufacturers; the abstract has been updated accordingly.

1. Introduction

With the advancement of agricultural technology, the functions and efficiency of combine harvesters are continuously improving. However, combine harvesters have numerous moving parts, complex motion patterns, and variable working conditions. In particular, the resonance generated between the working components of the combine harvester and external excitations, when transmitted to the cab, severely deteriorates the working environment for the driver and harms their physical and mental health [1]. Therefore, to enhance the reliability of the equipment and reduce the vibration of the combine harvester to improve the working environment, it is essential to clarify the vibration source characteristics of the combine harvester. By altering the external excitation frequency of the moving parts to avoid resonance, the vibration transmitted to the cab can be reduced.
Over the past decades, many scholars in China and abroad have conducted extensive research on the vibration reduction and noise control of engineering machinery. Yao et al. [2] from China Agricultural University conducted research on the vibration characteristics and modal parameter identification methods of the frame structure of a corn harvester under complex excitations. Wang [3] from Jiangsu University carried out vibration analysis and structural optimization of the cab of a tracked combine harvester. There are researchers who established the 7-DOF rigid body dynamics model of the combine harvester frame to obtain the modal shape and vibration response [4]. Mo et al. [5] from Guangxi Academy of Sciences studied the impact of disc axial vibration and cutting parameters on the cutting quality of sugarcane harvesters. Yang et al. [6] from China Agricultural University conducted research on multi-condition suspension control and testing of large-scale sprayers based on road surface characteristics. Liu et al. [7] from Ningbo University explored the reasons for excessive vibration by analyzing the vibration acceleration spectrum and effectively reduced the vibration and noise of the cab by adding beams to the upper floor of the cab. Foreign scholars established a vehicle model through ADAMS and analyzed the vibration characteristics of the vehicle. By optimizing the stiffness and damping of the cab suspension system, the ride comfort of the vehicle is improved [8]. Ebrahimi et al. [9] conducted dynamic and vibration analysis of a cutting platform through finite element and modal analysis, thereby reducing the vibration of sugar beet harvesters. There are also scholars who determined the optimal design and kinematic parameters of the beet-topping mechanism installed on the front of the tractor [10]. Aldair et al. [11] improved ride comfort and passenger safety by controlling the parameters of the vehicle suspension system. Ma et al. [12] collected vibration acceleration signals from the outer surface of the threshing and separating device under different load conditions through field tests and accurately identified the load conditions of the threshing and separating device of the combine harvester.
Currently, in China, research on vibration reduction of harvesters mainly focuses on improving the panel frame structure of the cab and the overall frame of the harvester. Some scholars have also extracted and characterized vibration signals from components such as the knife shaft and threshing drum for parameter optimization and fault diagnosis. Pang et al. [13] considered that the cutter is the main source of header vibration and designed a nut with a rubber sleeve to reduce the vibration from the cutter to the chute. Yang et al. [14] used displacement and acceleration sensors to collect and analyze the vibration signals of the cutterhead and the vibration source in view of the problems such as large cutterhead vibration during harvester operation and obtained the degree of rigidity influence of vibration intensity at different test points on the cutterhead connection. Hao et al. [15] studied the vibration characteristics of rice threshing drums under different working conditions and the vibration response states of drum bearings with different faults and established a vibration system model of threshing drums. Li et al. [16] established a dynamic response model of the multi-roller parallel system in different transmission modes in view of the complex vibration problem of the combine harvester threshing system and solved the vibration characteristics of the system. In contrast, in the plains-dominated regions of Europe and America, large combine harvesters are commonly used, which generally exhibit more stable performance during operation. Therefore, there is less research on vibration reduction of harvesters in these regions, with the focus mainly on optimizing the suspension parameters of automotive cabs to improve comfort. Hence, this paper starts from the analysis of vibration source signals of the harvester to explore the reasons for excessive vibration in the cab. Through signal analysis, modal simulation, and changing the external excitation frequency, resonance between the cleaning screen and the chopper is effectively avoided, and the vibration acceleration of the cab is reduced. This approach provides the most cost-effective and efficient solution to the problem of excessive cab vibration for harvester companies, contributing to the improvement of their harvester performance.

2. Materials and Methods

2.1. Combine Overall Structure and Components

The main working parts of the harvester include the cutting table, cleaning screen, threshing drum, engine, grass crusher, etc. [17,18] As shown in Figure 1, all the parts are stimulated by the engine, which will generate more or less vibration during movement, and the vibration signal of the resonant part will be transmitted to the cab. To reduce the driver’s comfort, this paper tests and analyzes the vibration signal of the original harvester based on the Short-Time Fourier Tranform in order to find the main vibration source of the harvester [19].

2.2. Test of Harvester Vibration Signal

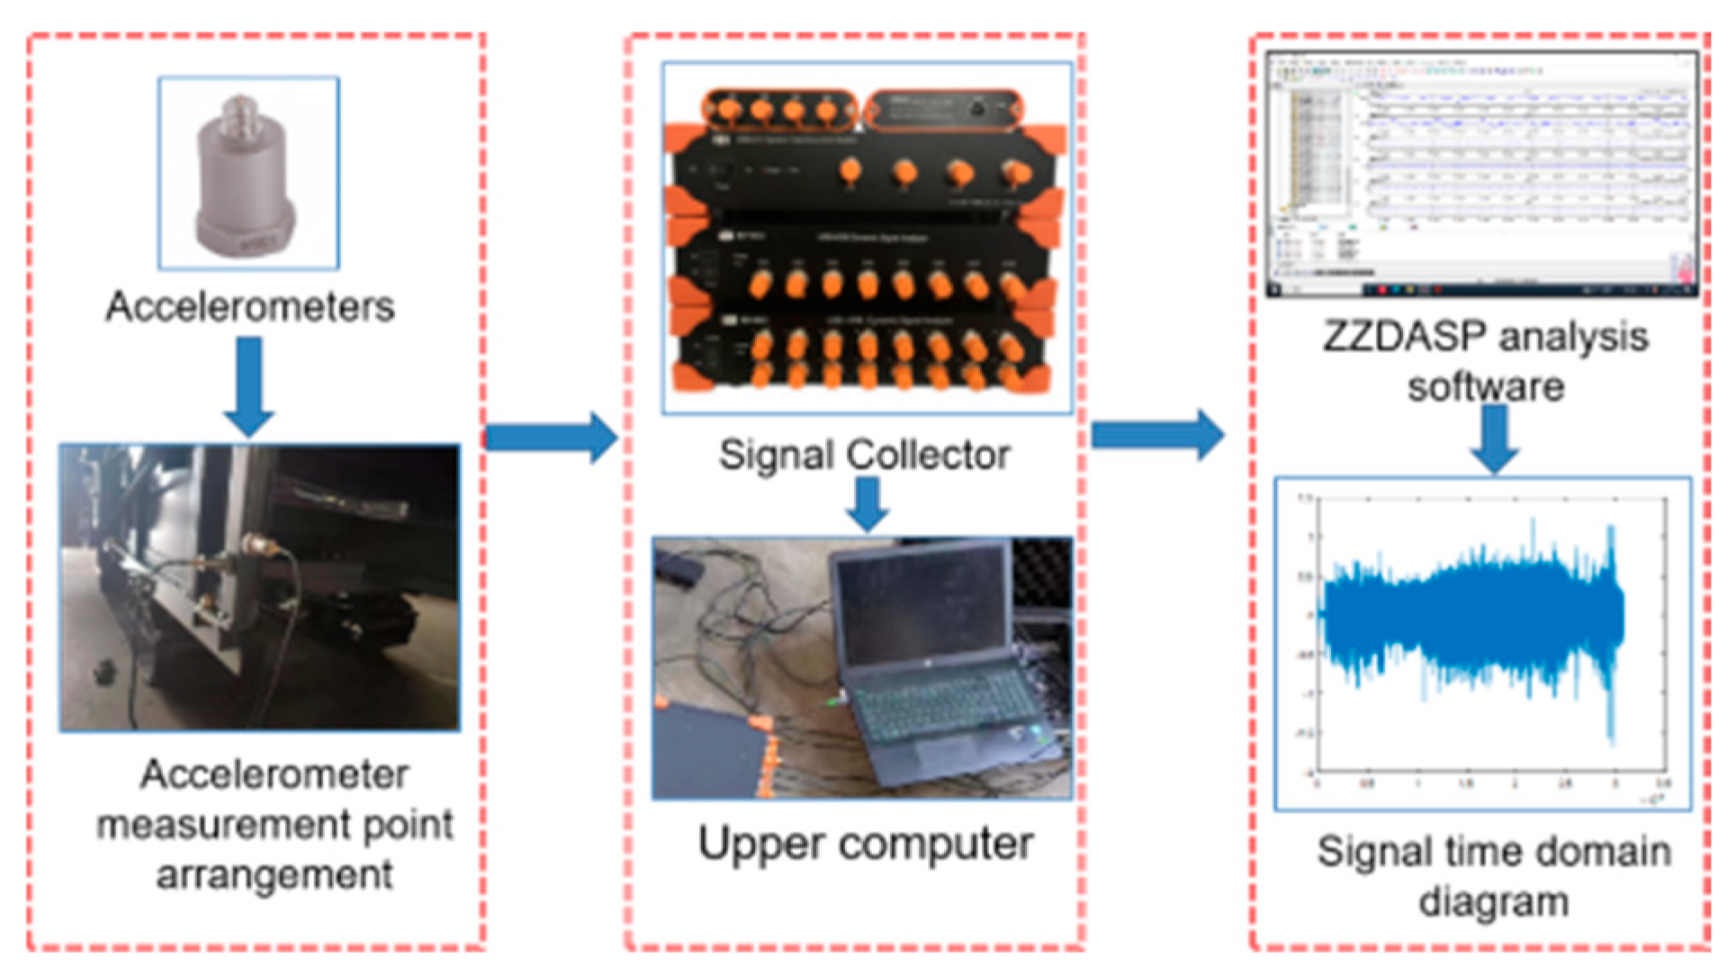
The author conducted vibration signal testing on the original harvester model at Linhai Co., Ltd. (Taizhou, China). The testing scenarios and equipment are shown in Figure 2. The signals were acquired using the ZZDASP software and its system. The collected signals were then imported into MATLAB software, where the Short-Time Fourier Transform (STFT) was applied through a pre-programmed script to perform time-frequency analysis [20,21]. Two working conditions were selected for the testing of the original harvester model. Condition a involved starting only the engine without activating any other working components, while condition b involved starting the engine along with other working components.

2.3. Vibration Signal Test Principle of Harvester Based on Short Time Fourier, VLI Index, and RMS Index

Time-frequency analysis is an effective approach for processing multi-component non-stationary signals. It represents one-dimensional analysis signals in a two-dimensional time-frequency plane and utilizes time-frequency features to characterize the non-stationary nature of the signals. To better represent the time-frequency information of combine harvester vibration signals, this paper employs the Short-Time Fourier Transform (STFT) method for the testing and analysis of the vibration signals [22,23].
The vibration magnitude is characterized using the VLI (Vibration Level Indicator) and RMS (Root Mean Square) indicators. Because they capture vibration from the two most critical and complementary perspectives, ”energy” and “peak”, they can efficiently and reliably cover the vast majority of mechanical condition-monitoring and fault-diagnosis needs. RMS quantifies the overall vibration level, whereas VLI reflects the maximum stress; combining RMS and VLI leverages their complementary strengths. The fundamental principles of this time-frequency analysis method are described as follows:
For an analytic signal, its Short-Time Fourier Transform (STFT) can be defined as Equation (1):
S x g t , ω = x μ g μ t e 2 π j ω μ t d μ  
where x μ represents the signals to be analyzed, g t is a window function that defines the time frame of the analysis, t is the time variable that represents the center position of the window function, Energy, and ω is the angular frequency that represents the frequency component of the signal.
g(t)∈L(R) represents the window function of compact support and S x g t , ω is the STFT coefficient of x(t). In the time-frequency domain, S x g t , ω 2 is the time-frequency spectrum of the signal x(t). STFT uses a window function to intercept the analysis signal near the time, performs a Fourier transform on the signal in the window to obtain the local spectral characteristics of the time, and then continuously moves the position of the analysis window in the entire time domain to obtain the frequency characteristics of each moment of the analysis signal.
The Vibration Lift Index (VLI) is an indicator used to assess the level of vibration. It helps us understand the impact of vibration on machinery and structures, thereby enabling appropriate measures to be taken to protect equipment and reduce structural damage. Its calculation principle is shown in Equation (2):
VLI = max A min A m e a n A
where max(A) is the maximum of the dataset, min(A) is the minimum of the dataset, and mean(A) is the mean of the dataset.
The RMS (root-mean-square) value, also called the effective value, is a pivotal vibration indicator. It states how large a constant (DC) level would deliver the same time-averaged energy intensity as the alternating vibration signal. Because a vibrating system’s total energy is proportional to the square of its amplitude, the RMS calculation—by integrating the squared amplitudes—directly captures this energy content. Consequently, operators routinely use RMS to gauge overall vibration severity. Whenever the goal is to assess total vibration energy, monitor equipment condition, or analyze fatigue life, RMS is the foremost metric. The calculation principle is shown in Equation (3):
RMS = 1 N i = 1 N x i 2
where N is the number of sample points and x i is the amplitude of the ith signal.

2.4. Overall Process

As illustrated in Figure 3, this study first acquires vibration signals on the original harvester and, through signal processing, pinpoints the dominant resonance source. Next, external-excitation-frequency calculations and modal analyses verify this source. The critical component is then modified to shift its excitation frequency and avoid resonance. Finally, vibration tests before and after the modification confirm the effectiveness of the improvement.
Previous vibration-reduction research on harvesters has focused on redesigning cab panels or the overall chassis, or adding damping to specific sub-assemblies. By contrast, this paper starts from an analysis of vibration signals at their source to uncover why cab vibration becomes excessive. Using signal analysis, modal simulation, and a deliberate shift in external excitation frequency, resonance between the cleaning sieve and straw chopper is successfully avoided, significantly lowering harvester vibration. For agricultural-machinery manufacturers, this approach delivers an efficient reduction in vibration at notably low cost.

3. Results

3.1. Analysis of Harvester Vibration Signal Based on Time-Frequency Processing Method

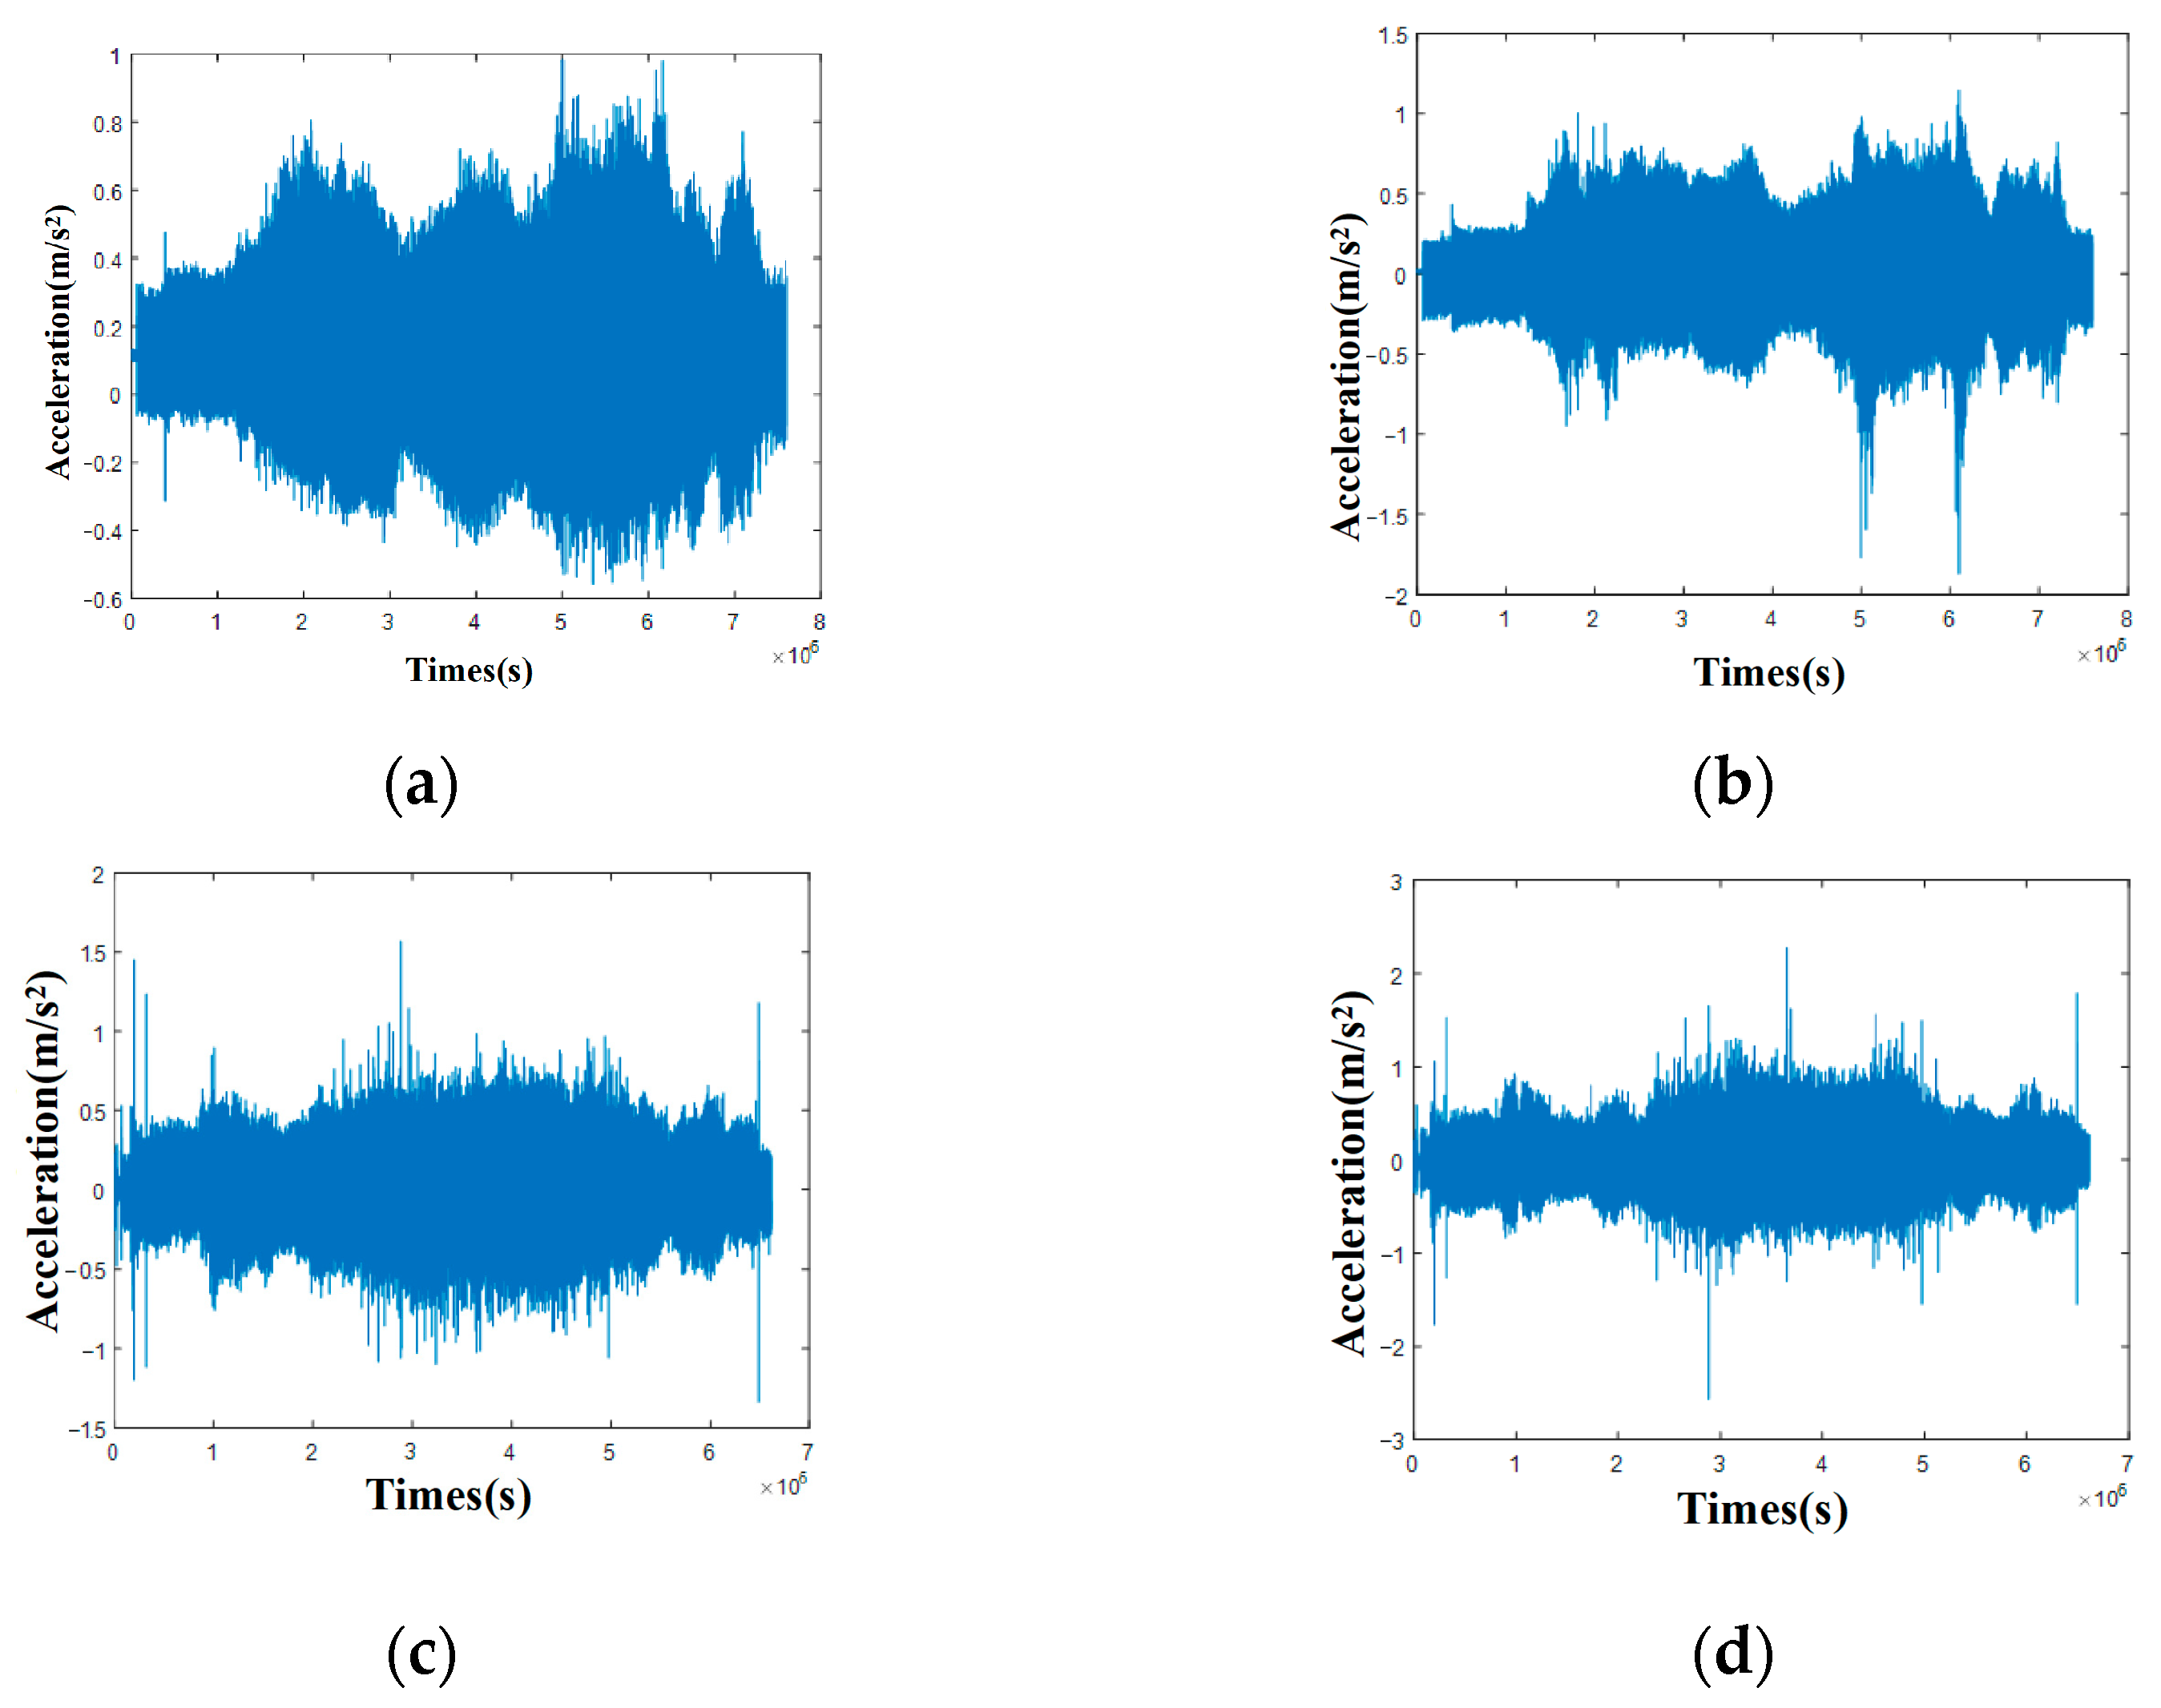
The author conducted vibration signal testing on the original harvester model at Linhai Co., Ltd. The testing scenarios and equipment are shown in Figure 4. The signals were acquired using the ZZDASP software and its system. The collected signals were then imported into MATLAB software, where the Short-Time Fourier Transform (STFT) was applied through a pre-programmed script to perform time-frequency analysis. Two working conditions were selected for the testing of the original harvester model. Condition a involved starting only the engine without activating any other working components, while condition b involved starting the engine along with other working components.
By comparing the time-domain vibration signals in the X-axis and Y-axis of the cab door pillar under two working conditions, it was found that the vibration acceleration amplitude of the harvester increased significantly after other working components were activated. Specifically, the vibration acceleration amplitude in both the X-axis and Y-axis of the cab door pillar increased by approximately 50%. The vibration in the X-axis direction was notably stronger than that in the Y-axis direction. This is hypothesized to be caused by resonance between the external excitations of the working components and their natural frequencies, which is transmitted to the cab.
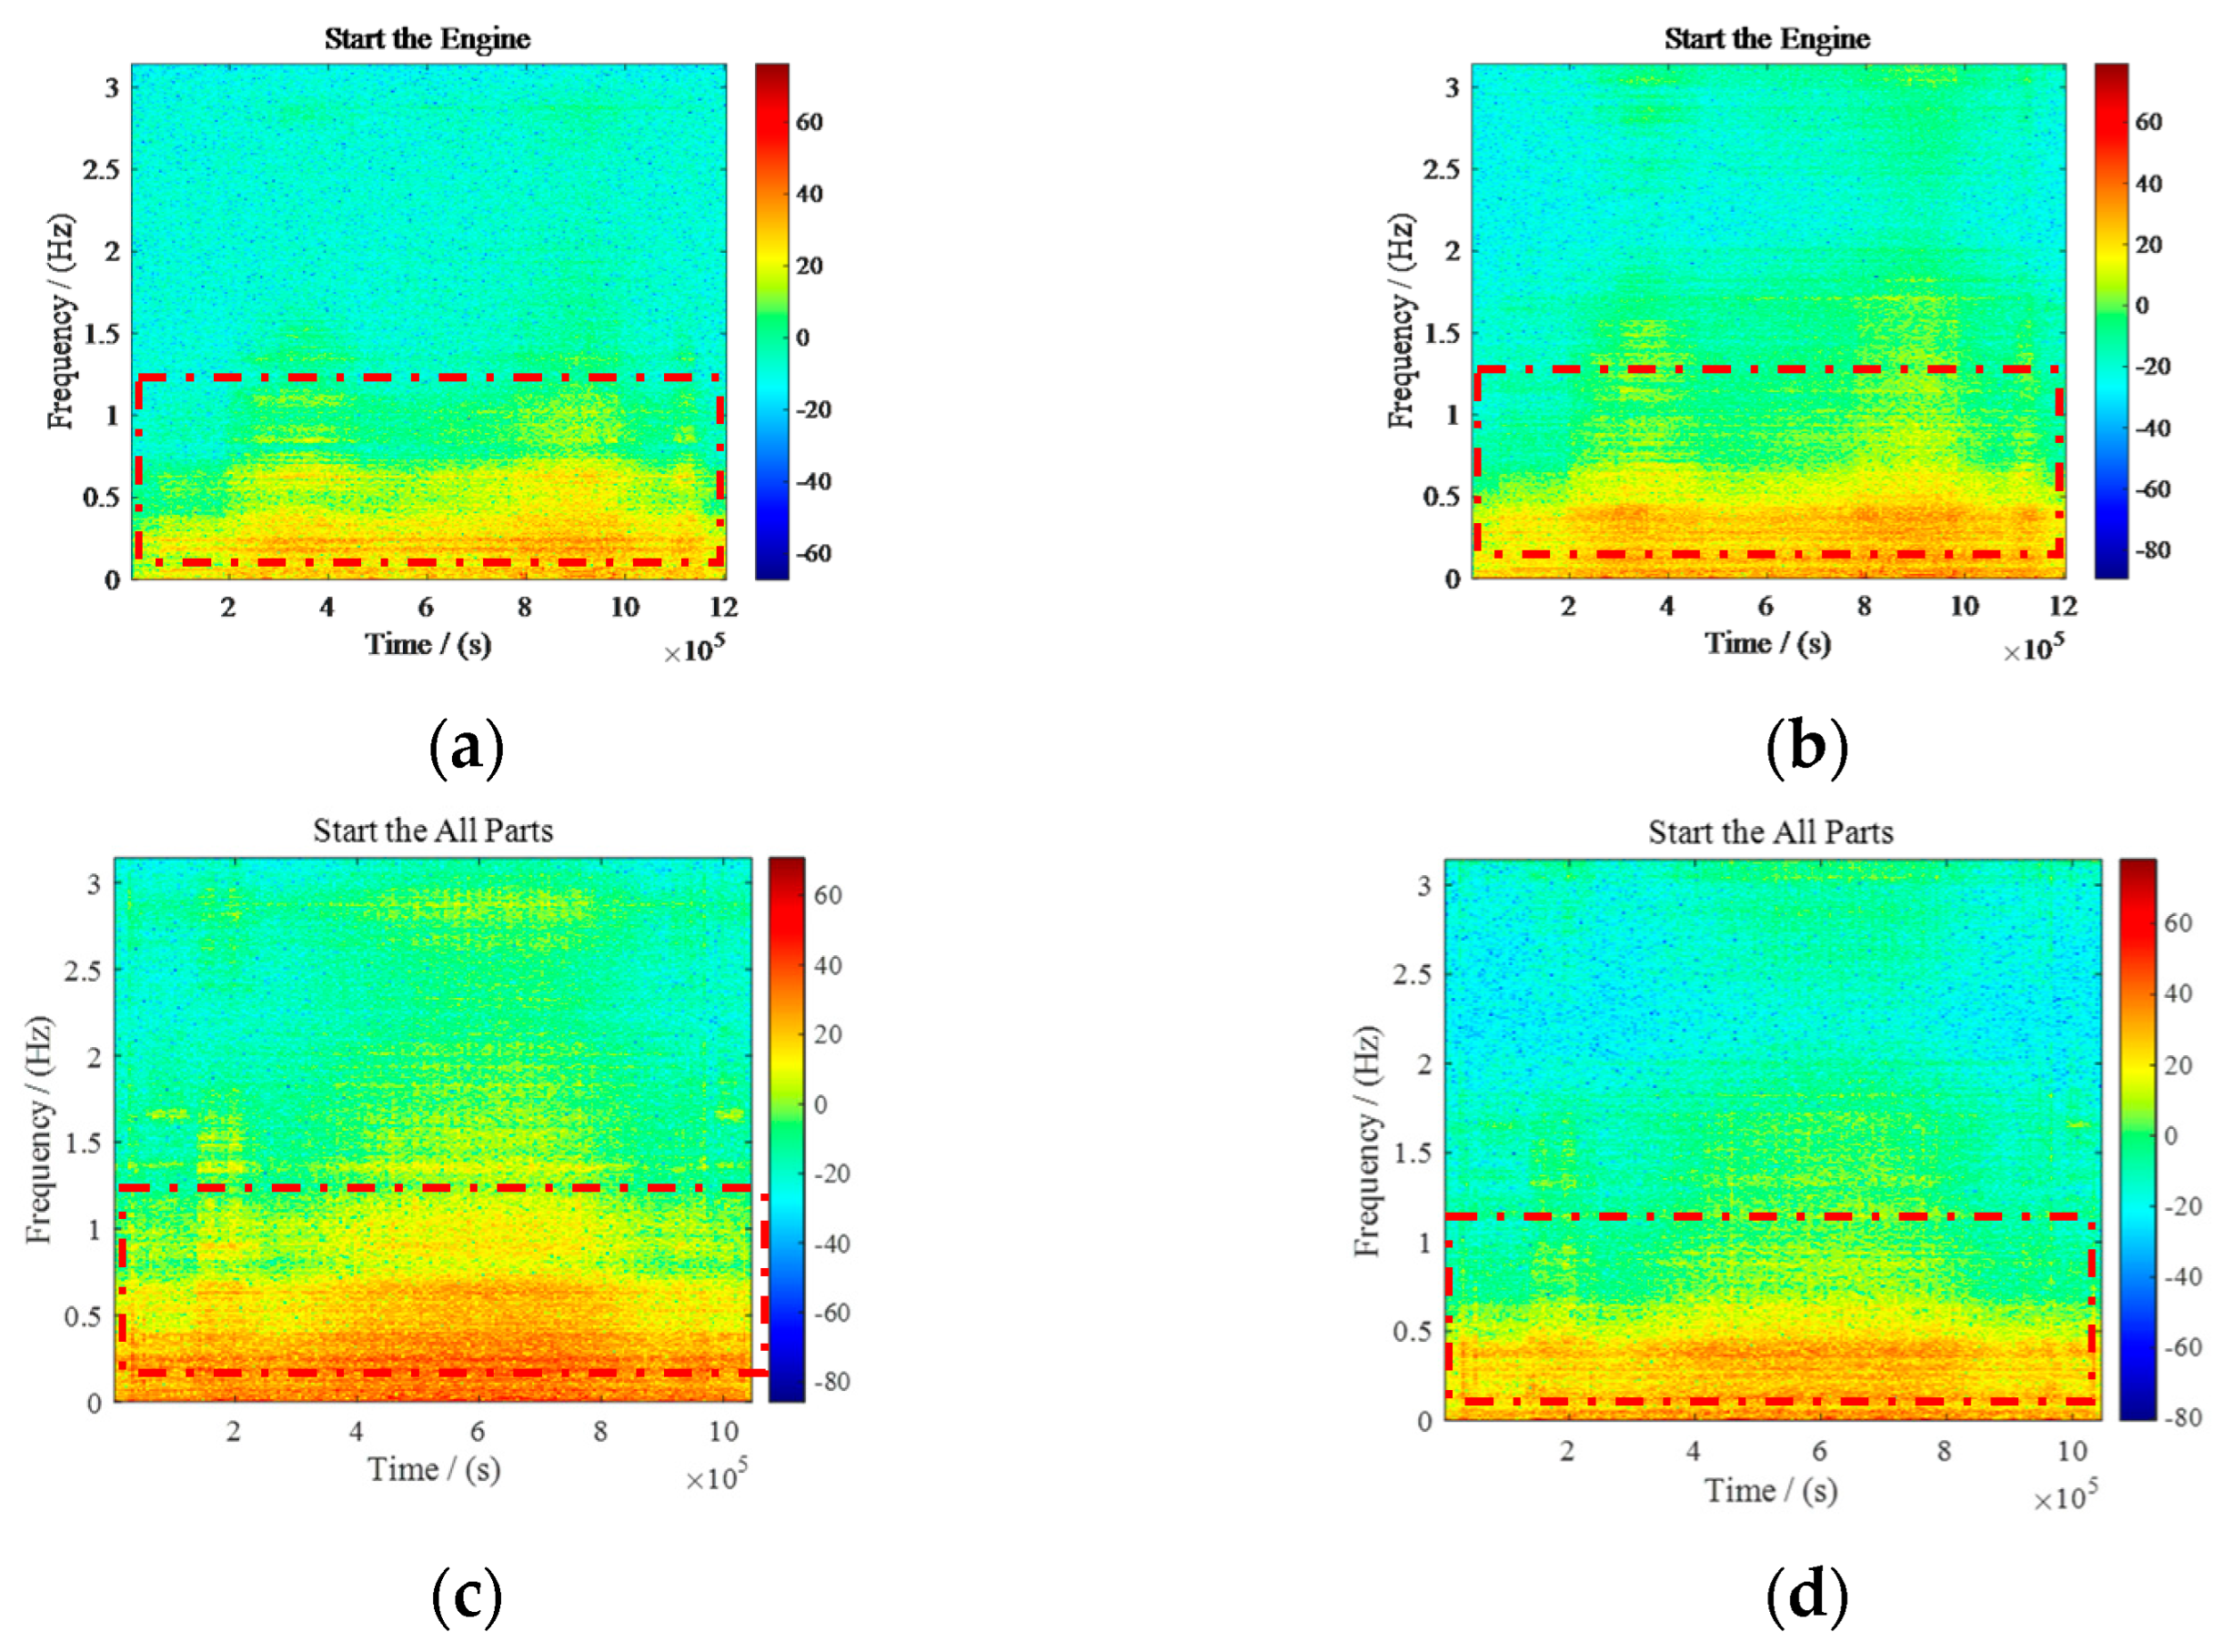
Subsequently, sample points within the range of 5,228,490–5,947,580 were selected, corresponding to the optimal working parameters of the harvester. The VLI values for the two directions of the cab door pillar were calculated, as shown in Table 1. Higher VLI values indicate stronger vibration, while lower values suggest more stable vibration conditions. Under condition b, the cab experienced severe shaking, with the VLI value being much higher than that under condition a. Specifically, the X-axis VLI value of the cab increased from 29 to 1255, and the Y-axis VLI value increased from 9.5 to 1195. The Short-Time Fourier Transform frequency-domain analysis (shown in Figure 5) revealed that the frequency information under condition b was much richer than that under condition a, especially in the X-axis direction, with significant increases in both high- and low-frequency energy.
Therefore, conducting vibration research on combine harvesters and developing targeted passive vibration reduction strategies is of great significance for improving the performance of engineering machinery.
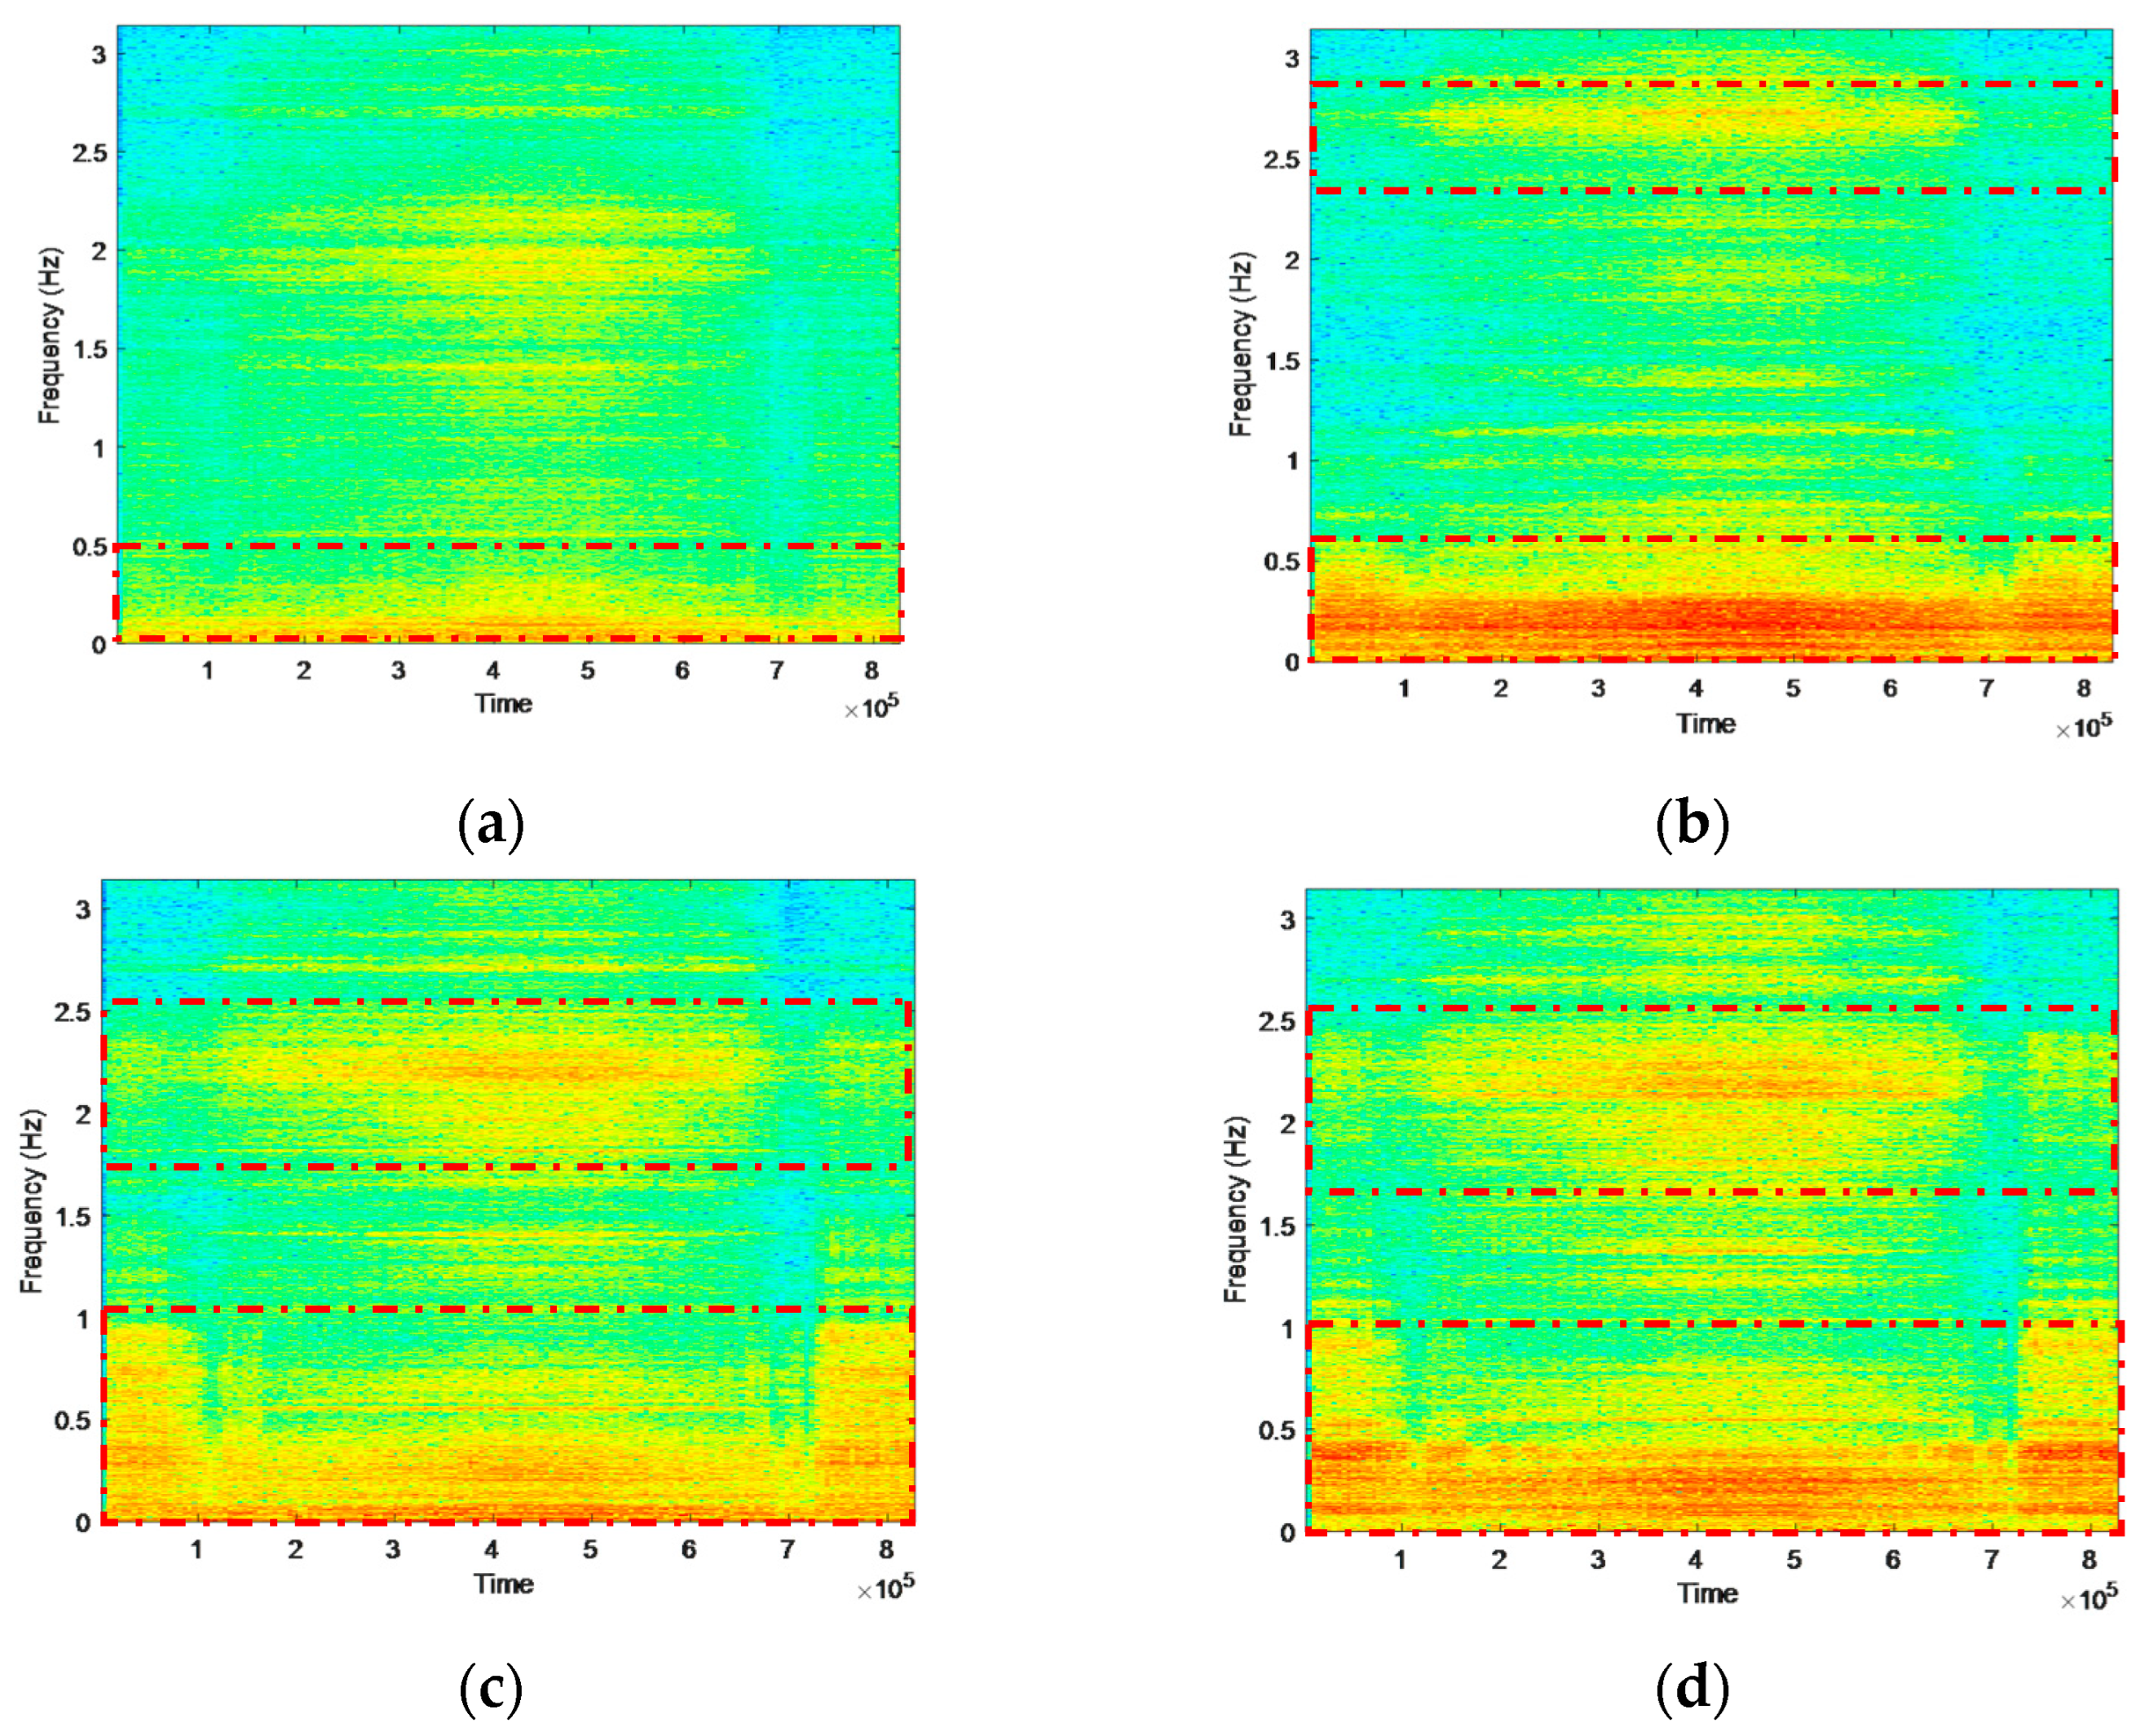
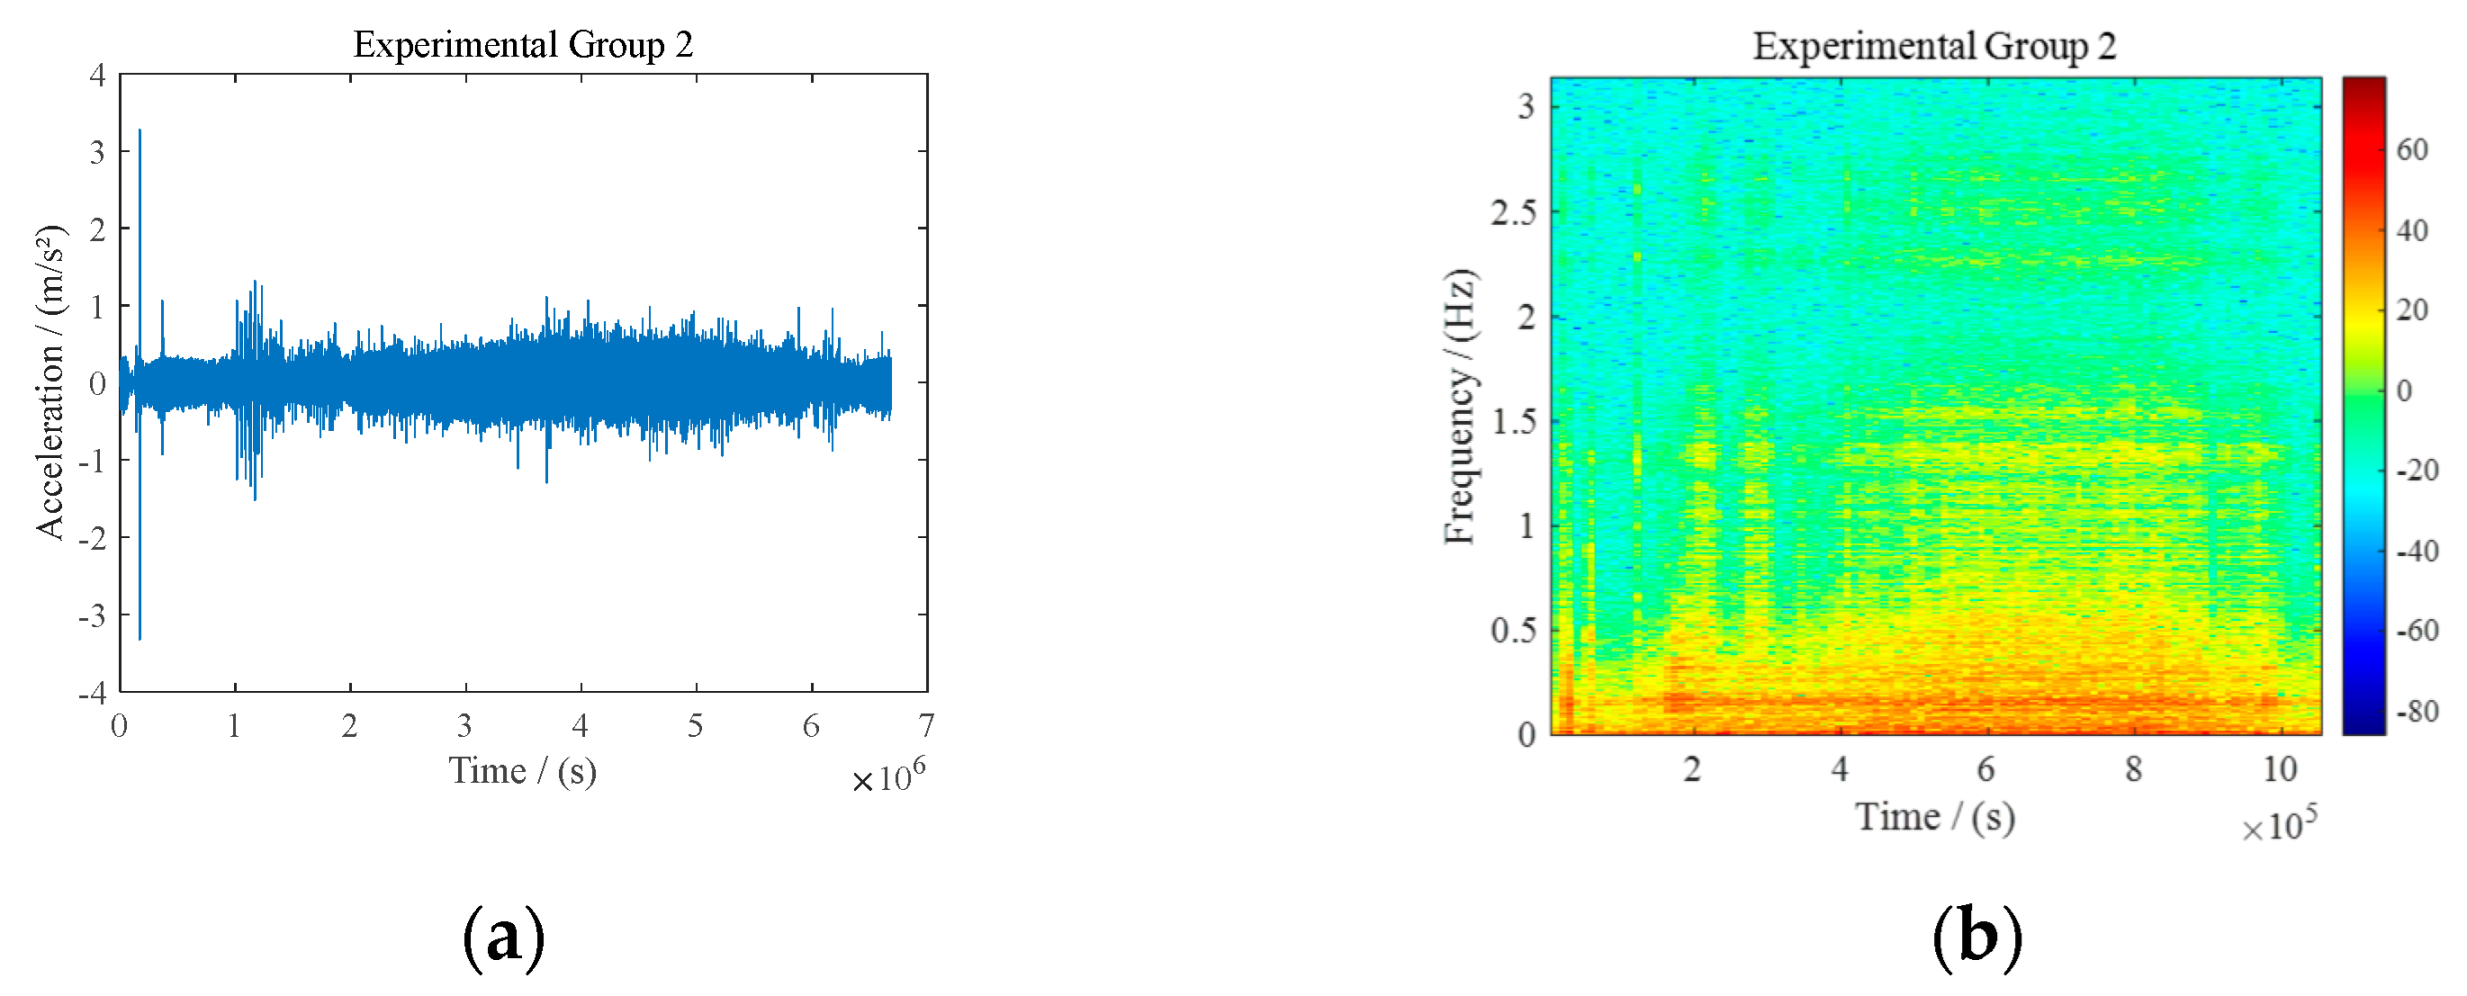
Then, the measurement signals of all sensors were analyzed using the short-time Fourier transform method, and it was found that there were four channels in the 30 s to 60 s range, the energy increased, and there were obvious resonance points, so it can be inferred that the external excitation of the vibrating screen or the grass breaker resonated with its natural frequency. The four channels are the X-axis above the vibrating screen, the external X-axis combined with the vibrating screen and the grass crusher, the Y-axis at the bottom of the vibrating screen, and the X-axis at the bottom of the vibrating screen. The four channels producing resonance have three X directions and one Y direction, so the resonance in the three X-axis directions is transmitted to the cab, causing a strong vibration sensation in the main X-axis direction of the cab door. The Short-Time Fourier Transform frequency domain diagram is shown in Figure 6:

3.2. The Shaker and the Grass Crusher Are Stimulated Externally During Normal Operation

In the previous section, frequency-domain analysis identified that the main resonant components of the combine harvester were either the vibration screen or the chopper. To further determine the specific resonant components, the external excitations of the vibration screen and the chopper were analyzed and calculated. It is known that, under the optimal harvesting conditions, the engine speed is maintained at 2400 r/min to ensure the efficiency of the combine harvester. All working components of the harvester are driven by the engine. According to the transmission ratios of the tested harvester, the transmission ratio i 1 from the engine to the vibration screen is 5.868, and the transmission ratio i 2 from the engine to the chopper is 0.67. Therefore, the operating speeds of the vibration screen and the chopper can be calculated using Equations (4) and (5):
n 1 = 2400 i 1 = 2400 5.868 = 409   r / min
n 2 = 2400 i 2 = 2400 0.67 = 3582   r / min
Based on Equation (6), the external excitation frequencies of the two components were calculated [24], as shown in Equations (7) and (8).
2 π f = 2 π n 60
f 1 = 409 60 = 6.82   Hz
f 2 = 3582 60 = 59.7   Hz
where n 1 and n 2 are the working speed of the vibrating screen and the grass crusher, respectively, in r/min; f 1 and f 2 are the working external excitation frequencies of the vibrating screen and the grass crusher, respectively, in Hz.

3.3. Modal Simulation Analysis of Vibration Screen and Grass Chopper

The external excitation frequencies of the vibrating screen and the chopper of the harvester under optimal working conditions are known to be 6.82 Hz and 59.7 Hz, respectively. To further identify the components of the harvester that are prone to resonance, the vibrating screen and chopper of the harvester were modeled in SolidWorks and imported into ANSYS software for modal simulation analysis in this section. The vibrating screen and chopper are primarily composed of a frame and metal plates. When establishing the finite element model, a mesh with quadrilateral elements as the main type was used for discretization. Triangular elements, being constant strain elements, can lead to an overly stiff model if used extensively, which affects the accuracy of the calculations. Therefore, their usage should be minimized, with the quantity generally controlled to around 10% [25]. The main material properties of the vibrating screen and chopper are shown in Table 2.
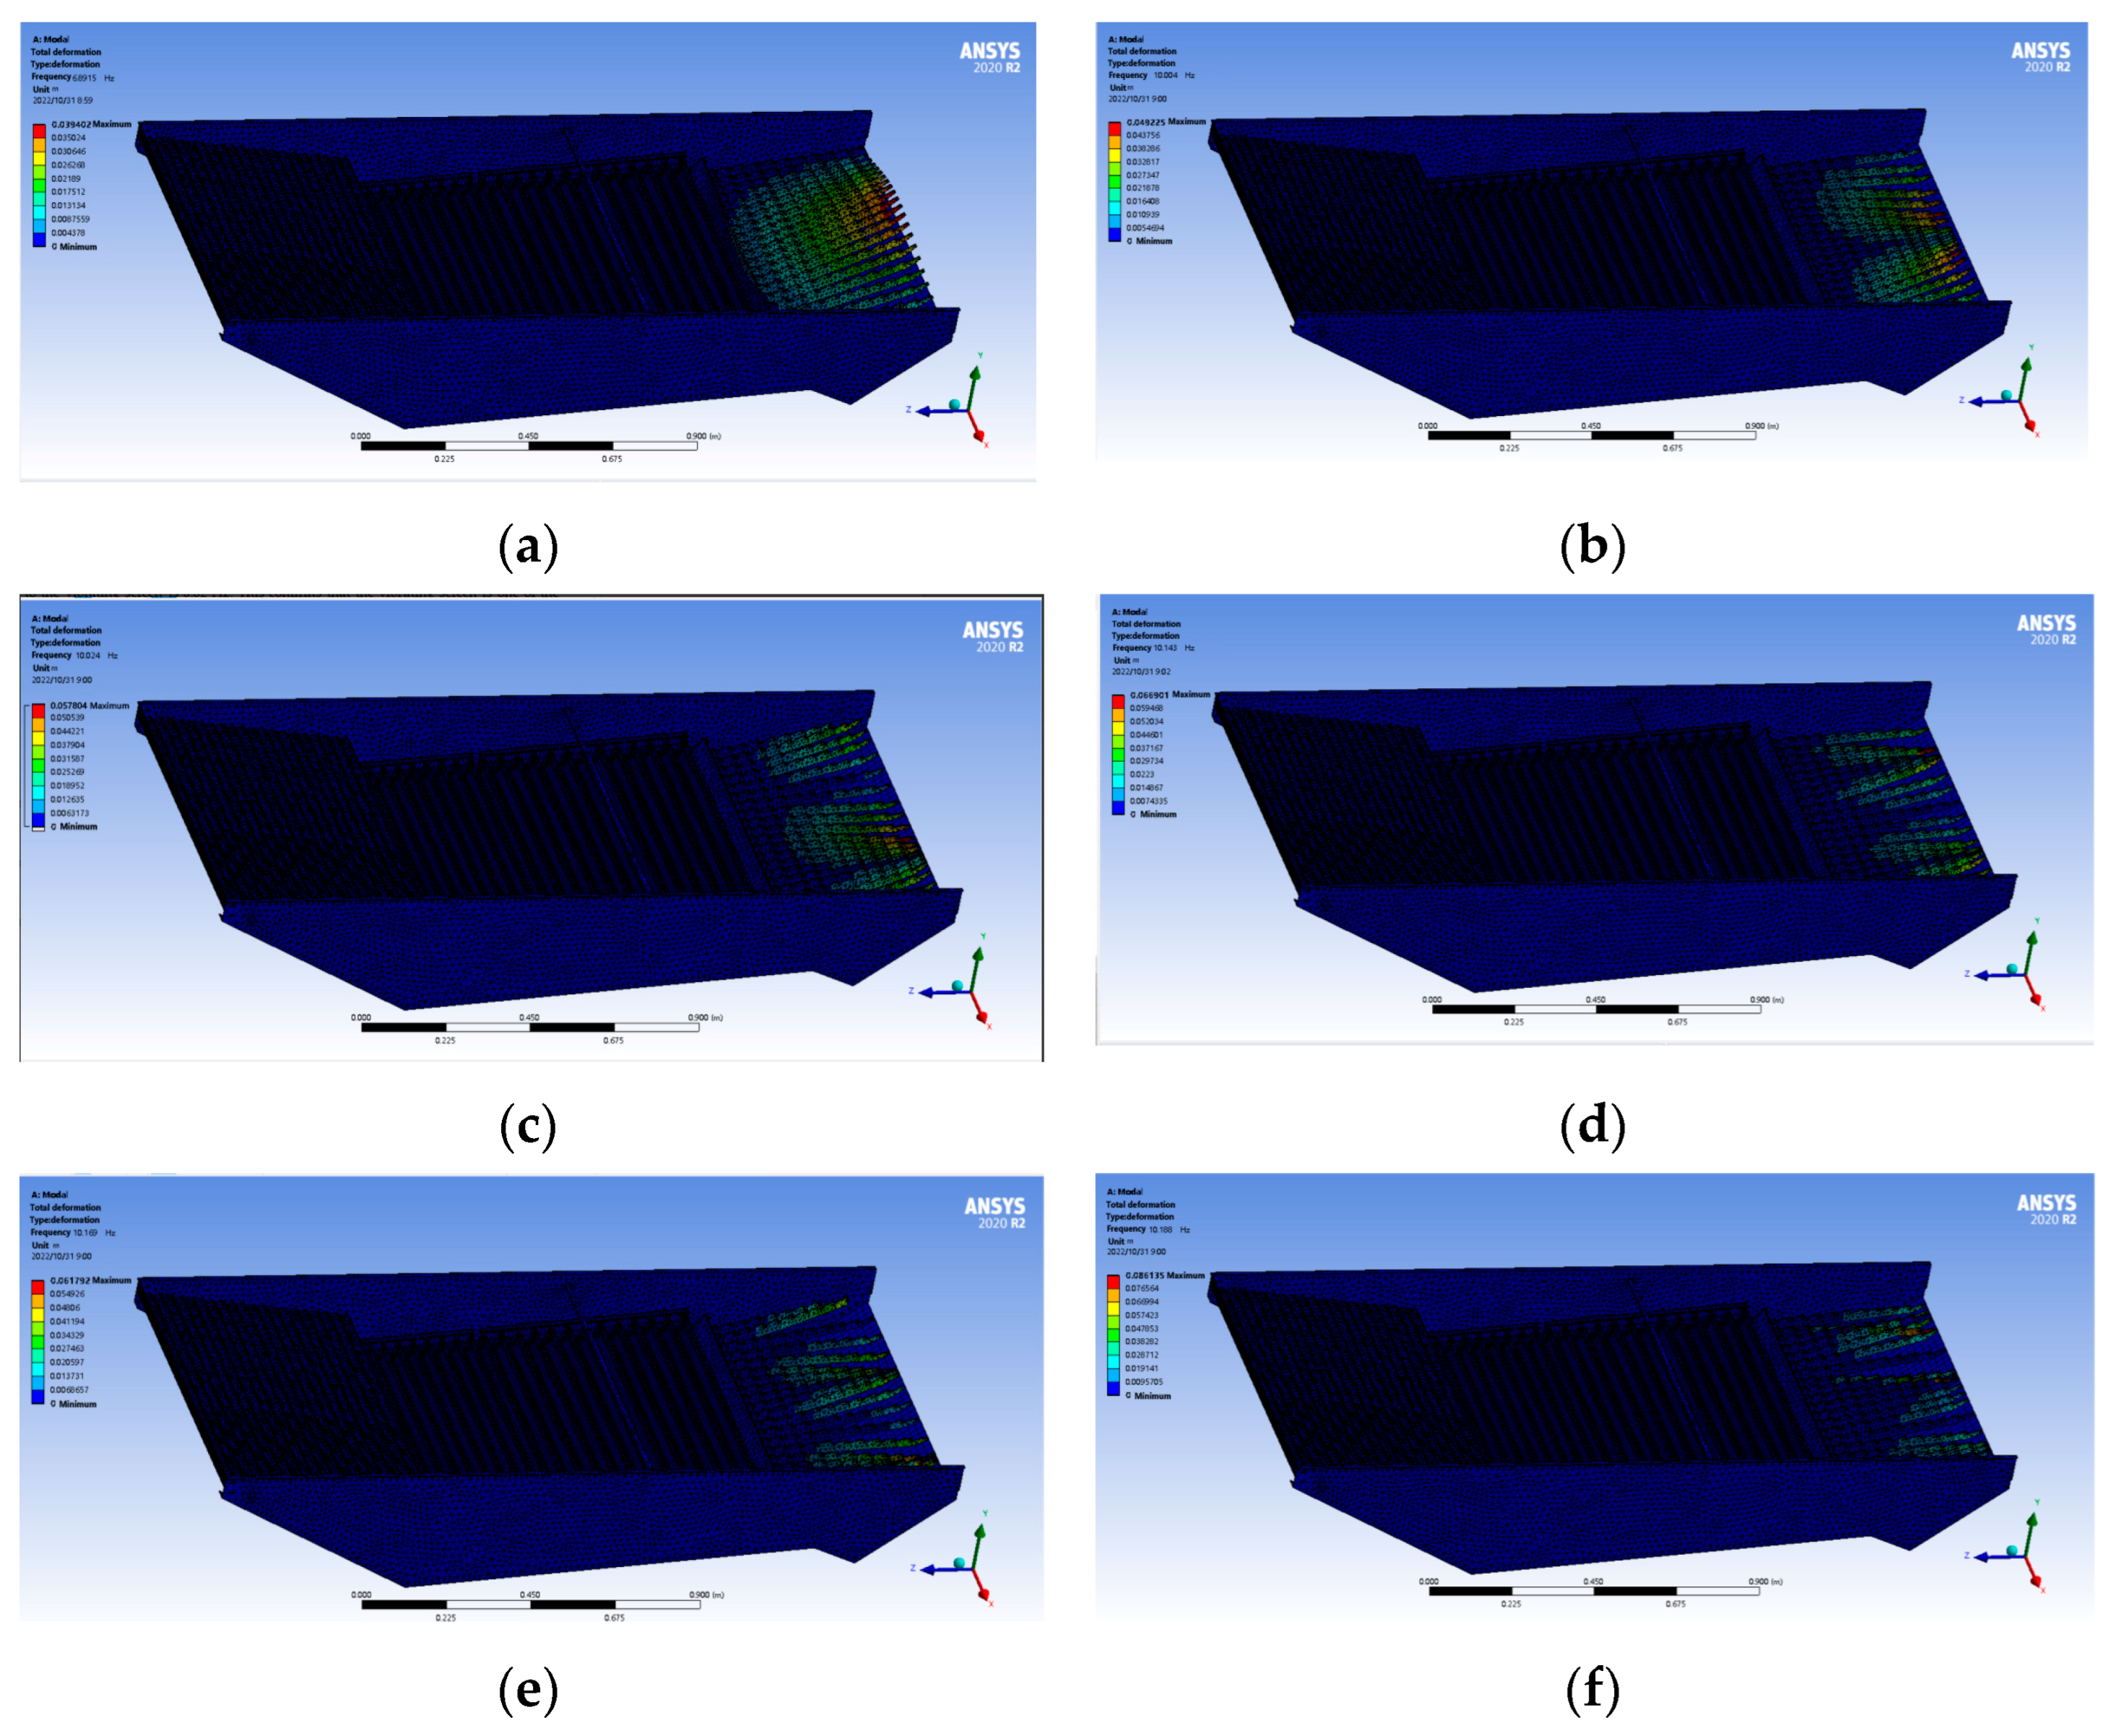
The modal displacement contour map of the vibrating screen is shown in Figure 7, and the frequencies of the first six modes are listed in Table 3. According to the modal simulation results, the displacement contour maps of the first to sixth modes of the vibrating screen all indicate that the deformation is mainly concentrated at the tail of the vibrating screen. This tail section is precisely the part connected to the drive mechanism of the vibrating screen. Therefore, it can be inferred from the contour maps that resonance occurs due to the external excitation frequency of the vibrating screen coinciding with its natural modal frequency. Combining this with the frequencies of the first to sixth modes, it is found that the first modal frequency of the vibrating screen is 6.89 Hz, while the external excitation frequency transmitted from the harvester’s engine to the vibrating screen is 6.82 Hz. This confirms that the vibrating screen is one of the resonant components of the harvester. The resonance signal generated by the vibrating screen is transmitted to the cab, causing an increase in vibration amplitude [26].
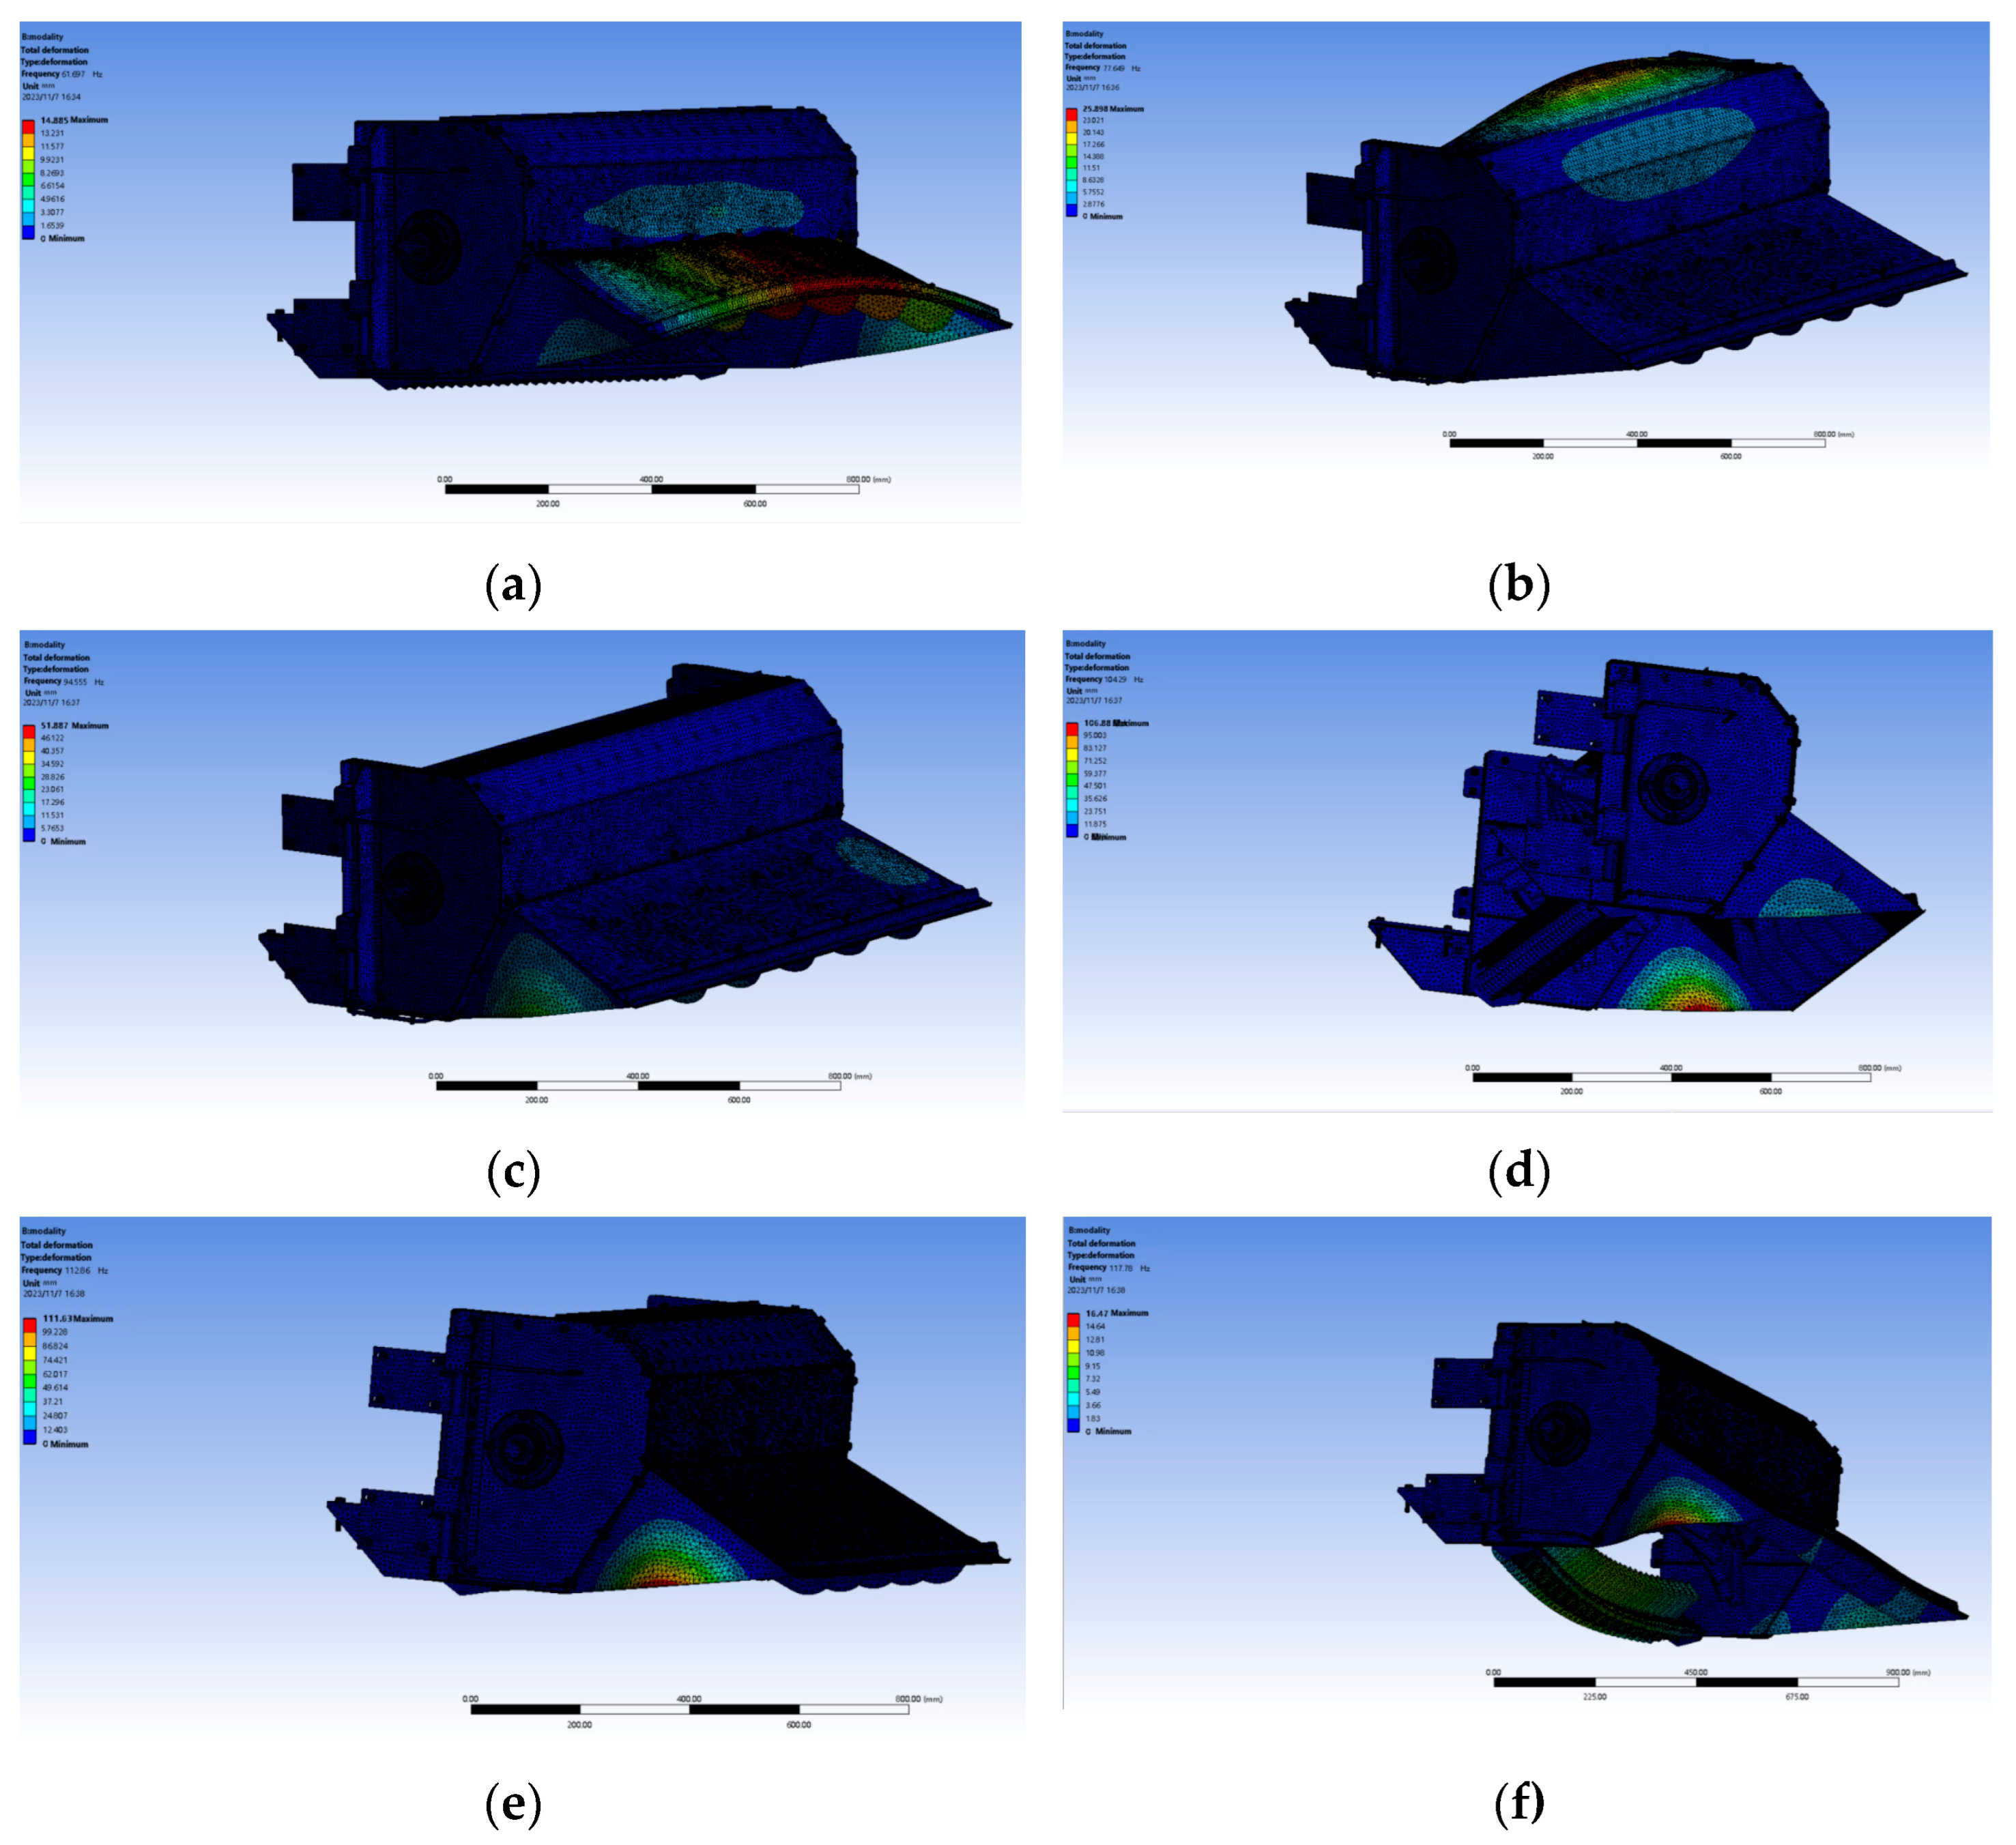
The modal displacement contour map of the chopper is shown in Figure 8, and the frequencies of the first six modes are listed in Table 4. According to the modal simulation results, the displacement contour maps of the first to sixth modes of the chopper all indicate that the deformation is mainly concentrated at the top of the chopper, specifically at the connection to the drive mechanism. Therefore, it can be inferred from the contour maps that deformation occurs in the chopper due to resonance between its external excitation frequency and its natural modal frequency. Combining this with the frequencies of the first to sixth modes, it is found that the first modal frequency of the chopper is 61.6 Hz, while the external excitation frequency transmitted from the harvester’s engine to the chopper is 59.7 Hz. This also confirms that the chopper is one of the resonant components of the harvester. The resonance signal generated by the chopper is transmitted to the cab, causing an increase in vibration amplitude [27].
Through the calculation of the external excitation frequency of the two components and the modal simulation, the resonant components of the harvester are further determined to be the vibrating screen and the grass breaker. This is a new discovery compared to the conclusion of the previous study that only the vibrating screen is considered the main vibration source and provides a theoretical basis for the harvester to reduce the vibration amount from the source.

3.4. Improvement of the Drive Pulley for the Vibrating Screen and Grass Shredder to Avoid Resonance

To address the issue of excessive vibration in the cab of the World Agricultural Machinery Company’s harvester, considering factors such as cost and time, this paper adopted the method of changing the diameter of the drive pulleys of the vibrating screen and chopper to alter their transmission ratios and external excitation frequencies, thereby avoiding resonance. The original parameters of the drive pulleys for the vibrating screen and chopper of the harvester are shown in Table 5 [28].
In order to ensure that the work efficiency of the shaker and the grass crusher meets the requirements and can avoid resonance and reduce the vibration amplitude of the cab, the parameters of the redesigned shaker drive pulley and the grass crusher drive pulley are shown in Table 6.
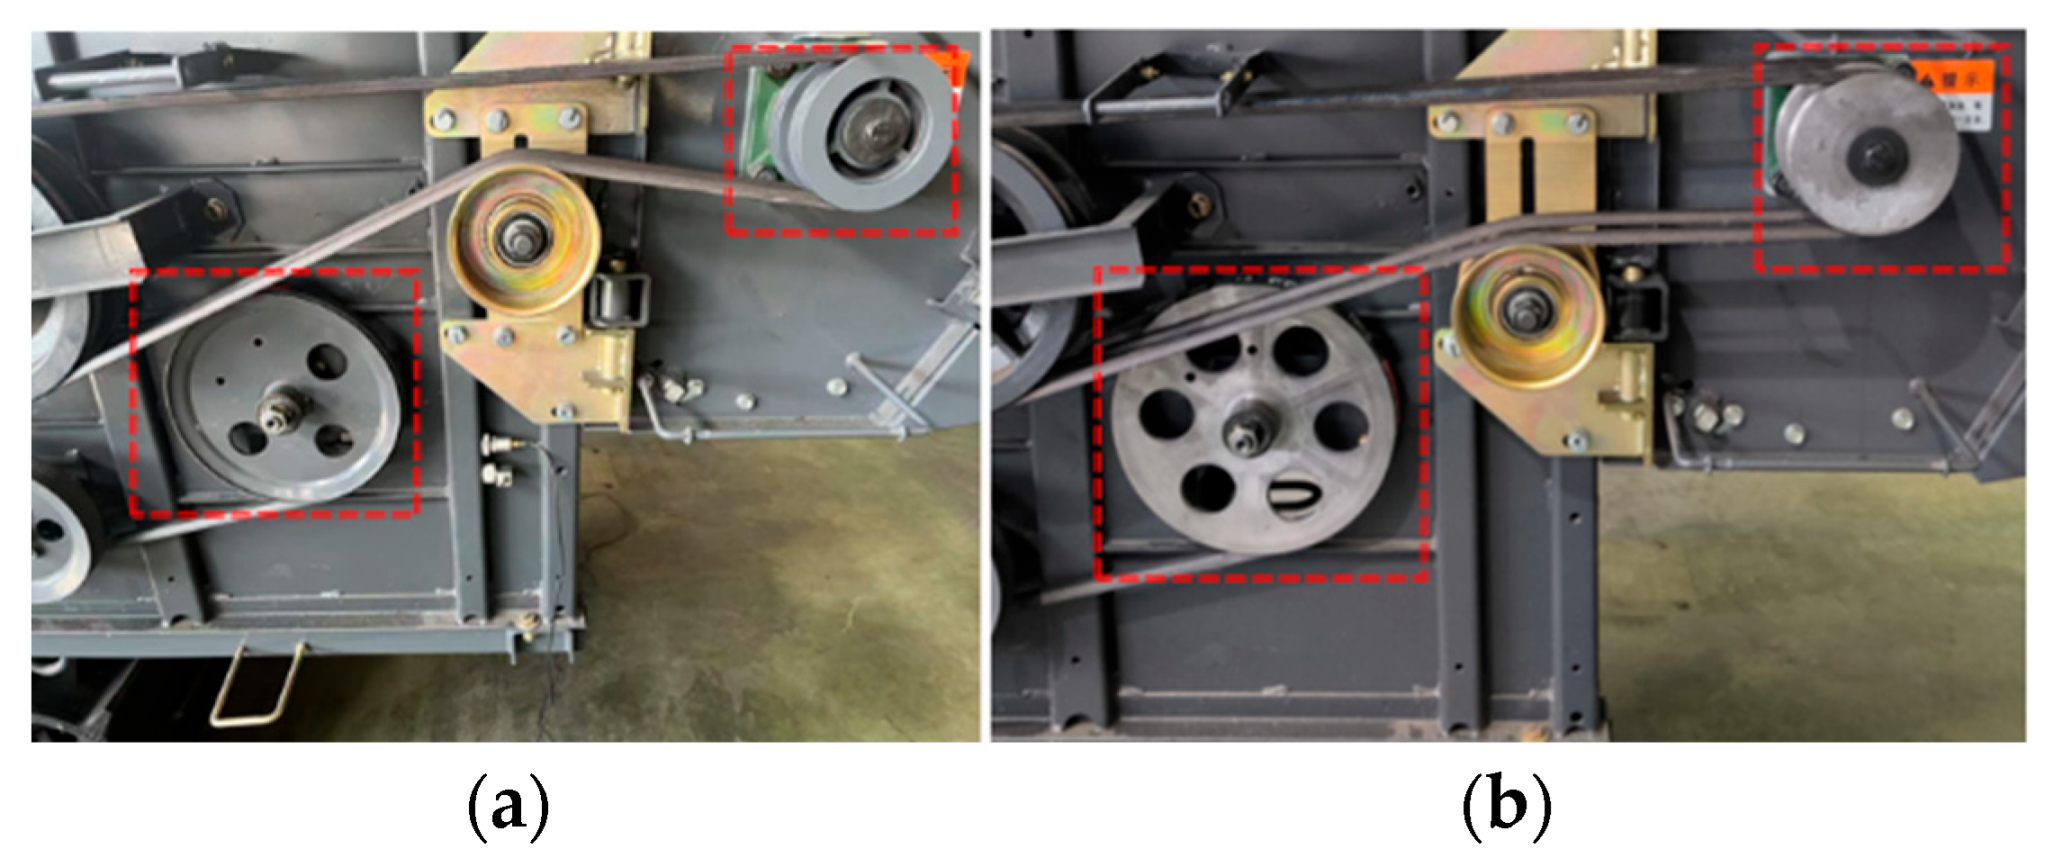
After the improvement of the harvester, the external excitation frequency of the vibrating screen was reduced from 8 Hz to 6.82 Hz, a decrease of approximately 14%. The external excitation frequency of the chopper was reduced from 59.7 Hz to 49 Hz, a decrease of approximately 17.9%. These changes effectively avoided the first-order modal frequencies of both components and were unrelated to other higher-order modal frequencies. The physical images of the harvester before and after the improvement are shown in Figure 9 [29].

3.5. Comparative Analysis of Vibration Signals Before and After Improvement

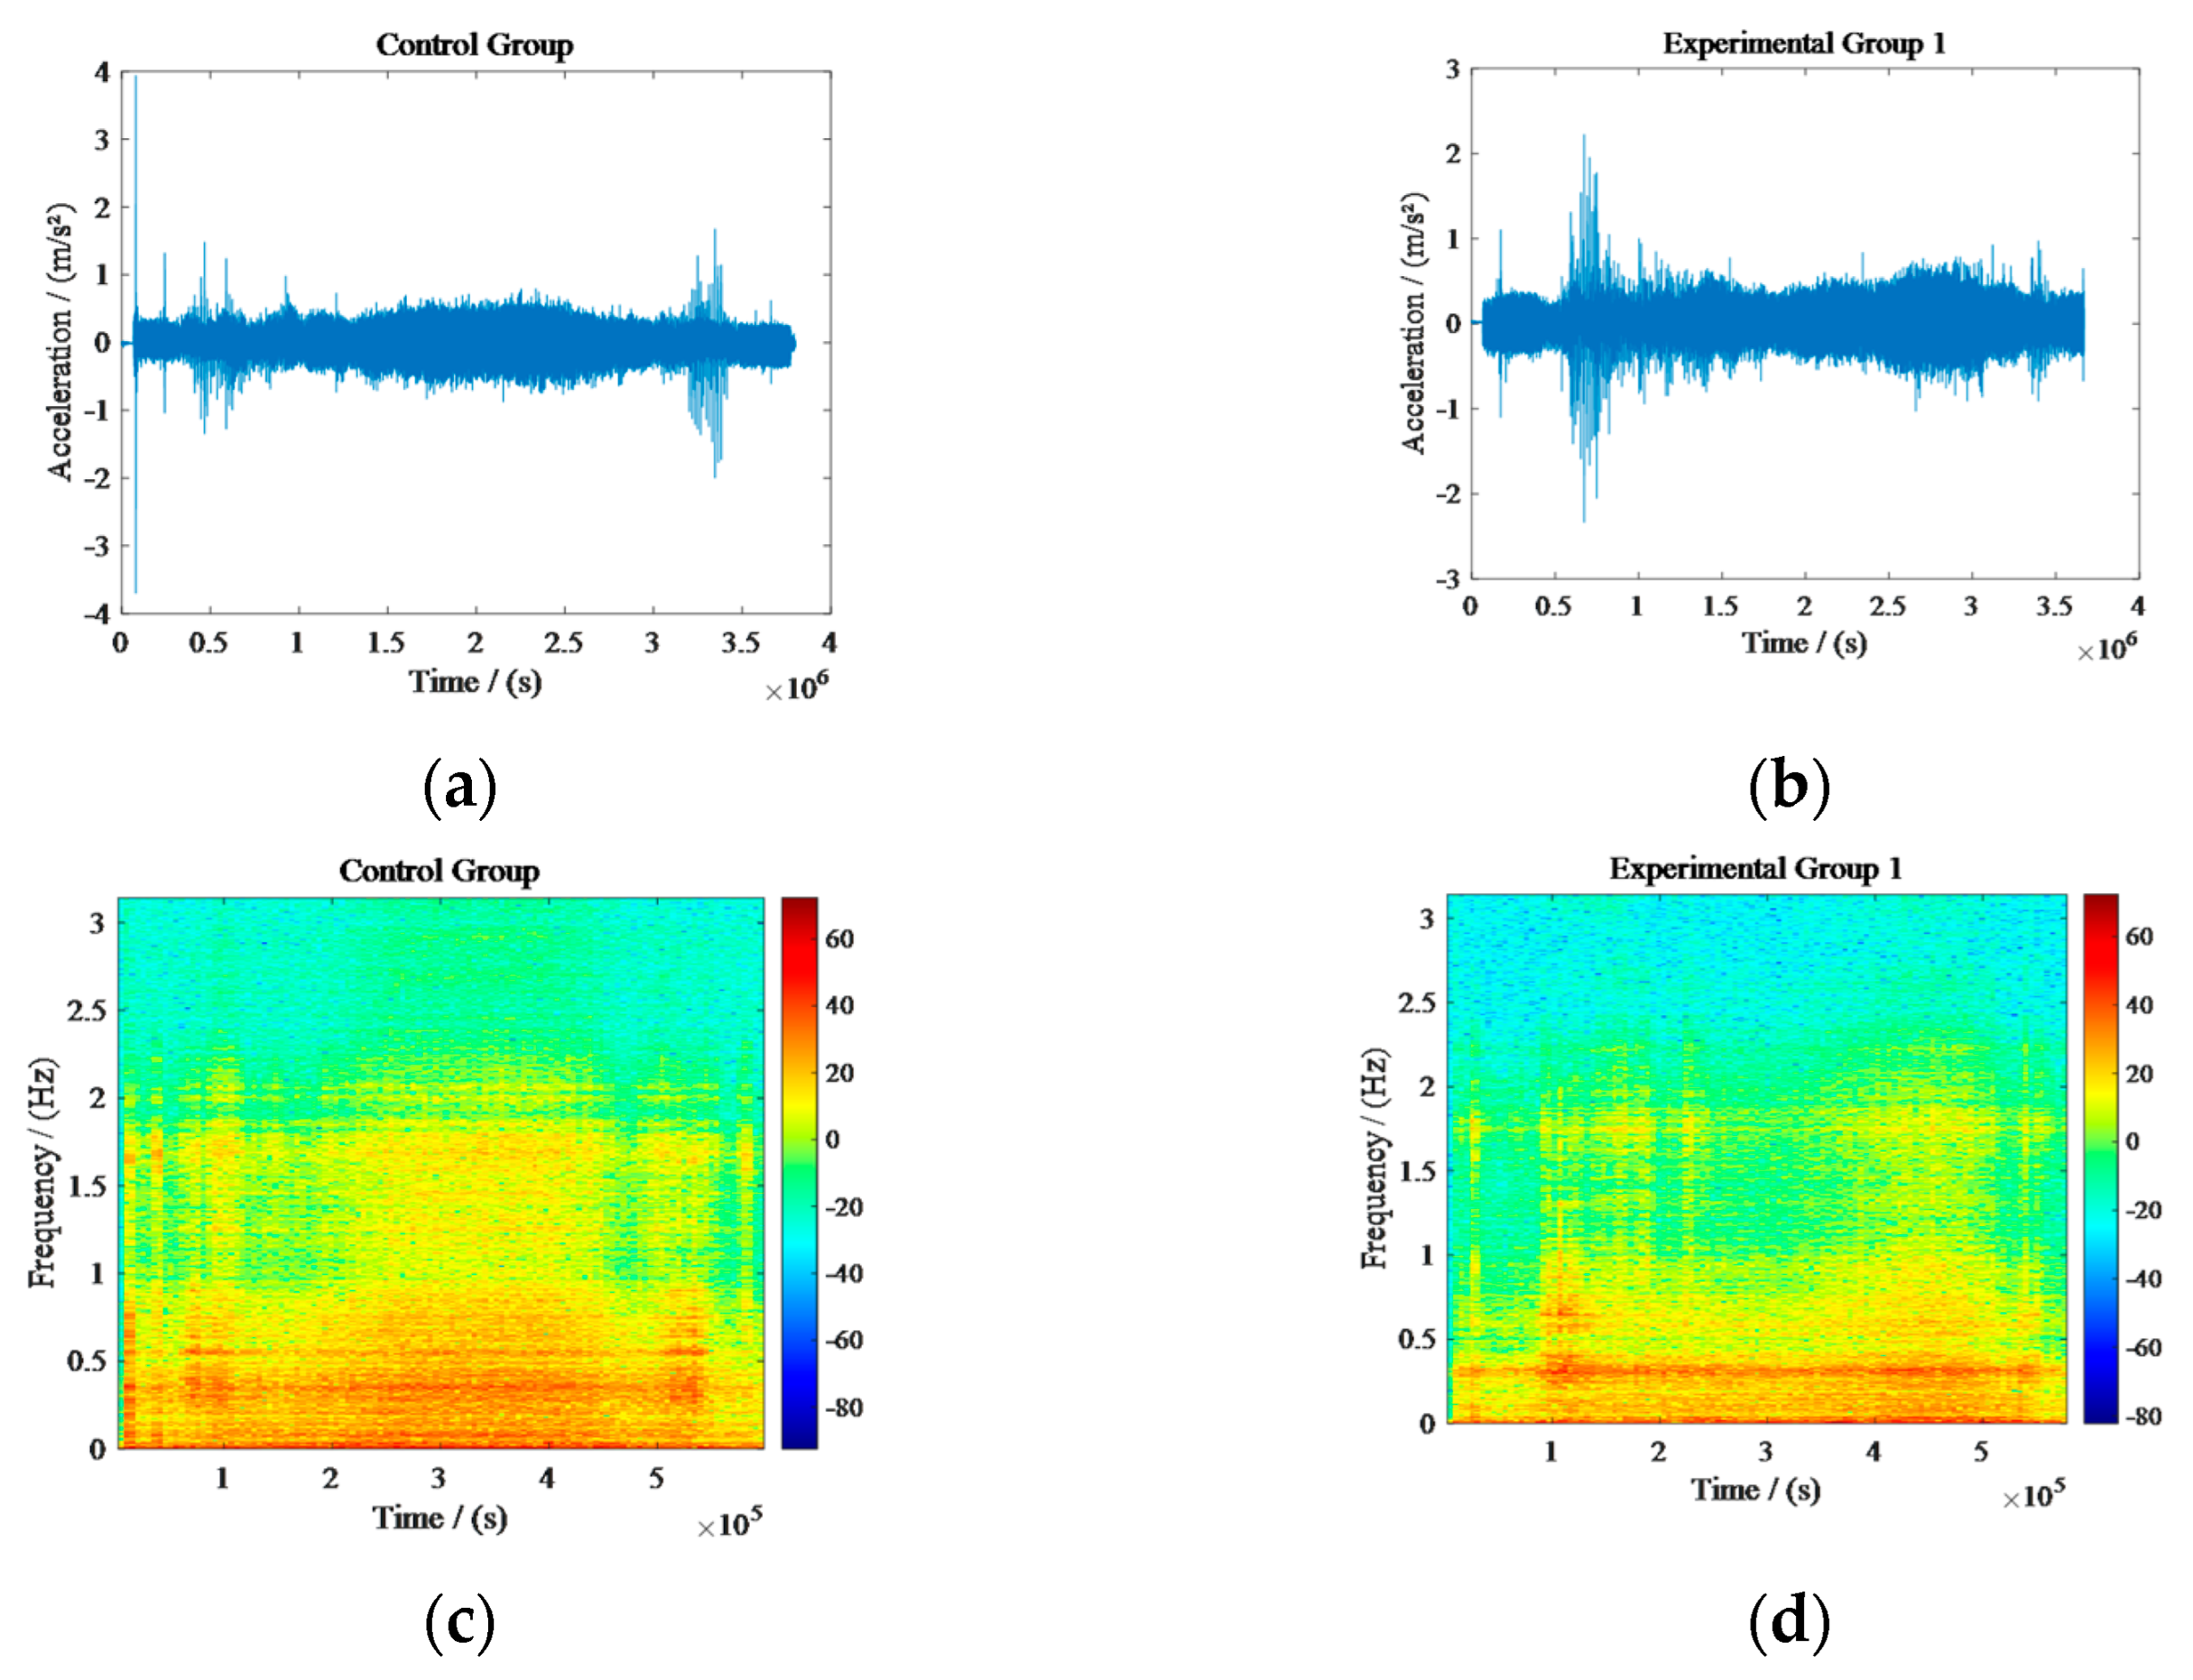
The author improved and tested the harvester in Linhai Co., Ltd. The vibration signal testing and analysis were performed on the harvester with modified pulley diameters. The test conditions were all set to Condition b. To ensure the reliability of the data and the consistency of the test conditions, vibration signal testing was first conducted on the original model of the harvester [30]. The newly designed drive pulleys were then installed for comparative analysis. The time-domain and frequency-domain vibration signal diagrams of the cab door pillar X for both the original and improved harvesters are shown in Figure 10. The VLI of the cab door pillar X for the original and improved models is shown in Table 7. The RMS values of the cab door pillar X for the original and improved models are shown in Table 7.
To further determine whether both the vibrating screen and the chopper are sources of resonance, an additional control experiment was added in this study [31]. The vibration signals of the cab were tested with only the chopper drive pulley replaced. The time-domain and frequency-domain diagrams of the X-axis of the cab door pillar are shown in Figure 11. The VLI of the cab door pillar X for the original model and the model with only the chopper pulley replaced is shown in Table 8. The RMS values of the cab door pillar X for the original and modified models are shown in Table 8.
As shown in Figure 10a,b, the overall vibration signal in the time domain of the harvester cab with both the new vibrating screen and chopper drive pulleys installed has been significantly reduced. Although a brief peak appears at the end of the time-domain signal, this is due to the sudden deceleration and stopping of the harvester during the test. To more intuitively demonstrate the reduction in vibration, the VLI was used to characterize the time-domain signals. As shown in Table 7, the VLI of the cab vibration signal decreased from 1215 in the original model to 112 after the new pulleys were installed, representing a reduction of over 90%. The RMS values are presented in Table 8, with a 26% reduction after modification. This aligns with human perception, as the author noticed a significant decrease in vibration and improved comfort when operating the harvester with the new pulleys installed.
The time-domain signals were further analyzed in the frequency domain. Figure 10c,d show that the energy in the frequency-domain vibration signal of the cab with the new pulleys is significantly reduced compared to the original harvester. The frequency-domain information is simpler, and the low-frequency resonance is more intuitively observed through the intensity of the red areas in the plots. The significant reduction in cab vibration after installing the new pulleys indicates that the resonance issue has been mitigated, and the vibration in the cab has been substantially improved.
Comparing our results with previous studies, Pang et al. [13] added vibration pads at the cab-mounting points, which reduced vibrations to some extent but did not address the root cause of excessive vibration. Zheng et al. [32] focused on vibration reduction for the header, one of the vibration sources of the harvester. In contrast, this study identified the vibrating screen and chopper as the two major vibration sources through signal analysis, with the chopper being particularly significant. As an end component of the harvester, the chopper is often overlooked but is indeed one of the main sources of resonance. Considering cost and other factors, this study achieved a vibration reduction by altering the external excitation frequency to avoid resonance. This is the first time the chopper has been identified as a major resonant component of the harvester.
Compared with Figure 10c and Figure 11b, it can be seen that the frequency domain diagram of the vibration signal of the harvester cab after the replacement of the new driving wheel of the harvester only shows a decrease in energy, and the frequency domain information is simpler than the frequency domain diagram of the original harvester. The red region of the low-frequency resonance decreases significantly, and the vibration of the harvester cab decreases significantly after the replacement of the new driving wheel of the harvester. This indicates that the resonance phenomenon of the harvester has been alleviated, and the vibration of the cab has been significantly improved. As shown in Table 8, it can be seen that the RMS value of the harvester replaced with the driving wheel of the grass breaker is 0.1576, which is 9.6% lower than that of the original model. By comparing Figure 10d and Figure 11b, it can be seen that the RMS value of the harvester replaced with the driving wheel of the grass breaker is 0.1576. At the same time, after the replacement of two new belt wheels, the deep red color in the dotted frame of the harvester becomes lighter, the resonance phenomenon is further reduced, and the RMS value is further reduced from 9.6% to 26%. It can be seen that the grass crusher and the vibrating screen are both resonant parts of the harvester.

4. Conclusions

This paper selected the Linhai 4LZ-7.0 combine harvester, which has good sales in China, as the research object for vibration source detection and vibration reduction design studies. The main research conclusions are as follows:
  • By collecting and analyzing the time-domain vibration signals of the combine harvester cab under two working conditions, it was found that after the working components of the harvester were in operation, resonance occurred and was transmitted to the cab, causing an increase in the VLI of the cab. The vibration amplitude in the X direction of the cab door pillar was particularly significant.
  • Frequency-domain analysis of the vibration signals from all sensors revealed that the energy of the frequency-domain information near the vibrating screen increased and resonance occurred. By comparing the external excitation frequencies with the modal simulation results, it was determined that the vibration sources of the harvester were the vibrating screen and the chopper. The external excitation frequencies of these two components during normal operation were 8 Hz and 59.7 Hz, respectively, while their modal frequencies were 6.89 Hz and 61.6 Hz. To avoid resonance in the simplest and most cost-effective manner, the drive pulleys of the vibrating screen and chopper were redesigned to change the external excitation frequencies to 8 Hz and 49 Hz, respectively. This effectively avoided resonance in the harvester. Additionally, the rotational speed of the vibrating screen increased from 409 r/min to 480 r/min, thereby enhancing the vibration cleaning efficiency of the harvester.
  • After replacing the drive pulleys of the vibrating screen and chopper, the VLI of the vibration signal in the X direction of the cab door pillar decreased from 1215 in the original model to 112, a reduction of over 90%. The RMS value also decreased by 26% after modification. This aligns with human perception, as the author noticed a significant reduction in vibration and improved comfort when operating the harvester with the new pulleys installed.
  • Unlike previous studies, which have sought to reduce harvester vibration by modifying cab panels or the overall chassis or by adding damping to specific sub-assemblies, this work begins with an analysis of the vibration signals at their source to identify the component most responsible for excessive cab vibration. By redesigning this single component and shifting its excitation frequency, resonance is avoided. The approach delivers an efficient reduction in vibration at minimal cost for agricultural-machinery manufacturers. Although further refinements are needed, future research will continue to explore how the dominant vibration source can be optimized even further.

Author Contributions

Methodology, data analysis, writing—original draft, visualization, formal analysis, software, conceptualization, resources: K.J.; funding acquisition, validation, supervision, writing—review and editing: Y.L. All authors have read and agreed to the published version of the manuscript.

Funding

This study was supported by the National Natural Science Foundation of China (52275251), the Natural Science Foundation of Jiangsu Province (BK20210772), the Youth Project of the Natural Science Foundation of Jiangsu Province (BK20240879), the Shandong Province Postdoctoral Innovation Project (SDCX-ZG-202400199), and the Priority Academic Program Development of Jiangsu Higher Education Institutions (PAPD-2023-87).

Institutional Review Board Statement

Not applicable.

Informed Consent Statement

Not applicable.

Data Availability Statement

The original contributions presented in this study are included in the article. Further inquiries can be directed to the corresponding author.

Conflicts of Interest

The authors declare no conflicts of interest.

References

  1. Pang, J. Vibration Source-Response Analysis and Transmission Main Path Identification of Crawler Grain Combine. Ph.D. Thesis, Jiangsu University, Zhenjiang, China, 2018. [Google Scholar] [CrossRef]
  2. Yao, Y.C.; Du, Y.F.; Zhu, Z.X.; Mao, E.R.; Song, Z.H. Modal based analysis and optimization of vibration characteristics of corn harvesting locomotive frame. Trans. Agric. Eng. 2015, 31, 46–53. [Google Scholar] [CrossRef]
  3. Wang, Y.D. Vibration Analysis and Structure Optimization of Crawler Combined Harvester Driver. Master’s Thesis, Jiangsu University, Zhenjiang, China, 2016. [Google Scholar]
  4. Chen, S.R.; Zhou, Z.P.; Tang, Z.; Lu, S. Modal vibration response of rice combine harvester frame under multi-source excitation. Biosyst. Eng. 2020, 194, 177–195. [Google Scholar] [CrossRef]
  5. Mo, H.N.; Li, S.P.; Qiu, C.; Ma, S.C.; Huang, Z.M.; Zhou, J.H. Effects of knife disc axial vibration and cutting parameters on the cutting quality of sugarcane harvester. J. Agric. Eng. 2020, 38, 62–71. [Google Scholar] [CrossRef]
  6. Yang, F.; Du, Y.F.; Li, X.Y.; Zhang, Y.A.; Mao, E.R.; Li, Z. Control and test of large spray machine combined with pavement characteristics. J. Agric. Mach. 2023, 54, 110–120. [Google Scholar] [CrossRef]
  7. Liu, C.; Chen, Z.L.; Yan, R.L. Study on vibration reduction and noise reduction of a certain construction machinery. Mech. Des. Res. 2023, 39, 102–107+123. [Google Scholar] [CrossRef]
  8. Jain, P. Design and analysis of a tractor-trailer cabin suspension. SAE Tech. Pap. 2007, 26, 47. [Google Scholar] [CrossRef]
  9. Ebrahimi, R.; Esfahanian, M.; Ziaei-Rad, S. Vibration modeling and modification of cutting platform in a harvest combine by means of operational modal analysis (OMA). Measurement 2013, 46, 3959–3967. [Google Scholar] [CrossRef]
  10. Bulgakov, V.; Adamchuk, V.; Ihnatiev, Y. Theory of Vibrations of Sugar Beet Leaf Harvester Front-Mounted on Universal Tractor. Acta Technol. Agric. 2017, 20, 96–103. [Google Scholar] [CrossRef]
  11. Aldair, A.A.; Alsaedee, E.B.; Abdalla, T.K. Design of ABCF control scheme for full vehicle nonlinear active suspension system with passenger seat. Iran. J. Sci. Technol. Trans. Electr. Eng. 2019, 43, 289–302. [Google Scholar] [CrossRef]
  12. Ma, Z.; Jiang, S.; Xu, L.Z.; Li, Y.M. Recognition methods of threshing load conditions based on machine learning algorithms. Comput. Electron. Agric. 2022, 200, 107250. [Google Scholar] [CrossRef]
  13. Pang, J.; Li, Y.M.; Ji, J.T.; Xu, L.Z. Vibration excitation identification and control of the cutter of a combine harvester using triaxial accelerometers and partial coherence sorting. Biosyst. Eng. 2019, 185, 25–34. [Google Scholar] [CrossRef]
  14. Yang, X.Z.; Zhou, J.J. Vibration Analysis and Optimization Design of Blade Discs in Compact Sugarcane Harvesters. Hubei Agric. Sci. 2022, 61, 162–165. [Google Scholar] [CrossRef]
  15. Hao, S.; Tang, Z.; Guo, S.; Ding, Z.; Su, Z. Model and Method of Fault Signal Diagnosis for Blockage and Slippage of Rice Threshing Drum. Agriculture 2022, 12, 1968. [Google Scholar] [CrossRef]
  16. Li, Y.; Tang, Z.; Wang, X.Z.; Zhang, H.; Li, Y.M. Bearing Seat Vibration Modes Undergoing Unbalanced Excitation of Multirotating Drums. Shock. Vib. 2021, 2021, 5655150. [Google Scholar] [CrossRef]
  17. Jing, J.; Sun, H.; Liang, R.; Chen, S.; Tang, Z.; He, X.; Chen, Y. Noise Testing of the Conveyor Trough Sprocket and Surface Noise Reduction Performance Evaluation of the Cavity Structure in a Combine Harvester. Agriculture 2025, 15, 1299. [Google Scholar] [CrossRef]
  18. Yuan, L.; Sun, M.; Yan, G.; Que, K.; Wang, B.; Xu, S.; Lian, Y.; Tang, Z. Experimental Study on Loosening and Vibration Characteristics of Vibrating Screen Bolts of Combine Harvester. Agriculture 2025, 15, 749. [Google Scholar] [CrossRef]
  19. Lee, S.; Jeong, H.; Kwon, J. Transformer-based GAN with multi-STFT for rotating machinery vibration data analysis. Electronics 2024, 13, 4253. [Google Scholar] [CrossRef]
  20. Gao, Y.; Yang, Y.; Fu, S.; Feng, K.; Han, X.; Hu, Y.; Zhu, Q.; Wei, X. Analysis of Vibration Characteristics of Tractor–Rotary Cultivator Combination Based on Time Domain and Frequency Domain. Agriculture 2024, 14, 1139. [Google Scholar] [CrossRef]
  21. Gao, Y.; Yang, Y.; Hu, Y.; Han, X.; Feng, K.; Li, P.; Wei, X.; Zhai, C. Study on Operating Vibration Characteristics of Different No-Tillage Planter Row Units in Wheat Stubble Fields. Agriculture 2024, 14, 1878. [Google Scholar] [CrossRef]
  22. Peter, B.; Federico, B.; Elena, C. Comparisons between Fourier and STFT multipliers: The smoothing effect of the short-time Fourier transform. J. Math. Anal. Appl. 2022, 529, 15–31. [Google Scholar] [CrossRef]
  23. Chai, X.Y.; Ma, T.L.; Liu, P.; Shi, M.L.; Zhu, L.J.; Zhang, M.; Xu, L.Z. Construction and Characteristic Analysis of Dynamic Stress Coupling Simulation Models for the Attitude-Adjustable Chassis of a Combine Harvester. Agronomy 2024, 14, 1874. [Google Scholar]
  24. Wang, B.Z.; Chen, S.R.; Wang, G.Q.; Tang, Z.; Ding, H.T. Damping Optimization Method of Combine Harvester Frame Undergoing Multi-Source Excitation. Agriculture 2024, 14, e815. [Google Scholar] [CrossRef]
  25. Tang, Z.; Li, Y.; Li, X.Y.; Xu, T.B. Rice threshing state prediction of threshing cylinder undergoing unbalanced harmonic response. Comput. Electron. Agric. 2019, 186, 323–336. [Google Scholar] [CrossRef]
  26. Wang, X.Z.; Hong, T.Y.; Fang, W.Q.; Chen, X.Y. Optimized Design for Vibration Reduction in a Residual Film Recovery Machine Frame Based on Modal Analysis. Agriculture 2024, 14, 543. [Google Scholar] [CrossRef]
  27. Wang, L.J.; Wang, W.; Du, Y.X.; Xu, L.; Huang, W.C.; Liu, J.W. Modal analysis and topology optimization of hydraulic machine rack based on ANSYS-workbench. Coal Mine Mach. 2019, 40, 79–83. [Google Scholar] [CrossRef]
  28. Tang, D.; Zhang, Z.; Hua, L.; Pan, J.C.; Xiao, Y. Prediction of cold start emissions for hybrid electric vehicles based on genetic algorithms and neural networks. J. Clean. Prod. 2023, 420, e138403. [Google Scholar] [CrossRef]
  29. Gao, J.J.; Liu, Z.Y.; Gu, W.; Zhang, F.F.; Zhu, L.P. Modal analysis and optimization of grain combine harvester undercarriage frame. Mach. Des. Res. 2023, 39, 199–205. [Google Scholar] [CrossRef]
  30. Meng, Z.; Kong, L.; Yi, J.X.; Peng, H. Optimum-pursuing method for constrained optimization and reliability-based design optimization problems using Kriging model. Comput. Methods Appl. Mech. Eng. 2024, 420, 116704. [Google Scholar] [CrossRef]
  31. Ding, Z.X.; Tang, Z.; Zhang, B.; Ding, Z. Vibration Response of Metal Plate and Shell Structure under Multi-Source Excitation with Welding and Bolt Connection. Agriculture 2024, 14, 816. [Google Scholar] [CrossRef]
  32. Zheng, G.Q.; Li, Y.M.; Ji, K.Z.; Liang, Z.W.; Ma, X. Vibration Analysis and Structural Optimization of the Cutting Platform Frame for Grain Combine Harvesters. Agric. Mech. Res. 2024, 46, 41–45. [Google Scholar] [CrossRef]
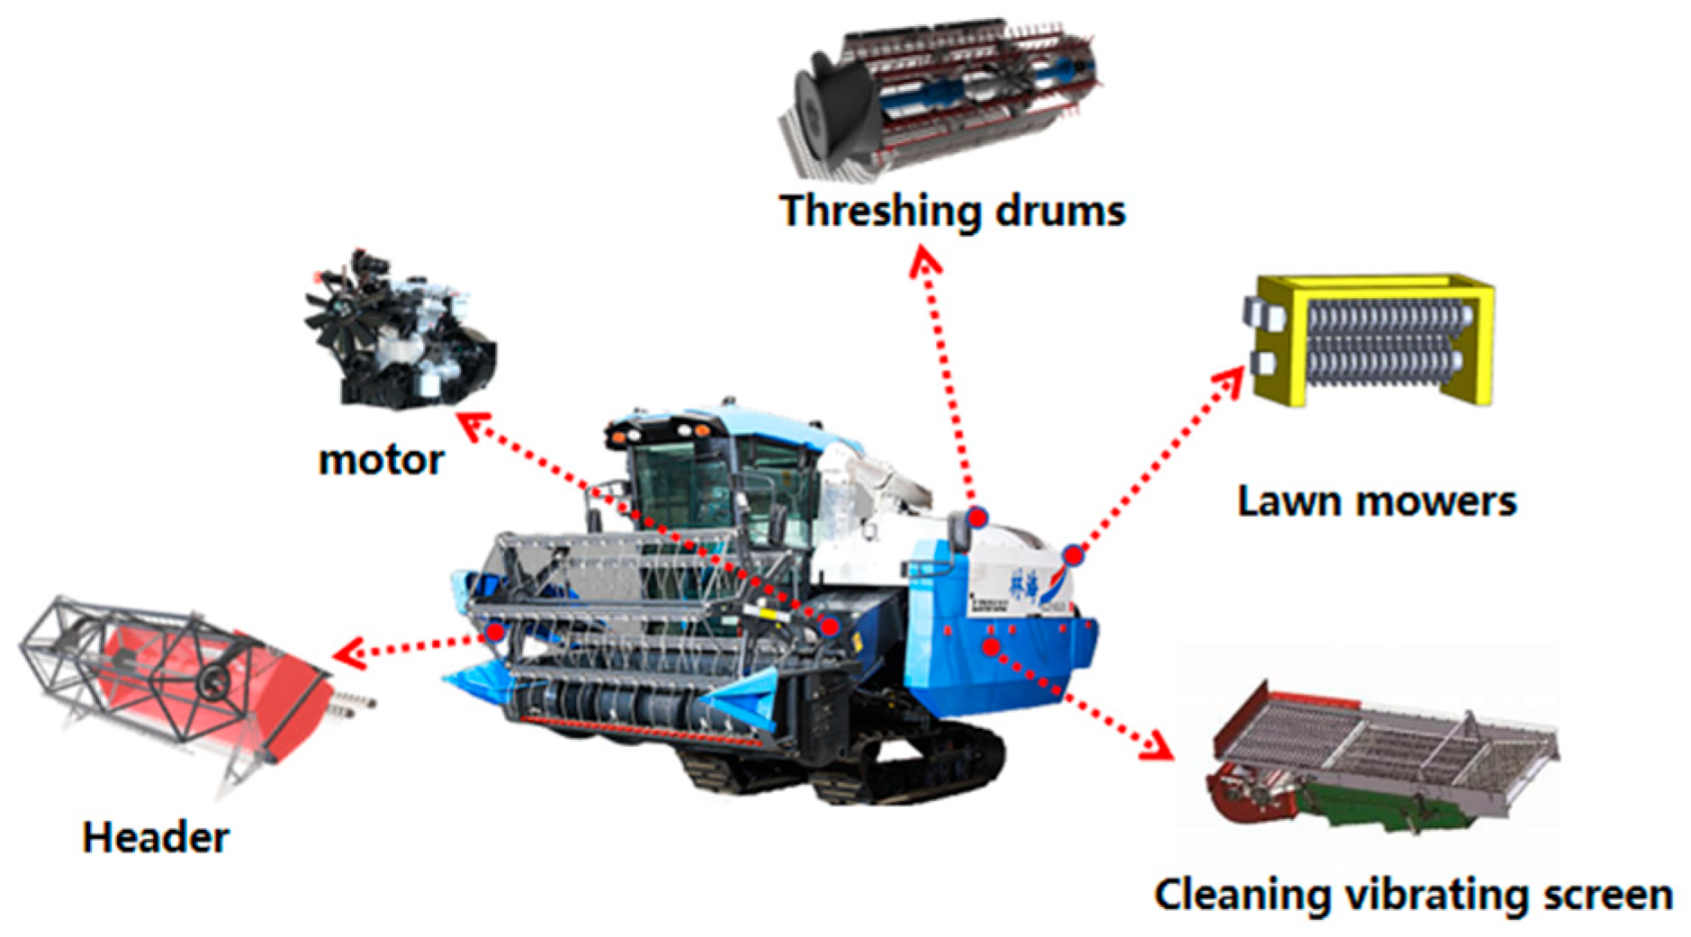
Figure 1. Flow chart for the correction of the roll forming process design.
Applsci 15 10134 g001
Figure 2. Vibration test equipment and test flow chart of the harvester.
Applsci 15 10134 g002
Figure 3. Overall flowchart.
Applsci 15 10134 g003
Figure 4. Time domain diagram of vibration signal under X-axis and Y-axis of cab door post: (a) the X-axis time domain of the cab door column in case a; (b) the Y-axis time domain of the cab door post in case a; (c) the X-axis time domain of the cab door post in the working condition b; (d) the Y-axis time domain of the cab door post in the working condition b.
Applsci 15 10134 g004
Figure 5. Frequency domain of vibration signal under the X- and Y-axes of cab door post: (a) the X-axis frequency domain of the cab door post in the working condition a; (b) frequency domain of Y-axis of cab door post in working condition a; (c) the X-axis frequency domain of the cab door post in the working condition b; (d) the Y-axis frequency domain of the cab door post in working condition b.
Applsci 15 10134 g005
Figure 6. Frequency domain diagram of the Short-Time Fourier Transform of the four channels near the sieve: (a) vibrating screen above X-axis; (b) vibrating screen and grass crusher joint X-axis; (c) vibrating screen bottom Y-axis; (d) shaker bottom X-axis.
Applsci 15 10134 g006
Figure 7. Modal displacement cloud image of vibrating screen: (a) first order; (b) second order; (c) third order; (d) fourth order; (e) fifth order; (f) sixth order.
Applsci 15 10134 g007
Figure 8. Mode displacement cloud diagram of grass-shredder machine: (a) first order; (b) second order; (c) third order; (d) fourth order; (e) fifth order; (f) sixth order.
Applsci 15 10134 g008
Figure 9. Physical picture before and after harvester improvement: (a) original belt wheel diagram of the harvester; (b) improved belt wheel diagram of the harvester.
Applsci 15 10134 g009
Figure 10. The time domain and frequency domain of the vibration signal of the harvester after two new drive wheels of the original model and the same machine: (a) X-axis cab door post time domain; (b) change in the X-axis time domain of the cab door post after two new wheels; (c) original model cab door post X-axis frequency domain; (d) change in the X-axis frequency domain of the cab door post after two new wheels.
Applsci 15 10134 g010
Figure 11. Time domain diagram and frequency domain diagram of the X-axis of the cab door post: (a) only the X-axis time domain of the driver; (b) only the X-axis frequency domain of the wheel door post replaced.
Applsci 15 10134 g011
Table 1. VLI indicators in the two directions of the cab door posts.
Working ConditionCab Door Post X-AxleCab Door Post Y-Axle
Working Condition a29.99.5
Working Condition b1.255 × 1031.195 × 103
Table 2. Main material properties of vibration shaker and grass grinder.
MaterialModulus of Elasticity (GPa)Poisson RatioDensity ((kgm3)−1)
Steel (Q235)2100.37800
Table 3. Frequencies of the six order modes.
Order123456
Frequency (Hz)6.8910.0010.0210.1310.1710.19
Table 4. Frequencies of the six order modes of the grass shredder.
Order123456
Frequency (Hz)61.677.694.5104.2112.8117.7
Table 5. Original drive pulley diameter of shaker and shredder.
The Drive Wheel of the
Vibrating Screen
Diameter
(mm)
Transmission
Ratio
Speed
(rpm)
External Excitation
Frequency (Hz)
2325.8684096.82
The Drive Wheel of the
Chopper
Diameter
(mm)
Transmission
Ratio
Speed
(rpm)
External Excitation
Frequency (Hz)
1230.67358259.7
Table 6. The improvement of the drive pulley diameter for the vibrating screen and crusher.
The Drive Wheel of the
Vibrating Screen
Diameter
(mm)
Transmission
Ratio
Speed
(rpm)
External Excitation
Frequency (Hz)
19754808
The Drive Wheel of the
Chopper
Diameter
(mm)
Transmission
Ratio
Speed
(rpm)
External Excitation
Frequency (Hz)
1320.82292749
Table 7. Indicators for the cab acceleration of the original models and improved models.
IndicatorsTypeCab Door Post X-Axle
VLIOriginal harvest machine1.215 × 103
VLIChange into the harvester behind two new belt wheels4.67 × 102
RMSOriginal harvest machine0.1744
RMSReplace only harvesters driven by grass crusher wheels0.1296
Table 8. Only replace the mower drive belt pulley and the acceleration indicator of the original cab.
IndicatorsTypeCab Door Post X-Axle
VLIOriginal harvest machine1.215 × 103
VLIChange into the harvester behind two new belt wheels4.67 × 102
RMSOriginal harvest machine0.1744
RMSReplace only harvesters driven by grass crusher wheels0.1576
Disclaimer/Publisher’s Note: The statements, opinions and data contained in all publications are solely those of the individual author(s) and contributor(s) and not of MDPI and/or the editor(s). MDPI and/or the editor(s) disclaim responsibility for any injury to people or property resulting from any ideas, methods, instructions or products referred to in the content.