1. Introduction
Vulnerable Road Users (VRUs) are a group of road users who use non-motorised modes for mobility and/or have reduced mobility functions [
1]. Compared to other road users, this group is most prone to sustaining bodily injuries in Road Traffic Crashes (RTCs) involving a four-wheeled motorised vehicle [
2]. VRUs (pedestrians, cyclists, or motorcyclists) account for over half of total RTCs worldwide [
3]. The data regarding fatal RTCs in the UK and Australia for 2021 and 2022 reveal that over 50% of the victims were VRUs [
4,
5,
6].
Numerous factors affect the occurrence and severity of RTCs, for example, environmental conditions (e.g., hostile weather), infrastructures (e.g., inadequate markings on road surfaces), vehicular characteristics (e.g., ill-serviced vehicles) or human characteristics (e.g., risk-taking behaviour or inaccurate judgement of own or others’ capacity) [
7,
8,
9]. Traffic safety research points out human errors as one of the causes of RTCs. However, non-human parameters (for example, environmental or vehicular) also influence how individuals perceive the road environment and make decisions [
8]. These factors ultimately lead the individual to take either intended or unintended actions, expressed as slips, lapses, mistakes or violations, collectively called human errors [
10]. There have been various physical and non-physical interventions to counteract or reduce human errors and improve road safety, including using automation in driving. However, will automation be enough to reduce the occurrences of pedestrian errors while they interact with AVs at road crossings?
Progress in driving automation has led to the concept of Automated Vehicles (AVs) on roads. Automation refers to the accomplishment of a task by a machine which was either carried out previously by a human or not carried out by humans as finely as compared to the machines [
11]. Some of the anticipated functionalities of AVs include sensing the environment, obeying traffic rules and guidelines and ensuring road user safety [
12]. A scenario where a VRU (for example, a pedestrian) might interact with an AV is when they are trying to cross a road or in shared spaces where VRUs and AVs interact in less formal boundaries [
13]. As AVs are a new concept and are being gradually trialled and tested on roads, some degree of uncertainty and unwillingness from pedestrians can be expected in this novel situation [
14]. A questionnaire conducted for a case study revealed that most of the sample considered fully or semi-automated vehicles to be too risky for their safety and would prefer to drive the vehicles by themselves [
15]. Currently, pedestrians use eye contact and gestures to communicate with human drivers. However, there is an absence of these human components in AVs, which makes it difficult to understand the AV’s intention [
16]. Thus, it is important to understand how pedestrians would interact with an AV in different road environments to design and develop AVs safely.
The factors causing RTCs also influence pedestrians’ risk perception and road decision-making. Risk perception is the subjective assessment and the concern towards a possible occurrence of a dangerous situation [
17]. Risk perception is dynamic and varies from person to person. Behavioural changes can be expected when there is a change in exposure towards stimuli or environmental conditions [
18]. The change in exposure can lead to a change in risk perception, either by expressing less cautious behaviour in unsafe conditions or more cautious behaviour in safer conditions [
18]. This is known as risk compensation or risk homeostasis [
19]. To make safe crossing decisions, pedestrians need to be able to perceive the true level of risk and expose themselves to acceptable levels [
20]. As decision-making is linked to risk perception, it is necessary to understand the influence of various internal and external factors on pedestrians’ road-crossing decisions.
In road-crossing contexts, risky behaviours influence decision-making [
21]. An example of a scale that is used to analyse pedestrians’ road use and crossing behaviour is the Pedestrian Behaviour Questionnaire (PBQ), which has been utilised to explain the link between behaviours and decision-making [
22,
23,
24]. Research can also benefit from gathering additional insights into pedestrians’ personality traits and how they influence their decision-making. An example of a scale that encompasses personality traits in pedestrians is the Big Five Inventory (BFI) by John and Srivastava [
25,
26,
27,
28].
In short, researchers need to understand not only what external factors affect pedestrians’ road crossing decisions while interacting with AVs but also how their behaviour and personality traits influence the decisions they make. This leads to the following section explaining the rationale of the present study.
5. Results
5.1. Demographics
Table 3 shows a breakdown of participants based on their age, gender, and location.
The number of responses for the two countries was imbalanced; thus, a cultural comparison was not performed. However, given that both are English-speaking countries with similar traffic rules and regulations, the combined data was included in further analysis. We also did not find significant differences in crossing intentions between genders.
5.2. Analysis Conducted on the Crossing Decisions
First, analysis was conducted on the whole sample to find out the influence of all the selected factors on the Likert scale responses for road crossing decisions. We conducted a 2 (road gradient: uphill vs. downhill) X 2 (weather: sunny vs. rainy) X 2 (distance between AV and pedestrian: 80 vs. 40 m) X 2 (type of AV: small car vs. lorry) ANOVA. It revealed that participants were willing to cross the road the most in the scenario where a small, automated car approaching from 80 m away was travelling up a hill towards them on a sunny day, on a scale ranging from 1 to 20 (Mean = 13.5, SD = 5.6).
The scenario with the exact opposite modalities, i.e., a lorry travelling down a hill towards the participant from 40 m away from them on a rainy day, was the scenario where most participants were less willing to cross (Mean = 6.0, SD = 5.7).
Second, the effects of all the factors on crossing decisions were found to be significant at
p < 0.001 with varying effect sizes. A
value equal to or more than 0.14 signifies a large size effect, equal to or more than 0.06 signifies a medium size effect, and less than that signifies a small size effect [
59].
Table 4 shows that road gradient, weather and distance had a large effect size, whereas the type of vehicle had a medium effect size on the crossing decision.
Thirdly, pairwise comparisons were conducted to analyse the relations between the sub-dimensions as per Anderson’s experimental protocol. It revealed three significant interactions between the sub-dimensions and their combinations as listed below.
We only list the significant interactions for the sake of brevity.
Between road gradient and longitudinal distance, F (1, 280) = 11.172,
p < 0.001,
= 0.038. Pairwise comparisons showed that when the AV was travelling up the hill and the distance was 80 m, participants were more willing to cross the road. See
Table 5.
Between the weather and longitudinal distance, F (1, 280) = 4.919,
p = 0.027,
= 0.017. Pairwise comparisons showed that when the weather was sunny and the longitudinal distance between the AV and the pedestrian was 80 m, participants were more willing to cross the road. See
Table 6.
Between all four factors (1, 280) = 5.008,
p = 0.026,
= 0.018. It was found that participants preferred when the AV was a small car, travelling uphill on a sunny day and 80 m away from them while crossing a road. See
Table 7.
5.3. Clustering Based on Crossing Decisions
Following the analysis of the whole sample, a clustering analysis was performed on the Likert scale responses for road crossing decisions.
A three-cluster solution was adopted to classify the participants into distinct clusters based on their varying decisions to either cross or not cross a road in the sixteen scenarios.
Table 8 shows the demographics in each cluster.
For all the clusters and factors, uphill, sunny, 80 m and small car modalities have the highest mean values, indicating that these were the preferred factors. However, for participants in cluster 2, the lorry was found to have a minor preference over small cars. The table can be found in
Appendix B.
We did not explore socio-demographic differences within the clusters for two reasons. First, we did not find significant effects of socio-demographic variables on crossing intentions in the overall sample. Second, splitting the clusters further would have resulted in highly uneven group sizes, especially due to the gender imbalance in clusters 2 and 3.
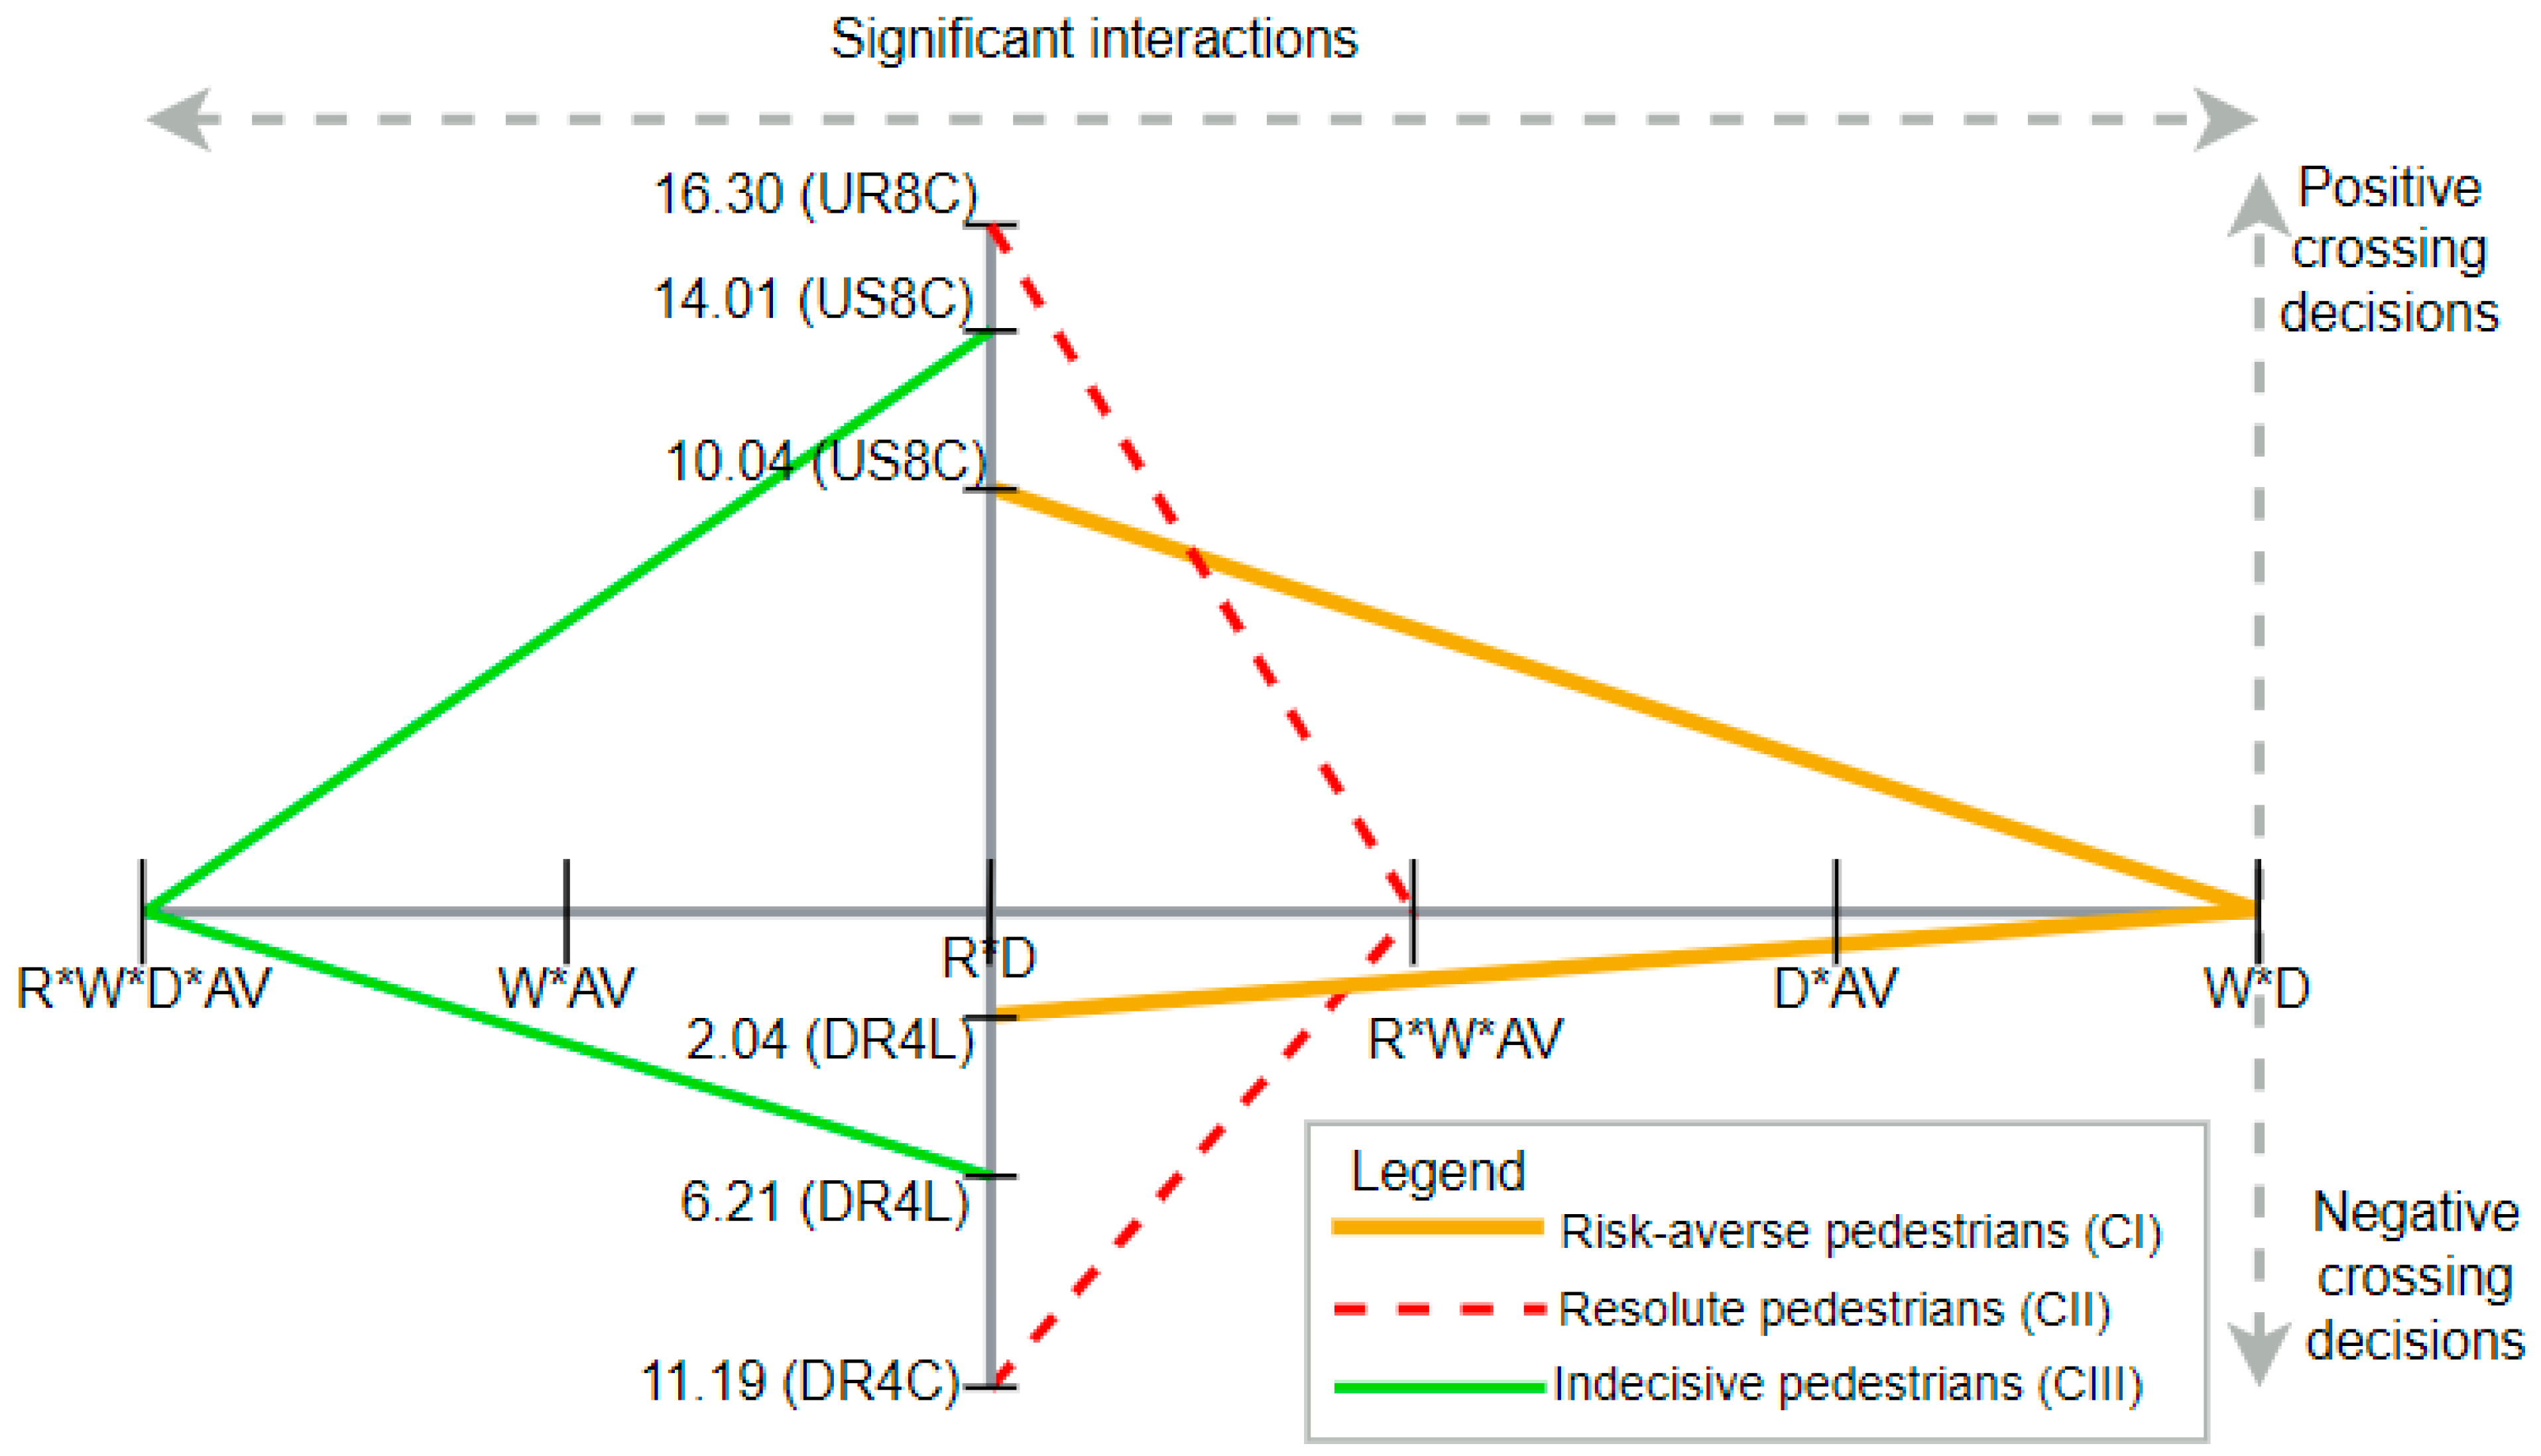
Figure 2 is a line drawing to visualise the mean values of crossing decisions on the Y-axis (on a scale of 1–20) of scenarios with the most and least ratings. Only the significant interactions among the factors are marked on the X-axis. The interactions marked on the X-axis under the coloured lines representing three different clusters show the significant interactions for each cluster, respectively.
The “positive crossing decisions” on the positive Y-axis refer to the Likert-scale rating for scenarios with the significantly highest likelihood of crossing. The “negative crossing decisions” on the negative Y-axis refer to the Likert-scale rating for scenarios with the significantly lowest likelihood of crossing.
For example, risk-averse pedestrians (yellow lines) were the most willing to cross the road in scenario-US8C with a mean response rating of 10.04 on a 20-point scale, whereas they were the least willing to cross the road in scenario-DR4L with a mean response rating of only 2.04 on the same scale.
The full configurations of the scenarios are provided in the figure caption. Additionally, for the same cluster of participants, only the four interactions: R*D, R*W*AV, D*AV, and W*D (the interactions listed in the X-axis bounded by the yellow line) significantly affected their road crossing decision. The other two clusters, represented by red and green lines, can be interpreted similarly.
On the X-axis, R means road gradient, W means weather, D means longitudinal distance between the AV and the protagonist, and AV means the type of vehicle. On the Y-axis, UR8C stands for Uphill, Rainy, 80 m and Small Car, US8C stands for Uphill, Sunny, 80 m and Car, DR4L stands for Downhill, Rainy, 40 m and Lorry, and DR4C stands for Downhill, Rainy, 40 m and Small Car.
The Standard Deviation (SD) values for crossing decisions in each cluster can be found in
Appendix C.
5.3.1. Cluster 1: Risk-Averse Pedestrians
The first cluster (n = 52) was composed of participants who were, in general, the most reluctant to cross the road under any conditions.
Thus, this group of people were called
risk-averse pedestrians. ANOVA revealed significant interactions (individual and between factors) in this cluster, as shown in
Table 9.
5.3.2. Cluster 2: Resolute Pedestrians
Cluster two (n = 27) was found to be the most distinct among the three clusters because participants in this cluster expressed comparatively positive crossing decisions.
This cluster was thus named
resolute pedestrians. There were no significant effects for any of the factors in this cluster at the individual level. However, there were two significant interactions between the factors, as shown in
Table 10.
5.3.3. Cluster 3: Indecisive Pedestrians
Cluster three (n = 202) was composed of participants with characteristics similar to those of risk-averse pedestrians, but the effect size of all four factors was lower for them. In contrast, the highest and lowest means of crossing decisions were higher compared to those of the first cluster. They were named
indecisive pedestrians. This was the only cluster of participants for whom the interaction effect of all four factors was significant. ANOVA revealed significant interactions (individual and between factors) in this cluster, as shown in
Table 11.
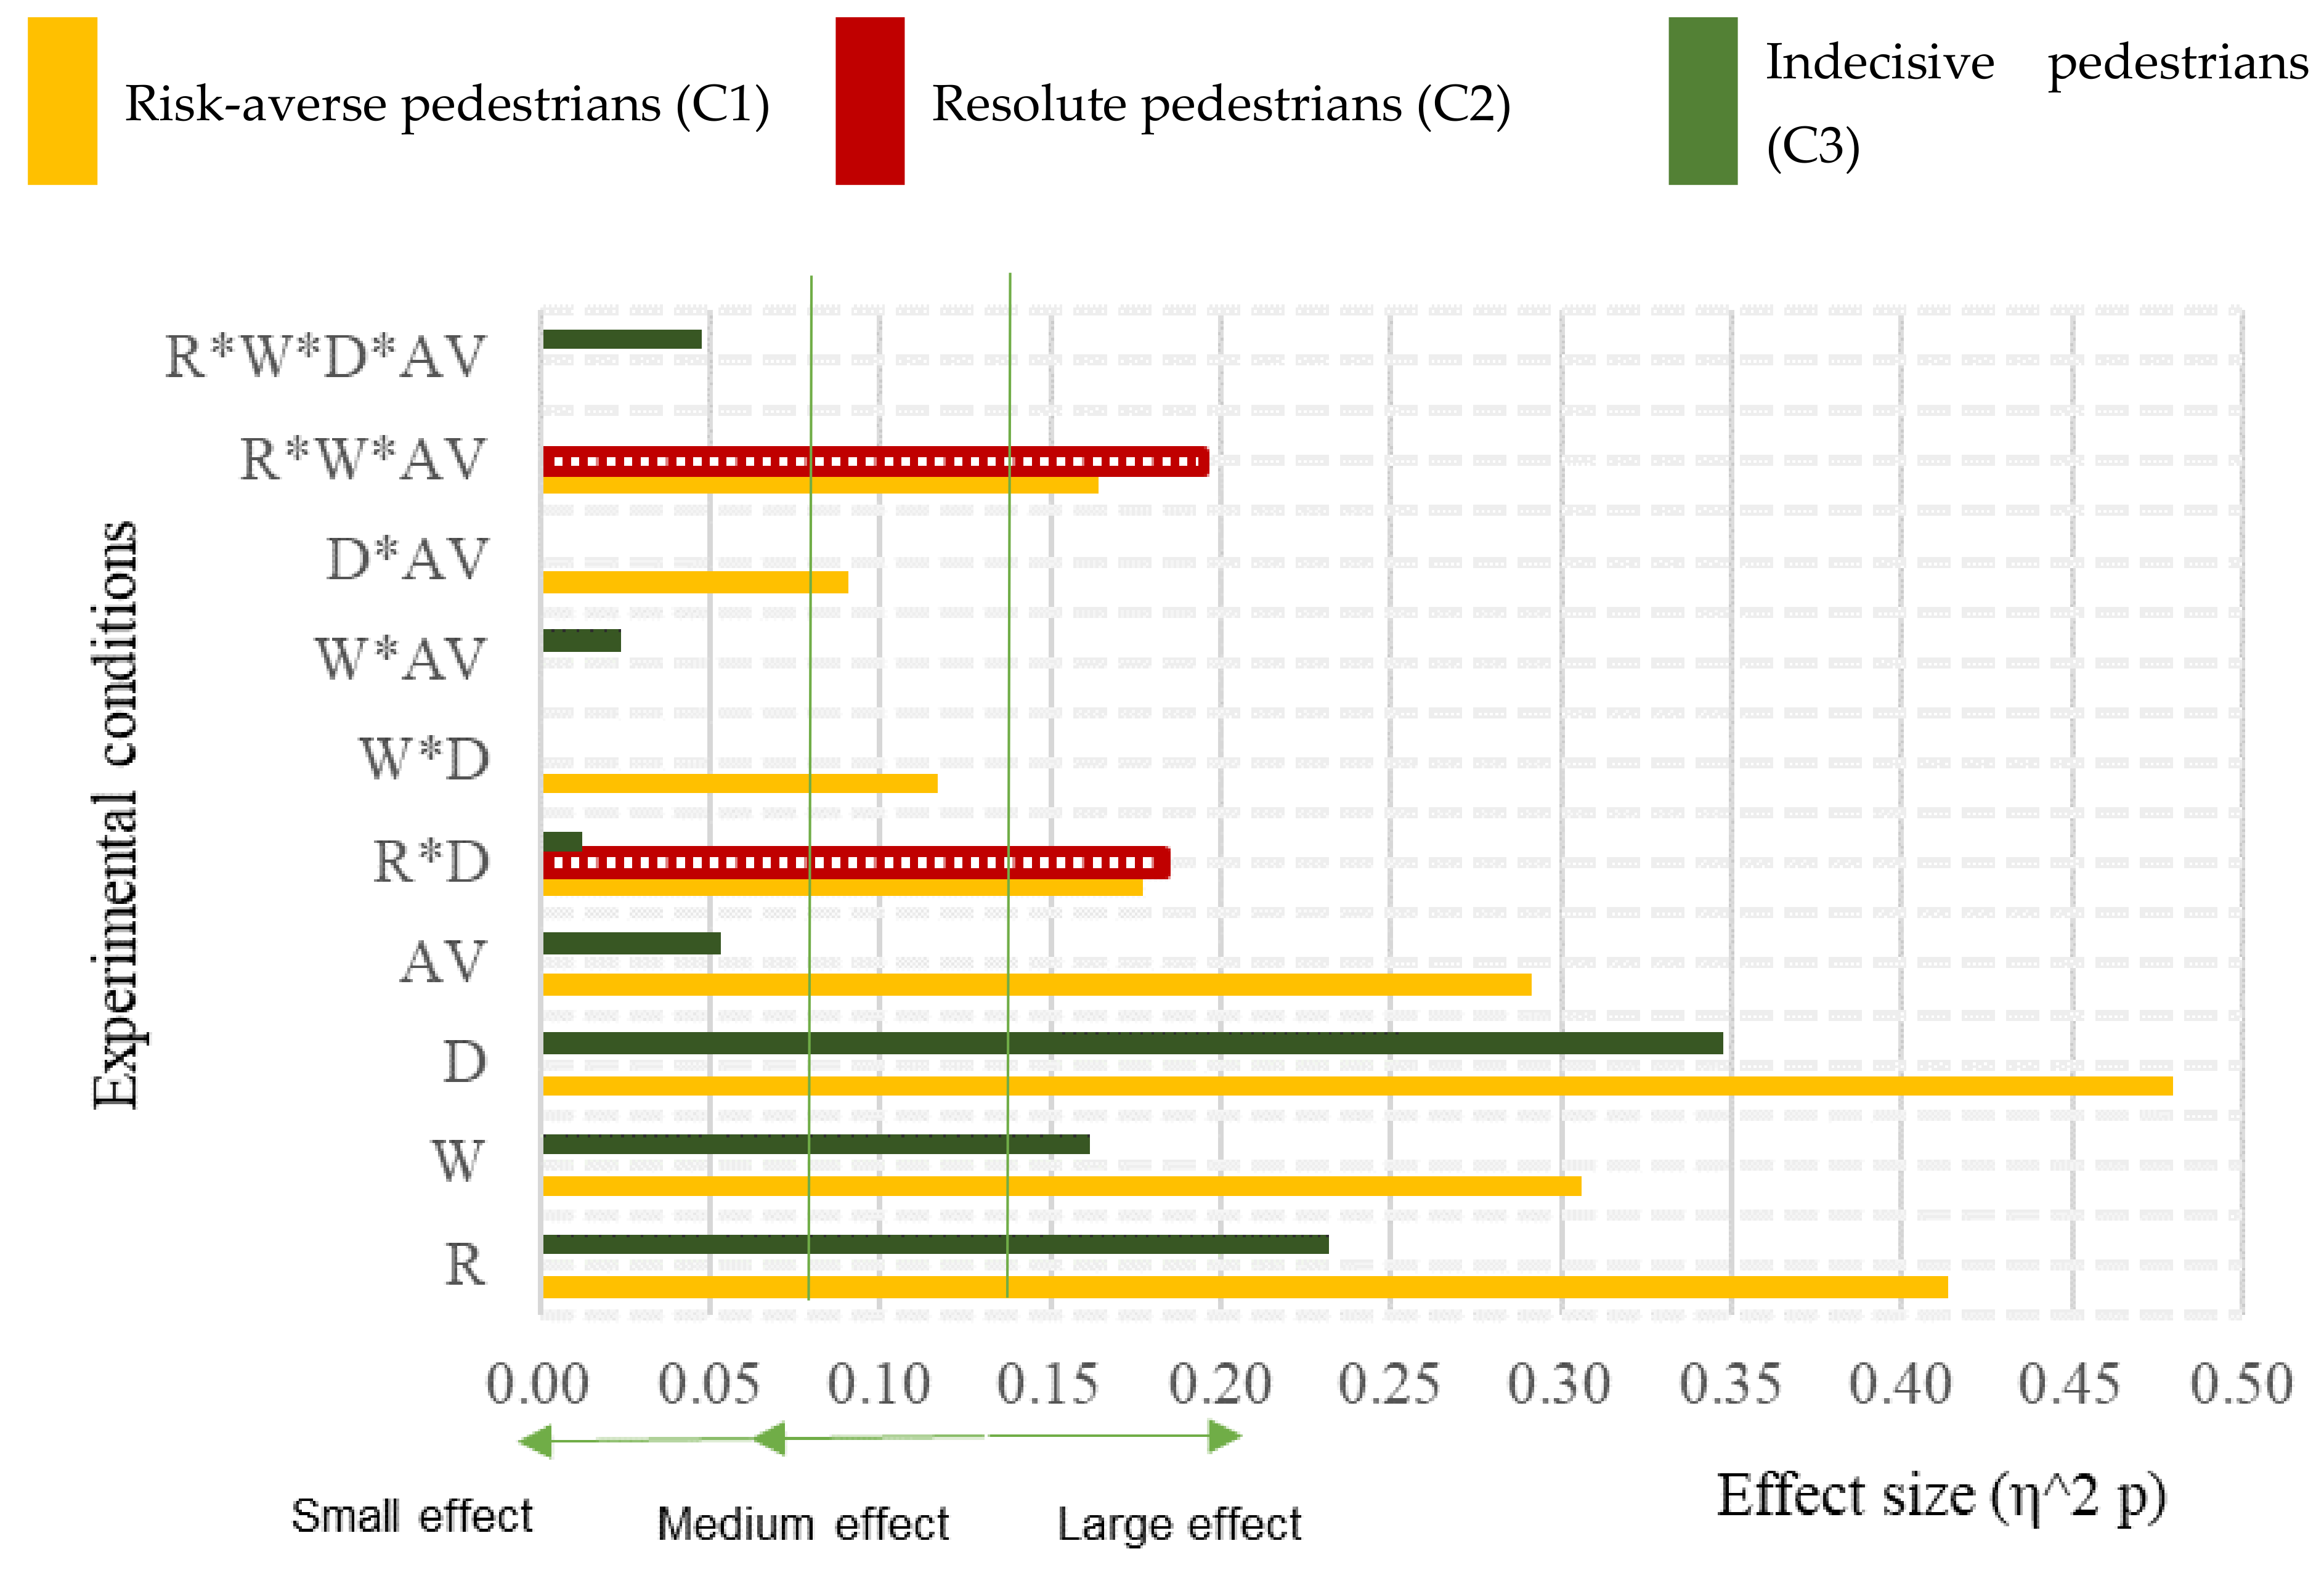
Figure 3 illustrates the effect sizes of only the significant interactions of each cluster.
The interaction between road gradient and distance (R*D) was significant in all three clusters. Cluster 1 (risk-averse pedestrians) was found to have larger effect sizes in general, and the opposite could be observed for cluster 3 (indecisive pedestrians). Cluster 3 was the only cluster whose crossing intentions were significantly influenced by the interaction between all four factors, i.e., road x weather conditions x distance between AV and pedestrian x type of AV. The clusters are defined in light of the interpretation of their self-reported measures rather than a moderation of situational effects in the following
Section 6.
5.4. Analysis of PBQ and BFI Within the Clusters
The PBQ was measured on a scale of 1 (extremely infrequently or never) to 6 (extremely frequently or always).
The highest scored PBQ items in each category were positive behaviour: “I thank a driver who stops to let me cross” (Mean = 5.7), error: “I cross between vehicles stopped on the roadway in traffic jams” (Mean = 4.4), violation: “I cross diagonally to save time” (Mean = 4.5), aggressive behaviour: “I have gotten angry with a driver and hit their vehicle” (Mean = 5.9), lapse: “I forget to look before crossing because I am thinking about something else” (Mean = 5.4).
The participants were asked to choose one of the five options, ranging from 1 (disagree strongly) to 5 (agree strongly) while answering the BFI questions. It was found that agreeableness was the most common psychological trait (35.2%), whereas extraversion was the least common (9.3%) in the collected sample.
5.5. Synthesis of Road Crossing Decisions, PBQ and BFI
Kruskal–Wallis test revealed there were significant differences between some of the PBQ and BFI items’ scores of participants in each cluster.
The following PBQ items: violation, aggression, and lapses were found to be significantly different across risk-averse (C1), resolute (C2) and indecisive (C3) pedestrians.
The following BFI item: Agreeableness was found to be significantly different across risk-averse (C1) and resolute (C2) pedestrians.
Following that, Dunn’s test was performed to calculate the differences in mean scores for the PBQ and BFI items, as shown in
Table 12.
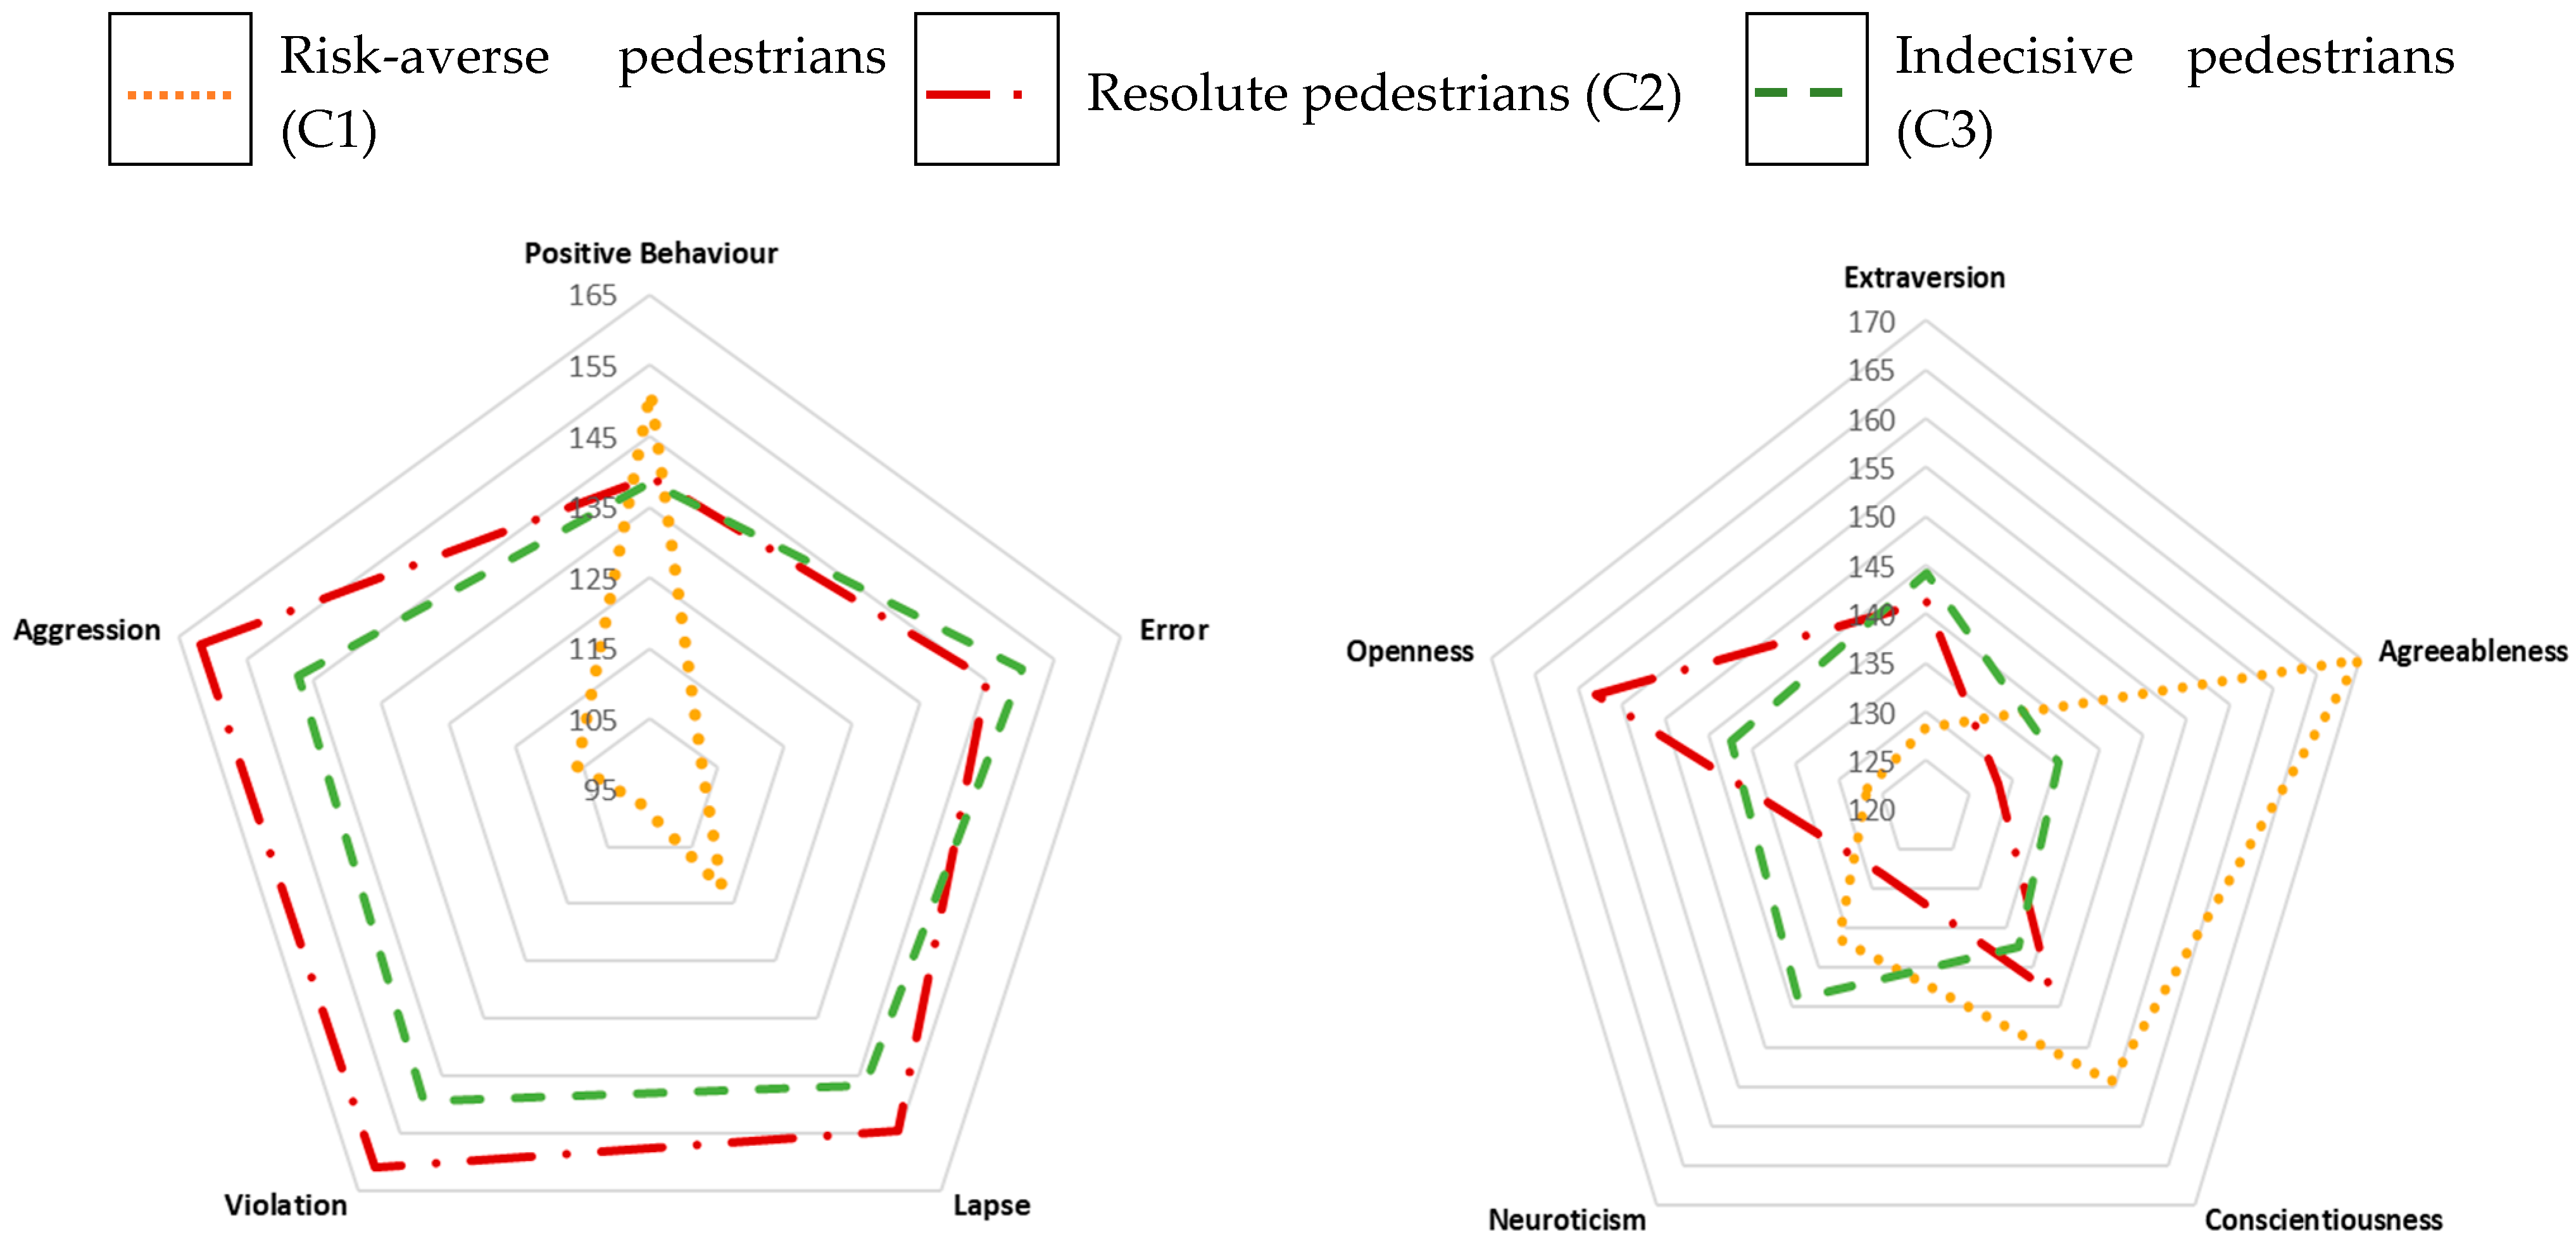
Figure 4 shows radial diagrams to visualise the PBQ and BFI mean rank values obtained from Dunn’s test. It can be observed that risk-averse pedestrians (C1) ranked the highest on positive behaviour and agreeableness, and the least on violation and openness. Resolute pedestrians (C2) ranked the highest on aggression and openness, and the least on positive behaviour and neuroticism. Indecisive pedestrians (C3) ranked the highest on errors and extraversion, and the least on positive behaviour and agreeableness.
6. Discussion
In our study, Anderson’s experimental protocol was used to collect and analyse responses on pedestrians’ road-crossing decisions across 16 different scenarios. The decisions were then related to their declared behaviours while crossing a road, as well as their psychological facets. The scenarios were used to manipulate the factors: road gradient, weather, longitudinal distance between pedestrians and the AV and the type of vehicle.
The first objective was to investigate the potential effect of selected factors and their interactions on pedestrians’ road-crossing decisions while interacting with an AV. ANOVA conducted on the whole sample (N = 281) showed all four factors had either a large (road gradient, weather, and longitudinal distance between pedestrians) or medium (type of vehicle) effect size on pedestrians’ crossing decisions.
The large effect size of road gradient on crossing decisions was a novel and interesting find, bridging a gap in the road safety literature, as there were no existing studies investigating this topic to the best of our knowledge. In this way, hypothesis 1: “Based on the looming effect, we posit that pedestrians are more likely to cross the road when an AV is approaching them from down a hill compared to when it is approaching from up a hill” is consistent with our findings.
Weather conditions (rainy vs. fair, or sunny) were found to create inconclusive effects on crossing decisions that involved HDVs and AVs in the consulted literature. Some studies have concluded that pedestrians make riskier road crossing decisions in rainy conditions Movahhed et al. [
32], whereas some studies show that pedestrians are more cautious and practice caution in the presence of unfair weather conditions [
33]. According to our results, rain decreased pedestrians’ intentions to cross the road, whilst sunny weather encouraged road-crossing behaviour in the presence of AVs. Therefore, it can be assumed that pedestrians consider their safety to be more important than comfort when it comes to risks while crossing the road in the rain. This is in line with the risk homeostasis theory by Wilde [
19], where individuals adapt their behaviour (and preferred risk levels) depending on a benefit versus risk trade-off. Thus, our findings support hypothesis 2: “Based on results analysing the frequencies and severities of pedestrian–AV crashes in different weather conditions, we posit that pedestrians are more likely to cross the road under sunny weather conditions compared to rainy weather conditions”.
Next, it was found that pedestrians preferred crossing the road when the AV was 80 m away from them compared to 40 m. This is an addition to numerous existing studies, which point out that pedestrians tend to prefer larger TTA values (which were expressed in terms of distance in this questionnaire) while crossing a road [
36,
40]. Therefore, our results support hypothesis 3: “Based on TTA values, we posit that pedestrians are more likely to cross the road when the AV is 80 m away from them compared to when the AV is 40 m away”.
Next, McGuire et al. [
38] concluded that visual looming affects the perceived threat of the incoming vehicle. Visual looming was also found to influence collision detection, TTA and road crossing responses [
31]. The findings from this study supported this, as pedestrians preferred to cross the road in front of a small, automated car compared to a large, automated lorry. Therefore, we have evidence to support hypothesis 4: “Based on looming bias, we posit that pedestrians are more likely to decide to cross the road when a small, automated car is coming towards them compared to an incoming automated lorry”.
These two findings relating to TTA and the type of vehicle are also congruent with the risk homeostasis theory by Wilde [
19], as the results point out that the participants adapted their acceptable levels of risk by making a trade-off between levels of safety and perceived risk.
The second objective was to quantify the effect of each factor and the potential interactions between them on pedestrians’ crossing decisions. Uphill movement of a small, automated car on a sunny day, 80 m away, was preferred most by the participants (supporting the fifth hypothesis). Interaction analysis revealed three significant interactions:
Road gradient X longitudinal distance between the participant and the AV.
Weather Xlongitudinal distance between the participant and the AV
and road gradient X weather X longitudinal distance between the participant and the AV X type of vehicle.
Variations in interactions between the factors were found to cause a variation in the risk perceived by the pedestrians, thus influencing their crossing decisions; thus, our findings also support the fifth hypothesis.
Next, clustering analysis on the road crossing decisions revealed three distinct clusters. The third objective was to investigate potential interactions between pedestrians’ road crossing decisions, their self-reported behaviours and psychological facets at road crossings. This investigation was carried out per cluster to compare the three distinct profiles. Although the three clusters varied in size, this did not compromise the statistical validity of the results. However, one limitation of the smaller cluster sizes is that they are more likely to lead to type II errors. Pedestrians’ declared behaviour was found to be an effective predictor of pedestrians’ psychological traits and vice versa. The three clusters are discussed further in the following sections.
6.1. Risk-Averse Pedestrians
In the first cluster (n = 52), i.e., risk-averse pedestrians, participants were reluctant to cross the road in most of the scenarios. They ranked the highest on positive behaviours and agreeableness, and the lowest on violation and openness.
Their mean crossing responses were the lowest among the clusters, but they had the most significant interactions between factors, suggesting they processed more information and took fewer risks when crossing. Their PBQ and BFI scores aligned with Zheng et al. [
53] and Qu et al. [
54], who found that positive behaviour predicts agreeableness. These individuals, being risk-averse, were less violent and exhibited safer behaviours, consistent with our findings. Openness was also a significant predictor of positive behaviour in Zheng et al. [
53] and Qu et al. [
54], and our results further support it. Openness was also a positive predictor of aggression [
54] due to its strong link to sensation seeking, which can manifest as positive behaviour or aggression. In the second cluster, higher openness may correlate with more aggressive behaviours.
6.2. Resolute Pedestrians
In the second cluster (n = 27), i.e., resolute pedestrians, participants were characterised by high ranks for aggression and openness and low ranks for positive behaviour and neuroticism.
This group had the highest mean crossing responses across all sixteen scenarios, showing the highest willingness to cross. They also had the fewest significant factor interactions, indicating minimal consideration of surrounding stimuli before crossing. This aligns with Joshanloo [
55], who links openness to risk-taking. However, our findings contrast with research suggesting that aggression correlates with neuroticism [
64] and that openness predicts positive behaviour [
53]. These inconsistencies may stem from contextual differences, as Zheng et al. [
53] studied urban residents’ living and travelling patterns, and Dam et al. [
64] examined personality traits and aggression, while our study focused on road-crossing decisions in the presence of AVs and stimuli.
6.3. Indecisive Pedestrians
In the third cluster (n = 202), i.e., indecisive pedestrians, participants were characterised by high ranks for error and extraversion and lower ranks for positive behaviour and agreeableness. Their mean crossing decision values were in-between the two other clusters but were uniquely influenced by the combination of all four factors, suggesting they processed stimuli but were indecisive. While [
53] found that positive behaviour and agreeableness reduce errors, this cluster showed the opposite. Though extroverts are typically confident [
25], our findings indicate indecision, likely due to contextual differences. Indecisive pedestrians might be hesitant to make decisions while interacting with novel AV technology, thus committing more errors. Therefore, future research should focus on bolstering the knowledge of pedestrians regarding AVs’ capabilities to mitigate the occurrence of human errors at road crossings. This is paramount as pedestrians may reproduce these errors they already make while interacting with non-automated vehicles.
6.4. Synthesis
The study distinguished participants’ behavioural intention, self-reported road-use behaviour, and psychological traits as predictors across the three clusters. Using Anderson’s experimental protocol and two scales, it explored pedestrian–AV interactions and factor dynamics. This is where we highlight the novelty of our study by using Anderson’s experimental protocol on factors that have inconclusive effects on pedestrian road crossing decisions and further establishing the links with road use/crossing behaviour and personality traits. Our findings highlight risky environmental and road features crucial for AV design and safety guidelines.
Evaluating pedestrian characteristics helps predict behaviours during AV interactions at crossings and informs future road safety campaigns. Pedestrian profiling enables targeted safety messaging and allows road authorities to tailor strategies to different profiles [
65]. As suggested by the same research, focusing on risk profiles can improve safety for high-risk groups like resolute pedestrians or groups prone to making human errors, like indecisive pedestrians. Future research could explore additional factors in scenarios to assess the consistency of PBQ and BFI predictor findings with this study.
7. Limitations
A potential limitation is the sample size and representativeness, as convenience sampling led to uneven distribution across age groups and genders. However, in our sample, we did not find significant effects between socio-demographic variables and cluster properties based on Anderson’s protocol.
A literature review drove the rationale behind choosing the investigated factors. We did not include popularly used factors such as the speed of approaching AV because it has been researched to vast depths, and we also knew that it would be difficult for the participants to visualise a dynamic factor such as speed via a questionnaire.
We used PBQ and BFI, which are standardised and validated scales. The internal consistencies (α) in some dimensions of the scales were lower than the values reported in their original literature. This may be explained by differences between validation samples and our participants (e.g., demographic or cultural). For example, PBQ was validated using data exclusively from the French population [
49], and BFI was checked for internal reliability using the American population [
52]. The scales’ reliability has been established in prior work, and our findings align conceptually with existing literature, suggesting that the lower α reflects sample-specific variation but not a psychometric weakness. Another reason could be that the PBQ was designed for non-AV-pedestrian interactions and may not always be consistent for AV-pedestrian interactions.
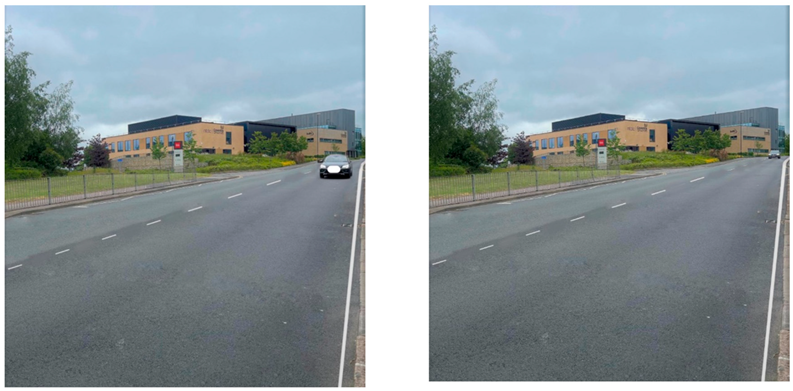
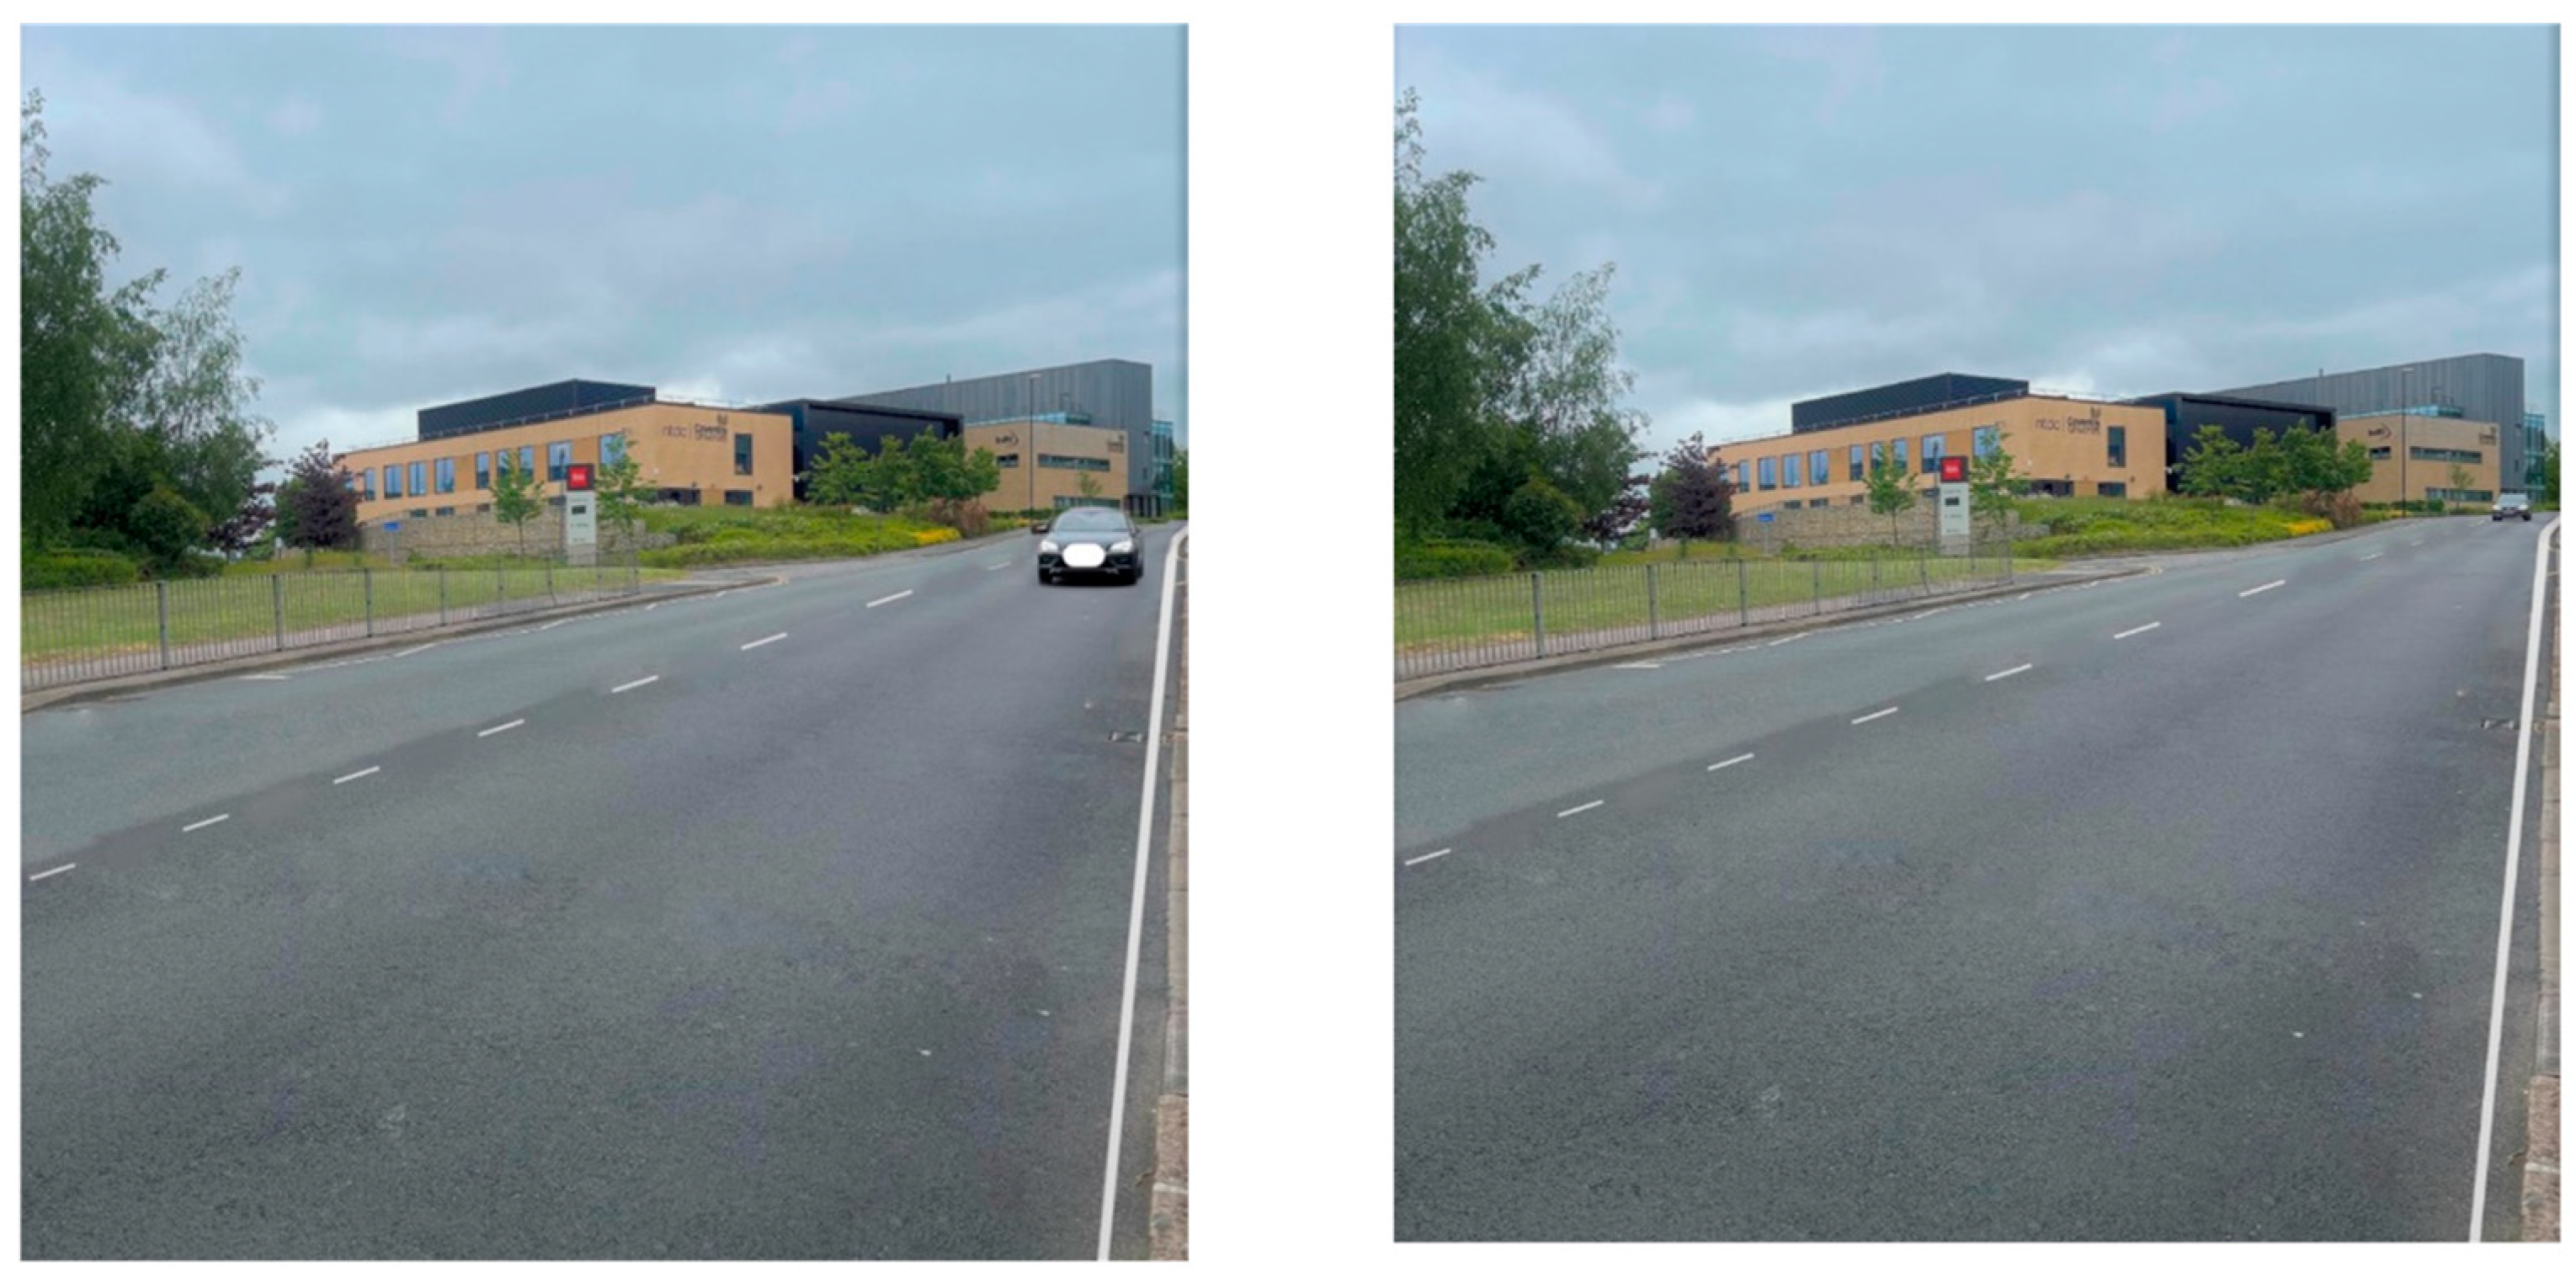
This study serves as a foundation for experimental designs, such as pedestrian simulation studies that capture actual behaviour rather than intentions. Using pictures to illustrate scenarios was less immersive than videos, but practical for smartphone-based responses. The use of images might have under-rendered the looming effect and omitted the acoustic cues and presence of other road users. However, the use of Anderson’s protocol has been proven to be a valid, immersive and efficient tool in a wide range of studies, including automated driving [
44,
45,
46,
48], thus it is a solid method to understand pedestrian intentions.
8. Recommendations for Future Work
Future research should aim for a more balanced sample in terms of incorporating pedestrians with mobility issues (for example, wheelchair users) or who have had past experiences in traffic collisions. We expect differences in how those groups of people would interact with AVs compared to those without such experiences.
As pointed out in the previous section, PBQ and BFI are expected to vary across cultures. Cultural differences can be compared to get an in-depth understanding of how they influence crossing intentions in front of an AV, for example, conducting a France-UK-Australia comparison of PBQ’s internal consistency.
Road crossing is affected by a multitude of factors, not only the four factors we investigated in this questionnaire. Different sets of factors and their interactions can be examined in the future. Furthermore, they can adopt Virtual Reality (VR) or simulators to enhance immersion and study pedestrian behaviours beyond intentions.
9. Conclusions and Implications
This study highlights that pedestrians’ crossing decisions vary not only with stimulus changes but also with their interactions. The four stimuli examined—road gradient, weather, pedestrian–AV distance, and vehicle type—all influenced road crossing decisions. Our study was conducted to understand which scenarios are perceived to be riskier from a pedestrian’s perspective as an AV approaches them, thus aiding the safe integration of AVs into road networks.
A novel finding was that pedestrian road-crossing behaviour was influenced by whether the AV was travelling uphill or downhill, a factor not explored in existing literature. While previous research was inconclusive about weather effects, our results showed a preference for crossing in sunny conditions over rainy ones. Additionally, pedestrians were more likely to cross when a small car was 80 m away than when a lorry was 40 m away. All findings aligned with the initial hypotheses.
Pedestrians’ psychological traits can be used to effectively predict their behaviour around AVs. Risk-averse pedestrians exhibited more positive behaviours, higher agreeableness, and lower violations and openness. Resolute pedestrians were more aggressive, open, and less neurotic, with fewer positive behaviours. Behavioural intentions were linked to these traits, categorising participants into three profiles. Consistent with Hulse et al. [
66], AV perception varies with individual risk-taking tendencies. Indecisive pedestrians made more errors, were extraverted, and scored lower on positive behaviour and agreeableness. These profiles can inform road safety initiatives targeting high-risk individuals and those most likely to make errors at road crossings. Future work could integrate insights from AV driving strategies (e.g., overtaking; [
67]) with models of pedestrian behaviour, to better capture how both traffic flow and human behaviour shape AV performance.
In this way, the study was conducted to understand how pedestrians interact with AVs at road crossings and what factors affect these interactions. This study further validates the application of scenario-based methodology [
44,
45,
46,
48] in the context of AVs and expands its applicability to pedestrians’ road crossing decisions whilst interacting with an AV.
The takeaway message from this study and the implications on safe pedestrian–AV interactions are summarised as follows:
The results from this study can be used to inform the design of AVs. For example, AVs could be designed to have a more cautious driving style in the conditions considered the riskiest by pedestrians, i.e., while travelling downhill in rainy weather.
Pedestrians preferred to cross when there was the largest gap (i.e., 80 m, not 40 m) between them and the incoming AV. Thus, AVs should be designed to start decelerating as far away from the pedestrian as possible.
The knowledge of decision-making in different scenarios can be used in pedestrian profiling and safety initiatives and policies. Three distinct profiles were identified using clustering analysis: risk-averse, resolute, and indecisive.
Furthermore, participants’ crossing decisions were associated with self-reported behaviour (positive behaviour, violations, lapses, errors and aggressive behaviour) and psychological traits (openness, conscientiousness, extraversion, agreeableness and neuroticism). Thus, pedestrian profiling helps inform traffic simulation studies by furthering the understanding of the road environment and geometry on pedestrian behaviour when exposed to AVs. It also advises practitioners to develop measures to mitigate or avoid the occurrence of human errors from the pedestrian perspective.
The results from our experiment can be used to design further studies that compare pedestrian interactions with either AVs or HDVs. Furthermore, the findings on pedestrian profiling can be used to develop studies that deal with trust and/or familiarity with AVs.
