Article

Development of Resource Map for Open-Loop Ground Source Heat Pump System Based on Heating and Cooling Experiments

by
Tomoyuki Ohtani
1,*,
Koji Soma
1,2 and
Ichiro Masaki
1,3
1
Department of Civil Engineering, Gifu University, Gifu 501-1193, Japan
2
Gifu Research Center for Public Health, Gifu 500-8148, Japan
3
Zeneral Heatpump Industry Co., Ltd., Nagoya 450-0002, Japan
*
Author to whom correspondence should be addressed.
Appl. Sci. 2025, 15(16), 9195; https://doi.org/10.3390/app15169195 (registering DOI)
Submission received: 8 June 2025 / Revised: 28 July 2025 / Accepted: 18 August 2025 / Published: 21 August 2025
(This article belongs to the Section Energy Science and Technology)

Abstract

Resource maps for open-loop ground source heat pump (GSHP) systems were developed based on heating and cooling experiments to identify areas with potential for reduced operational costs. Experiments conducted at a public hall, where groundwater temperatures fluctuate seasonally, clarified the relationships between the coefficient of performance (COP) of a heat pump and three key parameters: groundwater temperature, flow rate, and energy consumption. Multiple regression analysis produced equations for estimating the energy consumption of both the heat pump and the water pump. Results indicate that groundwater temperature influences the COP, increasing it by 0.07969 per °C during heating and decreasing it by 0.1721 per °C during cooling. These equations enable the estimation of energy consumption in open-loop systems from groundwater temperature, groundwater depth, and building type. Resource maps developed for the Nobi Plain in central Japan reveal that annual energy consumption is lower in the northwestern region, where groundwater temperatures are generally lower, except in marginal zones for hospitals and offices.

1. Introduction

Ground source heat pumps (GSHPs), also referred to as geothermal heat pumps, are a renewable energy technology used for space heating and cooling. They operate by exploiting the temperature difference between the earth’s surface and the subsurface, where temperatures remain nearly constant year-round. The subsurface acts as a heat source during winter and as a heat sink during summer. In closed-loop systems, heat is extracted via borehole heat exchangers, whereas in open-loop systems, heat exchange occurs through groundwater pumped from a well.
A heat pump consists of a compressor, condenser, expansion valve, and evaporator. The compressor consumes energy, typically electricity, to transfer heat. The performance of a heat pump is expressed as the coefficient of performance (COP), defined as the ratio of transferred heat to consumed energy. A GSHP system also includes a water pump; both components require energy input. A system’s COP accounts for the overall efficiency of the entire system and is defined as the ratio of transferred heat to total energy consumption.
Although GSHPs have been installed in countries such as China, the United States, Sweden, Germany, and Finland [1], their overall adoption remains limited. Resource maps can support the broader implementation of GSHP systems by identifying areas with favorable conditions.
Previous studies on resource mapping for closed-loop systems have produced heat exchange-rate maps based on numerical models of groundwater flow and heat exchange [2], and maps of required lengths of geothermal heat exchangers derived from regional groundwater and heat transport analyses [3]. Comparisons of heat exchange between plains and basins indicate that inland basins are generally more favorable due to groundwater flow patterns [4]. Very shallow soil thermal conductivity has been estimated using soil texture, bulk density, and moisture content [5]. Very shallow geothermal potential has also been assessed using a combination of geographic information systems (GIS), traditional modelling, and machine-learning approaches [6]. Methods for regional-scale mapping of potential ground heat exchange have been developed using typical residential building energy requirements along with local geological and climatic data [7]. Three-dimensional models of thermal conductivity, integrating airborne electromagnetic data and laboratory petrophysical measurements, have been used to evaluate heat exchange potential [8]. Other studies propose frameworks for quantifying the technical potential of GSHP systems by geospatial matching heat demands and potential GSHP systems, the modeling of technical potential with seasonal regeneration through the reinjection of excess heat from space cooling, and for the optimal allocation of heat supply in district heating and cooling [9]. City-scale parametric analyses have been carried out to examine the impact of temporal demand variation and differences between design and operational COP on energy use, for example in Westminster, London [10].
For open-loop GSHP systems, including aquifer thermal energy storage (ATES), resource mapping studies have focused on annual pumping volume [11,12], aquifer productivity [13], groundwater flux, temperature and heat capacity [14], as well as groundwater flow velocity, balanced heating/cooling demands [15], and GIS-based weighted parameter analyses [16]. City-scale ATES potential has been quantified using heat transport modeling [17,18]. GSHP suitability in a graben basin was assessed by considering the geospatial variation in the soil type, and found that alluvial areas show higher potential [19]. However, no regional-scale maps to date have included estimates of annual total energy consumption for heating and cooling.
The aim of this study was to develop a methodology for creating regional-scale resource maps of open-loop GSHP systems based on annual total energy consumption. Such maps cover both urban and rural areas and provide valuable information for regional energy policy and planning. As annual energy consumption is directly linked to operating costs, it is a key factor in promoting the wider adoption of these systems.

2. Experimental Site and Methods

2.1. Methodological Overview

Heating and cooling experiments were conducted at a site characterized by rapid lateral groundwater flow within an alluvial fan, which causes seasonal groundwater temperature variations (Figure 1). Using the data of the experiments, we derived a multiple regression equation for the COP based on three parameters: (1) inlet groundwater temperature, (2) the temperature difference between inlet and outlet groundwater in the groundwater heat exchange unit, and (3) the part-load ratio (partial load capacity relative to the rated capacity of the heat pump). The energy consumption of the groundwater pump was estimated using a pump performance diagram. From these relationships, the annual total energy consumption of an open-loop GSHP system could be estimated for arbitrary groundwater temperatures and depths. This methodology was applied to four building types (hospitals, hotels, offices, and commercial facilities) to produce resource maps that aid site selection.

2.2. Site Characteristics

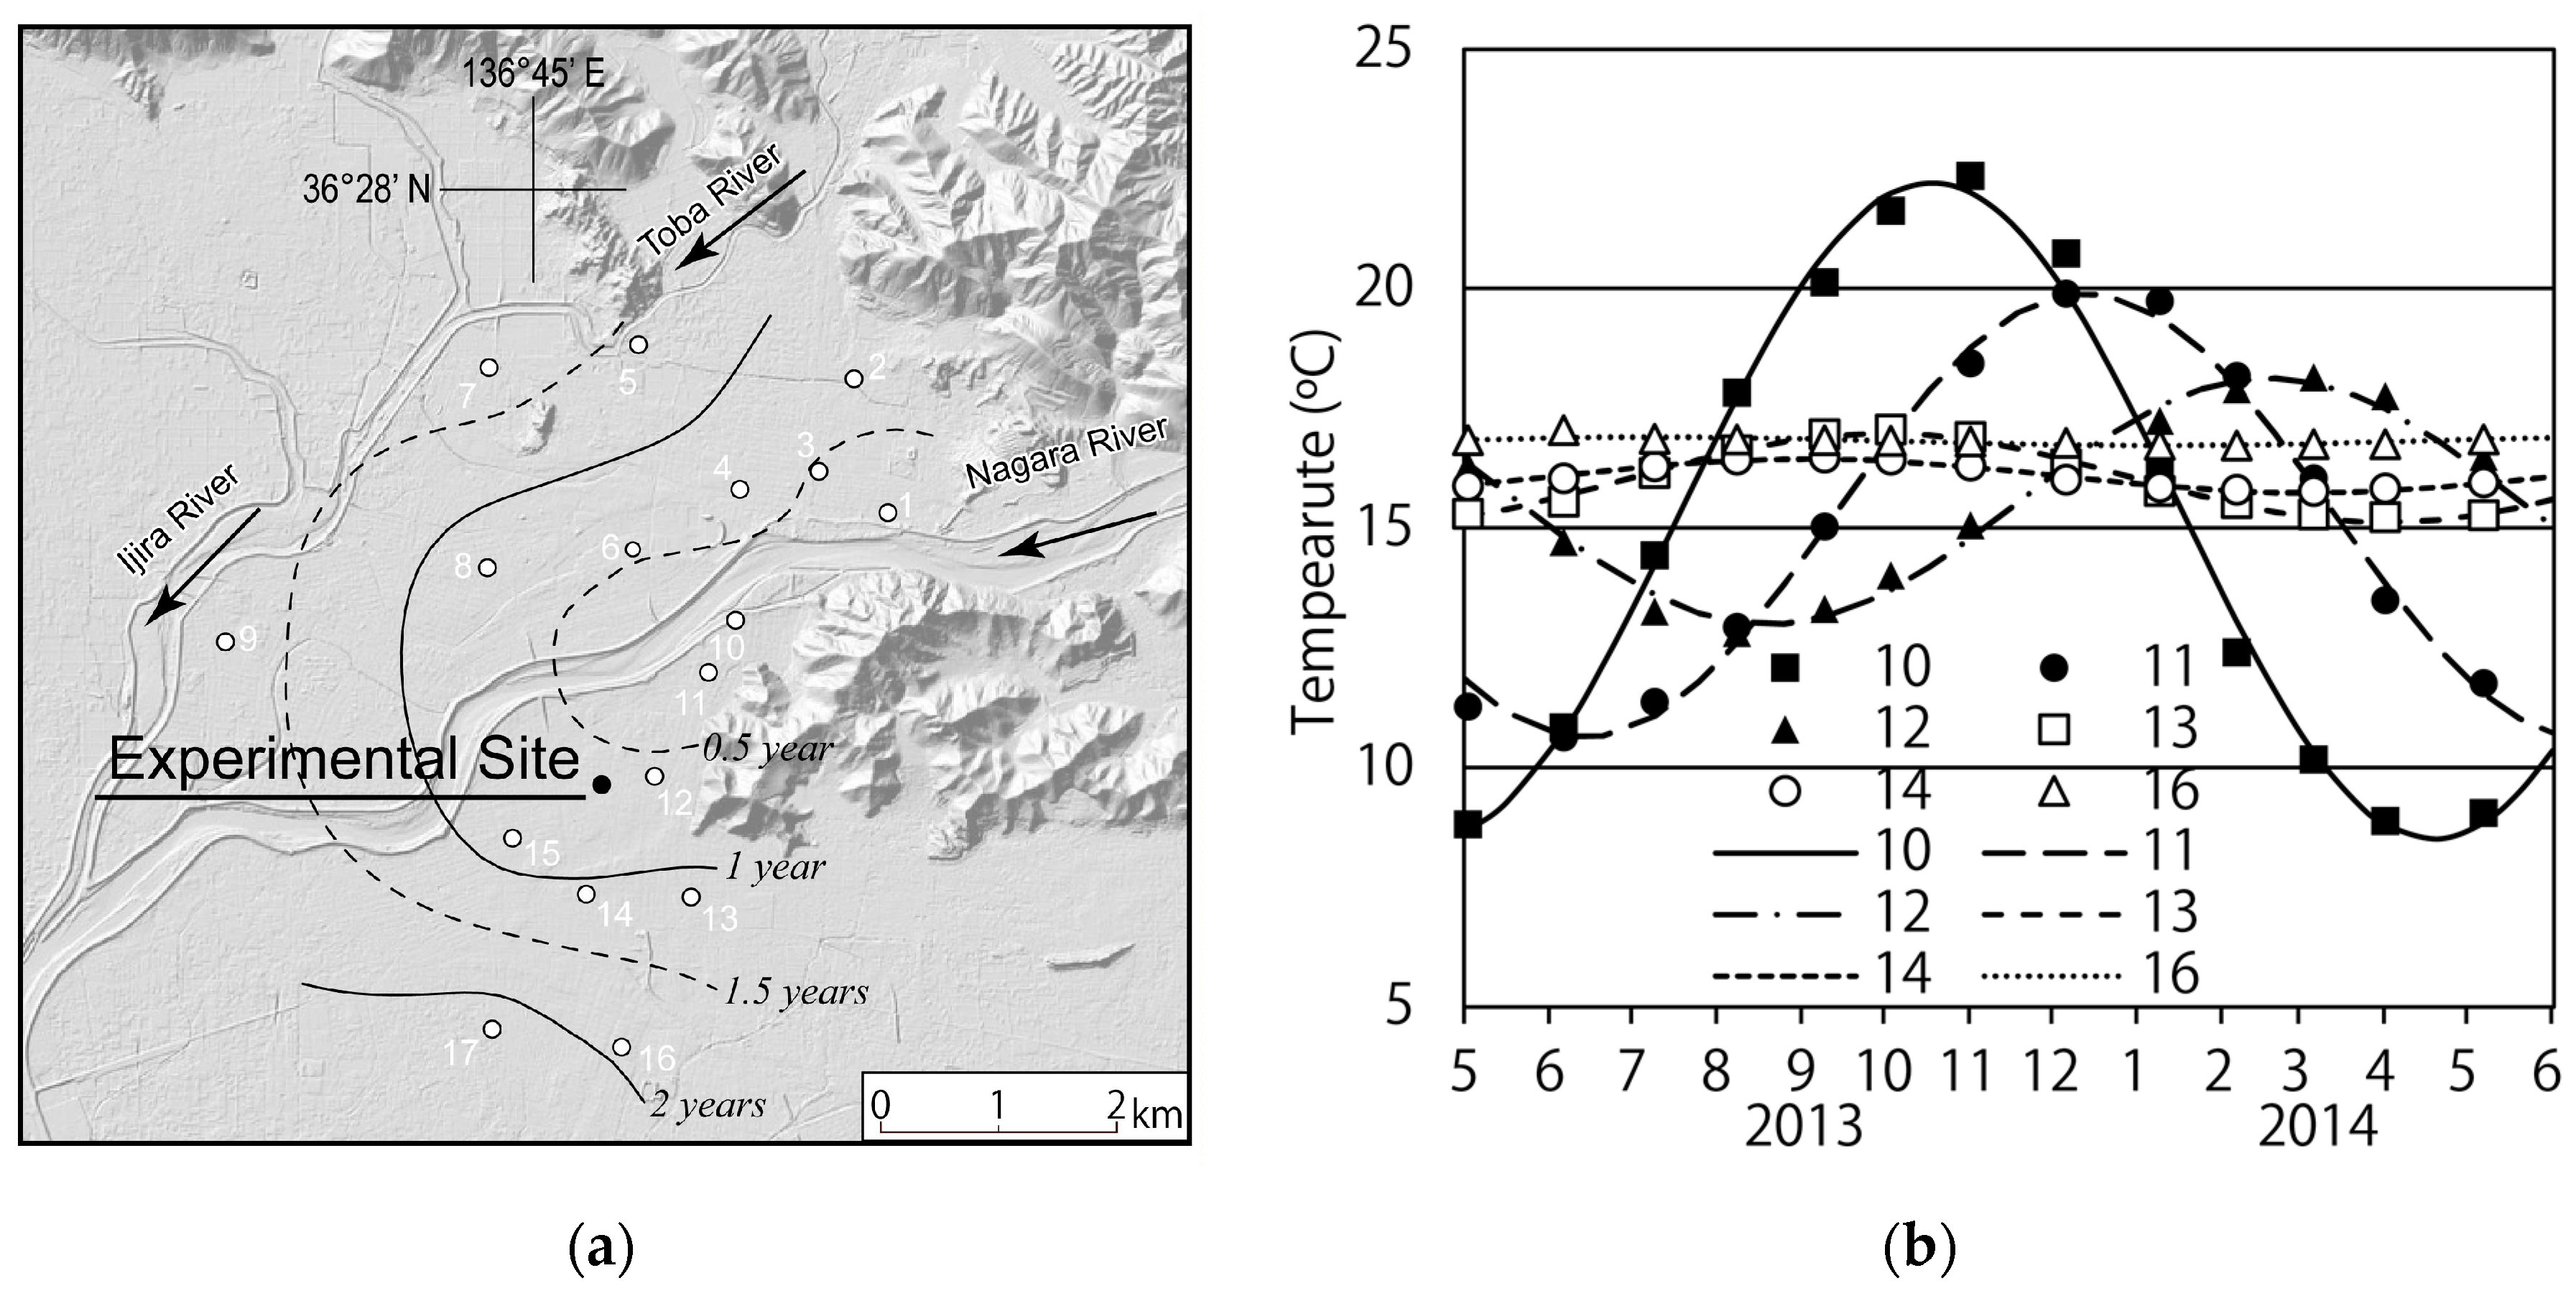
Experiments were conducted at a public hall in Gifu City, Japan. The site is located on the Nagara River alluvial fan (Figure 2a), composed mainly of unconsolidated gravels interbedded with thin silt layers. While subsurface temperatures are generally stable below a certain depth, groundwater temperatures in alluvial fans fluctuate due to faster groundwater flow from upstream recharge zones [20].
Measurements revealed an arc-shaped phase lag between subsurface and river water temperatures (Figure 2a). Figure 2b shows temperature variations at a 15 m depth in observation wells located progressively farther from the river. Well 10, nearest the river, showed the largest temperature fluctuation, with a peak temperature in November; farther wells exhibited smaller fluctuations with peaks occurring later. These patterns indicate the downstream advection of heat by groundwater flow. Warm river water infiltrates near the apex of the fan (around well 10) in summer and maintains its elevated temperature as it moves downstream creating a warm plume that persists into winter. This phenomenon makes groundwater in such settings an efficient heat source for GSHPs.

2.3. Experimental System

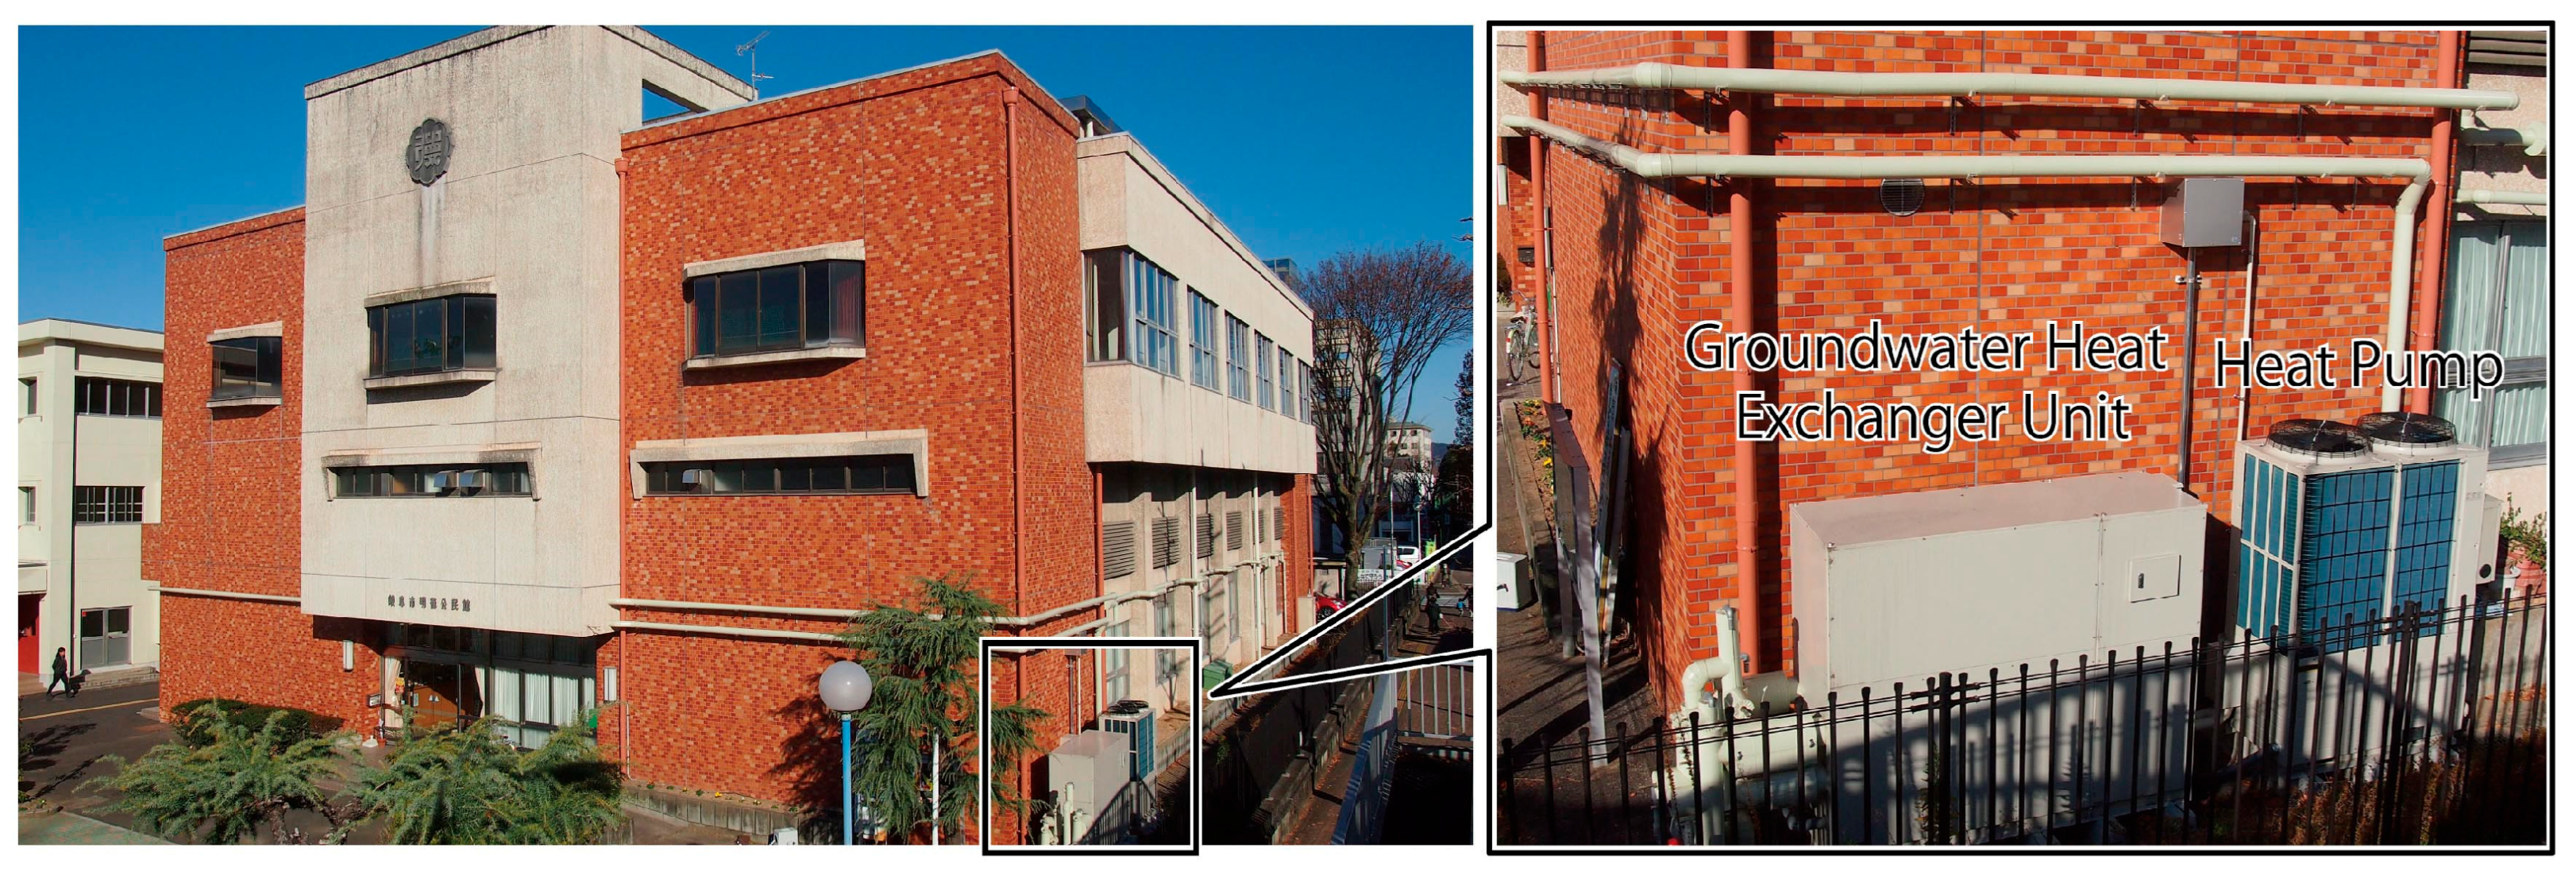
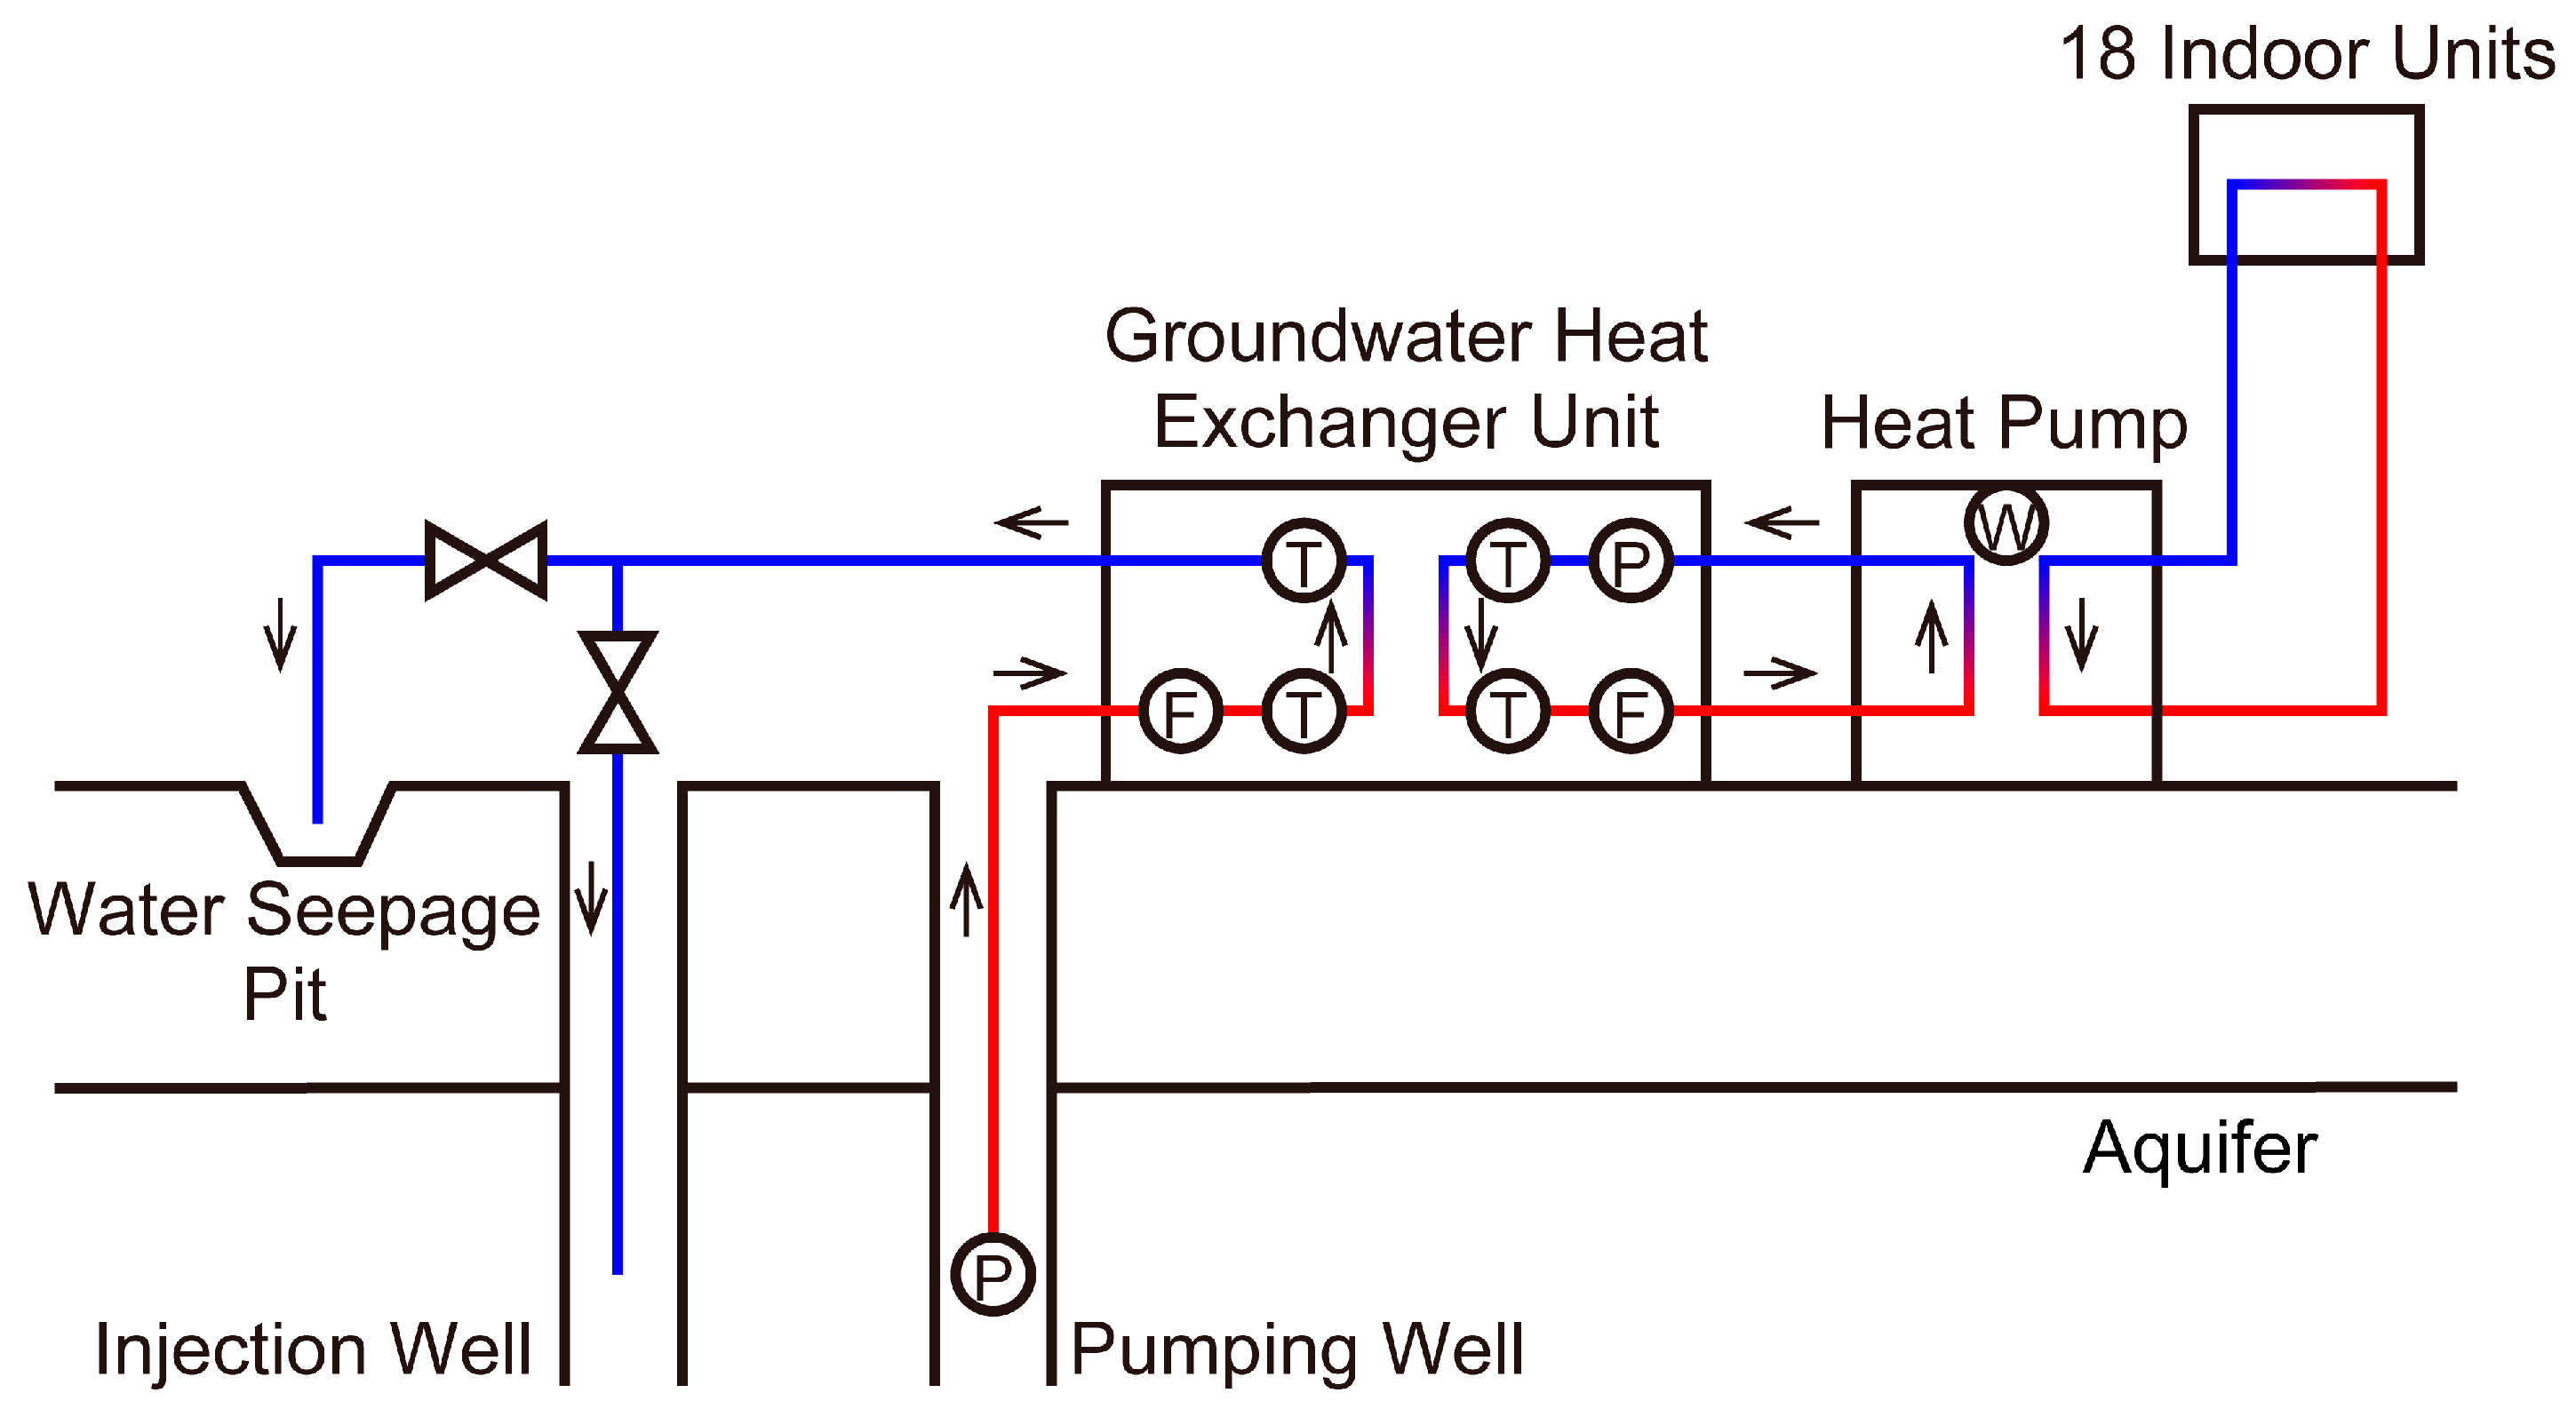
The experimental system comprised a pumping well, an injection well, a water seepage pit, a groundwater heat exchanger unit, a heat pump, and 18 indoor units (Figure 3 and Figure 4). Groundwater was pumped from the upstream well, passed through the groundwater heat exchanger unit, and reinjected either into a downstream injection well or a water seepage pit (these two were not used simultaneously). The groundwater heat exchange unit transferred heat between groundwater and an antifreeze circuit. Pumping power was controlled via an inverter, with a rated shaft power of 2.2 kW. The heat pump, a modified ZP-3-XS504T model (Zeneral Heatpump Industry Co., Ltd., Nagoya, Japan), had heating and cooling capacities of 56.5 kW and 50.4 kW, respectively, and could switch between groundwater and air as the heat source. Indoor units were independently controlled by public hall occupants.
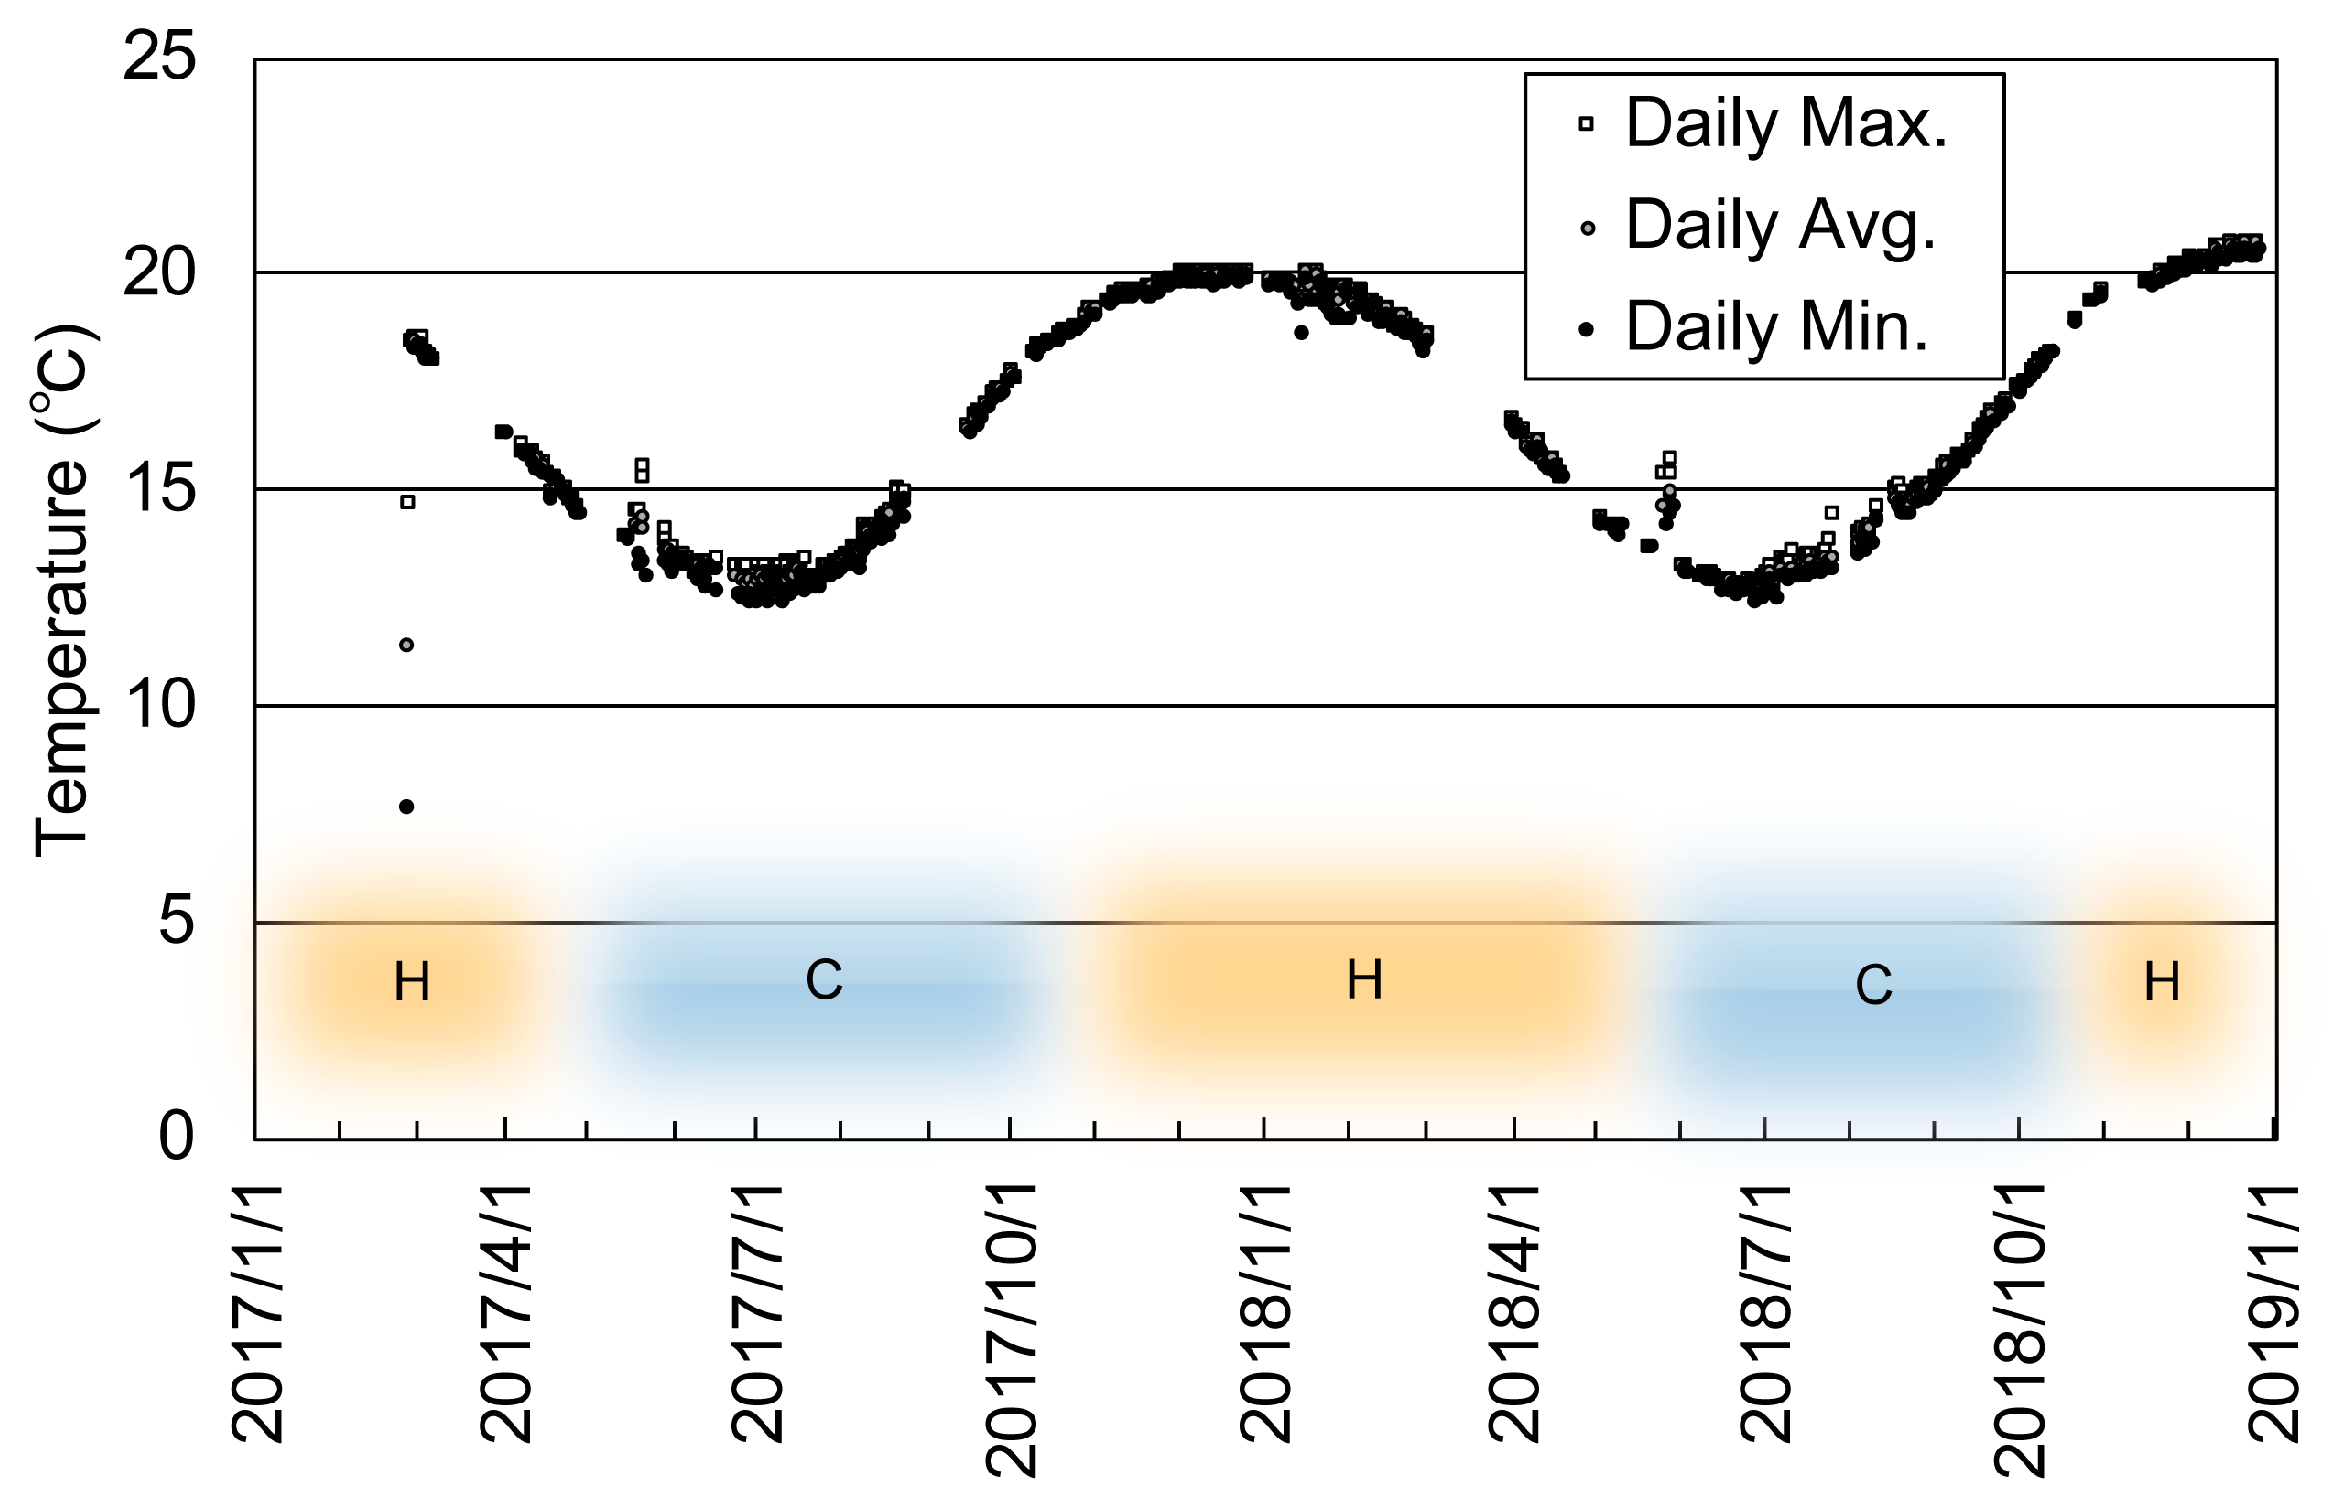
Data were recorded at 1 min intervals from April 2017 to December 2018, including groundwater inlet/outlet temperatures, pumping rates, and the energy consumptions of both the heat pump and the groundwater pump. Seasonal groundwater temperature fluctuations followed a sinusoidal trend, ranging from 13 °C in July to 20 °C in January (Figure 5). The temperature difference across the groundwater heat exchanger unit was set to fixed values (3, 5, 7, 8, and 10 K) on different days.

2.4. Estimation of Energy Consumption for Heat Pump and Groundwater Pump

To generate a regional-scale resource map, a methodology was developed to estimate the annual total energy consumption of open-loop GSHP systems. The required input parameters include groundwater temperature, groundwater depth, and heating/cooling demand profiles for different building types (hospitals, hotels, offices, and commercial facilities) [21]. Once the energy consumption at any site has been estimated, these values can be mapped spatially.
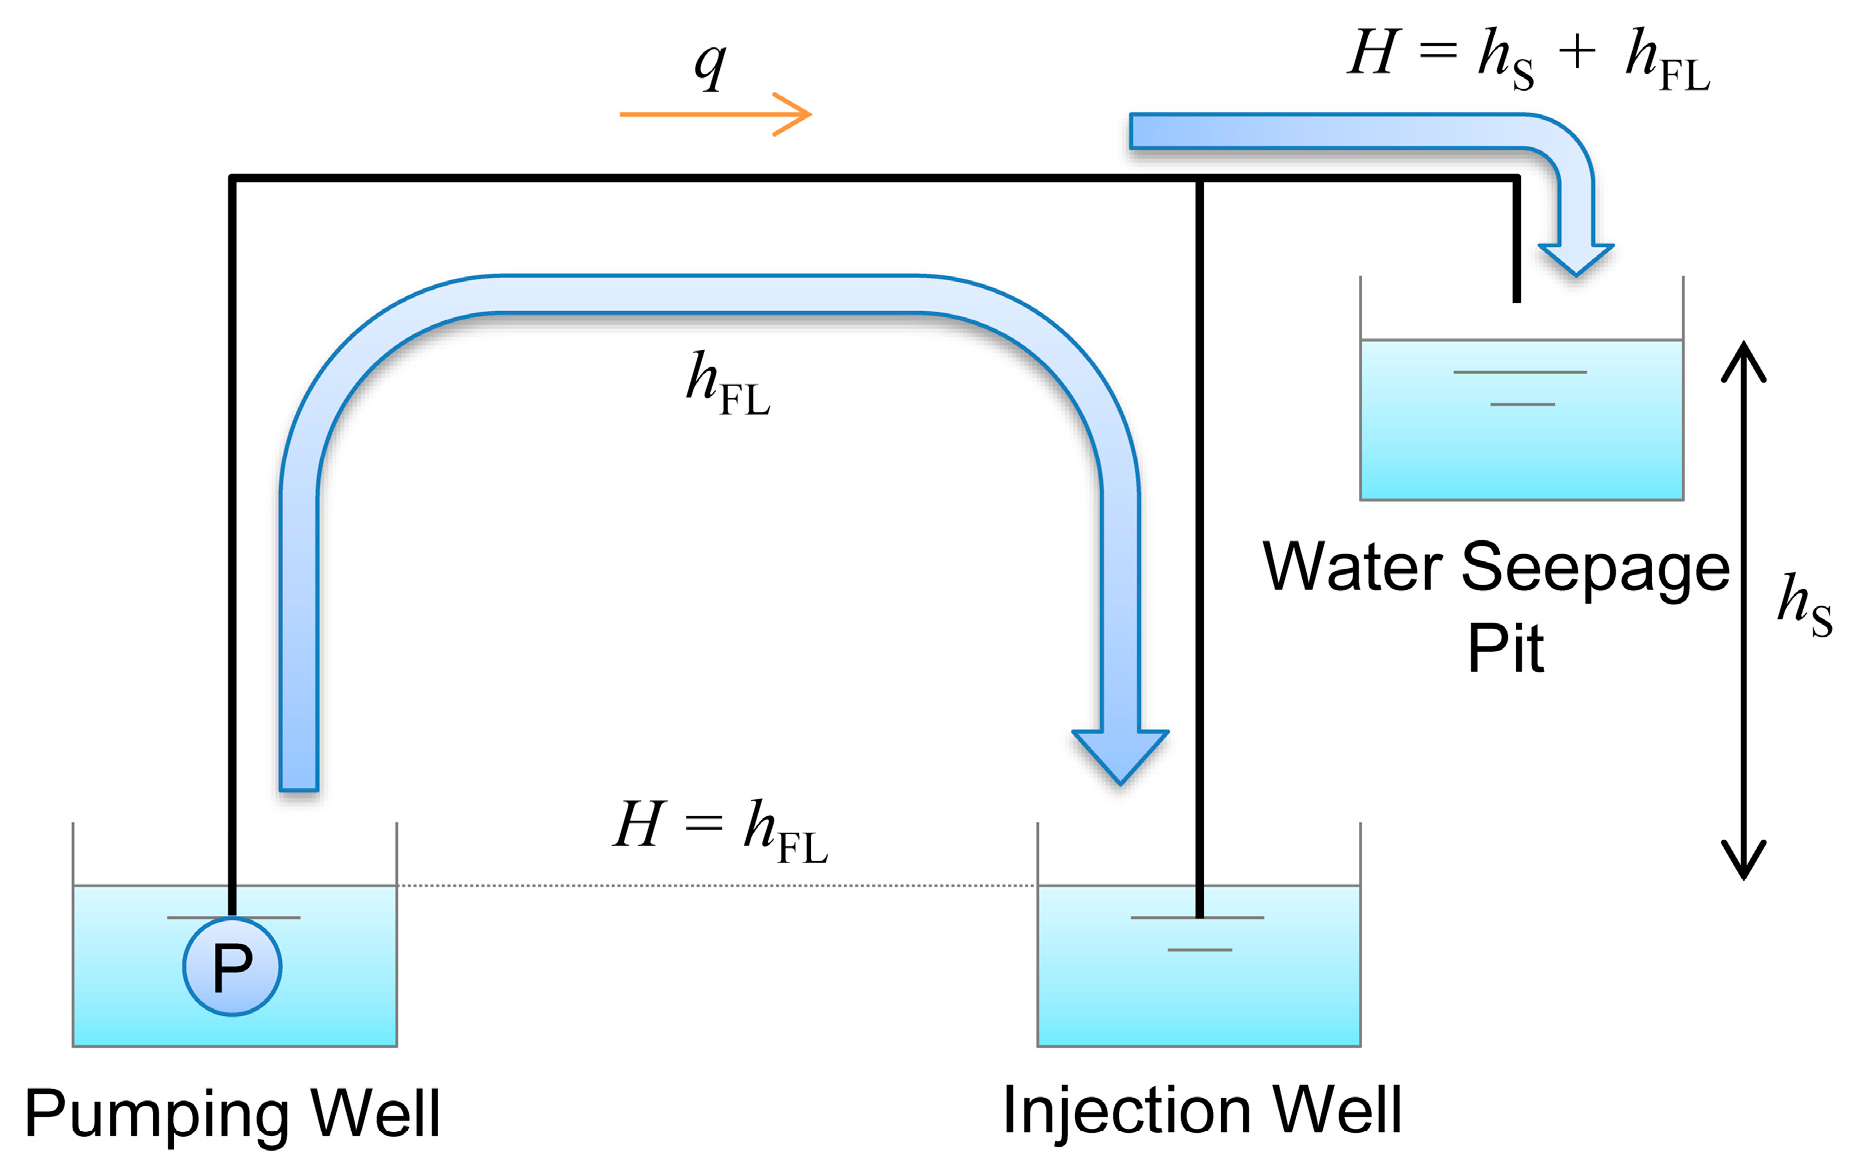
At the experimental site, groundwater temperature fluctuated between 13 °C and 20 °C annually. As described in Section 2.3, experiments were conducted using five fixed inlet–outlet temperature differences. Although the groundwater level remained relatively stable during the monitoring period, the static pump head was evaluated under two scenarios determined by the reinjection method: (1) reinjection via an injection well, and (2) reinjection via a water seepage pit (Figure 6). In the injection well method, the injection pipe was submerged below the water table. Under this configuration, groundwater remained under pressure along the entire circuit from pumping to injection, and the static head approached zero due to the siphon effect. In contrast, when using a water seepage pit, groundwater was released at atmospheric pressure and the static head became approximately equal to the height difference between the water table in the pumping well and the ground surface. These two conditions, combined with pump performance characteristics, defined the correlation between total dynamic head and energy consumption.
The energy use of a heat pump is estimated from the relationship between the COP and the three key parameters described in Section 2.1. Once the COP has been estimated for a given site, heat pump energy consumption can be derived from the annual heating/cooling demand profiles.
The experimental COP during heating and cooling was calculated from Equations (1) and (2), respectively.
C O P H e a t i n g = Q G W + W H P W H P
C O P C o o l i n g = Q G W W H P W H P
where C O P H e a t i n g and C O P C o o l i n g are the COP during heating and cooling, respectively, Q G W is extracted heat from groundwater (kJ), and W H P is the energy consumption of the heat pump (kJ). A positive Q G W indicates heat extracted from groundwater (heating), while negative values indicate heat released into groundwater (cooling). Q G W is positive because Q G W is negative during cooling operation.
Q G W is calculated by:
Q G W = q ρ c t T i n T o u t
where q is the pumping rate of groundwater (m3/s), ρ is the density of groundwater (kg/m3), c is the specific heat capacity of groundwater (kJ/kgK), t is time (s), and T i n and T o u t are the inlet and outlet temperatures of groundwater (°C).
The energy consumption of the groundwater pump was estimated using the empirical relationships between the pumping rate, total dynamic head, and pump performance characteristics. Based on monitored data and pump characteristic curves, the total annual energy consumption of the groundwater pump was estimated from known groundwater depth. The water pump’s energy use was calculated using an empirical formula (modified from [22]).
W W P = 1 1000 η i n v 100 η m o t 100 q ρ g H m η m 100 t
where W W P is the energy consumption of a water pump (kJ), η i n v is inverter efficiency (%), η m o t is motor efficiency (%), g is gravitational acceleration (m/s2), H m and η m are the total head (m) and efficiency of a water pump when the rotational speed of the motor shaft is m (%) of the rated speed. The numbers 1000 and 100 are used to convert from J to kJ and from percentage to decimal, respectively. In Equation (4), η i n v , η m o t , and ρ are constant, q is calculated by Equation (3), and H m and η m are functions of the rotational speed ratio m .
The total dynamic head H is the sum of static head h S and friction losses h F L .
H = h S + h F L
Friction losses h F L are defined as:
h F L = f L D v 2 2 g
where f is the frictional coefficient of the pipe, L is the length of the pipe (m), D is the inner diameter of the pipe (m), v is flow velocity (m/s), and g is gravitational acceleration (m/s2).
When using the injection well, the static head h S is effectively zero, so that the total dynamic head H is nearly equal to friction losses h F L . A constant value is determined from the relationship of the total dynamic head and flow rate obtained from the characteristic chart of the water pump.
f L D = 212.336
When the rotational speed of the motor shaft is m (% of the rated value), the flow rate q m (m3/s), total dynamic head H m (m), and efficiency of a water pump η m are represented as follows [22]. Equation (10) is an approximate estimation.
q m = m 100 q 100
H m = m 100 2 H 100
η m = 1 η 100 m 100 1 5
where q 100 (m3/s), H 100 (m), and η 100 are the flow rate, total dynamic head, and efficiency of a water pump at the rated rotational speed of m = 100 (%), respectively. The number 100 is used to convert from percentage to decimal.

2.5. Heating and Cooling Demand Patterns

The heating and cooling demand patterns of hospitals, hotels, offices, and commercial facilities were derived from published data [21]. The heating season was defined as December to March, and the cooling season as April to November. Target indoor setpoints were 22 °C during heating and 26 °C during cooling. The annual heating and cooling demands per unit floor area were 162 and 363 MJ/m2 for hospitals, 200 and 366 MJ/m2 for hotels, 56 and 295 MJ/m2 for offices, and 188 and 627 MJ/m2 for commercial facilities, respectively. Required heating and cooling capacities were 298 kJ/(m2·h) and 392 kJ/(m2·h) for hospitals, 369 kJ/(m2·h) and 472 kJ/(m2·h) for hotels, 268 kJ/(m2·h) and 357 kJ/(m2·h) for offices, and 366 kJ/(m2·h) and 691 kJ/(m2·h) for commercial facilities, respectively.
The part-load heat output from the heat pump is expressed as:
Q H e a t i n g , n = n 100 Q H e a t i n g , 100
Q C o o l i n g ,   n = n 100 Q C o o l i n g , 100
where Q H e a t i n g , n , Q C o o l i n g , n   are produced heat at n (%) part-load ratio by a heat pump in heating and cooling operations, respectively. Q H e a t i n g , 100 , Q C o o l i n g , 100 are produced heat at the rated operation in heating and cooling operations, respectively.
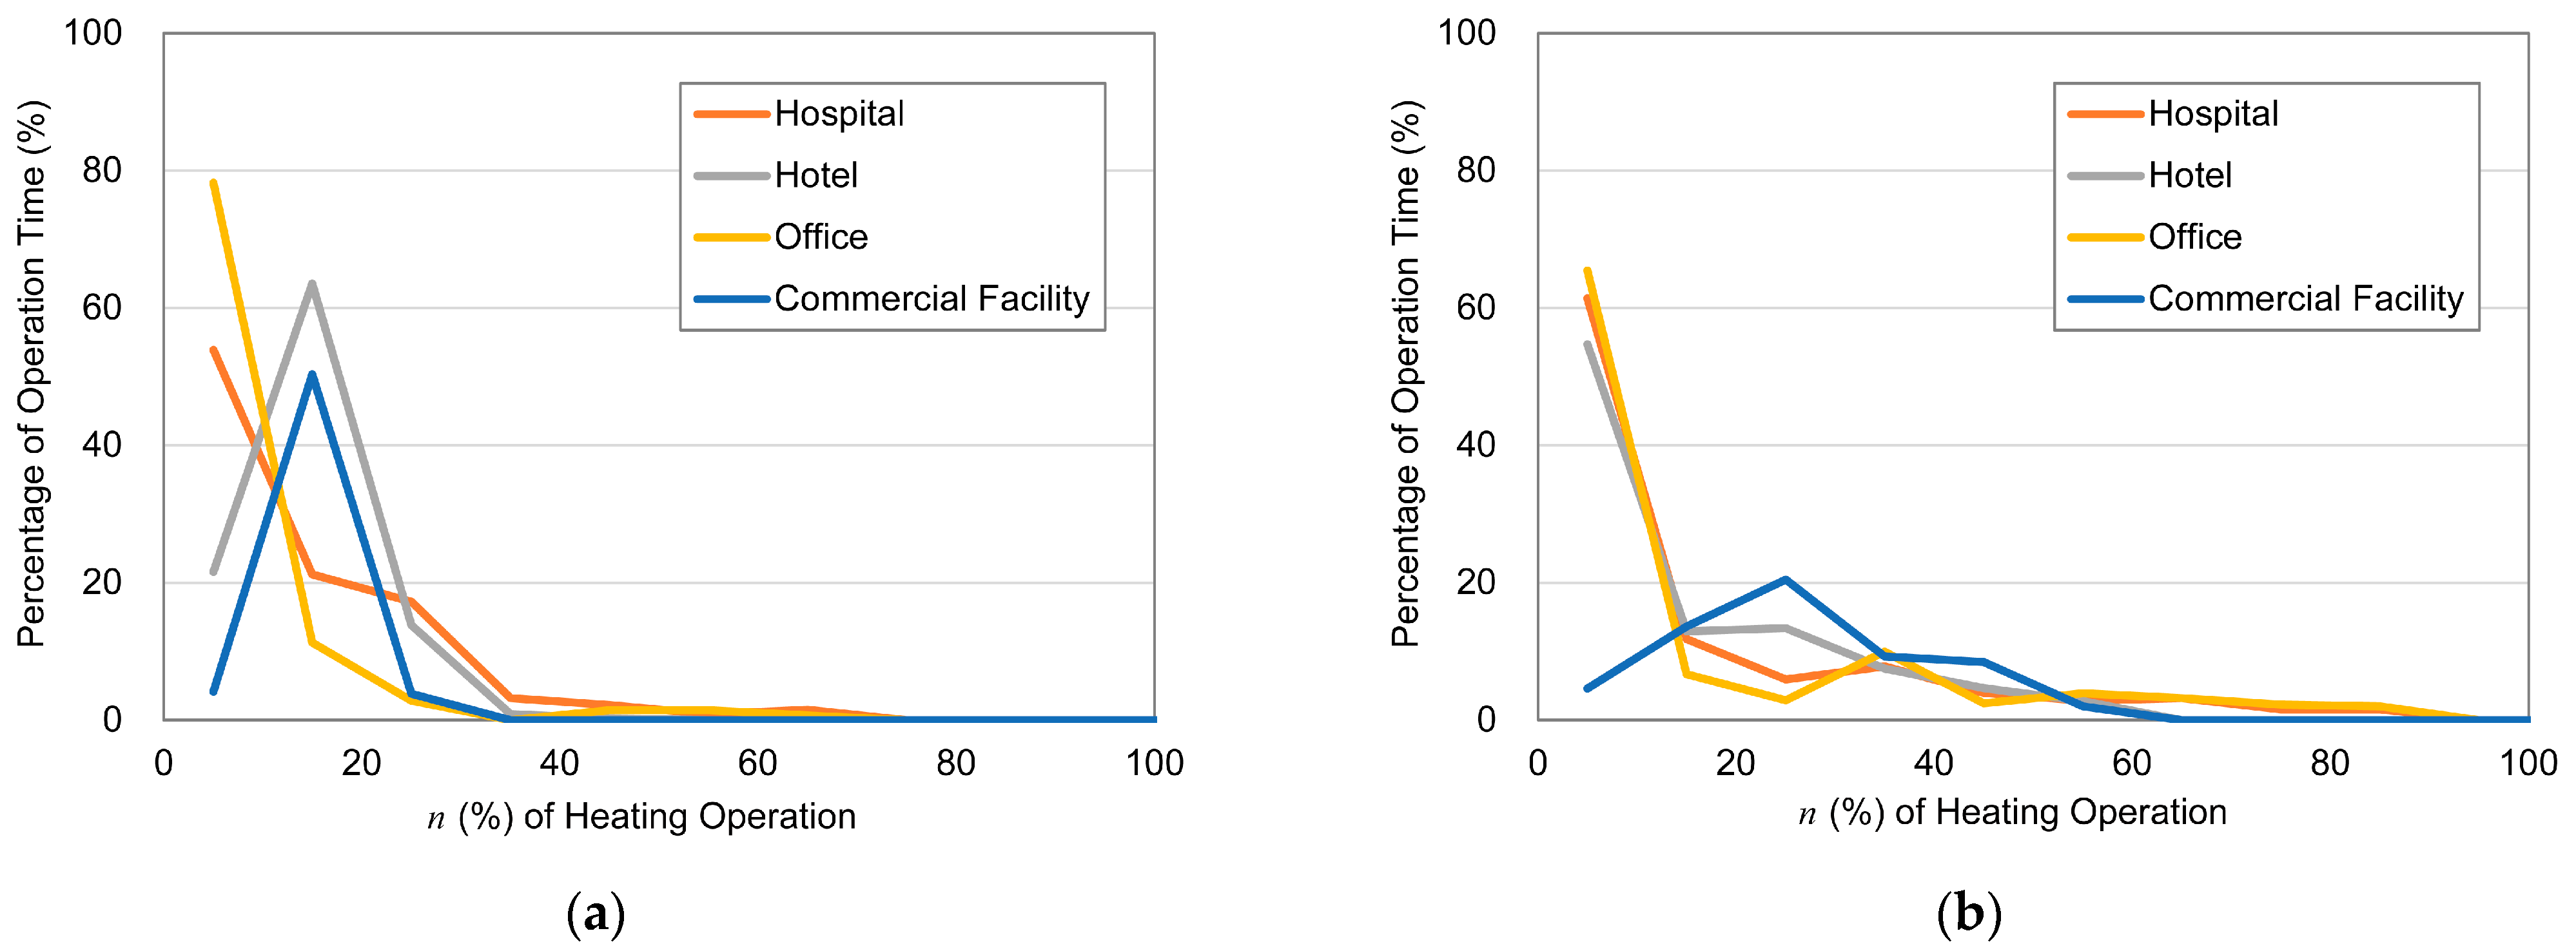
Assuming that the heat matches supplied heat, the resulting load distributions are shown in Figure 7.
The results indicate that heating loads were predominantly below 30% and cooling loads below 60%. More than 50% of both heating and cooling demand occurred at less than a 10% load for hospitals and offices. Commercial facilities showed the highest fraction in the 10–20% (heating) and 20–30% (cooling) ranges. This demonstrates that the system’s energy consumption was strongly affected by low-load operation, which varies significantly among building types.

2.6. Mapping Annual Total Energy Consumption

Resource maps were created using ESRI ArcGIS Desktop. The study area was divided into 250 m × 250 m meshes. For each mesh, the annual total energy consumption of the open-loop GSHP system was calculated from groundwater level, groundwater temperature, and building type. Energy consumption values are expressed as a ratio to standard reference conditions (groundwater depth of 15 m and groundwater temperature of 17 °C) to allow relative comparison.

3. Results

3.1. COP Estimated from Measured Parameters

During heating and cooling experiments, three parameters were recorded: (1) the inlet temperature of groundwater, (2) the temperature difference between inlet and outlet groundwater across the groundwater heat exchange unit, and (3) the part-load ratio of the heat pump. Figure 8 (blue dots) shows the relationships between these parameters and the COP. Multiple regression analysis was applied, yielding the following predictive equations:
C O P H e a t i n g = 0.07969 T i n 0.1310 T i n T o u t 0.0002572 n 2 + 0.03301 n + 1.879
C O P C o o l i n g = 0.1721 T i n + 0.4220 T i n T o u t 0.001194 n 2 + 0.1167 n + 10.06
Equations (13) and (14) indicate that the effect of the groundwater inlet temperature on the COP was an increase of 0.07969 per °C during heating and a decrease of 0.1721 per °C during cooling. The calculated trends align closely with the observed relationships between the COP and the three measured parameters (Figure 8a–c), confirming that these regression models can reliably estimate the COP for varying conditions.

3.2. Energy Consumption of Groundwater Pump Estimated from Flow Rate and Total Dynamic Head

The relationship between the pump rotational speed ratio (m), flow rate at m ( q m ), and total dynamic head at m ( H m ) was also modeled using multiple regression analysis.
m = 0.002061 q m 1 3 0.03416 q m 1 2 + 0.04485 q m + 0.001820 H m 1 3 + 0.09791 H m 1 2 + 0.06703 H m
This equation allows calculation of the rotational speed ratio m from the flow rate q m and total dynamic head H m (derived from Equations (3) and (5)). For injection to a seepage pit, the static head is approximately equal to the groundwater depth. Once m is obtained, the efficiency of the water pump η m can be calculated using Equation (10), and the corresponding energy consumption of the water pump W W P (kJ) can then be estimated using Equation (4).

3.3. Effects of Groundwater Depth/Temperature/Building Type on Annual Total Energy Consumption

To construct resource maps of open-loop GSHP systems, the annual total energy consumption was estimated based on groundwater depth, groundwater temperature, and building type. The part-load ratio (n) was divided into 10% intervals. For each interval, the annual energy consumption was calculated from the sum of heat pump and groundwater pump energy requirements based on Equations (4), (13), and (14).
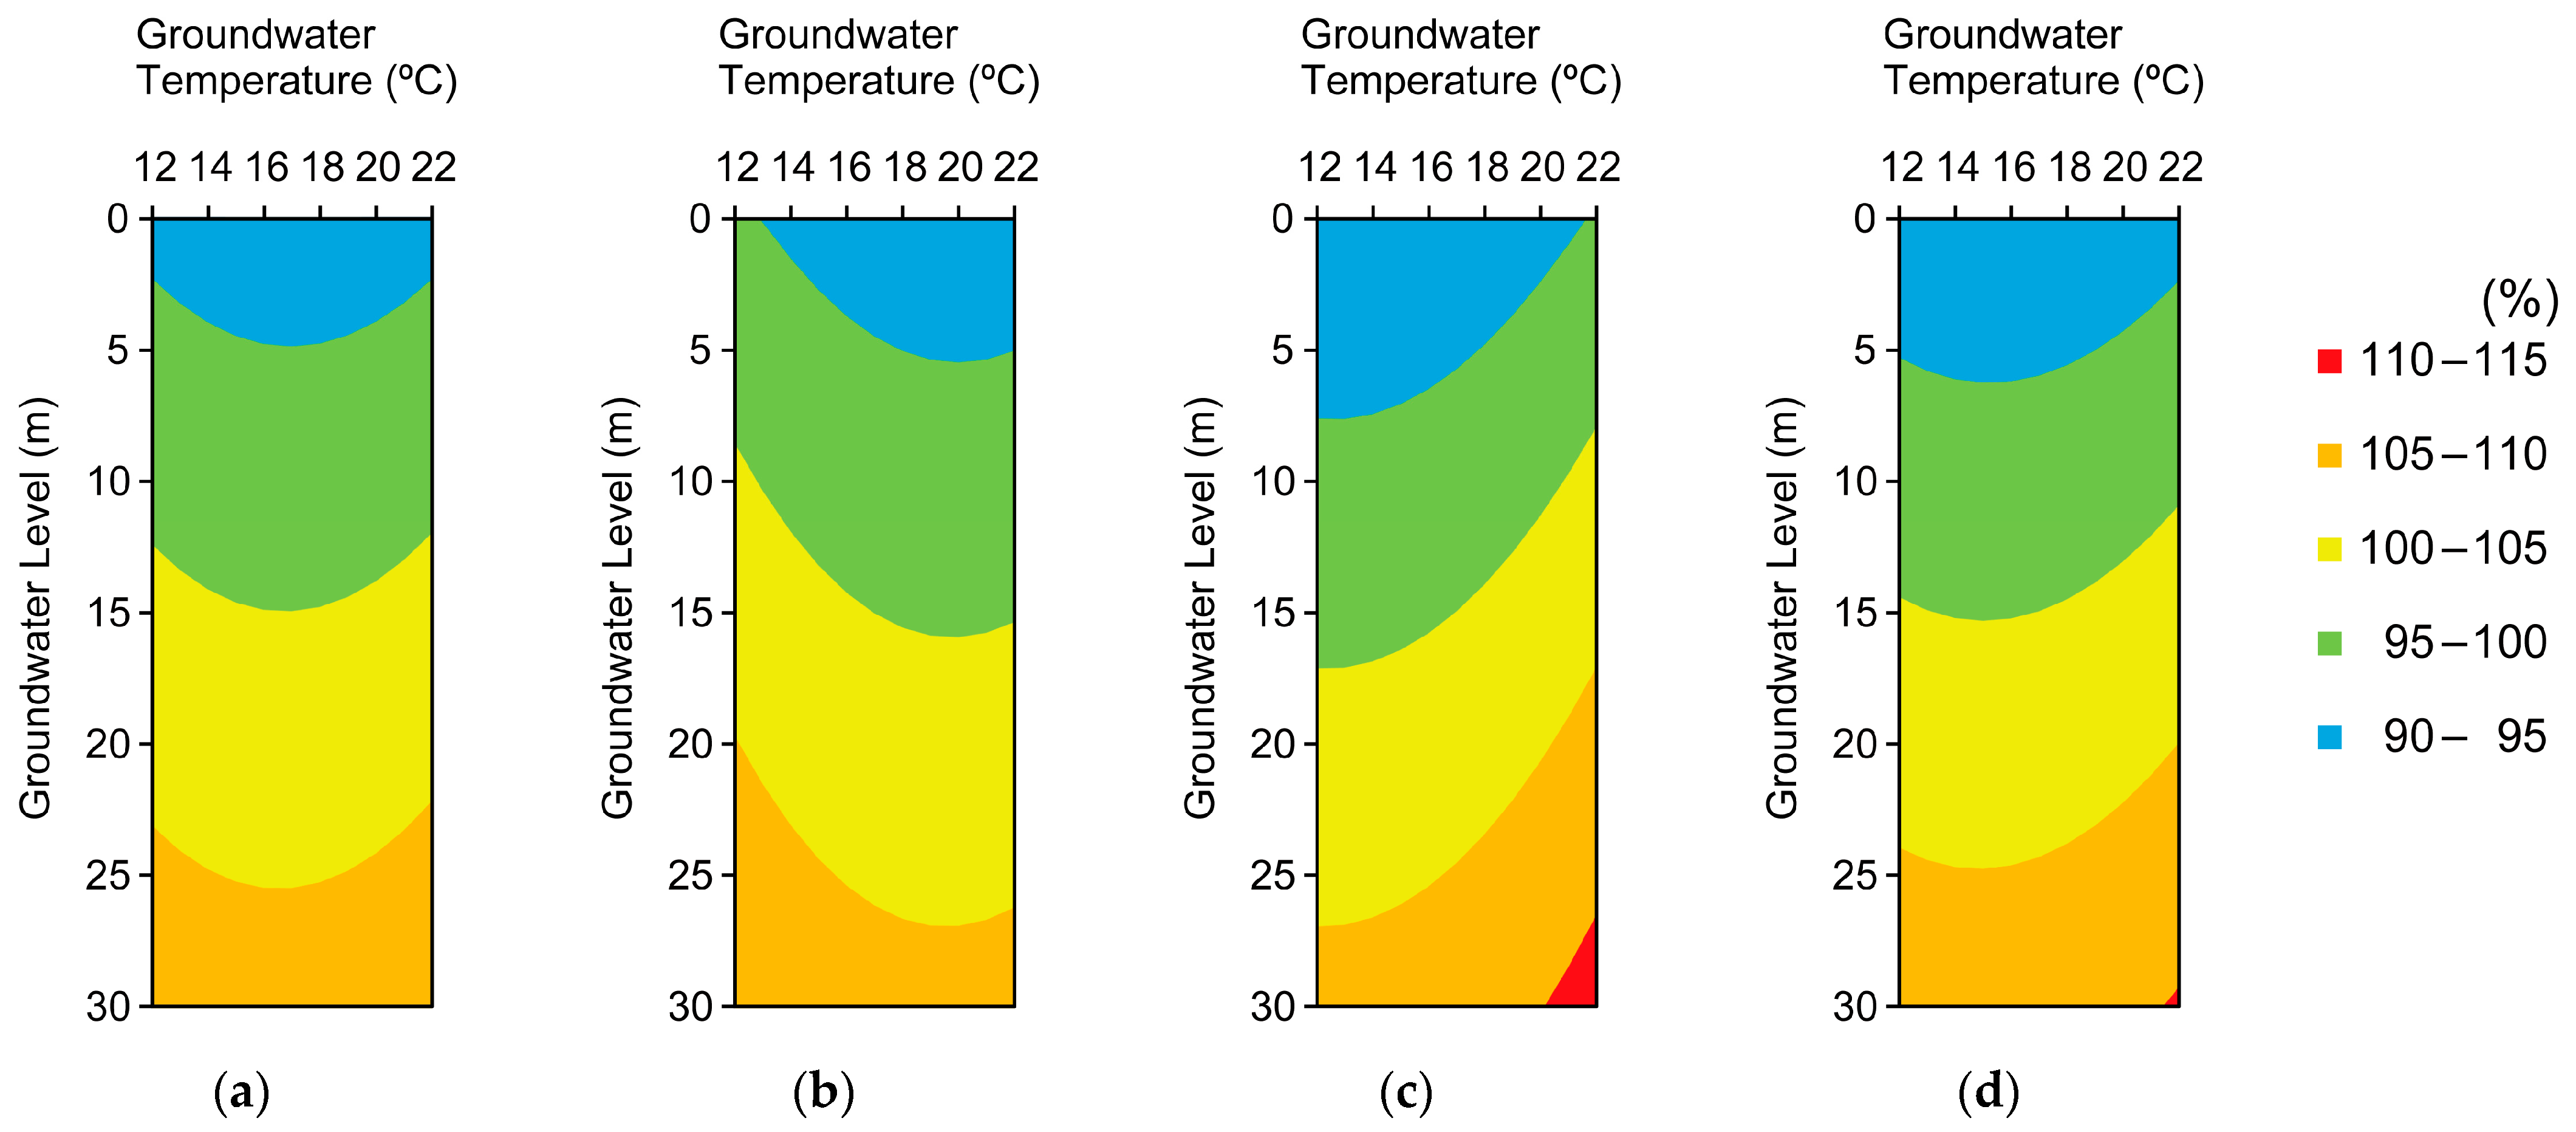
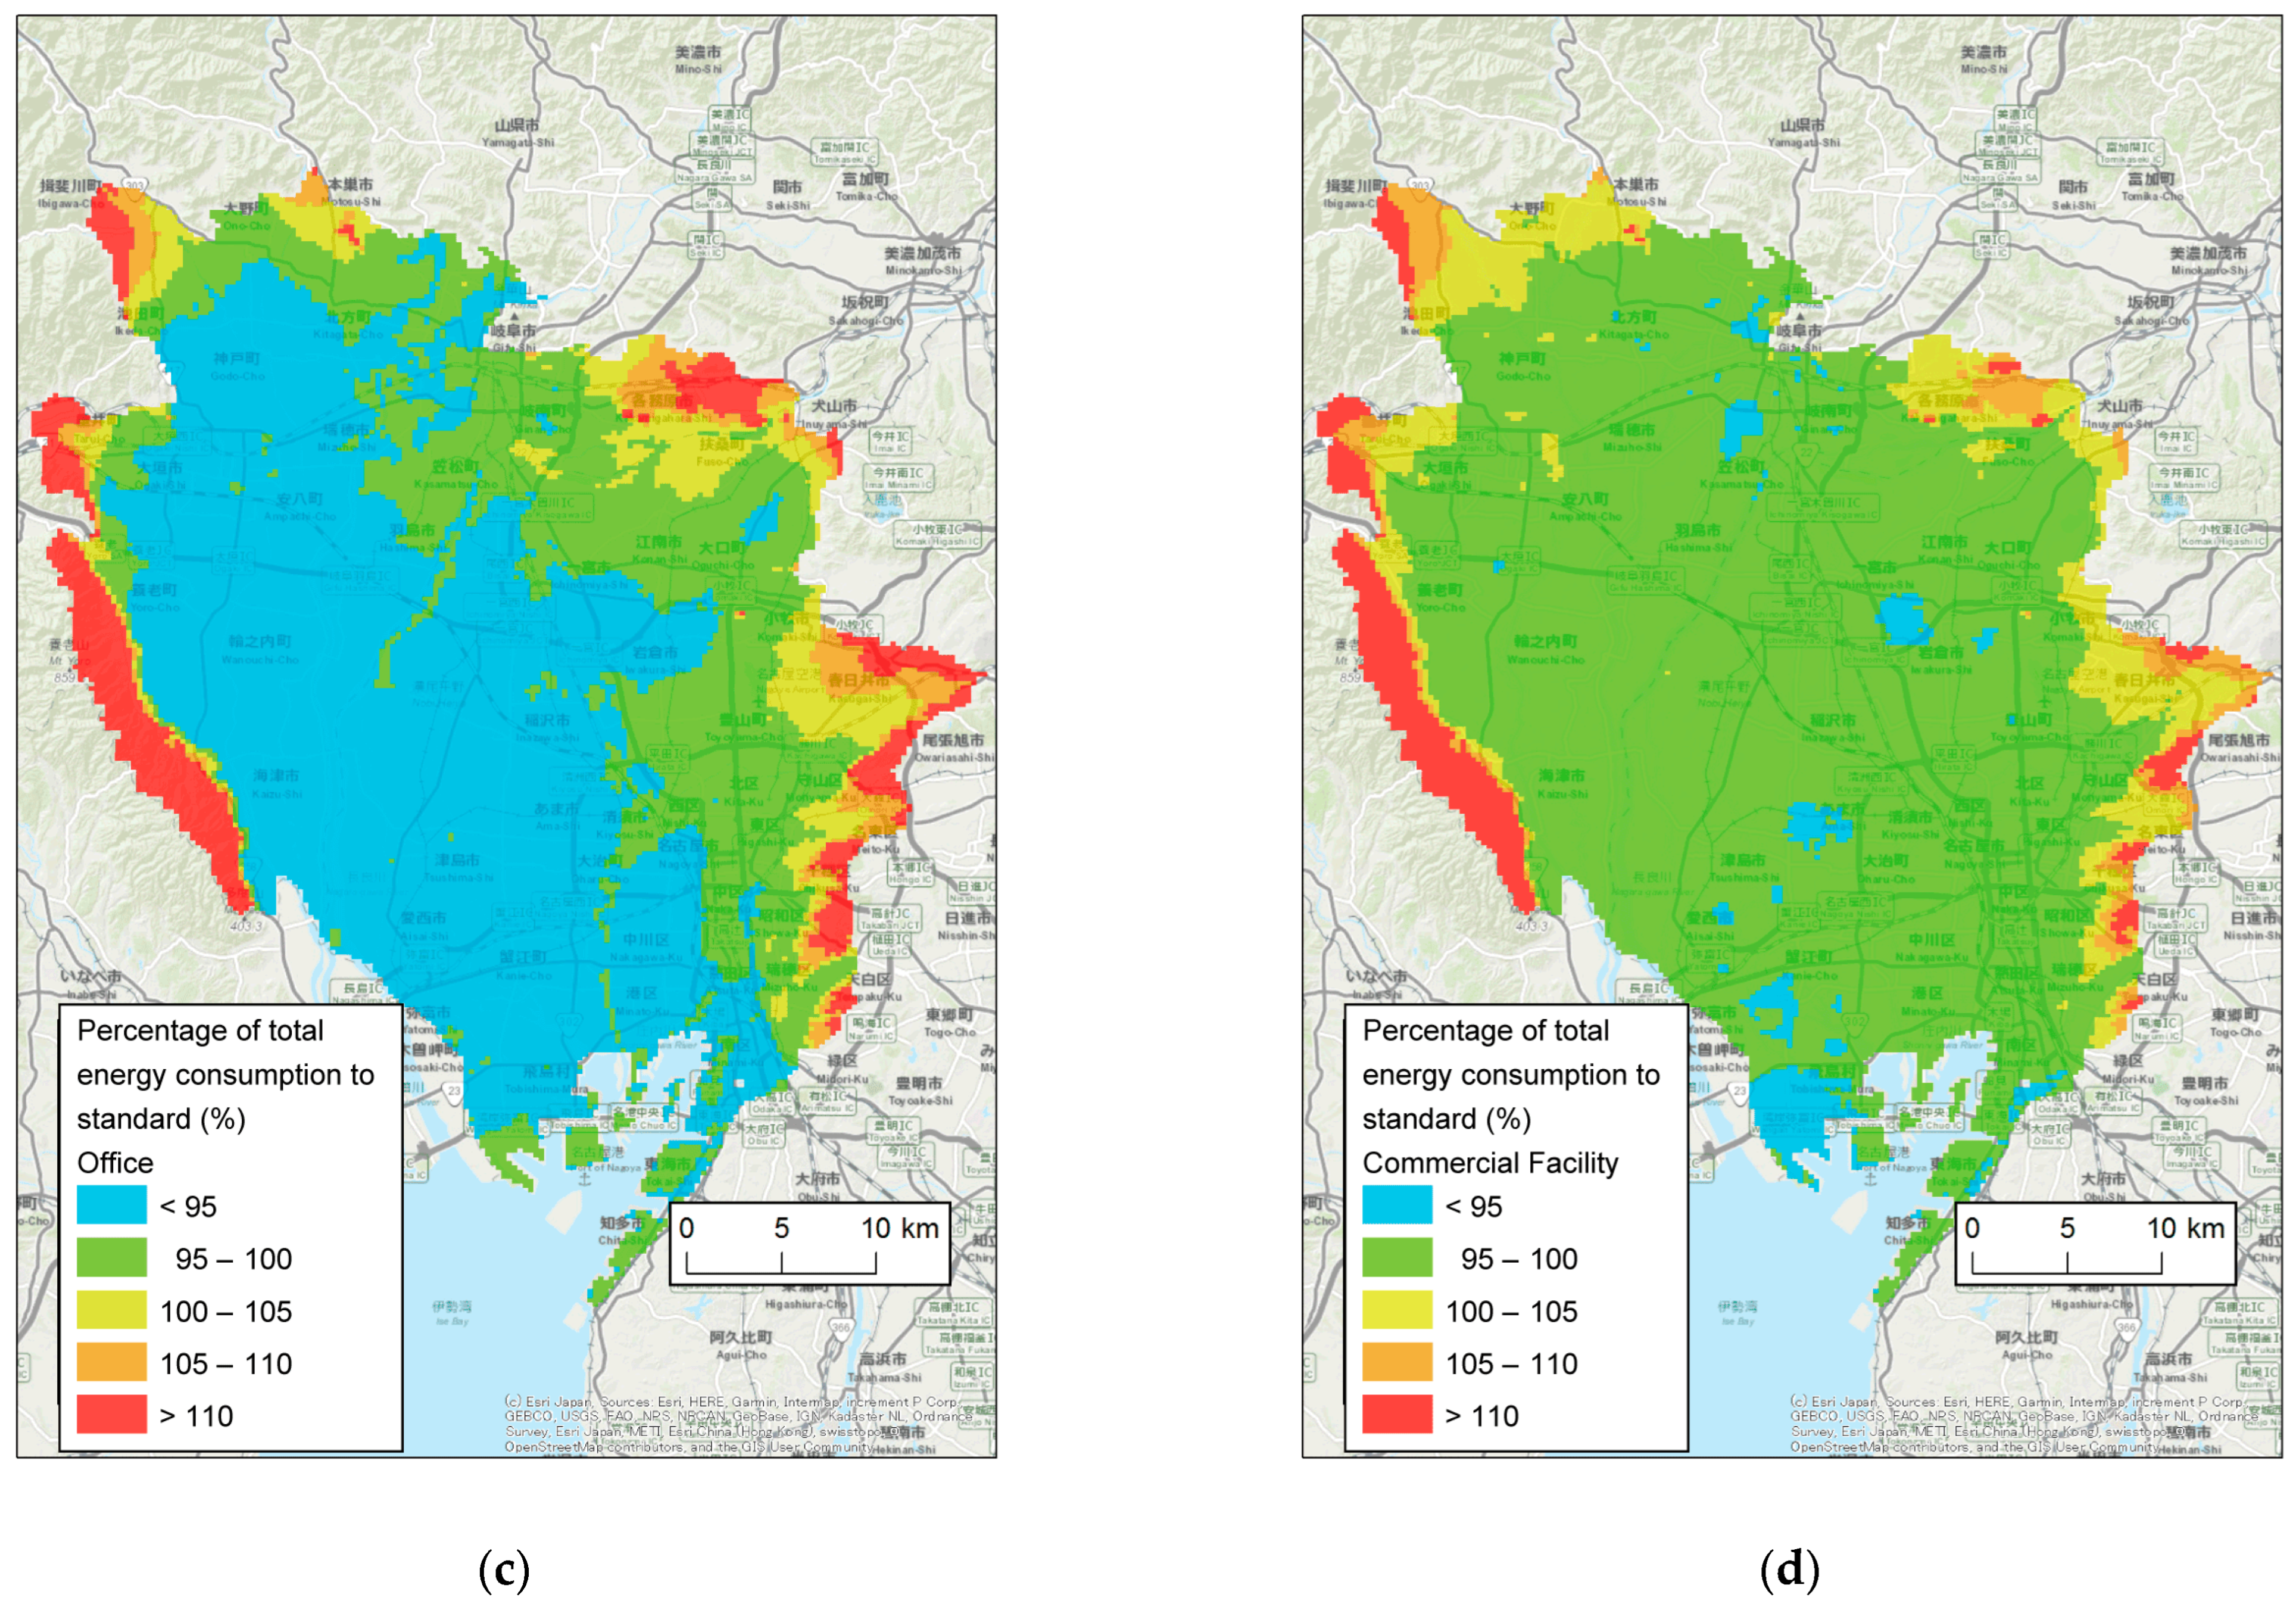
Figure 9 shows the variation in annual energy consumption for hospitals, hotels, offices, and commercial facilities under different groundwater temperatures and depths. Deeper groundwater resulted in higher energy consumption because additional energy was required to lift groundwater at a constant rate. For each building type, the 100% reference line forms a convex curve and its minimum point varies by building type: 17.0 °C for hospitals, 20.0 °C for hotels, 12.9 °C for offices, and 15.2 °C for commercial facilities. These differences reflect variations in the ratio of heating to cooling demand. Buildings with more heating demand (e.g., hotels) benefit from higher groundwater temperatures, while those with a cooling dominant demand (e.g., offices) are favored by lower temperatures.

3.4. Resource Maps of Open-Loop GSHP Systems

Groundwater temperatures and depth distribution were compiled from previous geological and hydrogeological studies of the Nobi Plain [23,24,25]. These data were combined with the analysis described in Section 3.3 to calculate annual total energy consumption across the region.
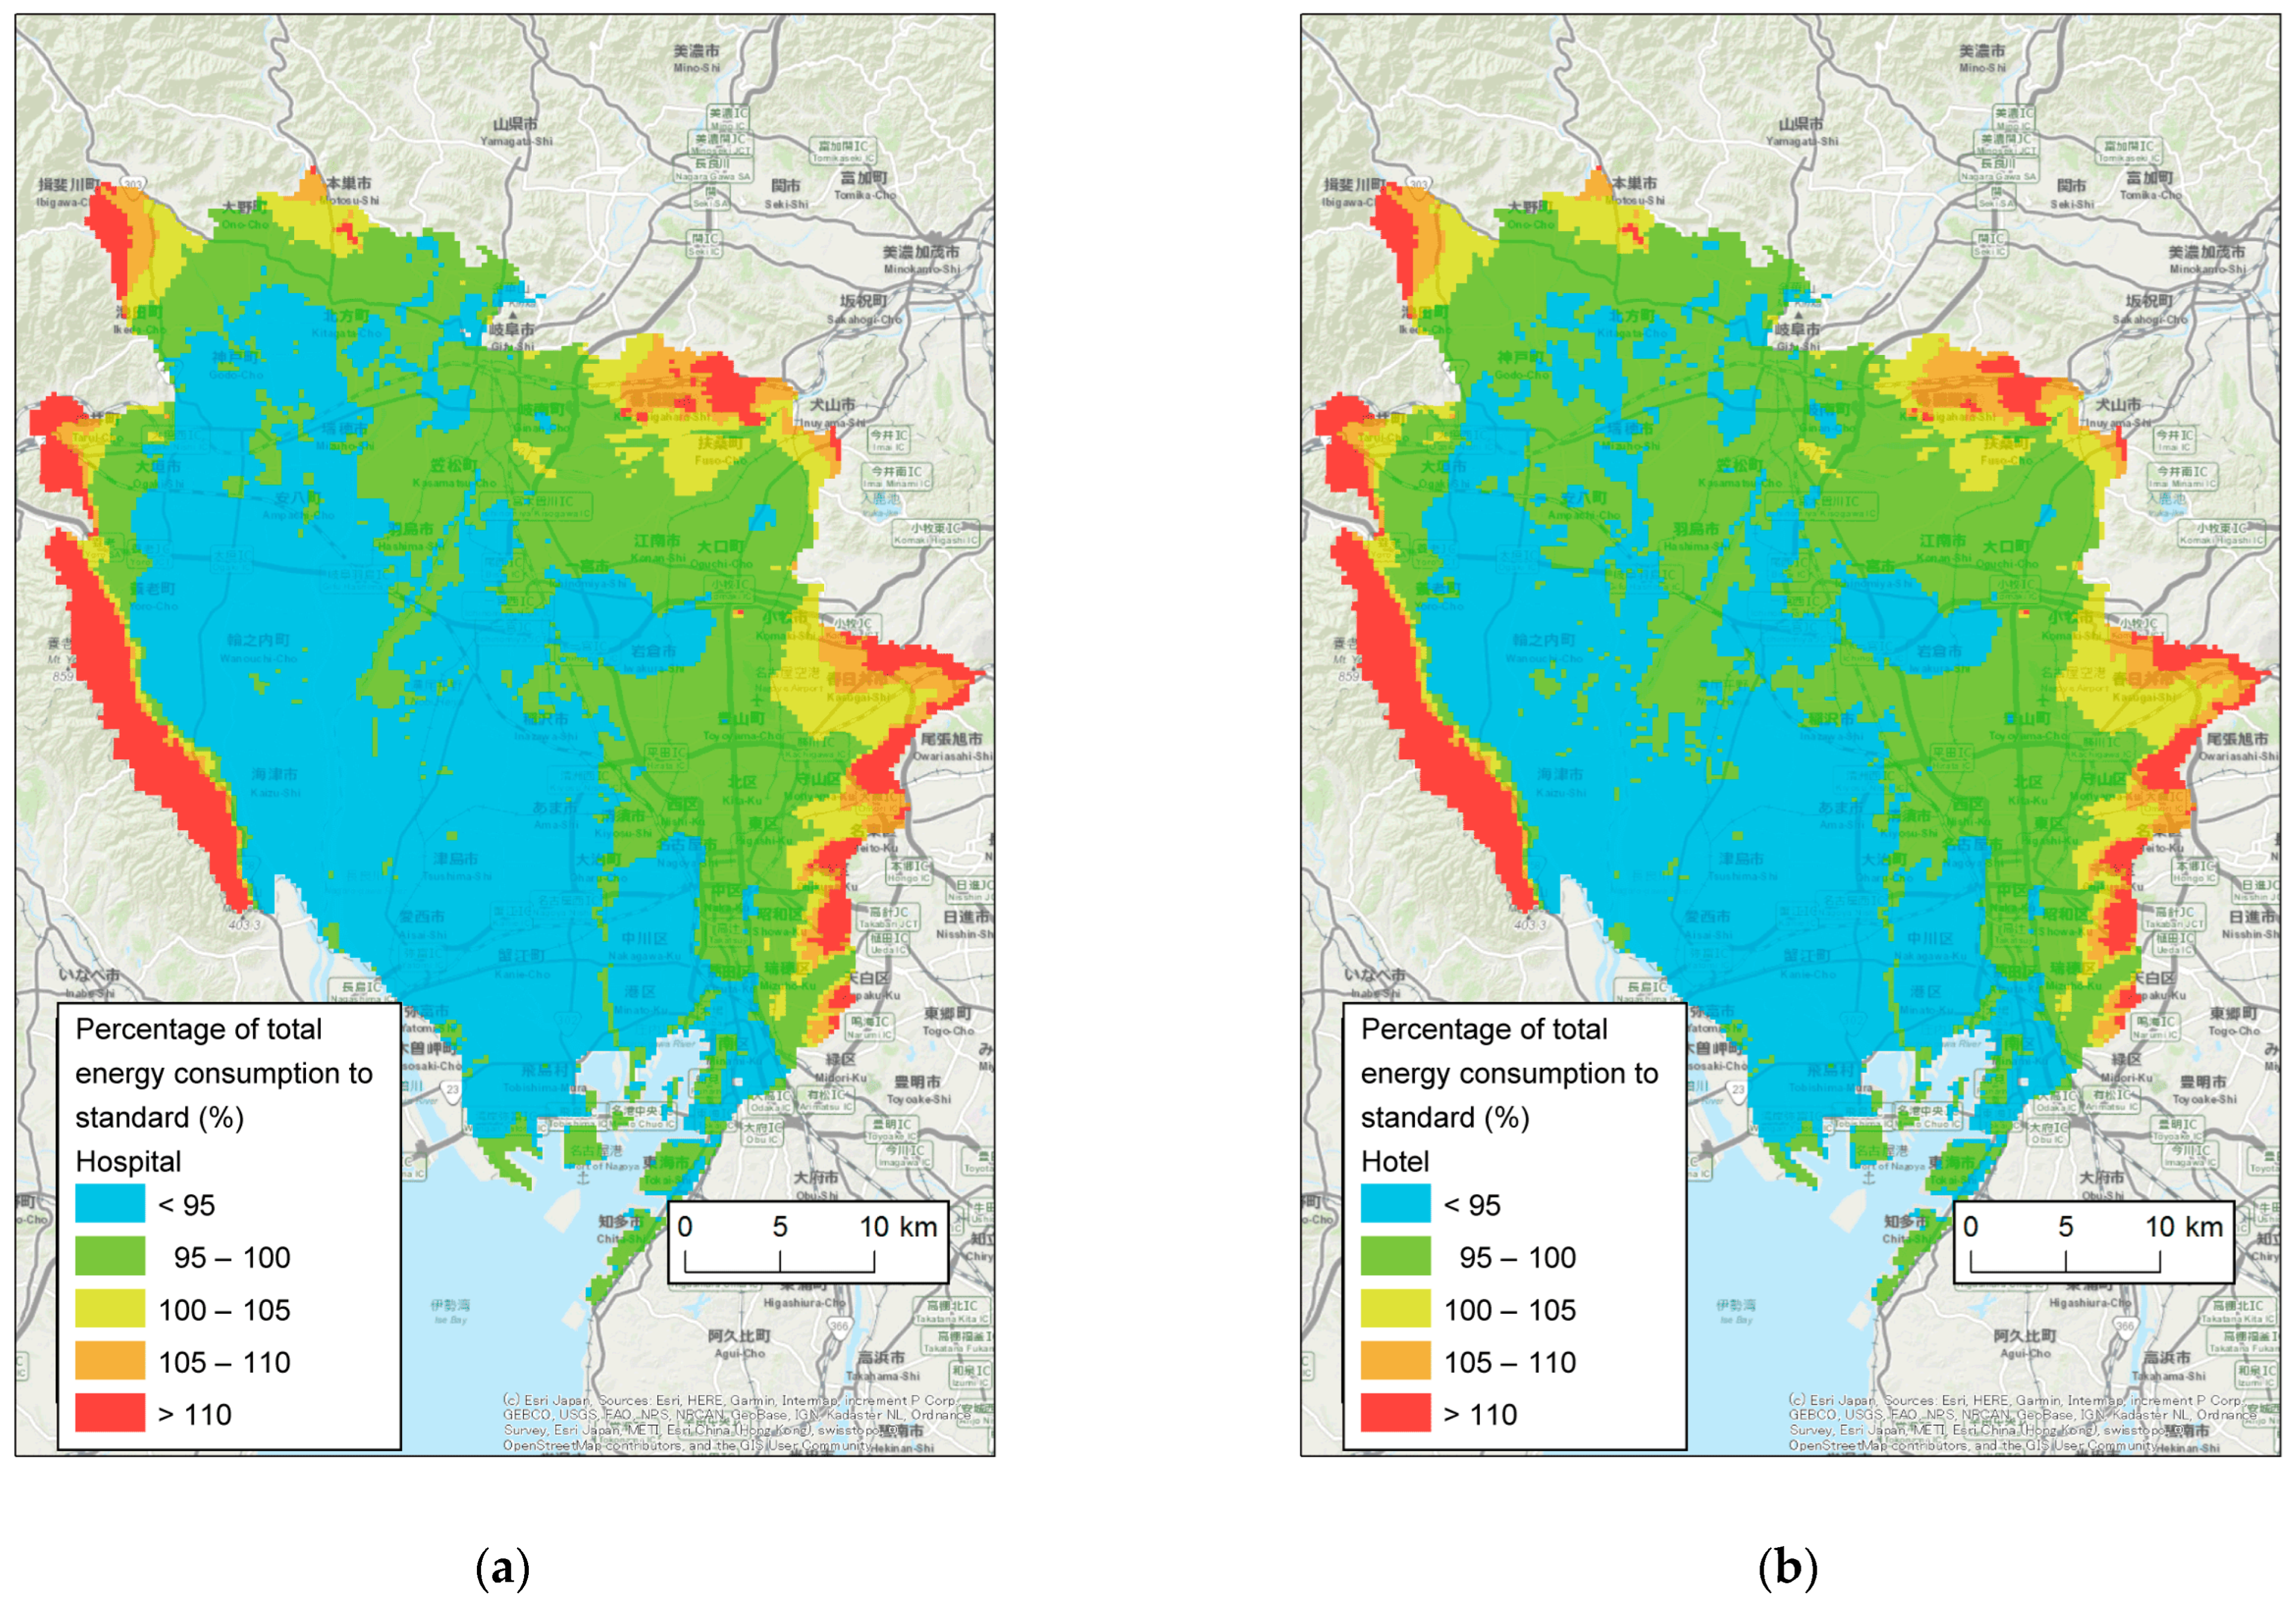
The resulting resource maps (Figure 10) illustrate the percentage of energy consumption relative to the reference condition (17 °C, 15 m depth). The Nobi Plain is surrounded by mountains and hills, with fault activity along the western boundary causing lower elevation in the west. Areas with deep groundwater (eastern and marginal zones) show higher energy consumption, while the western part of the plain exhibits lower consumption due to shallower groundwater.
Patterns differ by building type. Hotels and offices show broader low-energy zones in the west. For commercial facilities, low-energy areas are smaller, but the proportion of high-energy areas in the east is also smaller than it is for hotels or offices. These differences result from varying heating/cooling ratios. Lower groundwater temperatures favor cooling-dominant facilities, whereas higher temperatures favor heating-dominant ones.

4. Discussion

The total cost of open-loop GSHP systems includes both initial costs (e.g., drilling and equipment installation) and operating and maintenance costs. Although drilling depth, well diameter, and pump capacity have been mapped in previous studies [11,12,13,15], these reflect initial costs. In contrast, the present study focused on annual total energy consumption, a direct proxy for running costs. Unlike earlier ATES studies that addressed city-scale greenhouse gas reduction [15], this study provides regional-scale distributions of annual energy consumption, thereby offering practical guidance for site selection.
Equations (13)–(15), although derived from specific equipment, enable the estimation of heat pump and groundwater pump energy use across a range of groundwater conditions. They are therefore well suited to evaluate relative spatial patterns of energy consumption. These equations can identify areas most appropriate for heating-dominant or cooling-dominant applications.
The resource maps (Figure 10) indicate that offices, which have cooling-dominant demand, show extensive low-energy zones, particularly in the northwest where groundwater temperature is lower. However, climate warming could raise groundwater temperatures, reducing the size of these low-energy zones. Although this study focused on four building types, similar analyses can be extended to other facility types. For example, data centers, which have strong cooling-dominant demand, would likely exhibit spatial patterns similar to those of offices.
Operational challenges for open-loop systems include well clogging, corrosion, and scaling. These are influenced by groundwater chemistry, yet remain poorly quantified. Future studies should address the relationship between groundwater quality and maintenance frequency to better predict total lifecycle costs.
The resource maps produced here are expected to support the wider adoption of open-loop GSHP systems by providing clear visual guidance on locations with reduced operational costs, thereby assisting decision-making for building owners, engineers, and policymakers.

5. Conclusions

A comprehensive heating and cooling experiment was conducted at a public hall in Gifu City, Japan, with continuous monitoring of groundwater temperatures, pumping rates, and the energy consumption of both the heat pump and groundwater pump. Key findings are as follows.
Regression equations for the COP were developed using the inlet groundwater temperature, inlet–outlet temperature difference, and part-load ratio. The analysis revealed that the COP increased by 0.07969 per °C during heating and decreased by 0.1721 per °C during cooling.
Incorporating pump characteristics, a methodology was established for estimating annual total energy consumption for any groundwater temperature and depth.
Resource maps for the Nobi Plain show that annual energy consumption is generally lower in the northwest, where groundwater is cooler and shallower, except for marginal areas with deep groundwater tables.
These maps provide valuable insights into operation costs and can guide site selection for open-loop GSHP systems.

Author Contributions

Conceptualization, T.O.; methodology, T.O. and K.S.; data monitoring, T.O. and I.M.; data analysis, K.S. and T.O.; writing—original draft preparation, T.O.; writing—review and editing, K.S. and I.M.; funding acquisition, T.O. All authors have read and agreed to the published version of the manuscript.

Funding

This research was funded by the New Energy and Industrial Technology Development Organization (NEDO), grant number 15102718-0.

Data Availability Statement

The raw data supporting the conclusions of this article will be made available by the authors on request.

Acknowledgments

We am deeply grateful to the local government of Gifu City for allowing the use of a public hall for heating/cooling experiments; to Koji Tanifuji, Zeneral Heatpump Industry Co. Ltd., for his insightful comments that improved the multiple regression analysis; and to Naoko Yamada for her assistance with data arrangements.

Conflicts of Interest

Author Ichiro Masaki is employed by the company Zeneral Heatpump Industry Co., Ltd. The remaining authors declare that the research was conducted in the absence of any commercial or financial relationships that could be construed as a potential conflict of interest.

References

  1. Lund, J.W.; Toth, A.N. Direct Utilization of Geothermal Energy 2020 Worldwide Review. Geothermics 2021, 90, 101915. [Google Scholar] [CrossRef]
  2. Fujii, H.; Inatomi, T.; Itoi, R.; Uchida, Y. Development of Suitability Maps for Ground-Coupled Heat Pump Systems Using Groundwater and Heat Transport Models. Geothermics 2007, 36, 459–472. [Google Scholar] [CrossRef]
  3. Shrestha, G.; Bando, K.; Ishihara, T.; Fujino, T.; Isoishi, K.; Tomigashi, A.; Uchida, Y. Assessment of Installation Suitability of a Vertical Closed Loop Ground Source Heat Pump System in Regional Scale. Geothermics 2023, 113, 102766. [Google Scholar] [CrossRef]
  4. Kaneko, S.; Uchida, Y.; Shrestha, G.; Ishihara, T.; Yoshioka, M. Factors Affecting the Installation Potential of Ground Source Heat Pump Systems: A Comparative Study for the Sendai Plain and Aizu Basin, Japan. Energies 2018, 11, 2860. [Google Scholar] [CrossRef]
  5. Duque, J.; Moya, M.; Urresta, E.; Harnisth, K. Geospatial Assessment of Soil Thermal Conductivity for Geothermal Energy Systems in Ecuador. Geothermics 2025, 131, 103373. [Google Scholar] [CrossRef]
  6. Assouline, D.; Mohajeri, N.; Gudmundsson, A.; Scartezzini, J.-L. A Machine Learning Approach for Mapping the Very Shallow Theoretical Geothermal Potential. Geotherm. Energy 2019, 7, 19. [Google Scholar] [CrossRef]
  7. Galgaro, A.; Di Sipio, E.; Teza, G.; Destro, E.; De Carli, M.; Chiesa, S.; Zarrella, A.; Emmi, G.; Manzella, A. Empirical Modeling of Maps of Geo-Exchange Potential for Shallow Geothermal Energy at Regional Scale. Geothermics 2015, 57, 173–184. [Google Scholar] [CrossRef]
  8. Santilano, A.; Donato, A.; Galgaro, A.; Montanari, D.; Menghini, A.; Viezzoli, A.; Di Sipio, E.; Destro, E.; Manzella, A. An Integrated 3D Approach to Assess the Geothermal Heat-Exchange Potential: The Case Study of Western Sicily (Southern Italy). Renew. Energy 2016, 97, 611–624. [Google Scholar] [CrossRef]
  9. Walch, A.; Li, X.; Chambers, J.; Mohajeri, N.; Yilmaz, S.; Patel, M.; Scartezzini, J.L. Shallow Geothermal Energy Potential for Heating and Cooling of Buildings with Regeneration under Climate Change Scenarios. Energy 2022, 244, 123086. [Google Scholar] [CrossRef]
  10. Zhang, Y.; Choudhary, R.; Soga, K. Influence of GSHP System Design Parameters on the Geothermal Application Capacity and Electricity Consumption at City-Scale for Westminster, London. Energy Build. 2015, 106, 3–12. [Google Scholar] [CrossRef]
  11. Ohtani, T.; Ishihara, M.; Kojma, S. A Potential Installation of Groundwater Heat Pump Systems Inferred from Well Information in the Nobi Plain. J. Geotherm. Res. Soc. Jpn. 2008, 30, 121–129. [Google Scholar] [CrossRef]
  12. Nam, Y.; Ooka, R. Development of Potential Map for Ground and Groundwater Heat Pump Systems and the Application to Tokyo. Energy Build. 2011, 43, 677–685. [Google Scholar] [CrossRef]
  13. Abesser, C.; Lewis, M.A.; Marchant, A.P.; Hulbert, A.G. Mapping Suitability for Open-Loop Ground Source Heat Pump Systems: A Screening Tool for England and Wales, UK. Q. J. Eng. Geol. Hydrogeol. 2014, 47, 373–380. [Google Scholar] [CrossRef]
  14. Arola, T.; Eskola, L.; Hellen, J.; Korkka-Niemi, K. Mapping the Low Enthalpy Geothermal Potential of Shallow Quaternary Aquifers in Finland. Geotherm. Energy 2014, 2, 9. [Google Scholar] [CrossRef]
  15. Stemmle, R.; Hammer, V.; Blum, P.; Menberg, K. Potential of Low-Temperature Aquifer Thermal Energy Storage (LT-ATES) in Germany. Geotherm. Energy 2022, 10, 24. [Google Scholar] [CrossRef]
  16. Al-Madhlom, Q.; Al-Ansari, N.; Laue, J.; Nordell, B.; Hussain, H.M. Site Selection of Aquifer Thermal Energy Storage Systems in Shallow Groundwater Conditions. Water 2019, 11, 1393. [Google Scholar] [CrossRef]
  17. Stemmle, R.; Lee, H.; Blum, P.; Menberg, K. City-Scale Heating and Cooling with Aquifer Thermal Energy Storage (ATES). Geotherm. Energy 2024, 12, 2. [Google Scholar] [CrossRef]
  18. Todorov, O.; Alanne, K.; Virtanen, M.; Kosonen, R. Aquifer Thermal Energy Storage (ATES) for District Heating and Cooling: A Novel Modeling Approach Applied in a Case Study of a Finnish Urban District. Energies 2020, 13, 2478. [Google Scholar] [CrossRef]
  19. Luo, J.; Wang, H.; Zhang, H.; Yan, Z. A Geospatial Assessment of the Installation Potential of Shallow Geothermal Systems in a Graben Basin. Renew. Energy 2021, 165, 553–564. [Google Scholar] [CrossRef]
  20. Ohtani, T.; Mizuno, T.; Kohda, A. Underground Temperature Distribution and Spatial Suitability Assessment for Geothermal Heat Pumps in the Alluvial Fan of the Nagara River, Central Japan. J. Geotherm. Res. Soc. Japan 2019, 41, 121–133. [Google Scholar] [CrossRef]
  21. Society of Heating, Air-Conditioning and Sanitary Engineers of Japan. Planning, Design and Operation of City Gas Cogeneration; Society of Heating, Air-Conditioning and Sanitary Engineers of Japan: Tokyo, Japan, 2015. [Google Scholar]
  22. Sotoyama, Y. Intelligible Book of Pump Technologies; The Nikkan Kogyo Shimbun: Tokyo, Japan, 2016. [Google Scholar]
  23. Ohtani, T.; Mizuno, T.; Kouda, A.; Kojima, S. Seasonal Change of Underground Temperature and the Use of Geothermal in Gifu City, Japan. In Proceedings of the World Geothermal Congress 2015, Melbourne, VIC, Australia, 19–24 April 2015; pp. 19–25. [Google Scholar]
  24. Uchida, Y.; Sakura, Y. Subsurface Temperature Profiles in the Nobi Plain, Central Japan. Bull. Geol. Surv. Japan 1999, 50, 635–659. [Google Scholar]
  25. Uchida, Y.; Hayashi, T. Water Environment Map No. 4 “Nobi Plain” [CD-ROM]; Geological Survey of Japan, AIST: Tsukuba, Japan, 2004. [Google Scholar]
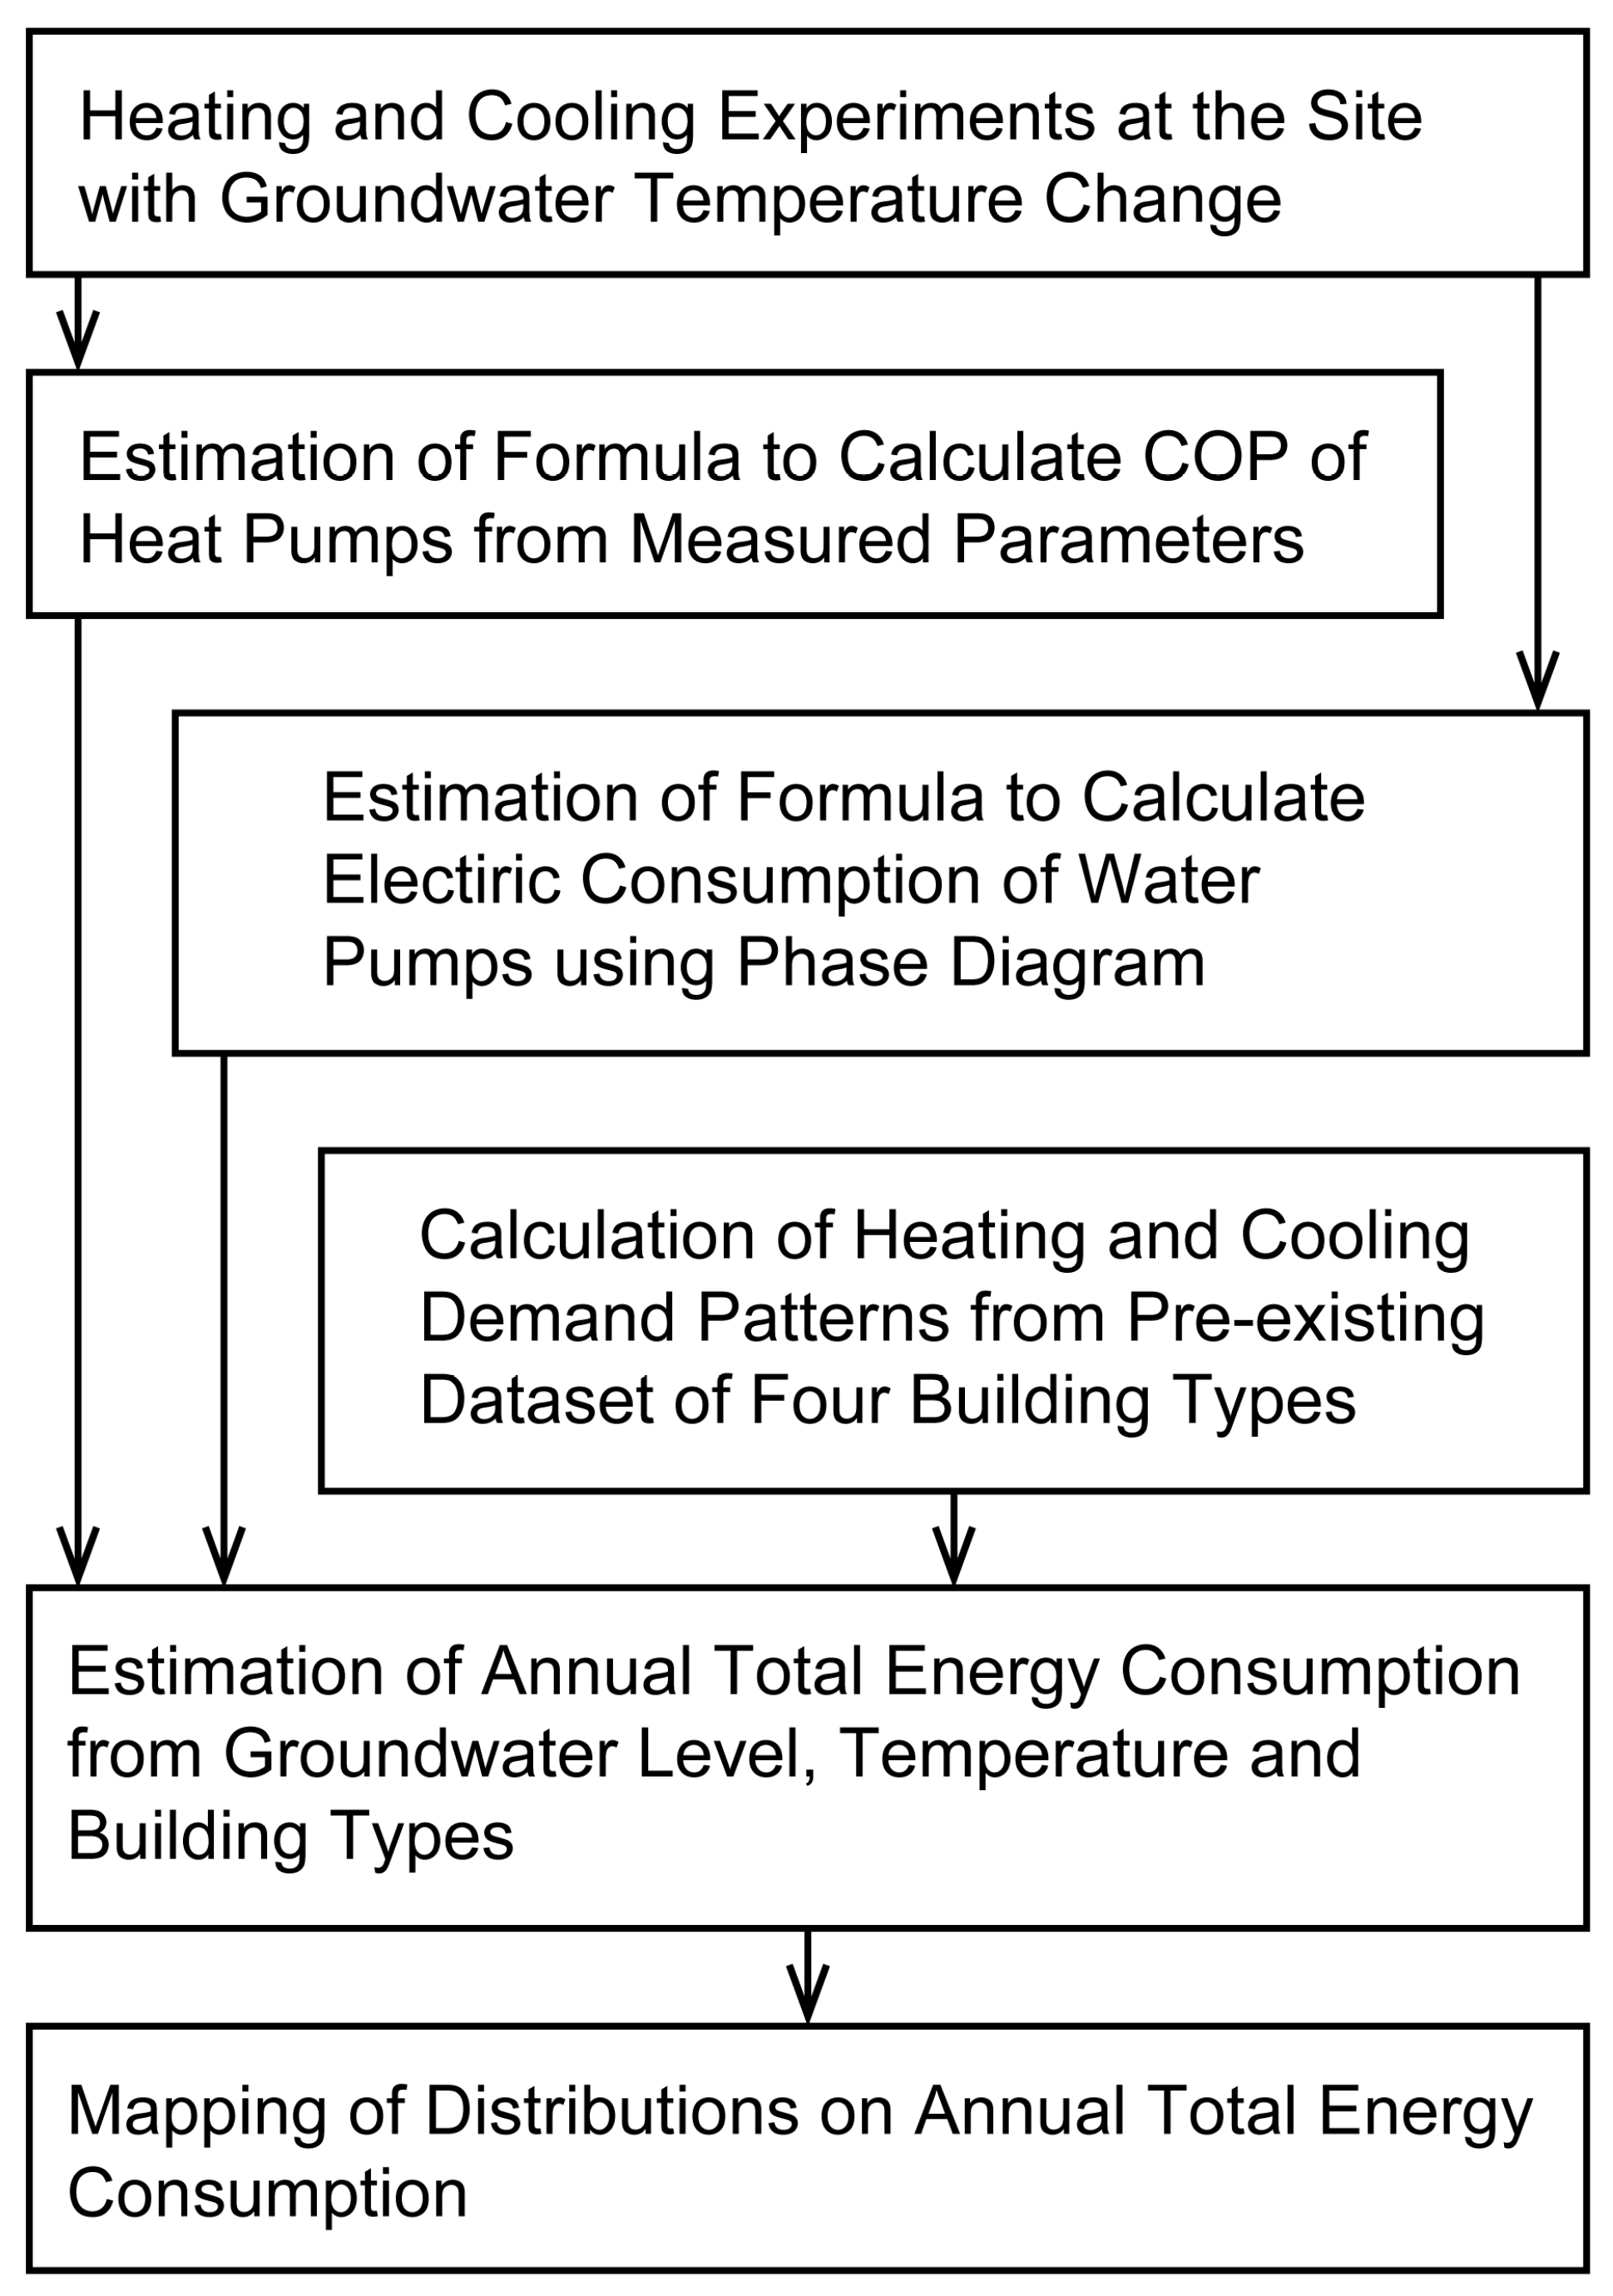
Figure 1. Outline of this study.
Applsci 15 09195 g001
Figure 2. Temperature changes in groundwater in the study area [20]. (a) Phase difference distribution between underground and river water temperatures. Open circles are observation wells. (b) Underground temperature variations at 15 m depth in observation wells.
Applsci 15 09195 g002
Figure 3. The external appearance of the heating and cooling experiment site with the groundwater heat exchanger unit and the heat pump.
Applsci 15 09195 g003
Figure 4. A schematic image of the heating and cooling experiment system of an open-loop ground-source heat pump. P: water pumps with wattmeters; F: flowmeters; T: thermometers; W: wattmeter.
Applsci 15 09195 g004
Figure 5. Seasonal fluctuations of inlet groundwater temperature into the groundwater heat exchange unit. H: heating; C: cooling.
Applsci 15 09195 g005
Figure 6. The total dynamic head, static head, and friction losses of the groundwater circuit from a pumping well to an injection well or a water seepage pit. H: total dynamic head; hS: static head; hFL: friction losses; q: pumping rate of groundwater.
Applsci 15 09195 g006
Figure 7. The distribution of the ratio of the heat demand to the heating/cooling capacity: (a) heating and (b) cooling.
Applsci 15 09195 g007
Figure 8. Relationships between the COP and three measured parameters: (a) the inlet temperature of groundwater, (b) the temperature difference between inlet and outlet groundwater, and (c) the part-load ratio of the heat pump.
Applsci 15 09195 g008
Figure 9. Ratio of annual energy consumption for (a) hospitals, (b) hotels, (c) offices, and (d) commercial facilities relative to 17 °C and 15 m reference conditions.
Applsci 15 09195 g009
Figure 10. Spatial distribution of the annual energy consumption ratios for (a) hospitals, (b) hotels, (c) offices, and (d) commercial facilities in the Nobi Plain, central Japan. The non-English terms present the names of cities, towns, and villages.
Applsci 15 09195 g010aApplsci 15 09195 g010b
Disclaimer/Publisher’s Note: The statements, opinions and data contained in all publications are solely those of the individual author(s) and contributor(s) and not of MDPI and/or the editor(s). MDPI and/or the editor(s) disclaim responsibility for any injury to people or property resulting from any ideas, methods, instructions or products referred to in the content.