Article

Study on the Stability Evaluation Index System for Rock Slope–Anchoring Systems

1
College of Harbour and Coastal Engineering, Jimei University, Xiamen 361021, China
2
Xinjiang Transportation Science Research Institute Co., Ltd., Urumqi 831399, China
3
Key Laboratory of Transport Industry of Highway Engineering Technology in Arid Desert Areas, Urumqi 831399, China
4
Xinjiang Key Laboratory of Highway Engineering Technology in Arid Desert Areas, Urumqi 831399, China
*
Author to whom correspondence should be addressed.
Appl. Sci. 2025, 15(16), 9147; https://doi.org/10.3390/app15169147
Submission received: 1 August 2025 / Revised: 16 August 2025 / Accepted: 16 August 2025 / Published: 20 August 2025

Abstract

The stability of rock slope–anchoring systems is one of the core concerns in protecting the ecological environment and ensuring the safe operation of hydropower, transportation, and construction projects. The stability evaluation index system is a critical factor influencing the accuracy of such assessments. This study establishes a stability evaluation index system for rock slope–anchoring systems by incorporating multi-factor influence mechanisms. The approach involves indicator screening, development of a hierarchical analytical structure, definition of classification criteria, and comparative analysis. The results indicate the following: (1) The proposed index system fully considers the deformation and failure modes of rock slopes, the factors influencing stability, and the safety-related parameters of anchoring structures. (2) It comprehensively captures the multi-factor influence patterns affecting the stability of the rock slope–anchoring system. (3) Compared with traditional empirical and equal-interval grading methods, the grading standards defined by this system are more accurate, better reflect the intrinsic data characteristics, and yield higher classification precision.

1. Introduction

Anchoring technology offers advantages such as ease of construction, low self-weight, and cost-effectiveness [1,2,3,4] and has been widely adopted for slope reinforcement in infrastructure projects related to transportation, mining [5,6], and hydropower [7,8]. This has led to the formation of numerous rock slope–anchoring systems. The stability of these systems is a critical factor directly affecting the operational reliability of major infrastructure and the effectiveness of disaster prevention and mitigation. System instability can result in severe economic losses, environmental hazards, and casualties. Therefore, establishing a reliable and systematic evaluation index system for rock slope–anchoring system stability is of great importance for ensuring accurate stability assessments, safeguarding the safe operation of engineering projects, and protecting both the ecological environment and human safety.
At present, extensive research has been conducted on the evaluation of rock slope stability. The primary methods include the Limit Equilibrium Method (LEM), numerical simulation techniques, machine learning approaches, reliability analysis, and vector sum methods [9]. A summary of the main rock slope stability evaluation methods is presented in Table 1. Among these, LEM remains the most widely used approach, while numerical simulations and artificial intelligence techniques are emerging as prominent research trends [9]. Current applications of artificial intelligence in slope stability evaluation primarily utilize machine learning algorithms such as Artificial Neural Networks (ANNs), Support Vector Machines (SVMs), and Random Forests (RFs) [10,11,12,13,14,15,16,17]. A summary of the applications of AI-based methods in slope stability assessment is provided in Table 2.
In addition, intelligent slope stability prediction based on visual exploratory data analysis has been developed using six dimensionality reduction techniques: Principal Component Analysis (PCA), Kernel PCA, Factor Analysis (FA), Independent Component Analysis (ICA), Non-negative Matrix Factorisation (NMF), and t-distributed Stochastic Neighbor Embedding (t-SNE) [29]. Furthermore, several researchers have assessed slope stability based on parameters such as the Geological Strength Index (GSI), Slope Mass Rating (SMR), Chinese Slope Mass Rating (CSMR), and Continuous Slope Mass Rating (CoSMR) [30,31].
In the evaluation of the safety of anchoring structures, the main methods currently employed include the analytic hierarchy process (AHP) [32,33,34], numerical simulation [35,36,37], non-destructive testing (NDT) [5,38,39,40,41], monitoring data analysis [42,43,44], and artificial intelligence-based approaches [45,46]. Among these, non-destructive testing remains the most commonly used method for evaluating the safety of anchoring structures. A summary of commonly used non-destructive testing techniques is provided in Table 3.
Although various methods have been developed to assess slope stability and the safety of anchoring structures, the key challenge lies in establishing a comprehensive and systematic evaluation index system. The indicators proposed thus far are mainly categorized into five aspects: rock mass-related indicators, geometric structure indicators, environmental and dynamic indicators, integrated safety performance indicators, and anchoring system indicators. A summary is presented in Table 4.
Extensive research has been conducted on the evaluation of rock slope stability and anchoring structure safety, resulting in a wide range and variety of proposed evaluation indicators. However, studies focusing on establishing a unified stability evaluation index system for the systems remain limited. Moreover, the classification standards for indicators are still largely based on empirical judgment and equal-interval division, which are non-quantitative methods that may significantly affect the accuracy of stability evaluations. This study, based on a comprehensive literature review and the analytic hierarchy process (AHP), constructs a three-tiered index system comprising 24 primary indicators, 5 secondary indicators, and 1 tertiary indicator. A novel method is proposed for determining classification standards of continuous indicators, based on the influence patterns of stability coefficients in the systems. Finally, a comparative analysis using the K-nearest neighbor (KNN) algorithm is conducted to verify the rationality of the proposed indicator system.

2. Hierarchical Analytic Structure of the Indicator System

In statistics, an indicator is defined as a concept that reflects the quantitative characteristics of a population. The various characteristics of a whole are represented by different indicators that are relatively independent yet interrelated, collectively forming an indicator system.

2.1. Construction of the Hierarchical Analytical Structure for Rock Slope–Anchoring Systems

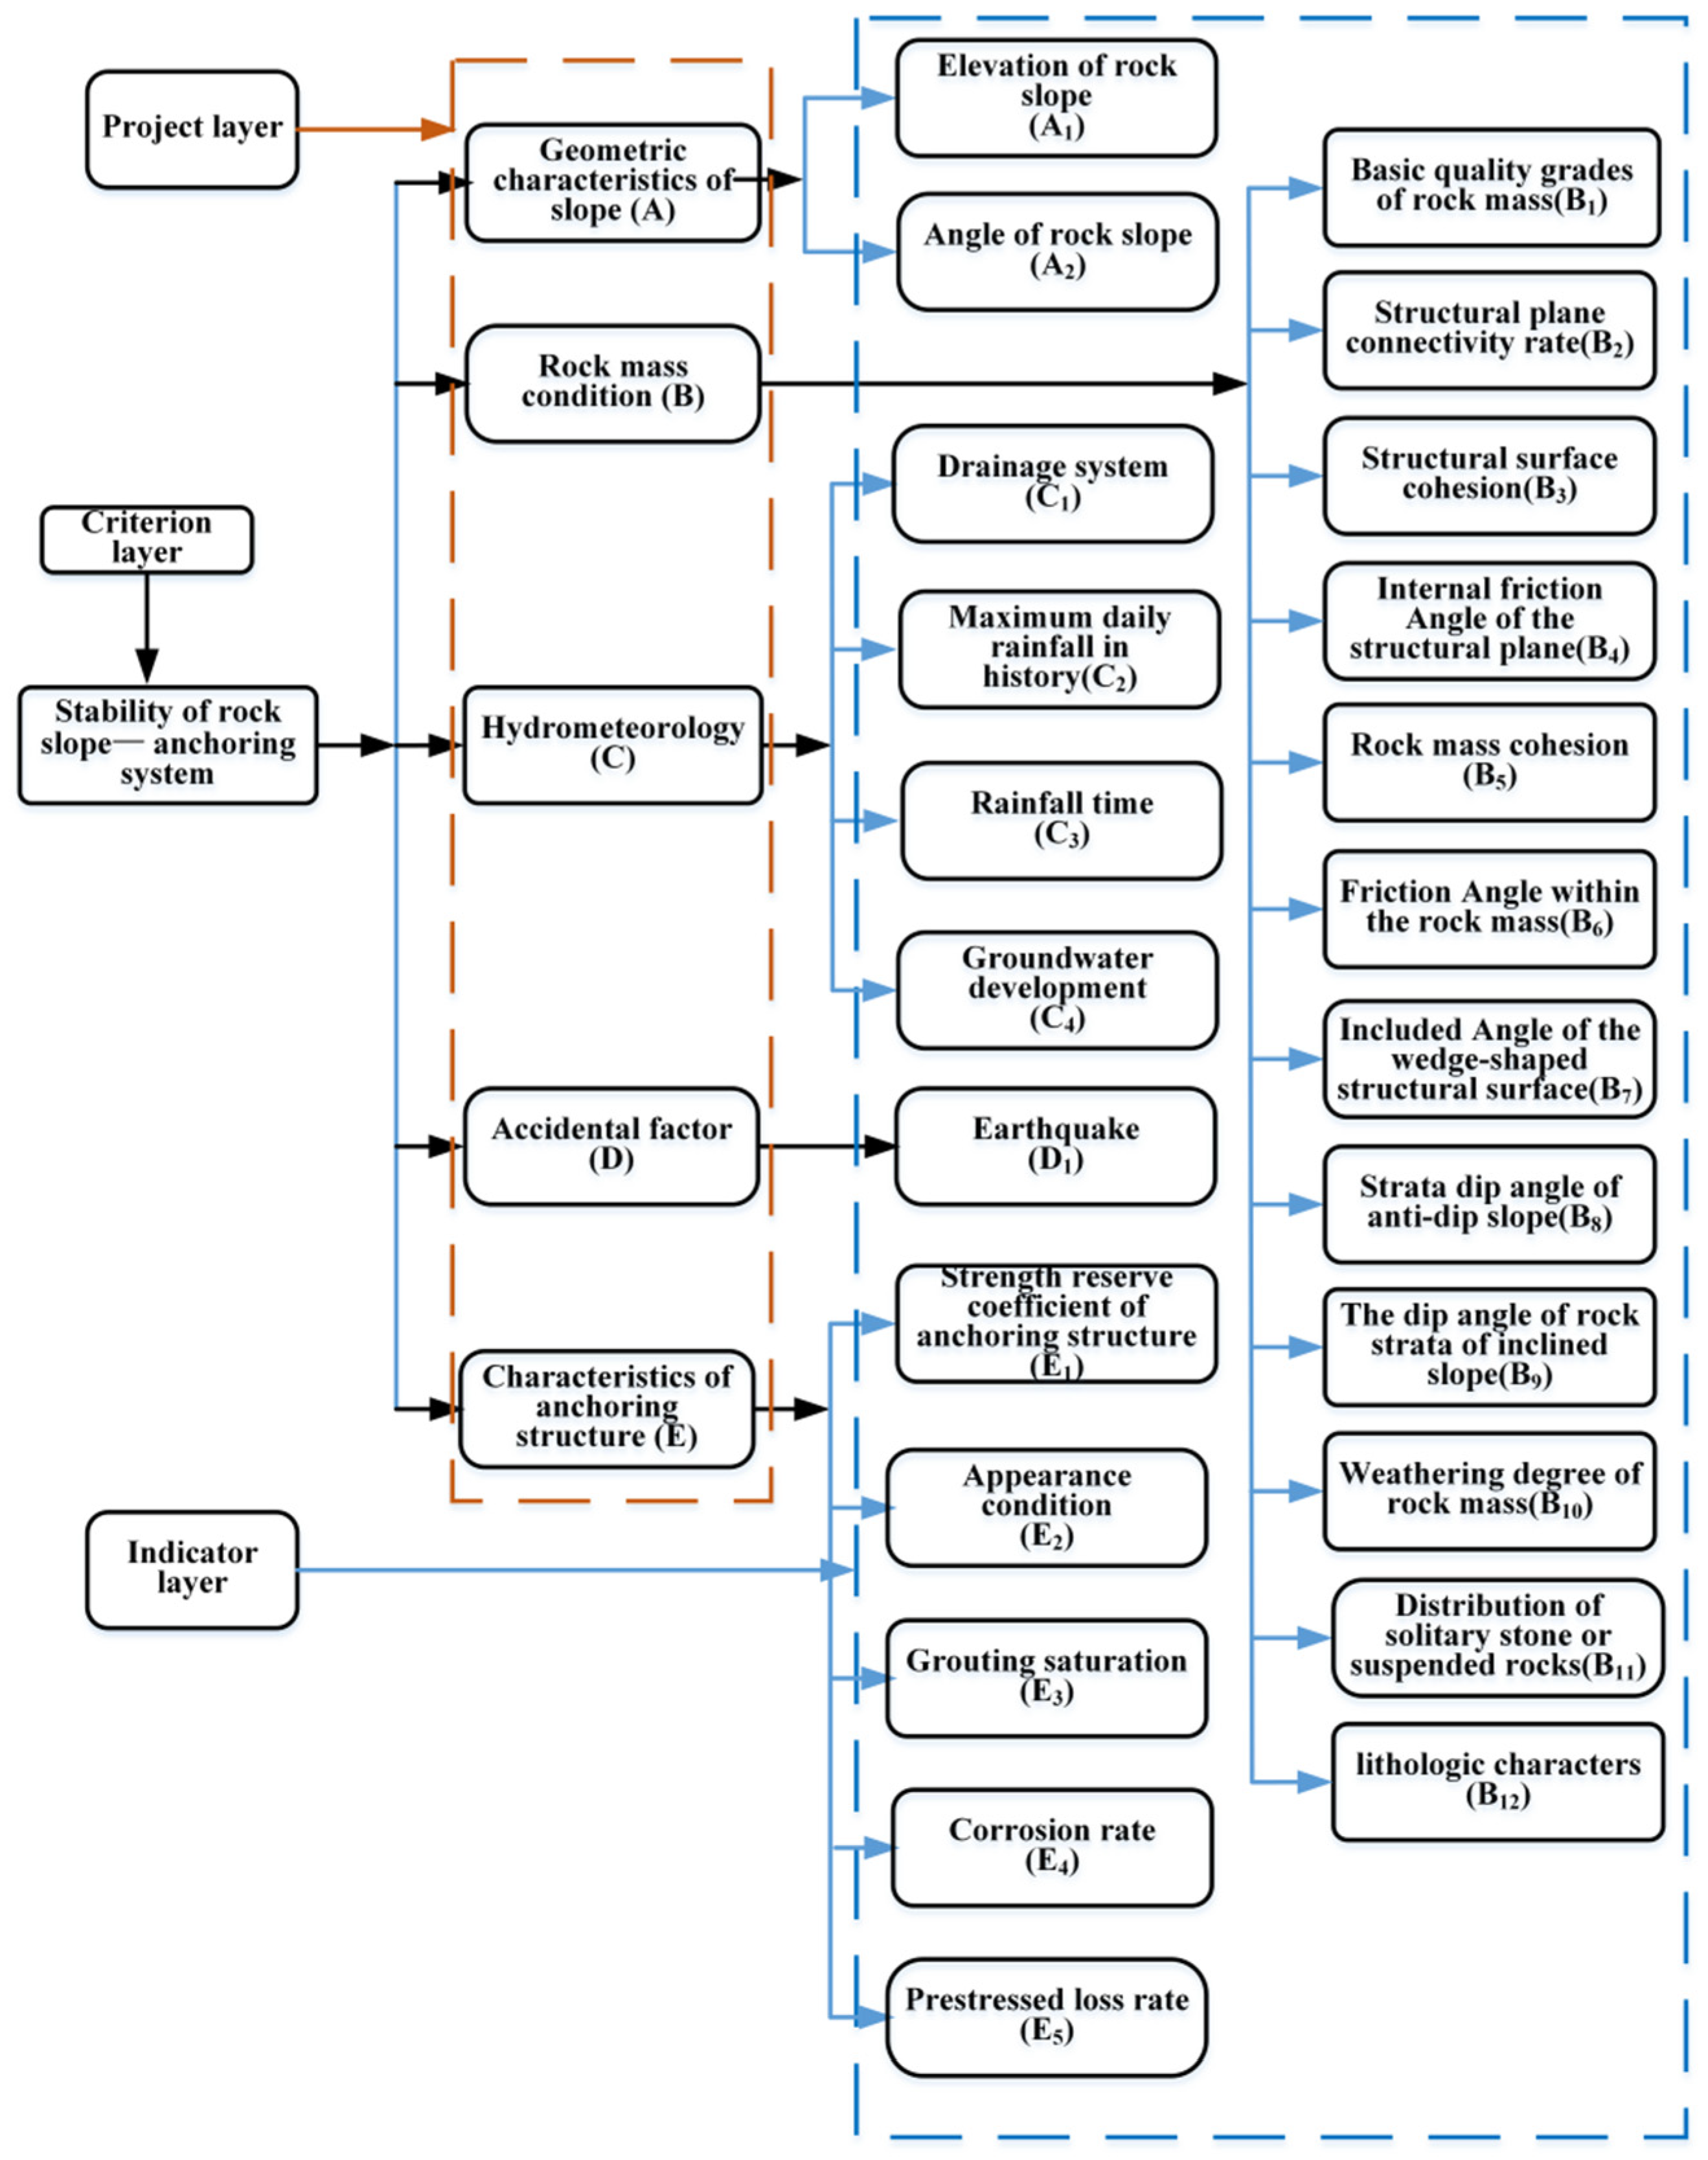
Based on the characteristics of the rock slope–anchoring system, as well as the influencing factors of slope stability and anchorage structure safety, a three-level hierarchical analytical structure—comprising the criteria layer, sub-criteria layer, and indicator layer—was established for the stability evaluation index system of rock slope–anchoring systems, as illustrated in Figure 1.

2.2. Indicator Selection

2.2.1. Preliminary Screening of Indicators

The stability of the systems is influenced by numerous and complex factors, with diverse failure mechanisms. Consequently, the evaluation indicators vary accordingly. Due to the significant influence of subjective judgment in the selection process, different researchers often adopt different sets of indicators. Based on the characteristics of the systems, existing technical standards [61], and relevant literature, a total of 36 indicators affecting the system’s stability were identified, as summarized in Table 5.

2.2.2. Indicator Screening

Indicator selection was based on five key principles: purposefulness, operability, hierarchical structure, completeness with representativeness, and observability. The preliminary indicators identified in Section 2.1 were further screened according to these principles. Field investigations and geological surveys revealed several typical degradation features in the rock slope–anchoring system, including severe weathering of the rock–soil mass, presence of unfavorable structural planes, steep and high slopes, water-related factors, insufficient grouting in anchorage bodies, and damage or failure of the anchoring structures. A total of 24 indicators were ultimately selected for the stability evaluation of the systems, along with their corresponding acquisition methods, as shown in Table 6.
Based on the hierarchical analytical structure described in Section 2.1, the stability evaluation index system for the rock slope–anchoring system was constructed, as illustrated in Figure 2.
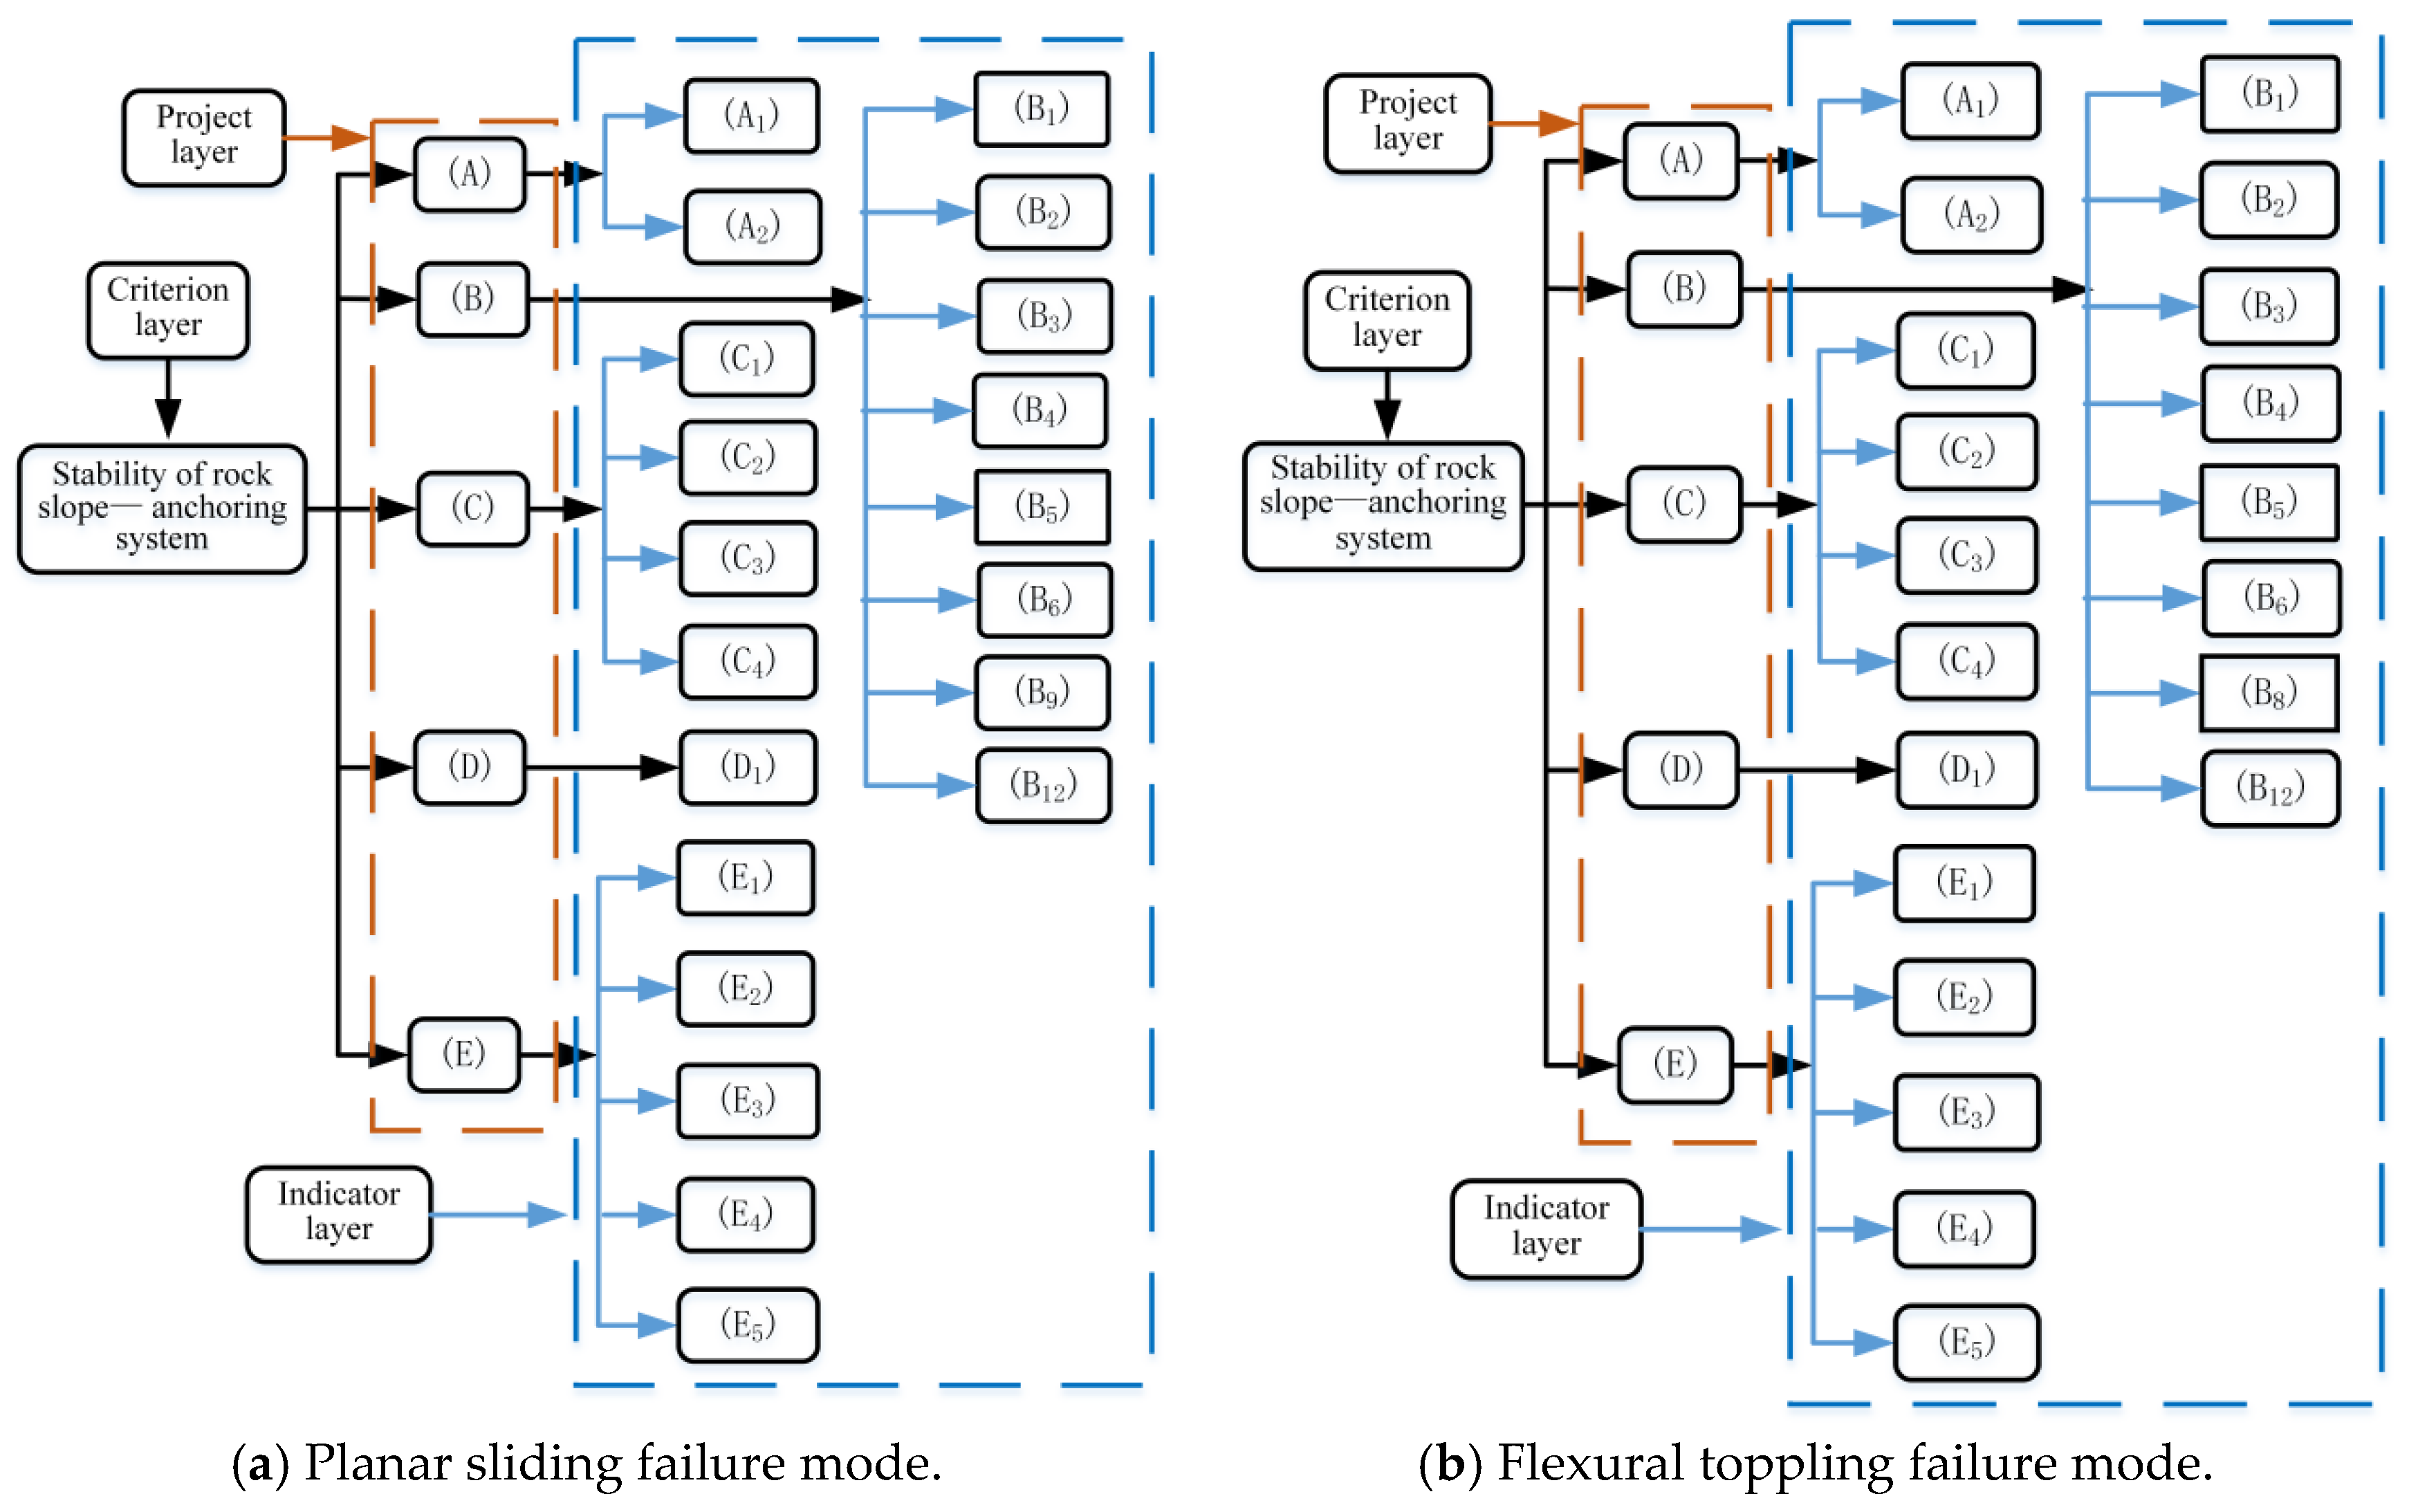
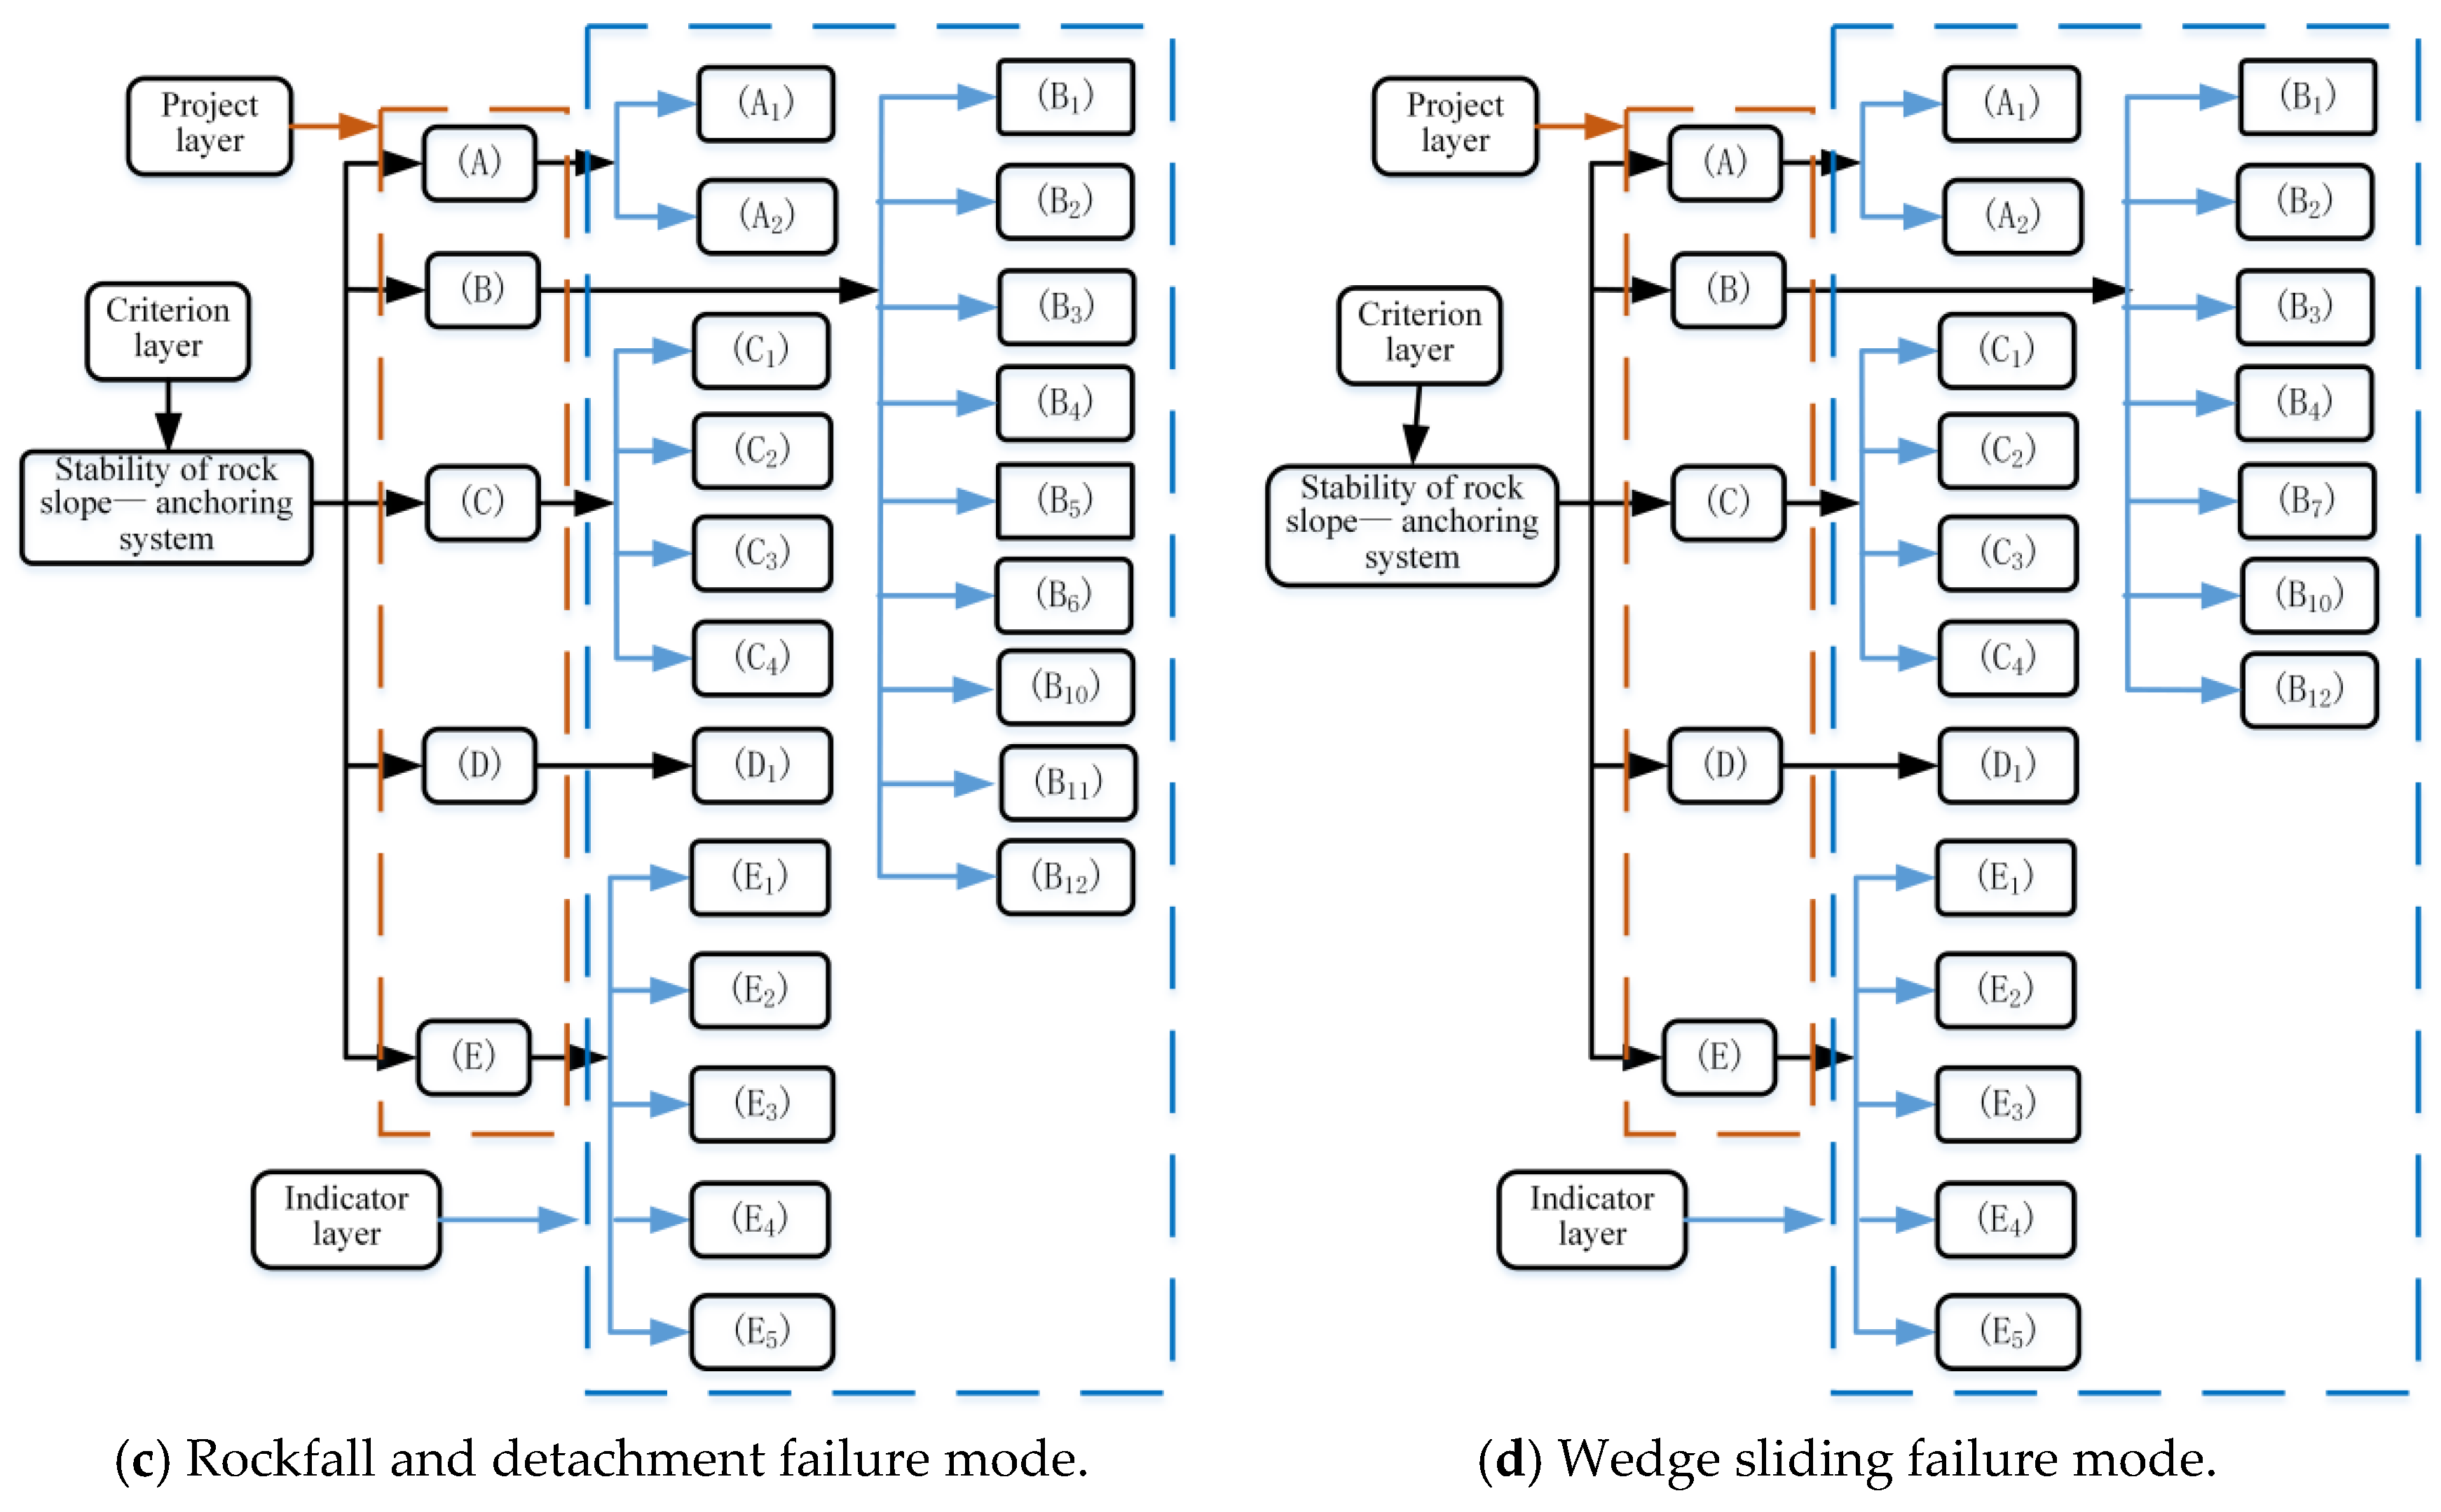
Since rock slopes exhibit diverse deformation and failure modes, the corresponding evaluation indicators vary. Figure 3 illustrates the hierarchical structure of the stability evaluation index system tailored to different failure mechanisms of rock slope–anchoring systems.

3. Grading Criteria

3.1. Classification of Indicators

The classification methods for qualitative and quantitative indicators differ; therefore, the indicators are first categorized into qualitative and quantitative types. The classification results are shown in Table 7.

3.2. Determination of Classification Criteria

3.2.1. Determination of Classification Criteria for Qualitative Indicators

Qualitative indicators were classified based on descriptive criteria, as shown in Table 8 below.

3.2.2. Determination of Grading Standards for Quantitative Indicators

According to the classification of rock slope stability levels specified in the existing standard [61], as shown in Table 9, rock slopes in hydropower projects are categorized into five levels, with corresponding safety factor requirements for each level. In this study, the evaluation indices are also divided into five levels, as stipulated in the Technical Code for Prestressed Anchoring in Hydraulic Structures (SL-T212-2020) [62]. Technical Specification for Prestressed Anchoring in Hydraulic Engineering, 2007b), the recommended stability safety factors for slopes reinforced with prestressed anchors (rods) should follow the requirements outlined in the Code for Design of Slopes for Hydraulic and Hydroelectric Engineering Projects (SL 386-2007) [61].
In currently adopted slope stability evaluation indicator systems, the classification of continuous indicators is typically based on the equal-width discretisation method, which divides the data into n intervals of equal width in ascending order. In some cases, experts determine classification thresholds based on personal experience. These methods often result in classification intervals that do not correspond clearly to slope stability and heavily rely on subjective judgment without quantitative justification. Furthermore, the equal-width discretisation approach presumes a linear relationship between the indicator and slope safety, which is rarely the case in complex geotechnical systems.
(1) Patterns of Influence of Multiple Indicators on the Stability of Rock Slope–Anchoring Systems
Based on the indicators selected in Section 2, this section employs numerical simulation methods to investigate the influence of five categories of factors—slope geometry, rock mass conditions, hydrometeorological factors, seismic activity, and anchoring parameters—on the stability of the systems. The slope geometry, rock mass conditions, and anchoring parameters are analyzed using the Discrete Element Method (DEM), while hydrometeorological and seismic effects are evaluated via rigid-body limit equilibrium combined with seepage analysis.
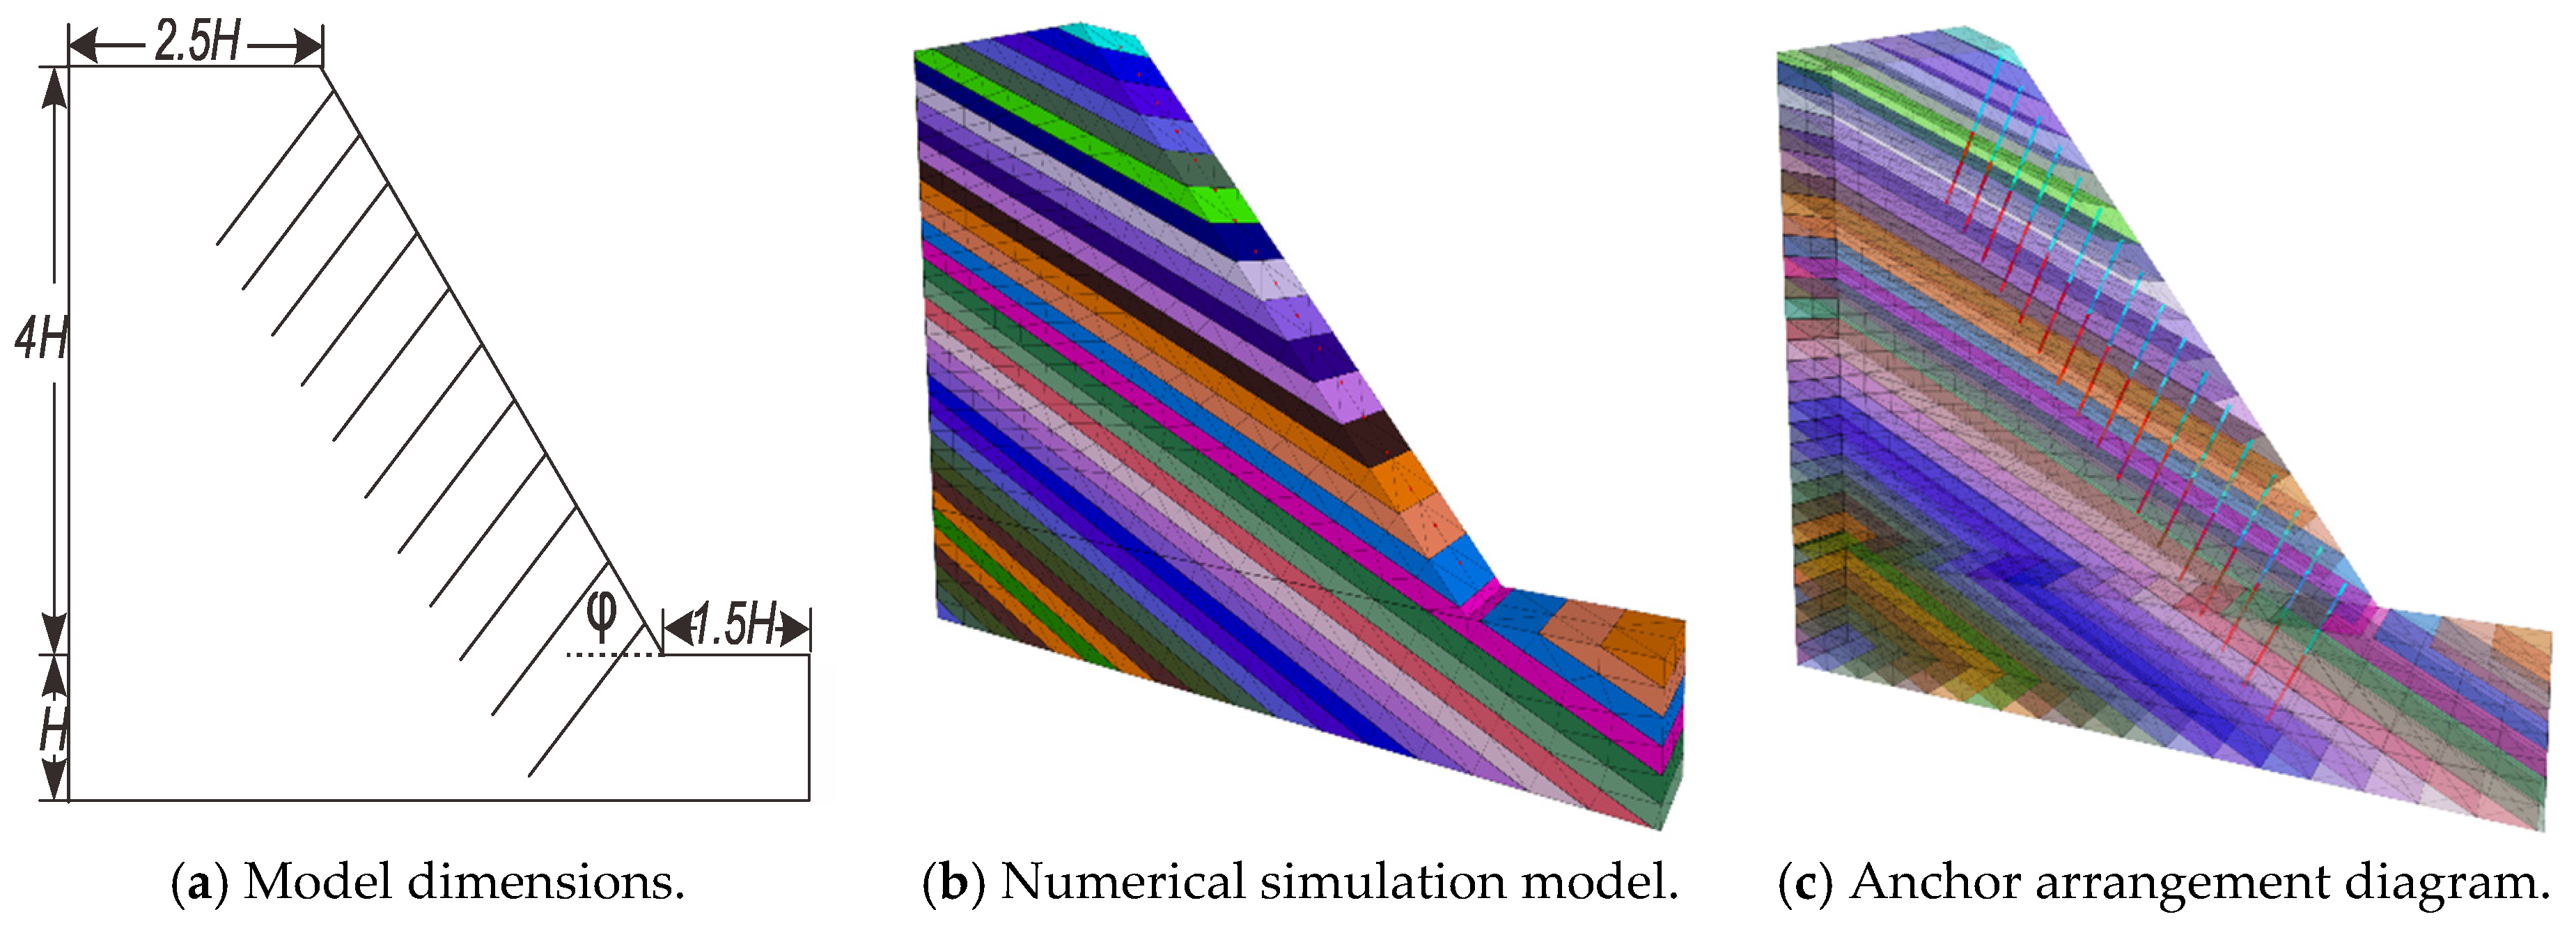
The corresponding numerical analysis model is illustrated in Figure 4 below. Discrete element software is employed to analyze the effects of slope geometry, rock mass characteristics, and anchoring parameters on the stability of the slope–anchoring system. The fundamental parameters of the numerical model are presented in Table 10 and Table 11. The impact of hydrometeorological conditions and seismic loading on the system’s stability is examined in the finite element analysis numerical simulation software, with the corresponding model shown in Figure 5. The fundamental parameters of the Geostudio numerical model are presented in Table 12 and Table 13.
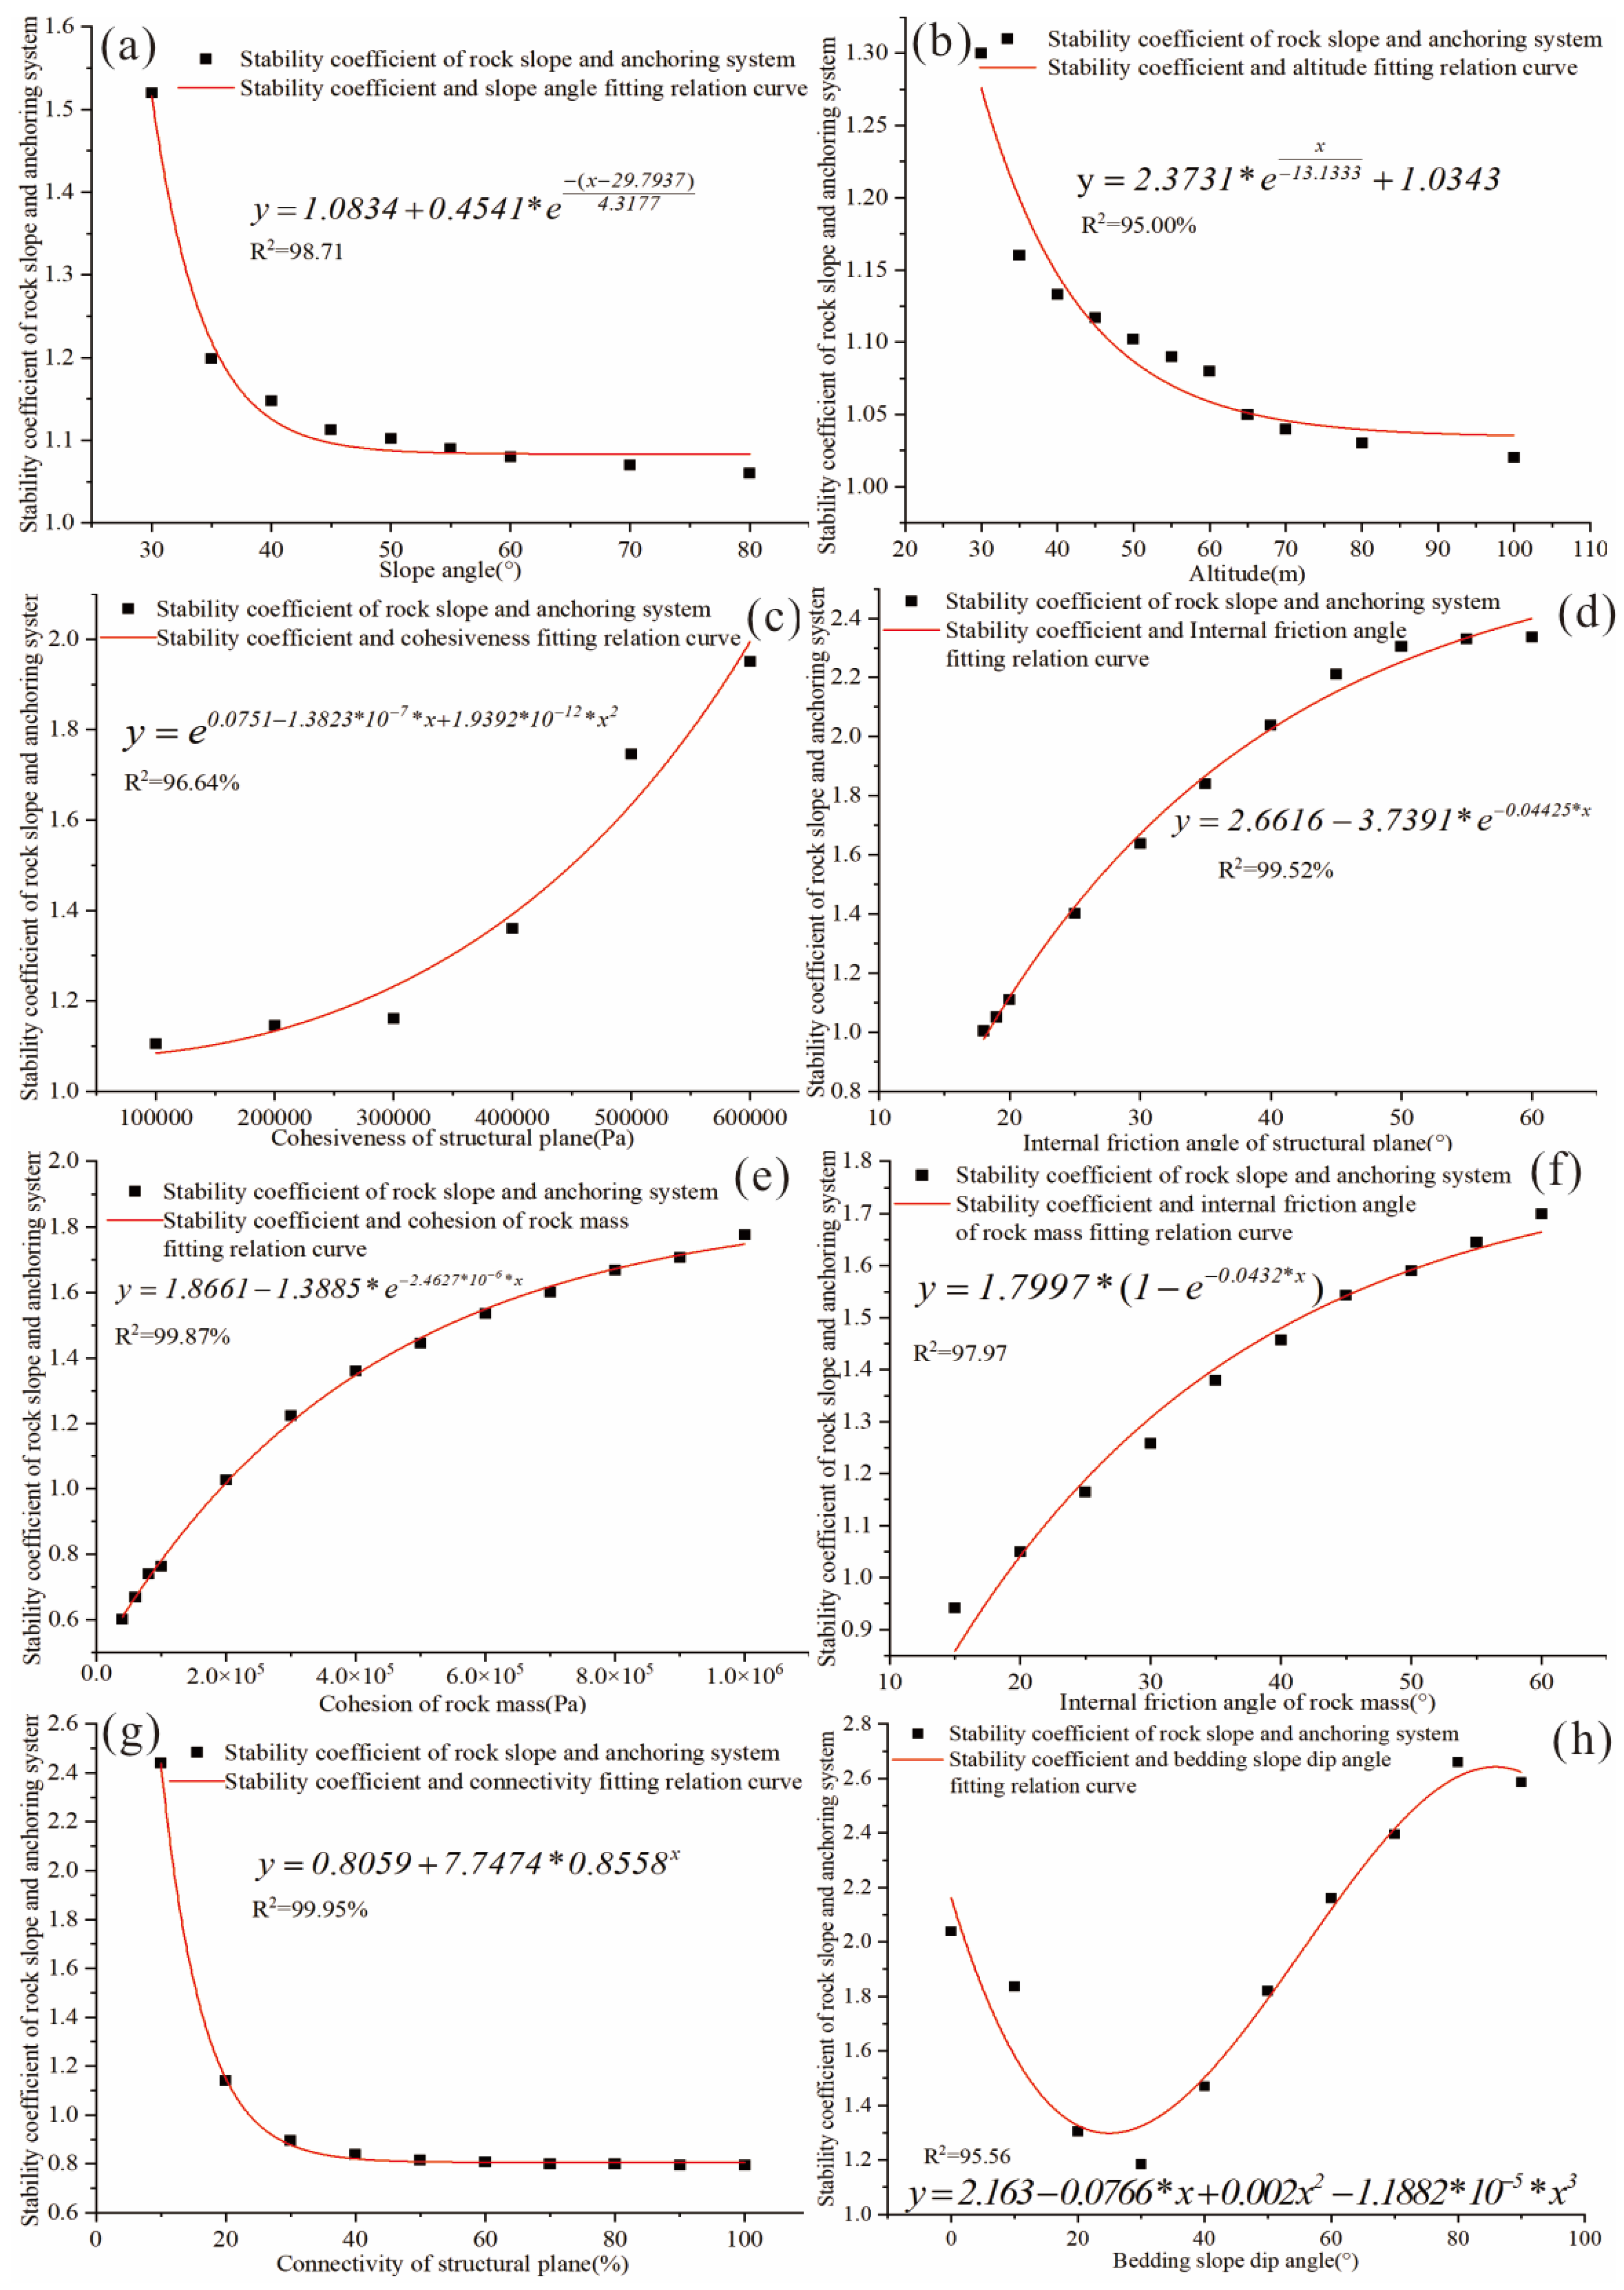
Based on the results of numerical simulations, the strength reduction method was used to calculate the slope stability coefficient. The relationships between the stability coefficient and various indicators were obtained and fitted to construct mathematical relationships between the stability coefficient of the rock slope–anchoring system and multiple indicators. The analysis results are shown in Figure 6. Specifically, Figure 6a–q present the correlation curves, fitted mathematical expressions, and coefficients of determination between the stability coefficient and the following indicators: slope angle, slope height, cohesiveness of structural plane, internal friction angle of structural plane, cohesion of rock mass, internal friction angle of rock mass, connectivity of structural plane, bedding slope dip angle, dip angle of strata in anti-dip slopes, rainfall duration, groundwater development, rainfall intensity, seismic activity, strength reserve coefficient of anchor materials, corrosion rate, prestress loss rate, and grouting saturation.
As shown in Figure 6, most influencing factors exhibit non-linear relationships with the stability of the systems. The stability of the rock slope–anchoring system exhibits varying sensitivity to different indicators across their respective value ranges. For instance, slight variations in the slope angle within the range of 30–35° can markedly influence stability, as illustrated in Figure 6a. Similar pronounced effects are observed for slope heights within 30–50 m (Figure 6b), structural–plane cohesion exceeding 400 kPa (Figure 6c), structural–plane friction angles between 18° and 30° (Figure 6d), rock mass cohesion in the range of 40–400 kPa (Figure 6e), rock mass friction angles between 15° and 30° (Figure 6f), structural–plane connectivity ratios of 10–20% (Figure 6g), bedding dip angles in anti-dip slopes within 80–90° (Figure 6i), rainfall durations of 1–2 days (Figure 6j), groundwater-level-to-slope-height ratios of 0.3–0.5 (Figure 6k), anchor material strength reserve factors of 1.08–1.6 (Figure 6n), and grouting saturation levels of 10–50% (Figure 6q). Minor changes in these parameter ranges can substantially affect the overall stability of the rock slope–anchoring system. Therefore, the use of equal-interval discretisation to determine grading criteria is inappropriate.
(2) Determination of Grading Criteria
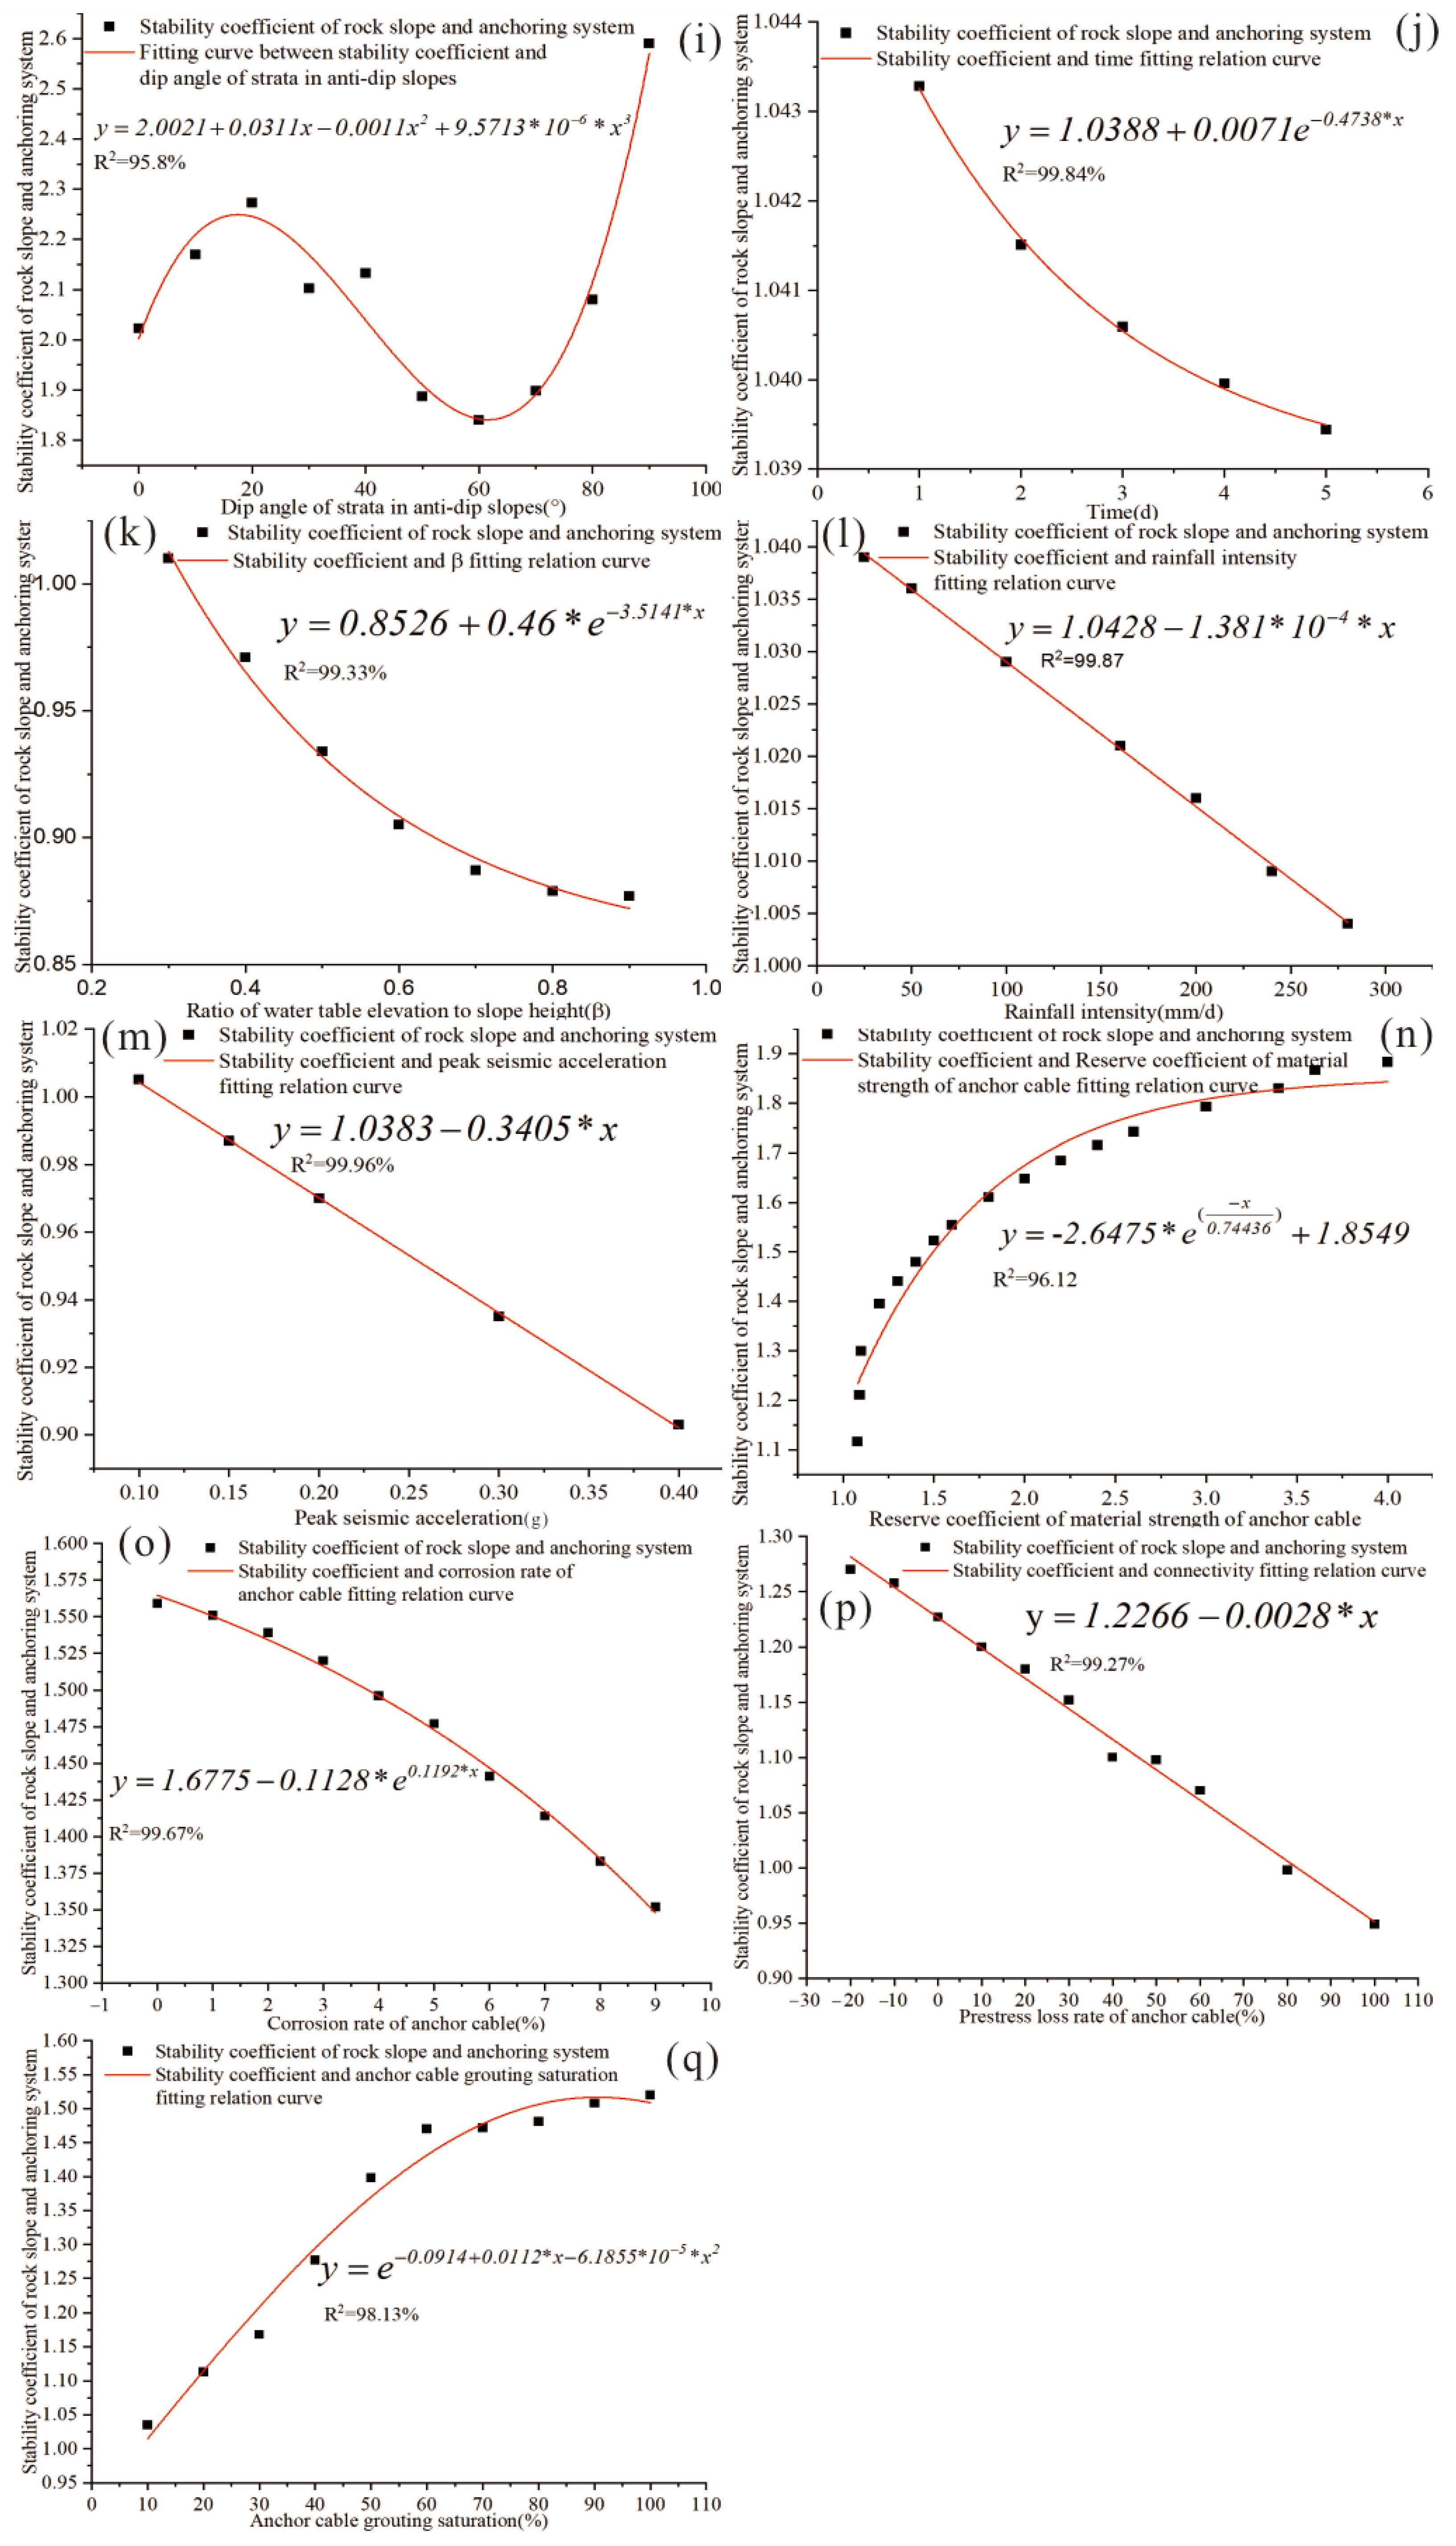
This section proposes a grading criterion determination method based on the influence patterns of stability factors in the systems. The method adopts the stability coefficient of the rock slope–anchoring system as a key quantitative indicator for stability evaluation. It is based on the empirical relationships between each indicator and the stability coefficient, which are expressed through fitted mathematical functions. For example, in the case of the strength reserve coefficient of the anchoring structure, numerical simulations are used to obtain the stability coefficients of the rock slope–anchoring system under varying conditions of this parameter. The data are then fitted using the least squares method to derive a mathematical model describing the relationship between the anchoring structure’s strength reserve coefficient and the system’s stability coefficient. The influence curves and corresponding mathematical models for representative indicators are shown in Figure 7. Based on available data samples, literature, and relevant standards, the range of each indicator is defined. This range, along with the fitted influence curves, is used to determine the corresponding range of stability coefficients. The stability coefficient range is then divided into equal-width intervals to define grading levels. Finally, the grading thresholds for each indicator are obtained by inversely solving the influence curves based on the interval endpoints of the stability coefficient.
This method not only determines the classification standards for continuous indicators but also establishes a one-to-one correspondence between indicator intervals and the stability grades of the rock slope–anchoring system. The implementation steps are as follows:
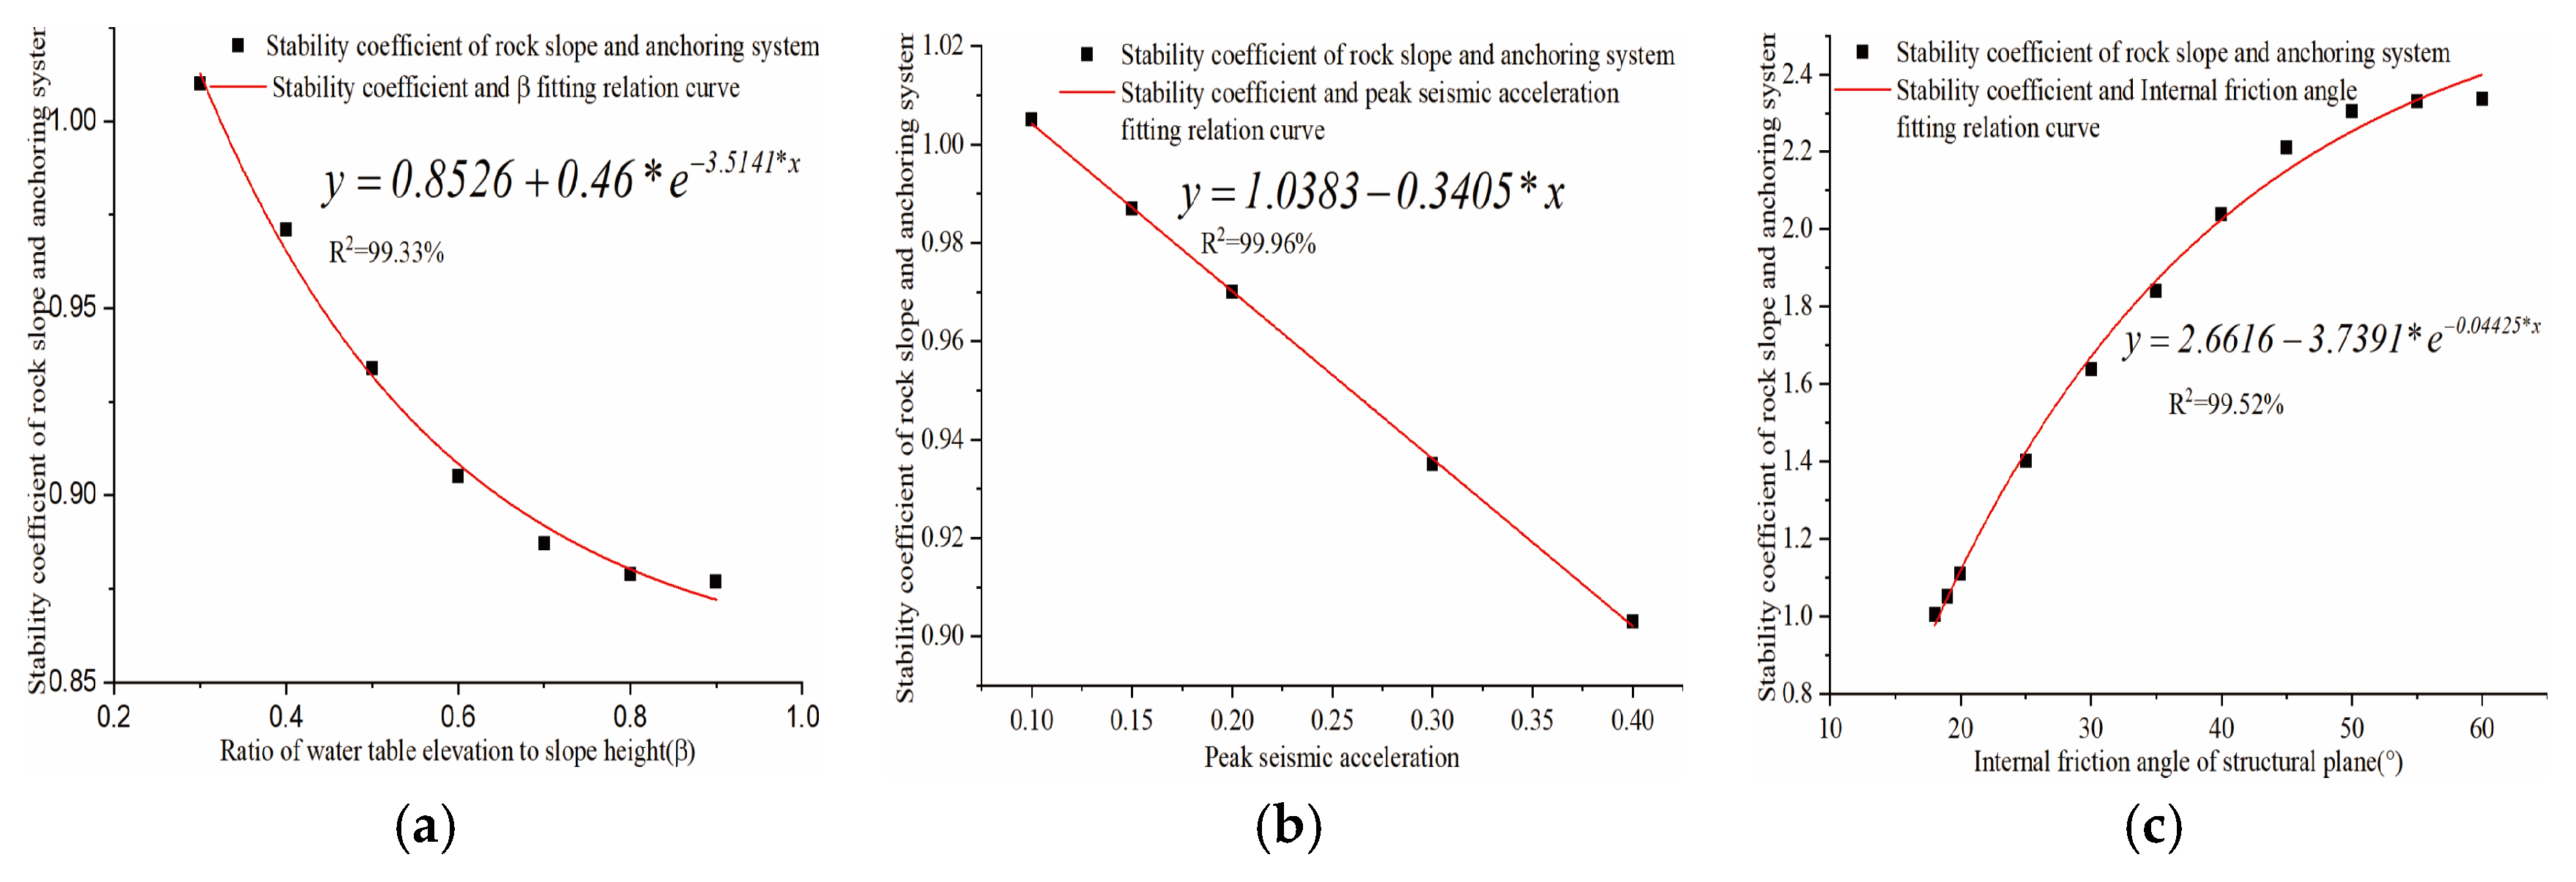
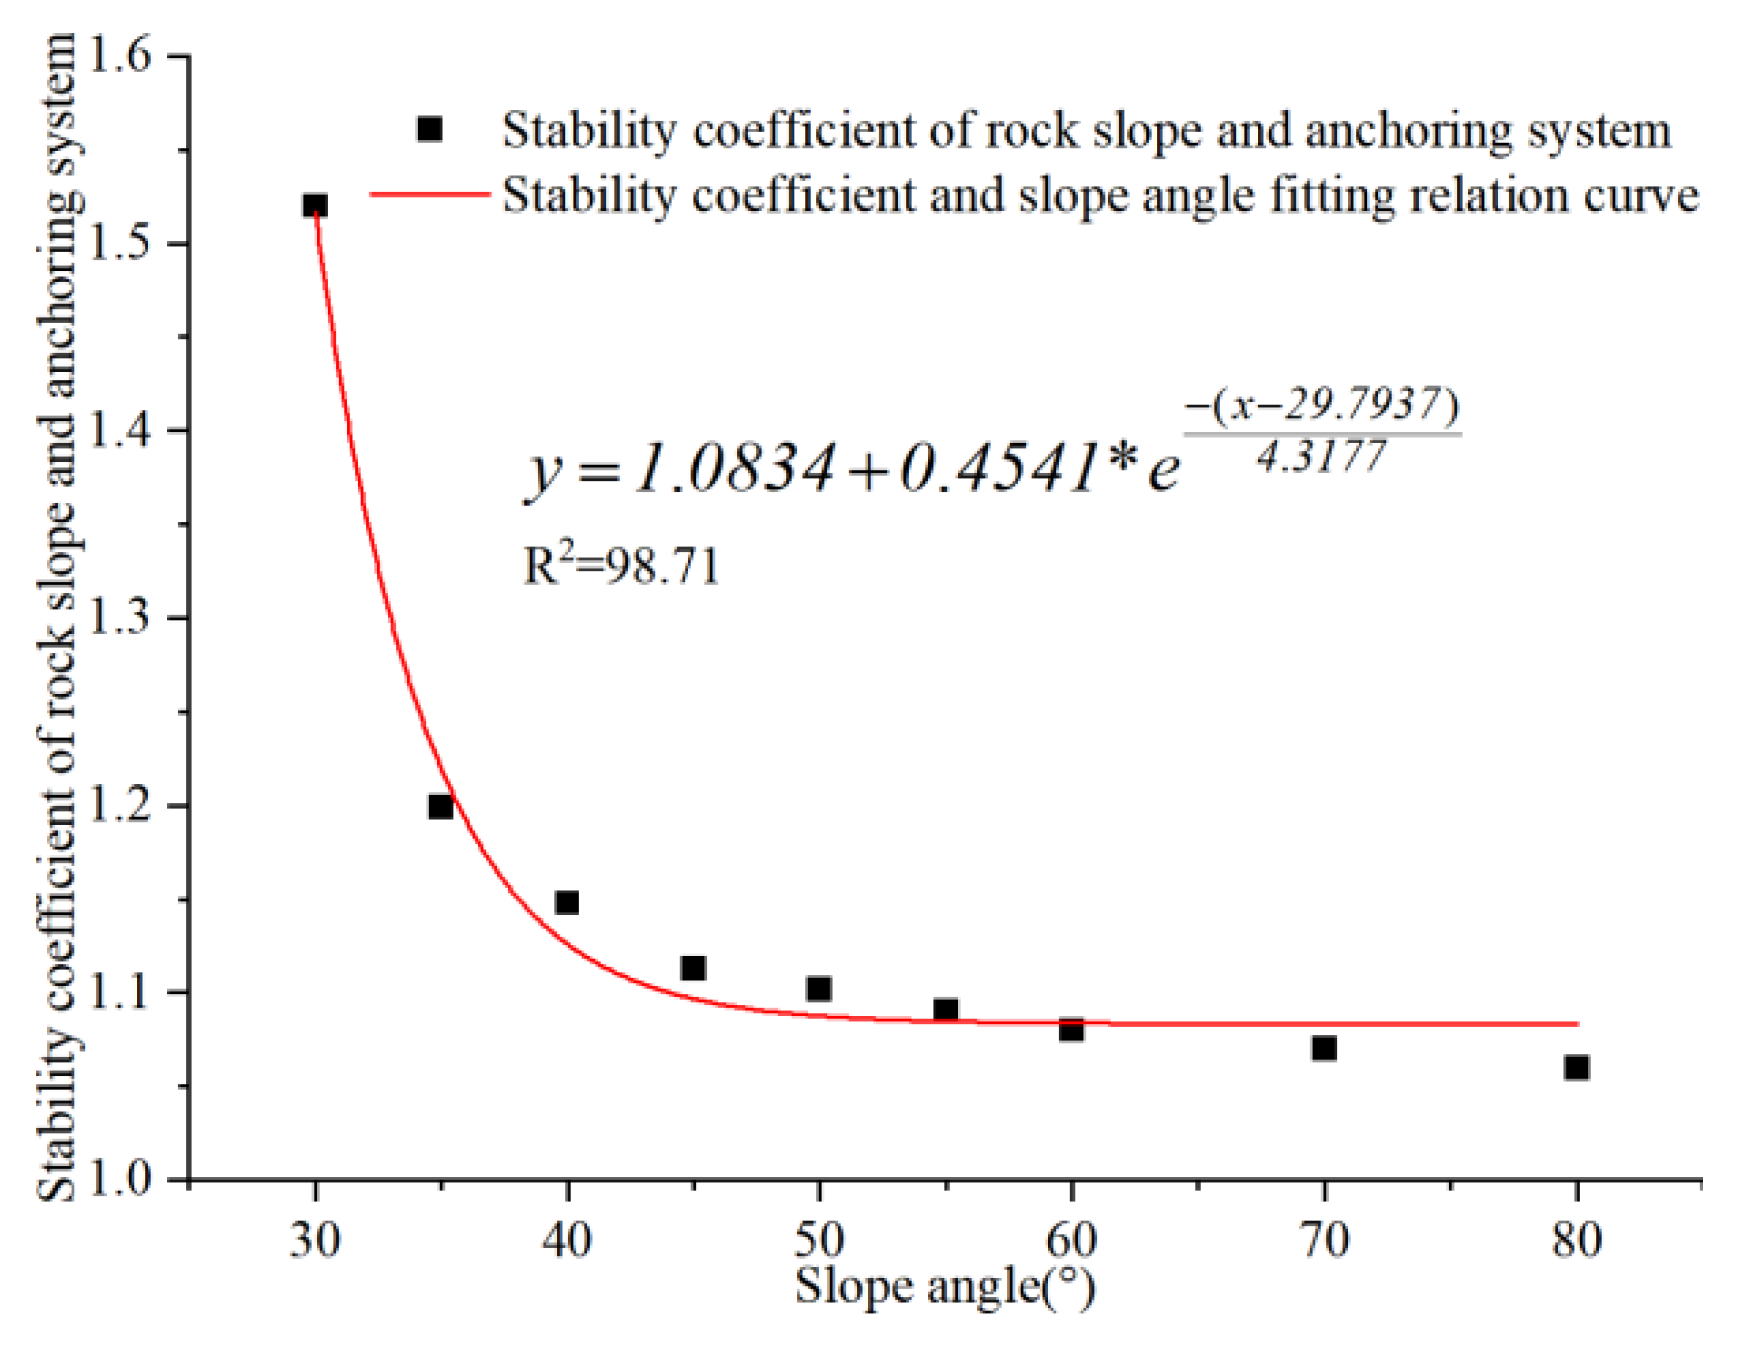
(1) Based on discrete element or finite element analysis methods, and taking into account the interaction between the anchoring structure and the rock slope, the stability coefficients of the rock slope–anchoring system under different levels of each indicator are analyzed. Figure 8 shows the stability coefficients obtained under various slope angles using the discrete element numerical simulation method.
(2) The data obtained in step (1) are fitted using methods such as least squares fitting, polynomial fitting, and orthogonal fitting, to derive the influence laws of each continuous indicator on the stability coefficient of the rock slope–anchoring system, as illustrated in Figure 9.
(3) Determination of Indicator Grading Intervals
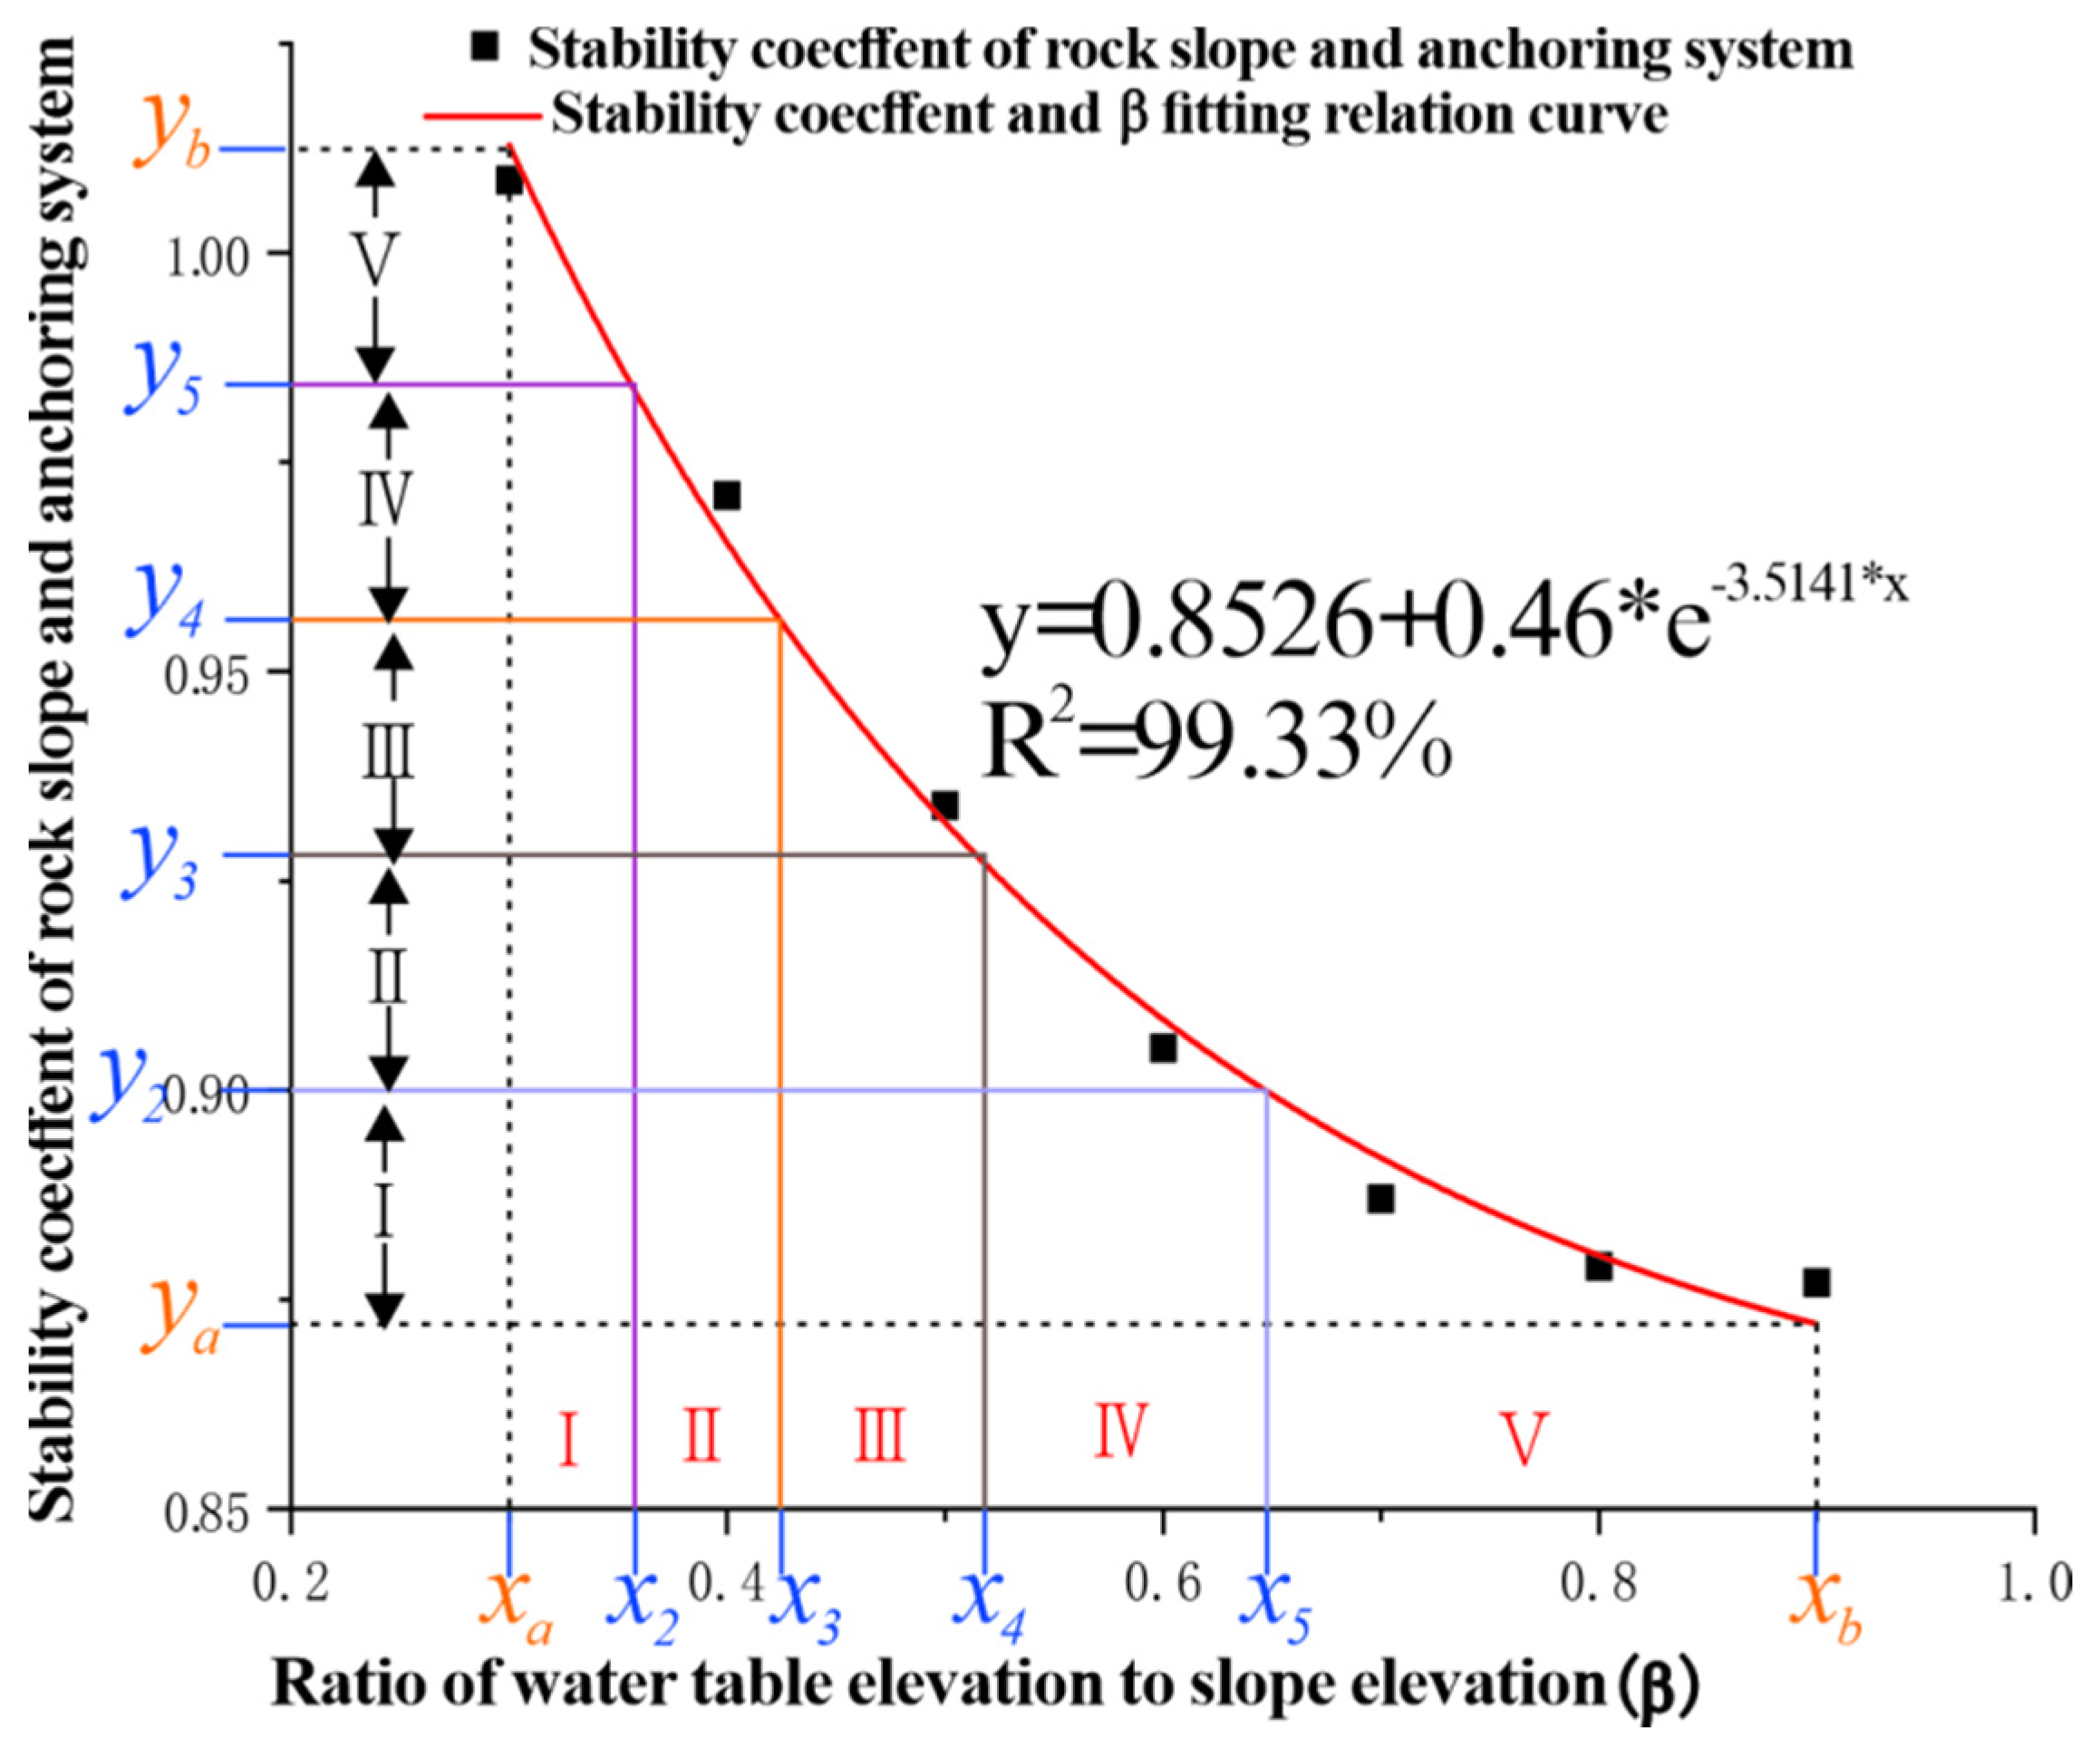
The first step is to define the range of each indicator, followed by determining the number of grading intervals based on practical evaluation requirements. The range of indicators is established by referring to existing engineering cases, technical specifications, and relevant literature. For example, a review of existing studies shows that the height of most engineering slopes typically ranges from 30 to 100 metres, thus setting the height range of the rock slope–anchoring system to [30, 100]. Let [xa, xb] represent the range of the continuous indicator. Based on this range and the fitted influence curve derived in Step (2), the corresponding stability coefficient range [ya, yb] is defined. As shown in Figure 10, the range of stability coefficients is further divided into five intervals, each corresponding to a specific stability level of the rock slope anchoring system. As shown in Figure 10I–V below: This subsection takes the groundwater development indicator as an example to demonstrate the grading process, as shown in Figure 10.
As illustrated in Figure 10, the indicator research range [xa, xb] is first established, followed by determining the corresponding stability coefficient range [ya, yb] for the rock slope–anchoring system. The number of intervals within [ya, yb] is then decided based on analytical requirements. In this study, five levels are defined according to existing guidelines [61]. Accordingly, the stability coefficient range is evenly divided into five grading intervals: [ya, y2], [y2, y3], [y3, y4], [y4, y5], and [y5, yb], which correspond to stability levels I through V, as shown in Figure 11.
(4) Based on the stability coefficient grading intervals established in Step (3) and the mathematical models derived in Step (2), the threshold values (interval endpoints) for each indicator are calculated via inverse analysis. The resulting indicator grading standards and corresponding intervals are illustrated in Figure 11.
As shown in Figure 11, the threshold values (interval endpoints) of the indicator—namely, x2, x3, x4, and x5—are obtained through inverse calculation using the fitted correlation curve and the stability coefficient intervals defined in Step (3). Together with the boundary values xa and xb of the indicator’s full range, the indicator range is divided into five intervals corresponding to the five stability grades of the rock slope–anchoring system, as denoted by the red Roman numerals in Figure 11.
(3) Classification of Continuous Indicator Intervals
Based on the findings of the influence patterns of each indicator on the stability of the rock slope–anchoring system and the proposed grading standard determination method, the classification intervals for the selected continuous indicators are established.
(1) Geometric Conditions of the Slope
The slope height in hydropower engineering generally ranges from 0 to 100 m, while the slope angle typically falls between 0°and 80°. Based on the correlation curves and mathematical models established for the relationship between slope height, slope angle, and the stability coefficient of the rock slope–anchoring system (as illustrated in Figure 6a,b), the classification intervals for continuous variables are determined using the grading method proposed in this section. The analysis results are summarized in Table 14.
(2) Hydrometeorological Factors
According to statistical analysis by Wu Renxi [63], there is a certain time lag between rainfall and landslide occurrence. Approximately 45.45% of landslides are triggered by one-day rainfall events, and rainfall within the preceding three days accounts for 90% of all landslide incidents. Therefore, this study defines the rainfall duration range as 0 to 5 days. In addition, landslide occurrence is significantly correlated with rainfall intensity. Based on the classification criteria issued by the China Meteorological Administration (as shown in Table 15), the selected range of rainfall intensity in this study is [0–150 mm/day]. The relationship curves between rainfall intensity and duration and the stability coefficient of the rock slope–anchoring system are illustrated in Figure 6i,j.
In addition to rainfall, the development of groundwater is also a critical factor influencing the stability of the rock slope–anchoring system. This section investigates the ratio of groundwater head to slope height as a quantitative indicator of groundwater development, and its relationship with the system’s stability coefficient. The corresponding relationship curve is shown in Figure 6k. Based on the classification methodology for continuous variables proposed in this section, the grading intervals for continuous indicators are determined. The analysis results are summarized in Table 16.
(3) Seismic Effects
This study employs peak ground acceleration (PGA) as the metric for seismic intensity, offering greater precision than the use of seismic intensity scales alone. According to the code [61], the comprehensive horizontal seismic acceleration coefficient is used to assess the impact of seismic activity on the stability of rock slopes, as shown in Table 17. The relationship curve between seismic activity and the stability coefficient of the rock slope–anchoring system, derived in Section 3.2, is illustrated in Figure 6m.
As shown in Figure 6m, the impact of peak ground acceleration on the stability coefficient of the rock slope–anchoring system exhibits a linear relationship. Therefore, the equal-interval method is appropriate for determining the classification standards of PGA values. Based on the existing code, the PGA value range is defined as [0.1 g–0.4 g]. The equal-interval method is then applied to determine the classification intervals for this continuous variable. The results are summarized in Table 18.
(4) Rock Mass Conditions
According to the findings in Section 3.2, the cohesion and internal friction angle of structural planes, the cohesion and internal friction angle of the rock mass, structural plane connectivity, the dip angle of bedding planes in anti-dip slopes, the dip angle of bedding planes in dip slopes, and the intersection angle of wedge structural planes all significantly influence the stability of the systems. Based on the Handbook of Rock Mechanics Parameters [64], the value ranges of each parameter are summarized in Table 19. The results in Section 3.2 indicate the influence patterns of rock mass conditions on the stability coefficient of the systems, as illustrated in Figure 6c–i.
Based on the classification method for continuous variables described in this section, the grading intervals for rock mass condition indicators are determined. The classification results are summarized in Table 20. Indicators marked with * in the table represent “the larger, the better”-type data, while those without * represent “the smaller, the better”-type data. For the “larger-the-better” indicators, a greater numerical value indicates a more stable state of the system, whereas for the “smaller-the-better” indicators, a smaller numerical value reflects a more stable state of the system.
(5) Anchorage Structure Parameters
According to the Ministry of Water Resources of the People’s Republic of China [61] and its detailed provisions, the strength reserve factor of prestressed anchorage structures under design tension load is recommended to be between 1.54 and 1.67. Both domestic and international anchorage engineering projects commonly adopt 60% to 65% of the standard tensile strength of the anchorage material as the allowable design stress. In this study, the selected range of the strength reserve factor is 1–2.
Based on the findings in Section 3.2, when the grouting saturation is 10%, the stability coefficient of the rock slope–anchorage system is 1.01. Therefore, the grouting saturation range selected for this study is 10–100%. According to the mathematical model of the influence of corrosion rate on the stability coefficient of the rock slope–anchorage system shown in Figure 1 of Section 3.2, the safety coefficient is 1.0 when the corrosion rate reaches 15%. Thus, the corrosion rate of anchor cables in this study is set within the range of 0–15%.
Based on the findings in Section 3.2, the influence curves and mathematical relationship models of anchorage structure parameter indicators on the stability coefficient of the rock slope–anchorage system are shown in Figure 6n–q. Applying the continuous indicator classification method proposed in this section, the classification standards for anchorage structure parameters are summarized in Table 21 below.
A summary of the grading criteria for the stability evaluation index system of the rock slope–anchoring system is presented in Table 22.

4. Validation of Classification Criteria

Section 3 of this study proposes a method for determining classification criteria based on the influence patterns of the stability coefficient of the rock slope–anchoring system, and the classification thresholds of the evaluation indicators are established accordingly. In this section, the reasonableness of the classification criteria is validated using the K-nearest neighbors (KNN) algorithm.

4.1. Basic Principle of the KNN Algorithm

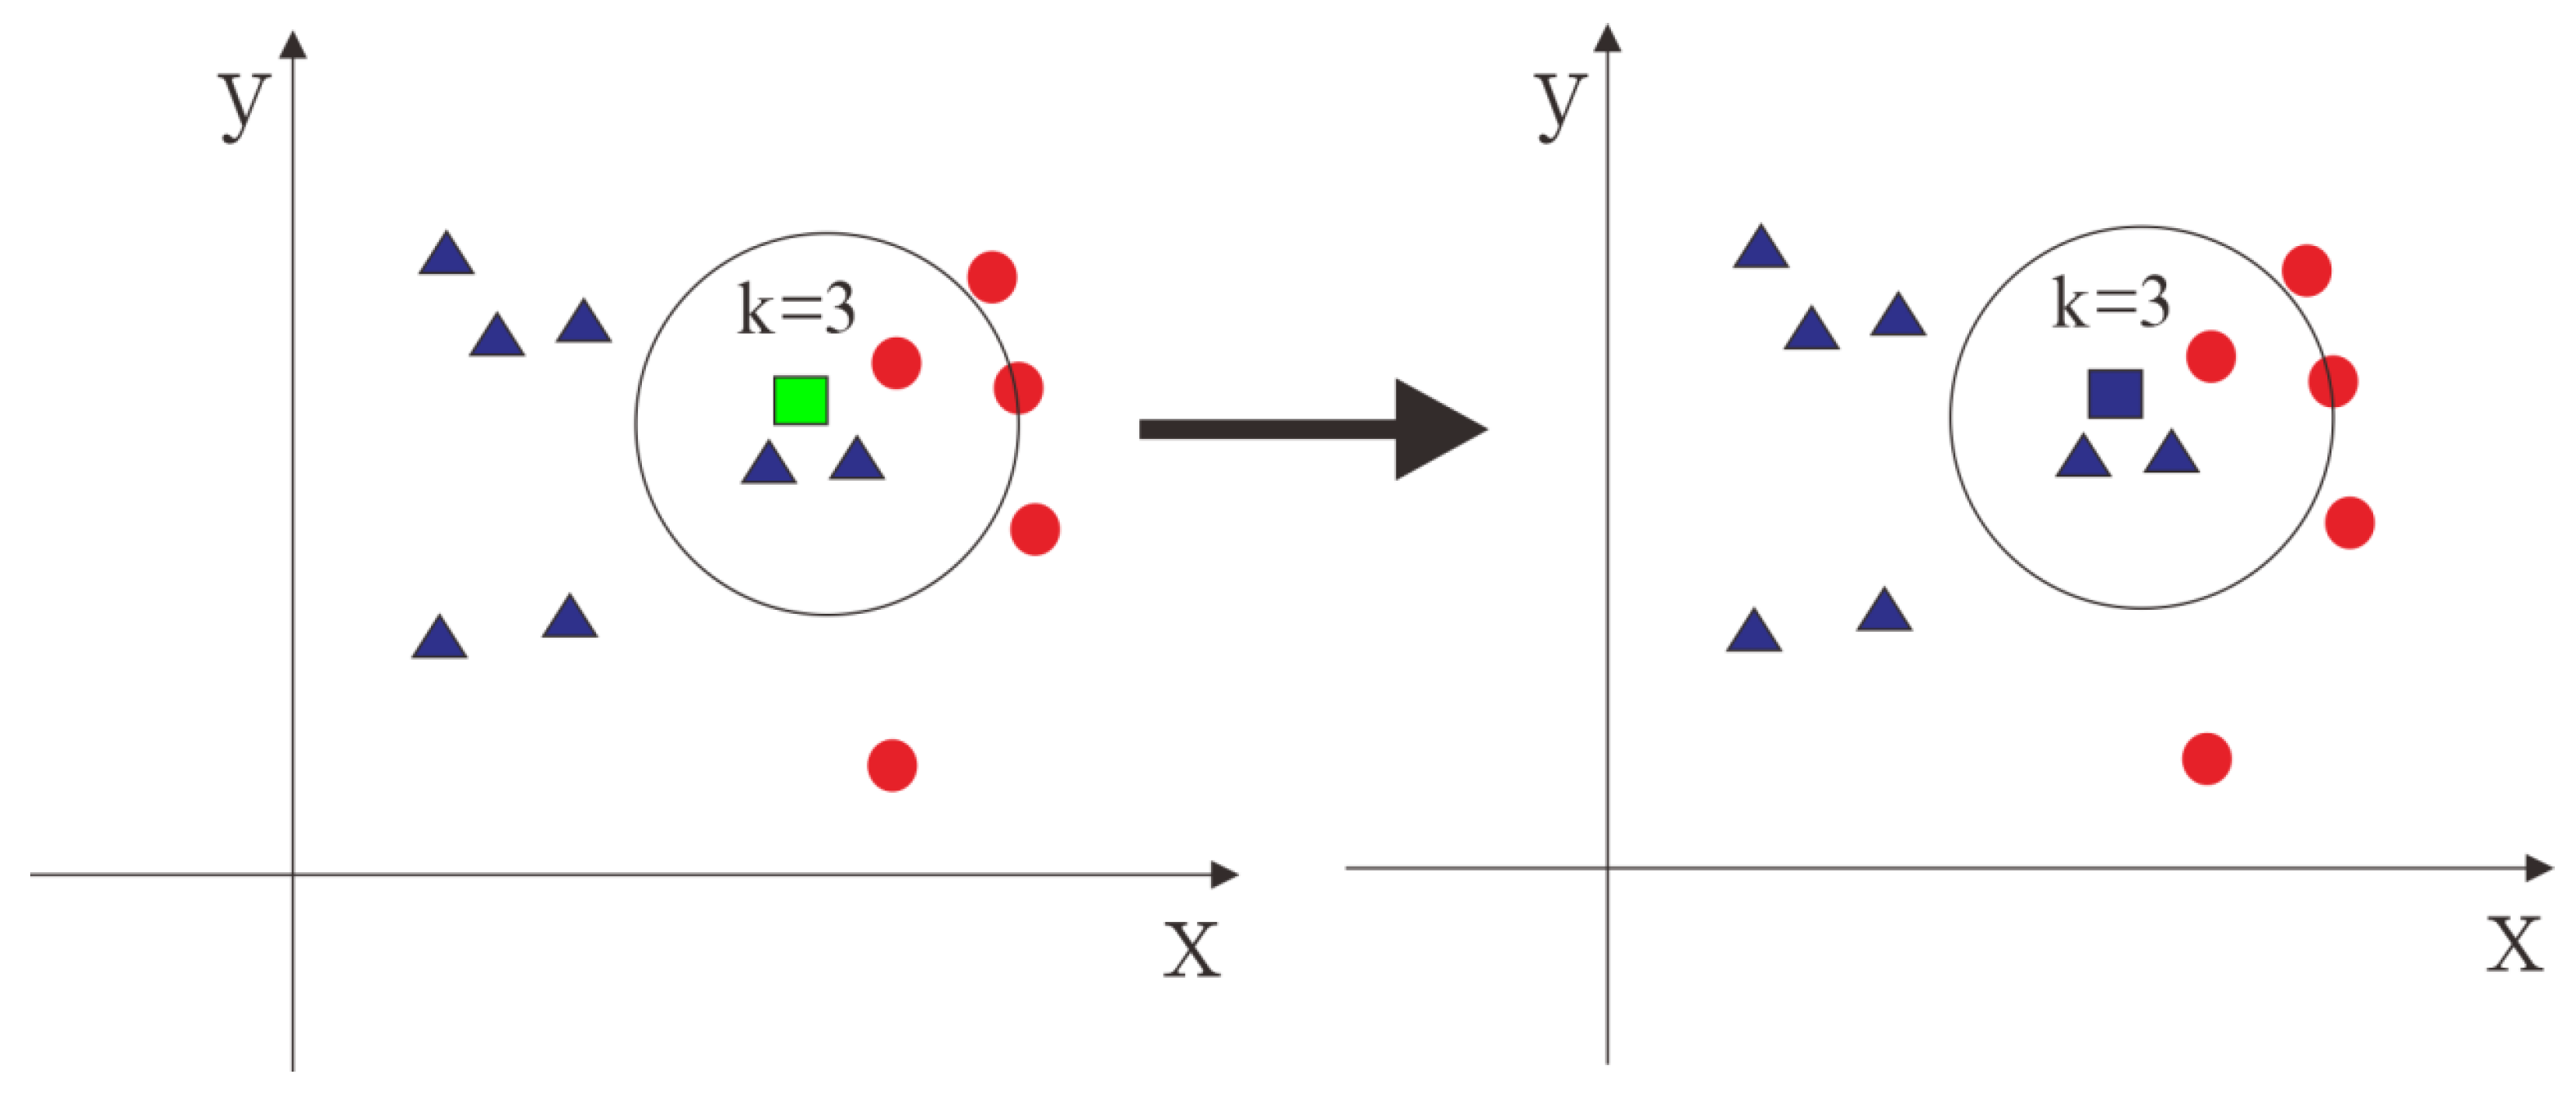
KNN classifies samples by measuring the distances between different feature values. The fundamental principle is that if the majority of the k nearest neighbors of a sample in the feature space belong to a certain category, the sample is assigned to the same category. In the KNN algorithm, all selected neighbors are objects with known and correctly labeled classifications. The classification decision is made solely based on the category of the nearest neighbor(s). The basic concept is illustrated in Figure 12.
As shown in Figure 12, different colors represent different categories. When K = 3, since two of the three nearest neighbor points are blue triangles (i.e., 2/3 of the majority cases), the green quadrilateral is classified into the same category as the blue triangle.

4.2. Evaluation of the KNN Model

The performance of a classifier can be evaluated based on the classification loss of its predictions. Generally, a better classifier yields a smaller loss value. The classification loss function quantifies the predictive accuracy of the model—higher accuracy indicates better model performance and a stronger ability of the samples to represent intrinsic data characteristics. Based on this principle, the K-Nearest Neighbors (KNN) algorithm can be used to validate the rationality of different discretization methods for defining the interval boundaries of evaluation indices. By calculating the classification accuracy of the KNN algorithm, the validity of the interval partitioning can be assessed, thereby verifying the rationality of the grading standard determination method.

4.3. Implementation Procedure of the Rationality Test

(1) Identify the indicators to be classified and their corresponding value ranges.
(2) Apply different classification methods to the same indicators and value ranges to define grading criteria and divide classification intervals.
(3) Based on the defined intervals, discretize the continuous indicators in the sample data to construct a fully discrete dataset.
(4) Apply the KNN algorithm to classify the discrete dataset and compute the classification accuracy, which is then used to assess model performance.
(5) A better-performing KNN model (i.e., higher classification accuracy) indicates that the corresponding classification method more effectively captures the intrinsic characteristics of the data. Lower information loss after discretization leads to higher classification precision.

4.4. Comparative Analysis of Grading Standard Determination Methods

A comparative analysis is conducted between the commonly used equal-width classification method and the classification method proposed in this study, which is based on the influencing patterns of the stability of the systems, in order to validate the feasibility and rationality of the proposed approach. Nine continuous indicators were selected for classification: slope height, slope angle, cohesion, internal friction angle, daily rainfall, strength reserve coefficient, grouting saturation, anchor corrosion rate, and prestress loss rate. These were used to establish classification criteria and assess the reasonableness of the methods. Due to the lack of sufficient empirical data on anchoring parameters and the stability of the systems, this study employed numerical simulation to generate sample data. The numerical model is shown in Figure 4 and Figure 5, and the parameters are listed in Table 10, Table 11, Table 12 and Table 13. By varying the values of the selected nine indicators, 40 sets of sample data were generated. Based on the generated sample data, classification criteria were determined using both methods. Classification intervals were constructed, and corresponding decision information tables were generated. A KNN-based computation program was implemented. A feature matrix (40 × 9) was constructed from the nine indicator variables for the 40 samples in the decision information table, and a label vector (n = 40) was created from the corresponding stability states. The hyperparameter K was selected via grid search with cross-validation, Euclidean distance was adopted as the distance metric, and the resulting model was then used to perform KNN classification.
The accuracy of the KNN classifier was calculated, where higher accuracy indicates that the decision information table generated by the classification method is more precise, and the resulting classification intervals are more accurate and reasonable. The calculation formula for classification accuracy is shown in Equation (1). Based on the sample data derived from different classification intervals, the classification accuracy using the KNN algorithm was computed. The results of the calculation are presented in Table 23.
A c c u r a c y = T P + T N T P + F N + F P + T N
where TP (True Positive) refers to the number of samples that are actually positive and predicted as positive, TN (True Negative) denotes the number of samples that are actually negative and predicted as negative, FP (False Positive) represents the number of samples that are actually negative but predicted as positive, and FN (False Negative) indicates the number of samples that are actually positive but predicted as negative.
As shown in Table 23, the classification accuracy of the grading standard determined by the method based on the stability coefficient influence patterns is approximately 10% higher than that of the equal interval grading method. This indicates that the proposed grading standard determination method, which is based on the influence patterns of the stability coefficient for the rock slope–anchoring system, more effectively captures the intrinsic characteristics of the data. It minimizes the loss of feature information caused by data discretization and thereby improves classification accuracy. This method outperforms the equal interval grading approach. The grading standard determination method for continuous variables, based on the stability coefficient influence patterns of the rock slope–anchoring system, is both reasonable and feasible.

5. Conclusions

(1) The proposed evaluation index system fully considers the deformation and failure modes of rock slopes, the factors influencing stability, and the safety-related parameters of anchoring structures. It provides a systematic and applicable evaluation framework for assessing the stability of the systems under complex geological and engineering conditions and offers a structured and quantitative basis for decision making in slope–anchoring engineering.
(2) The system thoroughly accounts for the multifactorial influence mechanisms affecting the stability of the rock slope–anchoring system.
(3) Compared with traditional equal-interval methods for determining grading standards, the proposed method yields more accurate classification thresholds. It better reflects the intrinsic characteristics of the data and minimizes the loss of feature information after discretization, thus achieving higher classification accuracy.

6. Discussion

The stability of rock slope–anchoring systems is a critical issue in geotechnical engineering, particularly in complex geological environments where the interaction between rock mass structure and anchoring support is strongly coupled. This study proposes a stability evaluation index system for such slopes developed through indicator screening, analytic hierarchy process (AHP) structuring, classification standard formulation, and comparative analysis.
The main innovations of this study are reflected in the following aspects.
First, the proposed index system accounts for the deformation and failure modes of rock slopes, key stability-influencing factors, and anchoring structure safety. It overcomes the limitations of conventional evaluation methods that rely heavily on single indicators or expert subjectivity. By incorporating multidimensional factors such as geological conditions, structural features, environmental influences, and anchoring parameters, the system provides a more comprehensive and realistic representation of the coupled effects that govern the stability of the systems. Second, the system employs the analytic hierarchy process (AHP) to logically decompose the indicator hierarchy and establishes grading standards based on the quantitative influence patterns of multiple factors on slope stability. Compared to traditional equal-interval or experience-based methods, the proposed grading approach better captures the intrinsic characteristics of the data, thereby significantly improving the accuracy and sensitivity of the classification results.
Although this study has made notable progress in both theoretical and practical aspects, certain limitations remain. Due to the difficulty of obtaining extensive real-world engineering data, numerical simulation was primarily used to analyze the influence of various indicators on stability. While simulation offers high controllability and repeatability, it cannot fully capture the stochastic nature and boundary uncertainties inherent in real projects. As a result, some of the grading thresholds may deviate from actual conditions and require further refinement through large-scale empirical data validation. In addition, the indicators exhibit pronounced local sensitivity to random deviations in the initial data, reflecting the high responsiveness of the rock slope–anchoring system to variations in geotechnical parameters such as cohesion, internal friction angle, and stress state. Although this sensitivity may amplify measurement errors, it enables the KNN method to capture subtle yet meaningful variations in rock mass properties. This characteristic should not be regarded as a deficiency; rather, it reflects the model’s reliance on high-precision input data and underscores the importance of improving data acquisition accuracy.
Future work may focus on (1) enriching the database of real-world engineering cases to strengthen empirical validation; (2) incorporating machine learning algorithms to optimize and refine the indicator set; (3) conducting extensive application studies under diverse geological conditions to enhance the universality, adaptability, and robustness of the evaluation system; (4) conducting a systematic sensitivity analysis and uncertainty quantification to further constrain the impact of data perturbations on the evaluation results and explore the feasibility of incorporating noise-reduction strategies into the KNN framework; and (5) integrating the KNN method, physical model experiments, and field monitoring to develop a comprehensive evaluation index system for the stability of rock slope–anchoring systems.

Author Contributions

P.X.: Conceptualization, funding acquisition, methodology, project administration, writing—original draft, writing—review and editing, supervision, resources. B.Z.: formal analysis, data curation, investigation, software, visualization, writing—original draft. J.L.: formal analysis, data curation, investigation, visualization, writing—original draft. Y.P.: formal analysis, data curation, resources, validation, writing—review and editing. All authors have read and agreed to the published version of the manuscript.

Funding

This research was funded by The National Natural Science Foundation of China grant number 42407225, Fujian Provincial Education Department Foundation grant number JAT231047, Xiamen Science and Technology Subsidy Project grant number 2024CXY0319, Research Start-up Fundation of Jimei University grant number ZQ2023019 and the APC was funded by the National Natural Science Foundation of China (No. 42407225).

Data Availability Statement

The datasets generated during and/or analyzed during the current study are available from the corresponding author upon reasonable request.

Conflicts of Interest

Author Peng Xia and Jie Liu were employed by the company Xinjiang Transportation Science Research Institute Co., Ltd. The remaining authors declare that the research was conducted in the absence of any commercial or financial relationships that could be construed as a potential conflict of interest.

References

  1. Du, Y.; Li, H.; Chicas, S.D.; Huo, L. Progress and perspectives of geotechnical anchor bolts on slope engineering in China. Front. Environ. Sci. 2022, 10, 928064. [Google Scholar] [CrossRef]
  2. Ding, W.; Wang, Z.; Huang, X.; Chen, L.; Zheng, Y. Influence of corrosion on anchoring bond behavior of jointed rock mass. KSCE J. Civ. Eng. 2022, 26, 1914–1928. [Google Scholar] [CrossRef]
  3. Pei, S.F.; Hao, W.F.; Fan, Y.L.; Chen, H.; Li, W.T. Operation condition of anchoring system in large-scale water conservancy and hydropower projects. J. Changjiang River Sci. Res. Inst. 2024, 41, 142–150. (In Chinese) [Google Scholar]
  4. Wen, L.; Huang, L.; Xiang, X.; Yang, X.Z.; Zhang, G.C. Research status and development trend of geotechnical anchorage technology in hydropower projects. Saf. Environ. Eng. 2023, 30, 35–45. (In Chinese) [Google Scholar]
  5. Lama, B.; Momayez, M. Review of non-destructive methods for rock bolts condition evaluation. Mining 2023, 3, 106–120. [Google Scholar] [CrossRef]
  6. Kang, H.; Yang, J.; Gao, F.; Li, J. Experimental Study on the Mechanical Behavior of Rock Bolts Subjected to Complex Static and Dynamic Loads. Rock Mech. Rock Eng. 2020, 53, 4993–5004. [Google Scholar] [CrossRef]
  7. Luga, E.; Periku, E. A pioneer in-situ investigation on the bearing capacity and failure causes of real scale fully grouted rockbolts. Constr. Build. Mater. 2021, 310, 124826. [Google Scholar] [CrossRef]
  8. Zheng, L.; Zuo, Q. Experimental study on the effect of water-induced deterioration on shear properties of bolted rock joints. Case Stud. Constr. Mater. 2024, 20, e03027. [Google Scholar] [CrossRef]
  9. Ullah, S.; Khan, M.U.; Rehman, G. A brief review of the slope stability analysis methods. Geol. Behav. 2020, 4, 73–77. [Google Scholar] [CrossRef]
  10. Koopialipoor, M.; Jahed Armaghani, D.; Hedayat, A.; Marto, A.; Gordan, B. Applying various hybrid intelligent systems to evaluate and predict slope stability under static and dynamic conditions. Soft Comput. 2019, 23, 5913–5929. [Google Scholar] [CrossRef]
  11. Khajehzadeh, M.; Taha, M.R.; Keawsawasvong, S.; Mirzaei, H.; Jebeli, M. An effective artificial intelligence approach for slope stability evaluation. IEEE Access 2022, 10, 5660–5671. [Google Scholar] [CrossRef]
  12. Asteris, P.G.; Rizal, F.I.M.; Koopialipoor, M.; Roussis, P.C.; Ferentinou, M.; Armaghani, D.J.; Gordan, B. Slope stability classification under seismic conditions using several tree-based intelligent techniques. Appl. Sci. 2022, 12, 1753. [Google Scholar] [CrossRef]
  13. Lin, S.; Zheng, H.; Han, C.; Han, B.; Li, W. Evaluation and prediction of slope stability using machine learning approaches. Front. Struct. Civ. Eng. 2021, 15, 821–833. [Google Scholar] [CrossRef]
  14. Lin, S.; Zheng, H.; Han, B.; Li, Y.; Han, C.; Li, W. Comparative performance of eight ensemble learning approaches for the development of models of slope stability prediction. Acta Geotech. 2022, 17, 1477–1502. [Google Scholar] [CrossRef]
  15. Qin, J.; Du, S.; Ye, J.; Yong, R. SVNN-ANFIS approach for stability evaluation of open-pit mine slopes. Expert Syst. Appl. 2022, 198, 116816. [Google Scholar] [CrossRef]
  16. Moayedi, H.; Tien Bui, D.; Kok Foong, L. Slope stability monitoring using novel remote sensing based fuzzy logic. Sensors 2019, 19, 4636. [Google Scholar] [CrossRef]
  17. Ahangari Nanehkaran, Y.; Pusatli, T.; Chengyong, J.; Chen, J.; Cemiloglu, A.; Azarafza, M.; Derakhshani, R. Application of machine learning techniques for the estimation of the safety factor in slope stability analysis. Water 2022, 14, 3743. [Google Scholar] [CrossRef]
  18. Bi, J.; Luo, X.; Zhang, H.; Shen, H. Stability analysis of complex rock slopes reinforced with prestressed anchor cables and anti-shear cavities. Bull. Eng. Geol. Environ. 2019, 78, 2027–2039. [Google Scholar] [CrossRef]
  19. Yan, M.; Xia, Y.; Liu, T.; Bowa, V.M. Limit analysis under seismic conditions of a slope reinforced with prestressed anchor cables. Comput. Geotech. 2019, 108, 226–233. [Google Scholar] [CrossRef]
  20. Chen, S.; Yang, Z.; Zhang, W.; Li, L.; Zheng, Y.; Yuan, Y. Numerical simulation of the stability of a cutting slope and study on its reinforcement scheme. Adv. Civ. Eng. 2022, 2022, 5306923. [Google Scholar] [CrossRef]
  21. Liu, Y.; Lai, J.; Xu, J. Study on slope monitoring and stability based on bolt–cable combined support. Buildings 2024, 14, 886. [Google Scholar] [CrossRef]
  22. Xia, P.; Zeng, B.; Pan, Y. Stability Evaluation Method for Rock Slope-Anchorage Systems Based on Genetic Algorithms and Discrete Element Analysis. Appl. Sci. 2025, 15, 5057. [Google Scholar] [CrossRef]
  23. Wang, L.; Sun, D.; Yao, Y.; Wu, L.; Xu, Y. Kinematic limit analysis of three-dimensional unsaturated soil slopes reinforced with a row of piles. Comput. Geotech. 2020, 120, 103428. [Google Scholar] [CrossRef]
  24. Guo, M.; Li, C.; Wang, S.; Yin, S.; Liu, S.; Ge, X. Vector-sum method for 2D slope stability analysis considering vector characteristics of force. Int. J. Geomech. 2019, 19, 04019058. [Google Scholar] [CrossRef]
  25. Yang, Y.; Wu, W.; Zheng, H. Stability analysis of slopes using the vector sum numerical manifold method. Bull. Eng. Geol. Environ. 2021, 80, 345–352. [Google Scholar] [CrossRef]
  26. Bian, X.; Liu, J.; Nie, L.; Ma, S.; Tao, W.; Qiu, C.; Xu, G. Reliability evaluation of a high slope reinforced by anchor based on the stochastic finite-element method: Case study. Case Stud. Constr. Mater. 2023, 19, e02650. [Google Scholar] [CrossRef]
  27. Chen, J.F.; Du, C.C.; Peng, M.; Sun, R.; Zhao, F.; Shi, Z.M. System reliability analysis of a slope stabilized with anchor cables and piles under seismic loading. Acta Geotech. 2023, 18, 4493–4514. [Google Scholar] [CrossRef]
  28. Xia, P.; Hu, X.; Wu, S.; Ying, C.; Liu, C. Slope Stability Analysis Based on Group Decision Theory and Fuzzy Comprehensive Evaluation. J. Earth Sci. 2020, 31, 1121–1132. [Google Scholar] [CrossRef]
  29. Wang, G.; Zhao, B.; Wu, B.; Zhang, C.; Liu, W. Intelligent prediction of slope stability based on visual exploratory data analysis of 77 in situ cases. Int. J. Min. Sci. Technol. 2023, 33, 47–59. [Google Scholar] [CrossRef]
  30. Sardana, S.; Verma, A.K.; Verma, R.; Singh, T.N. Rock slope stability along road cut of Kulikawn to Saikhamakawn of Aizawl, Mizoram, India. Nat. Hazards 2019, 99, 753–767. [Google Scholar] [CrossRef]
  31. Sardana, S.; Verma, A.K.; Singh, A.; Laldinpuia. Comparative analysis of rockmass characterization techniques for the stability prediction of road cut slopes along NH-44A, Mizoram, India. Bull. Eng. Geol. Environ. 2019, 78, 5977–5989. [Google Scholar] [CrossRef]
  32. Jingwen, L.; Jiangang, Q.; Yuanming, D.; Xu, F.; Xiaoli, L. Safety Evaluation Method of Antifloating Anchor System Based on Comprehensive Weighting Method and Gray-Fuzzy Theory. Math. Probl. Eng. 2020, 2020, 3216948. [Google Scholar] [CrossRef]
  33. Zhu, H.; Xiang, Q.; Luo, B.; Du, Y.; Li, M. Evaluation of failure risk for prestressed anchor cables based on the AHP-ideal point method: An engineering application. Eng. Fail. Anal. 2022, 138, 106293. [Google Scholar] [CrossRef]
  34. Wang, J.; Cao, Q.; Mi, X.; Li, D. Research on safety evaluation of bolt support based on analytic hierarchy process-entropy weight method. E3S Web Conf. 2020, 213, 03019. [Google Scholar] [CrossRef]
  35. Wang, J.; Apel, D.B.; Xu, H.; Wei, C. Evaluation of the performance of yielding rockbolts during rockbursts using numerical modeling method. Int. J. Coal Sci. Technol. 2022, 9, 87. [Google Scholar] [CrossRef]
  36. Gaurav, K.; Kumar, R.; Mandal, P.K.; Das, A.J. Evaluation of a novel pyramidal design of rock bolt bearing plate using analytical, experimental, and numerical methods. Eng. Struct. 2023, 297, 116998. [Google Scholar] [CrossRef]
  37. Ye, W.; Ma, Y.; Qin, C.; Wang, H.; Li, C.; Ding, Z. Effects of degraded durability on the long-term stability of in-service slopes with reinforced concreted support structures. Sci. Rep. 2024, 14, 21297. [Google Scholar] [CrossRef] [PubMed]
  38. Skipochka, S.; Krukovskyi, O.; Serhiienko, S.; Krasovskyi, I. Non-destructive testing of rock bolt fastening as an element of monitoring the state of mine workings. Min. Miner. Depos. 2019, 16–23. [Google Scholar] [CrossRef]
  39. Zatar, W.; Xiao, F.; Chen, G.; Nghiem, H. Assessment of the Conditions of Anchor Bolts Grouted with Resin and Cement Through Impact-Echo Testing and Advanced Spectrum Analysis. Buildings 2025, 15, 399. [Google Scholar] [CrossRef]
  40. Skipochka, S.; Krukovskyi, O.; Serhiienko, V.; Krasovskyi, I. Physical modeling of the rock bolt interaction with the rock massif. E3S Web Conf. 2019, 123, 01002. [Google Scholar] [CrossRef]
  41. Yu, S.; Zhu, W.; Niu, L. Experimental and numerical evaluation on debonding of fully grouted rockbolt under pull-out loading. Int. J. Coal Sci. Technol. 2022, 9, 8. [Google Scholar] [CrossRef]
  42. Aghababaei, S.; Jalalifar, H. A field data-based approach for risk and relative efficiency assessment of rock bolt designs in underground coal mines. Research Square 2022. [Google Scholar] [CrossRef]
  43. Sun, H.; Liu, H.; Liu, X.; Ye, Z. Mechanical testing and numerical simulation of intelligent terminal structure of rockbolt used as a deformable support and for safety monitoring in rock engineering. Tunn. Undergr. Space Technol. 2024, 148, 105769. [Google Scholar] [CrossRef]
  44. Fuławka, K.; Pytel, W.; Szumny, M.; Mertuszka, P.; Pałac-Walko, B.; Hartlieb, P.; Jakić, M.; Nöger, M. Prototype of instrumented rock bolt for continuous monitoring of roof fall hazard in deep underground mines. Sensors 2022, 23, 154. [Google Scholar] [CrossRef] [PubMed]
  45. Hosseini, S.; Entezam, S.; Jodeiri Shokri, B.; Mirzaghorbanali, A.; Nourizadeh, H.; Motallebiyan, A.; Entezam, A.; McDougall, K.; Karunasena, W.; Aziz, N. Predicting grout’s uniaxial compressive strength (UCS) for fully grouted rock bolting system by applying ensemble machine learning techniques. Neural Comput. Appl. 2024, 36, 18387–18412. [Google Scholar] [CrossRef]
  46. Hosseini, S.; Jodeiri Shokri, B.; Mirzaghorbanali, A.; Nourizadeh, H.; Entezam, S.; Motallebiyan, A.; Entezam, A.; McDougall, K.; Karunasena, W.; Aziz, N. Predicting axial-bearing capacity of fully grouted rock bolting systems by applying an ensemble system. Soft Comput. 2024, 28, 10491–10518. [Google Scholar] [CrossRef]
  47. Taheri, A.; Tani, K. Assessment of the Stability of Rock Slopes by the Slope Stability Rating Classification System. Rock Mech. Rock Eng. 2010, 43, 321–333. [Google Scholar] [CrossRef]
  48. Song, Y.; Xue, H.; Meng, X. Evaluation method of slope stability based on the Qslope system and BQ method. Bull. Eng. Geol. Environ. 2019, 78, 4865–4873. [Google Scholar] [CrossRef]
  49. Moses, D.; Tumelo, K.D.; Sugeng, W. Rock slope stability analysis by using integrated approach. World J. Eng. Technol. 2020, 8, 405–428. [Google Scholar] [CrossRef]
  50. Mazzoccola, D.F.; Hudson, J.A. A comprehensive method of rock mass characterization for indicating natural slope instability. Q. J. Eng. Geol. Hydrogeol. 1996, 29, 37–56. [Google Scholar] [CrossRef]
  51. Basahel, H.; Mitri, H. Probabilistic assessment of rock slopes stability using the response surface approach—A case study. Int. J. Min. Sci. Technol. 2019, 29, 357–370. [Google Scholar] [CrossRef]
  52. Zheng, Y.; Chen, C.; Liu, T.; Ren, Z. A new method of assessing the stability of anti-dip bedding rock slopes subjected to earthquake. Bull. Eng. Geol. Environ. 2021, 80, 3693–3710. [Google Scholar] [CrossRef]
  53. Aladejare, A.E.; Akeju, V.O. Design and sensitivity analysis of rock slope using Monte Carlo simulation. Geotech. Geol. Eng. 2020, 38, 573–585. [Google Scholar] [CrossRef]
  54. Azarafza, M.; Nanehkaran, Y.A.; Rajabion, L.; Akgün, H.; Rahnamarad, J.; Derakhshani, R.; Raoof, A. Application of the modified Q-slope classification system for sedimentary rock slope stability assessment in Iran. Eng. Geol. 2020, 264, 105349. [Google Scholar] [CrossRef]
  55. Ghafour, B.D. Rock Slope Stability Assessment for Some Locations Within Koisanjaq City, Kurdistan Region, Iraq. Iraqi Geol. J. 2025, 58, 134–148. [Google Scholar] [CrossRef]
  56. Kim, H.; Rehman, H.; Ali, W.; Naji, A.M.; Kim, J.J.; Kim, J.; Yoo, H. Classification of factors affecting the performance of fully grouted rock bolts with empirical classification systems. Appl. Sci. 2019, 9, 4781. [Google Scholar] [CrossRef]
  57. Frenelus, W.; Peng, H.; Zhang, J. An insight from rock bolts and potential factors influencing their durability and the long-term stability of deep rock tunnels. Sustainability 2022, 14, 10943. [Google Scholar] [CrossRef]
  58. Yi, W.; Wang, M.; Zhao, S.; Tong, J.; Liu, C. The effect of rock hardness and integrity on the failure mechanism of mortar bolt composite structure in a jointed rock mass. Eng. Fail. Anal. 2023, 143, 106831. [Google Scholar] [CrossRef]
  59. Han, W.; Luan, H.; Liu, C. Assessment of bolt reinforcement effect based on analytic hierarchy process. Geotech. Geol. Eng. 2019, 37, 803–812. [Google Scholar] [CrossRef]
  60. Lin, M.; Zhang, F.; Wang, W. Experimental Study on Durability and Bond Properties of GFRP Resin Bolts. Materials 2024, 17, 2814. [Google Scholar] [CrossRef]
  61. SL386-2007; Code for Design of Slopes in Hydraulic and Hydroelectric Engineering. China Water & Power Press: Beijing, China, 2007. (In Chinese)
  62. SL/T 212-2020; Technical Specification for Prestressed Anchoring in Hydraulic Engineering. China Water & Power Press: Beijing, China, 2020. (In Chinese)
  63. Wu, R. Study on the Mechanism of Rainfall-Induced Landslides. Master’s Thesis, Central South University, Changsha, China, 2013. (In Chinese). [Google Scholar]
  64. Institute of Water Resources and Hydropower Research. Handbook of Rock Mechanics Parameters; China Electric Power Press: Beijing, China, 1991. (In Chinese) [Google Scholar]
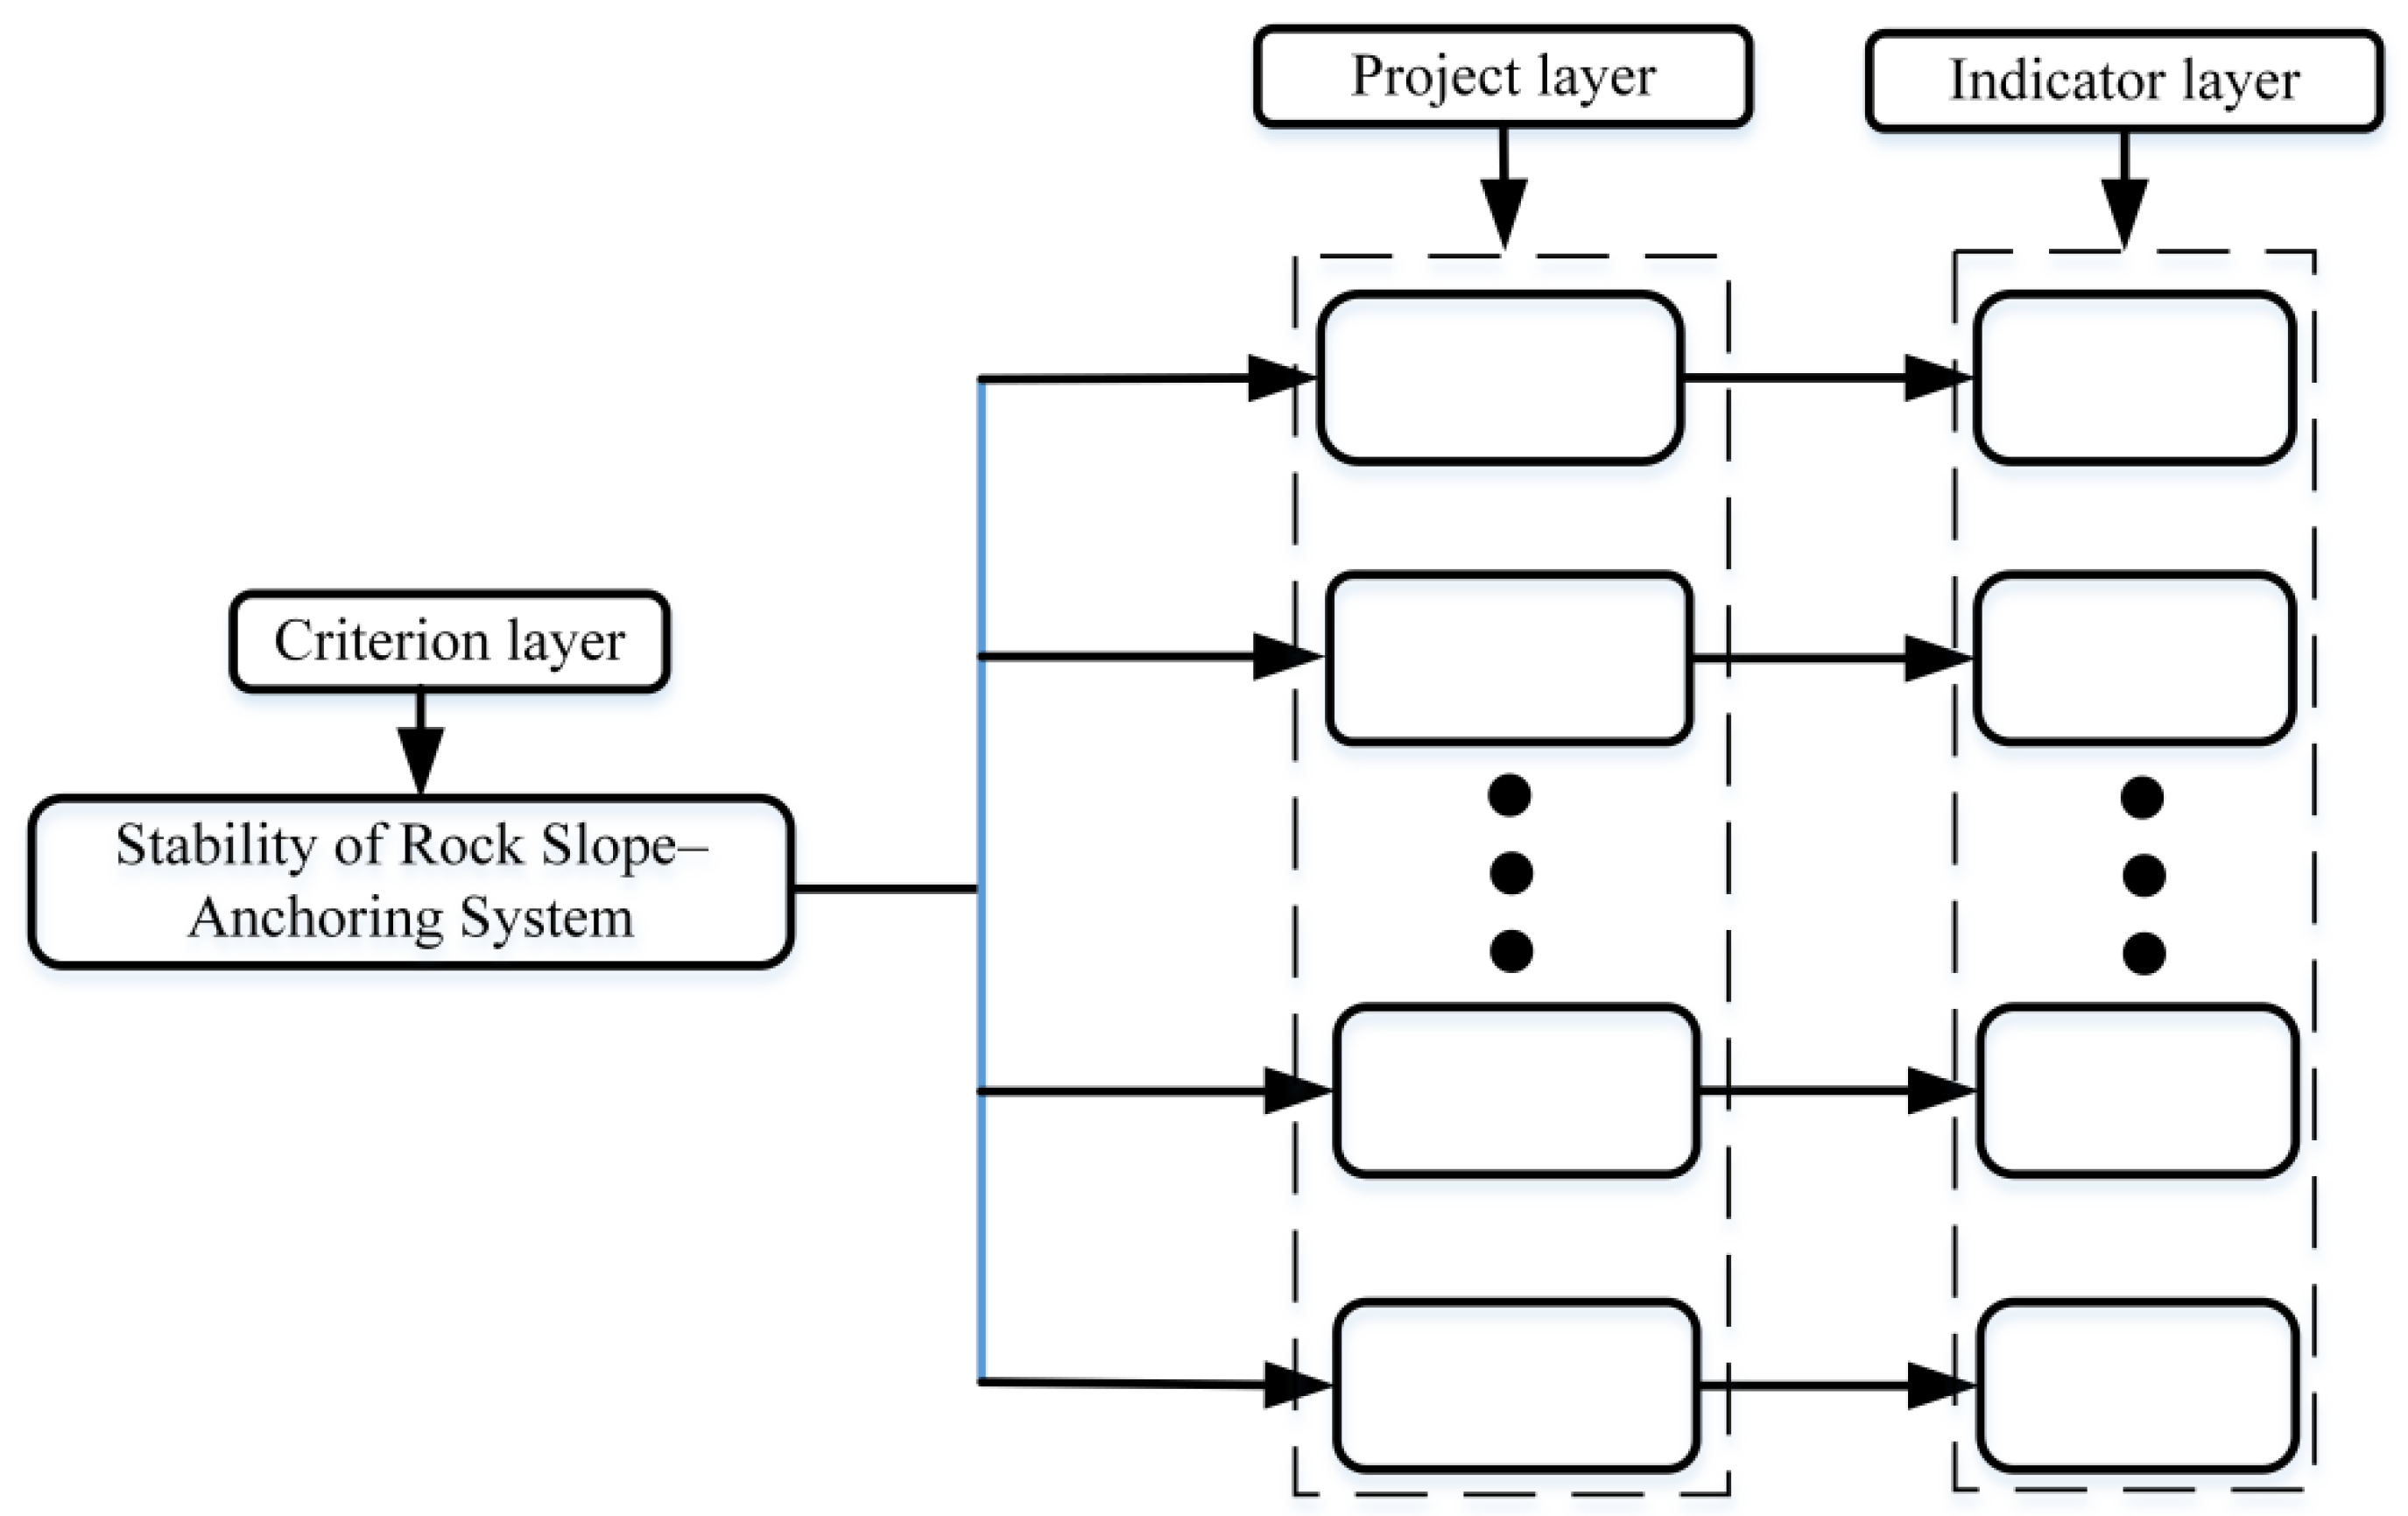
Figure 1. Hierarchical analytical structure of the stability evaluation index system for rock slope–anchoring systems.
Applsci 15 09147 g001
Figure 2. Stability evaluation index system for rock slope–anchoring systems.
Applsci 15 09147 g002
Figure 3. Hierarchical analytic structures of evaluation indices for rock slope–anchoring system stability under different failure modes.
Applsci 15 09147 g003aApplsci 15 09147 g003b
Figure 4. Numerical analysis model.
Applsci 15 09147 g004
Figure 5. Geostudio analysis model of rock slope–anchoring system.
Applsci 15 09147 g005
Figure 6. Relationship curves and mathematical models between evaluation indicators and the stability coefficient of the rock slope–anchoring system. (a) slope angle; (b) slope height; (c) cohesiveness of structural plane; (d) internal friction angle of structural plane; (e) cohesion of rock mass; (f) internal friction angle of rock mass; (g) connectivity of structural plane; (h) bedding slope dip angle; (i) dip angle of strata in anti-dip slopes; (j) rainfall duration; (k) groundwater development; (l) rainfall intensity; (m) seismic activity; (n) strength reserve coefficient of anchor materials; (o) corrosion rate; (p) prestress loss rate; (q) grouting saturation.
Applsci 15 09147 g006aApplsci 15 09147 g006b
Figure 7. Typical influence curves and corresponding mathematical models. (a) Influence curve and mathematical model of groundwater level; (b) influence curve and mathematical model of seismic activity; (c) influence curve and mathematical model of the internal friction angle of structural planes.
Applsci 15 09147 g007
Figure 8. Distribution of stability coefficients of rock slope–anchoring systems under different slope angles.
Applsci 15 09147 g008
Figure 9. Fitted relationship curve and mathematical model between slope angle and the stability coefficient of rock slope–anchoring systems.
Applsci 15 09147 g009
Figure 10. Schematic diagram of stability coefficient grading intervals.
Applsci 15 09147 g010
Figure 11. Schematic diagram of indicator grading standards and classification intervals.
Applsci 15 09147 g011
Figure 12. Schematic diagram of the KNN algorithm principle.
Applsci 15 09147 g012
Table 1. Summary of methods used for rock slope stability evaluation.
Stability Evaluation MethodDescriptionReference
Limit Equilibrium MethodSlope stability is evaluated by calculating the factor of safety (FoS) using limit equilibrium analysis, which is suitable for simple slope assessments.Ullah [9]
Bi [18]
Yan [19]
Numerical Simulation MethodsMethods such as the Finite Element Method (FEM), Finite Difference Method (FDM), and Discrete Element Method (DEM) can be used to analyze the stress–strain behavior of complex slopes.Ullah [9]
Chen [20]
Liu [21]
Xia [22]
Artificial Intelligence MethodsMachine learning methods predict slope stability based on training data, making them suitable for large-scale data analysis.Koopialipoor [10]
Limit Analysis MethodPlasticity theory is used to determine the conditions of slope failure, making this method suitable for investigating slope failure mechanisms.Ullah [9]
Wang [23]
Vector Sum MethodThis method calculates the sliding direction and stability of slopes and is applicable in complex geological settings.Ullah [9]
Guo [24]
Yang [25]
Reliability TheoryReliability theory is applied to estimate the probability of failure in rock slopes, thereby enabling a probabilistic assessment of slope stability.Bian [26]
Chen [27]
Fuzzy Comprehensive Evaluation MethodThe membership degree of each indicator is determined based on fuzzy set theory. According to the weights and membership degrees, fuzzy operations are applied to obtain the membership degree at the criterion level, thereby enabling the evaluation of slope stability.Xia [28]
Table 2. Summary of the application of artificial intelligence algorithms in slope stability evaluation.
Stability Evaluation MethodArtificial Intelligence AlgorithmsReference
Slope Stability Evaluation Method Based on Artificial Intelligence AlgorithmsArtificial Neural Network (ANN), Imperialist Competitive Algorithm (ICA), Genetic Algorithm (GA), Particle Swarm Optimisation (PSO), and Artificial Bee Colony (ABC).Koopialipoor [10]
Artificial Neural Network (ANN) combined with an improved Sine Cosine Algorithm (SCA).Khajehzadeh [11]
Decision Tree (DT), Random Forest (RF), and AdaBoost.Asteris [12]
Support Vector Machine (SVM), Gradient Boosting Regression (GBR), and Bagging methods.Lin [13]
AdaBoost, Gradient Boosting Machine (GBM), Bagging, Extremely Randomized Trees (ET), Random Forest (RF), Histogram-Based Gradient Boosting (HistGB), Voting, and Stacking.Lin [14]
Single-Valued Neutrosophic Number (SVNN) and Adaptive Neuro-Fuzzy Inference System (ANFIS).Qin [15]
Neuro-Fuzzy (NF) systems integrated with Invasive Weed Optimization (IWO) and Elephant Herding Optimization (EHO).Moayedi [16]
Multilayer Perceptron (MLP), Support Vector Machine (SVM), k-Nearest Neighbors (k-NN), Decision Tree (DT), and Random Forest (RF).Ahangari [17]
Intelligent visual analysis utilizing methods such as Principal Component Analysis (PCA), Kernel PCA, Factor Analysis (FA), Independent Component Analysis (ICA), Non-negative Matrix Factorisation (NMF), and t-distributed Stochastic Neighbor Embedding (t-SNE).Wang [29]
Table 3. Summary of non-destructive testing techniques for evaluating anchorage structures.
Non-Destructive Testing TechnologiesDetection ObjectiveReference
Ultrasonic TestingAssess internal defects and corrosion level of rock boltLama [5]
Yu [41]
Fibre Optic Sensing TechnologyReal-time monitoring of strain and deformation in rock boltLama [5]
Piezoelectric SensorsDynamic response of rock boltLama [5]
Electromagnetic Induction TechnologyEvaluate metal loss in rock boltLama [5]
Impact-Echo MethodDetect the integrity of rock boltLama [5]
Skipochka [38]
Zatar [39]
Acoustic Emission TechnologyIdentify microcracks and damage in rock boltLama [5]
Vibration Attenuation MeasurementThe rock bolt fastening qualitySkipochka [38]
Table 4. Summary of evaluation indicators for slope stability and anchoring structure safety.
Indicator CategoryContents IncludedReference
Geomechanical IndicatorsUniaxial compressive strength, rock mass type, BQ (basic quality index of rock mass), friction angle of geomaterials, cohesion of geomaterials, unit weight of geomaterials, rock density, lithology, geomaterial type, dry density of rock mass, dip, dip direction and friction angle of dominant discontinuities, tensile strength of rock layers and shear strength of joints, depth of tensile fracturesTaheri [47]; Song [48]; Koopialipoor [10]; Khajehzadeh [11]; Asteris [12]; Lin [13]; Lin [14]; Qin [15]; Moayedi [16]; Ahangariet [17]; Wang [29]; Moses [49]; Mazzoccola [50]; Basahel [51]; Zheng [52]; Aladejare [53]
Topographic and Geometric Structure IndicatorsQslope (rock slope quality evaluation), slope angle, slope height, potential slip surface angle, elevation, slope aspectSong [48]; Azarafza [54]; Ghafour [55]; Koopialipoor [10]; Khajehzadeh [11]; Asteris [12]; Lin [13]; Lin [14]; Qin [15]; Moayedi [16]; Ahangariet [17]; Wang [29]
Environmental and Dynamic IndicatorsPeak ground acceleration, horizontal acceleration coefficient, pore water pressure, stream power index (SPI), topographic wetness index, direction of seismic inertial force, variation in water depthKoopialipoor [10]; Khajehzadeh [11]; Asteris [12]; Lin [13]; Lin [14]; Qin [15]; Moayedi [16]; Mazzoccola [50]; Zheng [52]; Aladejare [53]
Comprehensive Safety Performance IndicatorsBQ, Qslope, geological strength index (GSI), slope mass rating (SMR), continuous slope mass rating (CoSMR), Chinese slope mass rating (CSMR), failure approaching index (FAI) of anchoring structuresSong [48]; Azarafza [54]; Sardana [30]; Sardana [31]; Zhu [33]
Anchoring System IndicatorsRock mass integrity, influence of groundwater, properties of anchoring materials, prestress level, installation accuracy, grouting effectiveness, long-term stress variation, environmental impact, support parameters, quality of bolts and accessories, construction management and monitoring level, rock strength, development of joints, rebar type, grouting materials, borehole quality, grouting methods, groundwater flow, temperature variation, static load, dynamic impact, corrosion resistance and tensile strength of materials, grouting quality, anchoring depth, humidity, chemical erosion, stress redistribution, deformation control, rock hardness and integrity, compressive strength of grouting materials, rock mass classification, anchor rod diameter, number of bolts, excavation timing, layer characteristics, anchorage length, bolt type and construction technology, grouting quality, bolt type, installation angle, water–cement ratio of grout body, curing time and properties of grouting materialsZhu [33]; Wang [34]; Kim [56]; Frenelus [57]; Yi [58]; Hosseini [45]; Han [59]; Luga [7]; Lin [60]; Hosseini [46]
Table 5. Preliminary indicators for stability evaluation of rock slope–anchoring systems.
Rock Slope HeightCohesion of Rock MassDistribution of Isolated or Overhanging Rock BlocksEarthquake
Rock Slope AngleInternal Friction Angle of Rock MassLithologyStrength Reserve Coefficient
Basic Quality Grade of Rock MassIncluded Angle of Discontinuities in Wedge StructureDrainage SystemVisual Condition
Connectivity of DiscontinuitiesDip Angle of Adverse Bedding PlaneRainfall IntensityGrouting Saturation
Cohesion of DiscontinuitiesDip Angle of Favorable Bedding PlaneRainfall DurationCorrosion Rate
Internal Friction Angle of DiscontinuitiesDegree of Weathering of Rock MassGroundwater DevelopmentPrestress Loss Rate
P-wave Velocity of Rock MassRiverbank ErosionUnit Weight of RockGully Development
Jointing Degree (Fracturing Degree)Slope Crest LoadErosion Characteristics at Slope AngleSurface Water
Fracture DensityDistance from River InfluenceElastic ModulusIn situ Stress
Table 6. Summary of the stability evaluation indicator system structure and rating levels for rock slope–anchoring systems.
Criterion LayerProject LayerIndicator LayerUnit or Evaluation GradeAcquisition Method
Stability of Rock Slope–Anchoring SystemSlope Geometrical FeaturesSlope Angle°Surveying
Slope HeightmSurveying
Hydro-meteorological ConditionsDrainage SystemExcellent, Good, Fair, Poor, Very PoorSite Investigation
Historical Maximum Daily RainfallmmMonitoring
Rainfall DurationdMonitoring
Groundwater Level StatusRatio of Groundwater Level to Slope HeightMonitoring
Rock Mass ConditionsBasic Quality Grade of Rock MassI, II, III, IV, VTesting
Connectivity of Discontinuities%Site Investigation
Cohesion of DiscontinuitiesKPaTesting
Internal Friction Angle of Discontinuities°Testing
Rock Mass CohesionKPaTesting
Rock Mass Internal Friction Angle°Testing
Included Angle of Structural Planes°Site Investigation
Dip Angle of Counter-Inclined Rock Strata°Site Investigation
Dip Angle of Inclined Rock Strata°Site Investigation
Degree of WeatheringUnweathered, Slightly Weathered, Moderately Weathered, Highly Weathered, Completely WeatheredSite Investigation
Distribution of Isolated or Suspended Rock Blocks Site Investigation
LithologyHard, Medium Hard, Soft, Moderately Soft, Very SoftTesting
Accidental FactorsEarthquakeI, II, III, IV, VMonitoring
Anchoring Structure ParametersStrength Reserve Coefficient%Design
Visual ConditionI, II, III, IV, VSite Investigation
Grouting Saturation%Testing
Corrosion Degree of Anchor Cables%Testing
Prestress Loss Rate%Testing
Table 7. Summary of indicator classification.
TypeIndicator
Qualitative IndicatorsDrainage SystemDegree of WeatheringLithology
Rock Mass Quality GradeDistribution of Isolated or Overhanging Rock BlocksVisual Condition
Quantitative IndicatorsRock Slope HeightInternal Friction Angle of RockGroundwater Development
Rock Slope AngleInterfacial Angle of Wedge-shaped DiscontinuitiesSeismic Activity
Joint Connectivity RateDip Angle of Adversely Dipping DiscontinuitiesStrength Reserve Coefficient
Joint CohesionDip Angle of Favorably Dipping DiscontinuitiesGrouting Saturation
Joint Internal Friction AngleMaximum Daily Historical RainfallCorrosion Rate
Rock CohesionRainfall DurationPrestress Loss Rate
Table 8. Summary of classification criteria for qualitative indicators.
IndicatorGrading Standard
Drainage SystemExcellent, Good, Moderate, Poor, Very Poor
Basic Quality Grade of Rock MassI, II, III, IV, V
Degree of WeatheringUnweathered, Slightly Weathered, Moderately Weathered, Strongly Weathered, Completely Weathered
Distribution of Boulders or Overhanging BlocksNo signs of surface loosening; small overhanging blocks (0.01 < volume < 1 m3); some loosened surfaces and small overhanging blocks; several loosened surfaces and small overhanging blocks; potentially detached overhanging blocks (volume > 1 m3)
LithologyHard Rock, Moderately Hard Rock, Soft Rock, Rather Soft Rock, Very Soft Rock
Surface Appearance ConditionI, II, III, IV, V
Table 9. Classification table of rock slope stability.
Operating ConditionsSlope Stability Grade
12345
Normal Operating Condition1.30~1.251.25~1.201.20~1.151.15~1.101.10~1.05
Unusual Operating Condition I1.25~1.201.20~1.151.15~1.101.10~1.05
Unusual Operating ConditionII1.15~1.101.10~1.051.05~1.00
Table 10. Rock mass parameters used in the discrete element numerical model.
TypeShear Strength ParametersBulk Modulus (Pa)Shear Modulus (Pa)
C (Pa)φ (°)
Rock Mass1 × 10623.02 × 1081 × 108
Table 11. Anchor element parameters used in the discrete element numerical model.
TypeShear Strength Parameters of Grouted BodyStiffness of Grouted Body (Pa/m)Perimeter of Grouted Body (m)Cross-Sectional Area
(m2)
Young’s ModulusYield Strength of Anchor Cable (Pa)
C (Pa)Φ (°)
Anchor Cable1.75 × 106201.12 × 1071.75 × 1061.81 × 10−42 × 1084000
Table 12. Parameter values of rock mass in Geostudio mumerical model.
TypeShear Strength ParametersSaturated Water ContentSaturated Permeability Coefficient (m/d)Density
(kN/m3)
C (Pa)φ (°)
Rock Mass30 × 10628.00.380.57920
Table 13. Parameter values of anchor cable elements in Geostudio.
TypePullout Strength
(kPa)
Tensile Strength
(kN)
Bond Length
(m)
Shear Strength
(kN)
Bond Diameter
(m)
Anchor Cable Spacing
(m)
Safety Factor for Pullout ResistanceSafety Factor for Tensile ResistanceSafety Factor for Shear ResistanceAnchor Cable LengthAnchor Cable Angle
Anchor Cable30020001300.38344.5212545°
Table 14. Classification intervals and corresponding safety grades for geometric indicators of the rock slope–anchoring system.
IndicatorClassification IntervalStability GradeDecision Attribute
Elevation of the Rock Slope–Anchoring System (m)[0~3]V(Safe)
[3~7]IV(Basically Safe)
[7~12]III(Potential Risk)
[12~21]II(Unsafe)
[21~100]I(Extremely Unsafe)
Slope Angle of the Rock Slope–Anchoring System(°)[30~31]V(Safe)
[31~32.2]IV(Basically Safe)
[32.2~34]III(Potential Risk)
[34~37]II(Unsafe)
[37~80]I(Extremely Unsafe)
Table 15. Classification of rainfall intensity.
Rainfall Intensity (mm/d)Q < 1010 < Q < 2525 < Q < 5050 < Q < 100100 < Q
Rainfall Intensity ClassificationLight RainModerate RainHeavy RainRainstormSevere Rainstorm
Table 16. Classification intervals and corresponding safety levels of hydrometeorological and seismic indicators for rock slope–anchoring systems.
IndicatorClassification IntervalStability GradeDecision Attribute
Rainfall Duration(d)[0–0.4]V(Safe)
[0.4~0.9]IV(Basically Safe)
[0.9~1.6]III(Potential Risk)
[1.6~2.7]II(Unsafe)
[2.7~5]I(Extremely Unsafe)
Rainfall Intensity (mm/d)[[0–30]V(Safe)
[30~60]IV(Basically Safe)
[60~90]III(Potential Risk)
[90~120]II(Unsafe)
[120~150]I(Extremely Unsafe)
Groundwater Development (Ratio of Groundwater Head to Slope Elevation)[0–0.06]V(Safe)
[0.06~0.14]IV(Basically Safe)
[0.14~0.24]III(Potential Risk)
[0.24~0.41]II(Unsafe)
[0.41~0.9]I(Extremely Unsafe)
Table 17. Correspondence between seismic intensity and horizontal seismic coefficient.
Basic Seismic Intensity7 Degrees8 Degrees9 Degrees
Peak Ground Acceleration 0.1 g0.15 g0.2 g0.3 g0.4 g
Comprehensive Horizontal Seismic Coefficient0.0250.0380.050.0750.1
Table 18. Summary of classification intervals and corresponding safety levels for peak ground acceleration in rock slope–anchoring systems.
IndicatorClassification IntervalStability GradeDecision Attribute
Peak Ground Acceleration (g)[0–0.08]V(Safe)
[0.08~0.16]IV(Basically Safe)
[0.16~0.24]III(Potential Risk)
[0.24~0.32]II(Unsafe)
[0.32~0.4]I(Extremely Unsafe)
Table 19. Value ranges of rock mass condition indicators.
IndicatorValue Range
Cohesion of Discontinuities10 kPa~600 kPa
Internal Friction Angle of Discontinuities10°~60°
Cohesion of Rock Mass0 kPa~4000 kPa
Internal Friction Angle of Rock Mass10°~70°
Connectivity Rate of Discontinuities10%~100%
Dip Angle of Rock Layers in Dip Slope0°~90°
Dip Angle of Rock Layers in Anti-dip Slope0°~90°
Intersection Angle of Discontinuities in Wedge Body20°~150°
Table 20. Classification ranges and corresponding stability levels of rock mass condition indicators for the rock slope–anchoring system.
IndicatorClassification IntervalStability GradeDecision Attribute
Joint cohesion (kPa)[0–322.41]I(Extremely Unsafe)
[322.41~425.77]II(Unsafe)
[425.77~498.01]III(Potential Risk)
[498.01~554.1]IV(Basically Safe)
[554.1~600]V(Safe)
Joint internal friction angle (°)[10–14.4]I(Extremely Unsafe)
[14.4~20]II(Unsafe)
[20~27.3]III(Potential Risk)
[27.3~38.2]IV(Basically Safe)
[38.2~60]V(Safe)
Joint connectivity rate (%)[10–11.4]V(Safe)
[11.4~13.3]IV(Basically Safe)
[13.3~15.9]III(Potential Risk)
[15.9~20.3]II(Unsafe)
[20.3~100]I(Extremely Unsafe)
Dip angle of bedding planes in dip direction (°)[69.56–88] * [88–90]V(Safe)
[60.35–69.56] *IV(Basically Safe)
[51.87~60.35] * [0–3.6]III(Potential Risk)
[42.65~51.87] * [3.6–9.34]II(Unsafe)
[24.68–42.65] * [9.34–24.68]I(Extremely Unsafe)
Dip angle of bedding planes in opposite direction (°)[87.08–90] *V(Safe)
[83.68~87.08] *IV(Basically Safe)
[79.49–83.68] *III(Potential Risk)
[73.75–79.49] * [6.05–19] * II(Unsafe)
[19–35.13]I(Extremely Unsafe)
Rock mass cohesion (kPa)[0–90.6] *I(Extremely Unsafe)
[90.6~207.4] *II(Unsafe)
[207.4–372] *III(Potential Risk)
[372–653.4] *IV(Basically Safe)
[653.4–4000] *V(Safe)
Rock mass internal friction angle (°)[10–14.74] *I(Extremely Unsafe)
[14.74~20.7] *II(Unsafe)
[20.7–28.75] *III(Potential Risk)
[28.75–41.19] *IV(Basically Safe)
[41.19–70] *V(Safe)
Included angle of wedge-shaped structural planes (°)[20–28.22]V(Safe)
[28.22~38.7]IV(Basically Safe)
[38.7–53.18]III(Potential Risk)
[53.18–76.77]II(Unsafe)
[76.77–150]I(Extremely Unsafe)
Indicators marked with * in the table represent “the larger, the better”-type data, while those without * represent “the smaller, the better”-type data.
Table 21. Classification intervals and corresponding safety levels of anchorage structure parameter indicators.
IndicatorClassification IntervalStability GradeDecision Attribute
Strength Reserve Factor [1–1.15] *I(Extremely Unsafe)
[1.15~1.35] *II(Unsafe)
[1.35–1.61] *III(Potential Risk)
[1.61–2.02] *IV(Basically Safe)
[2.02–3] *V(Safe)
Grouting Saturation (%)[10–20] *I(Extremely Unsafe)
[20~30] *II(Unsafe)
[30–42] *III(Potential Risk)
[42–56] *IV(Basically Safe)
[56–100] *V(Safe)
Corrosion Rate (%)[0–5.8]V(Safe)
[5.8~9.2]IV(Basically Safe)
[9.2–11.6]III(Potential Risk)
[11.6–13.5]II(Unsafe)
[13.5–15]I(Extremely Unsafe)
Prestress Loss Rate (%)[[0–20]V(Safe)
[20~40]IV(Basically Safe)
[[40–60]III(Potential Risk)
[[60–80]II(Unsafe)
[[80–100]I(Extremely Unsafe)
Indicators marked with * in the table represent “the larger, the better”-type data, while those without * represent “the smaller, the better”-type data.
Table 22. Summary of grading criteria for evaluation indicators.
IndicatorGrading CriteriaIndicatorGrading CriteriaIndicatorGrading Criteria
Slope Height
A1 (m)
[0~3]Included angle of wedge-shaped structural planes B7 (°)[20~28.22]Rainfall Duration C3 (d)[0~0.4]
[3~7][28.22~38.7][0.4~0.9]
[7~12][38.7–53.18][0.9~1.6]
[12~21][53.18–76.77][1.6~2.7]
[21~100][76.77–150][2.7~5]
Slope Angle A2 (°)[30~31]Dip angle of bedding planes in opposite direction B8 (°)[87.08~90]Groundwater Development C4(Ratio of Groundwater Head to Slope Elevation)[0~0.06]
[31~32.2][83.68~87.08] *[0.06~0.14]
[32.2~34][79.49~83.68] *[0.14~0.24]
[34~37][73.75~79.49] *
[6.05~19] *
[19~35.13]
[0.24~0.41]
[37~80][0~6.05] *
[35.13~58.14]
[0.41~0.9]
Basic Quality Grade of Rock Mass B1VDip angle of bedding planes in dip direction B9 (°)[69.56~88] * [88~90]Seismic Activity D1
(peak ground acceleration)
[0~0.08 g]
IV[60.35~69.56] *[0.08 g~0.16 g]
III[51.87~60.35] *
[0~3.6]
[0.16 g~0.24 g]
II[42.65~51.87] *
[3.6~9.34]
[0.24 g~0.32 g]
I[24.68~42.65] *
[9.34~24.68]
[0.32 g~0.4 g]
Discontinuity Connectivity Rate B2 (%)[10~11.4]Degree of Weathering B10UnweatheredStrength Reserve Factor E1[1~1.15] *
[11.4~13.3]Slightly Weathered[1.15~1.35] *
[13.3~15.9]Moderately Weathered[1.35~1.61] *
[15.9~20.3]Strongly Weathered[1.61~2.02] *
[20.3~100]Completely Weathered[2.02~3] *
Cohesion of Discontinuities B3
(KPa)
[0–322.41]Distribution of Boulders or Overhanging Blocks B11No signs of surface looseningSurface Appearance Condition E2V
[322.41~425.77]Small overhanging blocks (0.01 < volume < 1 m3)IV
[425.77~498.01]Some loosened surfaces and small overhanging blocksIII
[498.01~554.1]Several loosened surfaces and small overhanging blocksII
[554.1~600]Potentially detached overhanging blocks (volume > 1 m3)I
Internal Friction Angle of Discontinuities B4 (°)[10~14.4]Lithology B12Hard RockGrouting Saturation E3
(%)
[10~20] *
[14.4~20]Moderately Hard Rock[20~30] *
[20~27.3]Soft Rock[30~42] *
[27.3~38.2]Rather Soft Rock[42~56] *
[38.2~60]Very Soft Rock[56~100] *
Rock Mass Cohesion B5
(KPa)
[0~90.6] *Drainage System C1ExcellentCorrosion Rate E4
(%)
[0~5.8]
[90.6~207.4] *Good[5.8~9.2]
[207.4~372] *Moderate[9.2~11.6]
[372~653.4] *Poor[11.6~13.5]
[653.4~4000] *Very Poor[13.5~15]
Internal Friction Angle of Rock Mass B6 (°)[10~14.74] *Rainfall Intensity C2 (mm/d)[0~30]Prestress Loss Rate E5
(%)
[0~20]
[14.74~20.7] *[30~60][20~40]
[20.7~28.75] *[60~90][40~60]
[28.75~41.19] *[90~120][60~80]
[41.19~70] *[120~150][80~100]
Indicators marked with * in the table represent “the larger, the better”-type data, while those without * represent “the smaller, the better”-type data.
Table 23. Summary of KNN classification accuracy for different grading methods.
Grading Standard Determination MethodAccuracy
Grading Standard Determination Method Based on Stability Influence Patterns75.3%
Equal Interval Grading Standard Determination Method65.2%
Difference10.1%
Disclaimer/Publisher’s Note: The statements, opinions and data contained in all publications are solely those of the individual author(s) and contributor(s) and not of MDPI and/or the editor(s). MDPI and/or the editor(s) disclaim responsibility for any injury to people or property resulting from any ideas, methods, instructions or products referred to in the content.