Article

Axial Compression Behavior of Steel Angles with Double-Shear Splice Connections in Transmission Towers

1
Energy Development Research Institute, China Southern Power Grid, No. 11 Kexiang Road, Science City, Guangzhou 510663, China
2
State Key Laboratory of Safety and Resilience of Civil Engineering in Mountain Area, Chongqing 400045, China
3
School of Civil Engineering, Chongqing University, Chongqing 400045, China
4
Southwest Electric Power Design Institute Co., Ltd., China Power Engineering and Consulting Group, 16 Dongfeng Road, Chenghua District, Chengdu 610021, China
*
Author to whom correspondence should be addressed.
Appl. Sci. 2025, 15(16), 9140; https://doi.org/10.3390/app15169140
Submission received: 18 July 2025 / Revised: 15 August 2025 / Accepted: 18 August 2025 / Published: 19 August 2025
(This article belongs to the Special Issue Design, Fabrication and Applications of Steel Structures)

Abstract

Structural safety of transmission towers is directly influenced by the behavior of bolted connections at discontinuity joints in the main steel angles. Thus, it is essential to investigate the axial compression behavior of double-shear splice connections of main steel angles. In this study, a total of 10 groups of discontinuous steel angle specimens with double-shear splice connections, comprising eight groups of specimens with the same upper and lower angles and two groups of specimens with different upper and lower angles, were designed and tested in compression. The axial deformation, out-of-plane deflection, and strain at the mid-height of steel angles were measured to analyze the influence of double-shear splice connections on the compression behavior of steel angles. Moreover, comparisons were made among discontinuous steel angles in terms of the ultimate load and the associated deformation to investigate the effects of splice steel ratio, slenderness, bolt spacing, and bolt torque, respectively. Based on the experimental results of steel angles in compression, comparisons with the values calculated using Chinese design codes suggest that present design methods show limited accuracy in calculating the axial compressive load capacity of steel angles with double-shear spliced connections, indicating the necessity for revising the design methods in relevant codes.

1. Introduction

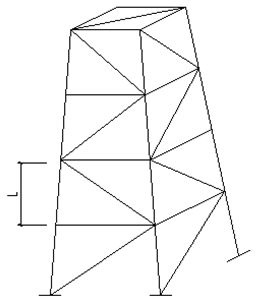
As an important component of the power-transmission system and with the increasing demand for ultrahigh-voltage transmission lines, research studies on the safety and reliability of transmission towers have essential significance [1,2]. Steel equal-leg angles have been widely used in lattice transmission towers, which are primarily subjected to axial compression forces [3] and connected through bolts to transfer spatial loads [4,5]. The usable length of individual steel angles in lattice transmission towers is limited by manufacturing or transportation constraints, and double-shear splice connections are generally used to connect steel angles. However, prevailing Chinese design codes lack precise splicing provisions to achieve both sufficient member lengths and adequate connection capacity [6]. It necessitates the study of the axial compression behavior of steel angles with double-shear splice connections.
Researchers have studied the behaviors and influential factors for equal-leg steel angles under compression and assessed the accuracy of available design methods using experiments or finite element models (FEM). Filipović et al. [7] conducted axial compression tests of pin-ended hot-rolled stainless steel equal-leg angles and found that the main influential parameters included connection methods, material properties, and initial imperfections. Comparisons between test results and predictions from European and North American standards indicate that the specifications are conservative. Studies on factors such as corrosion and loading position at one leg of the steel angle have also been conducted [8,9,10]. Huang et al. [11] and Tan et al. [12] analyzed the local defect effects on compression behavior using combined experimental tests and FEM and proposed design equations for corroded steel angles based on parametric studies. Shi et al. [13,14,15] investigated local buckling behaviors of high-strength equal-leg steel angles under axial compression and proposed modified design methods. However, limited transport or manufacturing capabilities necessitate bolted connections for transmission tower angles. Gusella et al. [16] investigated stiffness and failure mode of bolted connections in cold-formed steel pallet racks through monotonic and cyclic tests, and Roure et al. [17] analyzed semi-rigid joint behavior in similar structures through experimental and finite element methods. As a typical connection method, bolted joints have been extensively used and studied in terms of seismic performance [18,19], bolt torque [20], joint slippage [21,22,23,24], and shear behavior of double-splice bolted connections [25,26]. However, the behavior of steel angles with bolted connections has not been fully investigated.
To connect steel angles in transmission towers, Eom et al. [27,28] proposed end-plate high-strength bolted connections to adjoin upper and lower steel angles. Tensile tests and FEM of varied connection configurations revealed that the primary failure mode of specimens was fracture of bolts, and the plate thickness also affected the connection performance. However, residual stresses and the number of bolts will also affect the loading capacity of steel angles with this type of splice connection. These effects can be mitigated using double-spliced bolted connections. Available studies on steel angles with double-splice bolted connections in transmission towers use FEM to investigate the load capacity and influential factors such as slenderness under axial compression. It was found that bolt connection design and construction will affect the connection behavior [29,30,31]. Gao [32] and Qu [33] investigated the axial compressive stability of discontinuous steel angles with discontinuity joints at panel ends and mid-spans. They analyzed the effects of different factors, including bolt quantity and overlap area ratio, and established equations to calculate the load capacity, in which a slenderness modification factor was proposed. Zhang et al. [6] conducted axial compression tests on equal-leg angle steel columns with end connections and compared the effects of connection length-width ratio, width-to-thickness ratio, and slenderness on discontinuous steel angles with a splice steel ratio of 1.1. Based on FEM, the relationships between effective length coefficients and support stiffness were derived, which were then used to revise the design method in DL/T 5486–2020 [34]. Li et al. [35] conducted axial compression tests on double-shear splice steel angles and investigated the effects of bolt connection length and steel-clad area ratios. The accuracy of Chinese design methods was also examined based on comparisons between experimental results of spliced and non-spliced specimens. However, there is still a lack of experimental studies on the effects of splice steel ratio, slenderness, bolt spacing and bolt torque for the behavior of steel angles with double-shear splice connections under axial compression.
This paper addresses the axial compression behavior of equal-leg steel angles with double-shear splice connections. In the experimental program, discontinuous steel angles were connected by double-splice plates with two rows of bolts. Specimens were designed with different parameters to analyze the effects of splice steel ratio, slenderness, bolt spacing, and bolt torque on compression behavior. Moreover, the cross-sections of the upper and lower angles were also varied to simulate realistic discontinuous connections. The axial deformation, out-of-plane deflection, and mid-height strain were monitored to characterize the axial compression behavior of steel angles in the test. Comparisons are also made among experimental results and calculated values per Chinese design codes. The experimental results can be used to revise the design methods for spliced steel angles in Chinese codes.

2. Experimental Program

2.1. Specimen Design

In transmission towers, main steel angles are connected to bracings from two different directions. In the design of specimens, two bracings aligned with the leg of the main angle were installed on both sides of the main angle. The main member was also extended by 2/3 the length at each end to form a basic segment, thereby eliminating the stress concentration at the end. To mitigate the adverse impacts of discontinuity locations on the stability of the main angle, the splice was placed at a region 360 mm away from the segment end, as shown in Figure 1. The specimen was fixed vertically to the testing frame, with the end nearer to the discontinuity point at the bottom. Four out-of-plane diagonal bracings were connected to the frame.
The experimental program comprised 11 groups of specimens with varied connection configurations. One group of specimens was made of intact main steel angles, and the other groups were made of discontinuous steel angles spliced in the middle. The details of the double-shear splice joint are shown in Figure 2. Three steel angles were tested in axial compression in each group, as summarized in Table 1. All main angles, splice steel, and diagonal bracing components were fabricated of Q355 steel, with equal-leg angle sections used for the specimen. Moreover, four bolts were used in each discontinuous specimen. Grade 6.8 M20 bolts were used for the connection, with corresponding bolt holes 1 to 2 mm larger than the bolts in diameter. The specimen is designated as follows: A denotes the splice steel ratio of 1.1, 1.2, and 1.3, respectively, which is defined as the ratio of the combined gross cross-sectional areas of the inner angle steel and the outer splice plates at the splice joint to the cross-sectional area of the upper portion of the main steel angle.; D represents the bolt spacing, including 50.0 mm, 58.0 mm and 62.5 mm, which refers to the distance between adjacent bolts; S represents the slenderness of 40, 55 and 70, respectively, which is defined as the ratio of the segment length between joints of main angle to the minimum radius of gyration of the cross-section; T corresponds to the bolt torque, including 100 N·m and 225 N·m. A0-S55 was the intact primary member with a steel angle section of L125 × 10 and a total length of 1350 mm, obtained from the work of Li et al. (2025) [35]. Except that A1.1-S55-D50.0-T225 and A1.1-S55-D62.5-T225 were designed with steel angle sections of L140 × 10 and L125 × 10 to form the main angle, the other specimens were designed with main angles of L125 × 10. The diagonal bracings were designed with steel angles of L63 × 5 with a length of 1000 mm.

2.2. Test Setup and Loading Procedures

To achieve the specified boundary condition, each specimen was connected to a testing frame, as shown in Figure 3. Horizontal steel angles were connected to the columns of the frame through bolts, and vertical steel angles were bolted to the steel beam. A hydraulic jack of 5000 kN capacity was placed underneath the vertical steel angle to apply axial compression. A load cell was inserted between the hydraulic jack and the vertical steel angle to measure the applied compression force.
Displacement transducers with strokes of 100 mm and 200 mm were used to measure the lateral deflection of the steel angle. A vertical displacement transducer was arranged at the hydraulic jack to measure its displacement, and horizontal displacement transducers were placed at the section corresponding to the quarter length of the vertical steel angle, as shown in Figure 4a. Strain gauges were mounted at the middle and quarter lengths of the vertical steel angle and the third length of the horizontal steel angle, as shown in Figure 4b.

2.3. Mechanical Properties of Steel Angles

Steel coupons were cut from the angle according to GB/T2975-2018 [36] and tested in tension per GB/T228.1-2021 [37]. Three samples were tested for each steel angle specification. The yield strength, ultimate strength, elastic modulus, and elongation were obtained from the test results, as included in Table 2. The yield strength of steel angles was within the range of 377.3 MPa and 413.9 MPa, and the ultimate strength ranged from 555.6 MPa and 572.7 MPa.

3. Experimental Tests and Discussions

3.1. Load-Deformation Curves

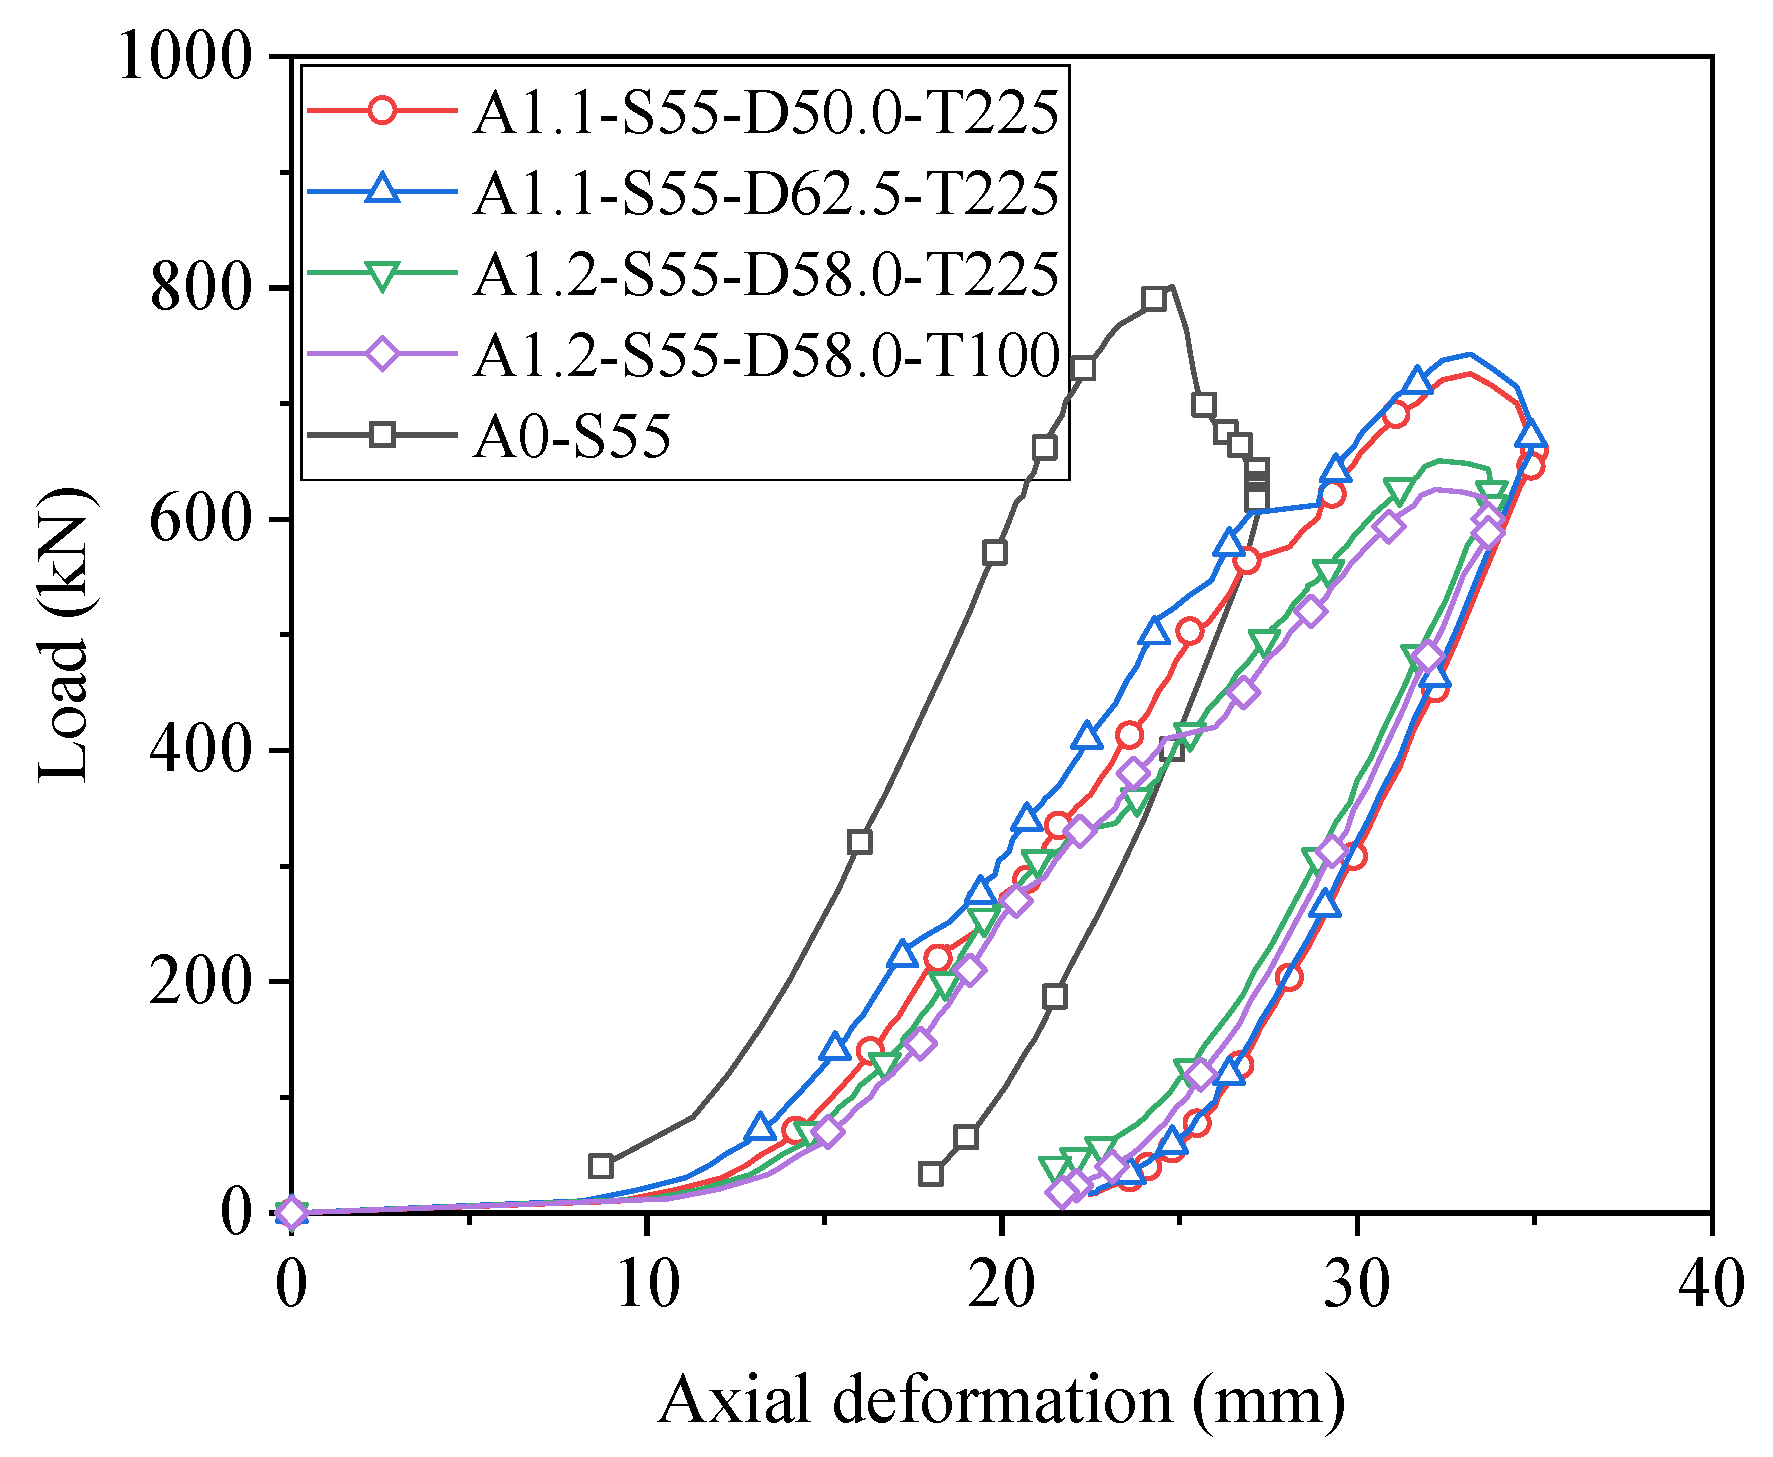
Figure 5 compares the load-axial deformation curve between the intact and discontinuous steel angles with various splice steel conditions and a slenderness of 55. It shows that the presence of the splice connection in the main steel angle significantly reduced the axial compression capacity but increased the associated axial deformation. Despite several differences between these curves, such as the abrupt stiffness changes in the load-deformation curves of discontinuous angles, all curves show similar overall trends. The intact angle A0-S55 exhibited significantly smaller axial deformations at the peak load than spliced angles. The difference was primarily due to bolt slippage and secondary deformation occurring at the splice connections of the discontinuous members after failure.
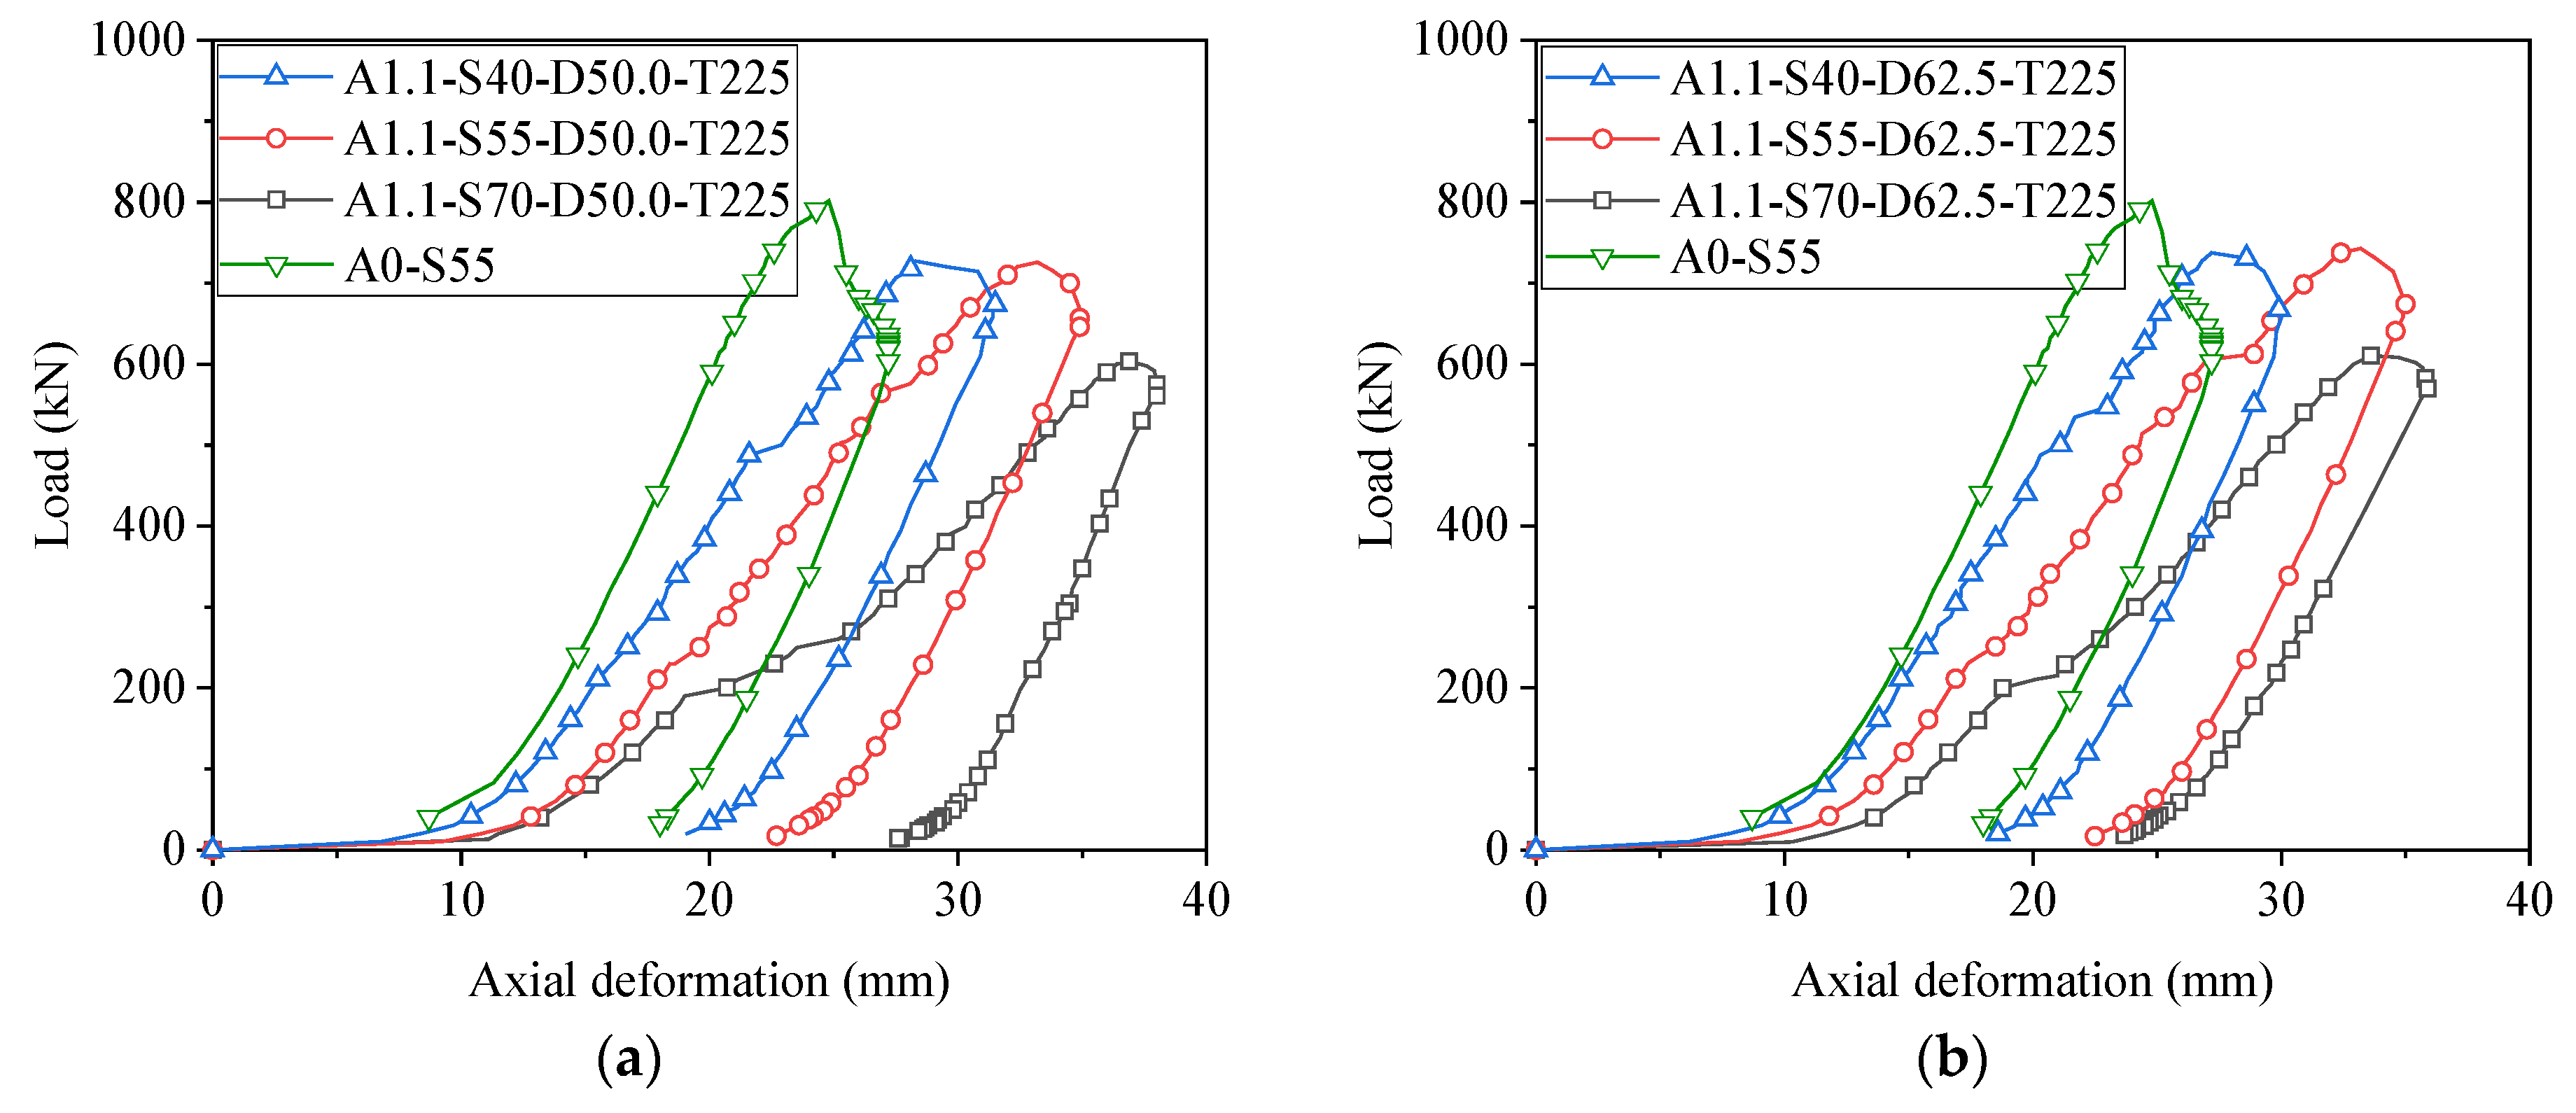
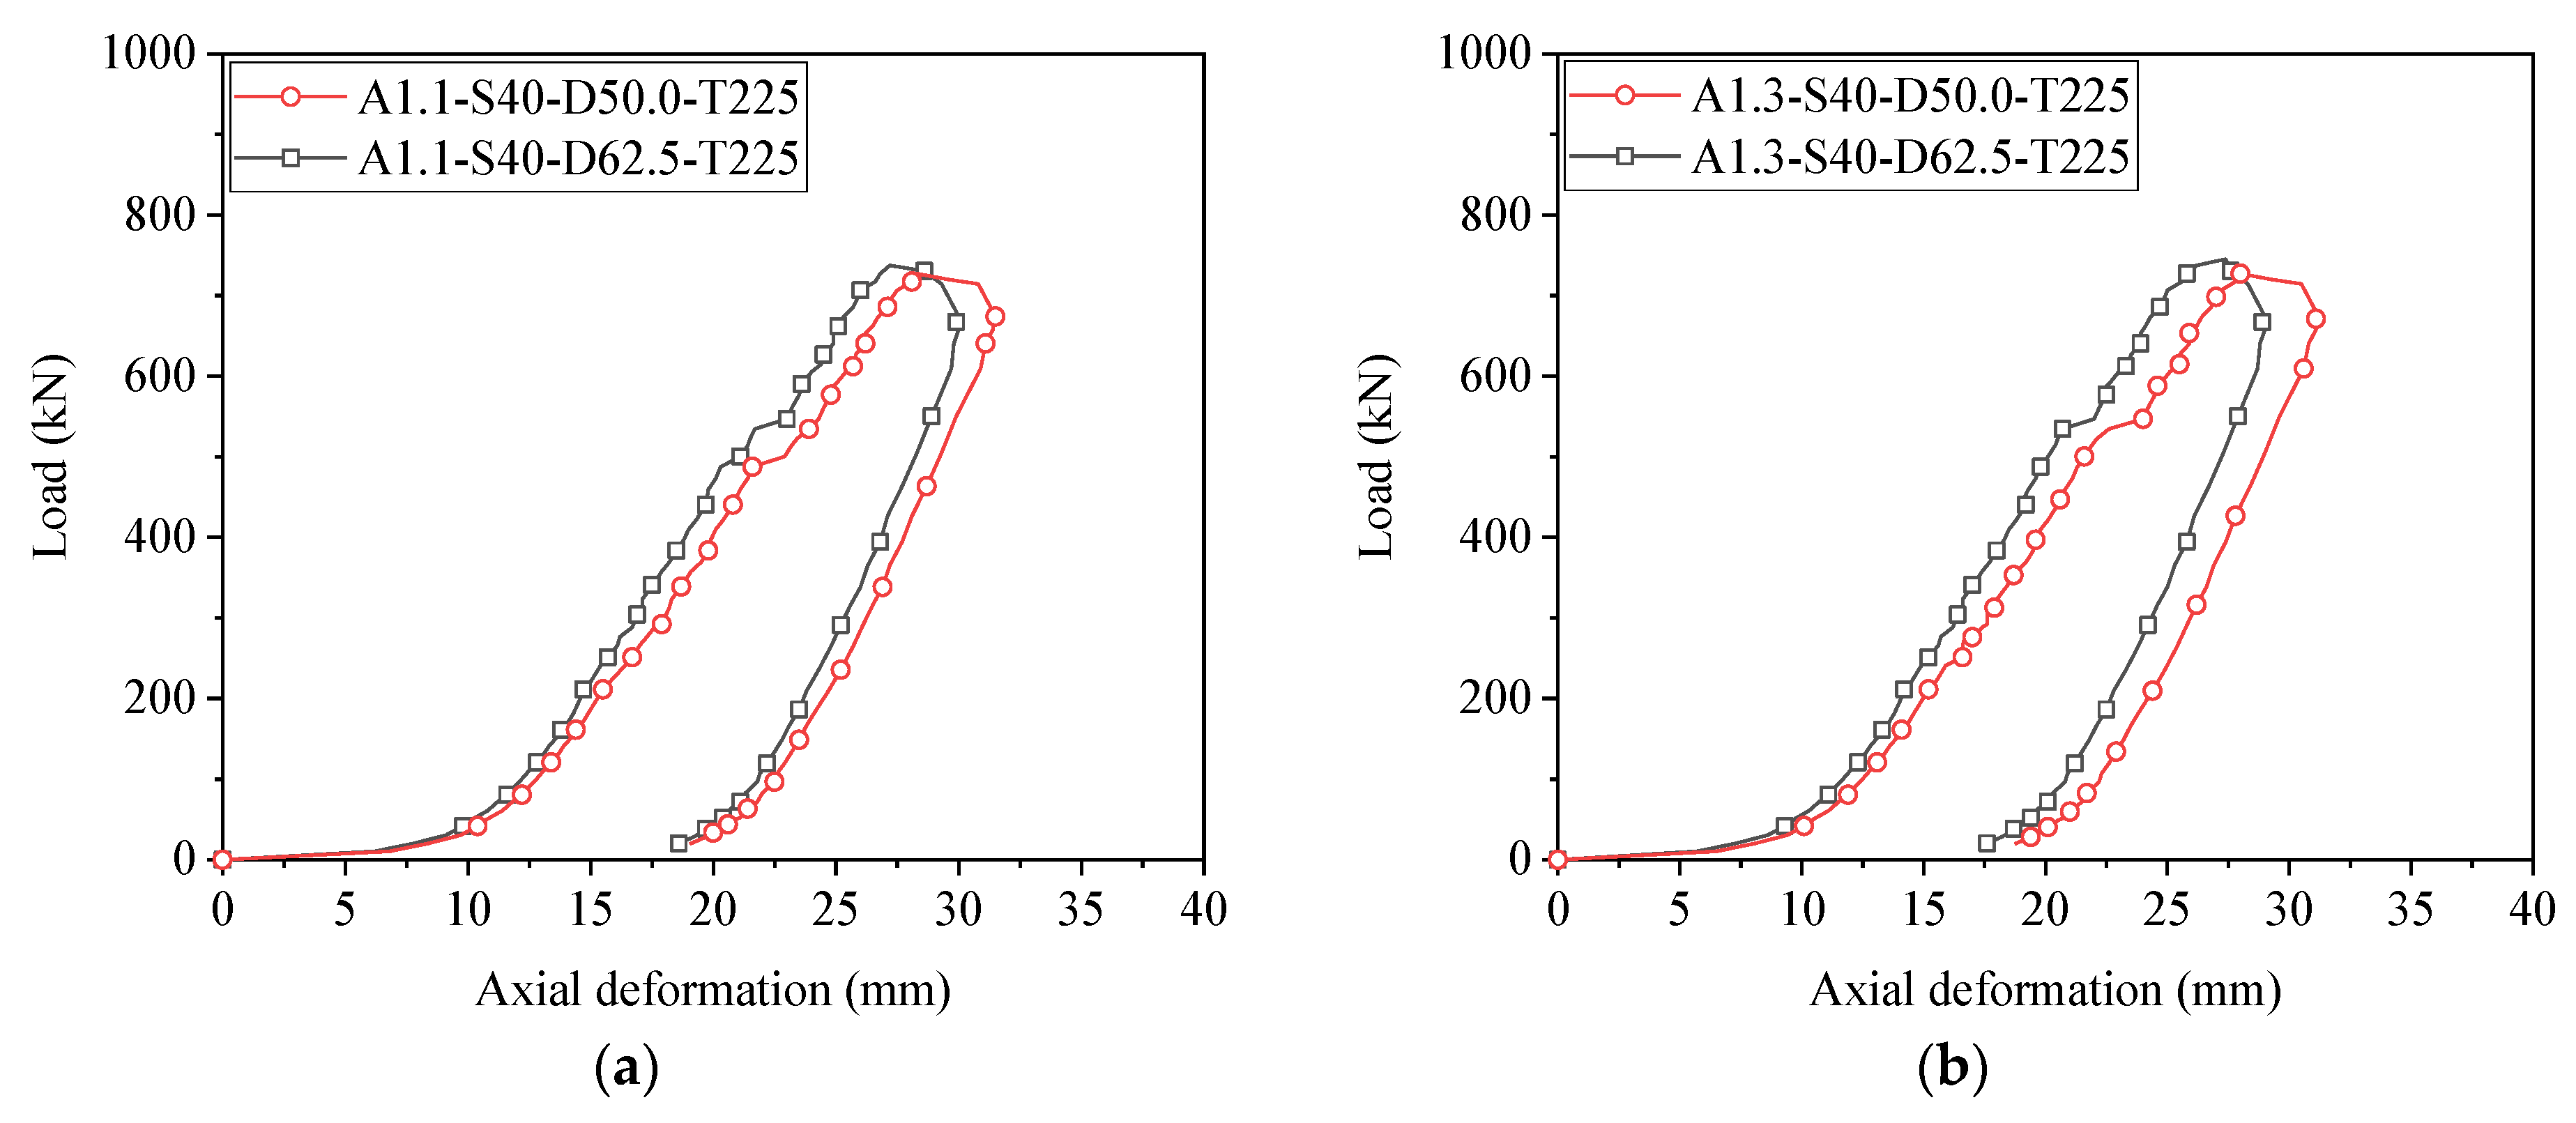
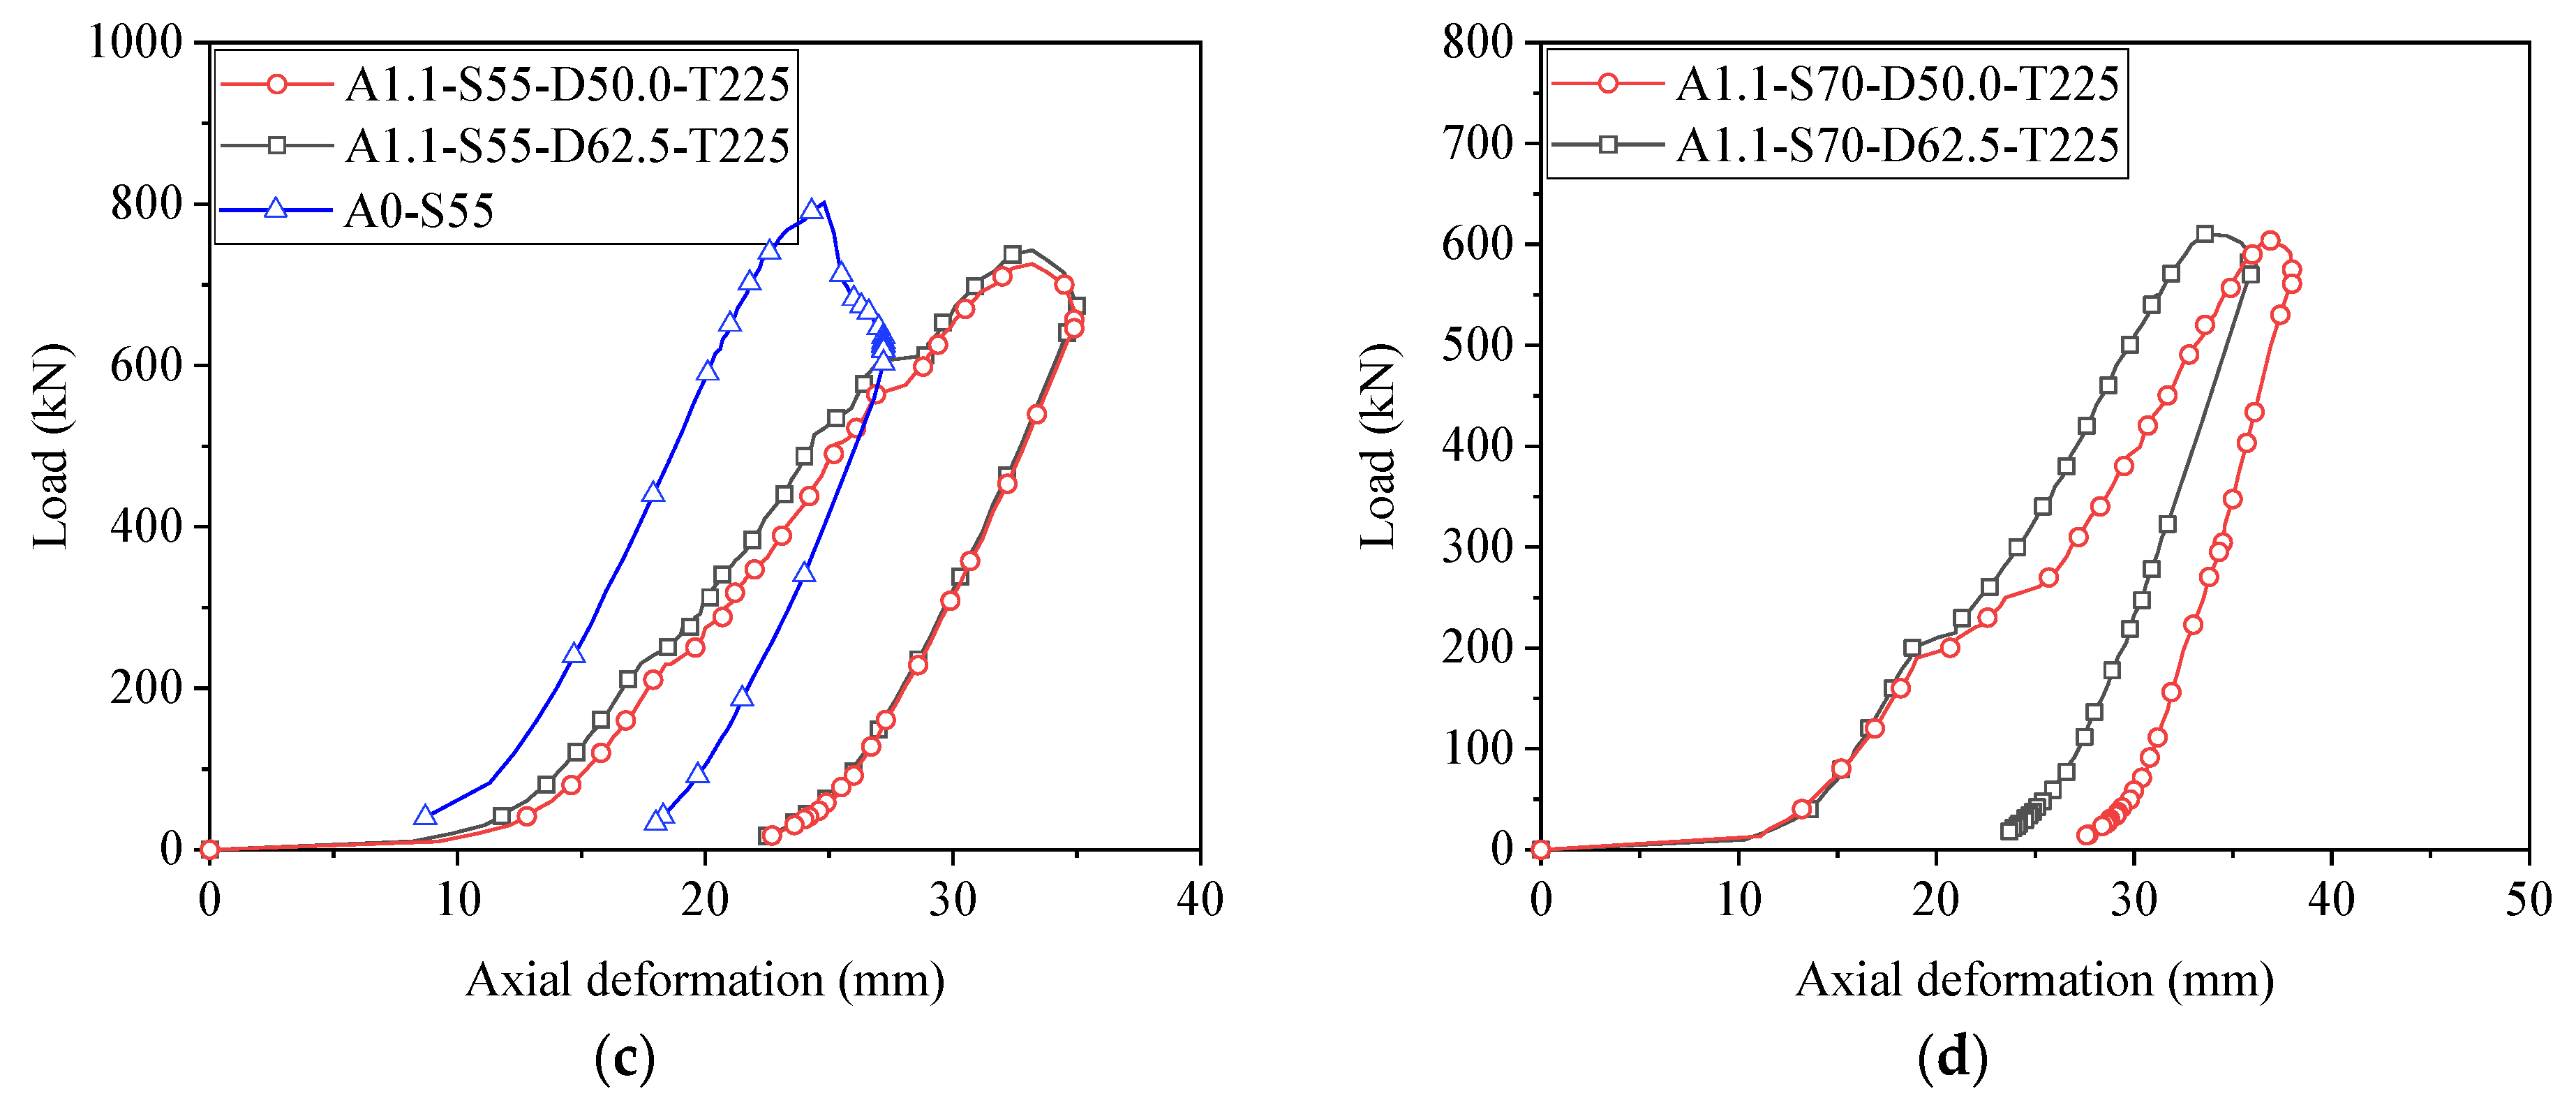
Figure 6, Figure 7, Figure 8 and Figure 9 show a typical load-axial deformation curve of specimens under compression. It can be observed that the load-deformation curves of the main steel angles under different cases exhibit similar variation trends. Due to the presence of connection gaps, the axial compression was rather limited when the axial deformation was less than 10 mm. Thereafter, the gap was closed up, and the applied axial compression started increasing almost linearly with the axial deformation. It should be pointed out that sudden changes in the axial deformation were also measured during testing, which was different from the stable increasing trend of A0-S55. It was mainly attributed to the slippage of bolts in shear. The load corresponding to the sudden deformation change varied with the cross-section and slenderness of the vertical steel angle. Moreover, the load of connections can be determined by the load at the occurrence of a sudden slip in the load-deformation curves. For instance, when the slenderness of steel angles was 40, the deformation change occurred at an axial compression of approximately 550 kN; when the slenderness increased to 70, the associated compression force was significantly reduced to 250 kN, as shown in Figure 7. Likewise, when the upper and lower cross-section of steel angles was 125 × 10 mm, the corresponding axial compression was between 300 kN and 450 kN for a slenderness of 55, whereas the compression increased to 600 kN when the cross-section of the lower angles became 140 × 10 mm and the slenderness remained the same. After the load reached its peak value, the axial displacement increased at an expedited rate, and then the vertical steel angle buckled, leading to a reduction of the applied load. The typical failure mode of the discontinuous vertical steel angle was characterized by flexural–torsional buckling at the mid-height.
Comparisons among load-deformation curves of steel angles demonstrated that differences existed in the initial stiffness. The slenderness of vertical steel angles had a significant influence on the initial stiffness, whereas the splice steel ratio only marginally affected the initial stiffness of vertical steel angles. The influence of bolt torque on the initial stiffness of vertical steel angles remained negligible, but the effect of bolt spacing varied with the slenderness of vertical steel angles. For vertical steel angles with a slenderness of 40, the same initial stiffness was obtained for the specimens, indicating that the influence of bolt spacing on the initial stiffness was rather limited, as shown in Figure 8. On the contrary, the initial stiffness of vertical steel angles was significantly affected when the slenderness increased to 70.

3.2. Failure Modes of Steel Angles

Under axial compression, the failure mode of intact primary steel angles differed significantly from that of discontinuous members with splice connections. It was found that specimen A0-S55 failed in flexural buckling about the weak axis near the mid-span section. Substantial out-of-plane deformations were also observed, whereas torsional deformations at the mid-span remained limited due to the presence of diagonal bracing restraints. The dominant failure mode was characterized by flexural buckling at the mid-height.
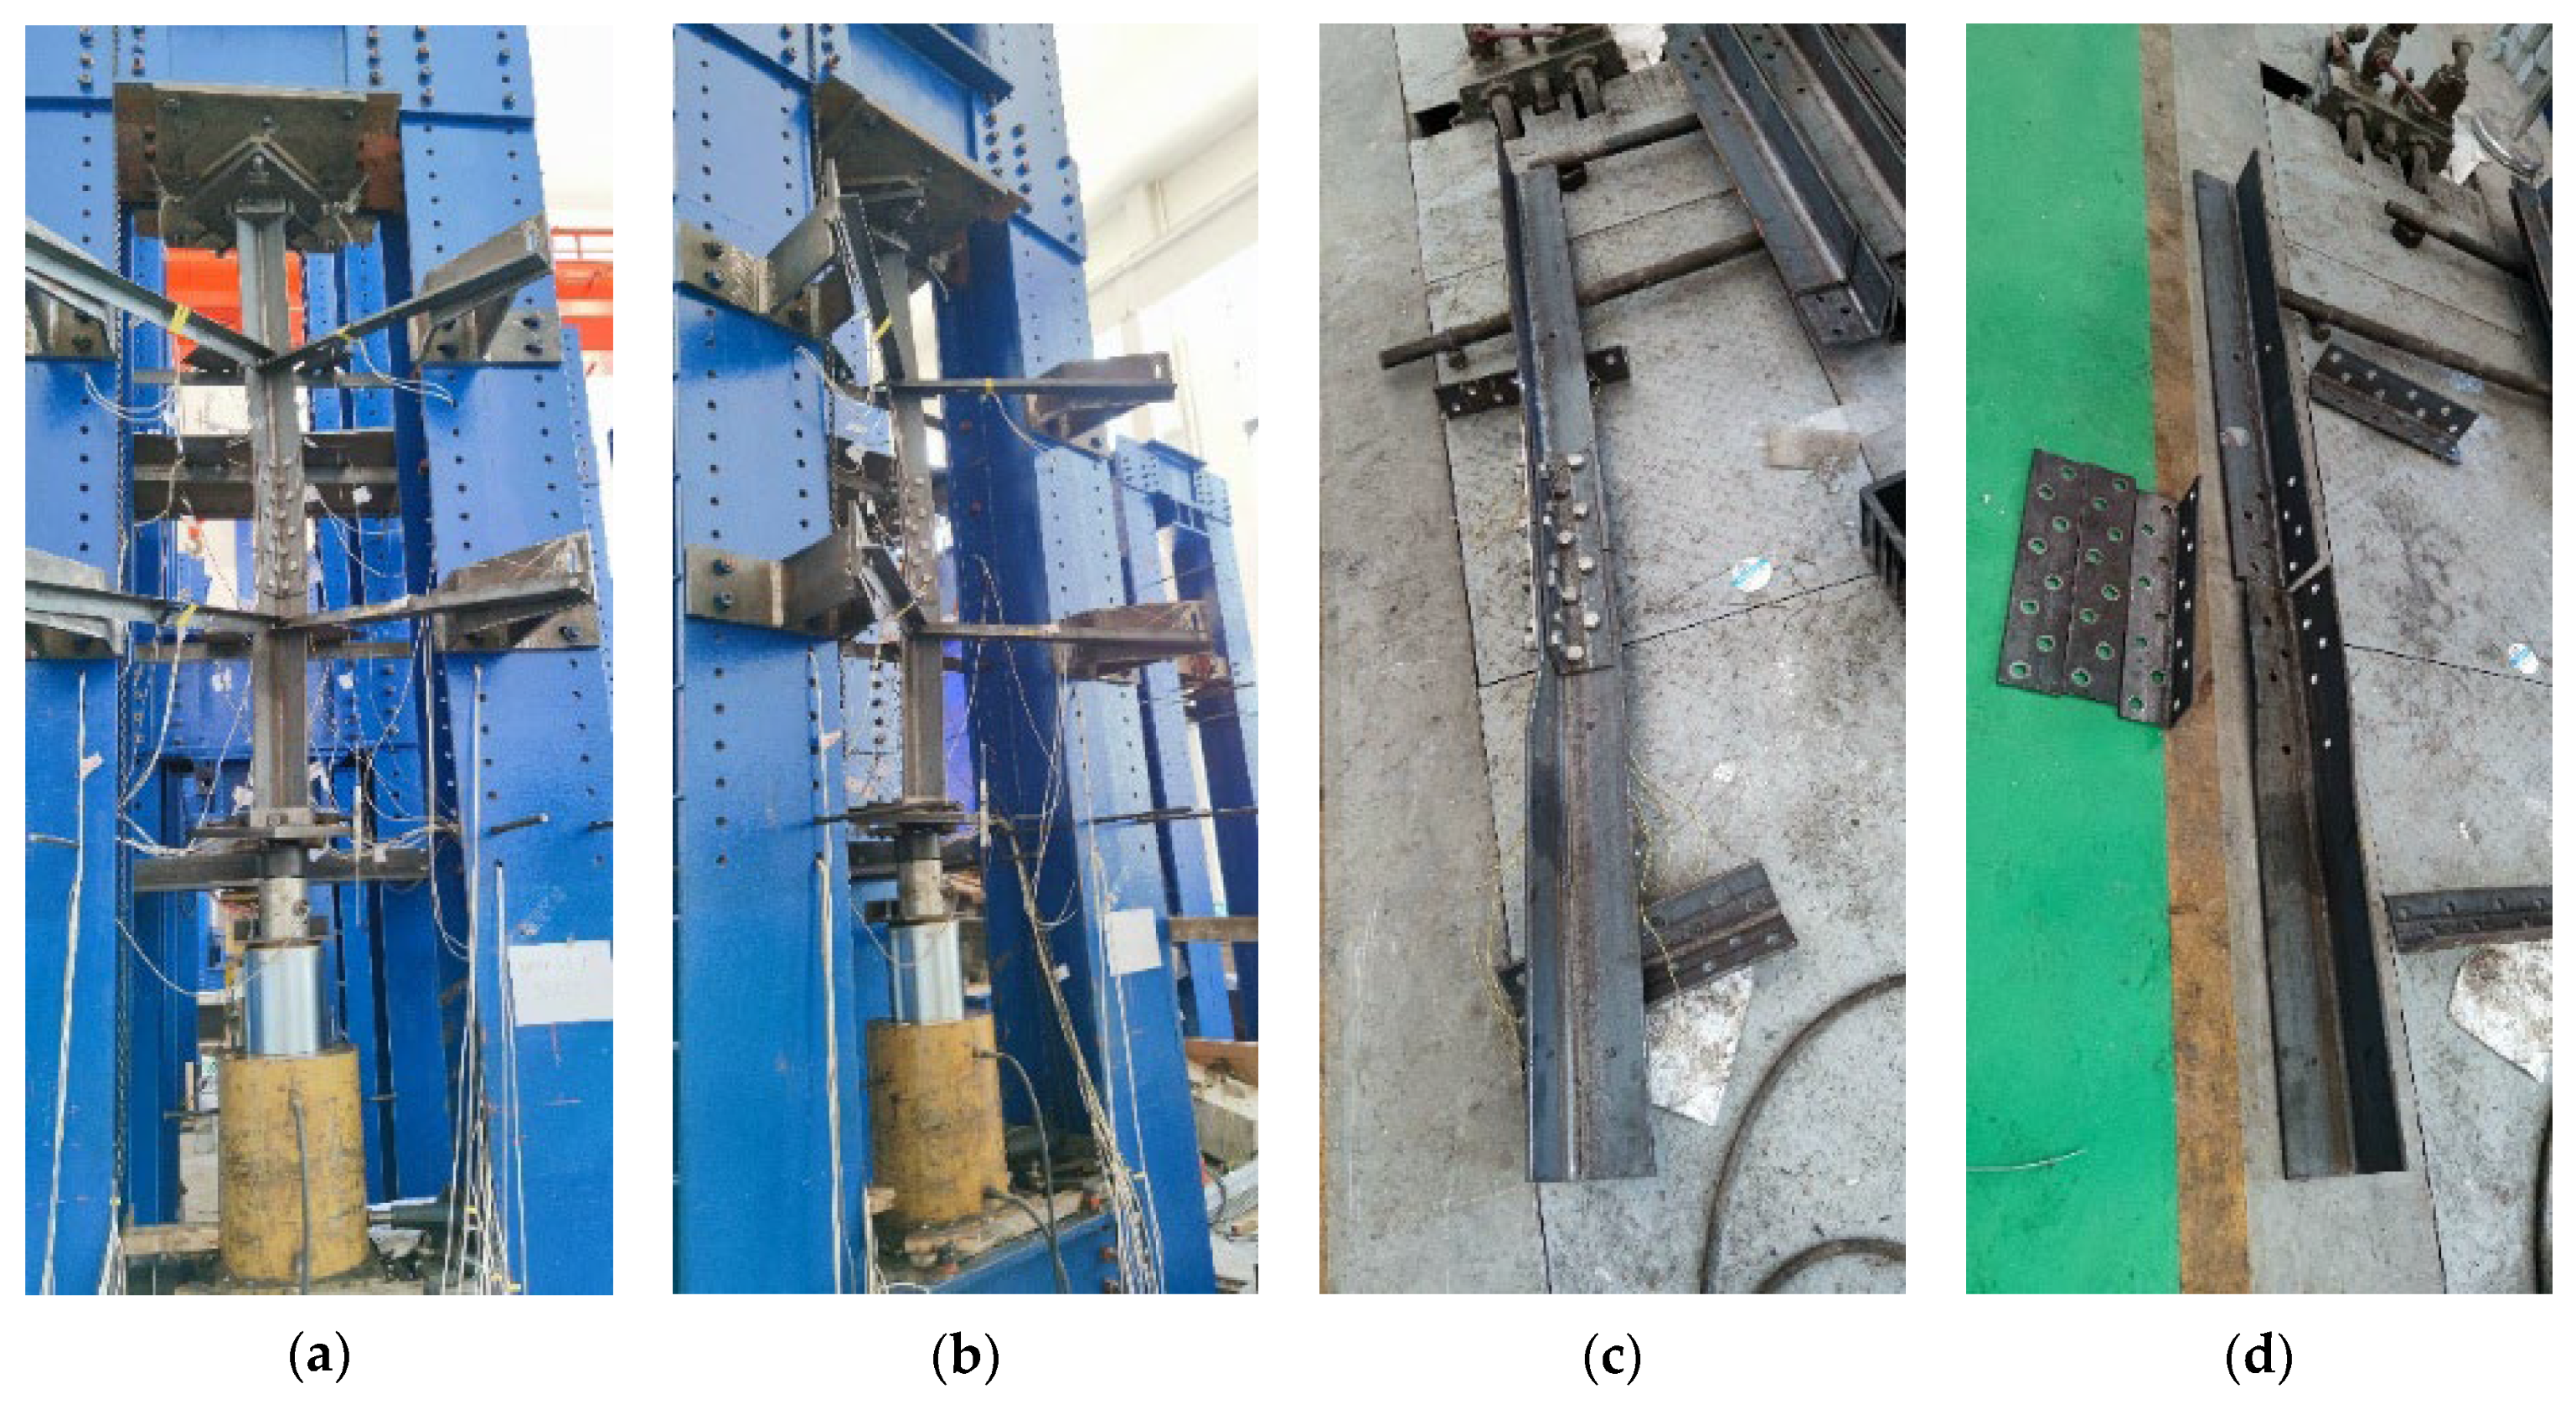
Specimens in group A1.3-S40-D62.5-T225 with the same upper and lower steel angles developed combined flexural–torsional buckling and buckling of diagonal bracing at the connection, as shown in Figure 10. When the applied load approached the ultimate load capacity, the specimens showed slight flexural–torsional deformations. For discontinuous steel angles with slendernesses of 40 and 55, abrupt stiffness changes at the discontinuous joint induced stress concentrations. Therefore, when the ultimate load capacity was reached, initial yielding occurred at the toe of the steel angle above the discontinuous joints, and local buckling developed. For specimens with a slenderness of 70, the stress level within the cross-section was reduced by its higher slenderness, which caused buckling failure before yielding of steel. It indicated that once the ultimate load was attained, abrupt buckling occurred at the cross-section above the connection, resulting in a sharp load reduction due to the abrupt change in the stiffness of the specimens.
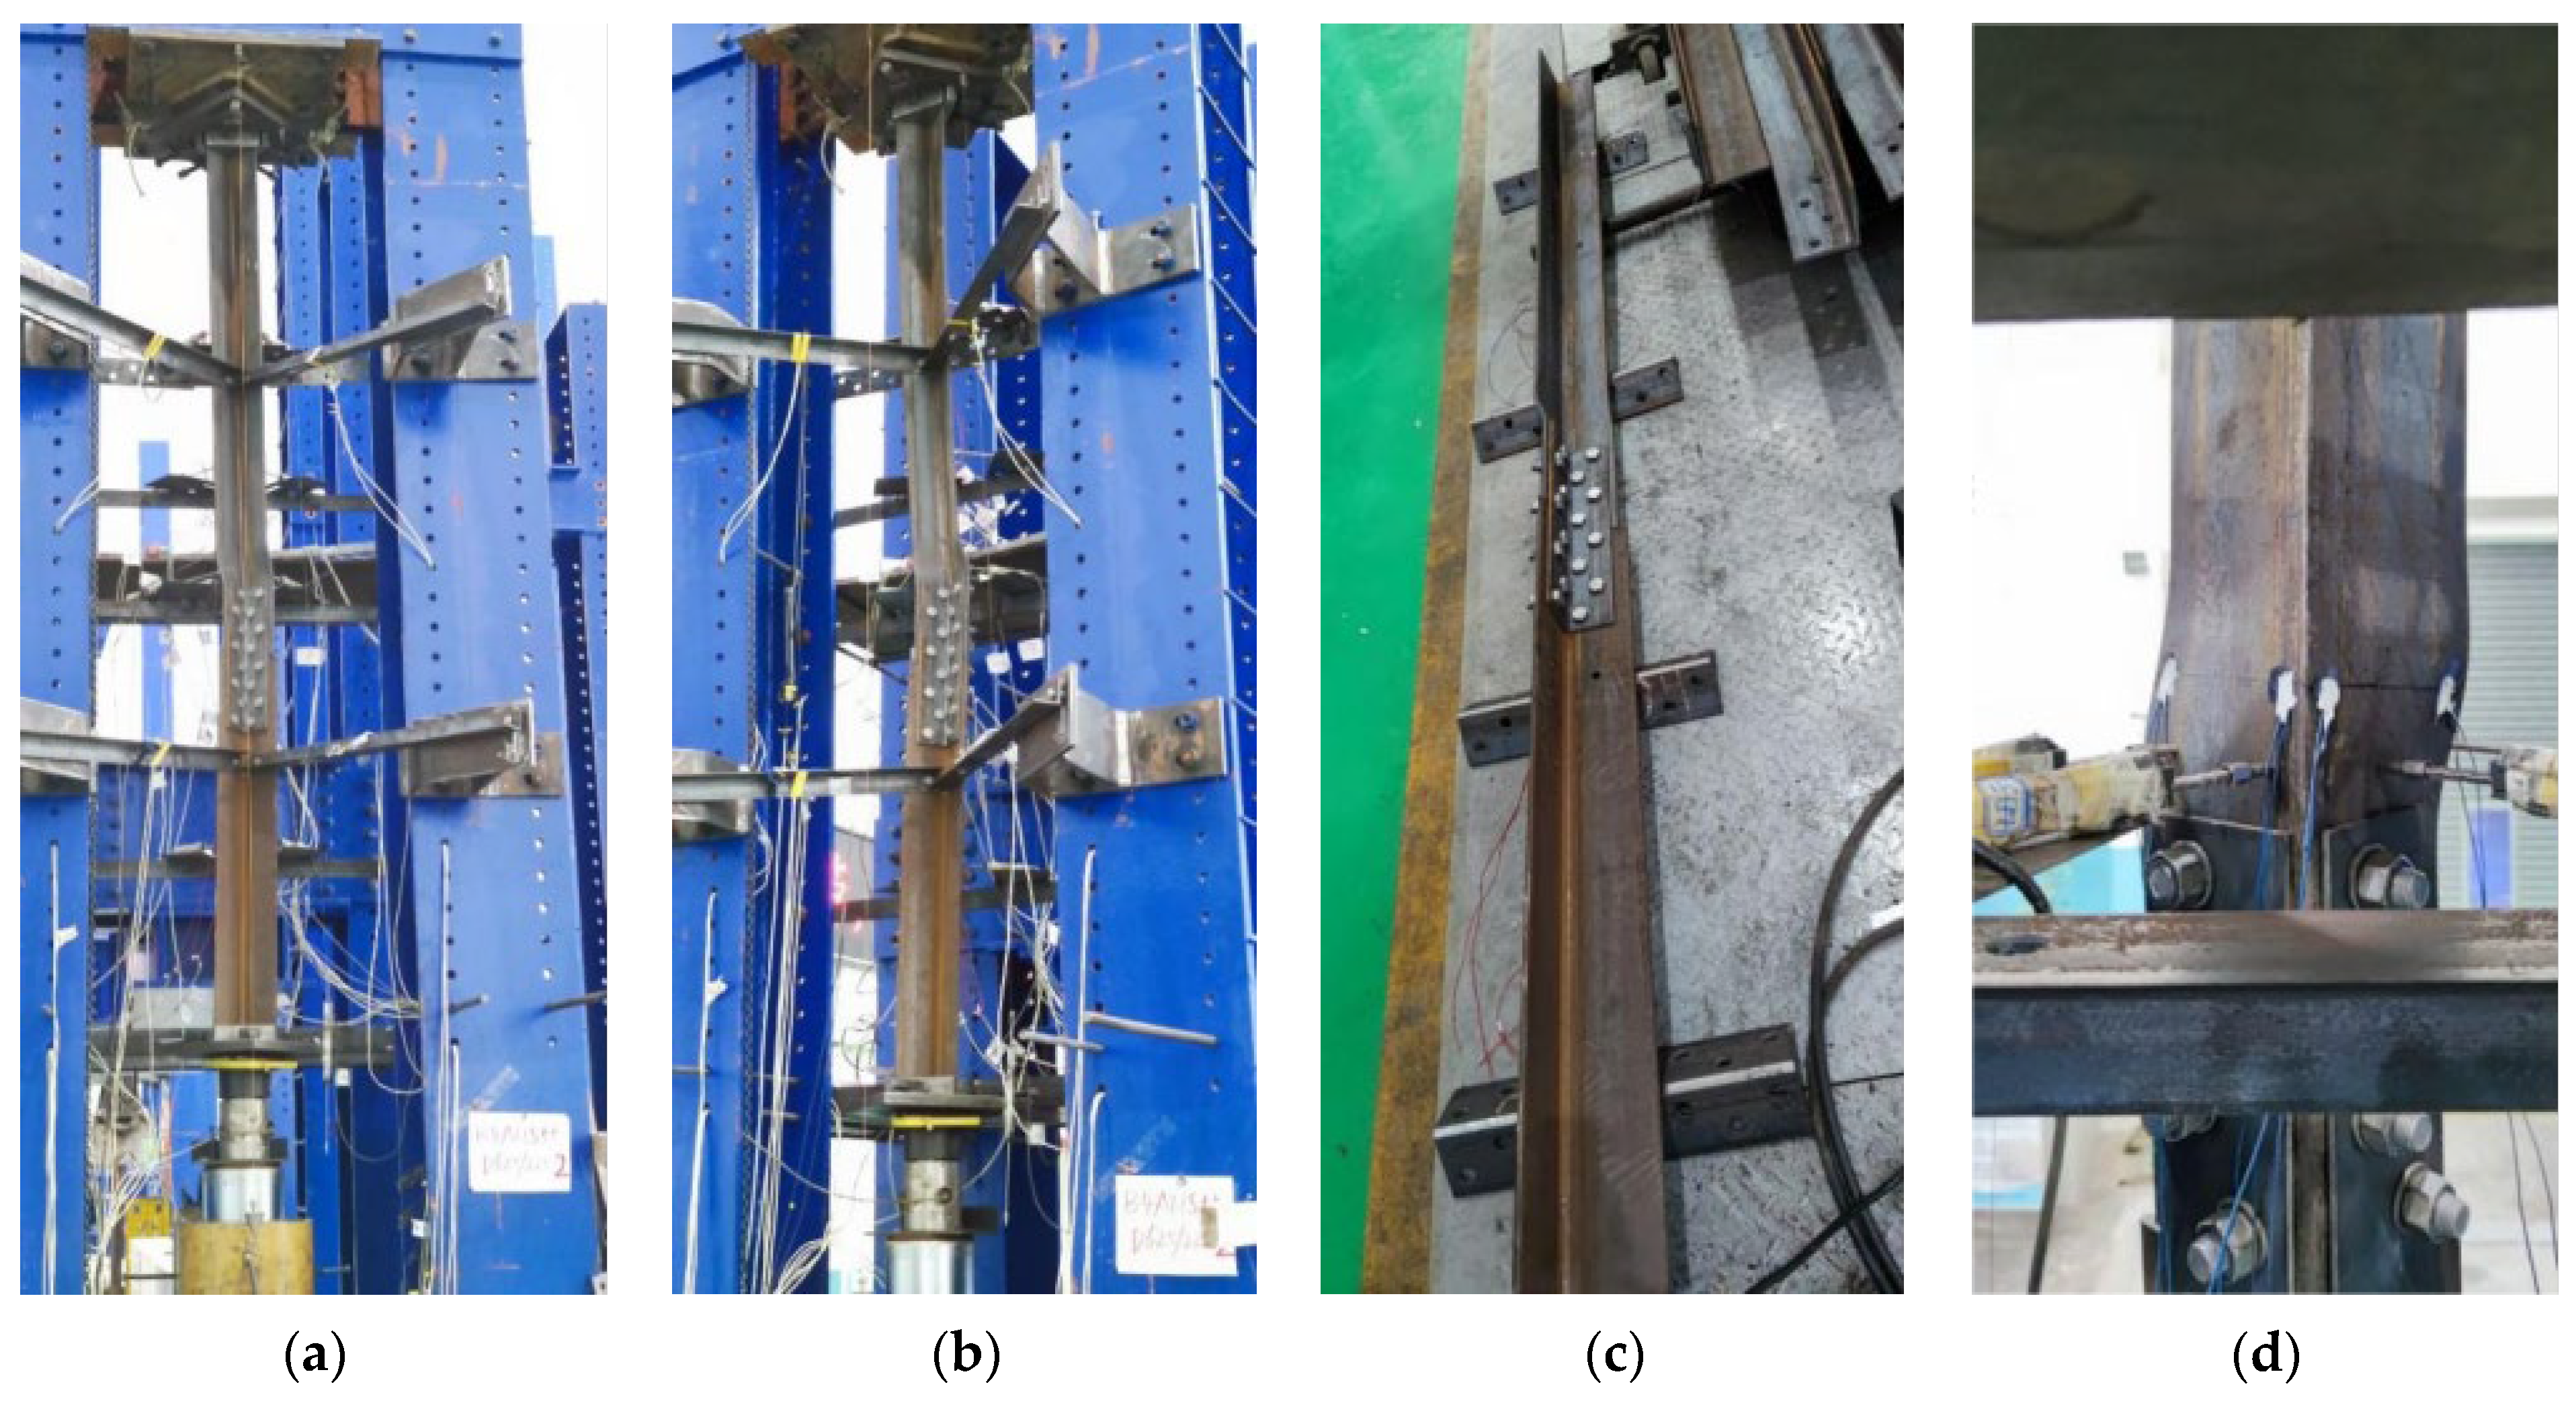
Specimens in group A1.1-S55-D50.0-T225 with different upper and lower angles displayed the same failure mode as the foregoing failure. However, group A1.1-S55-D62.5-T225 demonstrated only flexural–torsional buckling of steel angles, as shown in Figure 11. The specimen exhibited slight torsions prior to the attainment of the ultimate load. When the ultimate load was achieved, abrupt flexural–torsional buckling occurred at the mid-span, triggering a rapid load reduction. This failure originated from the eccentricity between the centroidal axes of the upper and lower steel angles, which induced secondary bending moment under axial compression. Consequently, the mid-span region became the critical region within the segment, and subsequent buckling occurred in the region.

3.3. Load-Deflection Curves

Figure 12 shows the axial load-deflection curve of vertical steel angles. It can be observed that immediately after loading, the two legs of each steel angle developed positive and negative deflections at the mid-height, indicating the twisting of the steel angle. As the load increased, the twisting deformation was restrained by diagonal braces, which prompted lateral deflections in the two legs. For specimen A1.1-S40-D50.0-T225, when the vertical steel angle was loaded to roughly 600 kN, slippage between bolts and the angle resulted in a plateau stage in the curve in which the load remained almost constant, but the lateral deflection continued increasing. When the ultimate load capacity was reached, the deflection of the steel angle entered a relatively stable stage due to overall buckling. Among all specimens, only the steel angle in group A1.1-S55-D62.5-T225 developed flexural deflections in the opposite direction compared to the others. It indicates that A1.1-S55-D62.5-T225 underwent bow-shaped bending deformation about its minor axis, with the smallest difference in the maximum displacement between the two legs. In contrast to A1.1-S55-D62.5-T225, all other specimens showed forward bending about the minor axis, along with significantly larger differences in the maximum displacement between the two legs. After attaining the ultimate load, the curves show a sharp descending stage, except for A1.1-S55-D62.5-T225. Meanwhile, the global buckling load of specimens can be determined as the critical load at the onset of instability in load-deflection curves.

3.4. Load-Strain Curves

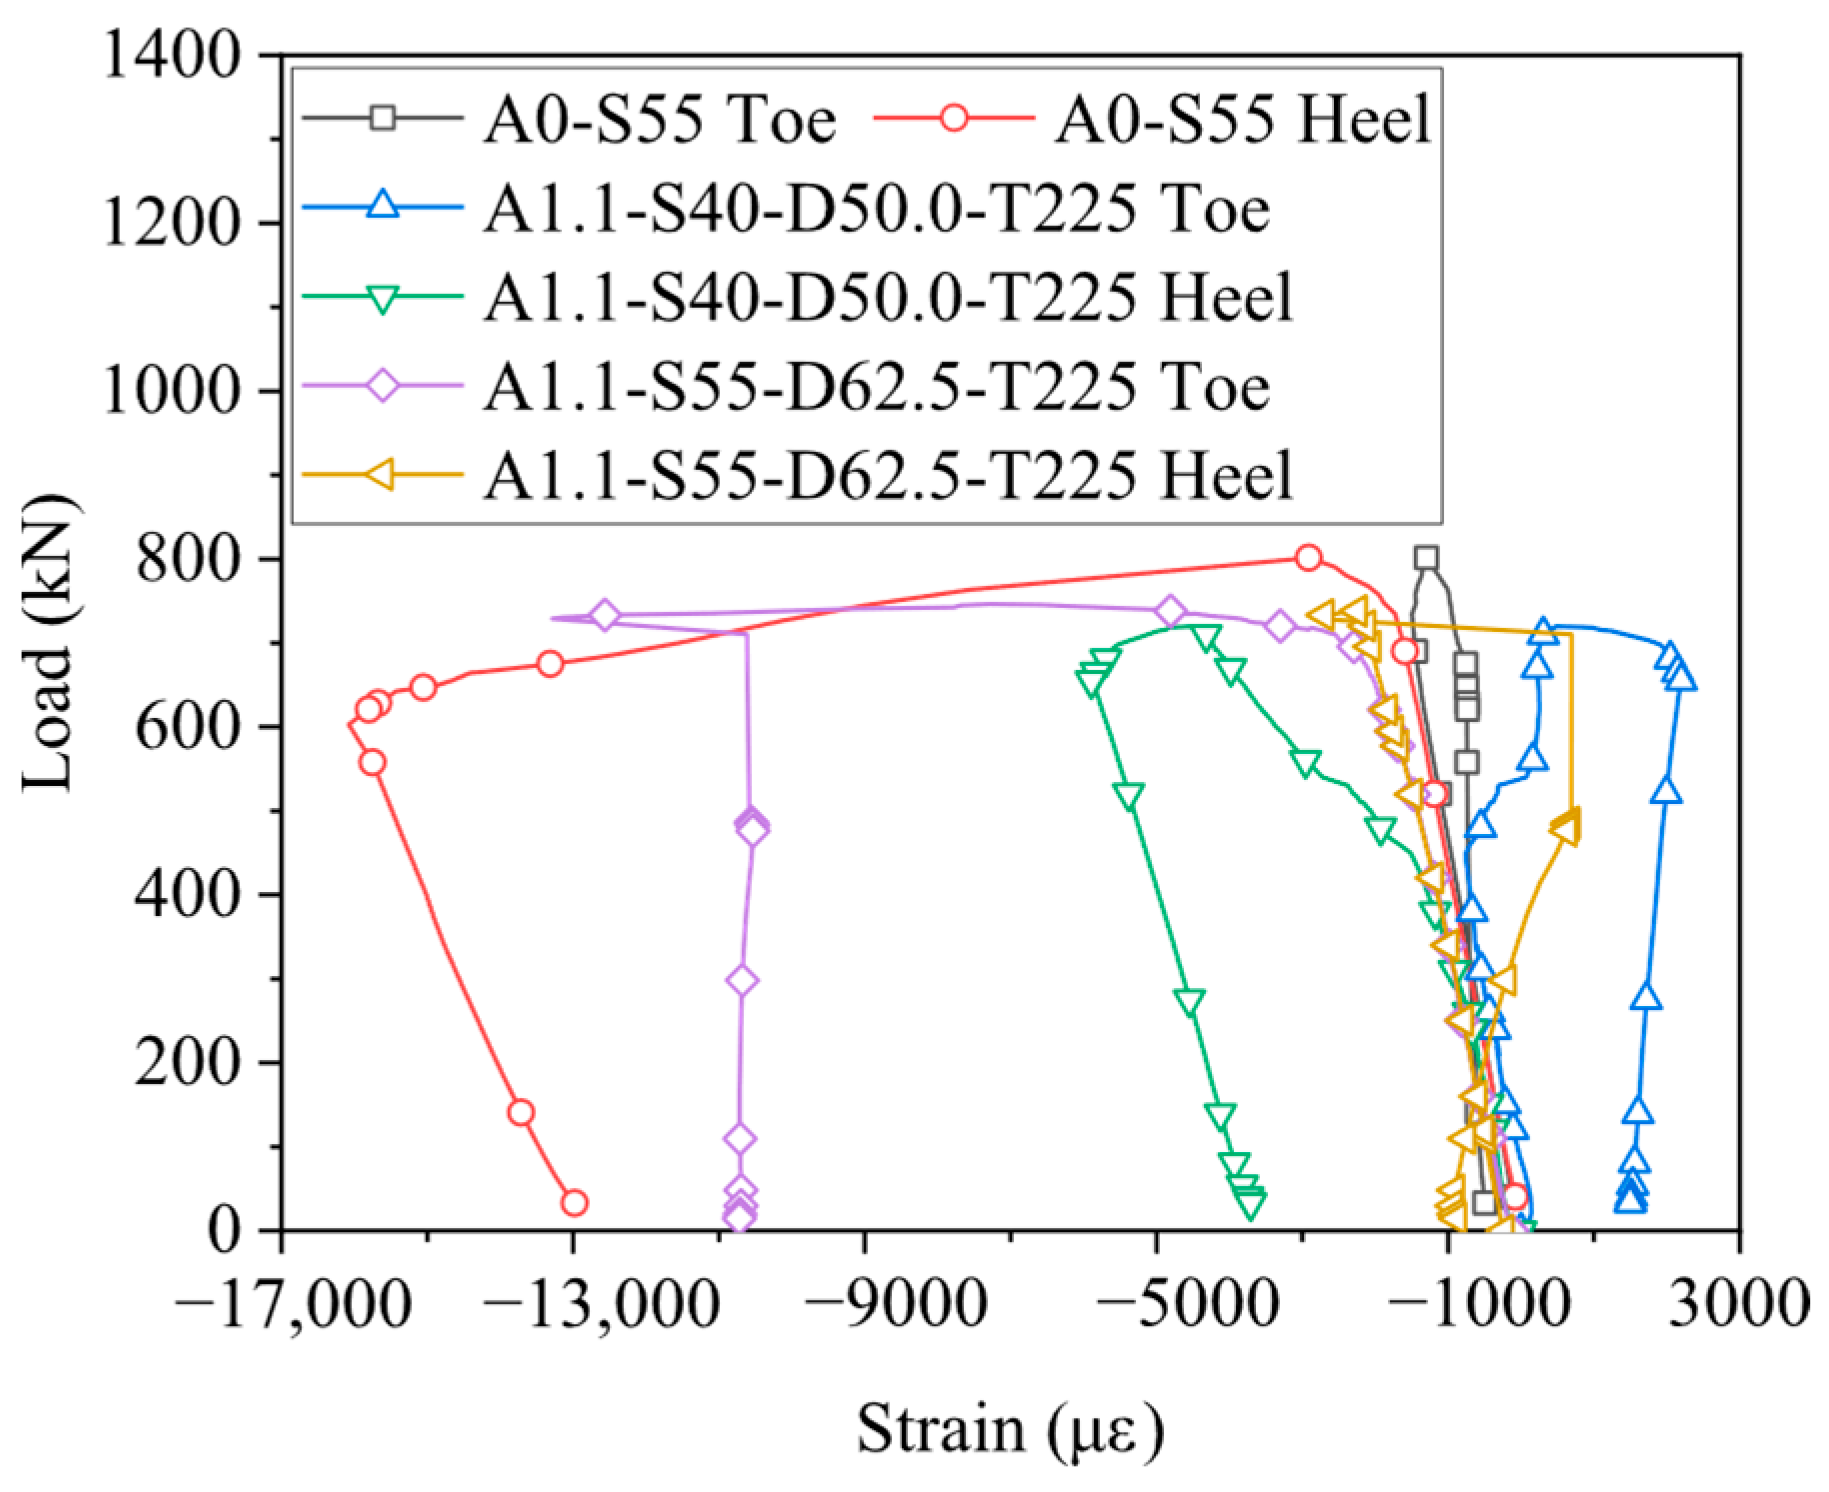
The strain of steel angles was also measured at the mid-height, as shown in Figure 13. It should be pointed out that four strain gauges were mounted at the mid-height, but only two sets of strains at the left leg are plotted in the figure due to the symmetry of measurements. It can be observed that the strain at the toe remained overlapped for the two specimens before overall buckling occurred. Following flexural deformations of the vertical steel angle, the curves exhibited different trends in the positive and negative directions. Following flexural deformations of the vertical steel angle, the curves exhibited different trends in the positive and negative directions, indicating the occurrence of flexural–torsional buckling. Group A1.1-S55-D62.5-T225 demonstrated reversed compressive strain at the toe compared to other specimens. Prior to the attainment of the ultimate load capacity, the toe and heel of the left leg developed compressive strains, likely attributed to eccentric loading induced by misalignment between the spherical hinge and centroidal axis. Group A1.1-S40-D50.0-T225 exhibited significant decreases in the measured strain after the peak value, indicating that localized buckling failure occurred following global buckling.

4. Discussion of Experimental Results

Table 3 presents the ultimate load capacity and failure mode of specimens. In each group, three specimens were tested in compression, and the average load capacity was also calculated. Detailed discussions on the effect of splice steel ratio, slenderness, bolt spacing, and torque for bolting can be found in the subsequent sections.

4.1. Effect of Splice Steel Ratio

Figure 14 compares the load capacities of steel angles with splice steel ratios of 1.1 and 1.3, based on average loads obtained from the specimens listed in Table 3. It can be found that when the bolt spacing was 50.0 mm, specimens with splice steel ratios of 1.1 and 1.3 exhibited average load capacities of 712.9 kN and 720.1 kN, respectively. At a larger bolt spacing of 62.5 mm, specimens with splice steel ratios of 1.1 and 1.3 exhibited average load capacities of 735.9 kN and 742.1 kN, respectively. Thus, the influence of splice ratio on the load capacity was insignificant for the range of splice ratios considered in the present study.

4.2. Effect of Slenderness

Figure 15 shows the average load capacities of specimens with slenderness ratios of 40, 55, and 70. With a bolt spacing of 50.0 mm, specimens with slendernesses of 40 and 70 could develop average load capacities of 712.9 kN and 606.7 kN, respectively. It demonstrates that an increase in the slenderness ratio significantly reduced the load capacity of steel angles in compression due to the local buckling of steel angles with larger slenderness ratios, caused by critical stress reduction and diminished geometric stiffness. A similar result could be obtained when the bolt spacing increased to 62.5 mm. When the slenderness of specimens increased from 40 to 70, the ultimate load was reduced by 14.3%. Specimen A1.1-S55-D50.0-T225 developed a load capacity of 726.5 kN, representing a marginal 1.9% increase compared to A1.1-S40-D50.0-T225. This behavior primarily results from the combined effects of increased slenderness ratio and the enlarged cross-sections of the lower angle, suggesting that the beneficial effect of larger lower-section steel angles partially offsets the adverse impact of increased slenderness, but still lower than that of A0-S55 at 796.1 kN. An increase in the bolt spacing to 62.5 mm only led to a 0.4% increase in the load capacity when comparisons were made between A1.1-S40-D62.5-T225 and A1.1-S55-D62.5-T225. It indicates that the increased bolt spacing diminished the beneficial effect of steel angles with larger lower sections when slenderness increased from 40 to 55.

4.3. Effect of Bolt Spacing

Figure 16 presents the effect of bolt spacing on the load capacity of specimens in compression. It can be observed that specimens A1.1-S55-D50.0-T225 and A1.1-S55-D62.5-T225 developed a marginal 1.6% increase in the load capacity from 726.5 kN to 738.1 kN as the bolt spacing increased from 50.0 mm to 62.5 mm. The three remaining groups of specimens showed greater increases of 3.1%, 3.1%, and 3.9%, respectively, in the load capacity with the bolt spacing varying from 50.0 mm to 62.5 mm. This comparative analysis reveals that increasing the bolt spacing could improve the load capacity in specimens with the same upper and lower angles more effectively than specimens with different upper and lower angles. The increased bolt spacing extended the lever arms of specimens and the length of the splice steel, thereby improving the stiffness and reducing the mid-span deformations.

4.4. Effect of Torque for Bolting

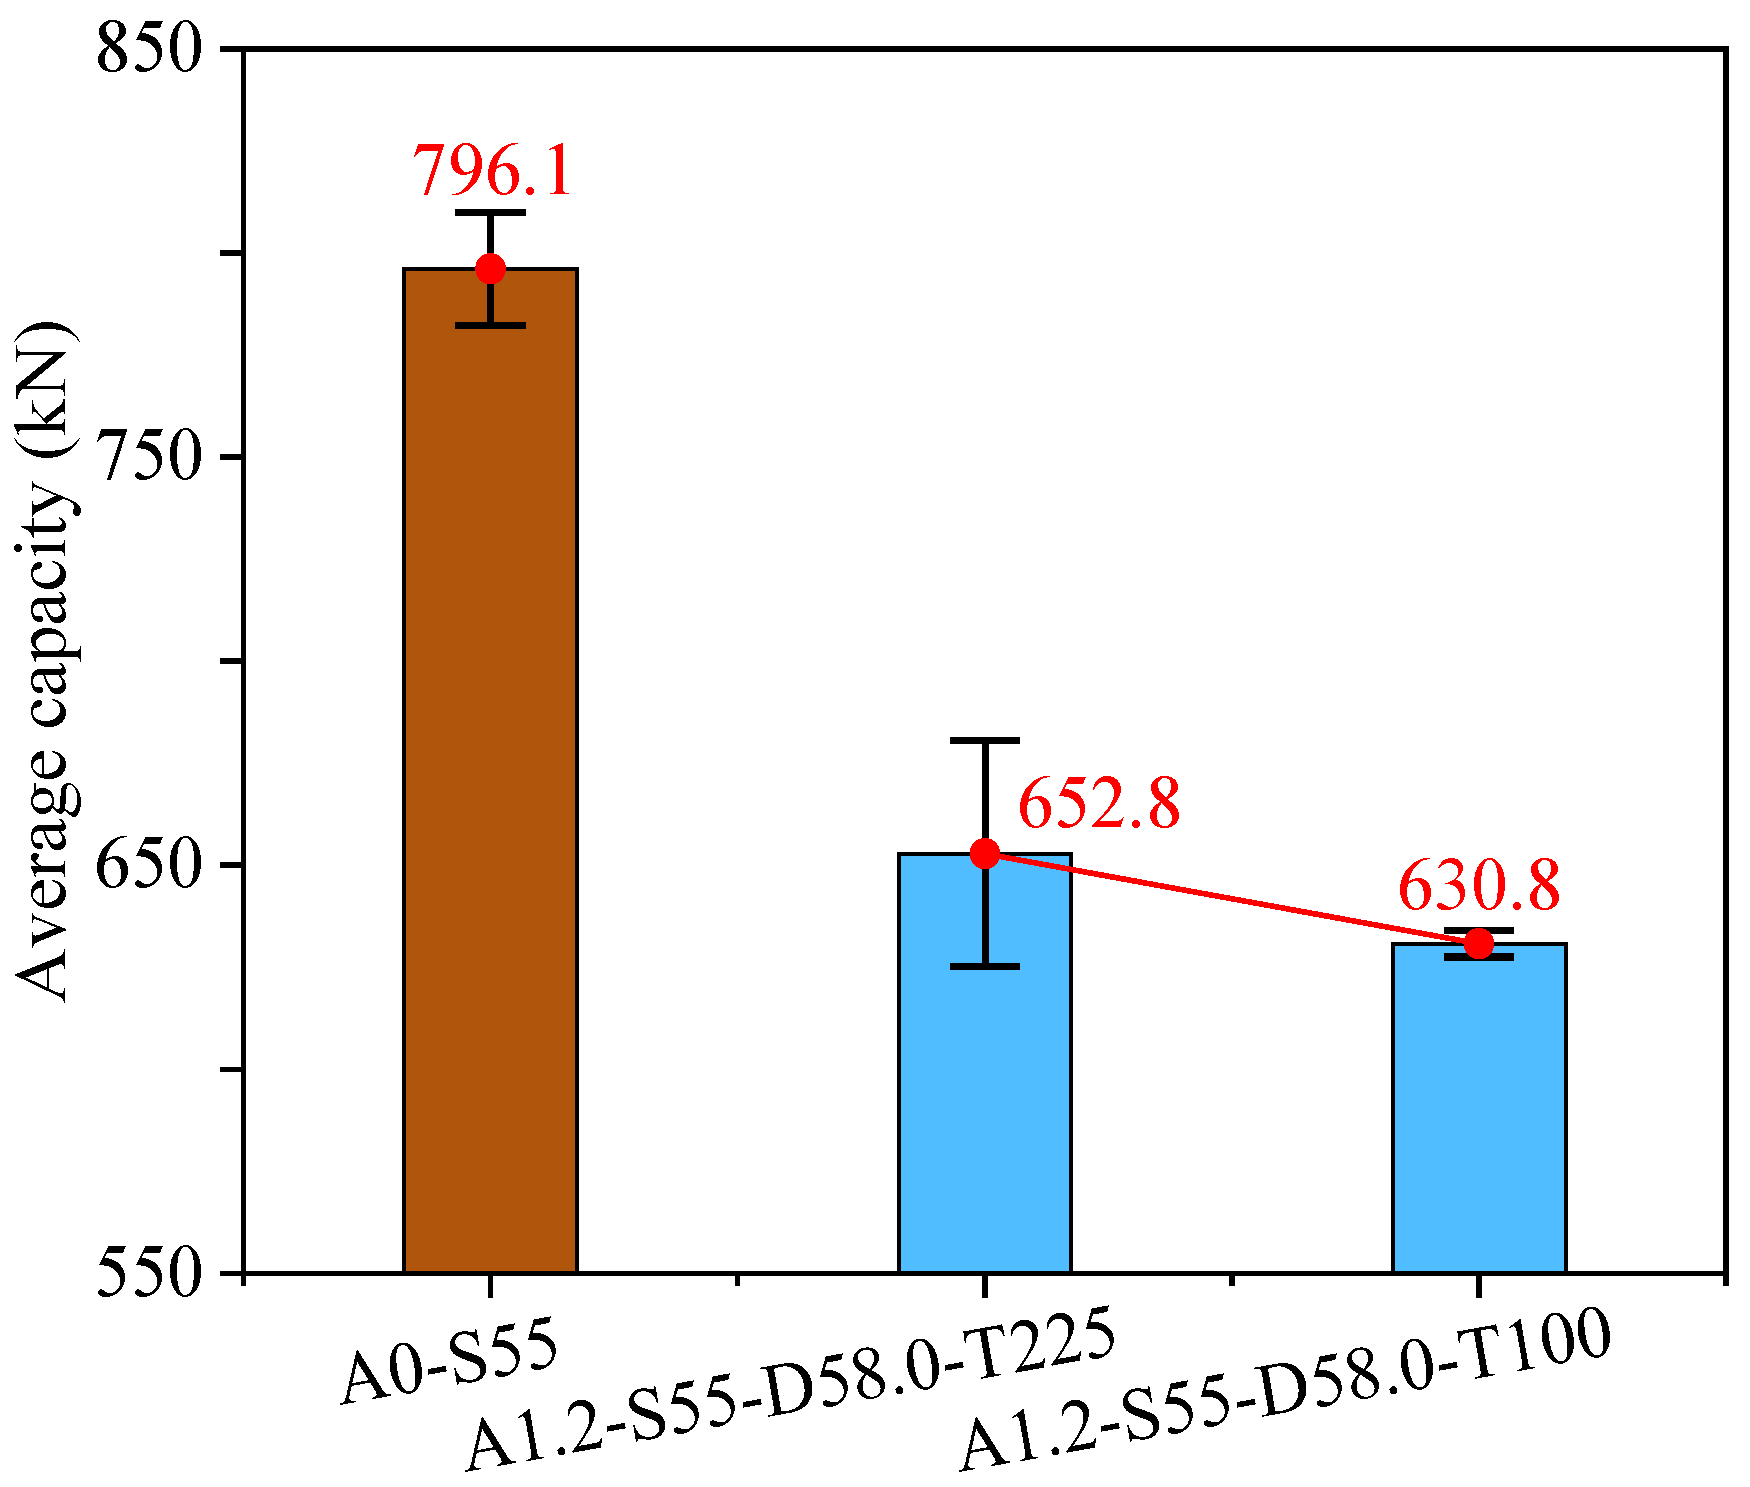
Figure 17 compares A1.2-S55-D58.0-T225 and A1.2-S55-D58.0-T100 to evaluate the effects of bolting torque on specimens with the same upper and lower angles. It can be observed that the average capacities of the two groups of specimens were 652.8 kN and 630.8 kN, respectively. It indicates that reducing the bolting torque from 225 N·m to 100 N·m resulted in a 3.4% decrease in the load capacity when the splice steel ratio was 1.2, the slenderness was 55, and the bolt spacing was 58.0 mm. This reduction was likely attributed to the reduced friction caused by insufficient bolt pretension or the slippage during loading. According to Eurocode, bolt torque in shear connections does not affect the ultimate load capacity of steel angles. However, Yang et al. demonstrated that initial torque can influence the load at which slip occurs in bolt connections [24]; thus, the effect of bolt torque on load capacity should be further verified for double-shear splice connections.

5. Design Equations for Steel Angles in Compression

5.1. Calculation Methods in Chinese Design Codes

In this section, Chinese design codes GB 50017-2017 [38] and DL/T 5154-2012 [39] are adopted to assess the ultimate load capacity of spliced steel angles in compression.
(1) GB 50017-2017
The stability of axially compressed steel angles can be evaluated using Equation (1) in GB 50017-2017.
N / ( φ A f ) 1.0
where N is the design axial compressive load, φ is the buckling coefficient, and can be calculated using the slenderness λ of steel angles, A is the gross cross-sectional area of steel angles, f is the design strength of steel angles.
For the lattice tower analyzed in the present study, the slenderness of steel angles depends on the bracing system, namely full overlap, partial overlap, and non-overlap. Equations provided in Table 4 below are applied to determine the corresponding buckling coefficients φ .
λ = l / i y
λ = 1.1 l / i u
λ = 1.2 l / i u
In Table 4, i y is the radius of gyration about the asymmetric principal axis of the section, l and i u denote the longer bay length and the radius of gyration about its parallel axis, respectively.
(2) DL/T 5154-2012
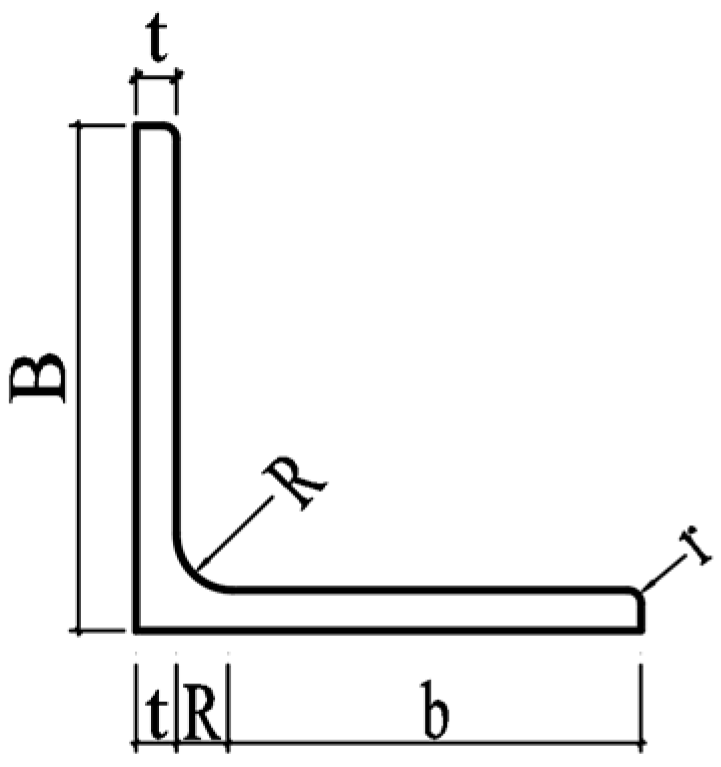
In the design equation incorporated in DL/T 5154-2012, a strength reduction factor m N is considered in addition to the slenderness, as expressed in Equation (5). The value of m N depends on the width-to-thickness ratio of the angle section, as can be calculated from Equations (6) and (7). ( b / t ) lim for axially compressed steel angles can be obtained from Equation (8). The symbols of steel angles are shown in Figure 18.
N / ( φ A ) m N f
m N = 1.0   for   b / t ( b / t ) lim
m N = 1.677 0.677 ( b / t ) / ( b / t ) lim   for   ( b / t ) lim < b / t 380 / f y
( b / t ) lim = ( 10 + 0.1 λ ) 235 / f y
where m N denotes the strength reduction factor for the stability of compressive steel angles. f y is the yield strength of steel angles. Please note that in the calculation, the slenderness of steel angles should be within the range of 30 and 100.
For equal-leg angles, the effective length of main steel angles is determined from the connection pattern on the two legs and can be categorized into two cases, namely full overlap and non-overlap in DL/T 5154-2012, which are calculated in accordance with GB 50017-2017, respectively.

5.2. Comparison of Theoretical and Experimental Results

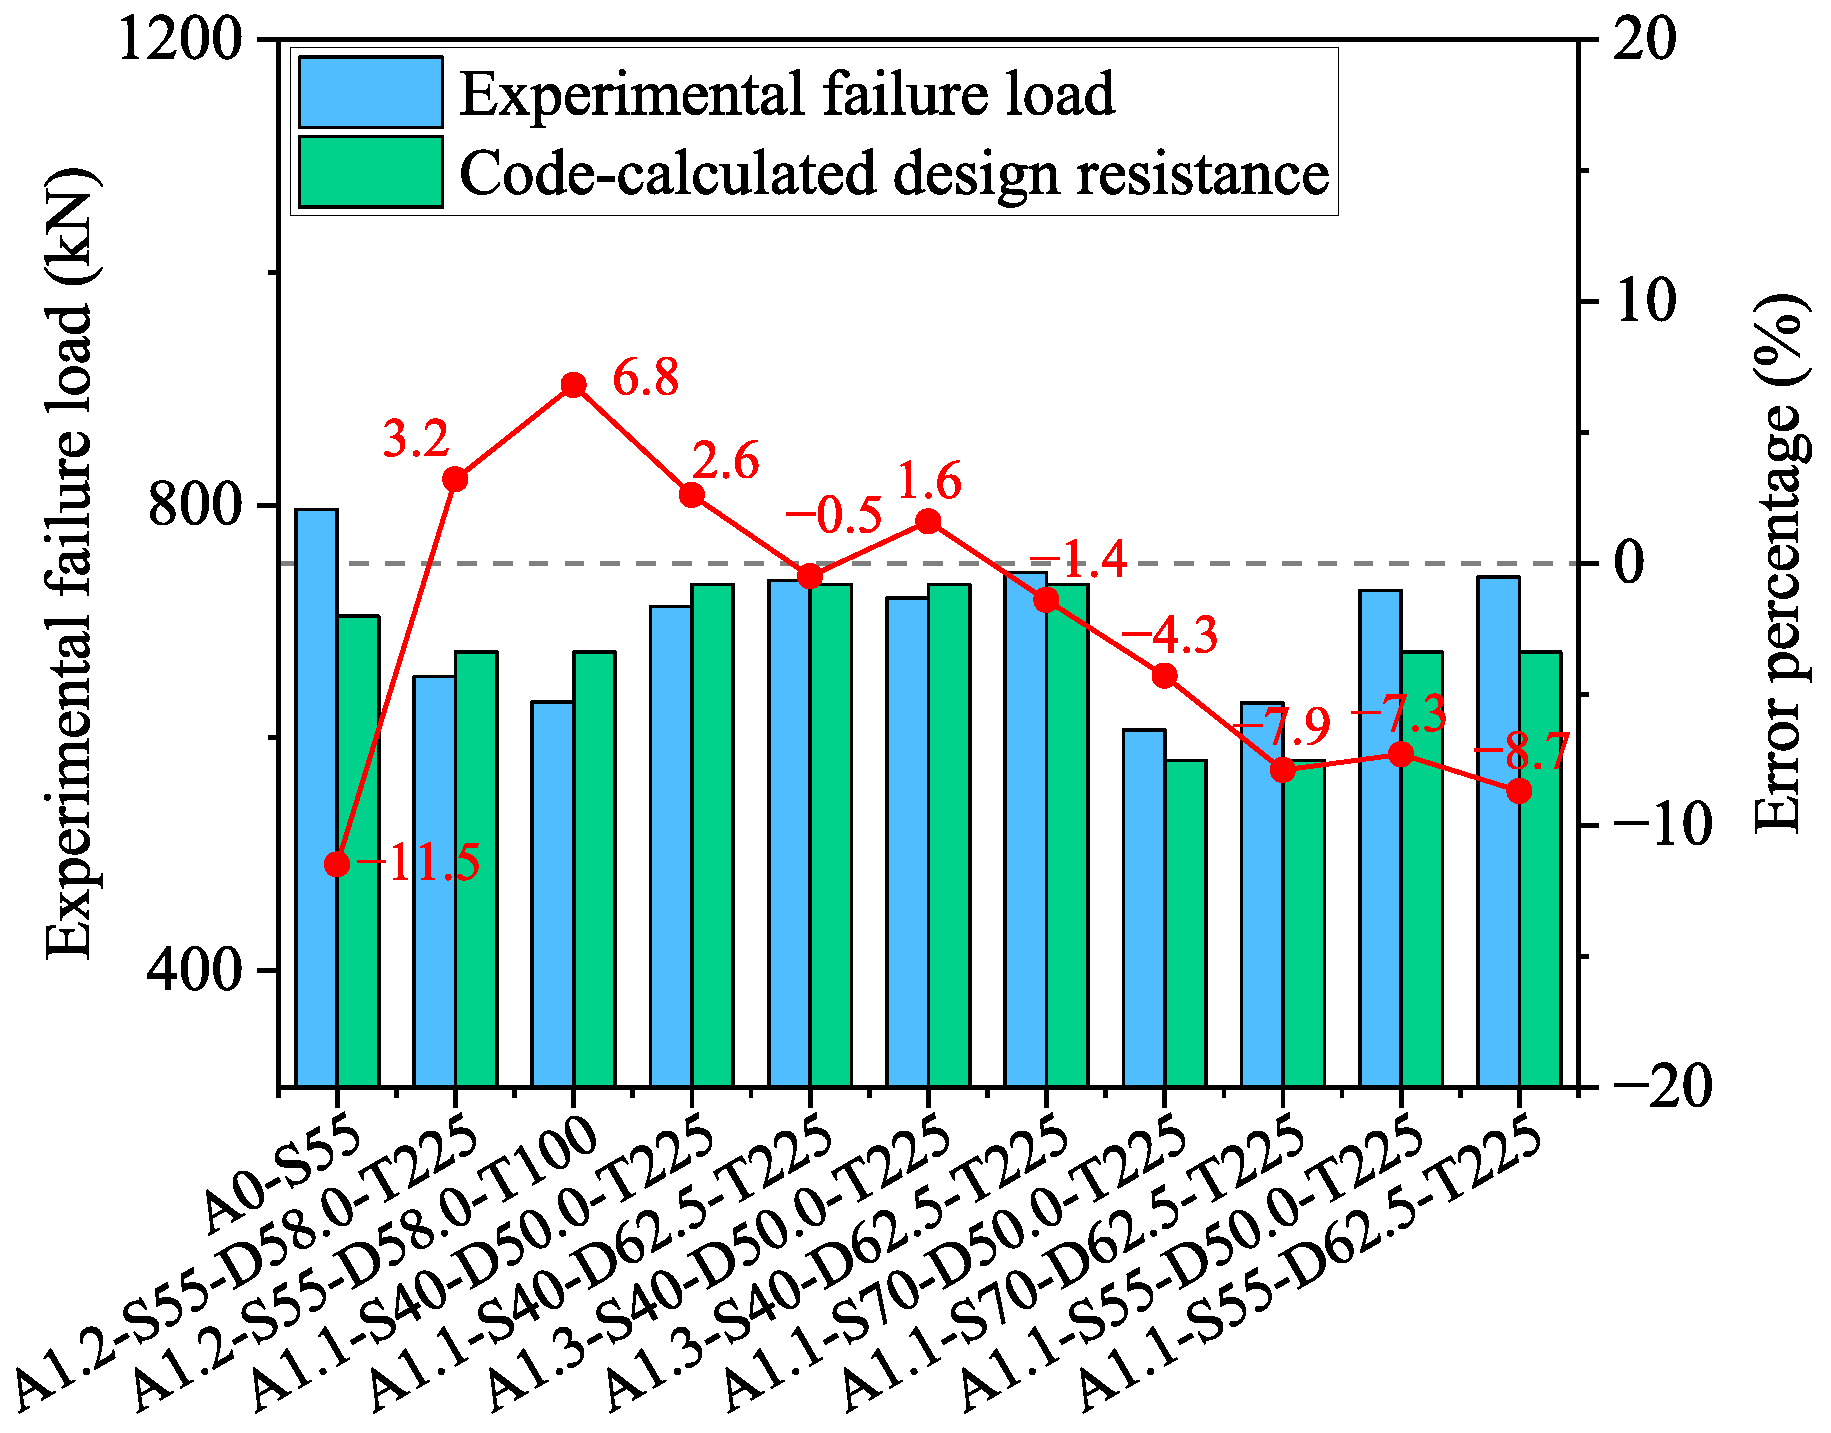
Table 5 shows the comparison of experimental results and calculated values obtained using the aforementioned methods. N 1 denotes the ultimate load calculated from GB50017-2017 and DL/T 5154-2012. In this present experimental test, the effect of adjacent diagonal bracing on main steel angles was considered, corresponding to the case specified in design codes where all connections of diagonal members were located at the same section. Therefore, GB50017-2017 and DL/T 5154-2012 adopt the same effective length. DL/T 5154-2012 incorporates additional considerations for the width-to-thickness ratio b / t of steel angles compared to GB50017-2017 by introducing the strength reduction factor m N .
In the calculations, the average mechanical properties of steel angles are used, and pinned supports are assumed at the end. Even though some specimens experienced buckling of diagonal bracings near the connection, which might have increased the ultimate load capacity of steel angles, this phenomenon is neglected in the calculation, and the focus is only placed on the middle steel segment, representing the more critical region for engineering applications. It can be observed from the table that the experimental ultimate load capacities of specimens with the same upper and lower sections and slendernesses of 40 and 55 were slightly lower than the calculated values. The design method can estimate the safety margin of intact steel angles more than 10%, but when discontinuous steel angles were used in the test, the accuracy of the design method becomes poor, with the error percentage ranging from −8.7% to 6.8%. It should be noted that the error percentage increased when the slenderness of specimens increased to 70 from 40, but the safety margins were improved, respectively. However, specimens with different upper and lower angles exhibit significantly larger deviations than those with the same upper and lower angles due to the enlarged safety margin, as shown in Figure 19. Therefore, it can be concluded that the double-shear splice connection in specimens significantly reduced the ultimate load capacity of the specimens. The prevailing design methods for compressive steel angles exhibit insufficient accuracy in calculating the axial compression capacity of discontinuous steel angles and cannot ensure the safety margin, especially for the specimens with the same upper and lower sections and slendernesses of 40 and 55, as the stiffness of the specimen might be reduced due to the presence of the connection. Therefore, it is necessary to modify the design method for the axial compression capacity of steel angles with double-shear splice connections.

6. Conclusions

In this study, 10 groups of spliced equal-leg angles with double-shear splice connections were tested in axial compression. The ultimate load capacity and failure modes were determined for spliced angles. The influences of splice steel ratio, slenderness, bolt spacing, and bolt torque on load capacity were quantitatively evaluated. Experimental results were compared with calculated values per Chinese design codes. The following conclusions are drawn from the experimental study.
  • The failure mode of the intact steel angle was flexural buckling under axial compression. For steel angles with double-shear splice connections, specimens with the same upper and lower sections of L125 × 10 exhibited flexural–torsional buckling and buckling of diagonal bracing at the connection. For steel angles with different upper and lower sections of L125 × 10 and L140 × 10, specimen A1.1-S55-D50.0-T225 exhibited the same failure mode as those with the same upper and lower angles, but specimen A1.1-S55-D62.5-T225 failed in flexural–torsional buckling.
  • The load-deformation curves exhibited similar trends for specimens with different design parameters. Compared to intact specimens, spliced steel angles demonstrated a sudden increase in the axial deformation during initial loading due to the occurrence of bolt slippage at the connection. The load capacity of spliced steel angles was substantially lower than that of the intact specimens.
  • Increasing the splice steel ratios from 1.1 to 1.3 showed a negligible effect on the load capacity of spliced steel angles. An increase in the slenderness from 40 to 70 significantly reduced the compressive load capacity. By increasing the bolt spacing, the ultimate load of steel angles increased, but the beneficial effect of a large bolt spacing decreases with increasing slenderness. Reducing the bolting torque from 225 N·m to 100 N·m had a minimal influence on load capacity.
  • Experimental load capacities were compared with the calculated results using the design method for compressive steel angles in GB50017-2017 and DL/T 5154-2012. Comparisons between experimental and calculated load capacities revealed that the calculated value overestimates the ultimate load capacity of spliced angles in compression, indicating the need for revision of current design provisions.

Author Contributions

Conceptualization, C.X., L.-Y.P., G.-S.Z. and H.-Y.M.; methodology, C.X.; investigation, S.-B.K., H.-Y.M., D.-G.H. and S.-Y.H.; data curation, S.-B.K. and G.-S.Z.; writing—original draft, C.X. and L.-Y.P.; writing—review and editing, S.-B.K., D.-G.H. and S.-Y.H. All authors have read and agreed to the published version of the manuscript.

Funding

This research received no external funding.

Institutional Review Board Statement

Not applicable.

Informed Consent Statement

Not applicable.

Data Availability Statement

The original contributions presented in this study are included in the article. Further inquiries can be directed to the corresponding author.

Conflicts of Interest

Authors Cheng Xu, Lu-Yao Pei, and Gen-Sheng Zeng are employed by Energy Development Research Institute, China Southern Power Grid. Authors Hai-Yun Ma, Da-Gang Han, Song-Yang He are employed by Southwest Electric Power Design Institute Co., Ltd., China Power Engineering and Consulting Group. The remaining authors declare that the research was conducted in the absence of any commercial or financial relationships that could be construed as a potential conflict of interest. The authors declare that they have no known competing financial interests or personal relationships that could have appeared to influence the work reported in this paper.

References

  1. Xie, Q.; Zhang, J. Experimental study on failure modes and retrofitting method of latticed transmission tower. Eng. Struct. 2021, 226, 111365. [Google Scholar] [CrossRef]
  2. Qiu, F.; Qiu, J.X.; Feng, H.; Wang, H.J.; Qian, H.L.; Jin, X.F.; Wang, K.Y.; Fan, F. Calculation method of stability bearing capacity of transmission tower angle steel considering semi-rigid constraint. Curved Layer. Struct. 2022, 9, 202–211. [Google Scholar] [CrossRef]
  3. Kettler, M.; Taras, A.; Unterweger, H. Member capacity of bolted steel angles in compression—Influence of realistic end supports. J. Constr. Steel Res. 2017, 130, 22–35. [Google Scholar] [CrossRef]
  4. Xu, J.J.; He, S.Y.; Cao, X.J.; Lu, Y.; Liu, X.Y.; Yan, X.Q. Analytical and numerical analysis of angle steel joints for conductors in lattice transmission towers. Case Stud. Constr. Mater. 2022, 17, e01592. [Google Scholar] [CrossRef]
  5. Qian, Y.; Huang, C.; Han, B.; Cheng, F.; Qiu, S.; Deng, H.; Duan, X.; Zheng, H.; Liu, Z.; Wu, J. Quantitative analysis of bolt loosening angle based on deep learning. Buildings 2024, 14, 163. [Google Scholar] [CrossRef]
  6. Zhang, Y.; Liu, H.J.; Yang, H.L.; Huang, X.; Zhu, L.; Guo, Y. Stability bearing capacity of equal-leg angle steel columns with end connection joints. J. Constr. Steel Res. 2024, 216, 108606. [Google Scholar] [CrossRef]
  7. Filipović, A.; Dobrić, J.; Baddoo, N.; Može, P. Experimental response of hot-rolled stainless steel angle columns. Thin Walled Struct. 2021, 163, 107659. [Google Scholar] [CrossRef]
  8. Huang, Z.L.; Liu, H.J.; Liu, H.Y.; Li, Z.L. Experimental study on stability behavior of equal-leg angle steel columns. Thin Walled Struct. 2021, 166, 108042. [Google Scholar] [CrossRef]
  9. Qu, S.; Guo, Y.; Sun, Q. Resistances of high-strength steel equal-leg-angle section columns eccentrically connected by one leg. J. Constr. Steel Res. 2022, 191, 107143. [Google Scholar] [CrossRef]
  10. Xu, Z.; Tong, G.; Zhang, L.; Guo, Y. Testing, modelling and design of aluminium alloy single-angle members connected by one leg under eccentric compression. Thin Walled Struct. 2023, 184, 110474. [Google Scholar] [CrossRef]
  11. Huang, X.; He, S.Y.; Liu, X.Y.; Han, D.G.; Pu, F.; Yan, H.Q.; Kang, S.B. Compression behaviour of Q355 steel equal-leg angles with simulated local defects at the mid-height. J. Constr. Steel Res. 2024, 217, 108673. [Google Scholar] [CrossRef]
  12. Tan, X.Z.; Song, Z.Y.; Jin, Y.; Zhang, X.; Zhao, J. Analysis of stability capacity of locally corroded single angle members under axial compression. J. Shandong Electr. Power Coll. 2022, 25, 13–19. [Google Scholar]
  13. Shi, G.; Liu, Z.; Ban, H.Y.; Zhang, Y.; Shi, Y.J.; Wang, Y.Q. Tests and finite element analysis on the local buckling of 420 MPa steel equal angle columns under axial compression. Steel Compos. Struct. 2012, 12, 31–51. [Google Scholar] [CrossRef]
  14. Shi, G.; Liu, Z.; Zhang, Y.; Shi, Y.J.; Wang, Y.Q. Study on the local buckling behavior of steel equal angle members under axial compression with the steel strength variation. In Sustainable Development of Urban Environment and Building Material, Pts 1–4; Li, H., Liu, Y.F., Guo, M., Zhang, R., Du, J., Eds.; Trans Tech Publications Ltd.: Durnten-Zurich, Switzerland, 2012; pp. 2430–2436. [Google Scholar]
  15. Shi, G.; Zhou, W.J.; Bai, Y.; Liu, Z. Local buckling of steel equal angle members with normal and high strengths. Int. J. Steel Struct. 2014, 14, 447–455. [Google Scholar] [CrossRef]
  16. Gusella, F.; Orlando, M.; Peterman, K. Stiffness and resistance of brace-to-upright joints with lipped channel braces assembled flange-to-flange. J. Constr. Steel Res. 2022, 193, 107258. [Google Scholar] [CrossRef]
  17. Roure, F.; Peköz, T.; Somalo, M.R.; Bonada, J.; Pastor, M.M.; Segura, A. Cross-aisle stiffness analysis of industrial welded cold-formed steel rack upright frames. Thin Walled Struct. 2019, 141, 332–344. [Google Scholar] [CrossRef]
  18. Yao, Y.F.; Huang, H.; Zhang, W.; Ye, Y.X.; Xin, L.; Liu, Y. Seismic performance of steel-PEC spliced frame beam. J. Constr. Steel Res. 2022, 197, 107456. [Google Scholar] [CrossRef]
  19. Yao, Y.F.; Zhou, L.Q.; Huang, H.; Chen, Z.; Ye, Y.X. Cyclic performance of novel composite beam-to-column connections with reduced beam section fuse elements. Structures 2023, 50, 842–858. [Google Scholar] [CrossRef]
  20. Mengelkoch, N.S.; Yura, J.A. Single-angle compression members loaded through one leg. In Proceedings of the Annual Stability Conference, Structural Stability Research Council, Seattle, WA, USA, 24–27 April 2002; pp. 201–218. [Google Scholar]
  21. Hu, F.F.; Gao, C.Z.; Jiang, W.Q.; Liu, S.X.; An, L.Q.; Gao, J.; Du, H.Y. Research on semi-rigid of bolted joint in main member of transmission tower. Steel Constr. (Chin. Engl.) 2018, 33, 83–87. [Google Scholar]
  22. Jiang, W.Q.; Wang, Z.Q.; McClure, G.; Wang, G.L.; Geng, J.D. Accurate modeling of joint effects in lattice transmission towers. Eng. Struct. 2011, 33, 1817–1827. [Google Scholar] [CrossRef]
  23. Gan, Y.D.; Deng, H.Z.; Li, C. Simplified joint-slippage model of bolted joint in lattice transmission tower. Structures 2021, 32, 1192–1206. [Google Scholar] [CrossRef]
  24. Yang, F.L.; Zhu, B.R.; Xing, H.J. The slip characteristics and parametric study of bolted connections for transmission towers. Eng. Mech. 2017, 34, 116–127. [Google Scholar]
  25. He, S.Y.; Ma, H.Y.; Yan, X.Q.; Jiang, R.; Xiao, Y.H. Study on uneven shear of double-clad shear connection joint bolts of transmission tower. J. Wuhan Univ. Technol. 2021, 43, 49–57. [Google Scholar]
  26. Taha, A.M.; Dabaon, M.A.; El-Boghdadi, M.H.; Hassanein, M.F. Experimental testing and evaluation of real-scale lap-splice bolted connections used in typical lattice steel transmission towers. Thin Walled Struct. 2022, 171, 108790. [Google Scholar] [CrossRef]
  27. Eom, T.S.; Yang, J.M.; Kim, D.K.; Lim, J.J.; Lee, S.H. Experimental investigation of bolted end-plate angle splice in encased composite columns. Eng. Struct. 2019, 190, 31–40. [Google Scholar] [CrossRef]
  28. Eom, T.S.; Cho, S.R.; Lim, J.J. Behavior of end plate connection for steel angles. Eng. Struct. 2022, 252, 113714. [Google Scholar] [CrossRef]
  29. Jiang, W.Q. Accurate Modeling of Structural Joint and Its Application in Lattice Transmission Tower Analysis. Ph.D. Thesis, North China Electric Power University, Beijing, China, 2011. [Google Scholar]
  30. Jiang, W.Q.; Chen, X.Y.; Liu, J.L.; Niu, Z.B.; Feng, L.Y.; An, L.Q. Study on bearing capacity of transmission tower main leg with bolted joints. Chin. J. Constr. Mach. 2021, 19, 471–476. [Google Scholar]
  31. Xue, S.D.; Wang, L.S.; Li, X.Y.; Zhou, Y. Finite element analysis of axial pressure stability bearing capacity of angle steel such as transmission tower. Build. Struct. 2023, 53, 1431–1435. [Google Scholar]
  32. Gao, F. Research on the Stability Capacity of the Equal Angle Steel Main Member in Transmission Tower Considering Middle Disconnected Joint. Master’s Thesis, Chongqing University, Chongqing, China, 2021. [Google Scholar]
  33. Qu, K.M. Experimental and Numerical Study on the Stability Capacity of Angle Column Connection Joints in Transmission Towers. Master’s Thesis, Chongqing University, Chongqing, China, 2021. [Google Scholar]
  34. DL/T 5486-2020; Technical Specification for the Design of Steel Supporting Structures of Overhead Transmission Line. National Energy Administration: Beijing, China, 2020.
  35. Li, J.; He, S.Y.; Li, Z.L.; Wang, R.; Pu, S.T.; Huang, X.; Yan, X.Q. Experimental Study on Axial Compression Behavior of Angle Steel Main Members with Double-Shear Splicing Joints. Prog. Steel Build. Struct. 2025, 27, 48–56. [Google Scholar]
  36. GB/T 2975-2018; Steel and Steel Products. Location and Preparation of Samples and Test Pieces for Mechanical Testing. Standardization Administration of China: Beijing, China, 2018.
  37. GB/T 228.1-2021; Metallic Materials. Tensile Testing. Part 1: Method of Test at Room Temperature. Standardization Administration of China: Beijing, China, 2021.
  38. GB 50017-2017; Standard for Design of Steel Structures. Standardization Administration of China: Beijing, China, 2017.
  39. DL/T 5154-2012; Technical Regulation of Design for Tower and Pole Structures of Overhead Transmission Line. National Energy Administration: Beijing, China, 2012.
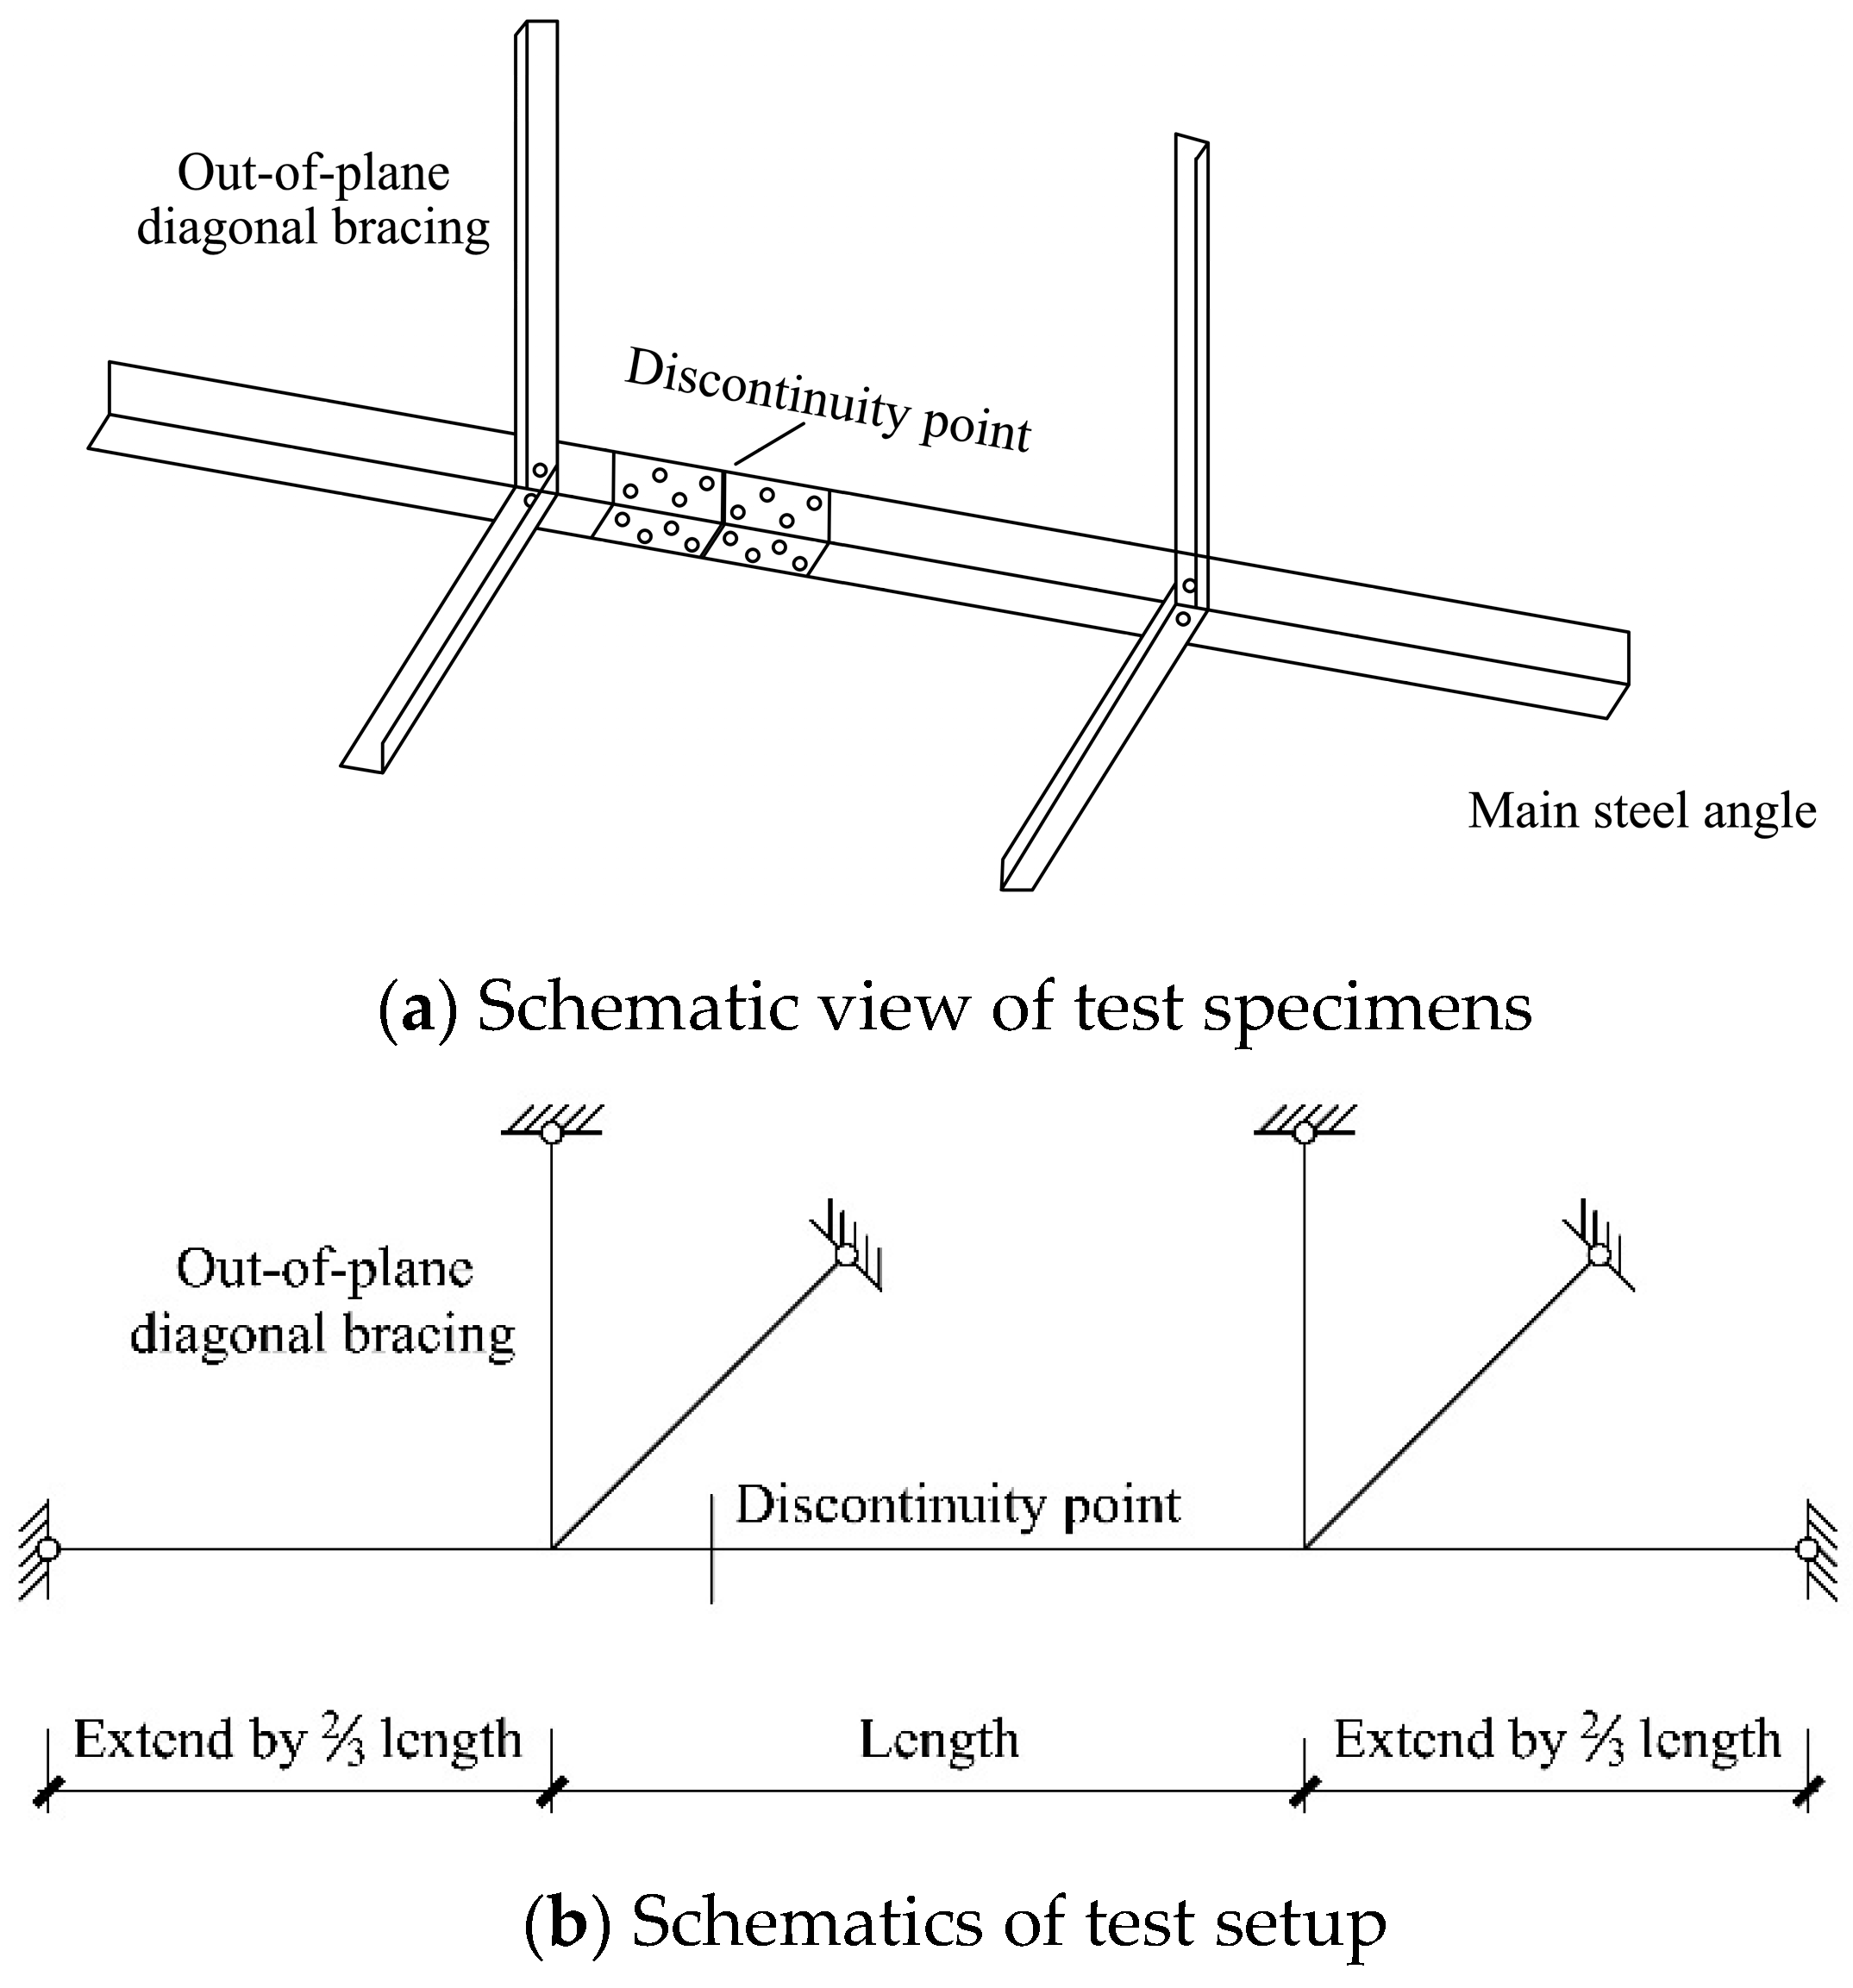
Figure 1. Details of steel angles in the experimental program (unit in mm).
Applsci 15 09140 g001
Figure 2. Details of main steel angles at double-shear splice connections.
Applsci 15 09140 g002
Figure 3. Test setup for steel angles in compression. (a) Schematic view; (b) Photo of setup.
Applsci 15 09140 g003
Figure 4. Layout of displacement transducers and strain gauges. (a) Displacement transducers; (b) Strain gauges.
Applsci 15 09140 g004
Figure 5. Load capacity of steel angles with a slenderness of 55.
Applsci 15 09140 g005
Figure 6. Effect of splice steel ratio on load-deformation curves of spliced angles. (a) S40-D50.0-T225; (b) S40-D62.5-T225.
Applsci 15 09140 g006
Figure 7. Effect of slenderness on load-deformation curves of spliced angles. (a) A1.1-D50.0-T225; (b) A1.1-D62.5-T225.
Applsci 15 09140 g007
Figure 8. Effect of bolt spacing on load-deformation curves of spliced angles. (a) A1.1-S40-T225; (b) A1.3-S40-T225; (c) A1.1-S55-T225; (d) A1.1-S70-T225.
Applsci 15 09140 g008aApplsci 15 09140 g008b
Figure 9. Effect of bolt torque on load-deformation curves of spliced angles.
Applsci 15 09140 g009
Figure 10. Flexural–torsional buckling and buckling of diagonal bracing at the connection of A1.3-S40-D62.5-T225. (a) Front view; (b) Side view; (c) Main member; (d) Bolt holes.
Applsci 15 09140 g010
Figure 11. Flexural–torsional buckling of A1.1-S55-D50.0-T225. (a) Front view; (b) Side view; (c) Main member; (d) Damaged joint.
Applsci 15 09140 g011
Figure 12. Lateral deflection of spliced angles in compression.
Applsci 15 09140 g012
Figure 13. Variation of steel strain with compression at the connection.
Applsci 15 09140 g013
Figure 14. Effect of splice steel ratio on the load capacity of steel angles.
Applsci 15 09140 g014
Figure 15. Effect of slenderness on the load capacity of steel angles.
Applsci 15 09140 g015
Figure 16. Effect of bolt spacing on the load capacity of steel angles.
Applsci 15 09140 g016
Figure 17. Effect of torque for bolting on the load capacity of steel angles.
Applsci 15 09140 g017
Figure 18. Section of equal-leg angles.
Applsci 15 09140 g018
Figure 19. Comparison of load capacities of steel angles in compression.
Applsci 15 09140 g019
Table 1. Details of steel angles for compression.
Specimen DesignationMain
Angles
Inner Angle SteelOuter Splice PlatesSlendernessLength of Top Angle (mm)Length of Bottom
Angle (mm)
Splice Steel RatioBolt Spacing
(mm)
Bolt Torque
(N·m)
A0-S55L125 × 10--551350---
A1.2-S55-D58.0-T225L125 × 10L100 × 7−8 × 10555126018801.258.0225
A1.2-S55-D58.0-T100L125 × 10L100 × 7−8 × 10555126018001.258.0100
A1.1-S40-D50.0-T225L125 × 10L100 × 7−6 × 10540102012801.150.0225
A1.1-S40-D62.5-T225L125 × 10L100 × 7−6 × 10540102012801.162.5225
A1.3-S40-D50.0-T225L125 × 10L100 × 8−8 × 10540102012801.350.0225
A1.3-S40-D62.5-T225L125 × 10L100 × 8−8 × 10540102012801.362.5225
A1.1-S70-D50.0-T225L125 × 10L100 × 7−6 × 10570151525151.150.0225
A1.1-S70-D62.5-T225L125 × 10L100 × 7−6 × 10570151525151.162.5225
A1.1-S55-D50.0-T225L140 × 10
+L125 × 10
L100 × 7−6 × 10555126018801.150.0225
A1.1-S55-D62.5-T225L140 × 10
+L125 × 10
L100 × 7−6 × 10555126018001.162.5225
Table 2. Mechanical properties of steel angles.
Steel CouponYield Strength (MPa)Ultimate Strength (MPa)Yield Strain (%)Elongation (%)Elastic Modulus (MPa)
Main angle377.3555.60.3913.5204,422.1
Diagonal bracing391.4563.40.4014.7202,798.5
Splice steel
100 × 7
413.9572.70.4111.5198,224.3
Splice steel
100 × 8
392.6562.10.4014.8201,097.9
Table 3. Load capacity and failure mode of spliced angles in compression.
Specimen
Designation
Splice Steel
Ratio
SlendernessBolt
Spacing
Failure ModeLoad
Capacity (kN)
Average Capacity (kN)
A0-S55-55-Flexural buckling of steel angles803.7796.1
780.2
804.5
A1.2-S55-D58.0-T2251.25558.0Flexural–torsional buckling of steel angles, Buckling of diagonal bracing at the connection684.5652.8
640.5
633.5
A1.2-S55-D58.0-T1001.25558.0Flexural–torsional buckling of steel angles, Buckling of diagonal bracing at the connection627.9630.8
630.2
634.3
A1.1-S40-D50.0-T2251.14050.0Flexural–torsional buckling of steel angles, Buckling of diagonal bracing at the connection720.4712.9
717.3
701.0
A1.1-S40-D62.5-T2251.14062.5Flexural–torsional buckling of steel angles, Buckling of diagonal bracing at the connection737.0735.2
732.3
736.3
A1.3-S40-D50.0-T2251.34050.0Flexural–torsional buckling of steel angles, Buckling of diagonal bracing at the connection708.5720.1
721.1
730.6
A1.3-S40-D62.5-T2251.34062.5Flexural–torsional buckling of steel angles, Buckling of diagonal bracing at the connection747.2742.1
737.9
741.3
A1.1-S70-D50.0-T2251.17050.0Flexural–torsional buckling of steel angles, Buckling of diagonal bracing at the connection603.7606.7
610.5
605.8
A1.1-S70-D62.5-T2251.17062.5Flexural–torsional buckling of steel angles, Buckling of diagonal bracing at the connection622.1630.1
638.2
A1.1-S55-D50.0-T2251.15550.0Flexural–torsional buckling of steel angles739.7726.5
Flexural–torsional buckling of steel angles, Buckling of diagonal bracing at the connection731.0
708.9
A1.1-S55-D62.5-T2251.15562.5Flexural–torsional buckling of steel angles742.2738.1
727.8
744.4
Table 4. Slenderness of main angles in lattice towers with different bracing systems.
Side Bracing ConnectionsSchematicSlenderness
Full overlapApplsci 15 09140 i001Equation (2)
partial overlapApplsci 15 09140 i002Equation (3)
Non-overlapApplsci 15 09140 i003Equation (4)
Table 5. Comparison of load capacities from experimental tests and design methods.
Specimen DesignationSplice Steel RationSlendernessBolt Spacing (mm)Experimental Failure Load N (kN)Code-Calculated Design Resistance N 1 (kN) N N 1 N 1 N N
A0-S55-55-796.1704.51.13−11.5%
A1.2-S55-D58.0-T2251.25558.0652.8673.60.973.2%
A1.2-S55-D58.0-T1001.25558.0630.8673.60.946.8%
A1.1-S40-D50.0-T2251.14050.0712.9731.60.972.6%
A1.1-S40-D62.5-T2251.14062.5735.2731.61.00−0.5%
A1.3-S40-D50.0-T2251.34050.0720.1731.60.981.6%
A1.3-S40-D62.5-T2251.34062.5742.1731.61.01−1.4%
A1.1-S70-D50.0-T2251.17050.0606.7580.41.05−4.3%
A1.1-S70-D62.5-T2251.17062.5630.1580.41.09−7.9%
A1.1-S55-D50.0-T2251.15550.0726.5673.61.08−7.3%
A1.1-S55-D62.5-T2251.15562.5738.1673.61.10−8.7%
Disclaimer/Publisher’s Note: The statements, opinions and data contained in all publications are solely those of the individual author(s) and contributor(s) and not of MDPI and/or the editor(s). MDPI and/or the editor(s) disclaim responsibility for any injury to people or property resulting from any ideas, methods, instructions or products referred to in the content.