Article

Seismic Performance of Multi-Floor Grain Warehouse Under Various Storage Conditions

by
Huifen Wang
,
Yonggang Ding
*,
Guiling Wang
,
Qikeng Xu
and
Yanan Zhang
College of Civil Engineering, Henan University of Technology, Zhengzhou 450001, China
*
Author to whom correspondence should be addressed.
Appl. Sci. 2025, 15(16), 9128; https://doi.org/10.3390/app15169128
Submission received: 19 June 2025 / Revised: 8 August 2025 / Accepted: 8 August 2025 / Published: 19 August 2025
(This article belongs to the Section Civil Engineering)

Abstract

The storage conditions of multi-floor grain warehouses change frequently during grain circulation. This paper investigates the effects of various storage conditions on the seismic performance of multi-floor grain warehouses. The numerical results indicate that the higher the storage material distribution position, the greater the damping ratio of the structural model and the more obvious the contribution of storage material movement to the damping of the structure. The intensity of earthquake action and the spatial height of the floor where the storage material is located are negatively correlated with the acceleration response of the structure. Under full-silo conditions, when the peak ground acceleration (PGA) is 0.4 g, the acceleration amplification factor at the top of the structure is 69.7% of the corresponding parameter at 0.1 g. The discontinuity in the storage space of the structure results in a torsional effect on the structure. When PGA = 0.22 g, the peak inter-story displacement angle of the first floor differs by nearly 1.7 times under different operating conditions, and the peak inter-story displacement angle of the second floor during an earthquake with PGA = 0.40 g differs by about 1.5 times under different operating conditions. The lateral pressure of the silo wall at different burial depths under earthquake action shows a highly nonlinear distribution trend, and the overpressure coefficient at the same burial depth of the warehouse wall is proportional to the PGA of the earthquake action. During 0.1 g, 0.22 g, and 0.40 g earthquakes, the maximum overpressure coefficients at the bottom of the warehouse wall on different floors are 1.13, 1.21, and 1.66, respectively.

1. Introduction

Grain storage facilities are important for ensuring the safety of national grain reserves [1]. The multi-floor grain warehouse is a type of warehouse (Figure 1) that is widely used in large-scale storage and logistics parks. It has the advantages of a high land intensification rate, a good grain storage effect, and a high degree of mechanization [2,3,4]. The components of the multi-floor grain warehouse include frame columns, frame beams, cross-beam floor slabs, and warehouse walls. The warehouse wall is composed of thick walls and tie beams to withstand lateral pressure from grain. According to the needs of grain storage, grain warehouses are usually designed to be three to five stories high, with a single-story loading height of 8 to 10 m and a floor-to-floor live load of about 64 to 80 kN/m2. In order to meet the need for grain storage and accommodate the working space of mechanical equipment, the floor height and structural member size of the structure are usually three to five times those of an ordinary frame structure. Multi-floor grain warehouses are typical large-scale, heavy-load structures [5].
In recent years, scholars have conducted comprehensive research on the structural mechanical properties of multi-floor grain warehouses. Wang et al. [6] used ABAQUS finite element software (2006) to analyze the static behavior of a three-story multi-floor grain warehouse structure under different grain storage conditions. Zhang et al. [7,8] conducted a finite element simulation of a typical multi-floor grain warehouse and obtained the distribution law of wall stress along the height of the floor. The abovementioned research mainly focused on the mechanical performance and structural design issues of buildings from a static perspective. According to incomplete statistics, the main reason for the large-scale damage and destruction of storage structures, such as grain silos, in modern times is still the occurrence of earthquakes. In the early Haiti and Tangshan earthquakes, a large number of storage silo structures were damaged, with a rate of damage of medium scale and above reaching 55%. After the Jiji earthquake, almost all silos within a 70 km radius of the epicenter collapsed or were damaged. The 7.4-magnitude Kocaeli earthquake and the 7.2-magnitude Duzces earthquake in Turkey in 1999 [9] caused serious damage to storage buildings in many cities. In the 2010 Chile earthquake, a 2 × 6, 34 m high reinforced concrete silo structure experienced bending shear failure between the thinner and thicker walls at the bottom 3.2 m, causing the entire silo to collapse [10]. Although there have been no reported cases of multi-floor grain warehouses being damaged by earthquakes, seismic design is essential to maintaining the function of the building, especially after any earthquake activity.
Gu and Liu [11] used the incremental dynamic analysis (IDA) method to quantitatively evaluate the seismic damage risk of a multi-floor grain warehouse. Xu et al. [12,13] took the lead in conducting vibration table modal tests and grain load lateral pressure tests on a multi-floor grain warehouse structure, revealing its dynamic characteristics and lateral pressure distribution laws under different grain storage conditions. Li et al. [5] focused on the node performance of a multi-floor grain warehouse and used quasi-static tests to clarify the influence of bulk grain on the failure mode of local nodes of the structure. From the abovementioned analysis, it is clear that research into characterizing the seismic response and seismic resistance of multi-floor grain warehouses has begun to receive significant attention.
Bulk grain significantly affects the dynamic response of granary structures [14,15,16,17,18,19], leading to complex seismic damage under various storage conditions [20]. Numerous studies have been carried out on granary structures, particularly on vertical silos and bungalows [21,22,23,24]. Extensive research findings have been obtained on their seismic performance and behavioral patterns under various storage conditions, which have effectively guided the design and practical application of granary structures. Due to the characteristics of layered storage of grain in vertical storage space, multi-floor grain warehouses exhibit a wider variety of storage conditions and greater randomness in practical applications. Compared with other types of granaries [21,22,23,24], the influence of various storage conditions on their dynamic response under seismic action is more complex.
Therefore, this paper focuses on investigating the influence of various storage conditions on the seismic response of the multi-floor grain warehouse under earthquake action using ABAQUS analysis software (2022). ABAQUS software has a significant advantage over other software programs in handling the contact between storage materials and structures due to its efficient master–slave contact search and penalty function algorithm. By analyzing the dynamic characteristics and dynamic responses under different intensities, this study addresses existing gaps in research on the seismic resistance of multi-floor grain warehouses.

2. Numerical Model of Multi-Floor Grain Warehouse

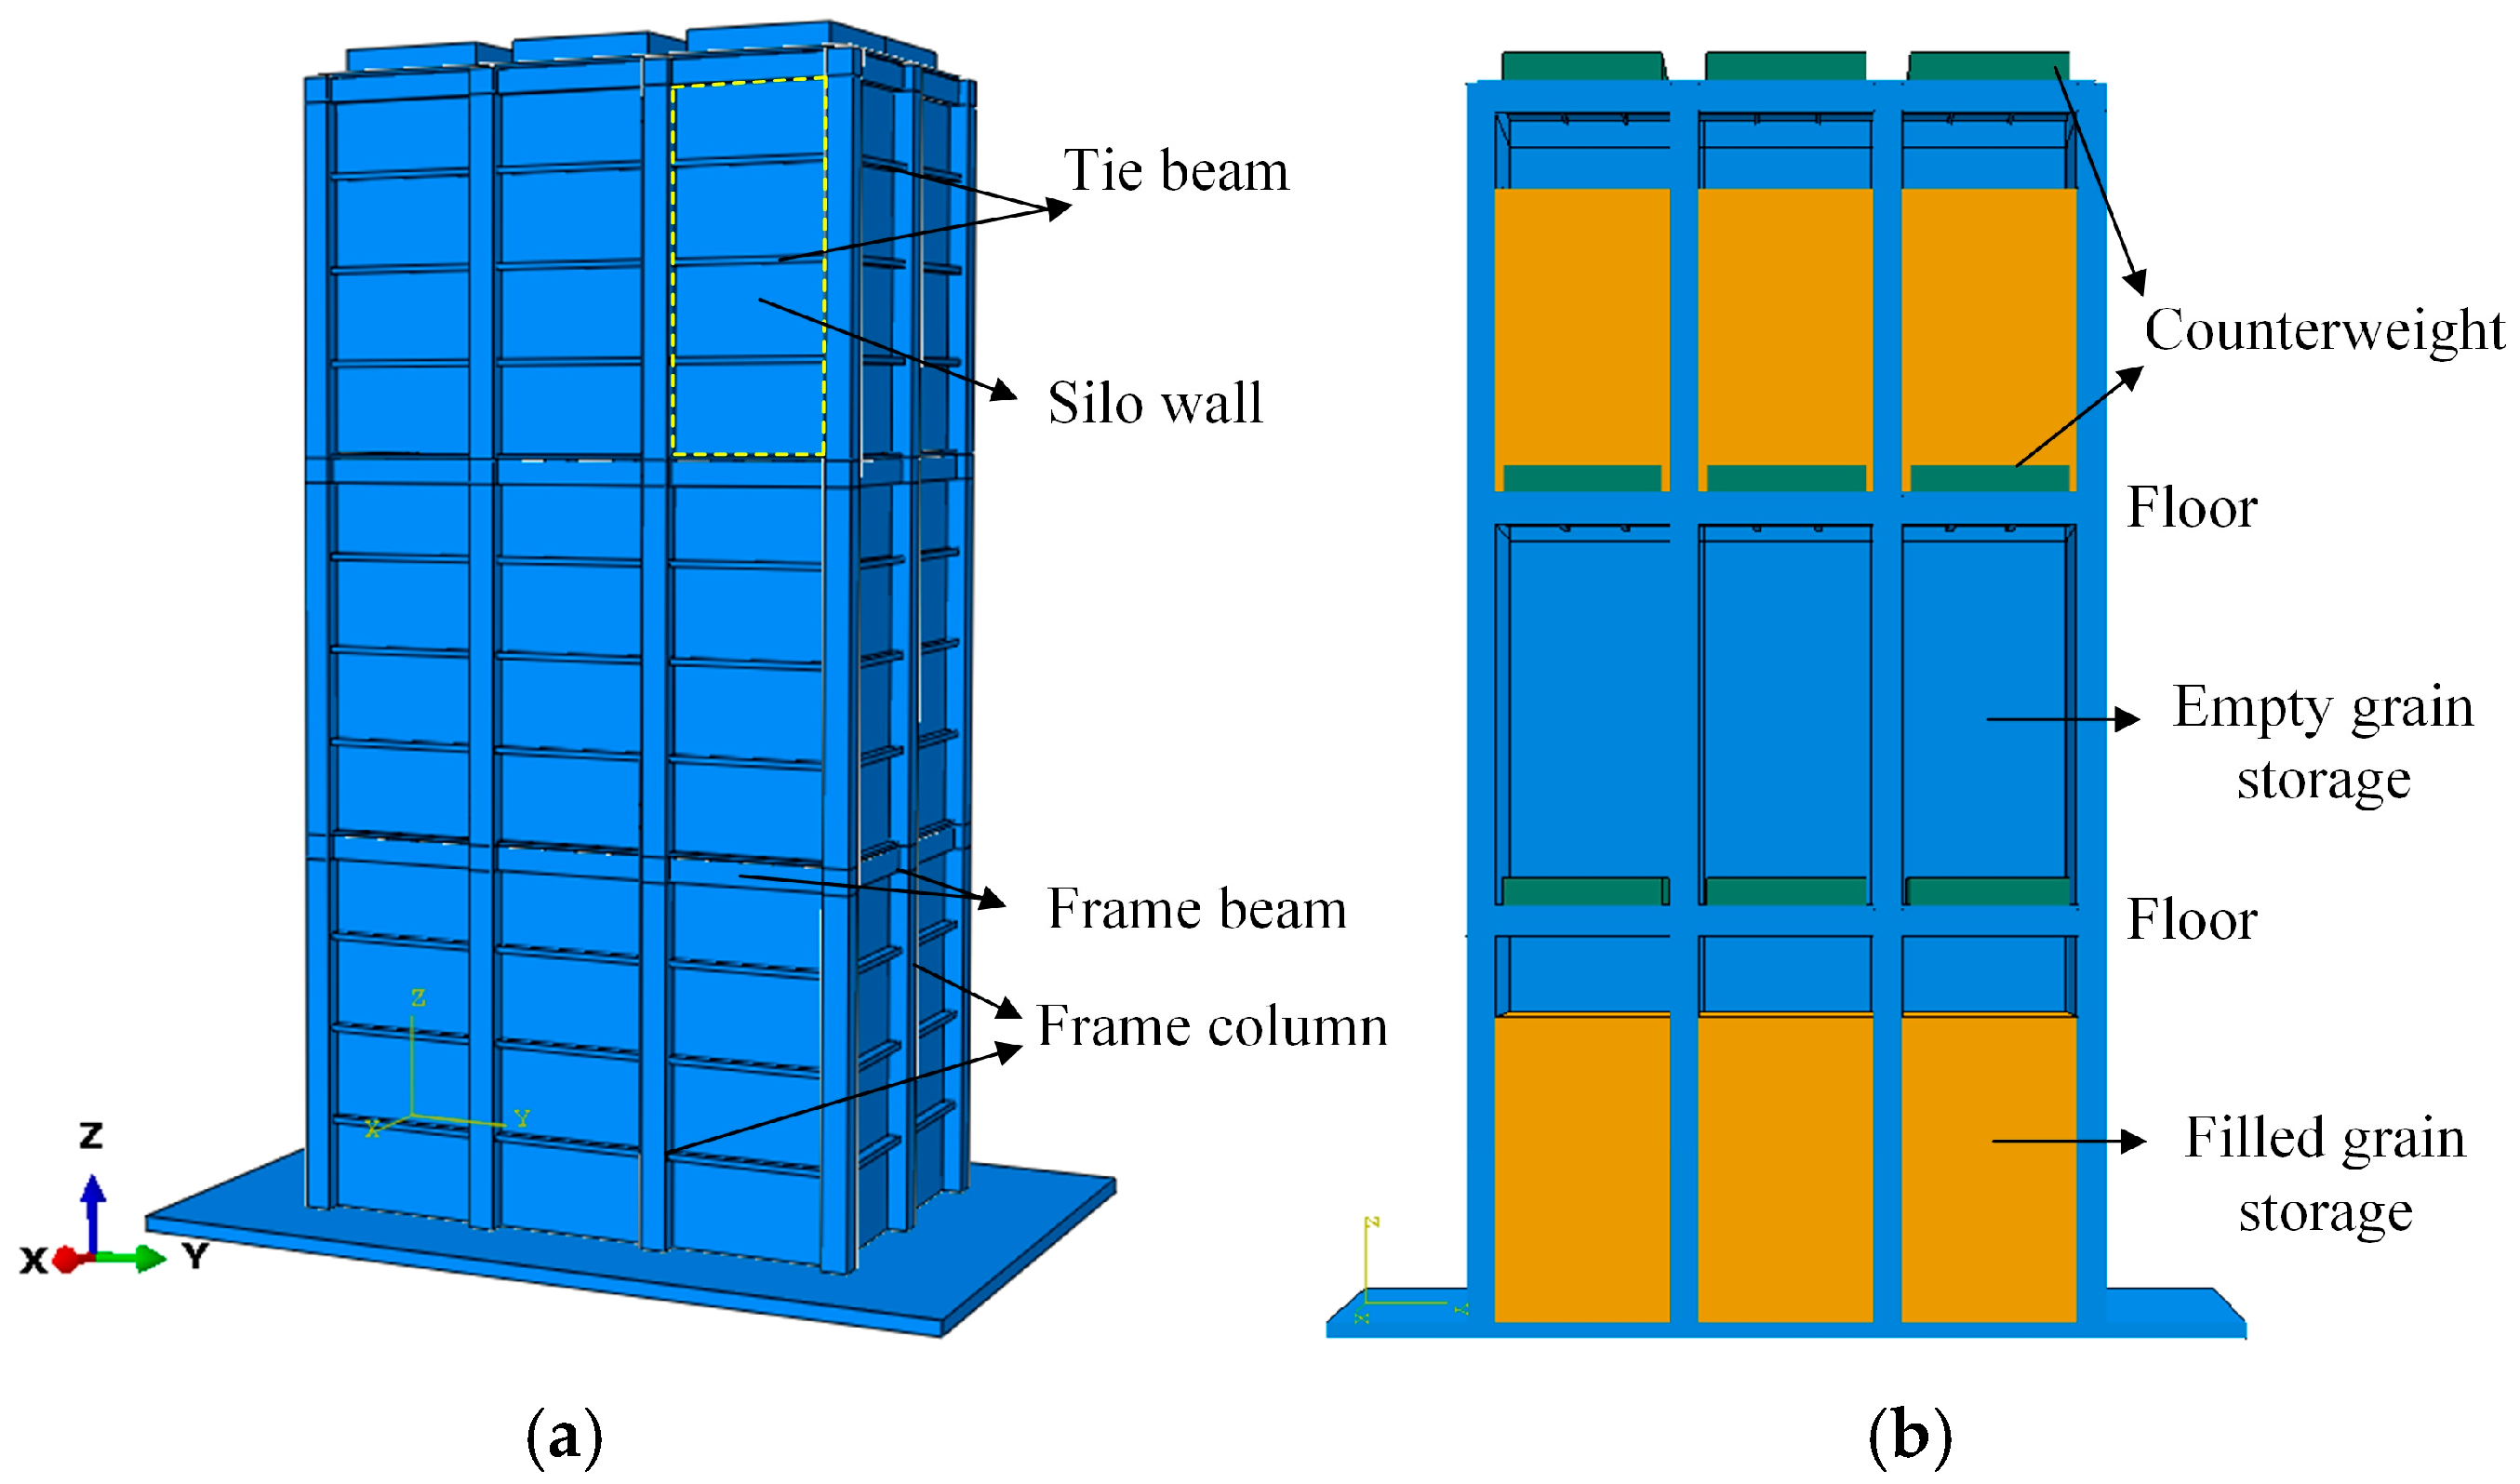
The numerical model was based on the multi-floor grain warehouse of a grain reserve depot in Guangzhou Panyu as its prototype. The seismic fortification intensity of the structure was 7 degrees, the site category was Class II, the design earthquake group was Group I, and the seismic fortification category was Class C. The numerical model of the multi-floor grain warehouse selected one of the granaries for design. The main structure is composed of frame columns, frame beams, tie beams, floor slabs, warehouse walls, bottom plates, and other components. The storage materials in the building are ceramic beads. A 3D finite element model of the multi-floor grain warehouse was established using a separate modeling approach implemented within ABAQUS software (2022). Figure 2 shows the three-dimensional model and cross-sectional view of the multi-floor grain warehouse, with basic information such as structural components and storage materials clearly marked.

2.1. Constitutive Model of Storage Material

As a mathematical model that describes the relationship between material stress and strain, the constitutive model is fundamental to understanding and analyzing the mechanical behavior of materials. The main structure was modeled using a linear elastic constitutive model (Hooke’s law) in accordance with the research objectives of this paper. According to relevant research findings [25], in ABAQUS software, the Drucker–Prager elastic–plastic constitutive model (D-P model) has been demonstrated to be a relatively accurate and reasonable choice for characterizing granular materials. It not only accounts for the elastic–plastic behavior of the material but also incorporates the yield criterion, thereby enabling more accurate simulation of deformation and failure behavior of granular materials during the stress process.
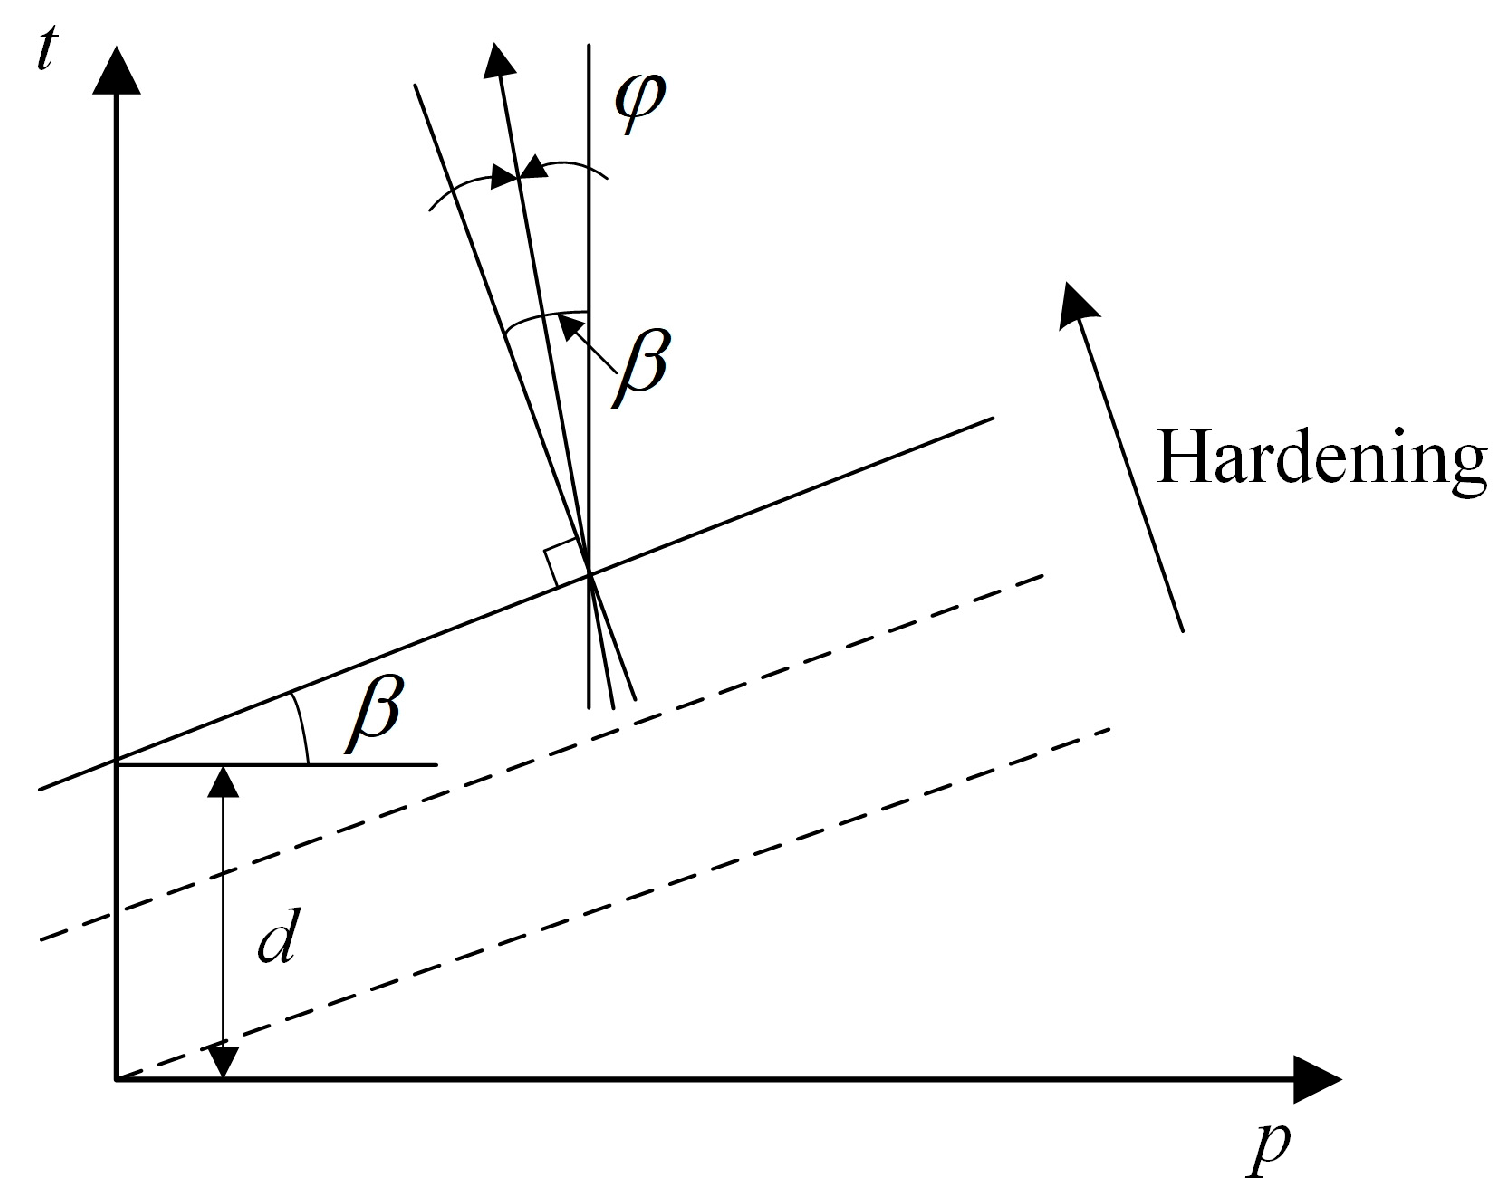
In ABAQUS, the D-P model is an improvement on the Mohr–Coulomb (M-C) model, addressing the numerical singularity problem caused by the sharp corners of the yield surface. This improvement is achieved by introducing a smooth yield surface that is non-circular on the deviatoric plane and permits different yield values in tension and compression, thus accommodating various experimental results. Unlike the M-C model, the yield surface of the D-P model is smooth at the corners and presents a conical shape in the principal stress space. The yield surface of the D-P model also depends on the effective mean stress σm. The D-P model provides several yield surface forms, including linear, hyperbolic, and exponential types, among which the linear model is the most used due to its simplicity and practicality. The yield function of this model is shown in Equations (1) and (2), and the plastic potential surface is shown in Figure 3.
F = t p tan β d = 0
t = 1 2 q 1 + 1 k 1 1 k r q 3
Here, t denotes the deviatoric stress measure; q is the deviatoric stress; r is the third deviatoric stress invariant; β is the friction angle; d is the cohesion, which is related to the material’s hardening strength; and k is the ratio of the yield stress in triaxial tension to the yield stress of triaxial compression.
In summary, when the non-associated flow law is used to simulate ceramic bead particles (CBPs), the material parameters of the D-P model cannot be directly equated to those of the M-C model. Instead, a parameter transformation exists between the two models, as shown in Equations (3) and (4):
tan β = 3 sin φ
k = 3 sin φ 3 + sin φ
The key parameters of the D-P model collectively form the basis of this model, with the internal friction angle defining the material’s yield condition and the constitutive equation being calculated based on the effective parameters. When the model is used to describe the mechanical behavior of ceramic bead particles (CBPs), the specific values are shown in Table 1.

2.2. Boundary Conditions and Mesh Division

The contact between the storage material and the warehouse wall is rigid–flexible surface contact [16,20]. This contact is capable of accommodating large deformations and can adapt to various surface geometries, thereby improving the realism and accuracy of the simulation. In the analysis, the warehouse wall is modeled as a rigid body, while the internal storage material is treated as a flexible body. In the normal direction, the contact between the two is set as “hard” contact [20], meaning that under compressive loading, the contact surfaces are prevented from penetrating each other. In the tangential direction, the relative motion and the generation of friction shear stress are simulated by setting the friction coefficient. In the dynamic characteristic analysis, the storage material can be “bound” to the wall to define the contact constraints between them.
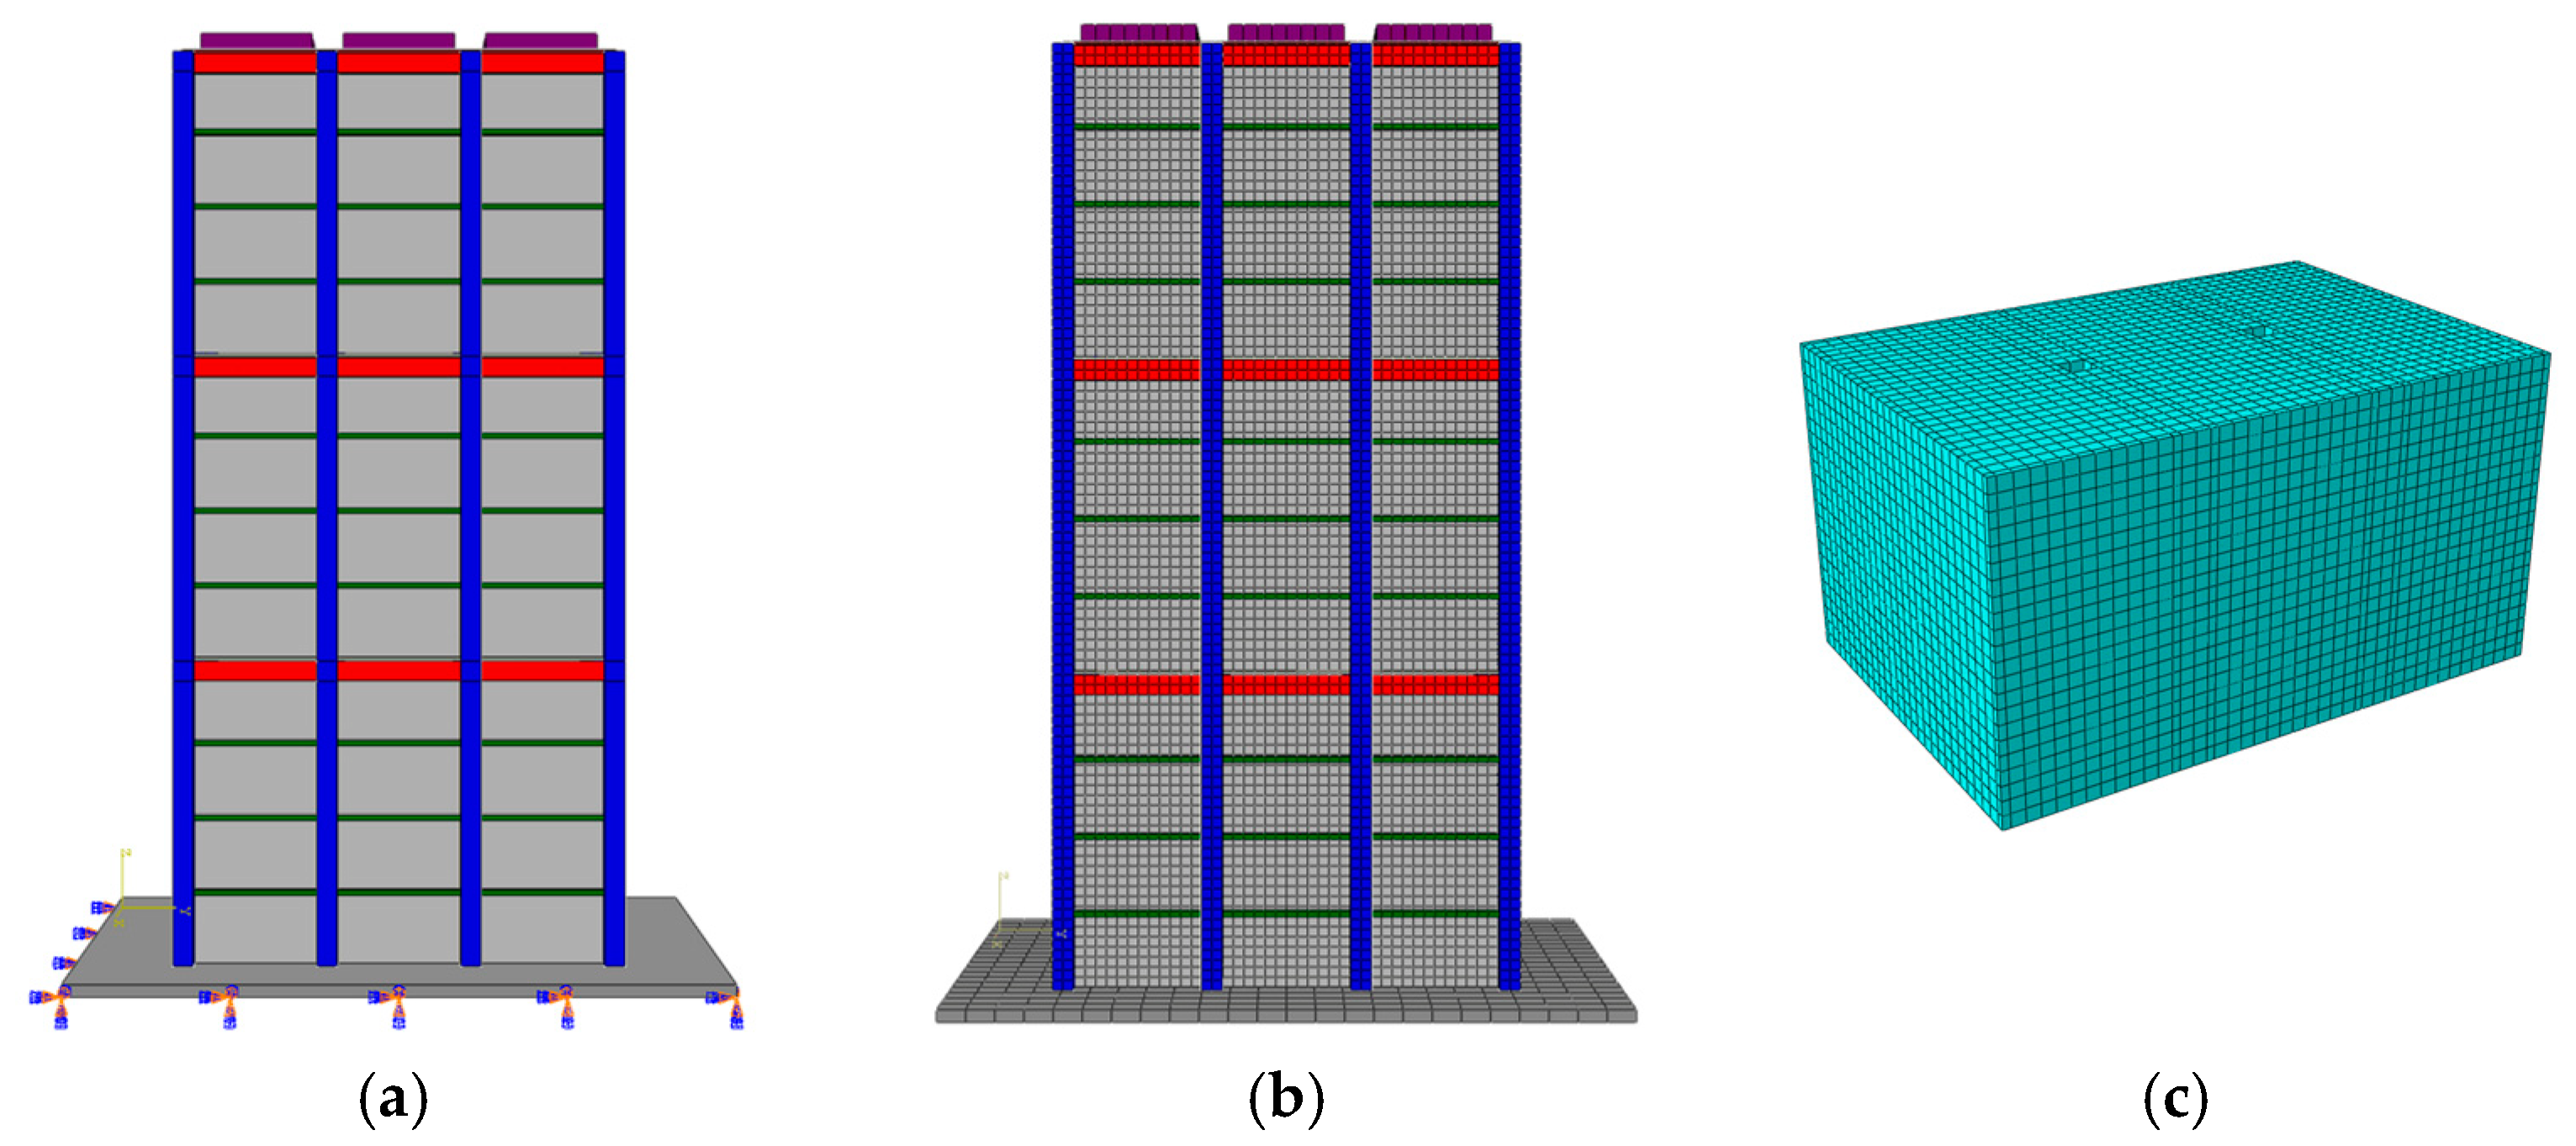
To ensure the simulation accurately replicates experimental behavior, proper boundary constraint definition at the silo bottom is essential. In accordance with the experimental conditions, all six degrees of freedom at the silo bottom are constrained. The structural component of the model is meshed using C3D8R elements, resulting in 23,831 elements. The mesh type of the stored material is identical to that of the structure, and a single layer of stored material is discretized into 24,596 elements. Details of the boundary conditions and mesh discretization for both the structural model and the stored material are provided in Figure 4.

3. Validation of Numerical Model of Multi-Floor Grain Warehouse Model by Shaking Table

To verify the rationality and reliability of the proposed numerical method, this section employs the above approach to simulate the shaking table test of the multi-floor grain warehouse model in ABAQUS. The numerical calculation results are compared with the experimental results.

3.1. Introduction to the Shaking Table Test

The prototype structure of the shaking table test model is a three-story, single-room granary from the Guangzhou Panyu multi-floor grain warehouse (Figure 1). The shaking table test is conducted at a scale of 1:25, and the dimensions of the test model are illustrated in Figure 2. The grain warehouse model is fabricated from organic glass, with an overall height of 1.83 m, a floor height of 0.61 m, frame columns with a cross-sectional size of 0.04 m × 0.04 m, frame beams with a cross-sectional size of 0.02 m × 0.04 m, a slab thickness of 0.006 m, connecting beams of 0.02 m × 0.01 m, gridiron beams of 0.01 m × 0.025 m, and warehouse walls with a thickness of 0.01 m. The various components are fastened with bolts and bonded using chloroform. The principal dimensions of the model structure are shown in Figure 5.
The stored material in the multi-floor grain warehouse consists of ceramic beads with a particle size of 1.18 to 2.36 mm, and the friction coefficient between organic glass and ceramic beads is 0.45. The mechanical properties of the organic glass and stored material are provided in [18]. Based on the Code for Seismic Design of Buildings [25] and the test loading conditions, El-Centro ground motion is selected as the seismic input for the numerical simulation.

3.2. Comparison of Dynamic Characteristics

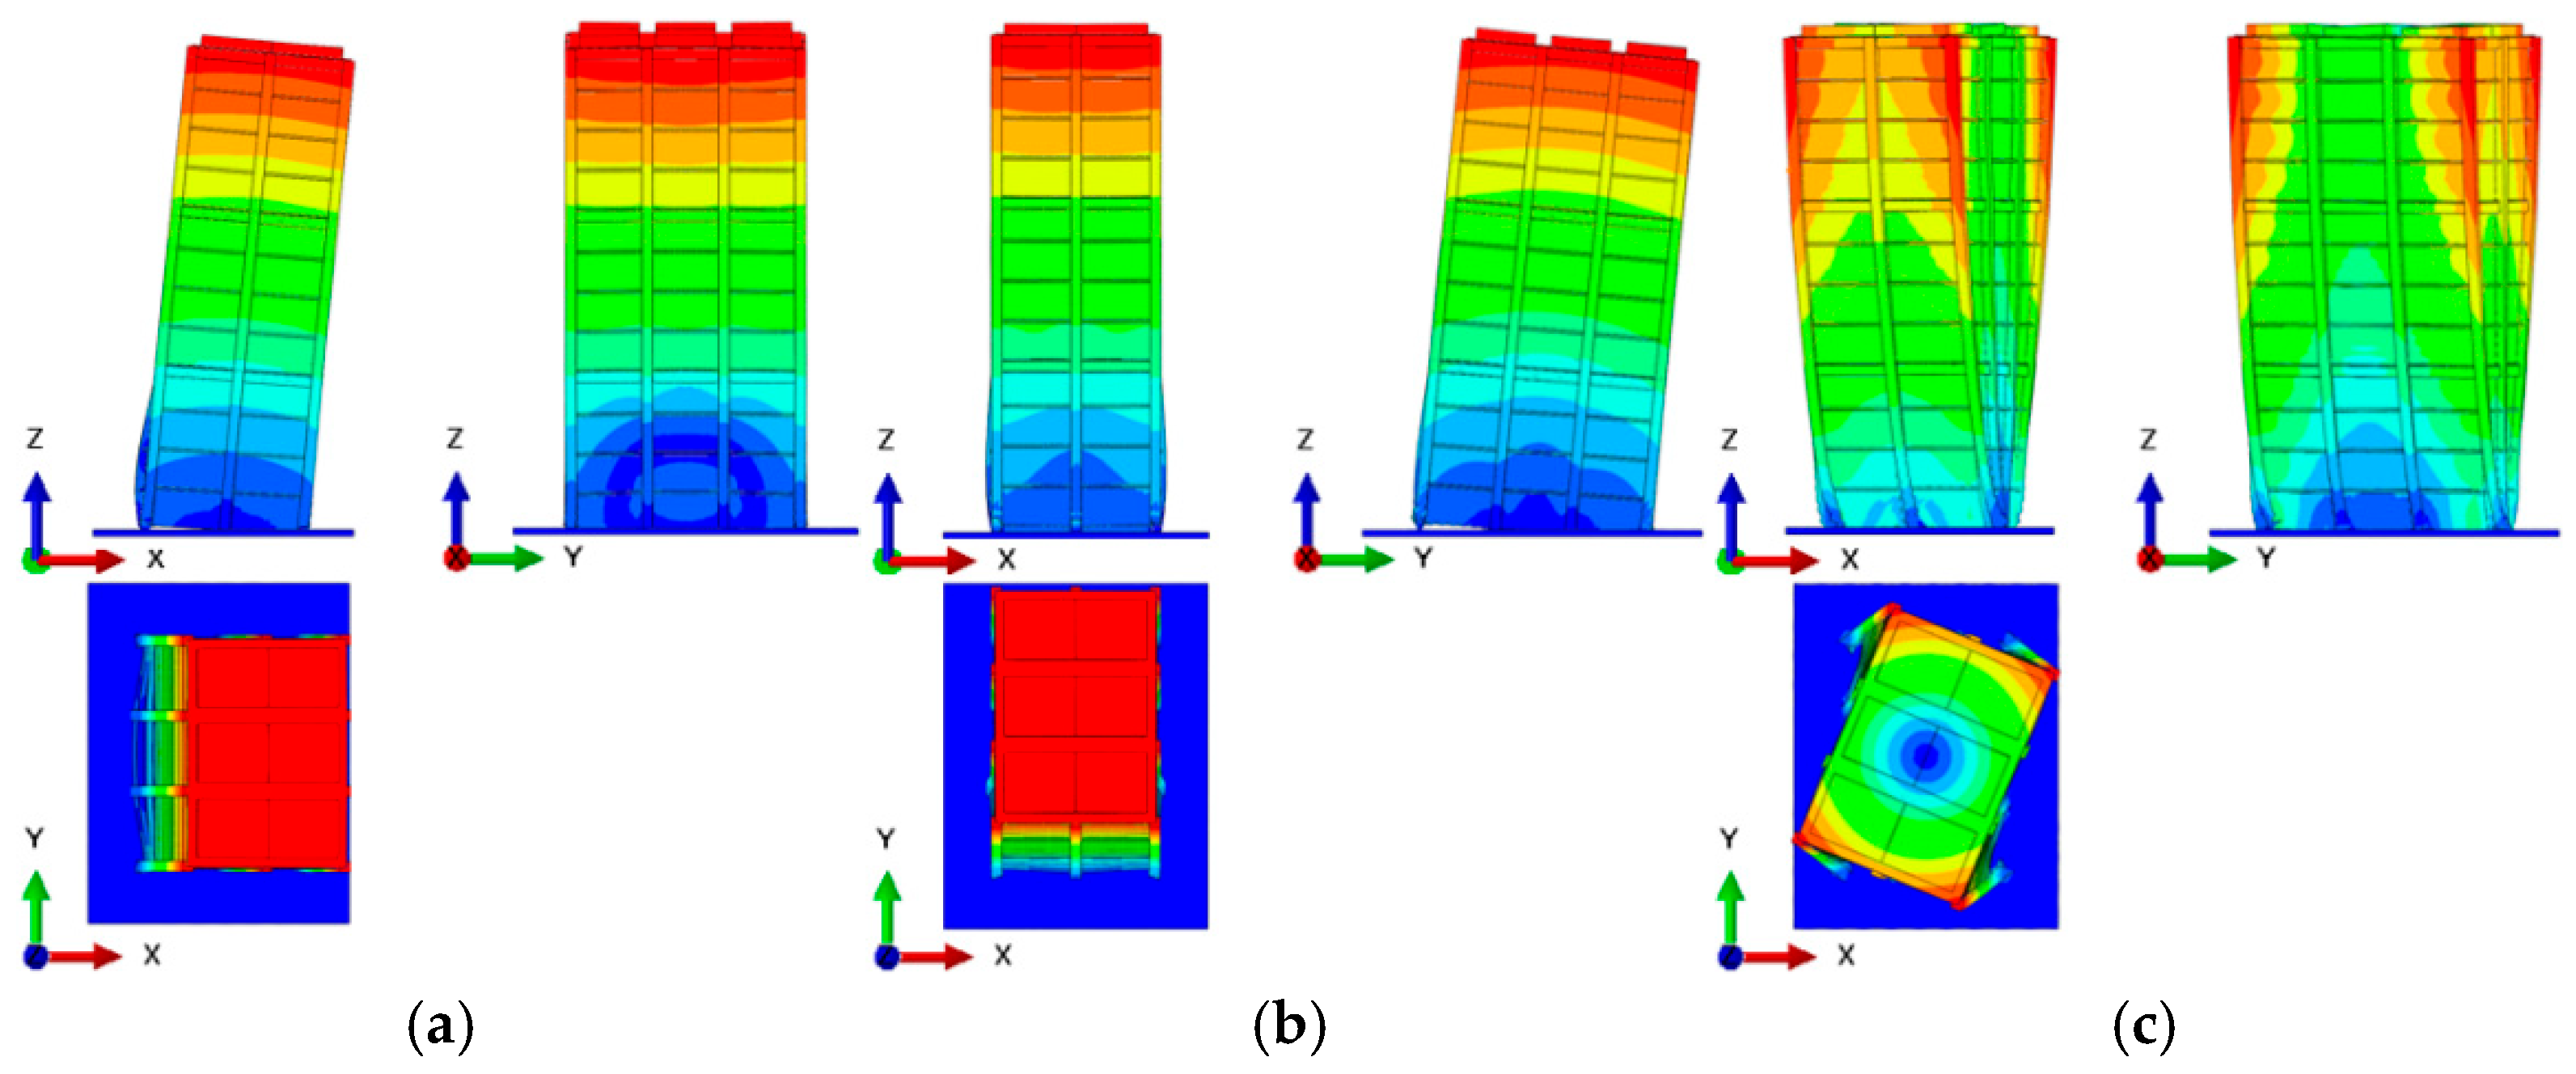
The natural frequencies of the model structure under various storage conditions were calculated using the “Frequency” step in the “Linear Perturbation” procedure in the step module of ABAQUS/Standard. Figure 6 and Figure 7 present the first three vibration mode shapes for the empty-silo and full-silo conditions.
It is observed from Figure 6 and Figure 7 that under various storage conditions, the finite element model of the multi-floor grain warehouse exhibits similar characteristics in the first three vibration modes: the first mode corresponds to translation in the X-direction, the second mode to translation in the Y-direction, and the third mode corresponds to torsion in the XOY plane. In all storage conditions, the first three vibration modes of the structure do not exhibit local vibrations, indicating that the stiffness distribution of the finite element model of the multi-floor grain warehouse is relatively uniform and reasonable.
Table 2 presents the first three natural frequencies of the finite element model of the multi-floor grain warehouse under various storage conditions. For the empty silo condition, the second-order natural frequency is approximately 7% higher than the first order, and the third order is about 232% higher than the first order. Similarly, for the full-silo condition, the increases are around 8% and 214%, respectively. The first-order natural frequency along the X-direction is lower than the second-order natural frequency along the Y-direction, indicating that the stiffness in the X-direction is less than that in the Y-direction. The first-order natural frequency of the full-silo condition is reduced by 36% compared with the empty silo, demonstrating that as the storage mass increases, the natural frequency decreases, and the reduction is nonlinear. The first-order natural frequencies of the test model and the finite element model under various storage conditions are in close agreement. The errors in the first-order natural frequency between the test model and the finite element model for the empty silo and full silo are 5% and −6%, respectively, suggesting that the constructed model has a reasonable and reliable structural configuration, with mass and stiffness distributions consistent with the test model.

3.3. Comparison of Acceleration Response

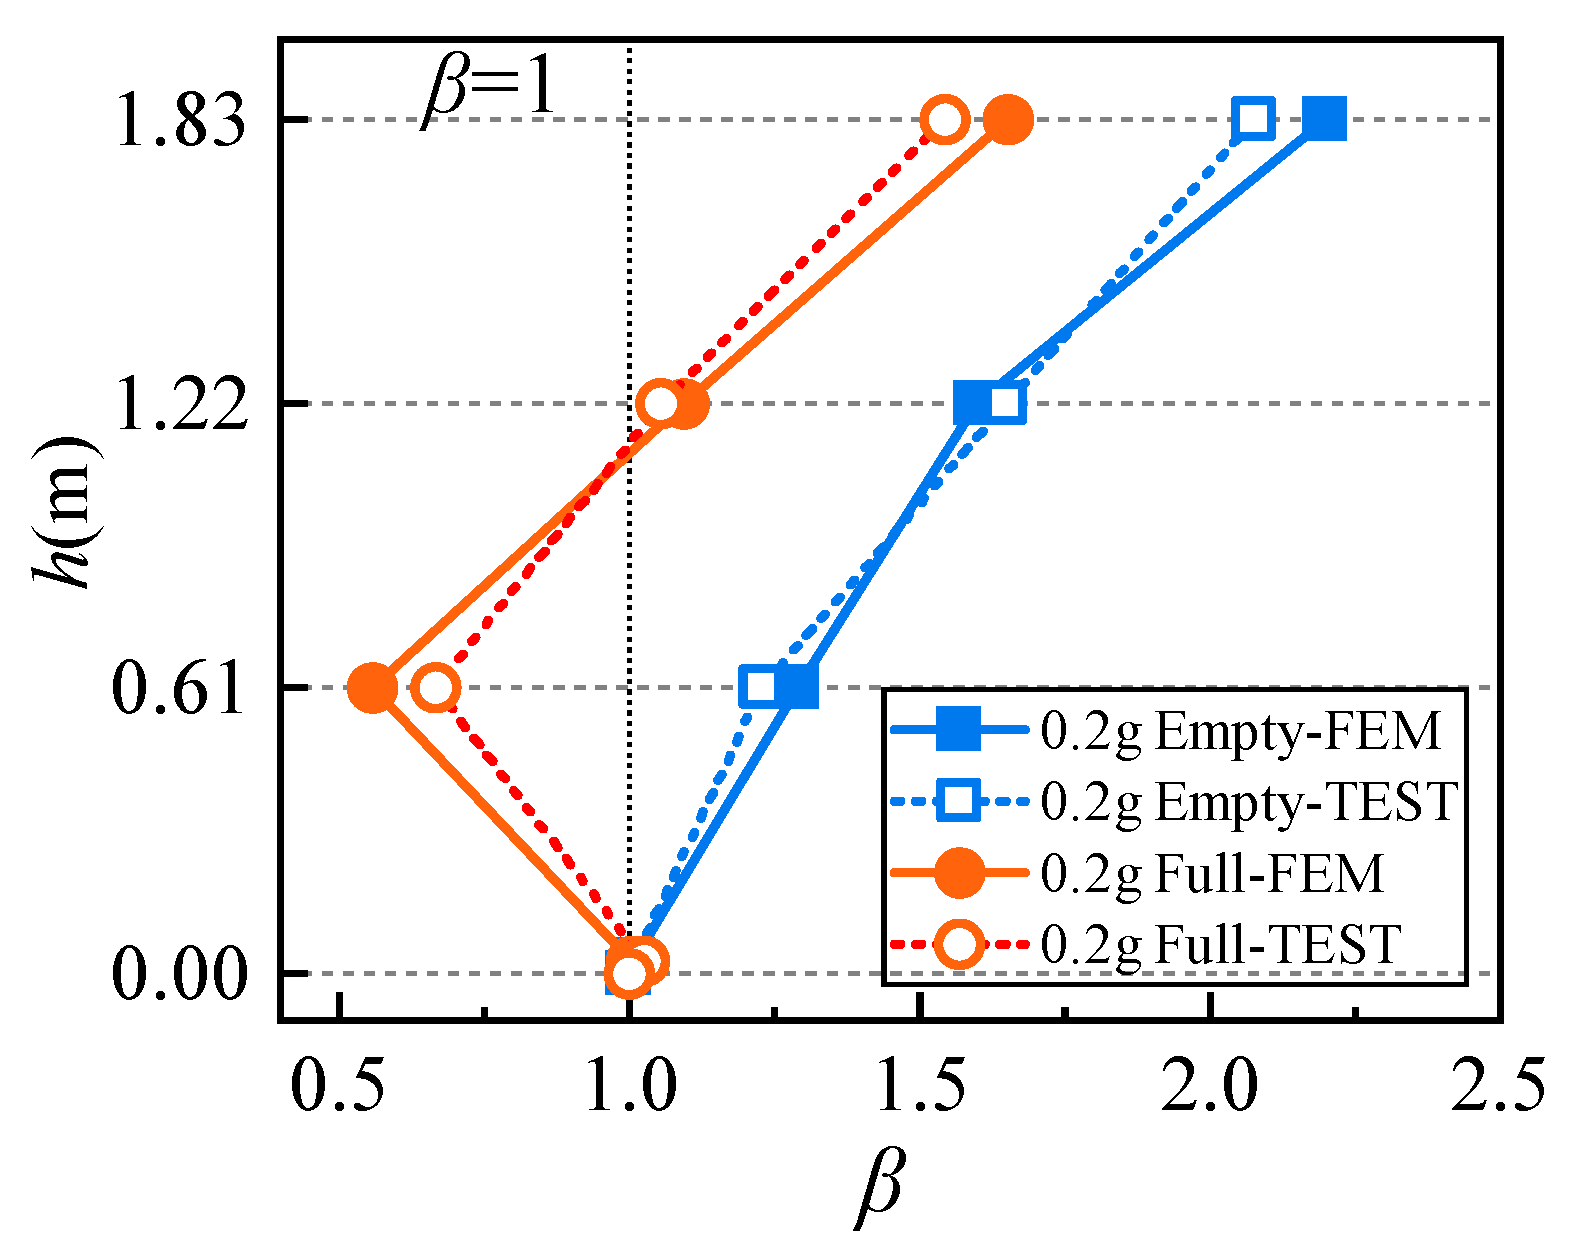
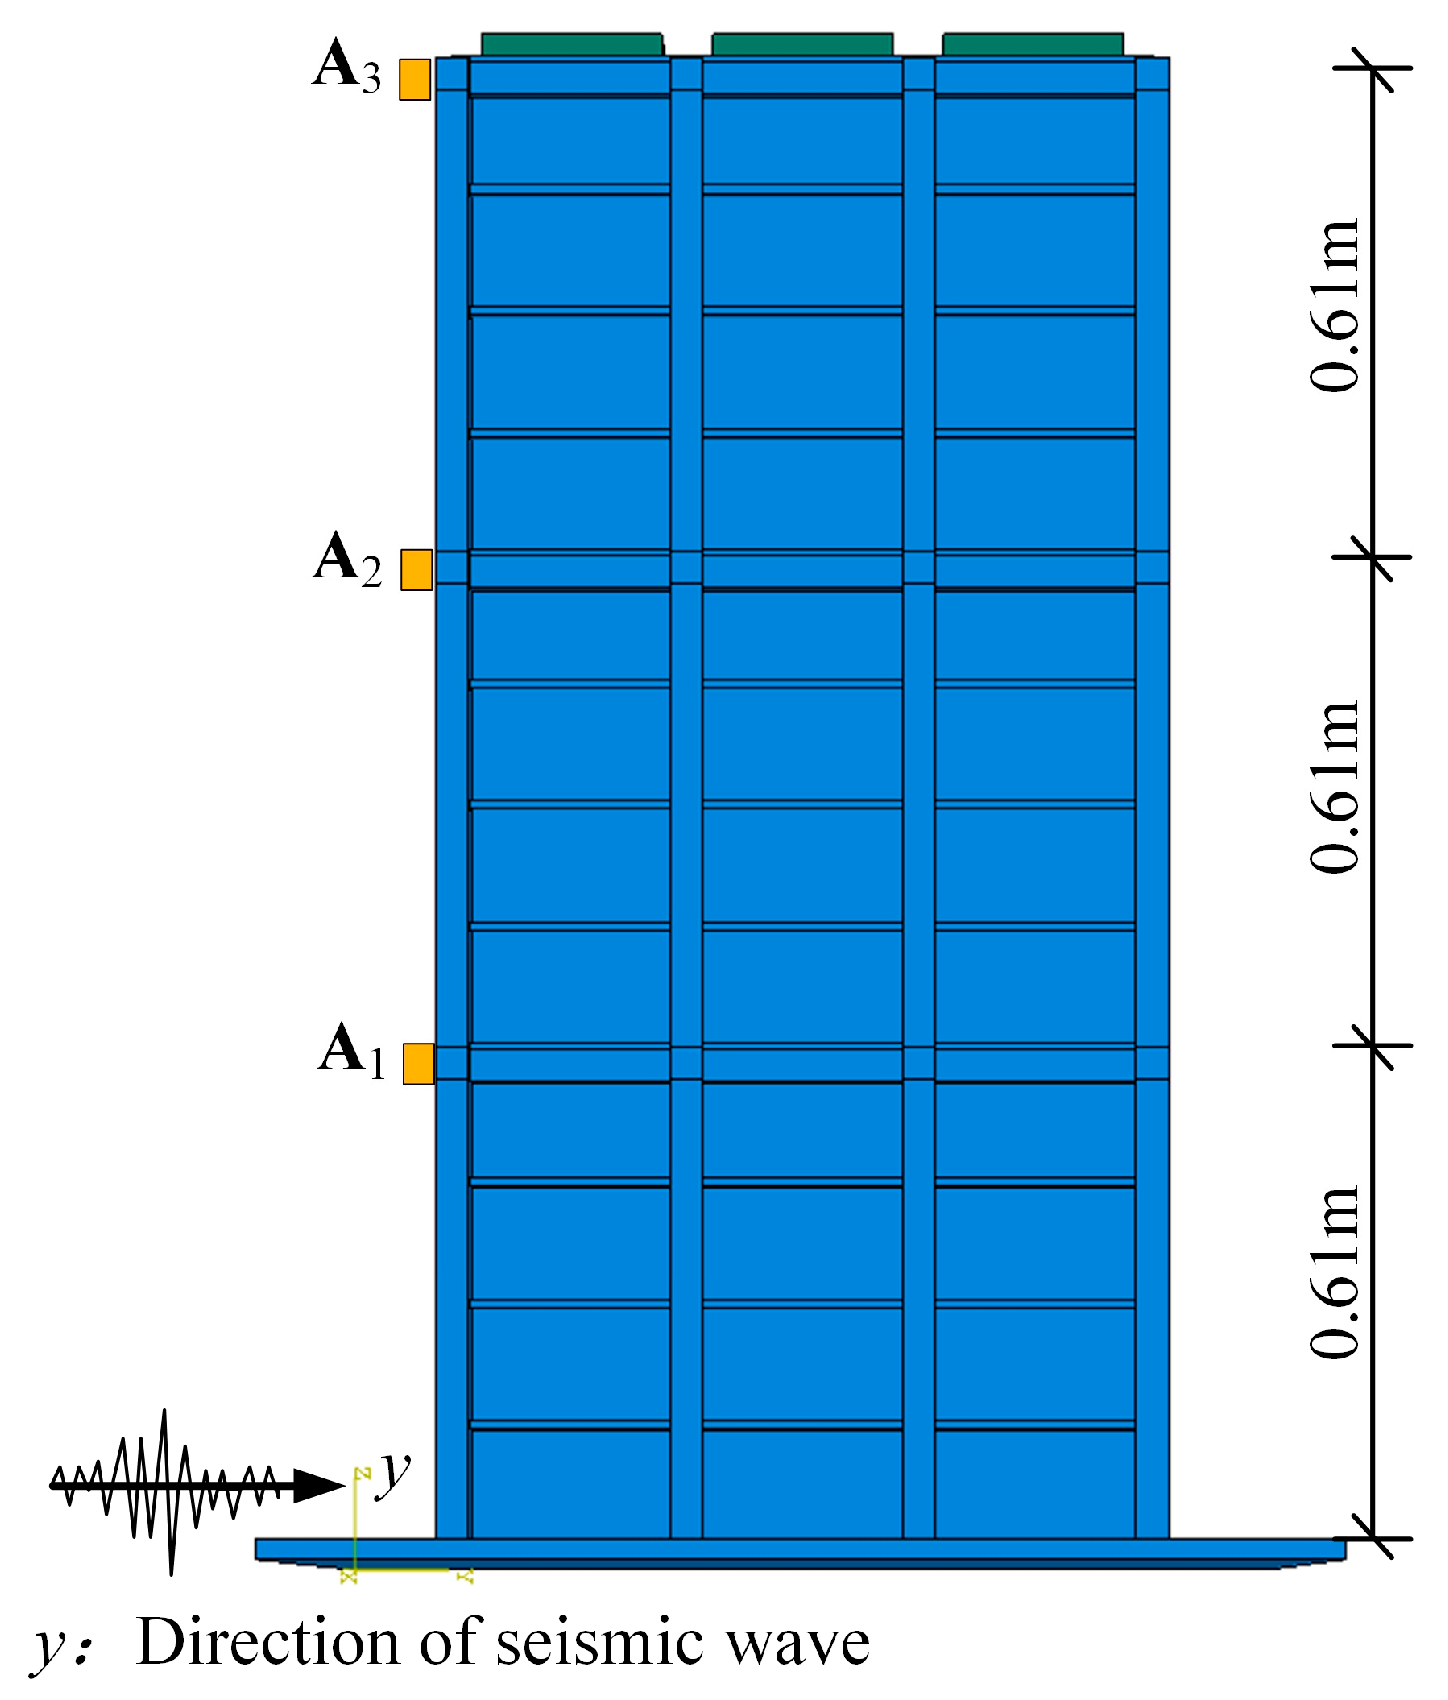
The acceleration amplification coefficient (β) of the multi-floor grain warehouse model is calculated for two filling conditions—empty and full states—and compared with the experimental results, as shown in Figure 8. The value of 0.2 g in the figure and caption denotes the peak ground acceleration (PGA) of the input seismic ground motion. Figure 9 illustrates the locations of the selected acceleration measurement points. As shown in Figure 8, under various storage conditions, the acceleration peak of the multi-floor grain warehouse model gradually increases with the input PGA during seismic excitation, and the simulated value of the absolute peak acceleration agrees well with the experimentally measured value.

3.4. Comparative Analysis of Pressure on Silo Walls

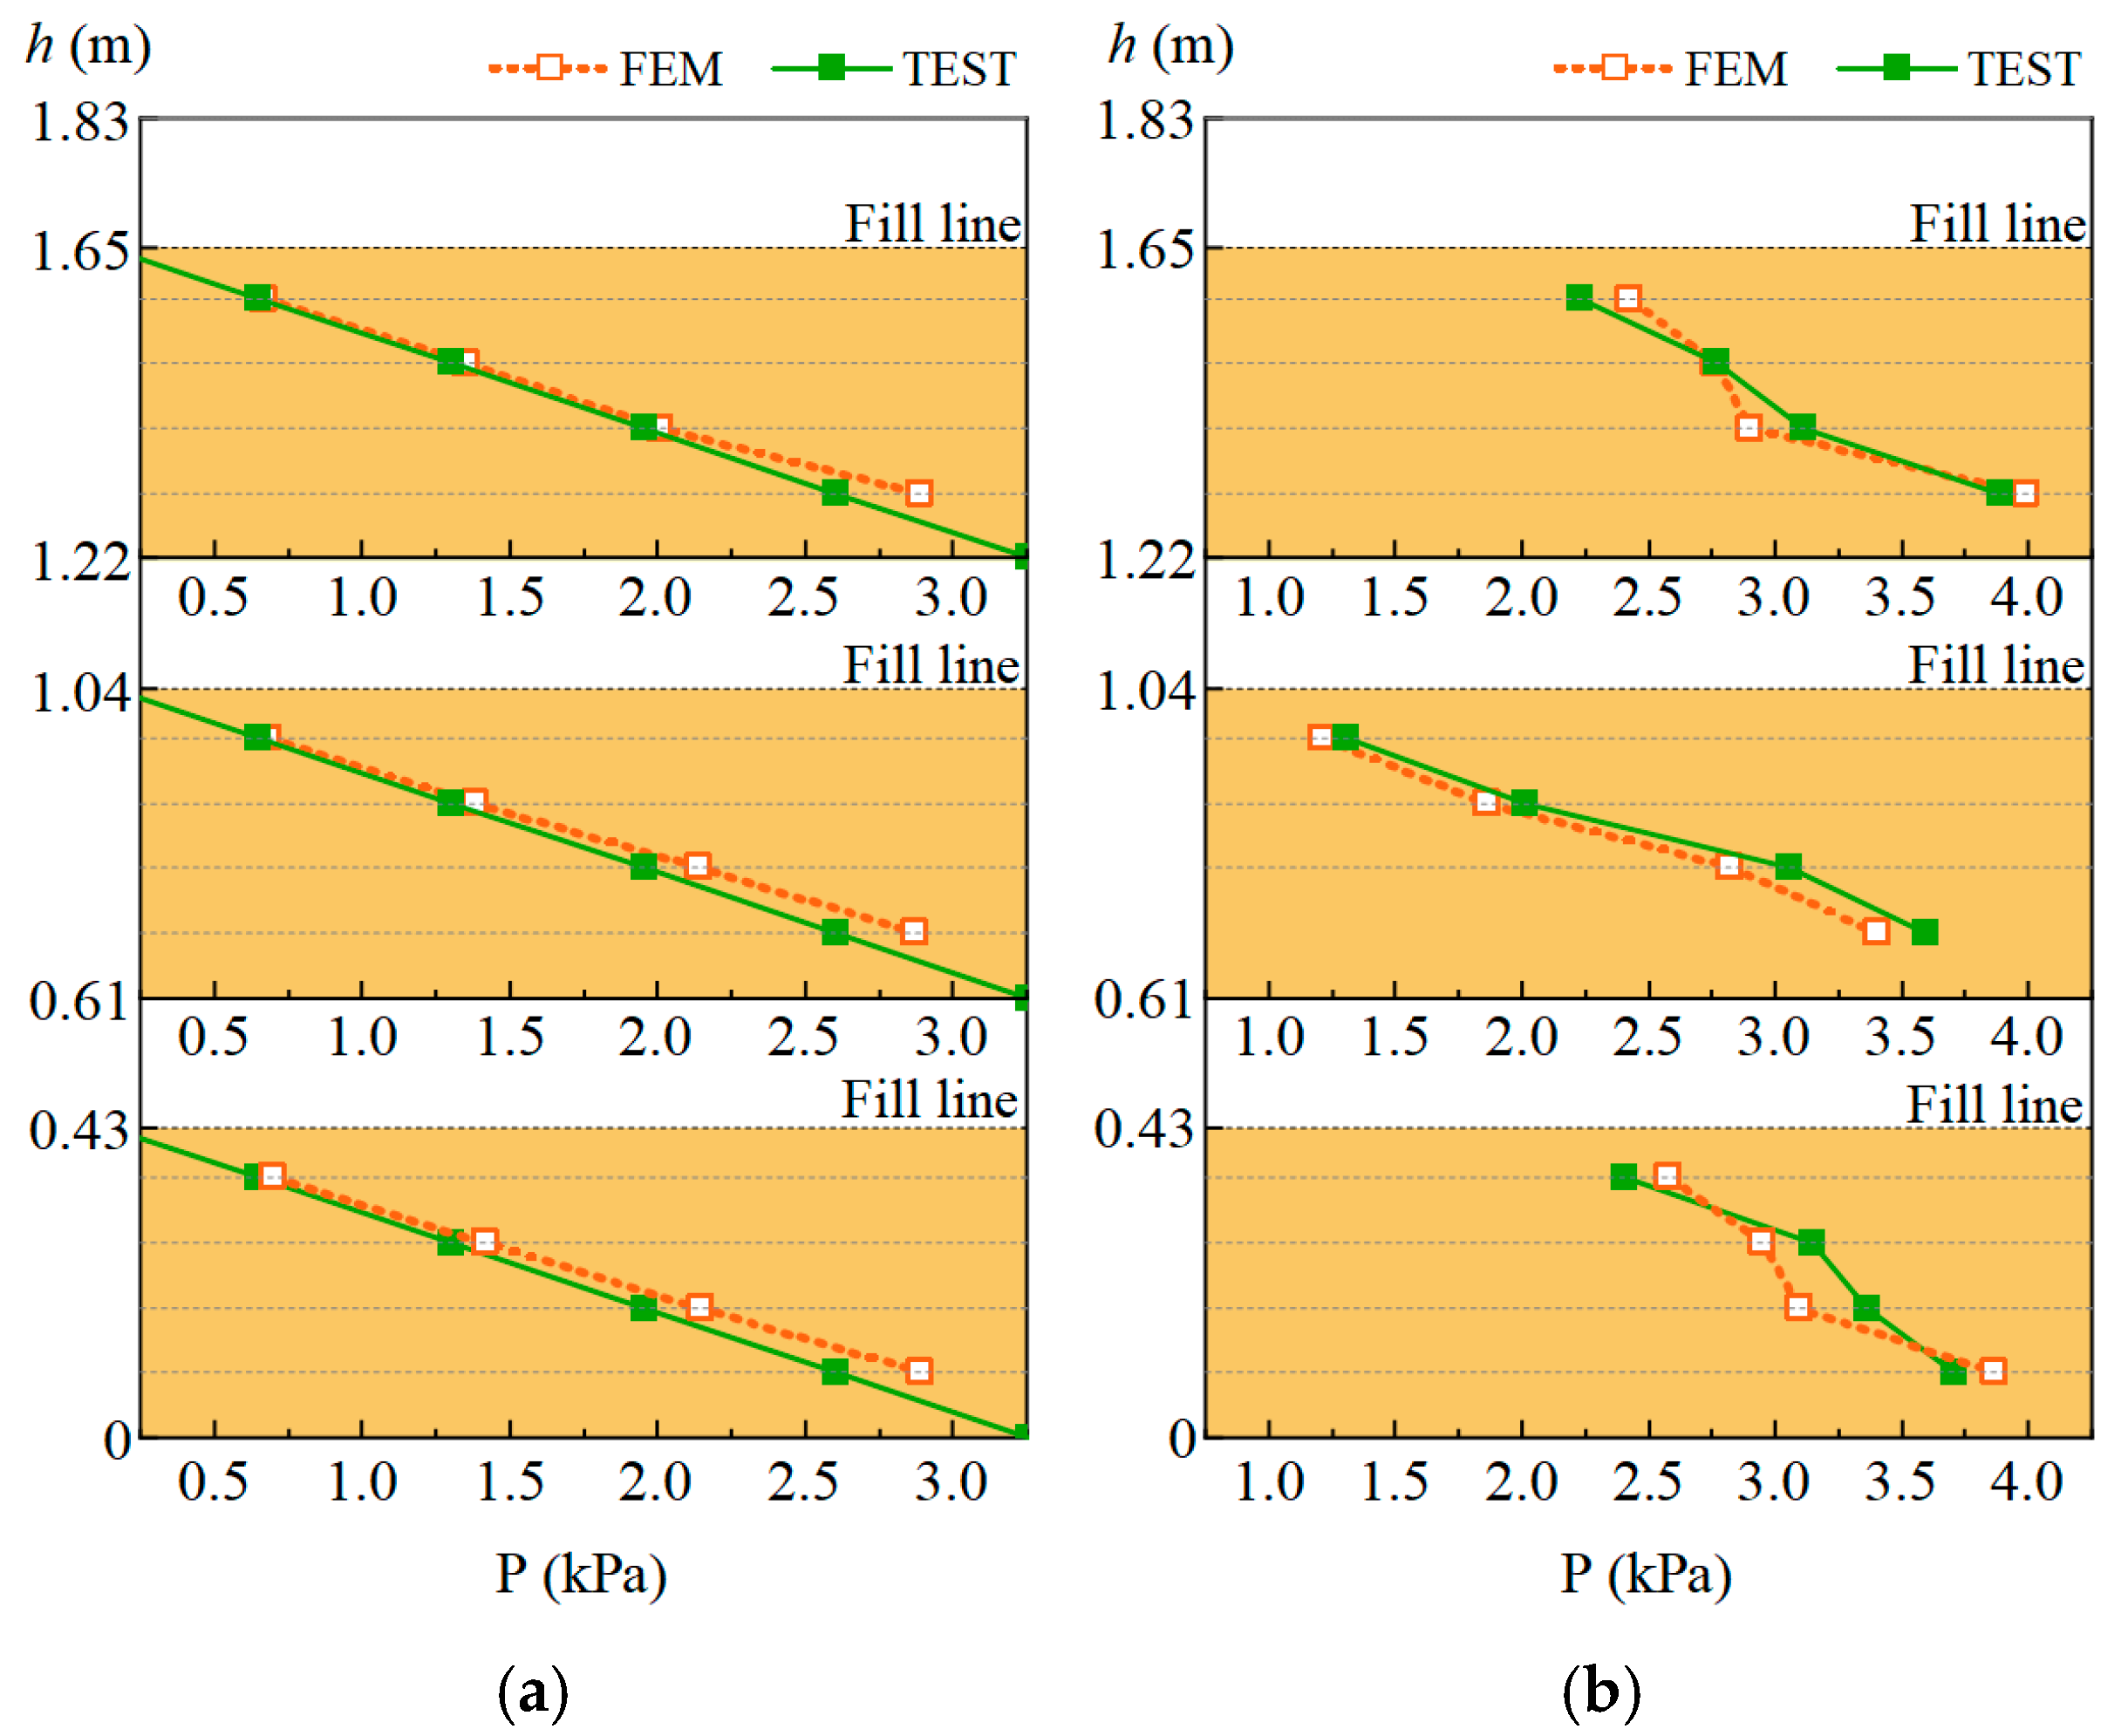
Figure 10a presents the results of the pressure along the height direction of the silo wall in the finite element model under the static load of the full-silo condition, together with the corresponding experimental values. The finite element results exhibit a trend consistent with the test data. The discrepancy between the simulation and test values is greater at deeper burial depths than at shallower depths. The average error in lateral pressure under the static load for all measurement points is calculated to be 7.02%. Figure 10b compares the simulated and experimental peak values of the pressure on the silo wall under the full-silo condition, subjected to El-Centro seismic ground motion with a PGA of 0.40 g. A comparison between the shaking table test and the finite element simulation shows that under seismic loading, the maximum pressure on the silo wall at different floors follows the same distribution trend along the wall height. Owing to variations in the spectral characteristics of different seismic ground motions and the inherent stochasticity of storage itself [26], localized deviations are observed between the simulated and measured dynamic lateral pressure at certain measuring points. The average deviation across all points is 6.17%.
In summary, comparative analyses of the test results and the finite element model demonstrate that the simulated and measured values exhibit strong agreement. This confirms the validity of the simulation model and indicates that the proposed numerical method is suitable for investigating the seismic performance of multi-floor grain warehouses under earthquake excitation.

4. Effects of Storage Conditions on Seismic Response of Multi-Floor Grain Warehouses

This section adopts the design method of the model in the previous section to calculate the seismic response of the bulk grain warehouse structure. Considering the substantial workload and computational cost calculation caused by bulk grain in the physical structure simulation, the model is constructed here according to the size and material properties of the test model structure.

4.1. Comparison of Pressure on Silo Walls

Combined with the Code for Seismic Design of Buildings (GB50011) [25] and the test parameters described in Section 3, three seismic ground motions, namely, artificial ground motion (RG), El-Centro ground motion (El), and Wenchuan ground motion (WC), were selected for the finite element simulation to investigate the seismic response of the structure. The envelope and design response spectral values at the fundamental period of each motion comply with the code requirements. Moreover, the intensity distribution of the three seismic ground motions in the low-frequency band corresponds to the low fundamental frequency of the structure, ensuring that specific harmonic components of the seismic motion match the natural frequency of the structural system, thereby inducing resonance. Figure 11 presents the comparison between the target response spectrum specified in the code and the response spectra of the three selected ground motions with a damping ratio of 5%. The selected motions exhibit strong agreement with the design spectrum within the structural response period, confirming their suitability for assessing the seismic performance of the structure [27,28,29].
The duration of the seismic ground motion was scaled according to the experimental similarity law [13], while the peak accelerations were adjusted based on the similarity coefficient. Three intensity levels were considered: 7-degree fortification (0.10 g), 7-degree rare (0.22 g), and 8-degree rare (0.40 g). The corresponding peak accelerations are shown in Table 3. Figure 12 presents the time–history curves of the three seismic ground motions at a peak ground acceleration of 0.10 g.

4.2. Definition of Storage Conditions in a Multi-Floor Grain Warehouse

According to the dynamic storage configuration of the multi-floor grain warehouse, eight storage conditions were defined to analyze the seismic response of the structure (Figure 13). Yellow-shaded areas in the figure indicate floors containing stored grain. The storage conditions are named based on the sequence of floors and their storage state. For example, in the notation EEF, the first and second floors are empty, while the third floor is fully loaded, where “E” means that the granary is empty and “F” means that the granary is full.

4.3. Natural Frequency

The first three natural frequencies of the finite element model of the multi-floor grain warehouse under various storage conditions are shown in Table 4.
It can be seen from Table 4 that under various storage conditions, the second-order natural frequency is about 10% higher than the first order, and the third order is more than twice that of the first order. The first-order natural frequency along the X-direction is smaller than the second-order natural frequency along the Y-direction, indicating that the stiffness in the X-direction is smaller than that in the Y-direction. The first-order natural frequencies of the storage conditions FEE, FFE, and FFF decrease by 29%, 30%, and 36%, respectively, compared with EEE, indicating that as the mass of the storage increases, the natural frequency decreases nonlinearly. A higher storage position results in a larger damping ratio of the structural model, thereby enhancing the contribution of storage movement to structural damping [12,18].

4.4. Acceleration Response of the Structure

The seismic acceleration response of the multi-floor grain warehouse is closely related to the storage conditions, and different seismic ground motions also influence the structural response due to their distinct spectral characteristics. Figure 14a and Figure 14b show the acceleration time–history curves and Fourier amplitude curves, respectively, for the El-Centro seismic ground motion under the FEE, FFE and FFF storage conditions, with a peak acceleration of 0.40 g. The locations of the acceleration measurement points are shown in Figure 8. By comparing the acceleration time–history curves and Fourier spectral curves of the EEE warehouse and FFF, it is found that the spatial distribution of the storage significantly affects the vibration of the grain warehouse structure. The participation of the storage notably reduces the vibration amplitude of the structure and causes the peak area of the structural spectral curve to shift to the low-frequency range.
Figure 14a shows the distribution of acceleration amplification coefficients of seismic ground motions at the floor positions under the conditions of 0.22 g EEF and 0.40 g FFE for three seismic ground motions. The structural response patterns of different seismic ground motions at the same loading level are similar, and their specific values are closely related to the storage conditions of the structure. To mitigate the influence of different seismic ground motion spectral characteristics on the seismic response of the structure, the average acceleration amplification coefficients of the three seismic ground motions under the same storage condition were taken for analysis and demonstration.
The distributions of the acceleration amplification coefficient at the structural floor positions under eight storage conditions are plotted in Figure 15. Figure 15a corresponds to the EEE and FFF storage conditions, Figure 15b corresponds to the FFE, EFF, and FEF storage conditions, and Figure 15c corresponds to the FEE, EFE, and EEF storage conditions. By comparing the different acceleration amplification conditions, it can be seen that the presence of storage materials significantly reduces the acceleration response of the structure. The magnitude of the peak acceleration and the storage conditions exert a substantial influence on the acceleration response of the structure [15]. Across various storage conditions, the PGA is negatively correlated with the acceleration response. Under the FFF condition, when the PGA is 0.40 g, the acceleration amplification coefficient at the top of the structure is 69.7% of the corresponding parameter when PGA is 0.10 g. The spatial distribution of storage materials within the floor also affects the acceleration of the structure. Under the same volume of storage materials, higher storage positions lead to a more pronounced reduction in the acceleration amplification effect. The storage conditions with the smallest acceleration amplification coefficients for two layers of material piles and one layer of material piles are EFF and EEF, respectively. Under the action of 0.40 g, the acceleration at the top of the structure can be reduced to 52.0% and 58.8% of the EEE condition, respectively.

4.5. Displacement Response of the Structure

The displacement response of the structure under various storage conditions is directly related to the volume and location of the stored materials, as well as to the frequency spectrum of the seismic ground motion and other characteristics. For each storage condition, the average value of the structural displacement response derived from three seismic ground motions with the same peak acceleration was calculated, and the maximum relative displacement distribution across the floors of the grain warehouse under various storage conditions was plotted (Figure 16). The displacement measurement points correspond to those used for acceleration measurement in Section 4.3.
As shown in Figure 16, the relative displacement of the structure under various storage conditions increases progressively from the first to the third floor. The maximum displacement of the third floor (top floor) of the structure occurs under the EEF, EFF, and FFF conditions under 0.10 g, 0.22 g, and 0.40 g earthquakes, respectively. The nonlinear behavior of the storage material significantly affects the displacement response of the structure to varying degrees at different earthquake intensity levels and spatial positions. The maximum displacement response of the second floor is observed under the FEF condition, with peak displacements of 7.03 mm, 17.02 mm, and 29.98 mm under 0.10 g, 0.22 g, and 0.40 g earthquakes, respectively. Under this condition, an empty warehouse on the given floor, combined with full warehouses on the adjacent upper and lower floors, induces significant changes in the displacement response of the structure. The discontinuity of the storage space of the structure enhances the likelihood of higher-order vibration modes of the structure, thereby generating a large torsional effect. Moreover, the greater the peak acceleration of the earthquake, the more pronounced the torsional effect is relative to other storage conditions. The displacement response of the first floor of the structure is less influenced by the storage condition when the earthquake intensity is small (0.10 g). As the earthquake action increases, the influence of the storage condition on the displacement response becomes progressively more significant. The maximum displacement response under 0.22 g and 0.40 g earthquakes is observed under the EFF storage condition. The presence of stored materials in the upper portion of a floor substantially amplifies the displacement response of that floor.
The storage height in the multi-floor grain warehouse, the continuity of vertical storage across floors, and the intensity of seismic excitation influence the displacement response of the structure. To comprehensively reflect structural stiffness, stability, and degree of damage, the maximum inter-story displacement angle in the direction of the seismic ground motion under various storage conditions is derived from the distribution of the average displacement (Figure 16).
As shown in Figure 17, the drift ratio response of the structure gradually increases with the increase in earthquake intensity. When the input earthquake intensity is small (0.10 g), the drift ratios of different storage conditions remain small and exhibit a uniform variation along the floor height. When the earthquake intensity is large (0.40 g), the drift ratios of different floors are affected by the storage conditions, resulting in highly nonlinear distribution. When the seismic ground motion PGA values are 0.1 g, 0.22 g, and 0.40 g, the maximum drift ratio of the top floor occurs under the FEF, EEE, and FEE conditions, respectively, while that of the second floor occurs under the EEE, EEF, and FEF conditions, respectively. The critical working condition corresponding to the first floor is consistently the EFF condition.
Combined with the analysis of the displacement and drift ratio response of the structure, the observed regular characteristics are directly related to the excitation of higher-order vibration modes in the structure under high-intensity earthquakes. In engineering applications, material storage solely on upper floors should be avoided to prevent the structure from developing significant torsional effects due to grain loads under similar conditions.

4.6. Pressure on Silo Walls of the Structure

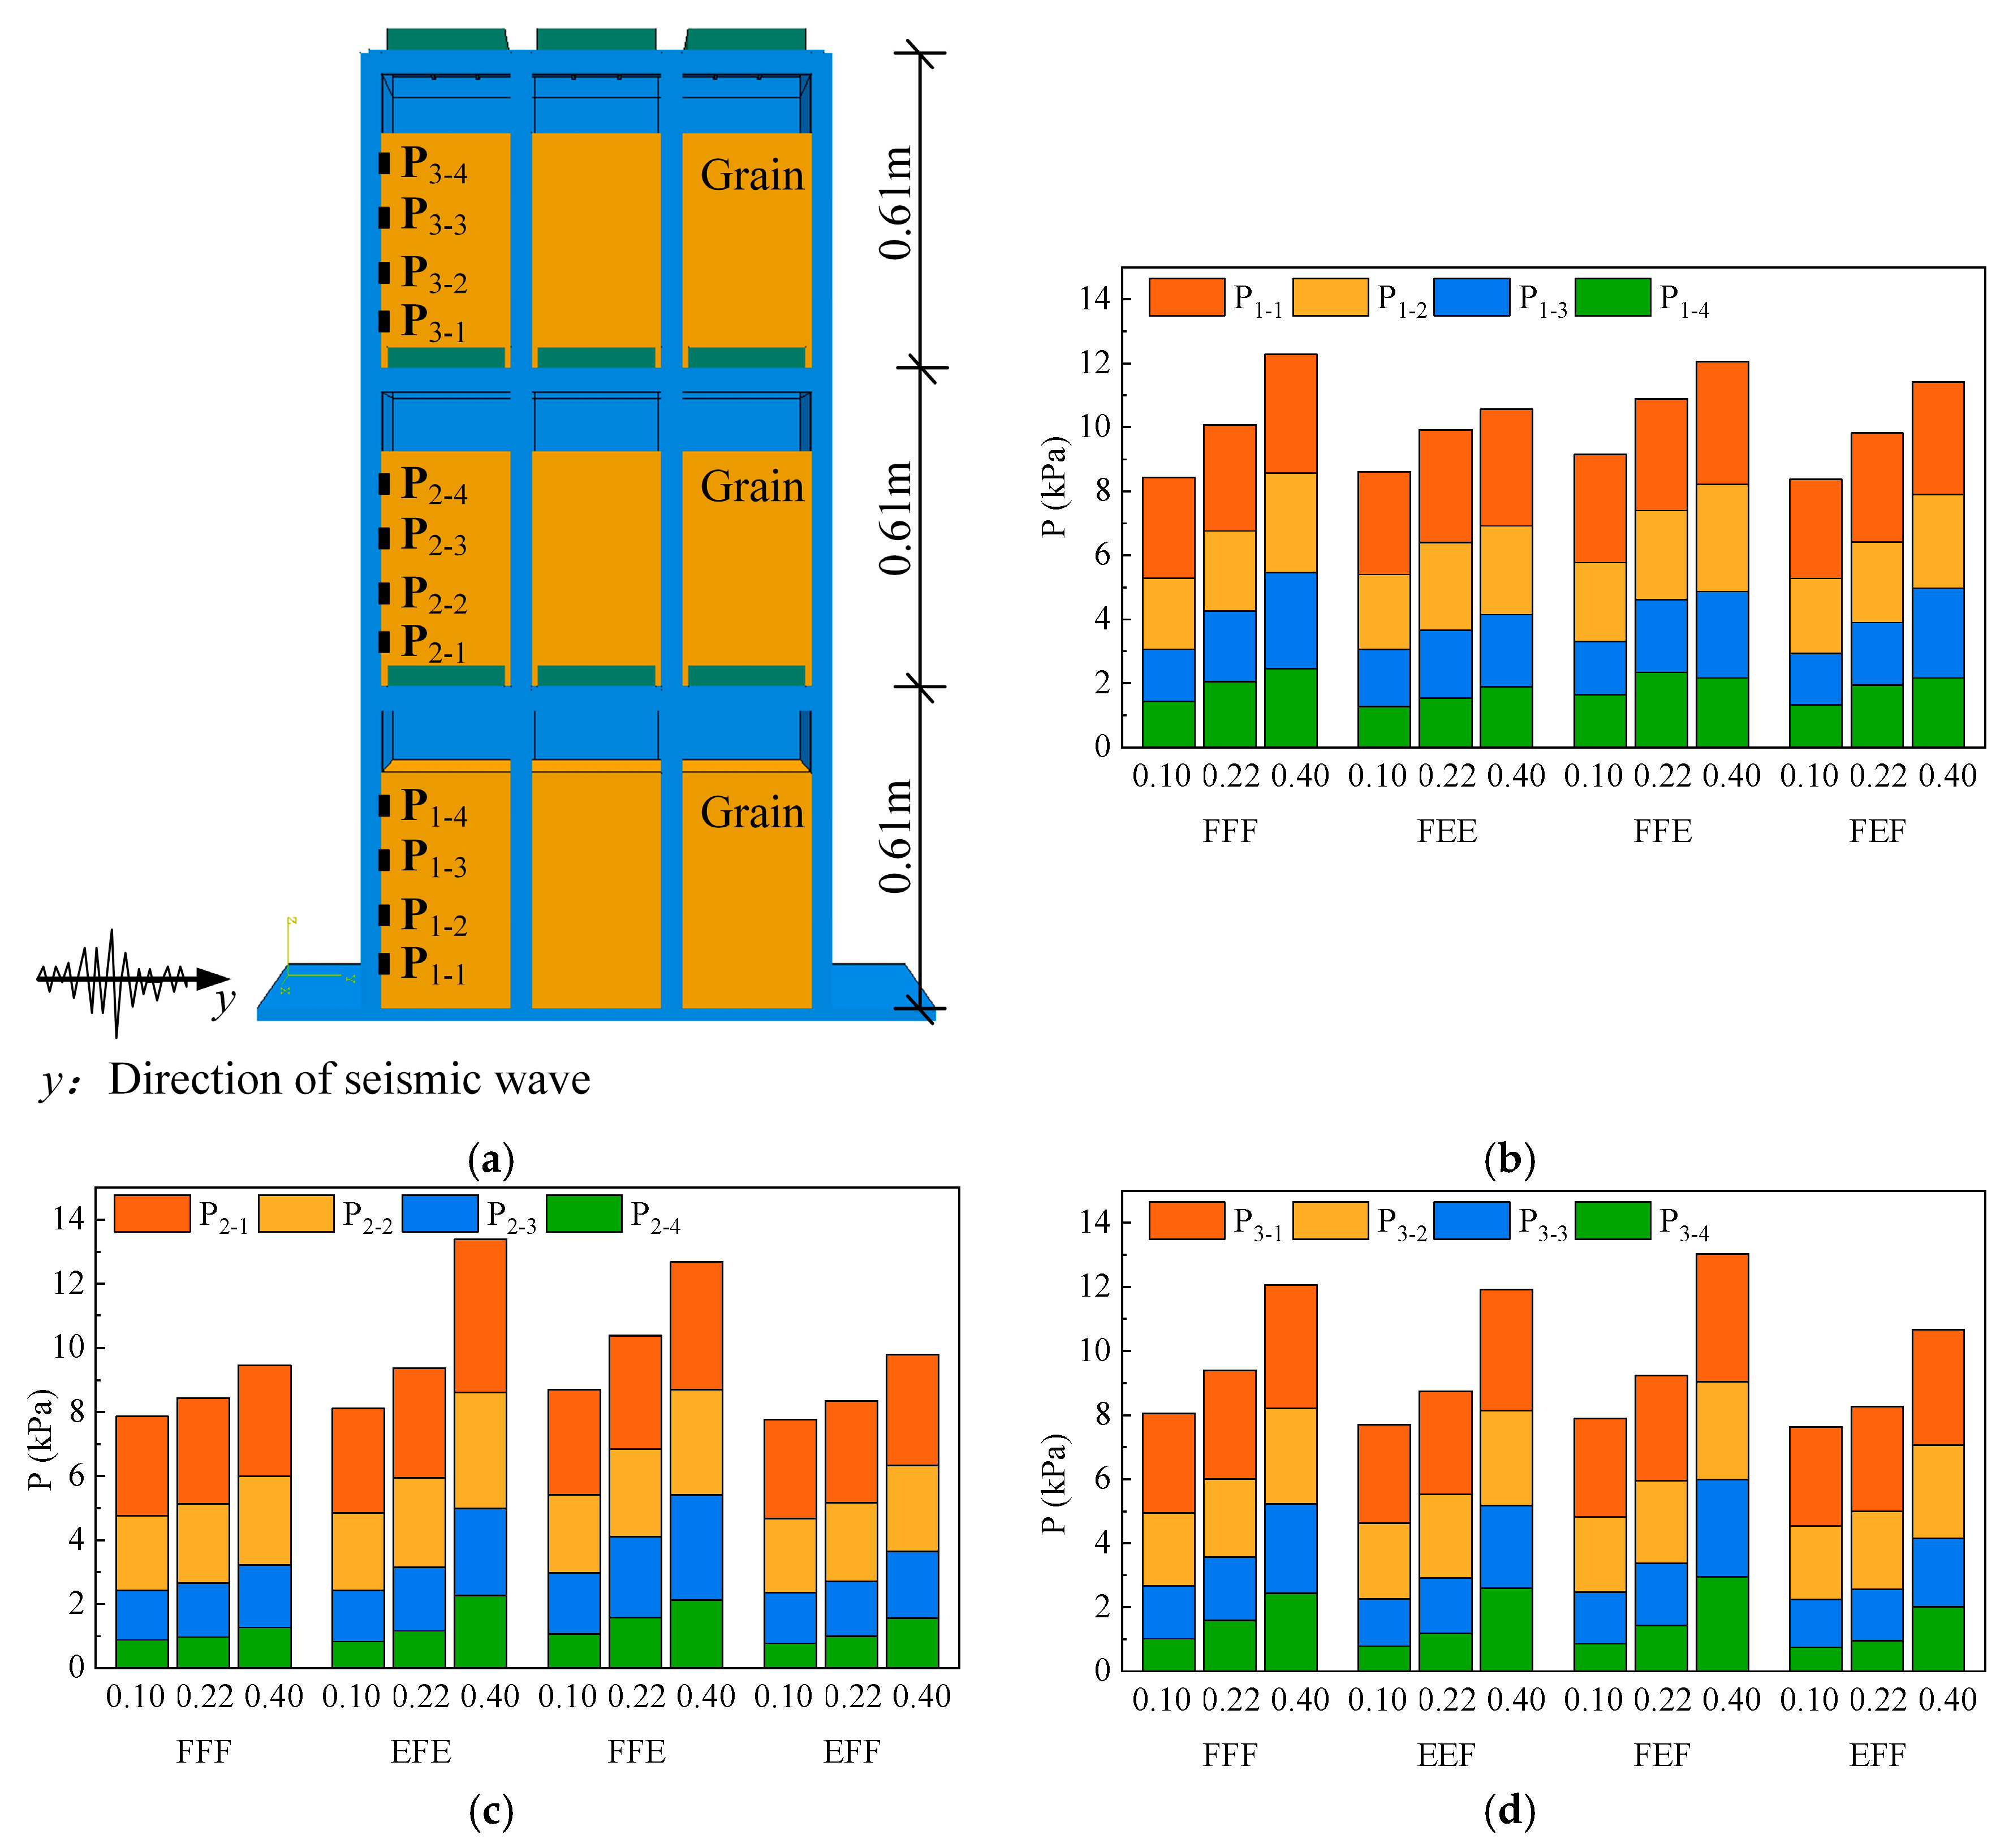
The research focus regarding the pressure of the multi-floor grain warehouse is the section of the silo wall at buried depths of 0.09 m, 0.18 m, 0.27 m, and 0.36 m on different floors (Figure 18a). The mean value of the silo wall pressure response under the same PGA for three seismic ground motions is calculated to obtain the peak distribution curve of pressure at different heights of the structure, as shown in Figure 18. As can be seen from Figure 18, the pressure at the same position on the silo wall exhibits a significantly increasing trend with the increase in seismic ground motion intensity. The pressure peaks at different positions on the same floor increase progressively with the buried depth of the stored material, and the maximum pressure position occurs at the lowest position of the silo wall on the floor. The main reason for the appearance of discontinuities in individual floors is the complex coupling of the nonlinear behavior and random behavior of the stored material under different storage conditions and different acceleration peaks [9,15,16,17].
The dangerous working conditions of the structure here (excluding the FFF working condition) are defined by the cumulative peak values of the silo wall pressure at different heights. Floors 1–3 correspond to the dangerous working conditions of FFE, EFE, and FEF, respectively. The peak pressure under the dangerous working conditions is compared to that under the FFF working condition and the static-load pressure, as illustrated in Figure 19. Due to the combined effects of PGA and differences in storage configurations, the overall trend of the pressure distribution at different burial depths under earthquake action shows a highly nonlinear change trend. A higher PGA results in greater pressure on the silo wall. The overpressure coefficient is defined as the ratio of the pressure on the silo wall under seismic loading to that under static storage conditions. Under the action of 0.1 g, 0.22 g, and 0.40 g earthquakes, the maximum overpressure coefficients at the Pi-1 position at the bottom of the silo wall on different floors are 1.13, 1.21, and 1.66, respectively. The overpressure coefficient of the silo wall is proportional to the PGA of the earthquake action. The greater the peak acceleration of the earthquake, the more obvious the overpressure phenomenon of the silo wall [9,15,27,28,29,30,31,32,33].

5. Conclusions

In this study, a numerical analysis was conducted to investigate the seismic performance of a multi-floor grain warehouse under various storage conditions. The results and conclusions of this study are summarized below:
(1)
An increase in the mass of the storage materials leads to a decrease in the natural frequency. The first-order natural frequencies of the FEE, FFE, and FFF storage conditions are reduced by 29%, 30%, and 36%, respectively, compared with EEE. A higher storage position results in a large damping ratio of the structural model, indicating a more pronounced contribution of storage material movement to overall structural damping.
(2)
The intensity of earthquake action is negatively correlated with the acceleration response of the structure. Under the FFF condition, when the PGA is 0.4 g, the acceleration amplification coefficient at the top of the structure is 69.7% of the corresponding parameter when PGA is 0.10 g. The higher the storage floor of the material, the more significant the reduction in structural acceleration. Under 0.40 g earthquake action, the acceleration amplification factors of two layers of material under EFF and one layer of material under EEF are 52.0% and 58.8% of those under the EEE condition, respectively.
(3)
The discontinuity of the storage space within the structure increases the possibility of higher-order vibration modes, resulting in a torsional effect on the structure. When the PGA is 0.22 g, the peak drift ratio of the first floor in the EFF condition is 1.7 times that of the FEE, while under a PGA of 0.40 g, the peak drift ratio of the second floor in the FEF condition is 1.5 times that in the FFE condition.
(4)
The distribution of silo wall pressure at varying burial depths under seismic excitation exhibits a pronounced nonlinear trend, and the overpressure coefficient at the same burial depth of the warehouse wall is directly proportional to the PGA of the earthquake. Under 0.1 g, 0.22 g, and 0.40 g seismic action, the maximum overpressure coefficients at the Pi-1 position at the bottom of the warehouse wall on different floors are 1.13, 1.21, and 1.66, respectively.
Based on the findings of this study, it is suggested that the storage conditions of bulk grain exert a substantial influence on the dynamic response of multi-floor grain warehouses. Although stored grain acts as a damping agent that mitigates vibration during structural vibration, it may simultaneously induce significant overpressure, thereby affecting the distribution pattern of the structure’s dynamic response. The insights into the seismic performance of multi-floor grain warehouses under various storage conditions provide quantitative guidance for engineering design.

Author Contributions

All authors listed have made a substantial, direct, and intellectual contribution to the work and approved it for publication. Collection of Data: G.W. and Y.Z.; Writing—Original Draft: H.W., G.W. and Y.D.; Visualization: H.W., Y.D. and Q.X.; Writing—Reviewing and Editing: H.W., Y.D. and Q.X.; Resources: Y.D. and Q.X.; Supervision: H.W. All authors have read and agreed to the published version of the manuscript.

Funding

This paper was supported by the Natural Science Project of Henan Provincial Department of Science and Technology (232102320186) and the Open Project of Henan Key Laboratory of Grain and Oil Storage Facility and Safety (2022KF02).

Institutional Review Board Statement

Not applicable.

Informed Consent Statement

Not applicable.

Data Availability Statement

The original contributions presented in this study are included in the article. Further inquiries can be directed to the corresponding author.

Conflicts of Interest

The authors declare no conflicts of interest.

References

  1. China News Service. Shenzhen Longgang Xikeng to Build the Nation’s “Tallest” Granary; China News Service: Beijing, China, 2024. [Google Scholar]
  2. GB50320-2014; Code for Design of Grain Storehouse. China Planning Press: Beijing, China, 2014.
  3. Xu, J.; Lv, J.; Bai, C.; Tang, P.A.; Guo, C.; Zhang, L.L. Advances in Research and Application of Modified Atmosphere in the Control of Stored Grain Pests. J. Chin. Cereals Oils Assoc. 2017, 38, 21–28, (In Chinese with English Abstract). [Google Scholar]
  4. Wang, S.X.; Fu, P.C.; Liu, S.Q.; Ye, Z.H.; Zeng, L.P.; Jiang, Z.X. Current Situation and Prospect of Application and Development of Low-Temperature Grain Storage Technology in China. J. Chin. Cereals Oils Assoc. 2023, 38, 215–224. [Google Scholar]
  5. Li, Z.; Ding, Y.; Zhao, J.; Guo, C.; Xu, Z.; Xu, Q.; Ren, G.; Liu, H. Experimental study on spatial joint of prefabricated steel reinforced concrete multi-floored grain warehouse. J. Build. Eng. 2025, 103, 112001. [Google Scholar] [CrossRef]
  6. Wang, L.; Xu, Q.; Liu, Y. Simple analysis of the current status and development of bulk grain building warehouses. Grain Distrib. Technol. 2013, 4, 9–11, (In Chinese with English Abstract). [Google Scholar]
  7. Zhang, Q.; Qiu, X.; Wang, Z. Column space analysis of multi-storied warehouse with bulk grain based on economy. J. Henan Univ. Technol. 2016, 37, 107–113, (In Chinese with English Abstract). [Google Scholar]
  8. Zhang, Q.; Qiu, X.; Wang, Z. Mechanical characteristics and structure type selection of multi-storied warehouse with bulk grain. J. Henan Univ. Technol. 2016, 37, 111–115, (In Chinese with English Abstract). [Google Scholar]
  9. Durmuş, A.; Livaoglu, R. A simplified 3 DOF model of A FEM model for seismic analysis of a silo containing elastic material accounting for soil–structure interaction. Soil Dyn. Earthq. Eng. 2015, 77, 1–14. [Google Scholar] [CrossRef]
  10. Tremblay, R.; Mitchell, D.; Tinawi, R. Damage to industrial structures due to the 27 February 2010 Chile earthquake. Can. J. Civ. Eng. 2013, 40, 735–749. [Google Scholar] [CrossRef]
  11. Gu, Z.; Liu, C. Vulnerability analysis of the grain multi-storied warehouse under earthquake load. J. Water Resour. Archit. Eng. 2022, 20, 209–215, (In Chinese with English Abstract). [Google Scholar]
  12. Xu, Q.; Shi, Z.; Liu, Q.; Ding, Y.; Ren, G. Dynamic characteristics of granular grain building warehouse under different storage conditions. Trans. Chin. Soc. Agric. Eng. 2023, 39, 272–278, (In Chinese with English Abstract). [Google Scholar]
  13. Xu, Q.; Zhang, R.; Liu, Q.; Cao, L.; Ding, Y.; Wang, H. Dynamic lateral pressure analysis of granular grain building warehouse walls under seismic effects. Trans. Chin. Soc. Agric. Eng. 2024, 40, 49–58, (In Chinese with English Abstract). [Google Scholar]
  14. Sun, W.; Qi, F.; Yuan, J.; Cao, Y.; Wang, L.; Zhou, L.; Wu, Y.; Feng, J. Structural behavior of stiffened steel silos subject to eccentric discharge pressures. Stored Prod. Res. 2025, 114, 102741. [Google Scholar] [CrossRef]
  15. Xu, Y.; Quan, C.; Li, R.; Wang, W.; Hua, Y.; Yang, H. Measurement of static and dynamic normal stress of granular materials in silos. Measurement 2025, 252, 117335. [Google Scholar] [CrossRef]
  16. Pinilla, A.; Fuentes, J.M.; Ayuga, F.; Gallego, E. Experimental Measurements in a Model Silo with Eccentric Hoppers. Powder Technol. 2025, 467, 121514. [Google Scholar] [CrossRef]
  17. Dornelas, K.C.; Soares Rodrigues, H.C.; Gandia, R.M.; Gomes, F.C.; Nascimento, J.W.B.D. Pressures Measurements of Maize Grain in Cylindrical Steel Silos and Comparison with Different International Standards. J. Stored Prod. Res. 2024, 108, 102391. [Google Scholar] [CrossRef]
  18. Ding, Y.; Sun, Q.; Liu, Q.; Xu, Q. Experimental study on dynamic lateral pressure of vertical grain silo during layered unloading. J. Henan Univ. Technol. 2022, 43, 113–120, (In Chinese with English Abstract). [Google Scholar]
  19. Chen, Y.; Lv, Y.; Wu, K.; Huang, X.; Shi, Y.-D. Special-Shape Similitude Law of a Soil-pile–Structure Model for Centrifuge Shaking Table Tests. Ocean Eng. 2023, 286, 115682. [Google Scholar] [CrossRef]
  20. Khalil, M.; Ruggieri, S.; Tateo, V.; Butenweg, C.; Nascimbene, R.; Uva, G. Assessment of the seismic overpressure in flat bottom steel silos based on advanced FE modelling approach. Soil Dyn. Earthq. Eng. 2025, 190, 109149. [Google Scholar] [CrossRef]
  21. Dornelas, K.C.; Rodrigues, H.C.S.; Cheung, A.B.; Junior, C.C.; Nascimento, J.W.B. Pressures in squat steel silo with flat bottom storing maize grain. Stored Prod. Res. 2024, 109, 102424. [Google Scholar] [CrossRef]
  22. Demir, A.D.; Livaoglu, R. Simplified seismic response model for a bulk solid-silo-embedded foundation/soil system. Soil Dyn. Earthq. Eng. 2023, 165, 107664. [Google Scholar] [CrossRef]
  23. Jing, H.; He, W.; Yang, J. Test on dynamic interaction of soybean storage and steel silo model. J. Henan Univ. Sci. Technol. 2023, 44, 84–92, (In Chinese with English Abstract). [Google Scholar]
  24. Demir, A.D.; Livaoglu, R. SSI effects on seismic response of RC flat-bottom circular silos. Structures 2023, 57, 105296. [Google Scholar] [CrossRef]
  25. GB/T50011-2010 CS; Code for Seismic Design of Buildings. China Building Industry Press: Beijing, China, 2024.
  26. Goodey, R.J.; Brown, C.J.; Rotter, J.M. Verification of a 3-dimensional model for filling pressures in square thin-walled silos. Eng. Struct. 2003, 25, 1773–1783. [Google Scholar] [CrossRef]
  27. Furinghetti, M.; Mansour, S.; Marra, M.; Silvestri, S.; Lanese, I.; Weber, F.; Pavese, A. Shaking table tests of a full-scale base-isolated flat-bottom steel silo equipped with curved surface slider bearings. Soil Dyn. Earthq. Eng. 2024, 176, 108321. [Google Scholar] [CrossRef]
  28. Fullard, L.A.; Godfrey, A.J.R.; Manaf, M.F.; Davies, C.E.; Cliff, A.; Fukuoka, M. Mixing experiments in 3D-printed silos; the role of wall friction and flow correcting inserts. Adv. Powder Technol. 2020, 31, 1915–1923. [Google Scholar] [CrossRef]
  29. Mehretehran, A.M.; Maleki, S. Axial buckling of imperfect cylindrical steel silos with isotropic walls under stored solids loads: FE analyses versus Eurocode provisions. Eng. Fail. Anal. 2022, 137, 106282. [Google Scholar] [CrossRef]
  30. Brunesi, E.; Nascimbene, R.; Pagani, M.; Beilic, D. Seismic performance of storage steel tanks during the May 2012 Emilia, Italy, earthquakes. J. Perform. Constr. Facil. 2015, 29, 04014137. [Google Scholar] [CrossRef]
  31. Nateghi, F.; Yakhchalian, M. Seismic behavior of silos with different height to diameter ratios considering granular material structure interaction. Int. J. Eng. 2012, 25, 27–37. [Google Scholar] [CrossRef]
  32. Silvestri, S.; Mansour, S.; Marra, M.; Distl, J.; Furinghetti, M.; Lanese, I.; Hernández-Montes, E.; Neri, C.; Palermo, M.; Pavese, A.; et al. Shaking table tests of a full-scale flat-bottom manufactured steel silo filled with wheat: Main results on the fixed-base configuration. Earthq. Eng. Struct. Dyn. 2022, 51, 169–190. [Google Scholar] [CrossRef]
  33. Hu, Q.; Zhang, X.; Hao, H. Overpressure rise rate prediction method for hydrogen-air explosions in vented silos. Gas Sci. Eng. 2025, 136, 205565. [Google Scholar] [CrossRef]
Figure 1. Real multi-floor grain warehouse scene (photo by the author).
Applsci 15 09128 g001
Figure 2. Finite element modeling of multi-floor grain warehouse: (a) Three-dimensional modeling of structure. (b) Model structural section.
Applsci 15 09128 g002
Figure 3. Plastic potential surface of a linear Drucker–Prager model.
Applsci 15 09128 g003
Figure 4. Modeling configuration of multi-floor grain warehouse: (a) Boundary constraints of model. (b) Mesh discretization of structure. (c) Mesh discretization of storage material.
Applsci 15 09128 g004
Figure 5. Structural details of test model: (a) Plan view of model structure (unit: mm). (b) Y-direction elevation of full silo. (c) X-direction elevation of empty silo.
Applsci 15 09128 g005
Figure 6. The first three vibration modes of the multi-floor grain warehouse (empty silo) under the fixed-base condition: (a) The first-order vibration mode. (b) The second-order vibration mode. (c) The third-order vibration mode.
Applsci 15 09128 g006
Figure 7. The first three vibration modes of the multi-floor grain warehouse (full silo) under the fixed-base condition: (a) The first-order vibration mode. (b) The second-order vibration mode. (c) The third-order vibration mode.
Applsci 15 09128 g007
Figure 8. Acceleration amplification factor distribution under El-Centro ground motion (PGA = 0.2 g).
Applsci 15 09128 g008
Figure 9. The acceleration extraction position.
Applsci 15 09128 g009
Figure 10. Pressure on the silo wall under full-silo condition: (a) Static pressure. (b) Pressure of 0.40 g under El-Centro ground motion.
Applsci 15 09128 g010
Figure 11. Basic properties of seismic ground motions: (a) Acceleration response spectrum (0.1 g). (b) Frequency response spectrum.
Applsci 15 09128 g011
Figure 12. Seismic ground motion acceleration time–history curves (PGA = 0.1 g): (a) El-Centro ground motion. (b) Wenchuan ground motion. (c) Artificial ground motion.
Applsci 15 09128 g012
Figure 13. Schematic of various storage conditions.
Applsci 15 09128 g013
Figure 14. Acceleration-dependent response under various storage conditions: (a) Acceleration time−history curves. (b) Acceleration Fourier curves. (c) Distribution of acceleration magnification factor.
Applsci 15 09128 g014
Figure 15. Envelope of the average amplification factor of acceleration at the top of multi-floor grain warehouse for various storage conditions (0.10 g, 0.22 g, and 0.40 g): (a) Empty silo (EEE) and full silo (FFF). (b) Full silo on two floors. (c) Full silo on one floor.
Applsci 15 09128 g015
Figure 16. Distribution of the average displacement of multi-floor grain warehouse for various storage conditions: (a) 0.1 g; (b) 0.22 g; (c) 0.40 g.
Applsci 15 09128 g016
Figure 17. Distribution of the average drift ratio of a multi−floor grain warehouse for various storage conditions (0.10 g, 0.22 g, and 0.40 g): (a) 0.1 g; (b) 0.22 g; (c) 0.40 g.
Applsci 15 09128 g017
Figure 18. Dynamic lateral pressure for different positions of the silo wall: (a) Location of lateral pressure. (b) First floor. (c) Second floor. (d) Third floor.
Applsci 15 09128 g018
Figure 19. Dynamic lateral pressure for each floor of the silo wall under various storage conditions: (a) First floor. (b) Second floor. (c) Third floor.
Applsci 15 09128 g019
Table 1. Values of material parameters for simulated storage.
Mass DensityModulus of ElasticityPoisson’s RatioFlow Stress RatioDampInternal Friction AngleFriction Between CBPs and PMMA
ρ/(kg/m3)E/MPaνκcφμ
134620.30.8410.515°0.27
Table 2. Self-oscillation frequency of the multi-floor grain warehouse under various storage conditions (Hz).
Vibration PatternEmpty SiloFull Silo
123123
FEM10.8511.69 36.066.867.4421.55
TEST10.31--7.34--
Table 3. Basic information of seismic ground motions’ peak ground acceleration (PGA).
Seismic IntensityPGA (g = 10 m/s2)PGA of Actual Input (g)
7-degree fortification0.10 g0.15 g
7-degree rare0.22 g0.33 g
8-degree rare0.40 g0.6 g
Table 4. Natural frequencies of finite element model under various storage conditions (Hz).
Vibration ModeStorage Conditions
EEEFEEFFEFFFFEFEEFEFFEFE
110.857.697.516.867.968.157.638.56
211.698.439.887.4410.558.788.2211.05
336.0625.4024.4921.5526.6726.2323.8627.32
Disclaimer/Publisher’s Note: The statements, opinions and data contained in all publications are solely those of the individual author(s) and contributor(s) and not of MDPI and/or the editor(s). MDPI and/or the editor(s) disclaim responsibility for any injury to people or property resulting from any ideas, methods, instructions or products referred to in the content.