Article

Study on Detection Technology for High-Speed Railway Slope Sliding Surface Based on Complex Observation of Electrical Resistivity Tomography

1
Department of Electronic Engineering, Guangxi University of Science and Technology, Liuzhou 545616, China
2
China Water Resources Pearl River Planning, Surveying & Designing Co., Ltd., Guangzhou 510610, China
*
Author to whom correspondence should be addressed.
Appl. Sci. 2025, 15(16), 9091; https://doi.org/10.3390/app15169091
Submission received: 13 July 2025 / Revised: 15 August 2025 / Accepted: 15 August 2025 / Published: 18 August 2025

Abstract

Slope landslide risk presents a critical challenge throughout high-speed railway construction and operation. Precise detection of sliding surfaces is essential for disaster prevention. This study develops an electrical detection method using complex electrode arrays, specifically addressing high-speed railway slope exploration constraints including confined spaces, significant investigation depths, and complex terrain. Numerical simulations analyzed the electric field distribution characteristics of power supply electrodes under various spatial constraints (half-space and full-space), revealing resolution differences between power supply combinations for target areas. Further comparative numerical modeling demonstrated that complex electrode arrays significantly enhance imaging quality over simple arrays in complex terrain. Finally, field validation confirmed the high reliability of complex observation systems for detecting slip surfaces along high-speed railway slopes. Therefore, under complex terrain conditions, utilizing complex observation systems to acquire multi-dimensional spatial data, integrated with topography-incorporated inversion technology, enables precise slip surface detection. This approach provides a reliable method for geological hazard mitigation in high-speed railway operations.

1. Introduction

Slope structures are essential components of high-speed railway construction, making landslide risk a critical factor that cannot be neglected during both the construction and operation phases. Statistics indicate that landslides account for approximately 70% of all geological disasters [1]. In general, landslide occurrences are associated with external environmental changes, with variations in slope moisture content recognized as the primary cause of slope instability [2,3,4]. As a form of passenger transportation infrastructure, high-speed railways are particularly vulnerable, with landslides posing significant threats to life and property [5,6]. Therefore, in the operation and maintenance of high-speed railways, it is especially important to develop precise detection technologies for slope sliding surfaces to provide a reliable data basis for geological disaster early warning and mitigation, thereby ensuring operational safety. With advancements in applied geophysics and computational science, slip surface detection has evolved from traditional drilling methods to physical detection techniques based on differences in medium properties. This shift has greatly improved detection efficiency, expanded coverage, and promoted the transition from conventional inspection to intelligent monitoring of slope-related disasters [7,8]. Commonly used geophysical methods for detecting slip surfaces include seismic exploration, electrical resistivity, and ground-penetrating radar. Among these, the resistivity method—based on the resistivity contrast between the slip surface and the overlying loose body—is the most widely applied and has yielded excellent results [9,10].
In its natural state, the shear strength of a high-speed railway slope exceeds its self-weight, thereby maintaining equilibrium. However, when external environmental factors such as rainfall, earthquakes, or construction activities occur, the internal stress state of the slope changes, potentially leading to instability and, in severe cases, downward sliding [11,12,13]. There is a quantifiable relationship between the resistivity of the sliding surface and the stress level. Wang et al. [14] demonstrated through rock shear tests that the resistivity of saturated rock changes significantly along the sliding surface—decreasing as stress increases and reaching its minimum when stress is fully released. The slip surface typically consists of a waterproof layer and a weathered layer. In applied geophysical studies, the dielectric resistivity of such layers generally ranges between 100 and 200 Ω•m [15].
The sliding surface formed by slope deformation typically exhibits low resistivity relative to the overlying and underlying layers. Numerous studies have leveraged this characteristic to detect the sliding surfaces. Zhuo et al. [16] applied high-density resistivity methods to open-pit mine slopes and found the detection results to be of great significance for evaluating slope stability. Rahmani et al. [17] employed the Schlumberger configuration of the resistivity method to investigate the characteristics of sliding surfaces in wavy terrains. Their findings indicated that the sliding surface generally has a dip angle of approximately 40° and a burial depth of around 14 m. Additionally, Maniruzzaman et al. [18] used the Wenner array resistivity method and self-potential method, supplemented with other surveying techniques, to study landslides and slope deformations triggered by heavy rainfall. Their research revealed a strong intrinsic correlation between slope stability and resistivity. Juwono et al. [19] applied a Wenner–Schlumberger composite array to investigate ground fissures and landslides, demonstrating that the combination of these two configurations has promising applications in geological disaster investigations. Furthermore, Tsai et al. [20,21] conducted long-term monitoring in landslide-prone areas using a complex well-to-surface observation method with a non-traditional hybrid apparatus. By analyzing temporal and spatial resistivity changes along with hydrogeological conditions, they found that resistivity variations correlated with slope water saturation. Notably, layers with increasing or decreasing resistivity were observed prior to sliding events, suggesting that resistivity-based monitoring can play a critical role in early landslide warning. Erginal et al. [22] combined geochemical analysis with 2D electrical resistivity tomography (ERT) to investigate the nature of slip surfaces and subsurface structures. Their study clearly identified the landslide’s upper boundary and internal composition and concluded that the new landslide was a secondary evolution of a previous one. Other studies have also integrated ERT with borehole drilling to map slip surfaces, providing valuable scientific data for landslide mitigation [23,24,25].
In resistivity surveys, undulating terrain can significantly impact detection results. If terrain effects are not properly corrected, local false anomalies may arise [26,27,28]. Device type also influences detection effectiveness. An ideal configuration should offer high sensitivity to targets, a broad array coverage, and a high signal-to-noise ratio [29,30]. Numerous case studies have shown that composite arrays yield better detection results than single-array configurations [31,32]. Zhou et al. [33] introduced a novel device type—the Full-Range-Gradient (FRG) array—which demonstrated superior imaging capabilities over dipole, Schlumberger, and multi-gradient arrays through both numerical simulations and field applications, highlighting its significant potential for widespread use.
In summary, prior research confirms that electrical differences exist between slip surfaces and surrounding materials, and that both terrain complexity and device configuration substantially influence detection results. Composite arrays generally offer better imaging performance than single arrays. Inspired by the FRG device proposed by Zhou et al. [33], this study introduces a high-speed railway slope sliding surface detection technology based on complex electrical observation arrays for challenging terrains. The methodology is validated through numerical simulations and engineering practices. As a non-destructive detection technology, it adapts to diverse complex topographies, offering high efficiency, low cost, and simple operation. The data acquisition system features a capability to suppress power frequency interference, ensuring that stray electrical noise around high-speed railways does not affect data quality. This technology provides a practical solution for detecting sliding surfaces in similar high-speed railway slope scenarios.

2. Fundamental Theory

2.1. DC Resistivity Method

The Direct Current Resistivity Method is a geophysical technique based on differences in the resistivity of subsurface materials. Its fundamental principle is that a stable DC electric field (I) is injected into the ground through power supply electrodes (A and B) placed on the surface. The resulting potential difference (V) between various surface locations is measured using potential electrodes (M and N). The resistivity at the electrode coverage area can be calculated using Equation (1). By analyzing the resulting resistivity data, the underground electrical structure can be inferred, thereby enabling the identification of the target of interest.
ρ = K v I
where K is the device coefficient, a constant determined by the spatial position of four electrodes. When the survey is a surface measurement, it can be calculated according to Equations (2) and (3):
K = 2 π 1 / A M 1 / B M 1 / A N + 1 / B N
and when the survey is a borehole measurement, it can be calculated as follows:
K = 4 π 1 / A M   + 1 / A ` M 1 / A N 1 / A ` N 1 / B M 1 / B ` M + 1 / B N + 1 / B ` N
where   A ` and B ` are the image points of current electrodes A and B with respect to the ground surface.
In actual measurements, since the subsurface medium is generally non-uniform, the calculated resistivity value represents a comprehensive response from the area covered by the four electrodes. This value is referred to as apparent resistivity, denoted as ρ s , and is expressed in units of Ω•m. Apparent resistivity can also be measured using two-electrode and three-electrode configurations.

2.2. Finite Element Forward Modeling

Finite element forward modeling in the DC resistivity method involves numerically solving the distribution of the underground current field and subsequently calculating the surface potential response and apparent resistivity. It is important to note that electromagnetic induction effects are not considered in the forward modeling of the DC resistivity method. Given the electric field strength I at point r 0 , the potential U at any point r can be calculated using the Poisson Equation (4):
· ( σ U ) = I δ ( r r 0 )
Here ∇ is the gradient operator, σ is the conductivity (σ = 1⁄ρ), δ(·) is the Dirac operator, r 0 is the power supply point, I is the electric field intensity of the power supply, r is the potential position to be determined, and U is the potential.
In actual calculation, it is difficult to solve partial differential equations. It is necessary to convert Equation (4) into integral form, multiply both sides of the Poisson Equation by the test function, and integrate over the entire calculation area Ω, then the following Equation holds:
Ω v · ( σ U ) d Ω = Ω v I δ ( r r 0 )
Using partial integration to reduce the second-order derivative to the first order, and with the boundary condition of surface insulation ( U n Γ s u r f a c e = 0 ), Equation (5) can be converted into Equation (6):
Ω σ v · U d Ω = I v δ ( r 0 )
Equation (6) is the integral form of the Poisson Equation (4).
If the calculation area Ω is discretized by an unstructured grid and divided into n units, the potential U in each unit cell can be approximately expressed by linear interpolation of shape function N i :
U U h = i n N i U i
where U i is the potential of the ith grid; N i shape function is 1 at node i and 0 at other nodes; h represents the size of the unit, and U h represents the finite element approximate solution under h-division.
Combining Equations (6) and (7), and testing function is also taken as shape function N i , the following linear Equation (8) can be obtained as follows:
i n ( Ω σ N i · N i d Ω ) U i = I N i ( r 0 )
The potential value at each grid point can be obtained by solving the system of Equation (8) using an iterative algorithm. Compared with methods such as finite difference and boundary element techniques, the unstructured finite element method offers greater accuracy for modeling irregular terrain and anisotropic media. It also allows for dense meshing near anomalous regions. This method supports arbitrary electrode arrangements, enabling direct current resistivity forward modeling for composite observation configurations under complex terrain conditions.

2.3. Gauss–Newton Inversion

Resistivity inversion involves reconstructing the internal resistivity structure of a medium using observed current and voltage data. The Gauss–Newton (G-N) iteration is a classic optimization algorithm for solving nonlinear least squares problems and has been widely used in geophysical inversion. Its core principle is to iteratively linearize the objective function to gradually approach the optimal solution.
Let the observed data vector be d o b s R M , the model parameter vector is m R N , and the forward operator is F ( m ) : R N R M . Then the objective function can be defined according to Equation (9):
m = 1 2 d o b s F ( m ) W d 2 + λ 1 2 L ( m m r e f ) 2
Here W d is the data covariance matrix used to reduce the impact of noise on data and highlight the contribution of high-quality data. L is the smoothness constraint matrix used to constrain the smoothness of the solution or prior information. λ is the regularization parameter, balancing the data fitting term and the model regularization term. Under the limit condition, the λ 0 means that the model completely fits the data, while the λ indicates that the model completely obeys the regularization constraint, ignoring the measured data, and the solution tends to the reference model. m r e f is the prior reference model.
The objective function consists of two parts. The first term is the data fitting term, denoted as follows: d m . The second term is the model regularization term, denoted as follows: m m . The function of the data fitting term is to quantify the difference between the forward modeling data and the observed data. The goal is to find a model m so that the forward modeling result F ( m ) may be close to the observed data. The model regularization term incorporates prior information to constrain the model space, helping to prevent issues such as uncertainty, non-convergence, and non-uniqueness in the inversion process, thereby ensuring that the system of linear equations is solvable. The combination of the data misfit term and the regularization term enables the inversion result to both fit the observed data and maintain geological plausibility, ultimately yielding an accurate and stable solution.
During the calculation process, the Gauss–Newton iteration method transforms complex optimization problems into a series of linear least squares solutions by linearizing the forward modeling operator. In electrical resistivity inversion, high precision and efficiency are achieved by integrating regularization constraints with fast sensitivity matrix computation. In the present study, due to the complex terrain, diverse types of working apparatuses, and large data volume, this iterative strategy was adopted to enhance computational efficiency while maintaining accuracy.

3. Numerical Simulation

3.1. Model Design and Forward Analysis

COMSOL Multiphysics (6.1) software was used to analyze the electric field distribution characteristics within the slope body. This software is a simulation platform based on the finite element method. The “ec”(Electrochemistry) module of this software enables the simulation of the resistivity method. Numerous studies have demonstrated its significant advantages in resistivity method research [34,35]. For instance, COMSOL can be used to perform potential field analysis of complex electrode configurations [36,37], support complex models and heterogeneous media, and produce highly accurate numerical results [38]. Additionally, it facilitates the implementation of multi-physics field simulations involving different types of media [39]. The modeling and simulation process for the resistivity method using COMSOL Multiphysics typically involves five steps, as illustrated in Figure 1.
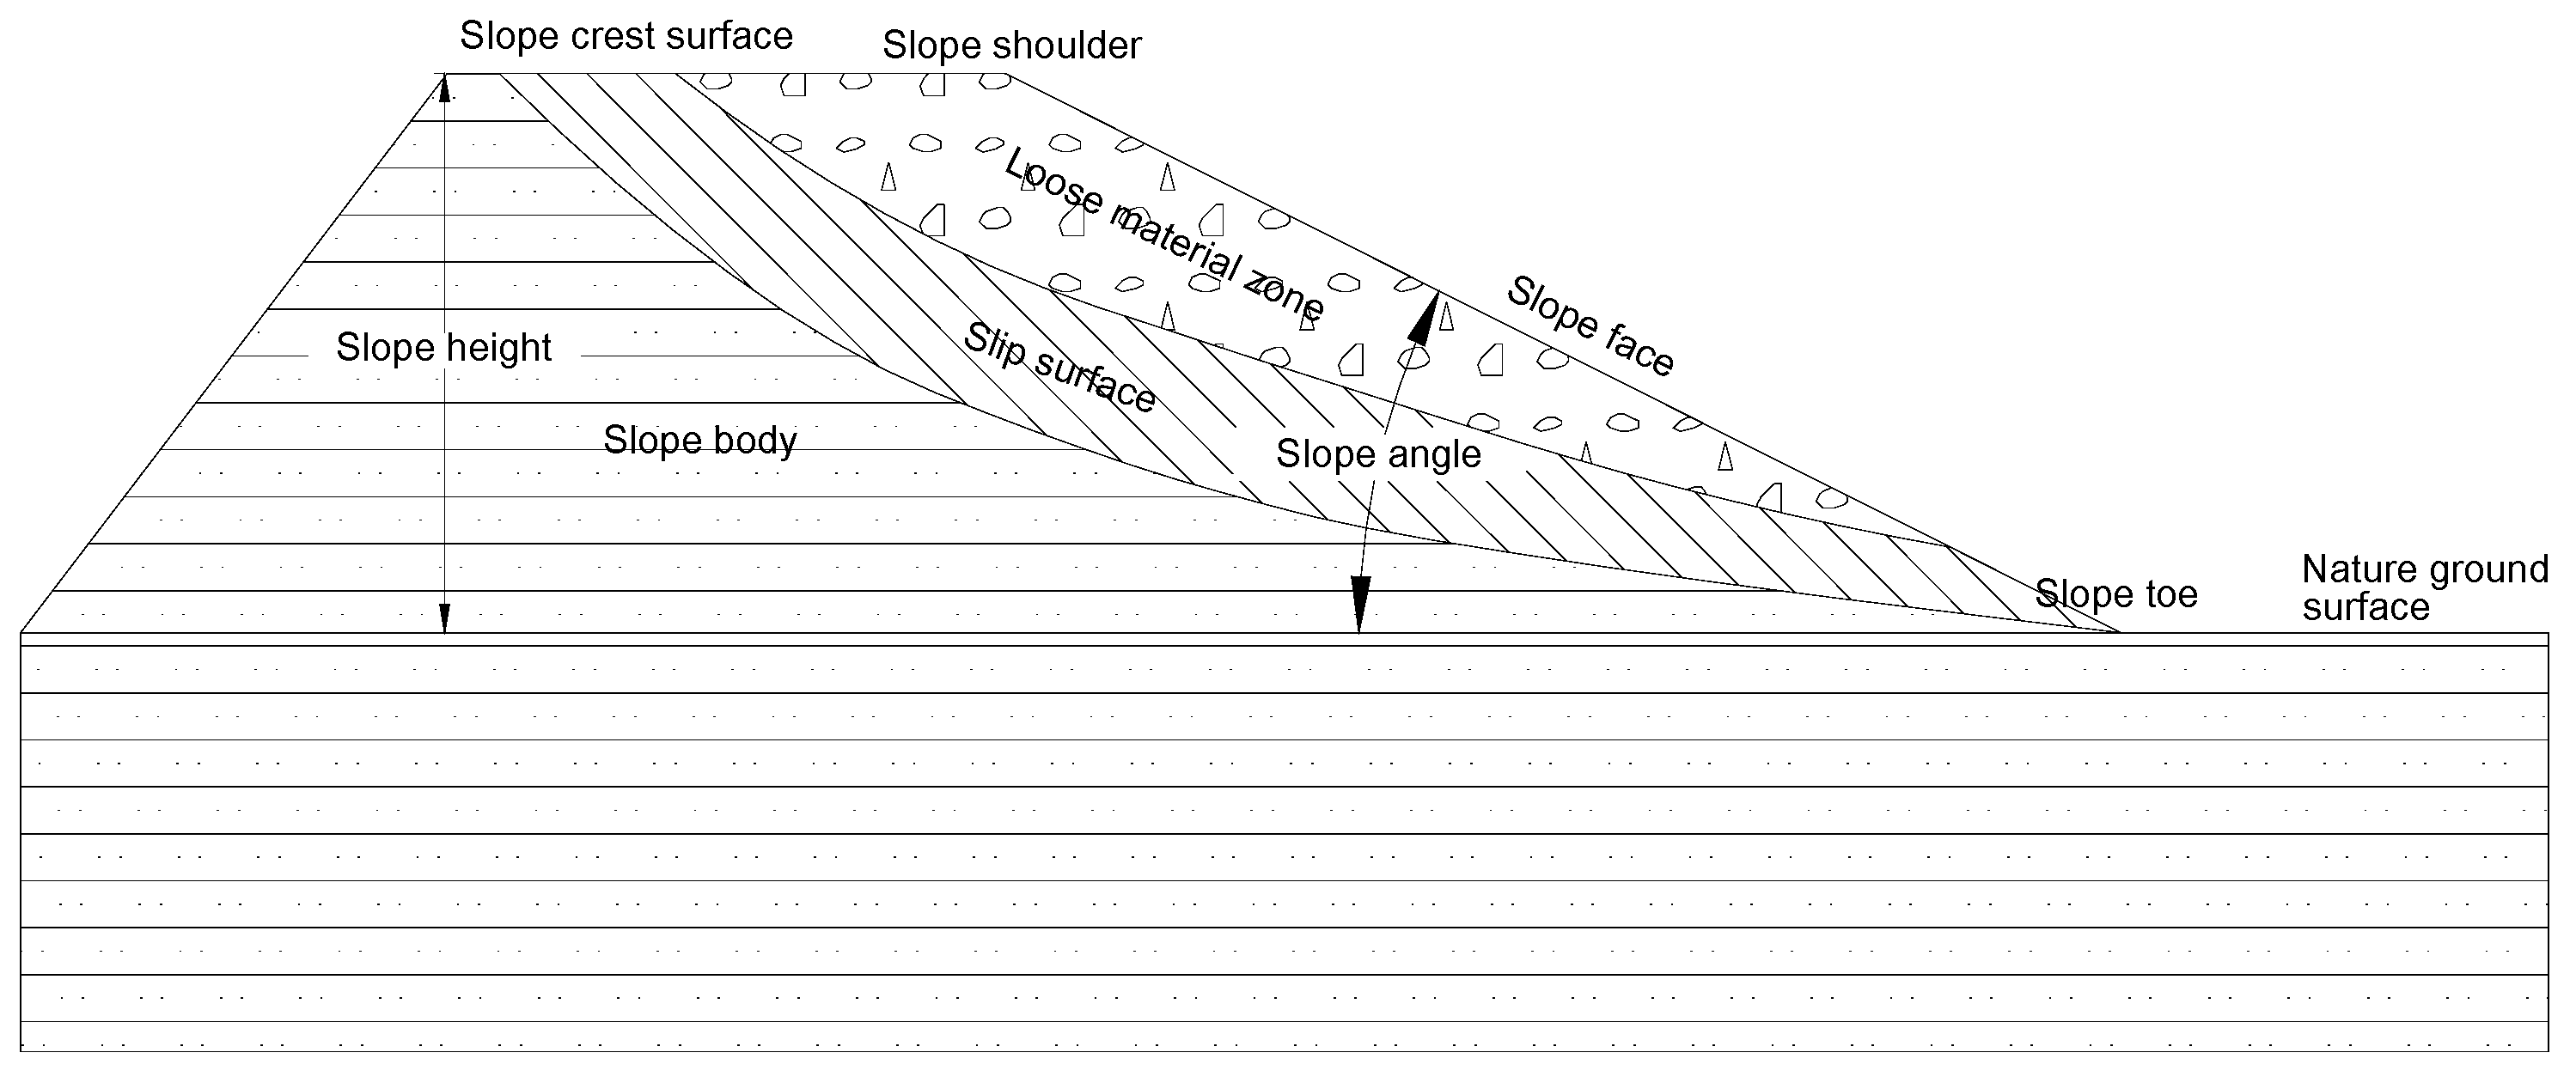
High-speed railway slopes are generally composed of the top surface, shoulder, slope surface, foot, and bottom surface (Figure 2). Their geometric parameters, such as slope height and angle, must be comprehensively determined based on the physical and mechanical properties of the rock and soil, the effects of load combinations, and stability analysis. Slope systems have obvious topographic complexity and geological structural heterogeneity.
According to most engineering geological survey results, under the combined influence of internal and external dynamic geological forces, a progressive deformation and failure zone often develops along the depth of the slope. The evolution of this zone exhibits clear temporal and spatial differentiation [40]. In the early stages, it presents as traction-induced settlement at the top of the slope. As the stress field redistributes and weak structural surfaces propagate, a continuous sliding surface extending from the top to the toe of the slope eventually forms, triggering slope collapse [41]. Morphological analysis of the sliding surface indicates that its spatial distribution is governed by the spatial variability of the shear strength parameters of the rock mass and the influence of groundwater seepage. It typically follows a developmental pattern resembling a circular arc or a segmented (broken line) structural surface [42,43].
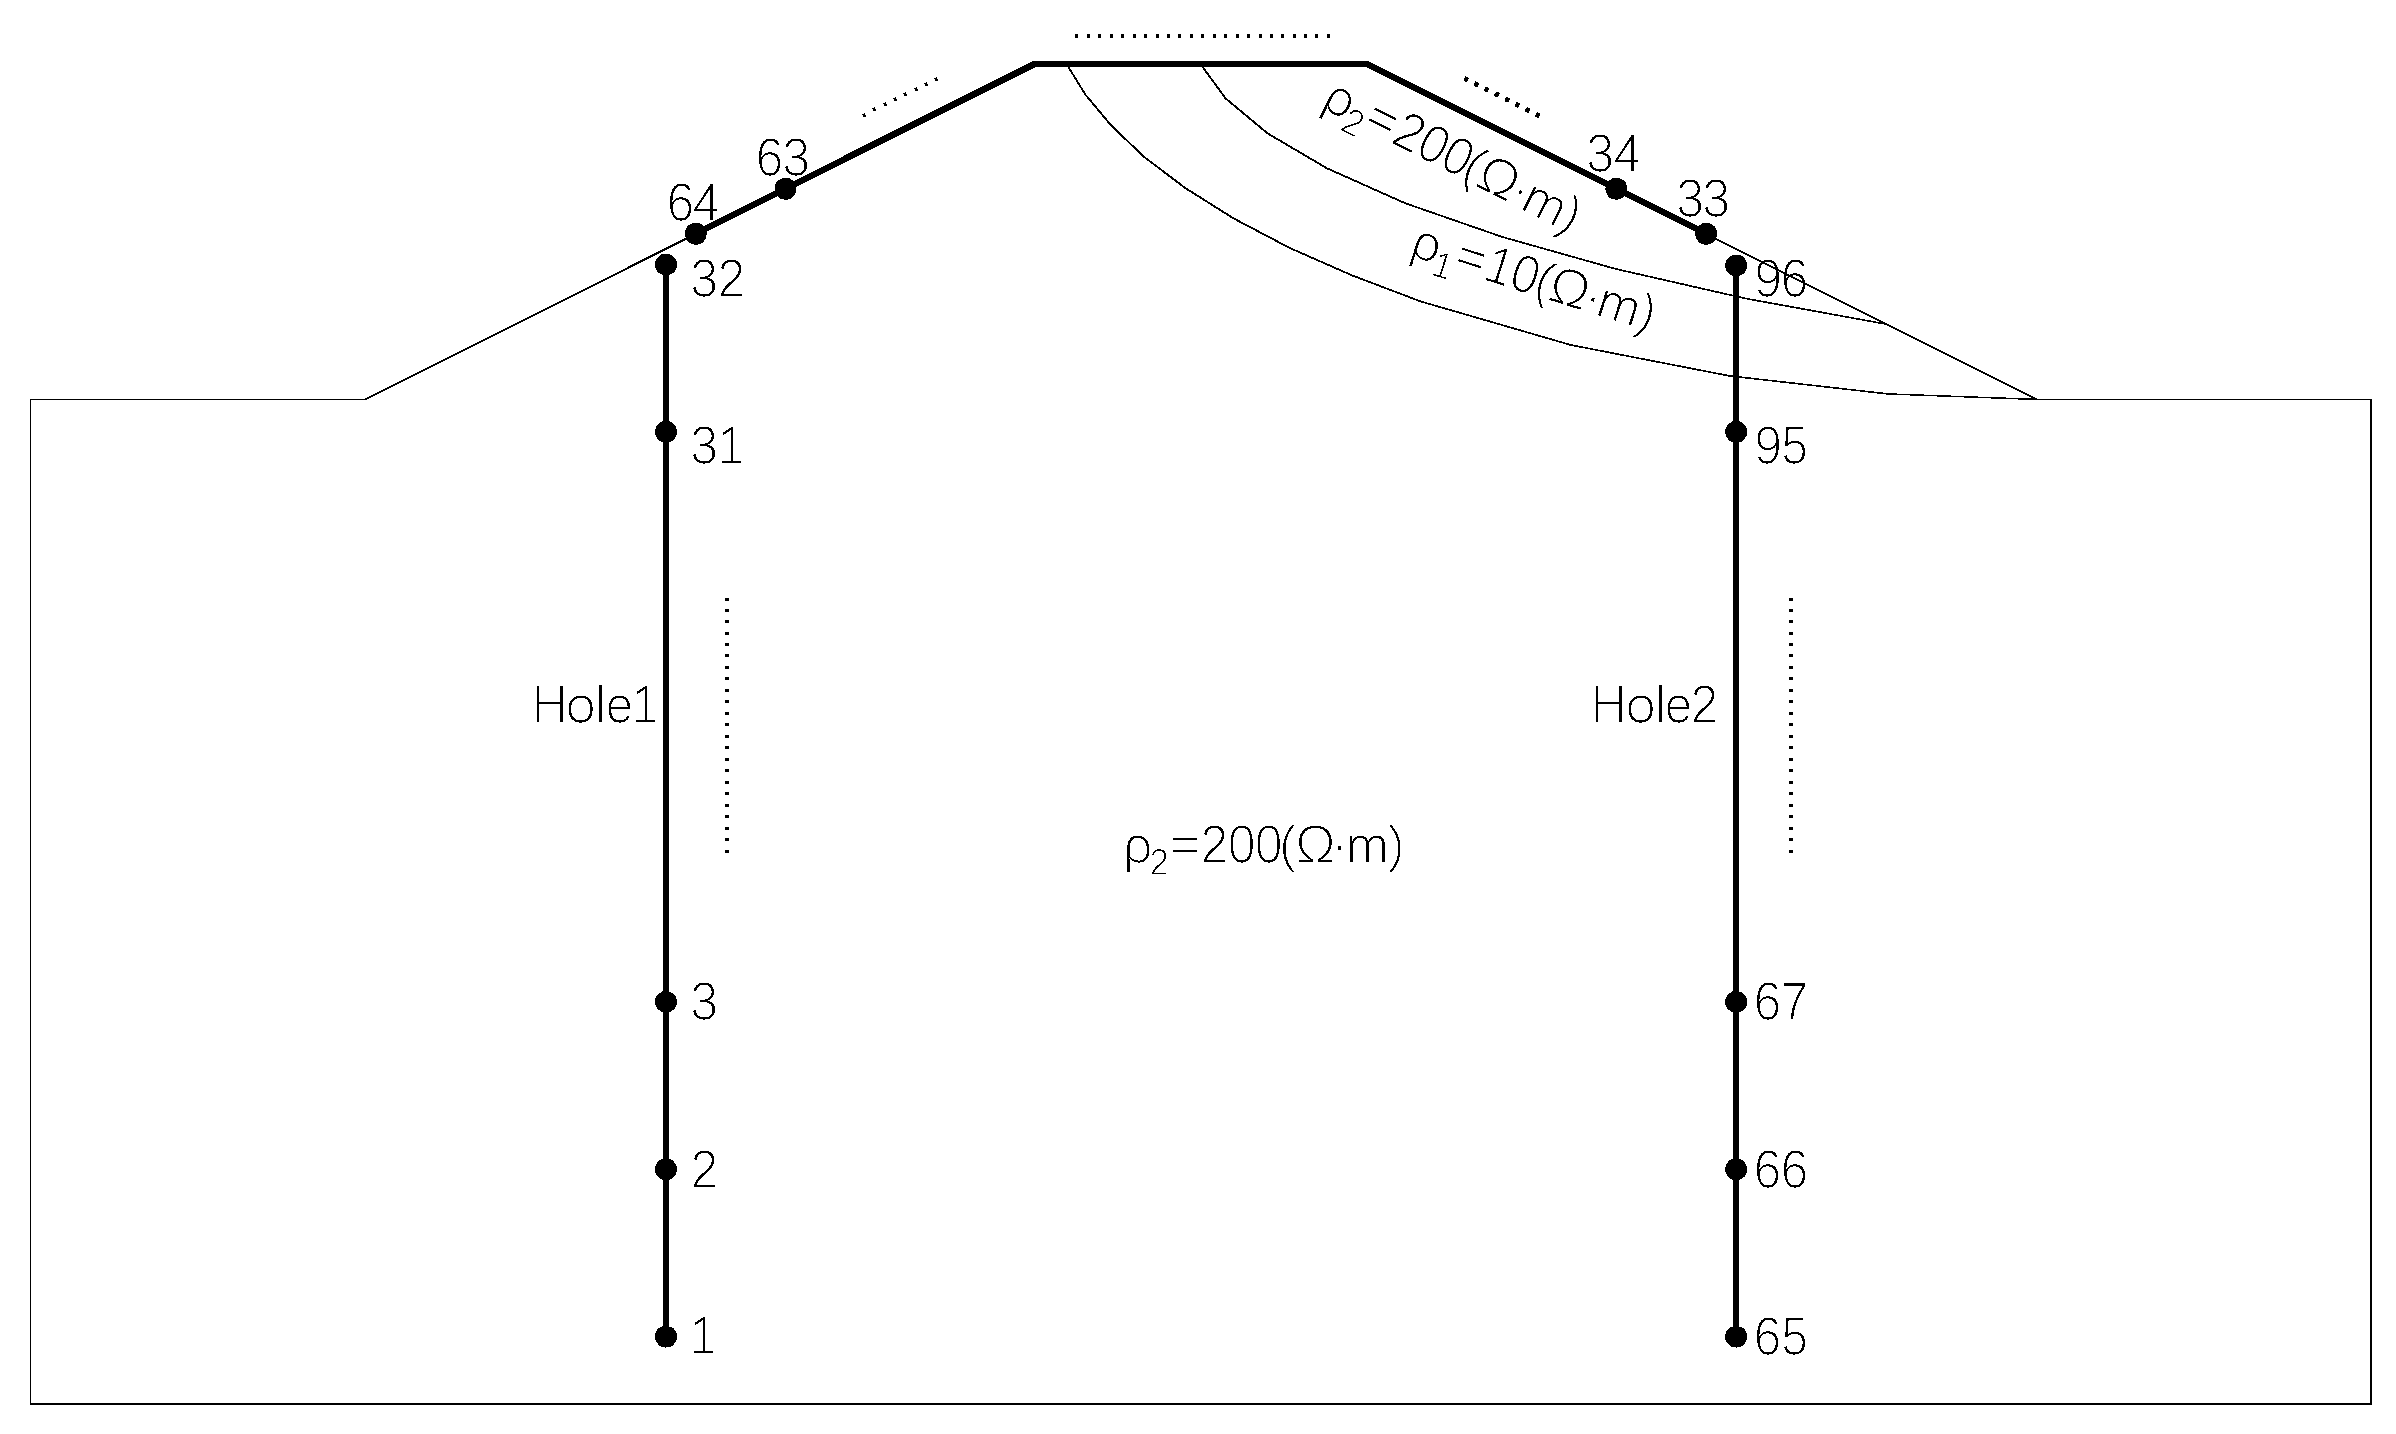
To accurately detect the extent of slope sliding surface development, a technical approach was proposed for complex terrain using complex observation devices. This approach was based on the morphological characteristics of the sliding surface and aimed to make full use of the well-ground workable space to collect multi-angle data, enhance data density in the imaging area, and improve imaging resolution through data fusion processing. Following this technical route, electrodes were arranged both in boreholes and on the ground during the simulation. The model parameters were set as follows: The resistivity of the sliding surface medium was 10 Ω•m, the resistivity of the overlying loose material was 200 Ω•m, and the resistivity of the surrounding rock was set equal to that of the loose material. A total of 96 electrodes were deployed: 32 in Hole 1 (numbered 1–32 from bottom to top), 32 on the ground (numbered 33–64), and 32 in Hole 2 (numbered 65–96 from bottom to top), as shown in Figure 3.
To investigate the imaging effect under complex terrain and observation conditions, it was necessary to design a suitable working apparatus based on the fundamental principles of resistivity imaging. A scientifically sound apparatus should minimize data volume while achieving optimal imaging resolution, ensuring that the data are non-redundant and free of distortion. To design such an apparatus, electric field simulations were conducted according to electrical prospecting principles, and the distribution characteristics of the electric field were analyzed for different power supply point locations.
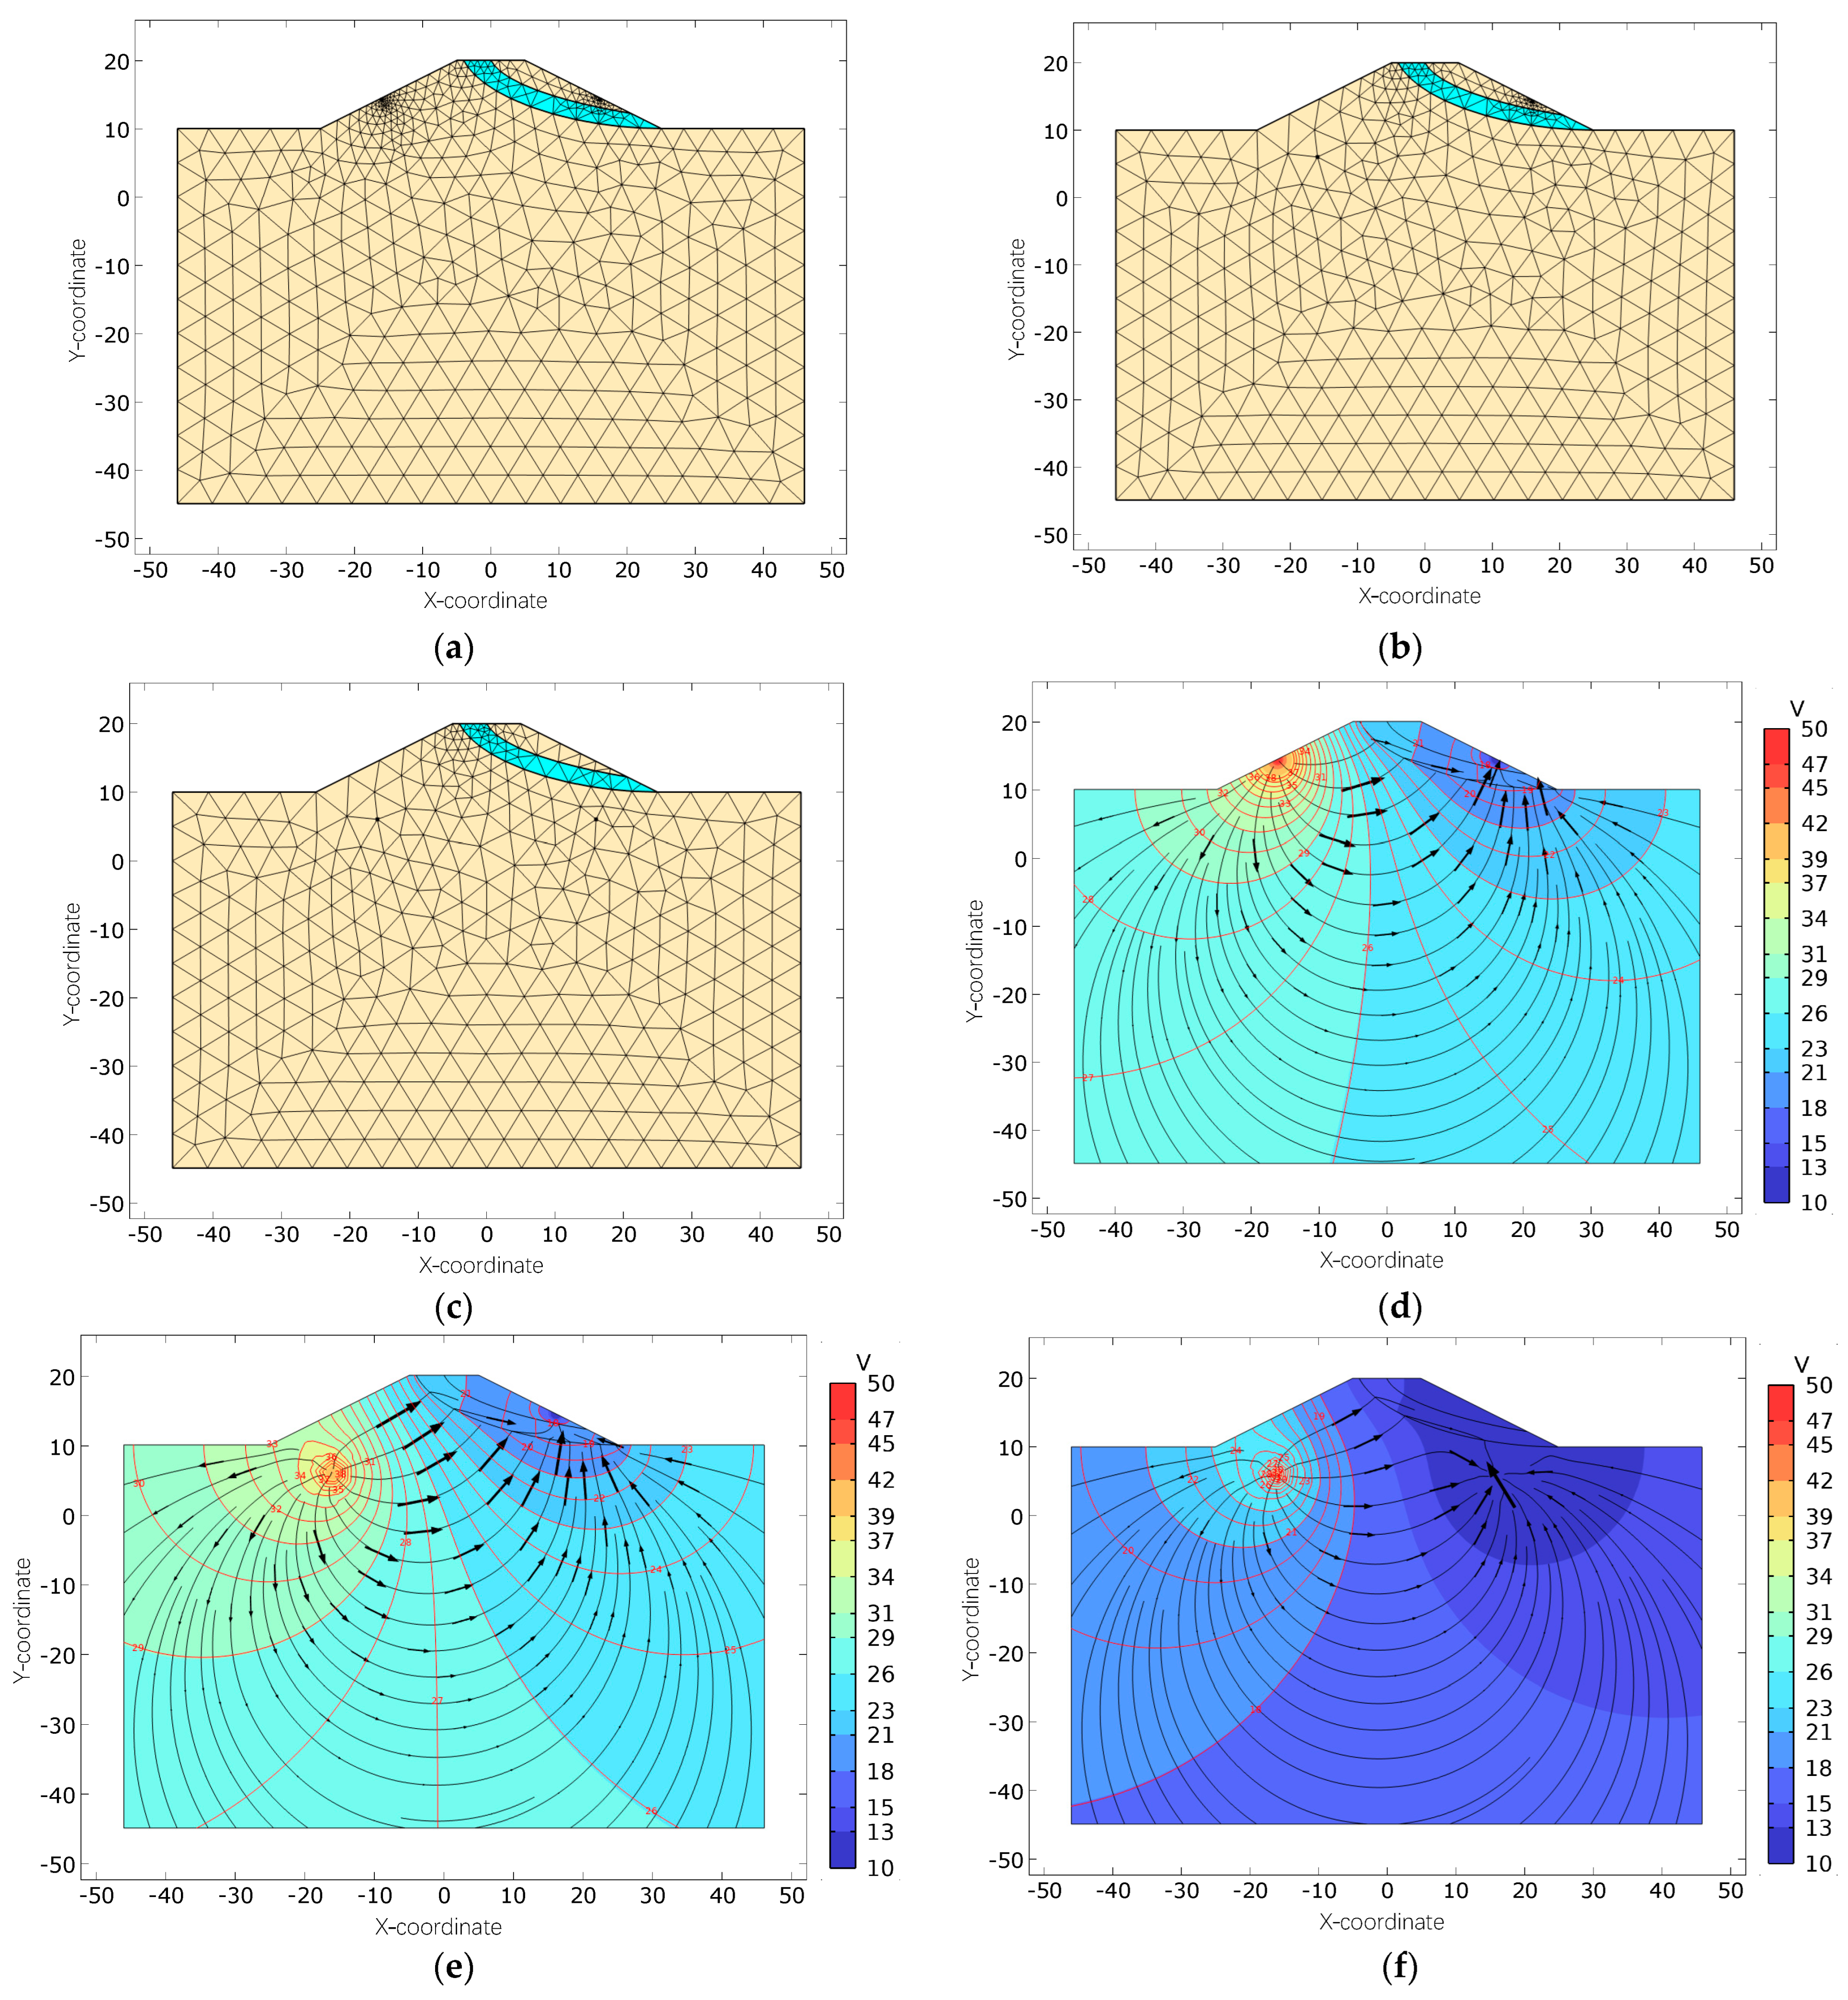
Three power supply configurations were used in the simulation: (1) Both power supply electrodes A (−16, 14.25) and B (16, 14.25) were located on the surface; (2) electrode A (−16, 6) was placed in the borehole while electrode B (16, 14.25) remained on the surface; (3) both electrodes A (−16, 6) and B (16, 6) were positioned in the borehole. The simulation used a current intensity of 1A. The mesh was generated using unstructured finite element triangulation, and the boundary of the simulation region was defined as an infinite element domain. The simulation results are presented in Figure 4.
Figure 4a–c display the meshing results for different power supply point configurations. The results indicate that the mesh is uniformly distributed within the homogeneous material, and its size remains consistent. However, the mesh becomes significantly more refined at the junctions of electrical interfaces, which also influences the meshing of the surrounding medium. When the power supply points were located on the ground surface—typically at the interface between two media (e.g., air and soil)—the electric field was conducted into the subsurface half-space, and the mesh around the power supply points is finer than that of the surrounding medium. In contrast, when the power supply points are placed in a borehole, the electric field is distributed throughout the space, the surrounding medium is uniform, and the mesh density at the power supply point is similar to that of the adjacent medium. Note that the geometric size of the power supply points was ignored in the simulation.
Figure 4d–f show the electric field and potential distribution diagrams for different power supply point positions. Figure 4d demonstrates that the potential lines are densely distributed on the surface, indicating a strong electric field intensity that is highly sensitive to the shallow geoelectric structure. This reflects variations in the resistivity of the near-surface medium. Additionally, the angle between the electric field lines and the horizontal direction at AB⁄2 is small, which is conducive to resolving horizontal geoelectric structures. Figure 4e illustrates that the electric field intensity is concentrated around the borehole electrode, making it more sensitive to geoelectric structures near the hole. The electric field lines form a larger angle with the horizontal direction, which enhances the imaging of non-horizontal structures. Figure 4f shows that the current forms a concentrated penetration path between the two boreholes. This configuration is particularly sensitive to the geoelectric structure within that path, while being less influenced by the surrounding medium. The transformation of spatial position enables a clearer distinction of complex geoelectric structures between the holes. Simulation results reveal that when power supply points were on the surface, the electric field diffused in a hemispherical pattern. When the power supply points are located in boreholes, the diffusion takes on a spherical pattern. Consequently, the potential values are higher when the power supply is on the surface compared to when it is in a borehole. Therefore, in geophysical inversion, it is essential to account for full-space or half-space conditions depending on the electrode configuration.
Through the above analysis, different power supply methods have different resolution capabilities for different regions. To identify complex geoelectric structures, it is necessary to combine multiple power supply methods to obtain data from abundant apparatus types and then reconstruct the geoelectric structure of regions surrounded by the electrode arrays through geophysical inversion.

3.2. Working Apparatus Design and Inversion

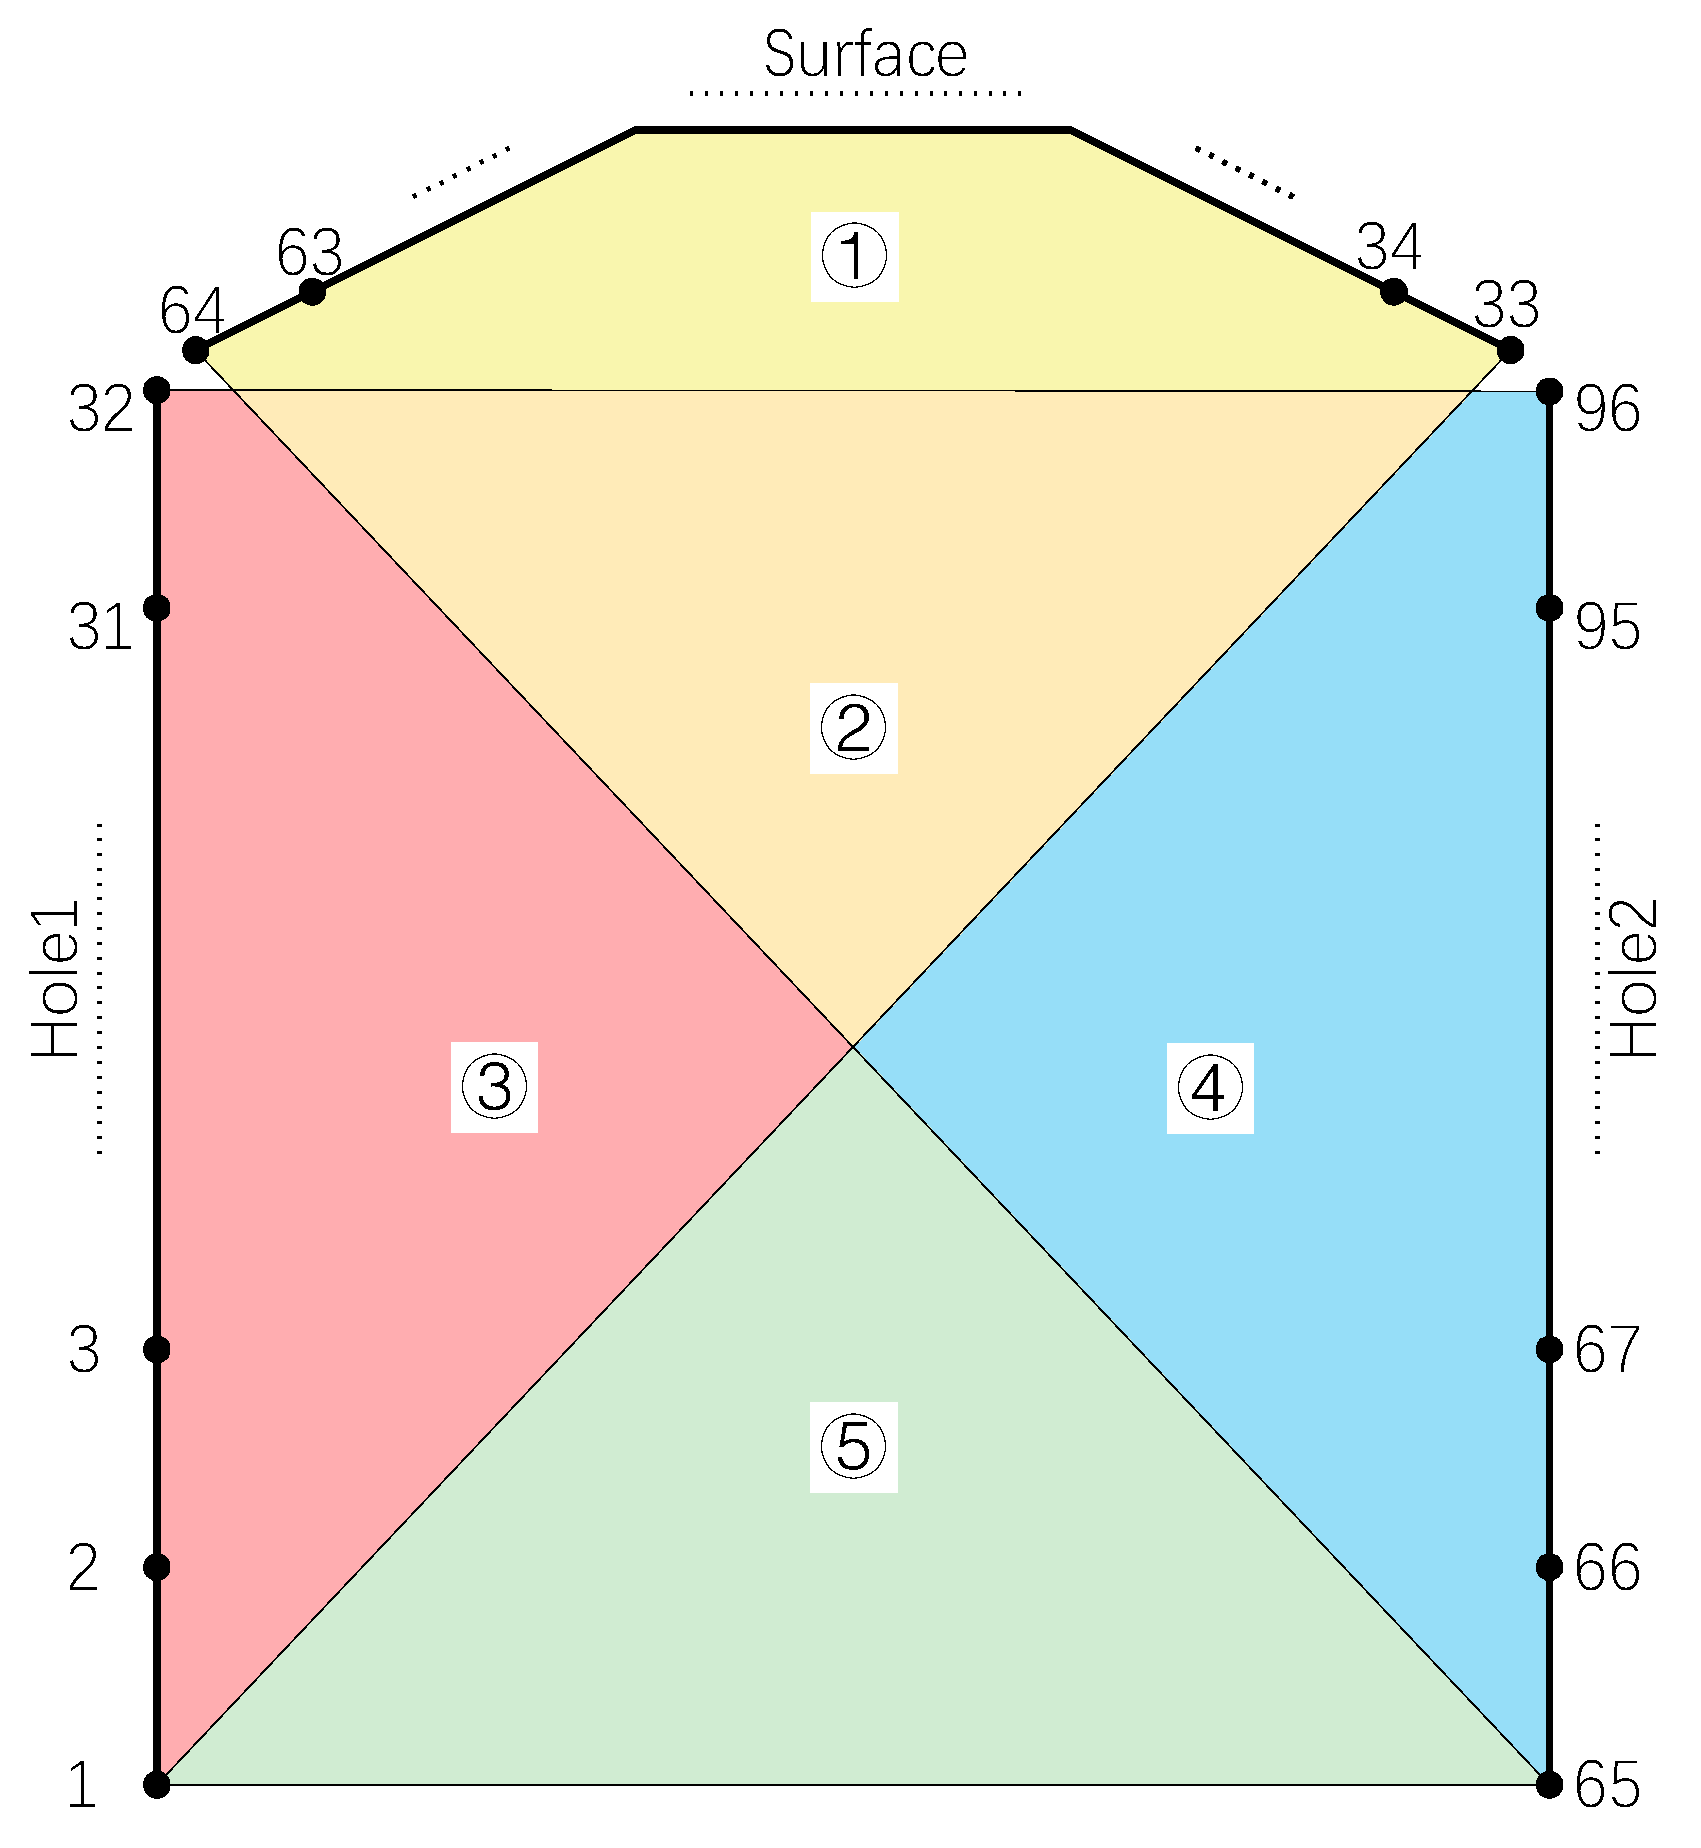
There is a direct relationship between the working device and detection effect, so the design of the working apparatus is of great significance. To accurately reconstruct the complex geoelectric structure, according to the above simulation results, the working apparatus should be diversified. In the detection of high-speed railway slopes, in order to achieve full coverage of the slope body, the boreholes and surface space should be fully utilized, and corresponding devices should be planned for each detection area. When designing the scheme, the slope body can be divided into 5 imaging areas, numbered ①~⑤ (Figure 5). Dahlin and Zhou [30] have conducted research on the projection method for apparent resistivity under different power supply combinations. Based on their projection method, the following summary is presented. The detection of areas ①, ②, and ③ was realized by combining Hole 1 and the ground surface space. The detection of areas ①, ②, and ④ was realized via combining Hole 2 and the ground surface space. The detection of areas ②, ③, ④, and ⑤ was performed by combining Hole 1 and Hole 2 spaces.
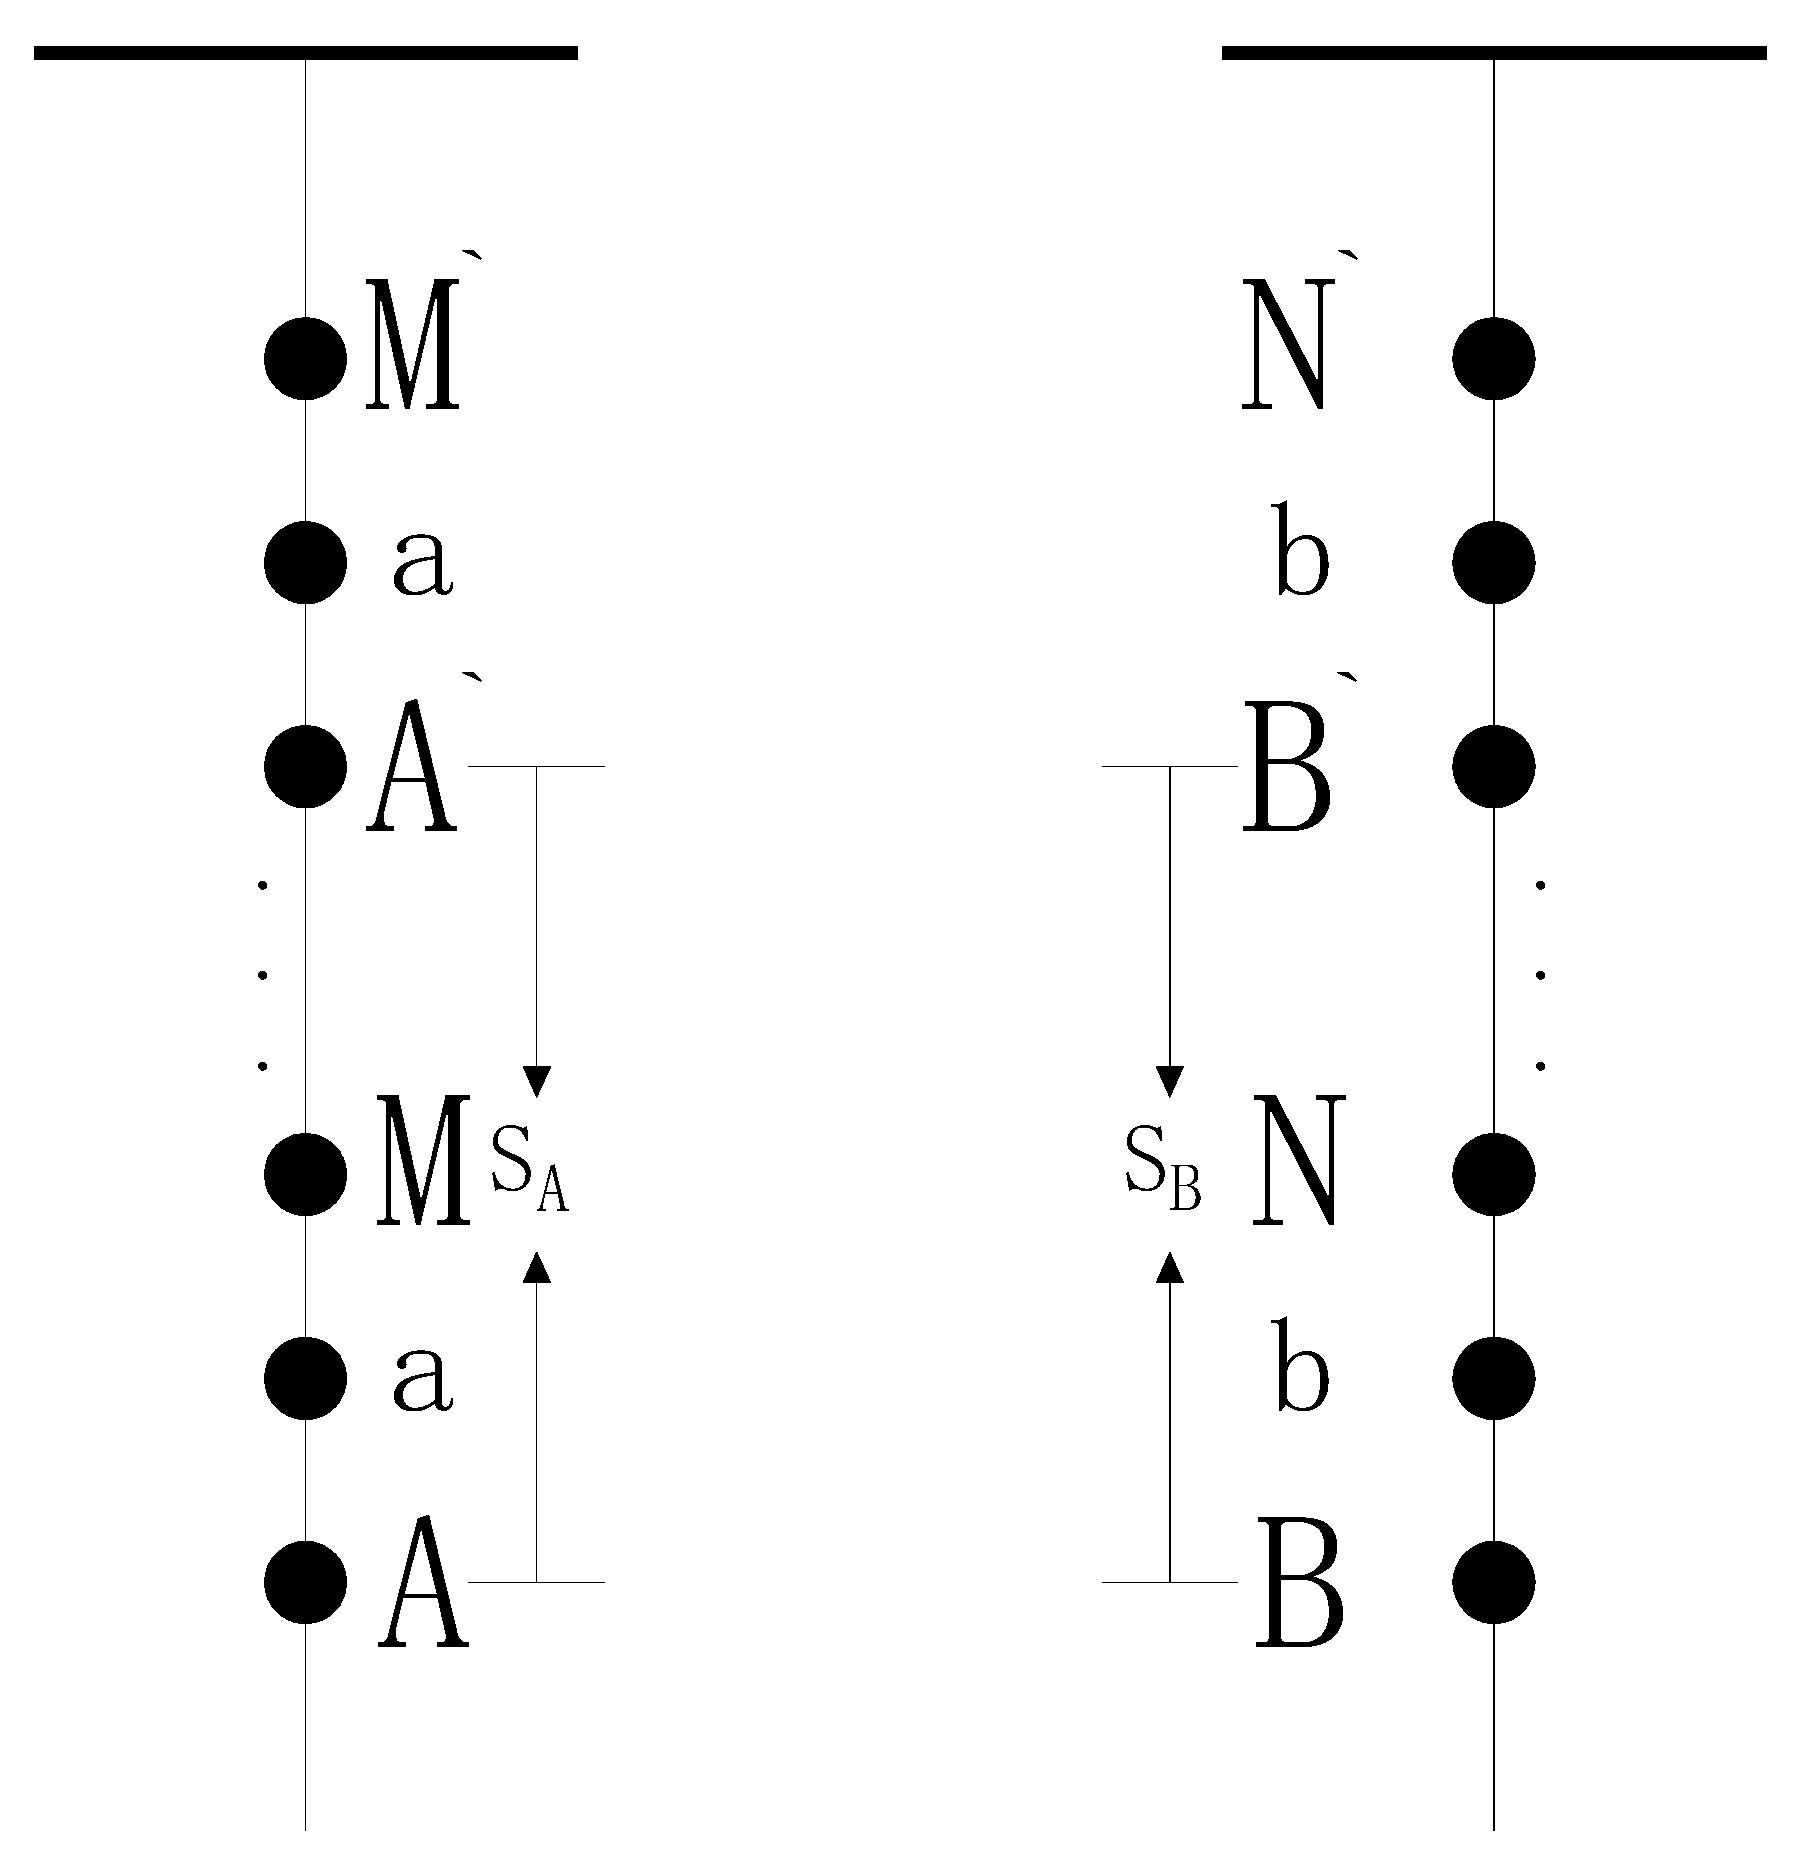
According to the simulation results, to make the artificial electric field fully cover the detection area and ensure the electric field strength in the detection area, the power supply electrodes should be separated. In addition, achieving a high signal-to-noise ratio of the measurement data also required the measuring electrodes to be separated. Therefore, A and B were placed in two spaces, and the measuring electrodes M and N were also located in two spaces, respectively. The working apparatuses are marked as A-M and B-N (Figure 6). The isolation coefficients of A, M and B, N are denoted as a and b, respectively. The transformation steps of A and B are denoted as S A and S B . Therefore, complex apparatus data collection can be realized by setting different a, b, S A and S B values.
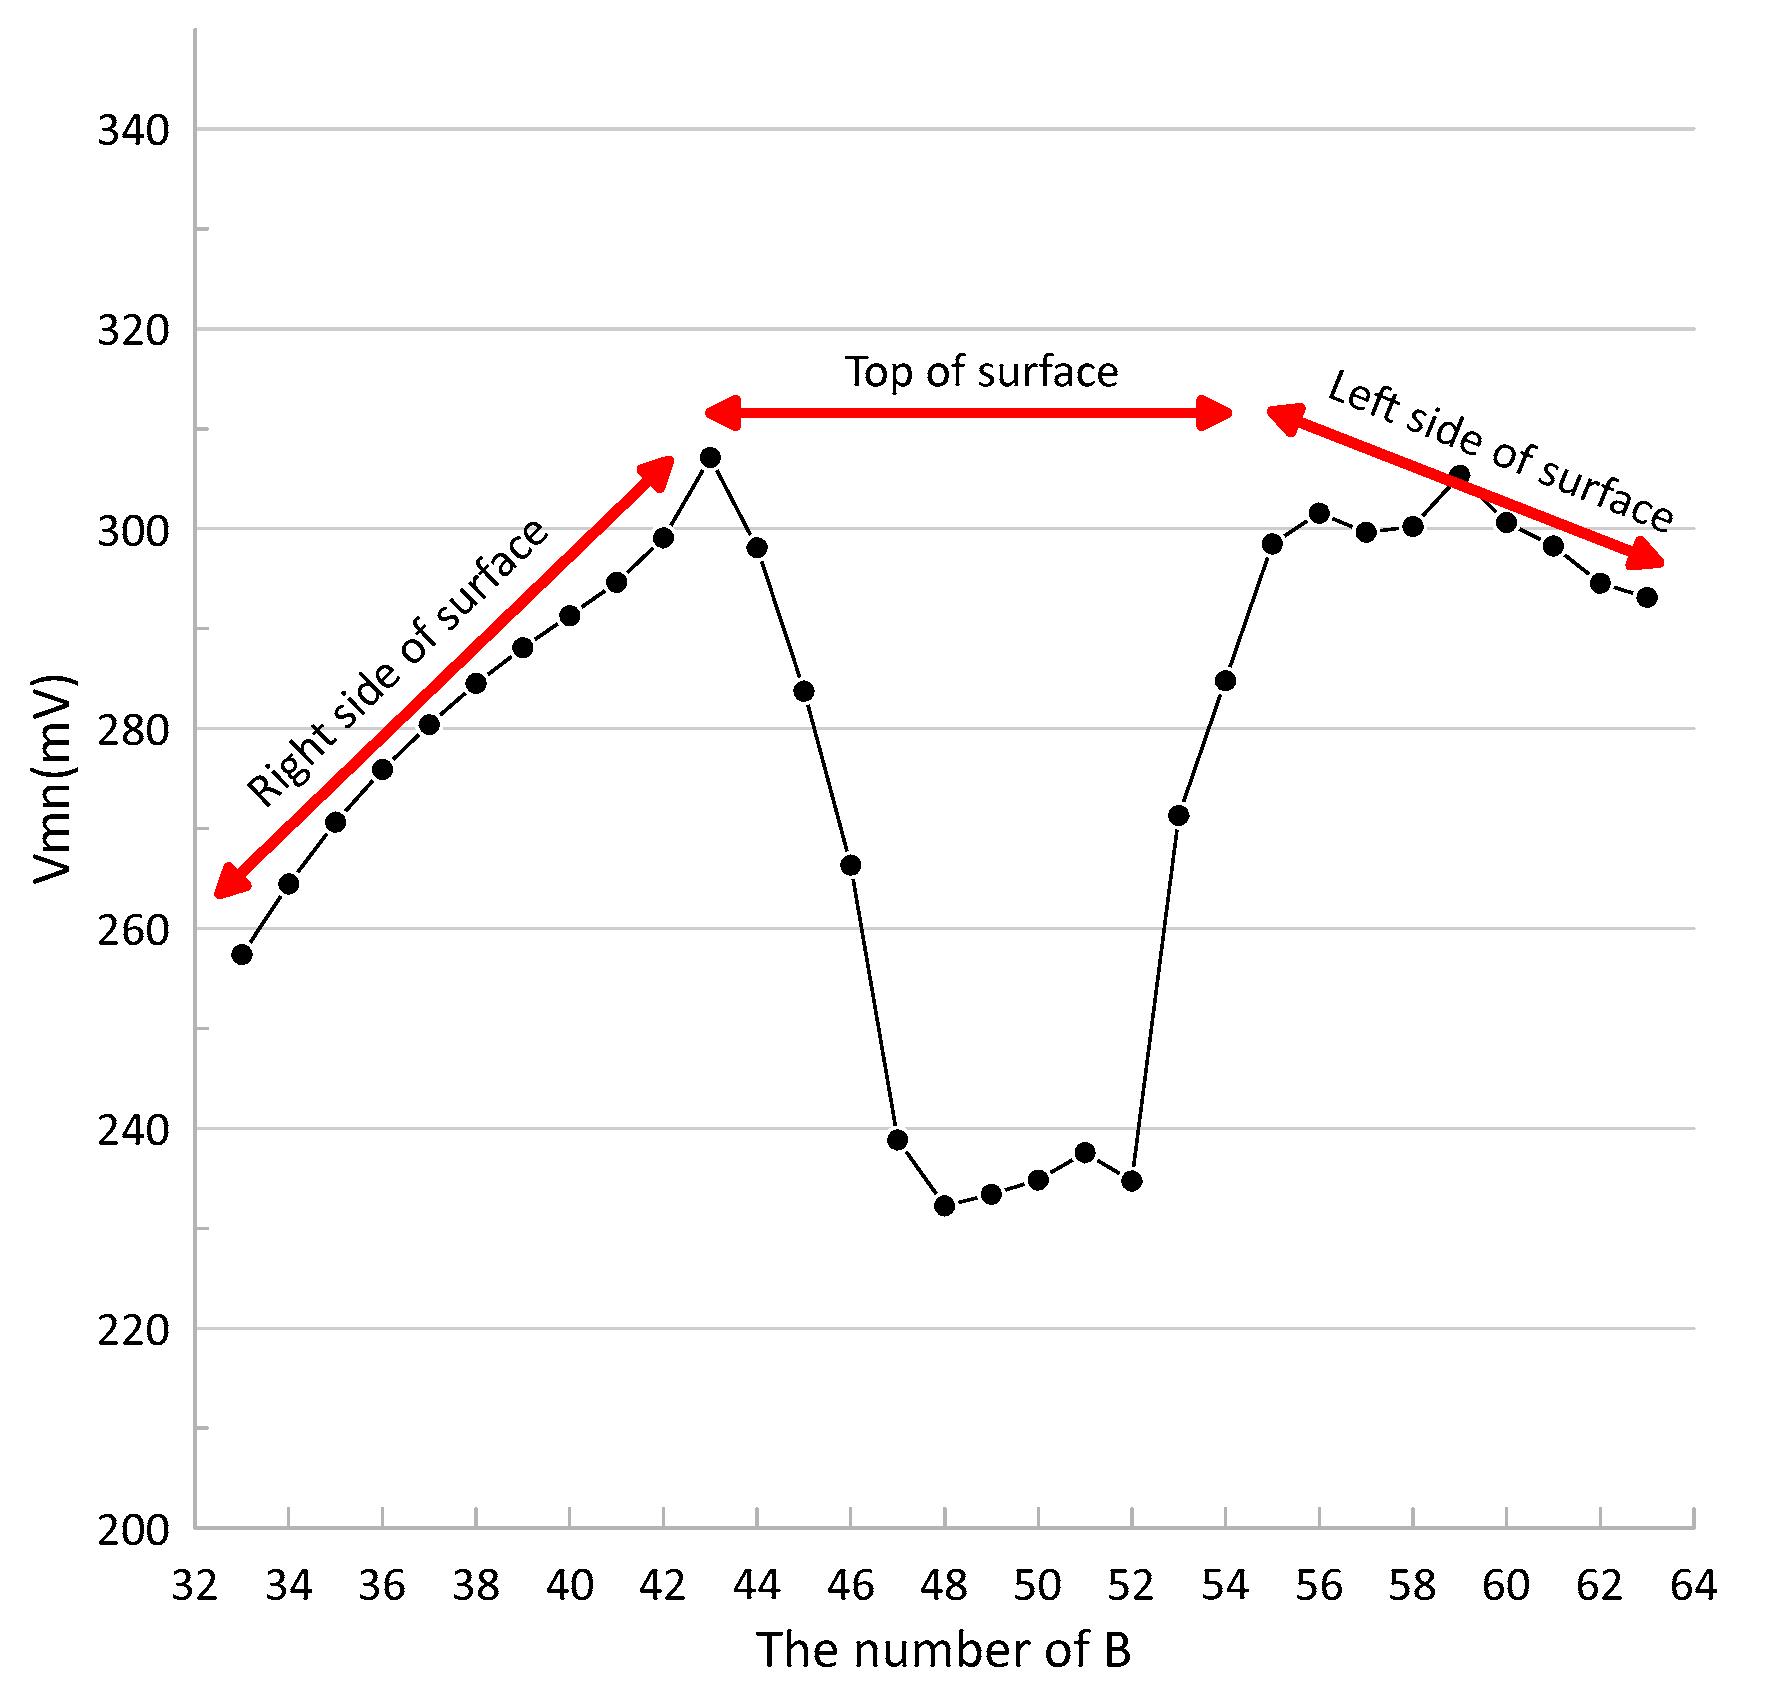
Figure 7 shows the voltage value V m n between M and N when A and M were in Hole 1, B and N were on the surface, A = 1#, M = 2#, initial B = 33#, b = 1, and S B = 1. That is, A-M was fixed in Hole 1, and B-N ran from the right side of the slope to the left side in the surface space. During simulation, the spacing between electrodes in the hole was 1.0 m, and the horizontal distance between electrodes on the ground (x direction) was also 1.0 m.
The curve shape reveals that the voltage values on the right side of the slope exhibit a large rate of change and a smooth trend, whereas the data on the left side show a smaller rate of change with noticeable fluctuations in the curve. It is also observed that the top surface data have the smallest rate of change, although the curve displays a fluctuation near B = 51#. Further analysis indicates that these curve fluctuations correspond spatially to terrain undulations and sliding surface anomalies. Regions farther from power supply point A show a lower rate of change in voltage values, while fluctuations in the curve become more pronounced near areas with sliding surface anomalies.
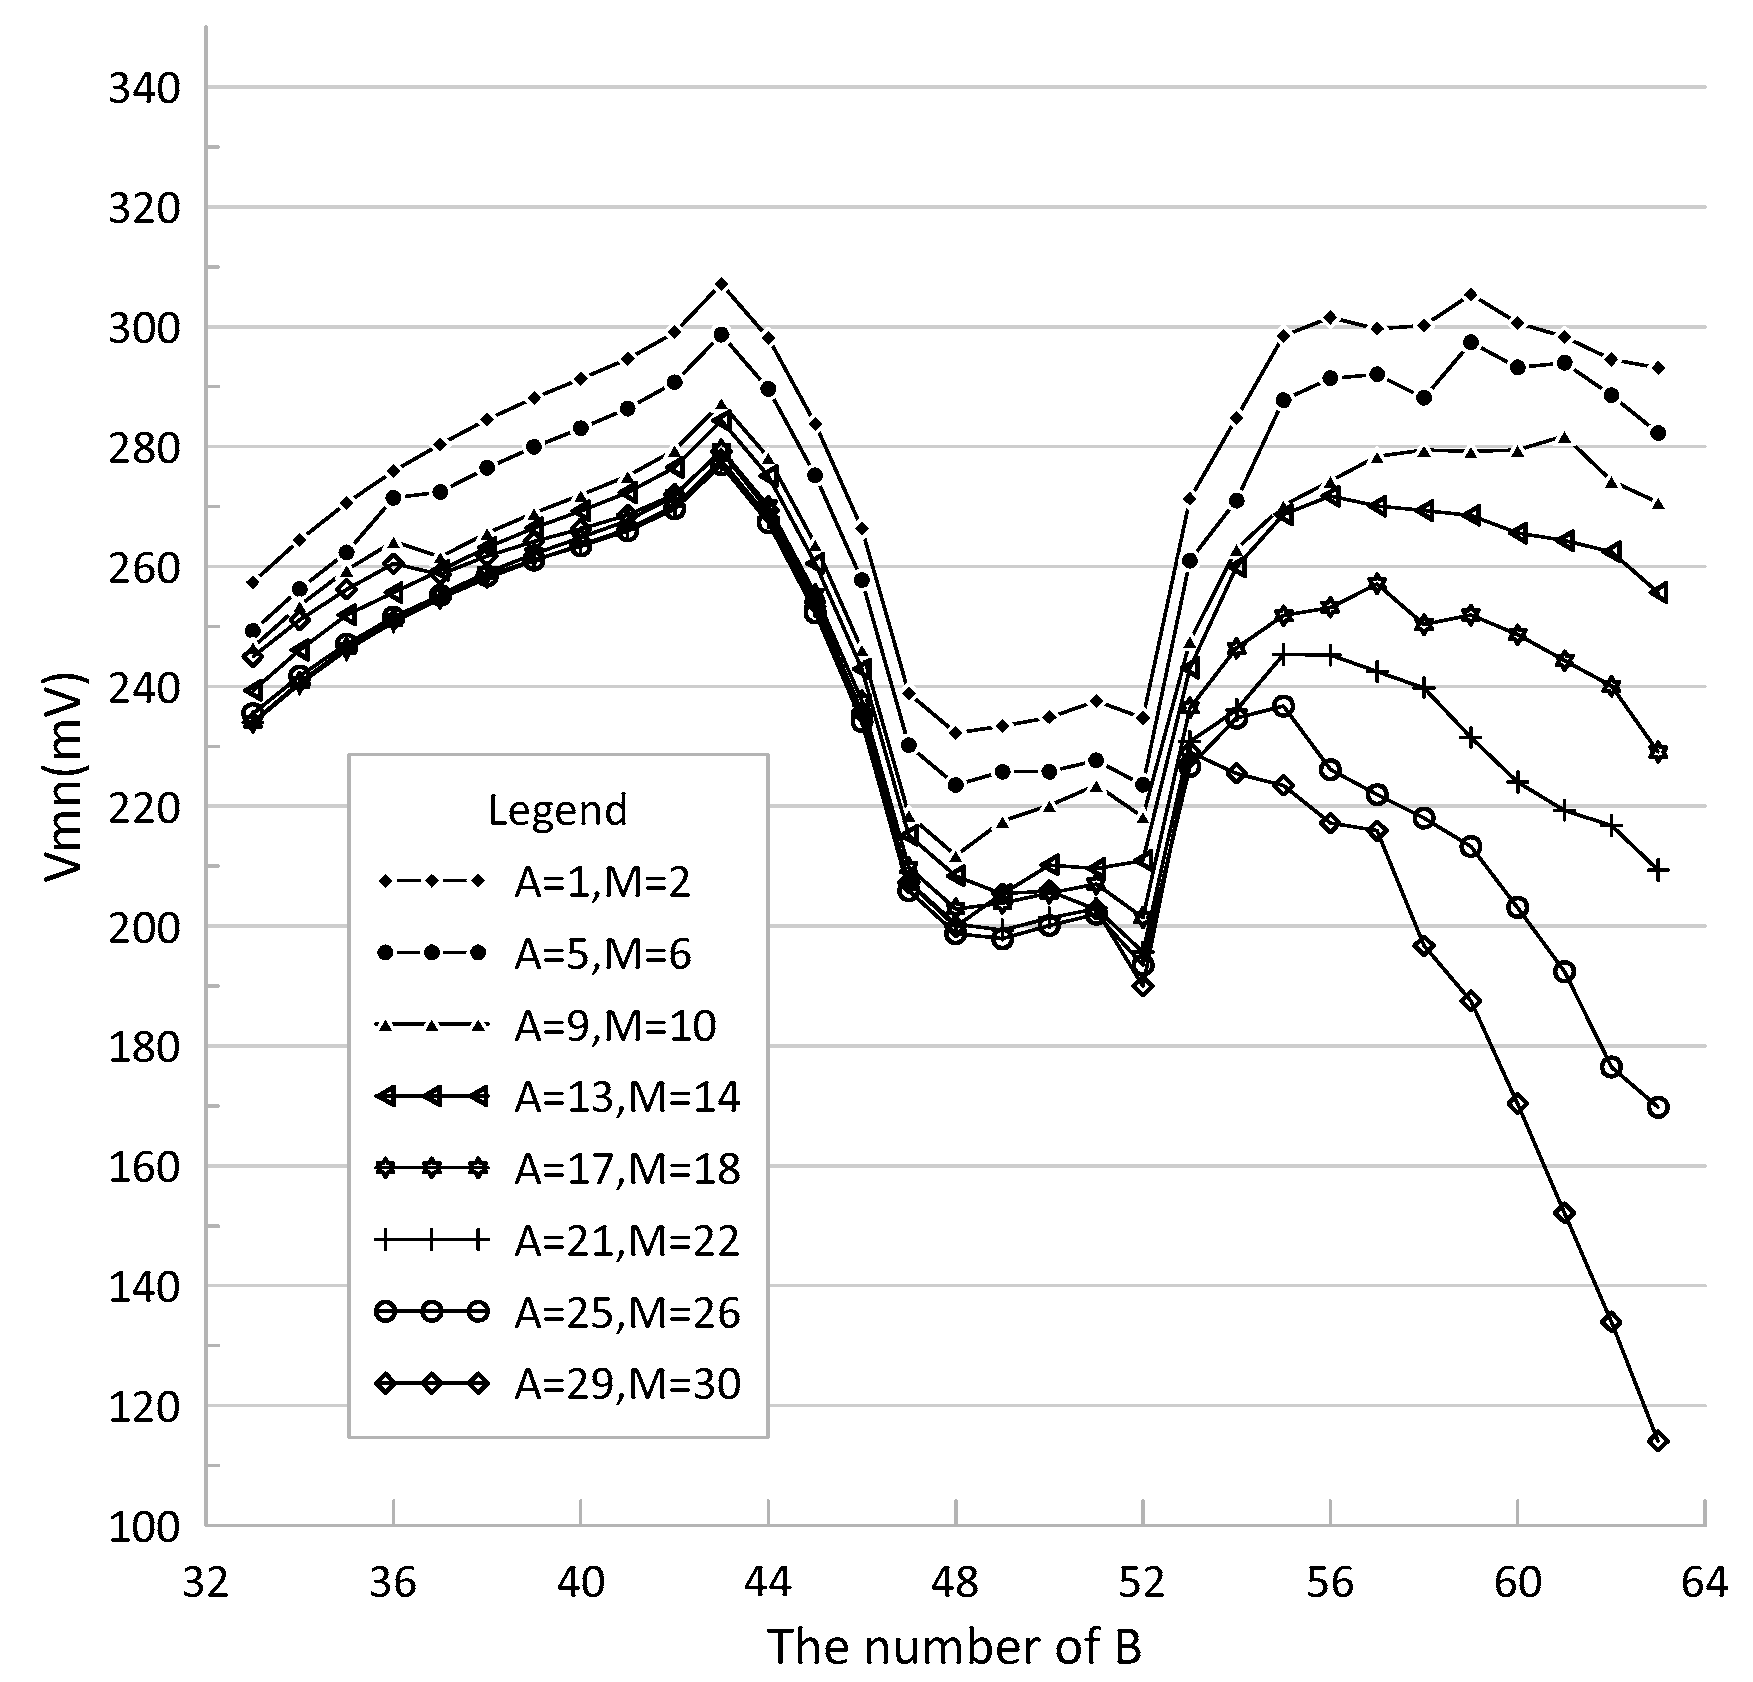
In order to analyze the changing characteristics of V m n under different power supply conditions, values of a = 1, b = 1, S A = 4, S B = 1 were used during simulation. The calculation results are presented in Figure 8, where the V m n values under eight different power supply combinations were plotted. The morphological analysis shows that the curve has an obvious feature. That is, when the power supply point B was placed on the left side and top surface of the slope, the V m n value changed slightly with the position of the power supply point A. However, as the power supply point B was located on the right side of the slope, the V m n value varied greatly with the position of the power supply point A. Also, as the power supply distance between A and B decreased, the change rate of V m n on the right side gradually increased. Although the left side and top surface have similar features, their rate of change is significantly lower than that of the right side. This phenomenon is believed to be associated with abnormal terrain and slope sliding surface. In other words, the measured potential value V m n contains information related to the sliding surface, and the disturbance caused by the sliding surface to the normal electric field is pronounced, providing favorable geophysical conditions for detection.
To compare the imaging effect under complex and simple observation attributes, the model (Figure 3) was numerically simulated using three observation attributes, namely, Hole 1–Surface, Surface–Hole 2, and Hole 1–Surface–Hole 2. In order to study only the influence of observation attributes on the imaging results, the same working parameters (a = 1, b = 1, S A = 1, S B = 1) were used in the forward modeling, and the same parameters (such as regularization factor and number of iterations) were also set in the case of inversion. Figure 9 shows the imaging results corresponding to these three observation attributes.
In Figure 9, blue and green represent low and high resistivity, respectively, while the black curve indicates the location of the sliding surface defined in the model. Under the Hole 1-surface condition (Figure 9a), the reconstruction results reveal that the low-resistance anomaly of the sliding surface is primarily at the top of the slope. At the far end of the observation area (the slope foot), the anomaly becomes less distinct. Additionally, the reconstruction near the bottom of Hole 1 reveals uneven electrical properties.
Figure 9b presents the reconstruction results based on surface–Hole 2 observation data. The sliding surface anomaly is evident from the top to the foot of the slope. The interface between the low-resistivity zone of the sliding surface and the surrounding slope body and overlying loose material is clear. However, some deviation exists between the reconstructed sliding surface shape and the model. Furthermore, near the bottom of Hole 2, the results exhibit uneven electrical properties, along with a false low-resistivity zone.
By combining the Hole 1–surface and surface–Hole 2 data, a complex observation configuration Hole 1–surface–Hole 2 was established. The reconstruction results, shown in Figure 9c, clearly capture the low-resistivity characteristics of the sliding surface across the full slope profile, from top to foot. The reconstructed curve closely matches the model-defined sliding surface. Notably, the false low-resistivity zones near the bottoms of Hole 1 and Hole 2 were eliminated.
A comparison of the three reconstruction results strongly indicates that multi-angle observation, formed by integrating multiple observation configurations, significantly enhances the imaging of the slope sliding surface. In contrast, limited observations can lead to incomplete detection, positional deviation, and the appearance of false anomalies.
The above numerical simulation process did not compare the influence of different noise levels on tomography. Zhou and Dahlin [44] pointed out that the errors affecting resistivity imaging can be classified into error-electrode spacing errors and observed potential errors. The impact of error-electrode spacing can be reduced or improved by RTK measuring the spatial position of each electrode point. Observed potential errors can be improved by setting the device coefficient (K < 1000) and increasing the spacing of MN to enhance the signal-to-noise ratio of the original measurement data. Additionally, during the inversion process, the original data can be pre-processed and analyzed using the reciprocity principle to eliminate outliers.

4. Engineering Practice

4.1. Overview of Practice Area

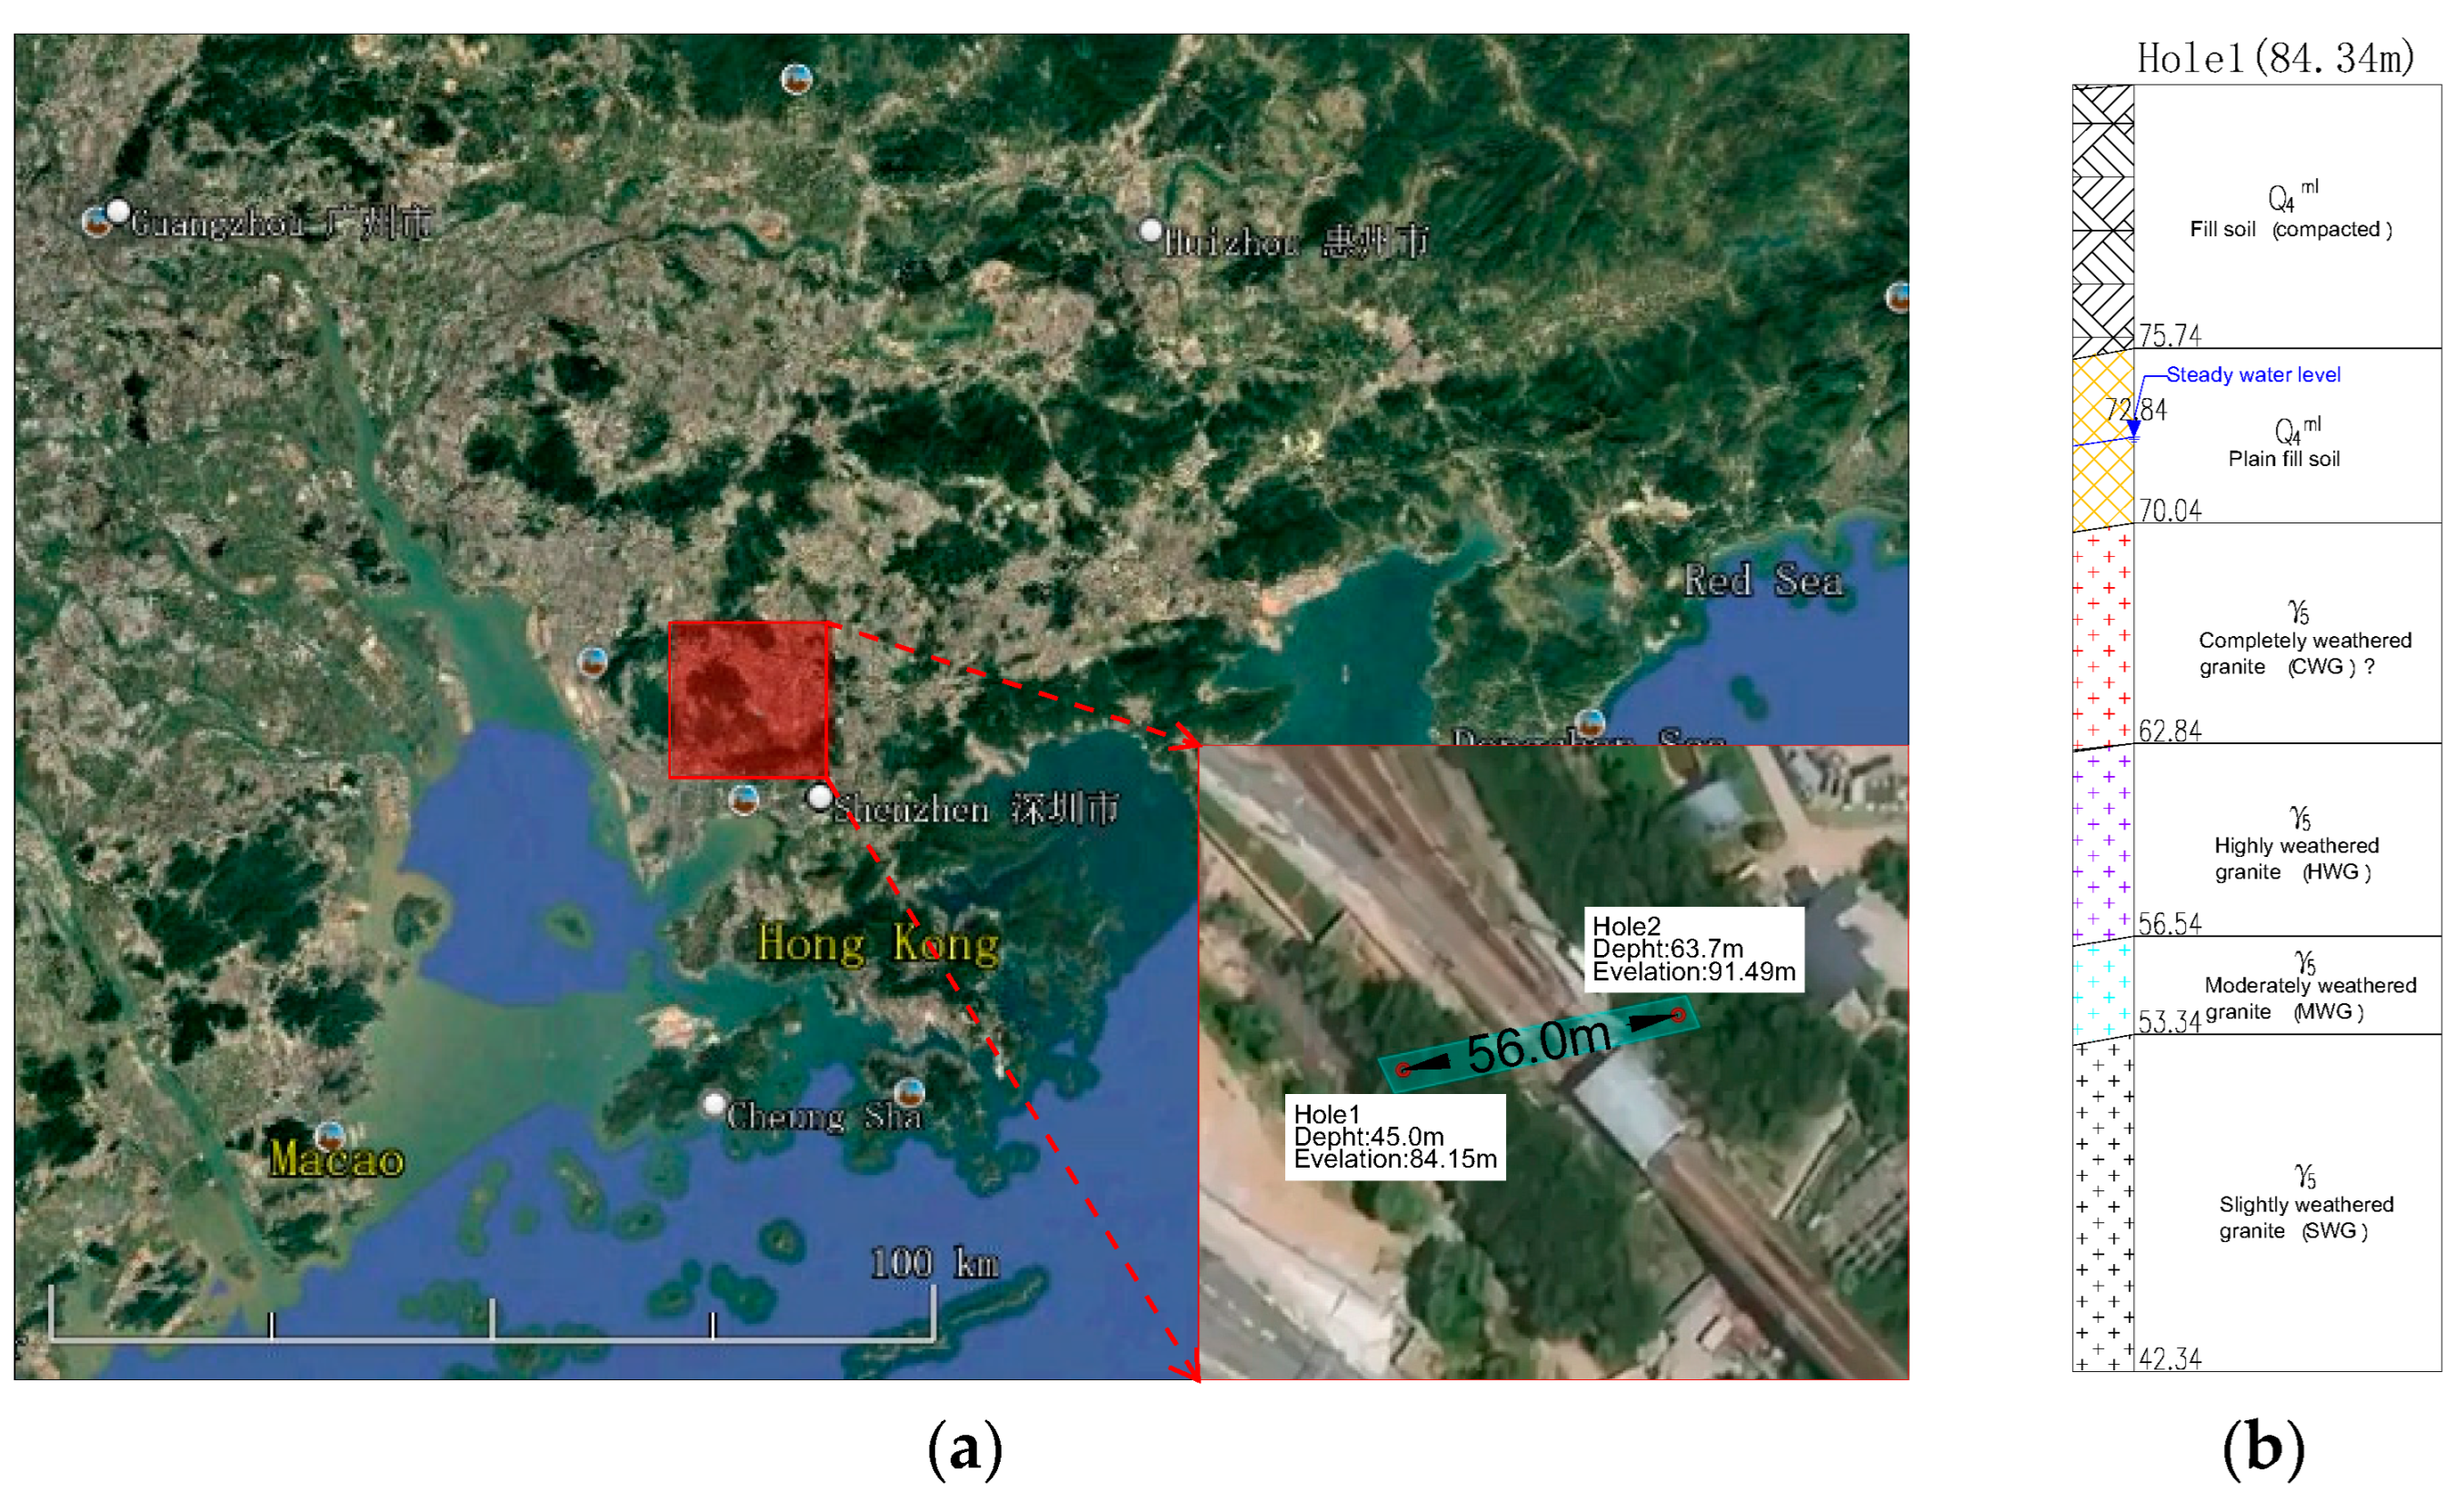
To evaluate the actual detection capability of complex observation configurations for identifying the sliding surface of a high-speed railway slope, a field test was conducted on a slope located in northern Shenzhen, Guangdong Province, China, as indicated by the red rectangle in Figure 10a. This slope is a fill slope, with the fill materials consisting of clay, gravel, and sand. Beneath the fill lies the original stratum, which, from top to bottom, comprises plain fill soil, fully weathered granite, strongly weathered granite, moderately weathered granite, and slightly weathered granite.
According to the on-site investigation, the slope at the test location had experienced sliding, with the movement direction extending from the top of the slope toward Hole 2. Near Hole 2, ground cracks were observed, and hexagonal hollow bricks on the slope had collapsed in multiple areas. The slope protection wall at the foot of the slope was also completely damaged. To ensure the safe operation of the high-speed railway, reinforcement of the slope is required. Prior to designing the reinforcement measures, it is essential to understand the distribution characteristics of the sliding surface and the extent of the collapsed mass.
According to the drilling results from Hole 1 (Figure 10b), the stable groundwater table at the test site is located at a depth of 11.5 m, within the original stratum and overlain by a slope fill layer with a thickness of 12.8 m. Beneath the slope fill, the thicknesses of the successive layers—plain fill soil, fully weathered granite, strongly weathered granite, and moderately weathered granite—are 4.7 m, 9.0 m, 5.8 m, and 4.1 m, respectively. The slightly weathered layer was not encountered. Hole 2, located on the opposite side of the slope, revealed a slightly different stratigraphy: A layer of muddy soil approximately 5 m thick was found beneath the plain fill. To effectively detect the sliding surface, a detection depth greater than 30 m is required. Due to spatial constraints, conventional ground-based geophysical methods are not feasible, making well-ground joint methods the only viable option. In this study, a well-grounded resistivity computed tomography (CT) approach based on complex observation attributes adapted to complex terrain was employed.

4.2. Working Methods

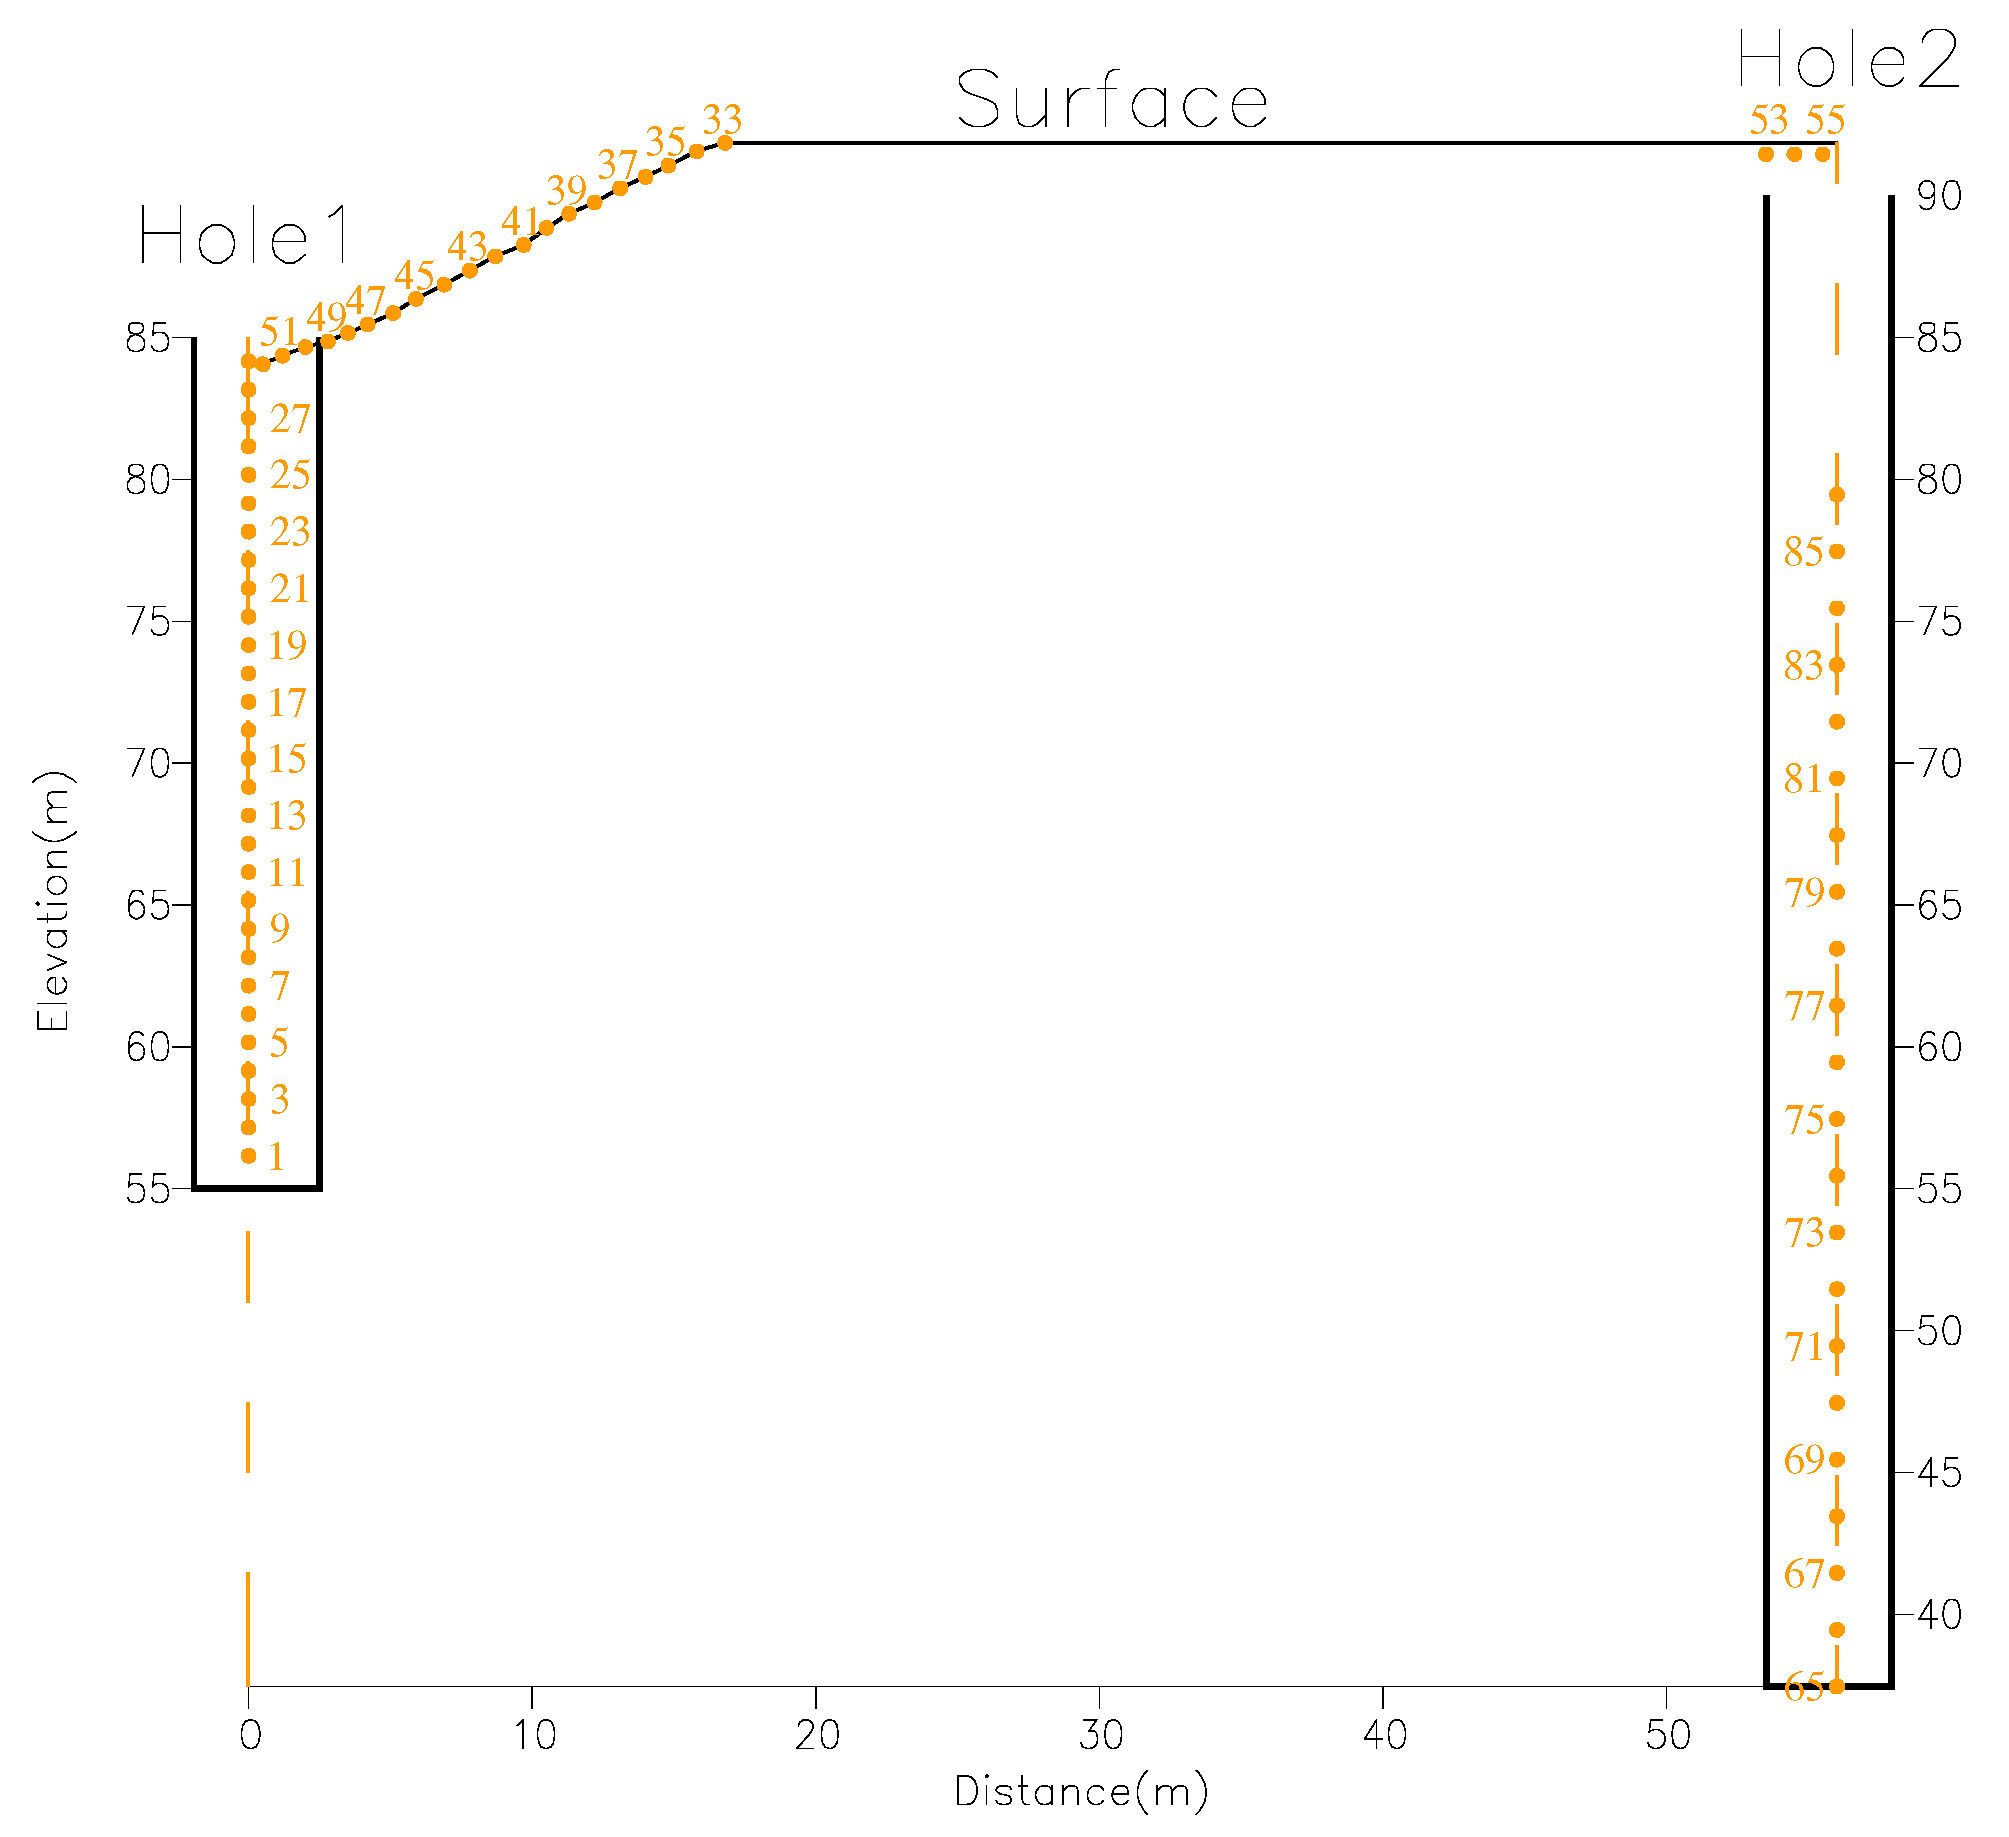
To avoid disrupting the railway operation, a borehole was arranged on each side of the railway during the test, designated as Hole 1 and Hole 2. The elevation and depth of Hole 1 are 84.34 m and 42.0 m, respectively, while those of Hole 2 are 91.49 m and 63.7 m. During data collection, observation electrode points were arranged to make full use of Hole 1, Hole 2, and the ground space between them. A cross-sectional view of the electrode point layout is shown in Figure 11. There were 28 electrodes (numbered 1–28) arranged in Hole 1 with a spacing of 1.0 m; 23 electrodes (numbered 33–55) were arranged on the ground with a spacing of 1.0 m. In Hole 2, 22 electrodes (numbered 65–86) were set with a spacing of 2.0 m.
Data acquisition was performed using the programmable full-waveform TerraRES-128 electrical resistivity system developed by Xi’an Shuyuan Technology. Complex observation configurations were achieved through programmable channel control, and full-waveform recording was used to improve the signal-to-noise ratio. The measurement apparatus included the AM-BN arrangements of Hole 1–Surface, Surface–Hole 2, and Hole 1–Hole 2. The electrode transformation parameters were set to a = 2, b = 2, S A = 1, S B  = 1.
The apparent resistivity of each rock and soil layer along the borehole wall can be directly obtained from well-logging data, providing accurate and reliable results. This is a widely used method for measuring stratum resistivity in geotechnical engineering. In this experiment, resistivity logging was carried out in Hole 1 using a gradient electrode system. The logging results help to understand the resistivity of each rock and soil layer within the scope of this exploration and further support the analysis of the resistivity CT results.

4.3. Results and Analysis

Figure 12 presents the results of current tests. Figure 12a shows the resistivity logging curve for Hole 1. Due to the absence of water in the shallow layer of Borehole 1, no data were obtained between the elevations of 84.15 m and 72 m. Additionally, a stepped borehole phenomenon happened during the field test, resulting in missing data in the lower section as well. The effective testing range was from 56 m to 72 m. The logging curve shows that the apparent resistivity of the rock and soil layers in the borehole can be divided into three distinct layers from top to bottom. The first layer, above 71 m elevation, corresponds to the fill soil and plain fill layers, with resistivity values greater than 200 Ω•m. The second layer, between 71 m and 58 m, corresponds to the fully and strongly weathered granite layers, with a resistivity value less than 150 Ω•m. The third layer, below 58 m, corresponds to the moderately weathered granite layer, with resistivity values exceeding 1000 Ω•m. These results indicate significant differences in electrical properties between various strata in this area, with a clear interface. Figure 12b summarizes the inversion resistivity results, topographic information, and geological analysis results. Several man-made structures, such as railway tracks, drainage ditches, and pipelines, are located on the surface. The terrain is steep on the side of the slope near Hole 1 and more gradual near Hole 2. According to the slope design data, the fill body is relatively uniform, has a distinct interface with the underlying original stratum, and exhibits some degree of stratification.
According to the inversion resistivity results, the electrical characteristics near Hole 1 are as follows: The resistivity is greater than 182 Ω•m at elevations above 71.5 m; greater than 1000 Ω•m at elevations below 58.0 m; and less than 150 Ω•m between 71.5 m and 58.0 m. These results are consistent with the resistivity logging data for Hole 1 shown in Figure 12a. The positions of electrical interfaces and apparent resistivity values align closely, indicating that the test results are effective and reliable.
According to the principle of geophysical interpretation, geological analysis of this resistivity profile suggests that the low-resistance zone in the middle of the profile corresponds to the slope sliding surface, with an estimated thickness of about 10 m. The high-resistivity layer above this zone represents the slope fill materials, while the high-resistivity layer beneath it corresponds to strongly and moderately weathered granite. At the railroad location, the foundation has been compacted, so the density is high. Also, it was treated for waterproofing, thereby the material in this area is expected to have high resistivity. The profile confirms this expectation, showing elevated resistivity values in that region. That is, the detection results are consistent with actual situations. In addition, near the drainage ditch, local cracking caused by the landslide allowed rainwater to infiltrate the area. This infiltration reduced the resistivity of the fill material, which should then exhibit low-resistivity characteristics. The cross-sectional profile indeed reveals low resistivity in this region. Once again, the detection results successfully reflect the actual conditions observed in the field.
Through engineering practice, the application of complex observation configurations in challenging terrain yielded ideal detection results. Specifically, there was strong consistency between the inversion resistivity values and the resistivity logging values within the borehole. Moreover, the relative sizes and shapes of the geological layers were also in good agreement. When compared with actual field conditions, the analysis results proved to be reasonable, and the interpretation results were highly reliable and convincing. These findings demonstrate that the resistivity exploration method proposed in this study holds significant application potential and offers a novel approach for slope investigation in special scenarios such as high-speed railway projects.

5. Discussion

Landslide hazards in high-speed railway slopes pose significant threats to human life and property. Therefore, it is very important to develop the technology for detecting the sliding surface of slopes. Current landslide investigations employ diverse technologies, including geotechnical testing, geophysical prospecting, and remote sensing [10,25,45,46]. Integrating these methods enables multi-parameter measurements, theoretically facilitating comprehensive slope stability assessments. However, practical engineering experience reveals limitations. Geotechnical testing provides only localized borehole data, failing to characterize the overall slope structure. Remote sensing captures surface displacement but cannot detect deep-seated structures (sliding surface depth, rock–soil interfaces), while dense vegetation further degrades optical remote sensing signals. Geophysical prospecting addresses these gaps via non-destructive detection of rock–soil property differences (e.g., electrical conductivity and seismic wave velocity). Crucially, landslide initiation strongly correlates with moisture content variations in slope media, and electrical conductivity exhibits a direct relationship with water content [47]. Among geophysical methods, Electrical Resistivity Tomography (ERT) has demonstrated significant efficacy in delineating slope sliding surfaces. Its ability to map subsurface hydrology and material heterogeneities has accelerated the adoption of applied technologies for rapid slope stability evaluation.
However, the morphological heterogeneity of slopes and environmental variability across sites challenge the adaptability of conventional survey configurations. Rigid application of a single electrode array is inadequate for diverse scenarios. Adhering to the fundamental theory of electrical prospecting, site-specific configurations must be designed for data acquisition to ensure reliable inversion results. No universal configuration suits all topographical conditions.
This study proposes a novel framework for slip surface detection in high-speed railway slopes under complex terrains, utilizing adaptive multi-configuration approaches. Nevertheless, broader implementation requires further research:
(1)
Adaptive Configuration Design: Techniques must be developed to dynamically adjust survey layouts based on topographical complexity and morphological features.
(2)
3D Adaptive Systems: Research should focus on 3D adaptive design techniques for survey configurations tailored to intricate topographies to enhance spatial accuracy in slip surface characterization.

6. Conclusions

The present study proposed a novel electrical imaging technique using a complex observation apparatus, specifically designed for complex terrain, based on differences in electrical properties between the slope sliding surface and the surrounding rock—applied in the context of high-speed railway slope investigation. A systematic study of this technique was conducted. First, simulation results demonstrated that different combinations of power supply electrodes (A and B) offer varying resolution capabilities for different regions. Accordingly, an A–M and B–N running pole configuration was designed, with adjustable isolation coefficients and step sizes. Numerical simulations of the high-speed railway slope indicated that, under complex terrain conditions, the complex observation apparatus—formed through multi-space combinations—achieved superior detection performance. The simulations also showed that using only Hole 1–Surface or Surface–Hole 2 configurations yielded suboptimal results, whereas the combined use of Hole 1–Surface, Surface–Hole 2, and Hole 1–Hole 2 significantly improved detection of the slope sliding surface. Second, an engineering field test was conducted to validate the simulation findings. The test results clearly revealed the developmental characteristics of the slope sliding surface in the high-speed railway scenario. The combined outcomes from simulation and practical application strongly support the conclusion that the proposed method can achieve effective slope disaster detection in a relatively short time.
Based on the theoretical research and practical analysis above, this technology is particularly suitable for high-precision shallow-depth detection tasks characterized by confined spaces, steep terrain, and large detection depth. During application, electrodes need to be placed in boreholes and on the surface, with data acquired using the AM-BN configuration array. Finally, high-resolution resistivity profiles can be obtained through borehole inversion with terrain correction. Building on this research, borehole–surface 3D complex surveying technology for electrical exploration will continue to be developed, thereby enriching high-precision shallow geophysical prospecting techniques.

Author Contributions

Conceptualization, H.L. and F.W.; methodology, H.L.; software, H.L. and Y.L.; formal analysis, H.L. and Y.L.; data curation, X.J.; writing—original draft preparation, H.L.; writing—review and editing, J.T. and F.W.; visualization, G.W. All authors have read and agreed to the published version of the manuscript.

Funding

This work has been supported by the National Key Research and Development Program of China (No. 2022YFE0134600) and Key Research and Development Program of Guangxi (No. AB22080055).

Institutional Review Board Statement

Not applicable.

Informed Consent Statement

Not applicable.

Data Availability Statement

The raw data supporting the conclusions of this article will be made available by the authors on request.

Acknowledgments

The authors sincerely would like to thank the editors and the reviewers for their valuable suggestions and meticulous review of the articles, and Bing Zhou for the guidance and comments on the revision of the article.

Conflicts of Interest

Author Jinyun Tang was employed by the company China Water Resources Pearl River Planning, Surveying & Designing Co., Ltd. The remaining authors declare that the research was conducted in the absence of any commercial or financial relationships that could be construed as a potential conflict of interest.

References

  1. State Council Leading Group for the First National Comprehensive Risk Census of Natural Disasters. Bulletin of the First National Comprehensive Risk Census of Natural Disasters; State Council of the People’s Republic of China: Beijing, China, 2024; accepted. [Google Scholar]
  2. Bardel, T. O antropogenicznych przyczynach powstania osuwiska na zboczu byłej kopalni iłów “Kantoria” w Tarnowie. Górnictwo I Geol. 2012, 7, 35–47. [Google Scholar]
  3. Xu, J.; Wei, Y.; Li, C. Discussion on monitoring technology proposal for high and steep side-Slope on railway in mountain area. In Proceedings of the 1st International Workshop on High-Speed and Intercity Railways; Springer: Berlin/Heidelberg, Germany, 2012; Volume 1, pp. 289–307. [Google Scholar]
  4. Bianchi, R.; Brambilla, F.; Hojat, A.; Tresoldi, G.; Zanzi, L. Long-term ERT monitoring data analysis to set slope instability attention thresholds based on water level fluctuations. In Proceedings of the 7th International Conference on Geotechnical and Geophysical Site Characterization, Marcos Arroyo & Antonio Gens, Barcelona, Spain, 18–21 June 2024; pp. 362–369. [Google Scholar]
  5. Li, Y.; Meng, H.; Dong, Y.; Hu, S.E. Types and Characteristics of Geological Disasters in China: Analysis Based on the Achievements of National County and City Level Geological Disaster Surveys. Chin. J. Geol. Hazard Control 2004, 15, 6–12. [Google Scholar] [CrossRef]
  6. Gao, J. Research on Slope Landslide Early Warning System Based on ANN-LSTM Hybrid Prediction Method. Ph.D. Dissertation, Jiangxi University of Science and Technology, Ganzhou, China, 2022. [Google Scholar] [CrossRef]
  7. Jiang, S.-H.; Li, D.-Q.; Zhang, L.-M.; Zhou, C.-B. Slope reliability analysis considering spatially variable shear strength parameters using a non-intrusive stochastic finite element method. Eng. Geol. 2014, 168, 120–128. [Google Scholar] [CrossRef]
  8. Kumar, P.R.; Muthukkumaran, K.; Sharma, C. Technological advancements and sustainable practices in rock slope stability—Critical review. Phys. Chem. Earth Parts A/B/C 2024, 136, 103699. [Google Scholar] [CrossRef]
  9. Bery, A.A. High Resolution in Seismic Refraction Tomography for Environmental Study. Int. J. Geosci. 2013, 4, 792–796. [Google Scholar] [CrossRef]
  10. Li, C.; Wei, L.; Xu, Q.; Yang, L.; Li, J.; Wan, X. Structural Detection and Stability Monitoring of Deep Strata on a Slope Using High-Density Resistivity Method and FBG Strain Sensors. Appl. Sci. 2024, 14, 3272. [Google Scholar] [CrossRef]
  11. Liu, X.R.; Zhang, L.; Yu, Y.; Liu, K. Study on the landslide mechanism of the Dayan slope in Youyang under rainfall conditions. Rock Soil Mech. 2013, 34, 2898–2904. [Google Scholar] [CrossRef]
  12. Wang, Y. Study on failure mechanism and stability of a high-steep slope for a high-speed railway. Railw. Investig. Surv. 2021, 47, 60–65+80. [Google Scholar] [CrossRef]
  13. Li, B. Deformation Monitoring of Railway Bridge Slope Adjacent to Landslide-Prone Mountain Area. Railw. Investig. Surv. 2024, 50, 28–33. [Google Scholar] [CrossRef]
  14. Wang, C.-Y.; Sundaram, P.; Goodman, R.E. Electrical resistivity changes in rocks during frictional sliding and fracture. Rock Frict. Earthq. Predict. 1978, 116, 717–731. [Google Scholar] [CrossRef]
  15. Perrone, A.; Piscitelli, S.; Lapenna, V. Electrical resistivity tomographies for landslide monitoring: A review. Berichte Geol. 2017, 93, 129–134. [Google Scholar]
  16. Jia, Z.; Zhang, J.M. The Application of High-Density Resistivity Method to the Evaluation on the Stability of Gongchangling Open Pit’s Slope. Appl. Mech. Mater. 2014, 686, 327–332. [Google Scholar] [CrossRef]
  17. Rahmani, T.R.; Sari, D.P.; Akmam, A.; Amir, H.; Putra, A. Using the Schlumberger configuration resistivity geoelectric method to analyze the characteristics of slip surface at Solok. J. Phys. Conf. Ser. 2020, 1481, 012030. [Google Scholar] [CrossRef]
  18. Maniruzzaman, S.; Balaji, S.; Bhat, G.R. Assessment of rainfall-induced slope failures at Chakargoan, Port Blair, India, using 2D ERT and self-potential techniques. J. Earth Syst. Sci. 2024, 133, 223. [Google Scholar] [CrossRef]
  19. Juwono, A.M. Study of Subsurface Conditions of Southern Cross Road Using the Wenner-Schlumberger Method for Disaster Mitigation. Int. J. GEOMATE 2022, 23, 97–105. [Google Scholar] [CrossRef]
  20. Advanced Geosciences Inc. Instruction Manual for EarthImager 2D. Version 2.4.0, Advanced Geosciences Inc., 2009. Available online: https://www.agiusa.com/ (accessed on 20 May 2019).
  21. Tsai, W.-N.; Chen, C.-C.; Chiang, C.-W.; Chen, P.-Y.; Kuo, C.-Y.; Wang, K.-L.; Lin, M.-L.; Chen, R.-F. Electrical Resistivity Tomography (ERT) Monitoring for Landslides: Case Study in the Lantai Area, Yilan Taiping Mountain, Northeast Taiwan. Front. Earth Sci. 2021, 9, 737271. [Google Scholar] [CrossRef]
  22. Erginal, A.E.; Öztürk, B.; Ekinci, Y.L.; Demirci, A. Investigation of the nature of slip surface using geochemical analyses and 2-D electrical resistivity tomography: A case study from Lapseki area, NW Turkey. Environ. Geol. 2008, 58, 1167–1175. [Google Scholar] [CrossRef]
  23. Susilo, A.; Suryo, E.A.; Fitriah, F.; Sutasoma, M. Preliminary study of landslide in Sri Mulyo, Malang, Indonesia using resistivity method and drilling core data. GEOMATE J. 2018, 15, 161–168. [Google Scholar] [CrossRef]
  24. Syukri, M.; Anda, S.T.; Safitri, R.; Fadhli, Z.; Saad, R. Prediction of Soil Liquefaction Phenomenon in Banda Aceh and Aceh Besar, Indonesia using Electrical Resistivity Tomography (ERT). GEOMATE J. 2020, 18, 123–129. [Google Scholar] [CrossRef]
  25. Santosa, I.; Sulaksana, N.; Yuningsih, E.T.; Zakaria, Z. The Sliding Surface Determination of A Deep-seated Landslide on Cisumdawu Highway, West Java, Based on The Electrical Resistivity Tomography. Indones. J. Geosci. 2024, 11, 189–199. [Google Scholar] [CrossRef]
  26. Takeshhi, K. The topographic effect in resistivity prospecting. Geophys Explor (Butsuri-Tansa) 1953, 6, 51–54. [Google Scholar]
  27. Papazian, P.B. Topographic Modeling of Resistivity Surveys Using the Schwarz-Christoffel Transformation. Master’s Thesis, Colorado School of Mines, Golden, CO, USA, 1979. [Google Scholar]
  28. Du, H.; Wu, X. Three-dimensional unstructured finite element numerical modeling of time-domain induced polarization method under undulating terrain. J. Univ. Sci. Technol. China 2020, 50, 705–714. [Google Scholar]
  29. Dahlin, T.; Zhou, B. A numerical comparison of 2D resistivity imaging with 10 electrode arrays. Geophys. Prospect. 2004, 52, 379–398. [Google Scholar] [CrossRef]
  30. Dahlin, T.; Zhou, B. Multiple-gradient array measurements for multichannel 2D resistivity imaging. Near Surf. Geophys. 2005, 4, 113–123. [Google Scholar] [CrossRef]
  31. Wang, G.; Wang, Q.C.; Guo, G.L.; Yuan, W.Q.; Huang, P. Comparative study of different array configurations in high-density electrical method for geological investigation. Coal Sci. Technol. 2020, 39, 68–70. [Google Scholar] [CrossRef]
  32. Weili, G.; Xiankun, J.; Yun, B.; Jifei, C. Application of combined inversion with different array configurations of high-density electrical method in detecting coal mine goaf. Geotech. Investig. Surv. 2023, 51, 67–71. [Google Scholar]
  33. Zhou, B.; Bouzidi, Y.; Ullah, S.; Asim, M. A full-range gradient survey for 2D electrical resistivity tomography. Near Surf. Geophys. 2020, 18, 609–626. [Google Scholar] [CrossRef]
  34. Xiaolong, W.; Hong, F.; Huaguang, T.; Di, W. Forward modeling of direct current resistivity methods based on COMSOL Multiphysics. Coal Geol. Explor. 2011, 39, 76–80. [Google Scholar]
  35. Hao, Y.J.; Li, H.; Wu, Y. Research on advance detection of DC resistivity method in excavating roadways based on COMSOL. Coal Mine Mod. 2020, 6, 104–106. [Google Scholar] [CrossRef]
  36. Zhao, G.Y.; Wang, J.; Zhai, P.H.; Li, C.S.; Liu, L.J. Research on advance detection in mines using DC resistivity method based on COMSOL Multiphysics numerical simulation. Coal Sci. Technol. 2018, 37, 177–179. [Google Scholar] [CrossRef]
  37. Li, Z.Q.; Li, C.W.; Song, W.W.; Zhou, X.; Wu, S.Y.; Xiong, B. Three-dimensional magnetotelluric numerical simulation of undulating terrain based on COMSOL. Geol. Explor. 2022, 58, 107–117. [Google Scholar]
  38. Gao, W.F.; Wang, K.W.; Hu, A.S.; Wang, N.J. DC resistivity advance detection technology using three-point source excitation based on COMSOL. Coal Mine Saf. 2023, 54, 168–172. [Google Scholar] [CrossRef]
  39. Zeng, C. Research on Precise Leakage Quantification Assessment Method for Landfills Based on Electrical Methods and Its Application. Ph.D. Dissertation, Chongqing Jiaotong University, Chongqing, China, 2022. [Google Scholar] [CrossRef]
  40. Huang, R.; Xu, Q. Geohazard Process Simulation and Process Control: Theoretical Framework of Deformation Mechanics-Based Geohazard Evaluation and Mitigation Design. Prog. Nat. Sci. 1999, 9, 124–130. [Google Scholar]
  41. Duncan, J.M.; Wright, S.G.; Brandon, T.L. Soil Strength and Slope Stability; John Wiley & Sons: New York, NY, USA, 2014. [Google Scholar]
  42. Varnes, D.J. Landslide types and processes. Landslides Eng. Pract. 1958, 24, 20–47. [Google Scholar]
  43. Yingren, Z.; Zuyu, C.; Gongxian, W.; Tianqing, L. Slope and Landslide Engineering Mitigation; China Communications Press: Beijing, China, 2007; accepted. [Google Scholar]
  44. Zhou, B.; Dahlin, T. Properties and effects of measurement errors on 2D resistivity imaging surveying. Near Surf. Geophys. 2003, 1, 105–117. [Google Scholar] [CrossRef]
  45. Yang, Y.S.; Yeh, H.F.; Ke, C.C.; Wei, L.W. Assessing shallow slope stability using electrical conductivity data and soil hydraulic characteristics. Eng. Geol. 2024, 331, 107447. [Google Scholar] [CrossRef]
  46. Wei, L.; Zeng, Z.; Yan, J. Factors Affecting the Stability of Loess Landslides: A Review. Appl. Sci. 2024, 14, 2735. [Google Scholar] [CrossRef]
  47. Chung, C.-C.; Lin, C.-P.; Yang, S.-H.; Lin, J.-Y.; Lin, C.-H. Investigation of non-unique relationship between soil electrical conductivity and water content due to drying-wetting rate using TDR. Eng. Geol. 2019, 252, 54–64. [Google Scholar] [CrossRef]
Figure 1. Basic workflow of applying COMSOL for resistivity simulation.
Applsci 15 09091 g001
Figure 2. Morphological characteristics of the slope sliding surface.
Applsci 15 09091 g002
Figure 3. Schematic diagram of electrode arrangement for detecting the sliding surface of the slope.
Applsci 15 09091 g003
Figure 4. Electric field distributions under different electrode configurations. (a) A/B were all on ground surface; (b) A was in hole and B was on ground surface; (c) A/B were all in hole; (d) distribution of electric field and potential under condition (a); (e) distribution of electric field and potential under condition (b); (f) distribution of electric field and potential under condition (c).
Applsci 15 09091 g004
Figure 5. Schematic diagram of slope imaging areas.
Applsci 15 09091 g005
Figure 6. Separate working apparatuses (A-M and B-N).
Applsci 15 09091 g006
Figure 7. Forward modeling value when A = 1#, a = 1, b = 1, S_B = 1.
Applsci 15 09091 g007
Figure 8. V m n value as A-M was in Hole 1, B-N was on the surface, a = 1, and b = 1.
Applsci 15 09091 g008
Figure 9. The imaging results under different observation attributes: (a) Hole 1–Surface, (b) Surface–Hole 2, and (c) Hole 1–Surface–Hole 2.
Applsci 15 09091 g009
Figure 10. The location of the on-site testing zone: (a) the location of the testing area and (b) drilling histogram of Hole 1.
Applsci 15 09091 g010
Figure 11. Cross-sectional view of electrode point layout under complex observation attributes.
Applsci 15 09091 g011
Figure 12. Test results of applying the complex arrangement to detect the sliding of slope: (a) apparent resistivity of Hole 1 and (b) Hole 1–Surface–Hole 2 inversion results analysis overlay.
Applsci 15 09091 g012
Disclaimer/Publisher’s Note: The statements, opinions and data contained in all publications are solely those of the individual author(s) and contributor(s) and not of MDPI and/or the editor(s). MDPI and/or the editor(s) disclaim responsibility for any injury to people or property resulting from any ideas, methods, instructions or products referred to in the content.