Article

Research on Performance Testing Methods for Electrical Equipment in High-Speed and Complex Environments: A Case Study on Roof Insulators of High-Speed Trains

1
Xuefeng Mountain Energy Equipment Safety Field Scientific Observation and Research Station, Chongqing University, Chongqing 400044, China
2
State Key Laboratory of Disaster Prevention & Reduction for Power Grid, Changsha University of Science & Technology, Changsha 410114, China
3
School of Energy and Power Engineering, University of Shanghai for Science and Technology, Shanghai 200093, China
*
Author to whom correspondence should be addressed.
Appl. Sci. 2025, 15(16), 9076; https://doi.org/10.3390/app15169076
Submission received: 11 July 2025 / Revised: 16 August 2025 / Accepted: 16 August 2025 / Published: 18 August 2025

Abstract

This paper proposes a rotating test method to address the limitations of high costs and the inability to replicate high-speed multiphase environments in icing wind tunnels and artificial climate chambers. The method simulates high-speed multiphase in an enclosed space using relative motion and duct regulation at a lower cost. Using the FQJG2-30/16-400 type roof insulator, the Eulerian–Eulerian and CFD (computational fluid dynamics) method was employed to compare the proposed rotating method with traditional linear airflow tests in wind–sand erosion and high-speed icing experiments. Results show maximum differences of 3.23% in the collision rate and 4.34% in the icing mass, indicating good consistency. Validation experiments in an artificial climate chamber further confirmed the feasibility of the rotating test method, with icing mass differences within 5–8%. This study provides a cost-effective approach for high-speed testing in multiphase environments.

1. Introduction

The operation of mechanical and electrical equipment at high speeds in complex environments is a very common working condition. Examples such as high-speed trains, airplanes, wind turbines, etc. operate at high speeds in environments with low temperatures, ice coverage, sand and dust, and salt fog over a long time. Therefore, their characteristics in a complex airflow field environment directly affect their stability and lifespan [1,2,3]. Taking high-speed rail as an example, long-term high-speed motion in sandy or low-temperature regions can lead to roof insulator material degradation and even flashover due to erosion and icing [4,5,6]. Similarly, wind turbine blades and high-speed aircraft also face similar issues, necessitating high speed multiphase testing to assess their long-term operational reliability [7,8,9].
Currently, wind tunnel and artificial climate chamber tests are widely used in the industry for the high-speed multiphase flow test [10,11]. The icing test is usually conducted in an ice wind tunnel. Ice wind tunnels can simulate low-temperature, high-humidity icing environments and have adjustable wind speeds. Liu et al. [12] and Zhang et al. [13] used ice wind tunnels to investigate the icing characteristics of offshore wind turbines blades. Guo [14] utilized a semi-open ice wind tunnel to study the icing characteristics of vertical-axis wind turbines in various environmental conditions. Malik et al. [15] investigated the water film backflow phenomena on aircraft wing surfaces under various powers of thermal de-icing systems using the ice wind tunnel at the University of Brunswick Institute of Technology. Han et al. [16] conducted icing tests on aircraft airfoils under normal and supercooled large droplets in the NRC-AIWT icing wind tunnel. Icing wind tunnel tests have provided the foundation for revealing icing mechanisms and have played a significant role in the study of de-icing for structures. However, wind tunnels are costly, functionally limited, and unable to create complex atmospheric environments test conditions internally. For instance, the ice wind tunnel can only conduct ice coverage tests, but cannot carry out other complex environmental tests.
Artificial climate chambers can simulate environments such as contamination and rain and support high-voltage testing, and they are widely used in research on erosion and contamination accumulation [17,18]. Fan [19] conducted glazed ice simulation experiments on insulators in an artificial climate chamber and studied the surface hydrophobicity and anti-icing performance. In addition, Wang [20] investigated the impact of contamination levels on the insulation of 220 kV composite insulators under minor icing conditions. Qiu [21] investigated the pollution flashover characteristics of 220 kV hollow porcelain insulators at different altitudes and contamination levels through artificial climate chamber tests. Zhang [22] investigated the aging of insulators eroded by sand in southern Xinjiang and explored the changes in surface roughness and elemental composition after aging from a microscopic perspective. Artificial climate chamber tests can simultaneously simulate multiphase flow and conduct energized tests. However, the existing artificial climate chambers were not designed for experiments involving high-speed airflow fields, and it is difficult to simulate high-speed airflow inside them, making them also unable to meet the requirements for high-speed multiphase tests.
To address the problem, this paper proposes a testing method based on a rotating reference frame. This method creates the required multiphase within the test space, then accelerates the sample to high speed through rotation. A designed duct is used to homogenize the flow field in the test section, thereby generating a high-speed uniform multiphase flow. This paper first presents the overall design scheme of the proposed method, and then attempts to prove the validity of this experimental method from the perspective of the flow field. The rotating reference frame method is used to solve the three-dimensional rotational flow field in this research. This method has been applied and the accuracy demonstrated in the study of rotating flow field characteristics in pump machinery [23], rotating wheel brake discs [24], helicopter rotors [25], and biological stirrers [26]. Subsequently, using high-speed rail roof insulators as the test objects, the equivalence of the rotating and linear airflow fields in collision and accumulation tests is compared through numerical simulation. Finally, icing tests on the insulator in an artificial climate chamber further validate the equivalence between the proposed and linear test methods.

2. Rotating High-Speed Multiphase Flow Generator

2.1. Flow-Field Uniformity Metrics

2.1.1. Uniformity of Flow Rate

Two primary metrics are used to evaluate velocity uniformity: velocity uniformity and the dynamic pressure coefficient. The velocity uniformity metric is defined as the root mean square value of the velocity deviation within the model region of the test section. The dynamic pressure coefficient, conversely, represents the average deviation of the dynamic pressure field within the same model region. Although their definitions differ, both metrics describe the uniformity of the velocity field. In this study, the dynamic pressure coefficient was selected to characterize the uniformity of the velocity field. The dynamic pressure coefficient at any point in the flow field is defined as the deviation of the local dynamic pressure from the average dynamic pressure value in the model region, expressed as follows:
μ i = q i q a 1
where qi denotes the dynamic pressure at a given point; qa represents the average dynamic pressure value over the entire model region.
q i = 1 2 ρ v 2
Ideally, the dynamic pressure coefficient should be minimized. A value closer to zero indicates greater uniformity in the velocity field magnitude within the test section.

2.1.2. Uniformity of the Directional Field

The evaluation index for the uniformity of the flow field is primarily the airflow deviation angle. The airflow deviation angle refers to the angle at which the direction of the airflow at a given location deviates from the mainstream direction, reflecting the uniformity of the flow direction, which is mainly influenced by the transverse pressure gradient. The definition of the airflow deviation angle is as follows:
β i = arctan v y 2 + v z 2 v x
where βi denotes the flow deflection angle at a given point; vx represents the velocity component along the x-axis (primary flow direction); vy and vz are the components along the y-axis and z-axis, respectively.

2.2. Test Space and Rotating Device

Figure 1 is the schematic diagram of the rotating device. An enclosed test space is formed inside the laboratory, and the high-speed rotating drive system is placed inside. The laboratory is designed to be sealed and heat-insulated to meet the requirements of low temperature and pressure tests, and a complex environment generation system installed to simulate various multiphase flows. The high-speed rotary drive system mainly comprises a self-balancing guide rail and slide system, a uniform-flow accelerating duct, and a high-speed drive system. The self-balancing guide rail and slide system supports the high-speed duct, it is the core of the high-speed motion platform, and it limits the rotating parts to only carry out high-speed circular motion along the guide rail. An automatic balancing device is installed on the opposite side of the duct to ensure the system’s stability at high-speed rotation. The asymmetric uniform-flow accelerating duct consists of contraction, test, and spread sections. It is fixed between the guide rails by two slides and is driven by the rotating direction and a connection rod to carry out high-speed circular motion on the guide rail. The primary work of this paper was to validate the equivalence of the proposed method and the apparatus in airflow testing.

2.3. Uniform-Flow Acceleration Duct

The multiphase flow test requires a uniform flow field. The generation of the flow field in this method is based on rotational motion. Different rotating radii of the test section airflow lead to different radial airflow velocities, affecting the test flow field quality. Within the symmetric duct structure of the test section, the airflow deflects radially outward, relative to the rotational motion. Consequently, the flow velocity at the outer radius of the rotating test section exceeds that at the inner radius. This phenomenon fundamentally arises from the asymmetry in the relative linear velocities induced by the rotation. To solve this problem, an asymmetric uniform-flow accelerating duct was designed to offset the deviation of the flow field in the test section by compensating the incoming flow, as shown in Figure 2.
In the XOY plane, the rotational motion results in a lower flow velocity in the lower half of the test section. To compensate for this discrepancy, the contraction section is designed with a larger opening in the lower half, allowing more airflow to enter the duct through this region. It is important to note that the duct is asymmetric only in the XOY cross-section (radial cross-section), while it remains axially symmetric in the XOZ cross-section (axial cross-section), as there is no velocity offset in the XOZ plane.
In Figure 2, L1, L2, and L3 correspond to the lengths of the contraction section, test section, and spread section, respectively. D11 and D12 denote the heights of the upper and lower regions of the contraction section in the XOY plane. Research indicates that the parameters primarily influencing the flow field quality in the test section are D11, D12. By conducting topology optimization of these three parameters with the flow field uniformity as the objective, their specific values are obtained as shown in Table 1.
Using CFD methods, the parameters of the asymmetric duct were optimized. As illustrated in Figure 3, after optimization, the dynamic pressure coefficient in the test section decreased by 37.38%, and the flow deviation angle was reduced by 39.88%. The flow field uniformity now meets the experimental requirements. When specific values of 0.4 m and 0.6 m were assigned to D11 and D12, respectively, the axial dynamic pressure coefficient and flow deviation angle were minimized. With this configuration, the duct demonstrated the optimal flow uniformity.

3. Numerical Model and Methodology

3.1. Computational Domain and Mesh

The computations were performed using k-ε turbulence model, and employed a multiple reference frame (MRF) approach as shown in Figure 4. Data transfer between the inside and outside domains is achieved through interpolation. The diagrams of mesh generation are displayed in Figure 5, and the detailed information of boundary conditions and mesh setting are shown in Table 2. Figure 6 shows the grid independence verification results, confirming that the total number of 800 W grid partitions selected meets the calculation requirements. The final grid quality is shown in Table 3.

3.2. Governing Equations of Airflow Field

The fluid in both the inside and outside computational domains satisfies the conservation of mass, momentum, and energy equations. Equations (1)–(3) represent the general form of these equations:
ρ t + · ρ v = 0
t ( ρ v ) + · ρ v v = p + τ i j + ρ g
ρ E t + ρ v H = κ T + v i τ i j + ρ g v
where t is the time; ρ is the fluid density; v is the velocity vector; τij is the viscous stress tensor; g is the gravity acceleration; H is the total entropy of fluid; T is the fluid temperature; κ is the thermal conductivity; E is the material energy.
In the inside domain, the rotation of the reference frame must be considered. The velocity and acceleration transformation equations are given by Equations (4) and (5). Substituting Equations (4) and (5) into Equations (1)–(3) yields the control equations for the rotating flow field:
v = ω × r + v r
a = d v d t = 2 ω × v r + ω × ( ω × r ) + α × r + a r
where vr is the velocity vector under the rotating reference frame; ω is the angular velocity of the rotating reference frame; a and ar are the angular acceleration under the stationary and rotating reference frame, respectively.

3.3. Governing Equations for the Parti Kelvin Phase

The Euler model is used to calculate the rotating multiphase flow due to its superior convergence performance in complex geometries. The test particles are assumed to be spheres without considering their deformation, phase change, and influence on air [27]. The Coriolis and centrifugal forces to the left of the momentum conservation equation represent rotational effects. The first term to the right of the momentum conservation equation represents resistance, and the second term represents external volumetric forces such as buoyancy and gravity. The resistance of the droplets plays a major role. The distribution of particles can be obtained by solving the continuity and momentum equations under the rotating reference frame:
α d ρ d t + · α d ρ d v dr = 0
t ( α d ρ d v d ) + · α d ρ d v dr v dr + α d ρ d ( 2 ω × v dr + ω × ( ω × r ) + α × r + a r ) = C D r Re dr 24 K r α d ρ d ( v ar v dr ) + α d ρ d ( 1 ρ ρ d ) 1 F r r
where subscripts a, d, and r represent the parameters of air phase, particle phase, and rotation, respectively; α is the volume fraction; CD is the drag coefficient; Red is the Reynolds number of particles, K is the droplets inertial parameter. Frr is the external volumetric force, such as the interaction force of two-phase flow, etc. A source term is added to the momentum equation to introduce the Coriolis and centrifugal forces acting on the fluid in the rotating reference frame:
2 ( ω × v r ) ω × ( ω × r )
The empirical formula for the droplet resistance coefficient is the following:
C D r = 24 R e d r 1 + 0.15 Re d r 0.687 R e d r 1300 C D r = 0.4 R e d r > 1300

4. Equivalence Analysis Between Rotational and Linear Testing Methods

4.1. Test Insulator

Taking the roof insulator on a high-speed rail train as an example, the high-speed multiphase flow test can be divided into two types. The first is the particle collision test, which researches the collision process when the high-speed rail runs in rain, sandstorm, and haze areas. Another type is the particle accumulation test, which focuses on particle accumulation behavior, such as ice and pollution. This chapter verifies the equivalence between rotating and linear high-speed multiphase tests by simulating icing and sandstorm colliding with the insulators. The insulator was placed in the duct test section, and numerical simulations were used to research the similarities between the rotating and linear testing method.
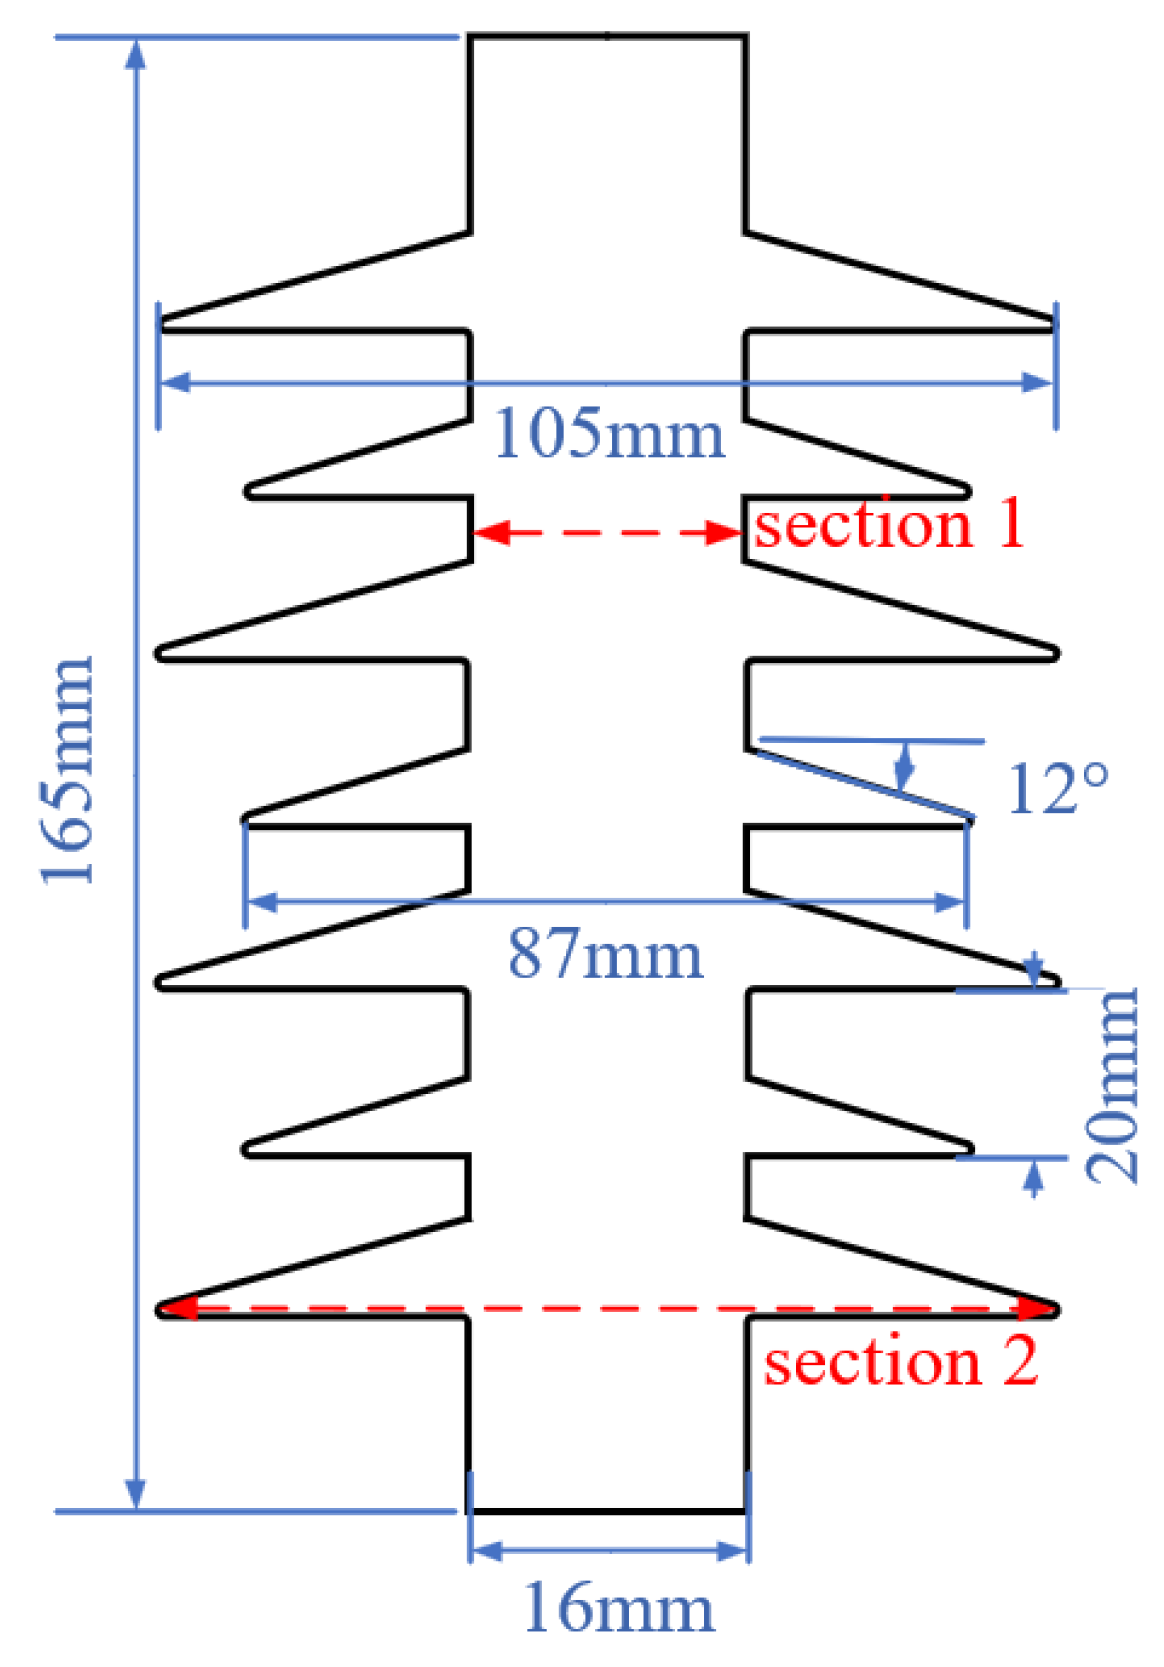
Considering the wall effect, it should be noted that a 1/2 scale model (to avoid the wall effect) of the FQJG2-30/16-400 insulator was used in the study, with geometric parameters as shown in Figure 7. Geometric parameters of the duct in the following tests are shown in Table 1. The particle diameter dm is 20 μm, the particle density ρd is 1000 kg/m3, and the particle volume mass ωd is 0.6 g/m3.

4.2. Equivalence on Collision Test

The continuous impact of high-speed particles can cause erosion on the surface of the insulators on the train roof, which affects their insulating properties and accelerates aging. Particle impact testing can be employed to investigate this erosive effect. Figure 8a presents the airflow velocity contour in the XOY plane in the test section of the rotating airflow test apparatus. As shown in the figure, after geometric optimization of the duct, the geometric structure exhibits an asymmetrical shape at the inlet; the inflow velocity in the test section reaches 67 m/s at a rotational radius of 6 m and a rotational speed of 60 rpm. Figure 8b presents the velocity distribution in the XOZ plane. Owing to the turbulence generated on both sides of the insulator, the velocities on both sides increase, with a greater increase observed on the upper and lower sides of the rod compared to the skirt region, leading to the maximum velocity in this area. Moreover, the velocity distribution in the far-field area of the test section is uniform. This indicates that the flow field obtained using the rotating test method meets the requirements.
Collision characteristics can be characterized by the local collision rate of particles on the surface; the local collision rate is defined as the ratio of the actual droplet collision rate on a differential surface element to the theoretical maximum droplet collision rate attainable on that same surface element. It serves as a dimensionless parameter characterizing the water collection capability of the differential surface, which is defined as follows:
β p = a d ρ d ( v d · n f ) ω d V , a
where vd is the local particle velocity; nf is the local normal direction vector.
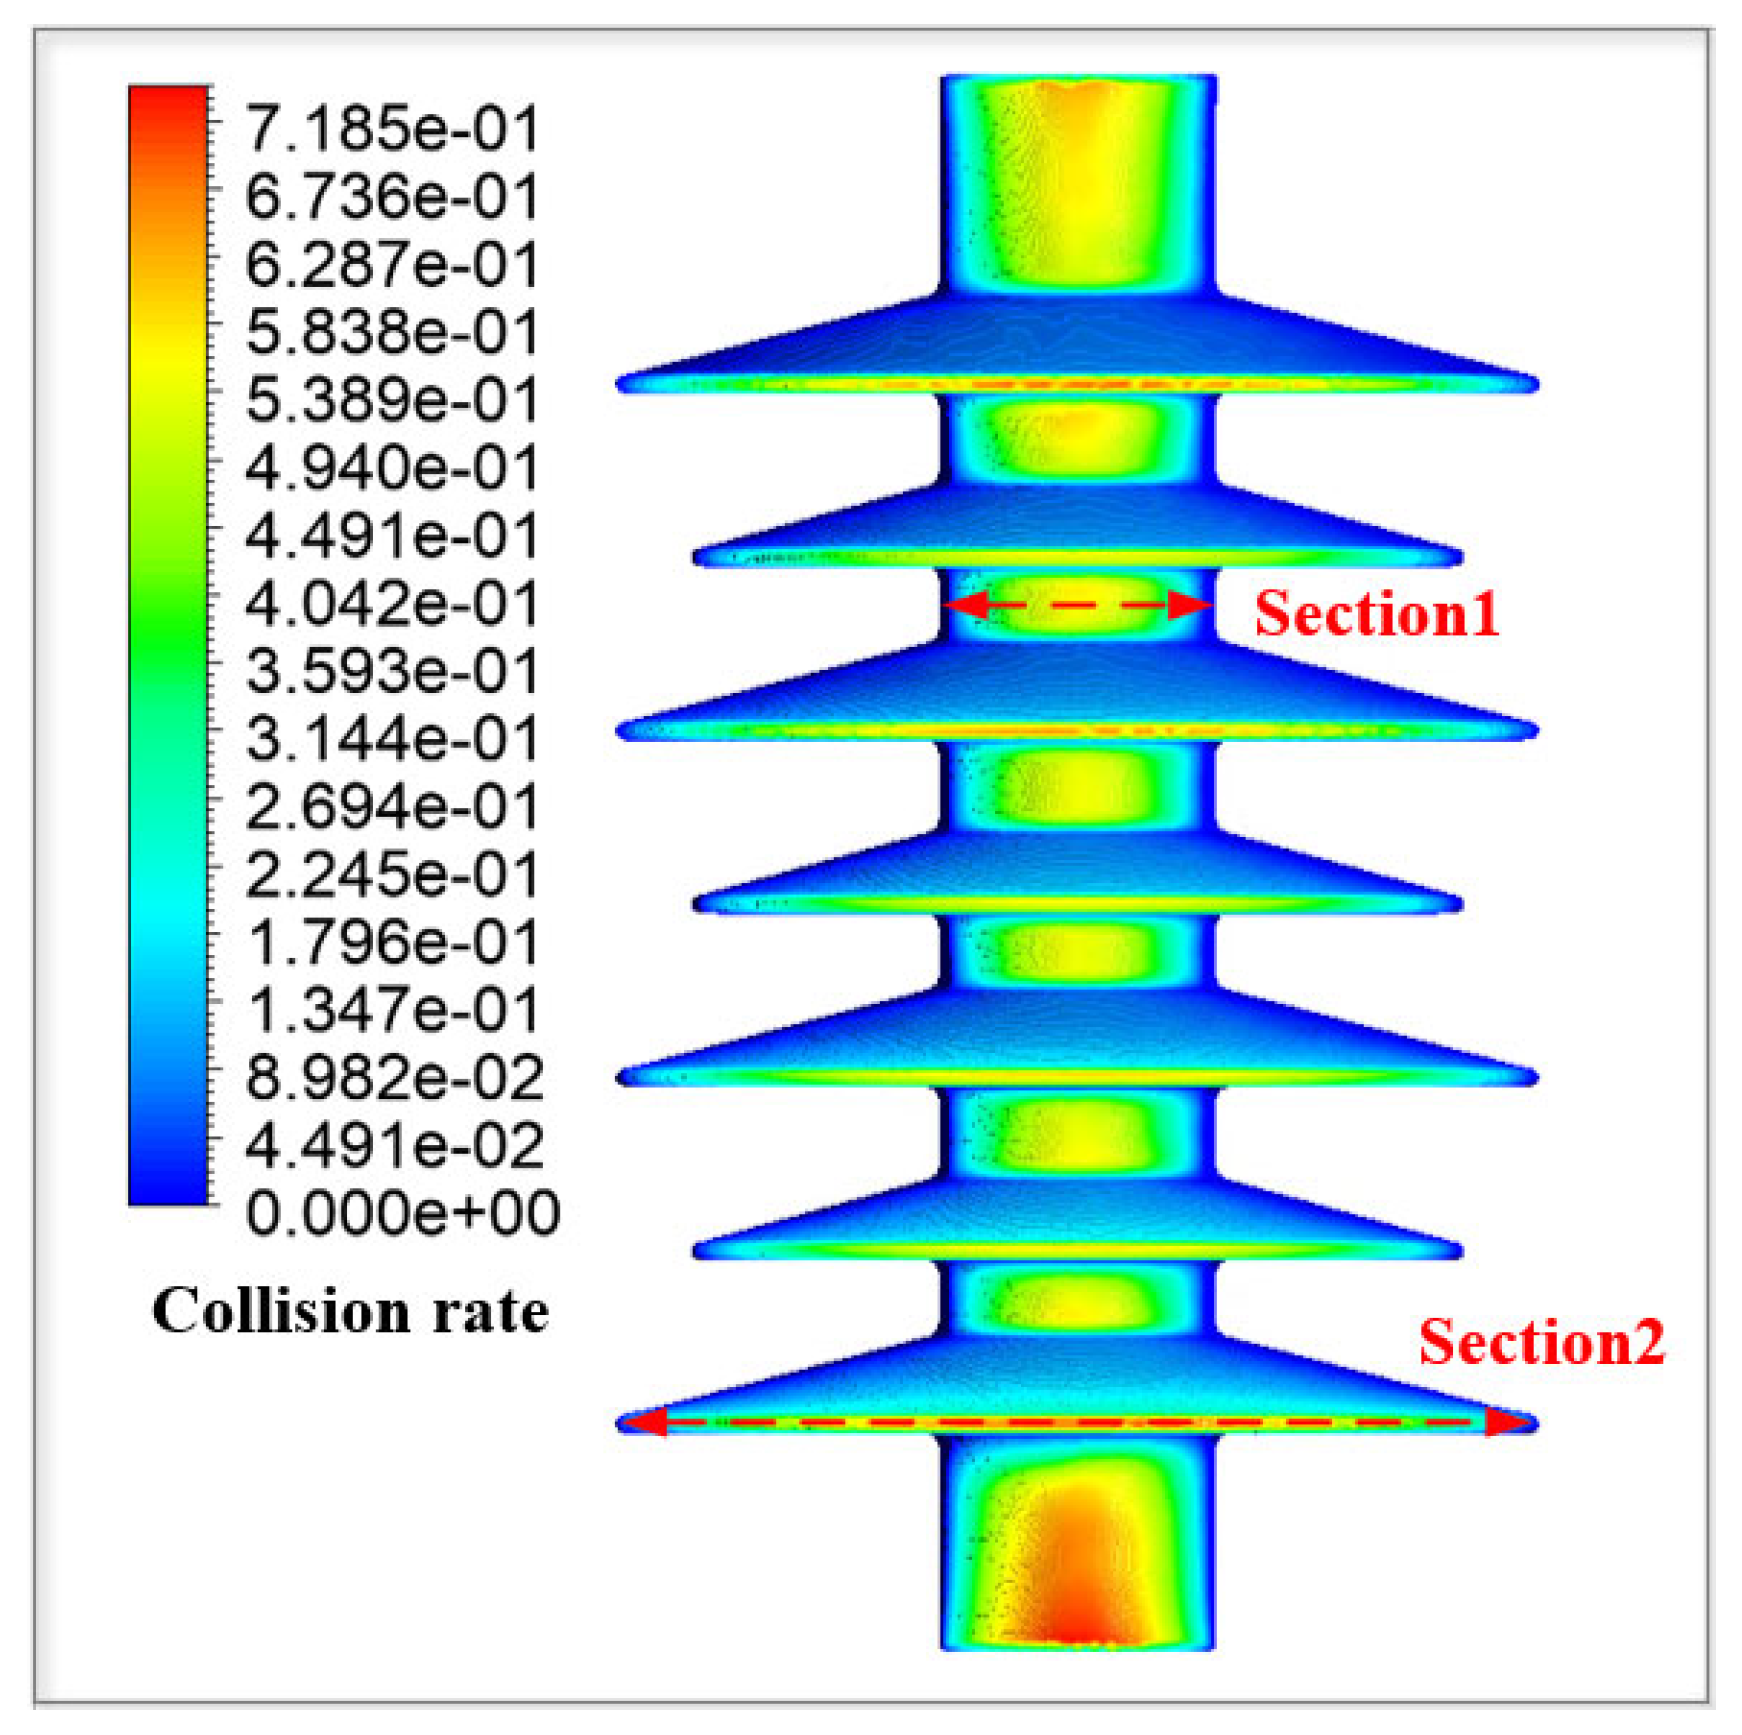
Figure 9 illustrates the collision rate on the insulator surface under the rotating test method. As shown in the figure, particles primarily collide with the windward side of the insulator. The region with the highest impact rate is the central part of the insulator, particularly concentrated on the rod and the edges of the sheds, which is consistent with the actual situation.
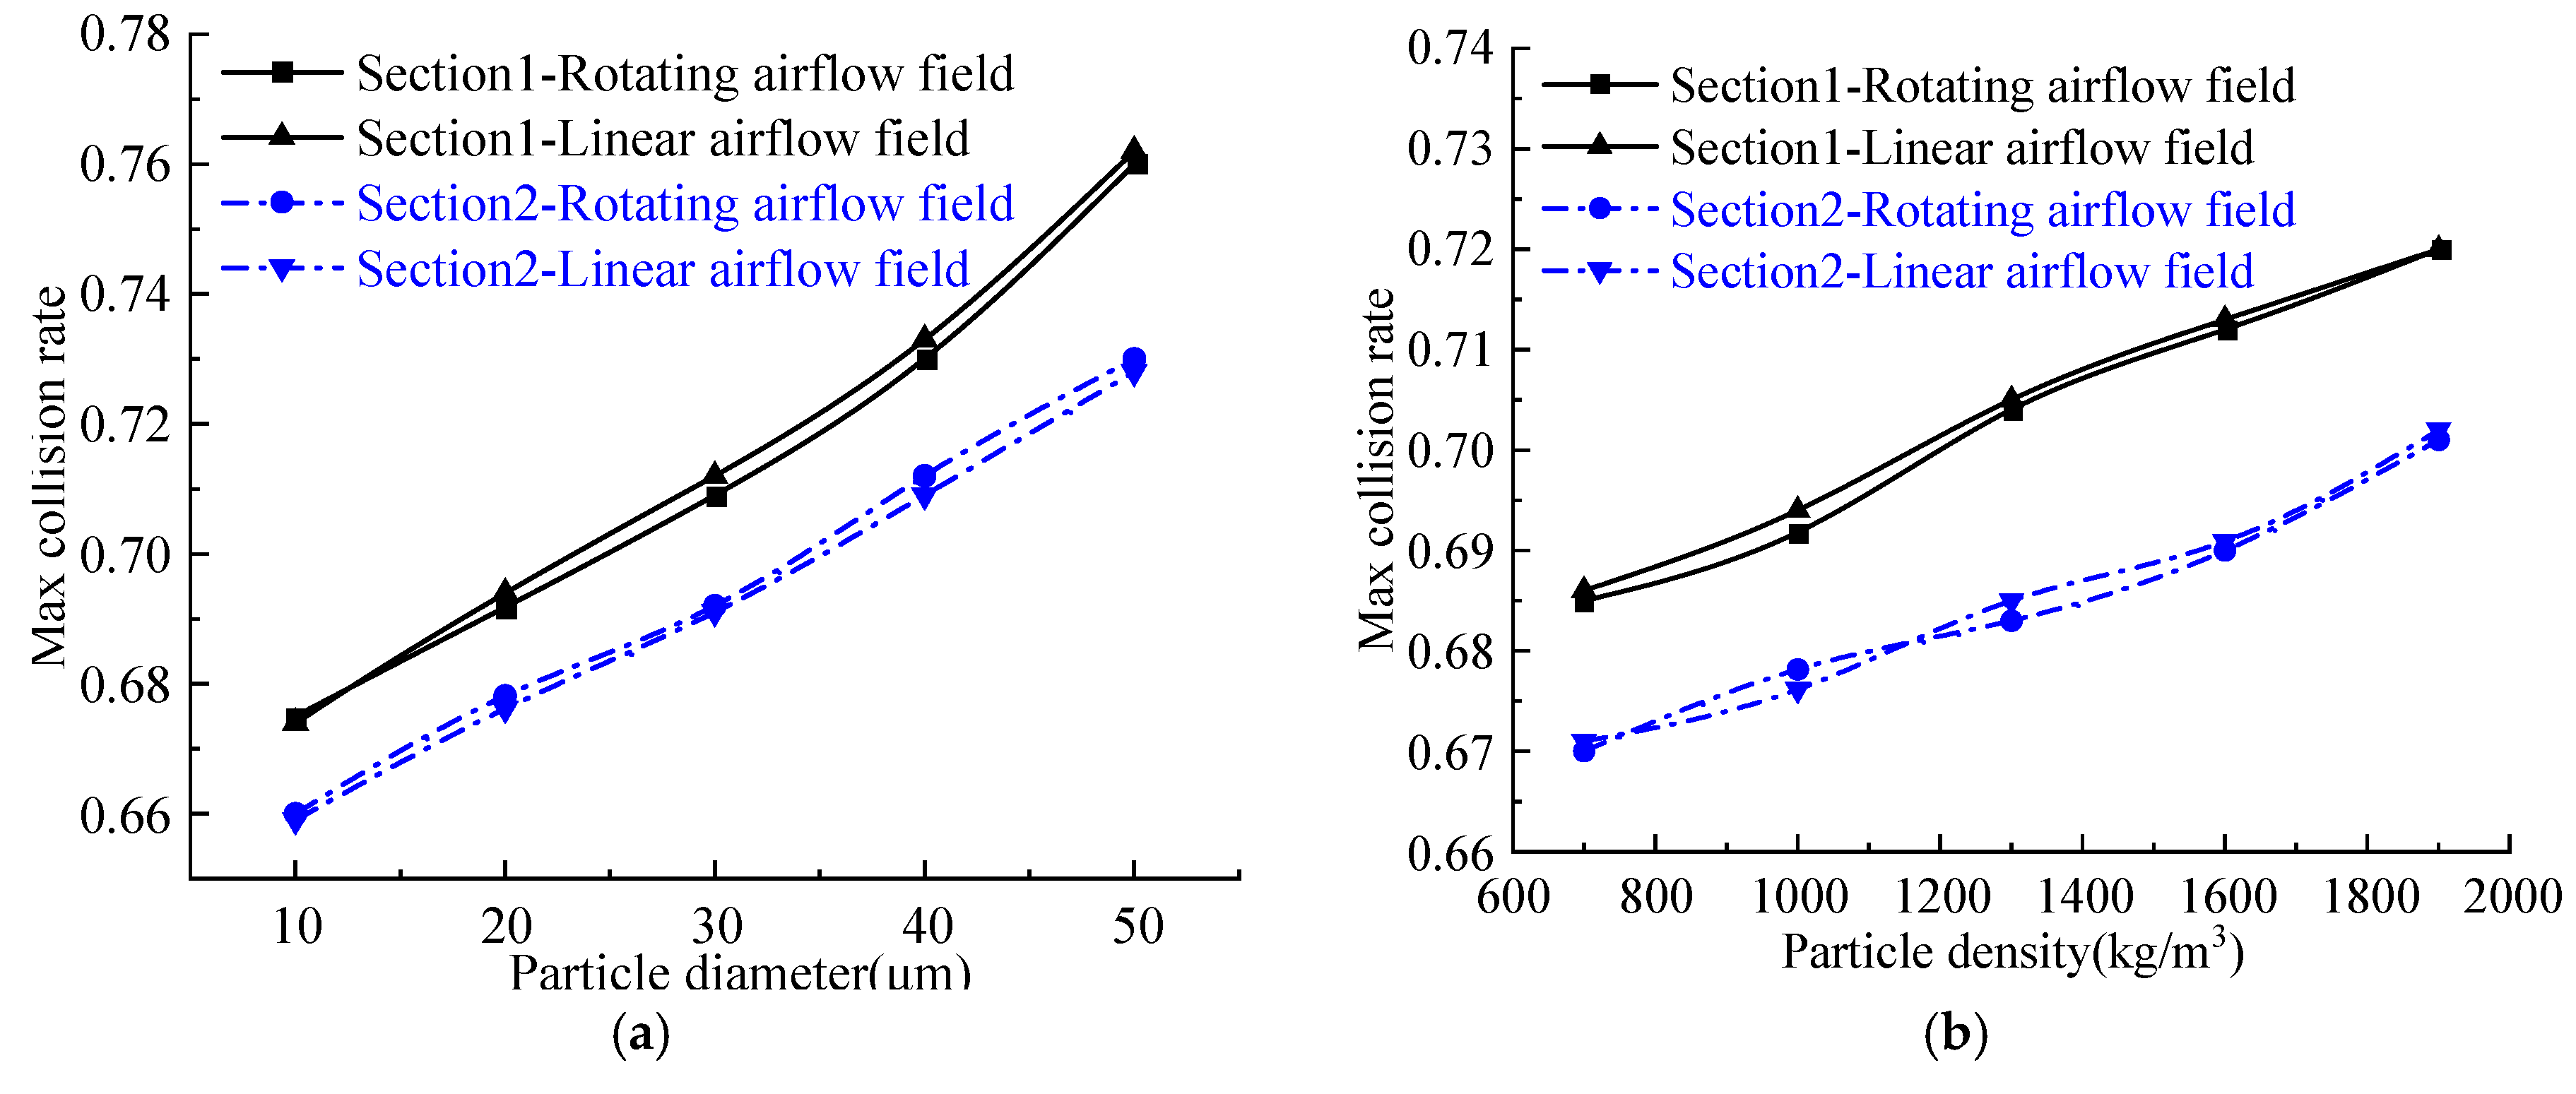
To verify the equivalence of the collision rate results between the rotating test method and the traditional linear airflow test method, the collision rate of the insulator in the linear airflow field was calculated using the method described in [28]. The inlet velocity in the linear airflow field was taken as the average velocity at the inlet cross-section of the duct test section, which is 61.72 m/s, while the particle parameters were kept the same as those in the rotating test. The maximum collision rates at the rod center (Section 1 in Figure 9) and the shed edge (Section 2 in Figure 9) were compared between the rotating airflow field and the linear airflow field, with the results shown in Figure 10.
As shown in Figure 10, under the computational conditions where the two variables of particle diameter and density are changed while the other environmental parameters remain constant, the trend of the change in collision rate is approximately linear. The maximum collision rates at both sections increase with the particle diameter and density. This is because an increase in diameter and density enhances the particle mass, making it more difficult for the particles to follow the airflow around the insulator, thereby increasing the collision rate. Additionally, the figure reveals that the collision rates in the rotating and the straight airflow field are very close, with the maximum deviation in the data being only 3.23%. This indicates that the rotating airflow field exhibits good equivalence to the linear airflow field when conducting particle collision tests.

4.3. Equivalence on Accumulation Test

To study the equivalence of the accumulation test in the rotating airflow field using the example of ice accumulation on the insulator on the high-speed train roof, it is assumed that the ice type is rime ice. On defining the area of a local control surface as S, the particle mass Δm and the volume Δv accumulated on the local control surface within timestep Δt are as follows:
Δ m = Δ t β p ω d V , a S
Δ V = Δ m / β ice
where βice is the density of accumulated ice.
After obtaining the accumulated particle volume on the surface, the ice shape can be updated according to the normal growth rule, thereby obtaining the shape of the insulator after icing. The icing calculations were performed using FENSAP-ICE 2023 R1. A multi-step scheme was adopted for ice-shape iteration, with a temporal step of 5 min, a freestream velocity of 61.72 m s−1 (identical to that in the collision test), an MVD of 20 µm, and an LWC of 0.6 g m−3. The icing calculation was performed on the test insulator in the rotating airflow field, and the ice shape on the insulator after 30 min is shown in Figure 11.
It was found that the icing primarily occurs on the windward side of the insulator and becomes more severe with increasing time. The regions with the most severe icing are the rod and the shed edges, which correspond to the higher collision rate areas in Figure 9. Moreover, the ice shapes obtained from the rotating and the linear airflow field are essentially consistent.
The inflow velocity in the linear airflow field is taken as the average velocity at the inlet of the duct test section, and the icing time is 30 min for all cases, with other parameters remaining unchanged. The mass of ice on the insulator under different particle diameters and volume masses in both the rotating and linear airflow fields are shown in Figure 12.
The figure shows that the icing mass on the insulator increases with the increase in particle diameter and volume mass. An increase in particle diameter leads to a higher collision rate, which results in a greater icing mass. Meanwhile, an increase in volume mass implies a higher concentration of particles in the air, meaning more particles reach the insulator surface per unit time, thereby causing an increase in the icing mass. Moreover, the icing mass calculated in the rotating airflow field is essentially the same as that in the linear airflow field, with the maximum difference being only 2.4%. This effectively demonstrates the good equivalence between the rotating and the linear airflow field when conducting accumulation tests.

5. Equivalence Study by Icing Experiment

5.1. Test Object and Facility

Icing tests on the FQJG2-30/16-400 roof insulator were conducted in an artificial climate chamber to verify the reliability of the computational results and the applicability of the rotating airflow field test. The climate chamber has a diameter of 7.8 m and a height of 11.8 m, with a temperature (degree Celsius) control range of −45 °C to 70 °C, a wind speed control range of 0 to 12 m/s, a humidity control range of 10% to 100%, and a median volume diameter (MVD) control range of supercooled water droplets from 20 μm to 500 μm.
The temperature and humidity measuring instruments used in the experiments have measurement errors of ±0.2 °C and ±1%, respectively; the anemometer has an error of ±0.1 m/s. The liquid water content (LWC) and MVD were measured using a rotating multi-conductor ice accretion probe.
The layout of the artificial climate chamber and the insulator arrangement is shown in Figure 13.

5.2. Test Procedures

The following procedures are used for this test:
(1)
Sample preprocessing: Before the test, the insulator is cleaned to remove surface grease and contaminants and then air-dried naturally.
(2)
Precooling: The insulator is placed in front of the air duct of the climate chamber and the refrigeration system turned on. When the temperature reaches the test value, the spraying system to start spraying is turned on.
(3)
Spraying system adjustment: The LWC is regulated by the tuning water pressure, while the MVD is controlled via air pressure adjustment (after water pressure stabilization). The nozzle opening is fine-tuned to optimize atomization. The parameters are maintained once the target LWC and MVD values are achieved.
(4)
Measurement of airflow velocity: The air duct system and fan power to control the airflow velocity is adjusted using a handheld anemometer to sample the airflow velocity at multiple horizontal and vertical positions at the windward side of the insulator and the average value taken.
(5)
Measurement of ice: The icing test lasts 60 min, keeping the temperature, wind speed, and water spray volume unchanged. The icing mass of the insulator is weighed every 10 min, and the local icing thickness measured by slicing after icing.
The icing test parameters are shown in Table 4. Keeping the chamber temperature at –10 °C is suitable for forming rime icing. Each group of icing tests was repeated three times and the average of the results taken to avoid the influence of randomness.

5.3. Experiment Results

The climate chamber test and numerical simulation of the rotating method were carried out for the above four groups; the test and simulation results of the ice mass for all icing tests are shown in Figure 14. It is of note that the icing mass positively correlates with the icing time in the test and simulation results. The difference is largest at the beginning of the tests for all four groups, and the test results are smaller than the simulation result. The maximum difference appears at 11.4% when the icing time is 10 min in test 3; this is speculative due to the influence of the hydrophobicity of the silicone rubber material on the insulator surface. As the icing test progresses, the difference stabilizes between 5% and 8%. This shows that rotating airflow field equates well with the linear airflow field in the icing test.

6. Conclusions

This paper proposes a rotational high-speed airflow testing method for complex environments and preliminarily verified its consistency with the traditional linear airflow testing method. The main conclusions are as follows:
  • Based on the principle of relative rotating motion, a test method is proposed to realize the test conditions of complex environments combining high-speed airflow.
  • Numerical simulation shows that the collision and accumulation test results of the rotating airflow fields agree with the linear airflow field. The collision rate distribution and icing shape are basically the same. The maximum difference in the collision rate and the ice mass is 3.23% and 4.34%, respectively. It should be noted that the similarity conclusions presented herein are derived solely from comparative CFD results; their further validation will necessarily depend on forthcoming data obtained from an actual rotating test facility.
  • It should be noted that this paper only verifies the feasibility of the proposed method in principle. Further research is needed to address practical engineering issues such as the duct wake effect and the stability of the rotating structure during high-speed rotation.

Author Contributions

Methodology, X.J.; software, J.J.; validation, Z.Y.; formal analysis, Y.H.; investigation, Y.H.; resources, X.J.; data curation, J.J. and Z.Y.; writing—original draft preparation, Y.H.; writing—review and editing, Y.H.; supervision, X.J.; project administration, X.J. All authors have read and agreed to the published version of the manuscript.

Funding

This research was funded by [Research Project of Xuefeng Mountain Energy Equipment Safety Field Scientific Observation and Research Station] grant number [NORS-XFEES-23-08, NORS-XFEES-23-05]; [Natural Science Foundation of Changsha] grant number [kq2502124]; [the Project Supported by National Natural Science Foundation of China] grant number [U23B20121, 52307158].

Institutional Review Board Statement

Not applicable.

Informed Consent Statement

Not applicable.

Data Availability Statement

The raw data supporting the conclusions of this article will be made available by the authors on request.

Acknowledgments

This work is supported by the Research Project of Xuefeng Mountain Energy Equipment Safety Field Scientific Observation and Research Station (NORS-XFEES-23-08, NORS-XFEES-23-05), Natural Science Foundation of Changsha (kq2502124), and the National Natural Science Foundation of China (U23B20121, 52307158), The authors would like to thank all authors for their contributions to this paper.

Conflicts of Interest

The authors declare no conflicts of interest.

References

  1. Ramalingam, B.; Manuel, V.; Elara, M.R.; Vengadesh, A.; Lakshmanan, A.K.; Ilyas, M.; James, T.J. Visual Inspection of the Aircraft Surface Using a Teleoperated Reconfigurable Climbing Robot and Enhanced Deep Learning Technique. Int. J. Aerosp. Eng. 2019, 2019, 5137139. [Google Scholar] [CrossRef]
  2. Gao, L.; Tao, T.; Liu, Y.; Hu, H. A field study of ice accretion and its effects on the power production of utility-scale wind turbines. Renew. Energy 2021, 167, 917–928. [Google Scholar] [CrossRef]
  3. Drapalik, M.; Zajicek, L.; Purker, S. Ice aggregation and ice throw from small wind turbines. Cold Reg. Sci. Technol. 2021, 192, 103399. [Google Scholar] [CrossRef]
  4. Zhang, X.; Shi, C.; Kang, Y.; Yin, X.; Gao, G.; Wu, G. Flashover characteristics of cylindrical insulator in high-speed sand environment. IEEE Trans. Dielectr. Electr. Insul. 2017, 24, 455–461. [Google Scholar] [CrossRef]
  5. Kang, Y.; Zhang, X.; Shi, C.; Zhou, Y.; Liu, Y.; Gao, G.; Wei, W.; Wu, G. Breakdown Characteristics and Mechanisms of Short Needle–Plate Air Gap in High-Speed Airflow. IEEE Trans. Plasma Sci. 2017, 45, 2406–2415. [Google Scholar] [CrossRef]
  6. Qi, Z.; Zhang, R.; Ma, J.; Wang, X.; Ma, L.; Zhao, Z.; Wu, Y. Effects of Static Icing on Flashover Characteristics of High-Speed Train Roof Insulators. Coatings 2022, 12, 950. [Google Scholar] [CrossRef]
  7. Mu, Z.; Guo, W.; Li, Y.; Tagawa, K. Wind tunnel test of ice accretion on blade airfoil for wind turbine under offshore atmospheric condition. Renew. Energy 2023, 209, 42–52. [Google Scholar] [CrossRef]
  8. Liu, Y.; Shi, W.; Wang, W.; Li, X.; Qi, S.; Wang, B.; Michailides, C. Investigation on the interaction between ice and monopile offshore wind turbine using a coupled CEM–FEM model. Ocean Eng. 2023, 281, 114783. [Google Scholar] [CrossRef]
  9. Jolin, N.; Bolduc, D.; Swytink-Binnema, N.; Rosso, G.; Godreau, C. Wind turbine blade ice accretion: A correlation with nacelle ice accretion. Cold Reg. Sci. Technol. 2019, 157, 235–241. [Google Scholar] [CrossRef]
  10. Pei, Y.; Cai, C.; Chen, Z.; Li, W.; Xiao, H.; Li, C.; Liu, K. An Experimental Study on Icing on Superhydrophobic Surfaces of Wind Turbine Blades in Offshore Environments. Coatings 2025, 15, 236. [Google Scholar] [CrossRef]
  11. Yu, D.; Han, Z.; Zhang, B.; Zhang, M.; Liu, H.; Chen, Y. A multi-autoencoder fusion network for fast image prediction of aircraft ice accretion. Phys. Fluids 2022, 34, 76107. [Google Scholar] [CrossRef]
  12. Liu, X.; Niu, C.; Chen, X.; Wang, Z.; Cheong, K. Experimental investigation on the characteristics of saltwater droplets ice accretion on an NACA0018 airfoil. Appl. Therm. Eng. 2025, 264, 125420. [Google Scholar] [CrossRef]
  13. Zhang, Y.; Guo, W.; Li, Y.; Chi, H.; Zhao, P.; Tagawa, K. An experimental study of icing distribution on a symmetrical airfoil for wind turbine blade in the offshore environmental condition. Ocean. Eng. 2023, 273, 113960. [Google Scholar] [CrossRef]
  14. Guo, W.; Shen, H.; Li, Y.; Feng, F.; Tagawa, K. Wind tunnel tests of the rime icing characteristics of a straight-bladed vertical axis wind turbine. Renew. Energy 2021, 179, 116–132. [Google Scholar] [CrossRef]
  15. Malik, Y.A.; Karpen, N.; Bonaccurso, E.; Roisman, I.; Hussong, J.; Villedieu, P. Experimental investigation of the accretion and shedding process on a heatable NACA0012 airfoil in ice crystal icing conditions. Cold Reg. Sci. Technol. 2024, 217, 104030. [Google Scholar] [CrossRef]
  16. Han, Z.; Si, J.; Wu, D. Contrast Icing Wind Tunnel Tests between Normal Droplets and Supercooled Large Droplets. Aerospace 2022, 9, 844. [Google Scholar] [CrossRef]
  17. Yang, C.; Guo, Y.; Shi, Z.; Li, B.; Zhang, X.; Xiao, S.; Wu, G. Discharge Characteristics of Roof Insulators in Strong Wind and Sand Environment: A Review. IEEE Trans. Dielectr. Electr. Insul. 2024, 31, 3231–3242. [Google Scholar] [CrossRef]
  18. Yang, L.; He, H.C.; Mei, L.L.; Hao, Y.P.; Li, L.C.; Lin, X.H. Ultrasonic Monitoring Technology of Equivalent Ice Thickness Under Slightly Uneven Ice Cover on Overhead Distribution Lines and Its Device Application. IEEE Trans. Instrum. Meas. 2025, 74, 3551310. [Google Scholar] [CrossRef]
  19. Fan, L.; Xia, M.Y.; Liu, J.; Li, B.; Zhu, T.; Zhao, Y.Y.; Song, L.B.; Yuan, Y. Fabrication of Superhydrophobic Coatings by Using Spraying and Analysis of Their Anti-Icing Properties. Coatings 2023, 13, 1792. [Google Scholar] [CrossRef]
  20. Wang, H.; Hu, Q.; Lin, H.; Xu, H.; Shu, L.; Yin, P.; Jiang, X. Effect of icing on the AC flashover voltage of 220 kV composite insulators. Electr. Power Syst. Res. 2025, 238, 111117. [Google Scholar] [CrossRef]
  21. Qiu, Z.; Sun, Y.; Cui, Y.; Zhang, Z.; Liu, Y.; Chen, X.; Wu, Y.; Li, C.; Wang, L.; Lei, Z. Optimized Design of Shed Parameters for Polluted Hollow Porcelain Insulators at High Altitude. IEEE Access 2023, 11, 63451–63462. [Google Scholar] [CrossRef]
  22. Zhang, X.; Kuang, S.; Wu, S.; Zhuang, W.; He, C. Analysis of Aging Characteristics of Umbrella Skirts of Composite Insulators Operating under the Influence of a Wind and Sand Environment in South Xinjiang. Materials 2024, 17, 680. [Google Scholar] [CrossRef] [PubMed]
  23. Si, Q.R.; Yuan, J.; Pei, J.; Lu, R. Practical Technique of Numerical Simulation of Centrifugal Pump, 1st ed.; Jiangsu University Press: Zhenjiang, China, 2018; pp. 62–94. [Google Scholar]
  24. Jung, S.P.; Kim, Y.G.; Park, T.W. A Study on Thermal Characteristic Analysis and Shape Optimization of a Ventilated Disc. Int. J. Precis. Eng. Manuf. 2012, 13, 57–63. [Google Scholar] [CrossRef]
  25. Strawn, R.C.; Caradonna, F.X.; Duque, E. 30 Years of Rotorcraft Computational Fluid Dynamics Research and Development. J. Am. Helicopter Soc. 2006, 51, 5–21. [Google Scholar] [CrossRef]
  26. Tamburini, A.; Cipollina, A.; Micale, G.; Brucato, A.; Ciofalo, M. CFD Simulations of Dense Solid-Liquid Suspensions in Baffled Stirred Tanks: Prediction of Suspension Curves. Chem. Eng. J. 2011, 178, 324–341. [Google Scholar] [CrossRef]
  27. Jia, W.; Zhang, F.; Zhang, Z. Numerical and experimental investigation of the supercooled large droplets icing of rotating spinner. Appl. Therm. Eng. 2024, 257, 124159. [Google Scholar] [CrossRef]
  28. Huang, Y.; Jiang, X.; Virk, M.S. Ice accretion study of FXBW4-220 transmission line composite insulators and anti-icing geometry optimization. Electr. Power Syst. Res. 2021, 194, 107089. [Google Scholar] [CrossRef]
Figure 1. Schematic diagram of the rotating high-speed multiphase flow experiment device.
Applsci 15 09076 g001
Figure 2. Structure of the optimized asymmetric uniform-flow accelerating duct.
Applsci 15 09076 g002
Figure 3. Optimization results of asymmetric duct.
Applsci 15 09076 g003
Figure 4. Calculation domains.
Applsci 15 09076 g004
Figure 5. Schematic diagram of the mesh of computational domain.
Applsci 15 09076 g005
Figure 6. Grid independence verification.
Applsci 15 09076 g006
Figure 7. Profile of test 1/2 scaling FQJG2-30/16-400 insulator.
Applsci 15 09076 g007
Figure 8. Airflow velocity contour in the test section of the duct.
Applsci 15 09076 g008
Figure 9. Distribution of particle collision rate on the insulator.
Applsci 15 09076 g009
Figure 10. Effect of particle diameter and density on the maximum collision rate. (a) Effect of diameter, (b) effect of density.
Applsci 15 09076 g010
Figure 11. Ice accreting process on the test insulator. (a) 5 min, (b) 15 min, (c) 30 min.
Applsci 15 09076 g011
Figure 12. Effect of particle diameter and volume mass on the ice mass. (a) Effect of diameter, (b) effect of volume mass.
Applsci 15 09076 g012
Figure 13. Schematic of artificial climate chamber and insulator icing test.
Applsci 15 09076 g013
Figure 14. Simulation and experiment of icing mass on insulator. (a) Test 1, (b) Test 2, (c) Test 3, (d) Test 4.
Applsci 15 09076 g014
Table 1. Parameters before and after optimization.
D11 (m)D12 (m)Dynamic Pressure
Coefficient
Flow Deviation
Angle
Original0.50.50.02140.2011
Optimized0.40.60.01340.1209
Table 2. Information of boundary conditions and mesh.
Boundary ConditionsMesh Information
ItemsDescriptionItemsDescription
Inside domainRotates at 60 rpm about the Z-axisInside domaintetrahedral elements, 0.1 m size
Outside domainsRemains stationary relative to the absolute coordinate system.Outside domainshexahedral elements, 0.5 m size
Duct and insulator wallsNo-slip and stationery relative to adjacent cells.Interfacestopology share, 0.04 m size
Outside wallsNo-slip and stationery to the absolute coordinate.Duct wall boundary layers5 boundary layers, 1.2 growth ratio, 0.0001 m first element height, 30 < y+ < 60
Sphere body of influence (SBOI)SBOI1: 0.04 m size
SBOI2: 0.015 m size
Table 3. Mesh quality.
Quality CriterionWarning LimitError (Failure) LimitWorst
Maximum Aspect RatioDefault (5)Default (1000)32.751
Minimum Cell QualityDefault (0.05)Default (5 × 10⁻⁴)0.047
Minimum Cell QualityDefault (0.05)Default (5 × 10⁻³)0.15
Maximum SkewnessDefault (0.9)Default (0.999)0.85
Table 4. Icing test parameters.
Test GroupAirflow Velocity (m/s)Temperature (°C)LWC (g/m3)MVD (μm)
Test 115−100.620
Test 210−100.620
Test 315−100.920
Test 415−100.630
Disclaimer/Publisher’s Note: The statements, opinions and data contained in all publications are solely those of the individual author(s) and contributor(s) and not of MDPI and/or the editor(s). MDPI and/or the editor(s) disclaim responsibility for any injury to people or property resulting from any ideas, methods, instructions or products referred to in the content.