Article

Design and Aerodynamic Analysis of Rigid Wing Sail of Unmanned Sailboat at Sea Based on CFD

School of Physics Science and Information Engineering, Liaocheng University, Liaocheng 252000, China
*
Author to whom correspondence should be addressed.
Appl. Sci. 2025, 15(16), 9052; https://doi.org/10.3390/app15169052
Submission received: 14 July 2025 / Revised: 10 August 2025 / Accepted: 13 August 2025 / Published: 16 August 2025

Abstract

As a novel type of ocean monitoring tool, unmanned sailboats exhibit significant application potential. In this study, a novel wing sail structure for offshore unmanned sailboats is proposed and its performance compared with that of the conventional NACA 0021 wing sail. The Reynolds-averaged Navier–Stokes (RANS) equations are employed for numerical analysis, and the aerodynamic performance is evaluated using ANSYS Fluent. The results indicate that the lift coefficient and lift-to-drag ratio of the HF-14-CE-01 wing sail are significantly superior to those of the NACA 0021 wing sail. Compared to the NACA 0021 wing sail, the HF-14-CE-01 wing sail has undergone structural optimization. The HF-14-CE-01 wing sail demonstrates improved wind direction efficiency, uniform force distribution, ease of adjustment, and extends the service life of the sail. Subsequent research examined the influence of aspect ratio on both the aerodynamic performance of the wing sail and the thrust generated by the unmanned sailboat, identifying an optimal aspect ratio of 4 for the HF-14-CE-01 wing sail. Analysis of the velocity and static pressure contour maps for the HF-14-CE-01 wing sail identified a critical angle of attack of 28°, providing a clear visual representation of its aerodynamic performance. Furthermore, compared with other rigid sail designs, the HF-14-CE-01 wing sail achieved a 30.9% increase in peak lift coefficient, indicating superior propulsion capability.

1. Introduction

Traditional marine exploration technologies encompass buoys, underwater robots, ships, observation stations, and satellites. Unmanned sailboats, as a novel class of marine vessels, harness wind energy for propulsion and solar energy for sail adjustment, thereby enabling autonomous operation at sea over extended durations [1]. Their distinctive advantages render them optimal tools for marine resource surveys and environmental monitoring.
Since the early 21st century, driven by advancements in intelligent algorithms and sensor technology, an increasing number of studies have concentrated on the practical applications of unmanned sailboats. In 2007, the Austrian Society for Innovative Computer Science developed the ASV Roboat. The boat has a length of 3.75 m, weighs 300 kg (including batteries), and can carry a scientific payload of 50 kg. The unmanned sailboat employs a soft sail [2]. In 2012, the American company Saildrone launched the Saildrone USV [3], equipped with wing sails and solar panels. In 2015, the Saildrone USV conducted an observation mission in the Bering Sea, providing data for analyzing the impact of sea ice melt on sea surface cooling. The Norwegian company Offshore Sensing AS launched the Sailbuoy unmanned sailboat [4], and its SB Met became the first unmanned sailboat to cross the Atlantic Ocean on 26 August 2018. The successful crossing of the Atlantic Ocean by the SB Met marks a milestone in the global development of unmanned sailboats.
To evaluate the performance of rigid sails, Ouchi et al. conducted full-scale computational fluid dynamics (CFD) simulations in 2011 to assess the propulsion characteristics of a nine-wing sail system [5]. In 2015, Viola et al. developed a numerical optimization procedure for rigid sails using a Reynolds-averaged Navier–Stokes (RANS) equation solver [6], which yielded an efficient approach for the parametric aerodynamic analysis of sails.
In 2019, Atkinson performed three-dimensional CFD simulations on segmented rigid sails and proposed a circular arc sail structure [7]. In 2022, Chen et al. investigated the aerodynamic characteristics of curved wing sails using two-dimensional simulations [8]. In 2023, Zhu et al. conducted numerical analyses on the aerodynamics of a crescent-shaped wing sail using the unsteady Reynolds-averaged Navier–Stokes (URANS) equations [9].
The sails of an unmanned sailboat must withstand wind forces from both the port and starboard sides, requiring a symmetrical structure. The NACA series represents one of the most influential achievements in aerodynamic research within the aviation field of the 20th century, particularly renowned for its wing profiles and aerodynamic design standards. The NACA 0021 is a highly representative symmetrical wing profile within the NACA series and is frequently chosen as the sail for unmanned sailboats. Based on this, this paper designed a sail structure specifically for unmanned sailboats, named HF-14-CE-01. Compared to the NACA 0021, this sail structure offers superior aerodynamic performance and higher wind direction efficiency. The HF-14-CE-01 wing sail differs primarily from the NACA 0021 and existing airfoils in its symmetrical leading and trailing edge structure. Its unique structure provides improved aerodynamic performance and a longer service life, making it suitable for unmanned sailboats requiring automatic angle adjustment. This paper employs Fluent and ANSYS Workbench 2022 R2 software to analyze the aerodynamic performance of rigid wing sails, generating performance data for thrust optimization and autonomous navigation control of unmanned sailboats [10]. This project exemplifies the application of aerospace theory within the field of navigation and holds significant implications for ocean exploration.

2. Modeling of the Wing Sail

2.1. Model Development

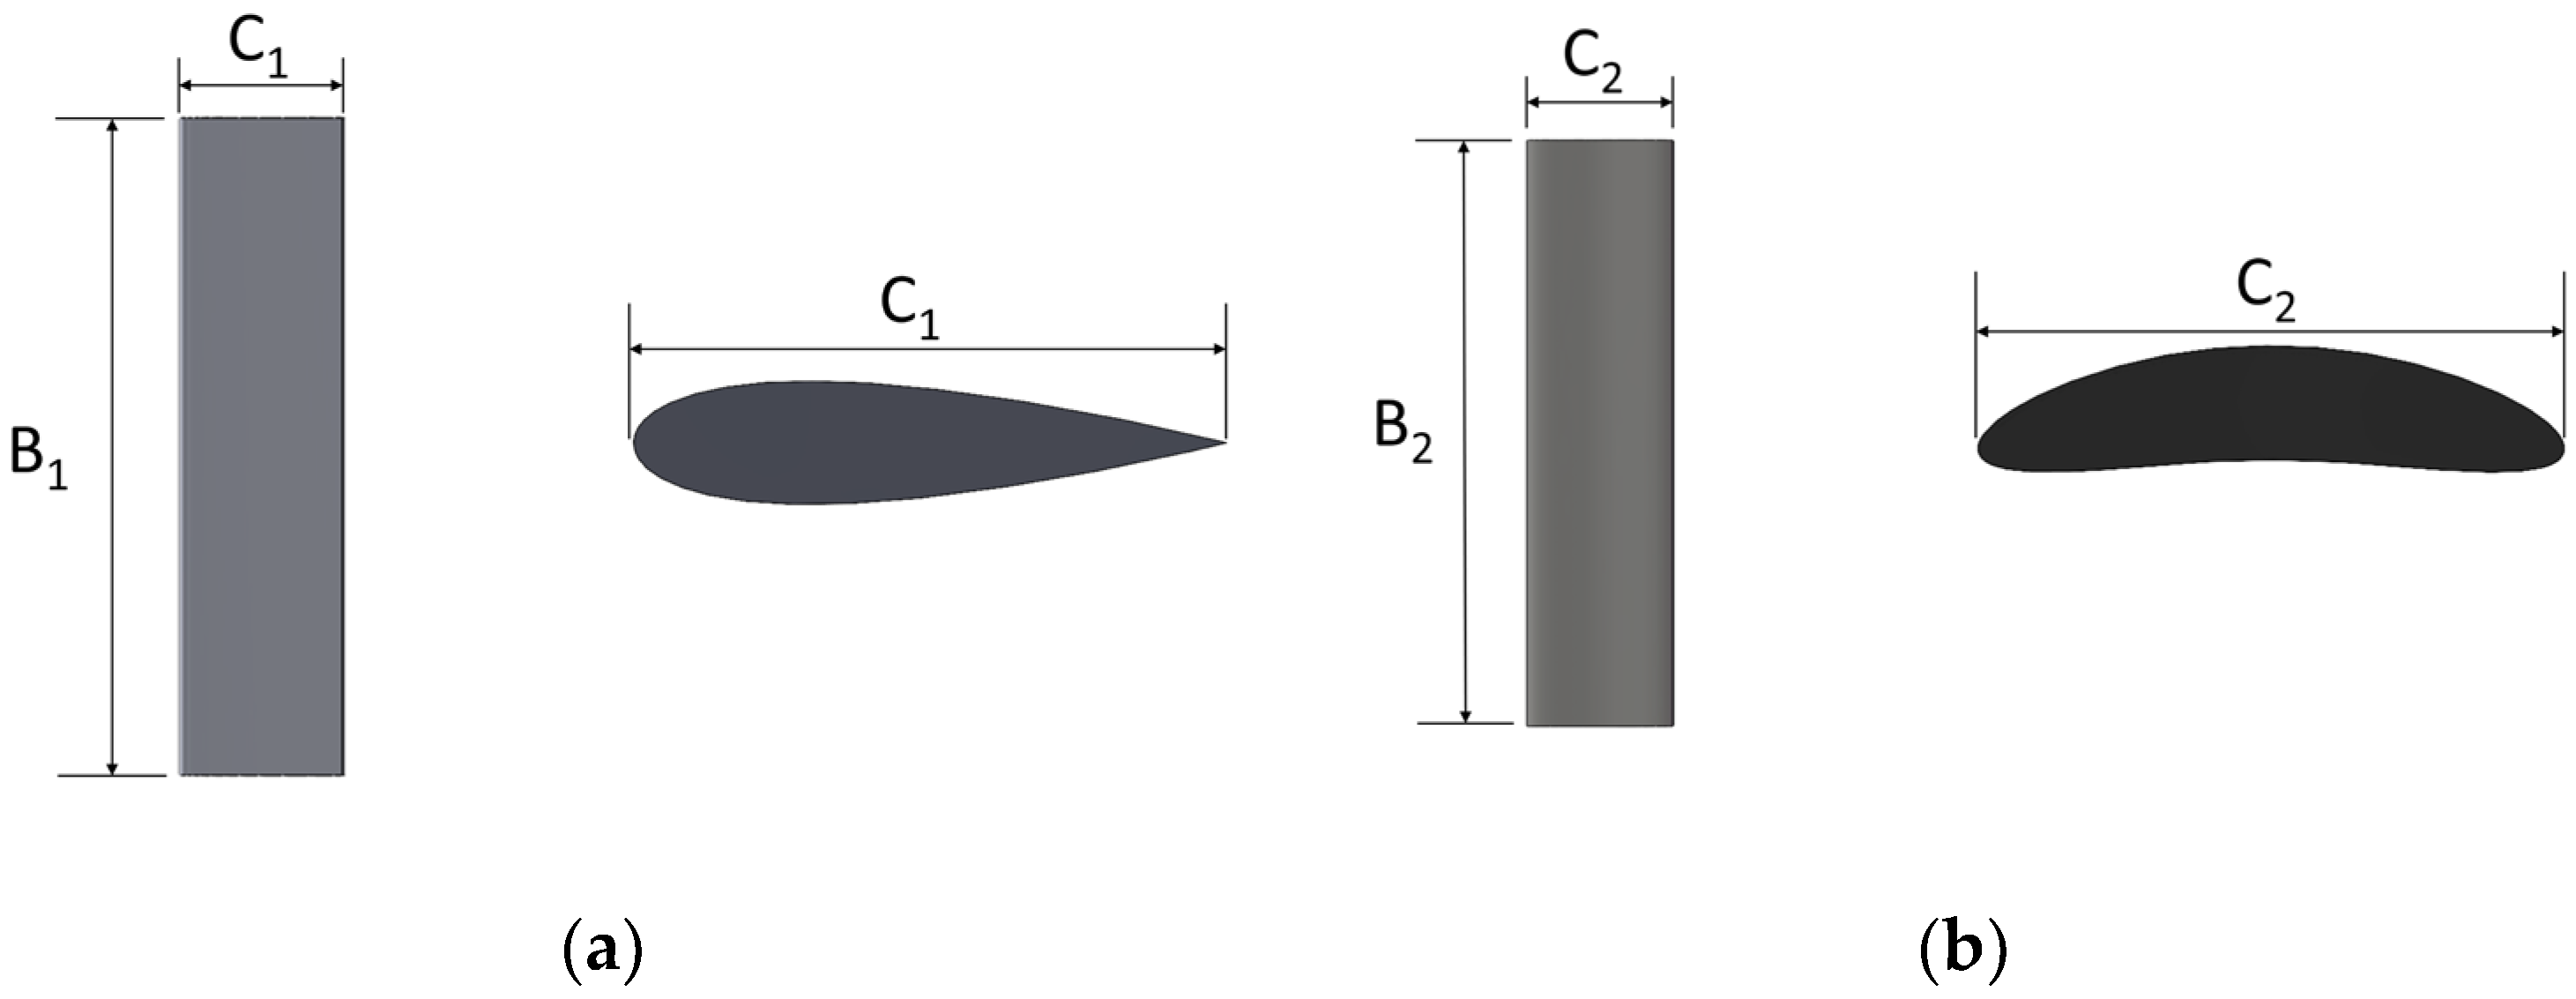
The NACA 0021 is a symmetrical airfoil developed by the National Advisory Committee for Aeronautics (NACA). The “00” indicates the symmetry of the airfoil, while “21” denotes that the maximum relative thickness is 21% of the chord length. The upper and lower surfaces of the airfoil are symmetrical, and it exhibits a lift coefficient of zero at a zero angle of attack. It is commonly employed in scenarios that require symmetrical lift characteristics [11]. Figure 1a is a cross-sectional view of NACA 0021. HF-14-CE-01 is a specialized wing sail designed in this study, specifically tailored for applications in unmanned sailboats at sea. Figure 1b is a cross-sectional view of HF-14-CE-01, which is a NACA 0021 with the addition of a left–right symmetrical structure of the leading and trailing edges. In Figure 1, C1 and C2 are the chord lengths of the wing sail. The HF-14-CE-01 wing sail has maximum camber at 30% and 70% of the chord length (C2), maximum thickness at 50% of the chord length (C2), and maximum thickness at 20% of the chord length (C2). The leading and trailing radii are 13.65 mm. The leading edge can guide the airflow and control the airflow separation. The rounded leading edge helps create a greater curvature on the upper surface of the wing sail. According to Bernoulli’s principle [12], the airflow accelerates faster on the upper surface, creating a larger low-pressure area, which is one of the main sources of lift. The trailing edge significantly increases the curvature of the rear part of the wing sail, making the airflow path on the upper surface longer, accelerating more significantly, and creating stronger suction. The airflow on the lower surface is hindered, and the pressure is higher. The overall effect is to significantly increase lift. Of course, the drag will also increase at the same time, but considering that the HF-14-CE-01 wing sail is used at a low angle of attack, the increase in drag is not significant.

2.2. Definitions of Wing Sail Parameters

As shown in Figure 1 and Figure 2, key parameters include the wing chord lengths (C1, C2) and the wingspan (B1, B2) [13]. The wing aspect ratio (AR) is calculated as follows:
A R = B n C n

2.3. Development of the Simulation Model

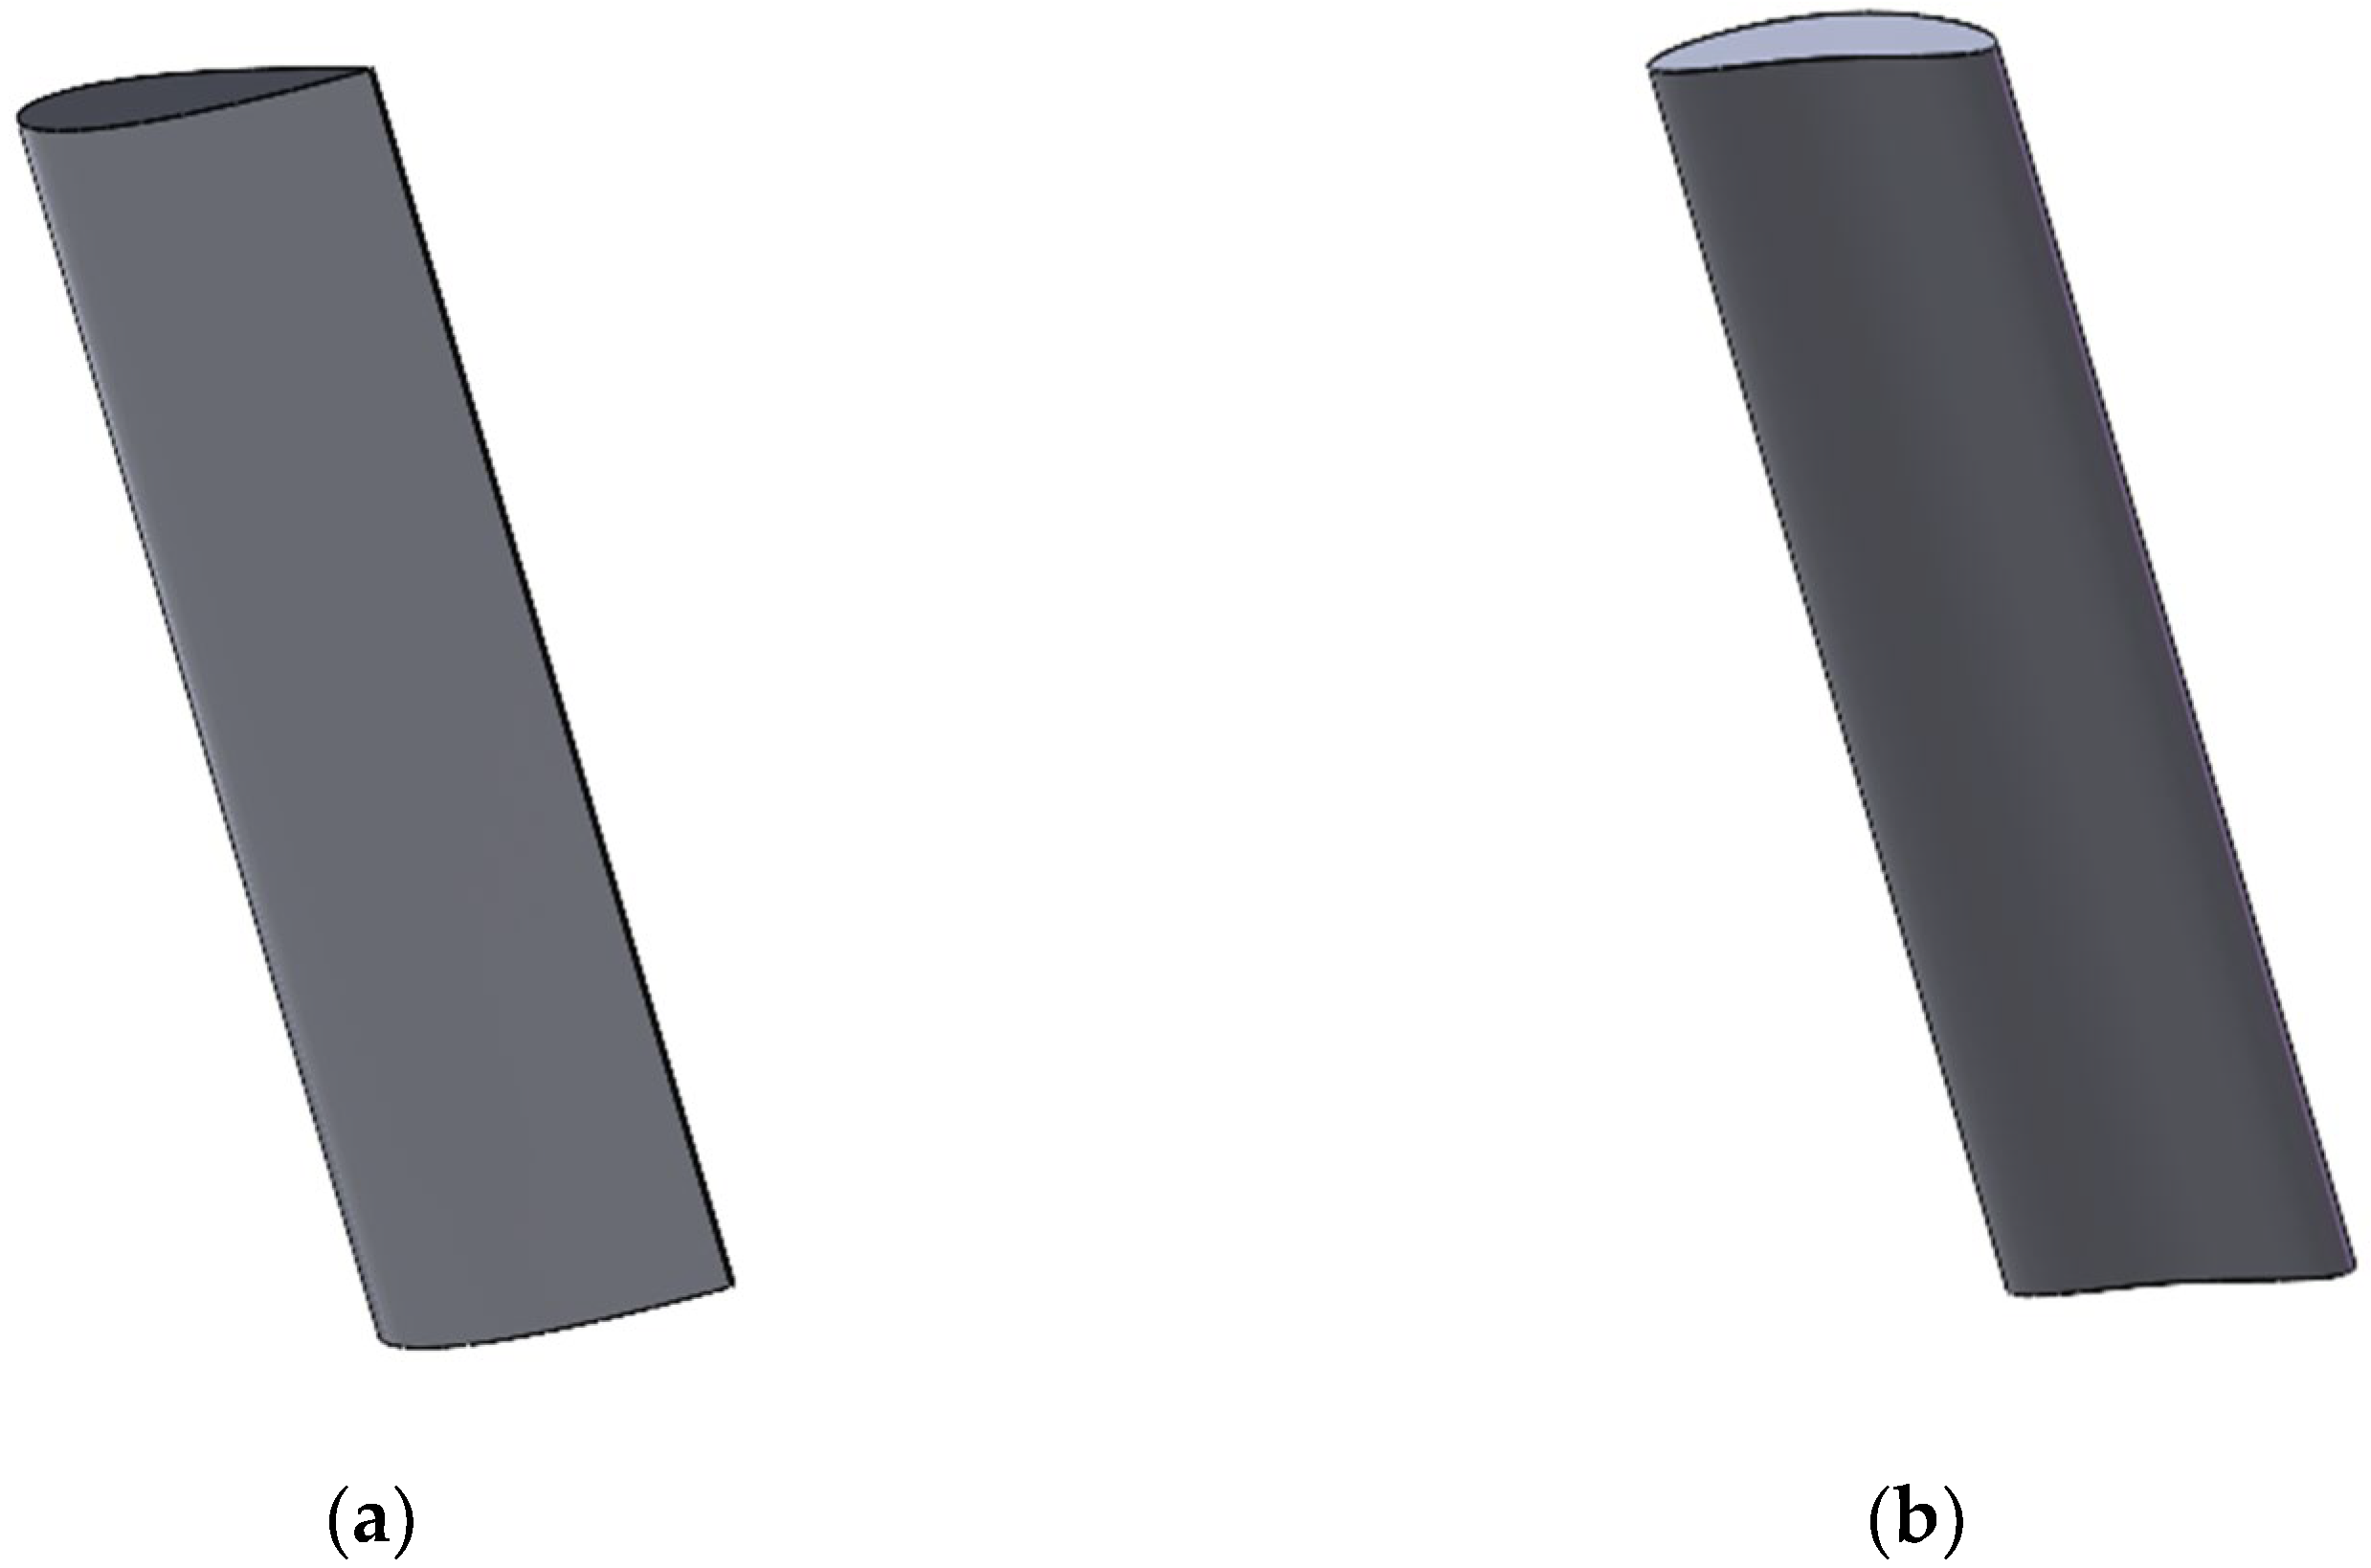
The initial parameters for the wing sail model are defined as follows: the chord lengths (C1, C2) are 620 mm, and the wingspan (B1, B2) is 2480 mm; the aspect ratio (AR) is set to 4. Based on these parameters, the wing sail model was created using SolidWorks 2022 software [14], as illustrated in Figure 3. The wing sail is constructed from carbon fiber composite materials. In comparison to rigid materials such as metal or wood, carbon fiber offers significant advantages in wing sail applications. First, the strength and stiffness of carbon fiber are comparable to, or even exceed, those of many metals, yet its density is significantly lower than that of metals (approximately 60% of aluminum and 25% of steel), allowing for the manufacture of extremely rigid and lightweight wings, which is critical for sailing. Second, carbon fiber demonstrates superior fatigue resistance compared to metals, particularly aluminum alloys, when subjected to repeated alternating loads such as wave turbulence, gust impacts, and frequent windward turns. Consequently, this results in a longer service life and enhanced reliability of the carbon fiber wing sail in harsh marine environments.

3. Aerodynamic Analysis of the Wing Sail

3.1. Principle of Forces Acting on the Wing Sail

Bernoulli’s principle is a fundamental concept in fluid mechanics, representing the conservation of mechanical energy in an ideal fluid. Under ideal conditions, at any given cross-section of a flow tube, the sum of the kinetic energy, potential energy, and pressure potential energy of a unit volume of fluid remains constant. The Bernoulli equation is as follows:
P + 1 2 ρ v 2 + ρ gh = c
In this equation, P is the pressure at a certain point in the fluid, ρ is the fluid density, v is the flow velocity of the fluid at that point, g is the acceleration due to gravity, h is the height of the point, and c is a constant.
The density of air can vary with pressure, but when the flow velocity is low (Mach number < 0.3), the pressure change resulting from the flow rate is insufficient to induce a significant change in air density. This type of flow is referred to as incompressible flow. A well-known corollary of Bernoulli’s principle is that, at equal height, the pressure decreases as the flow rate increases. In incompressible flow, under reasonable assumptions and simplifications (such as the negligible change in altitude during flight, which can be treated as constant), the Bernoulli equation for gases is typically written as follows:
P + 1 2 ρ v 2 = c
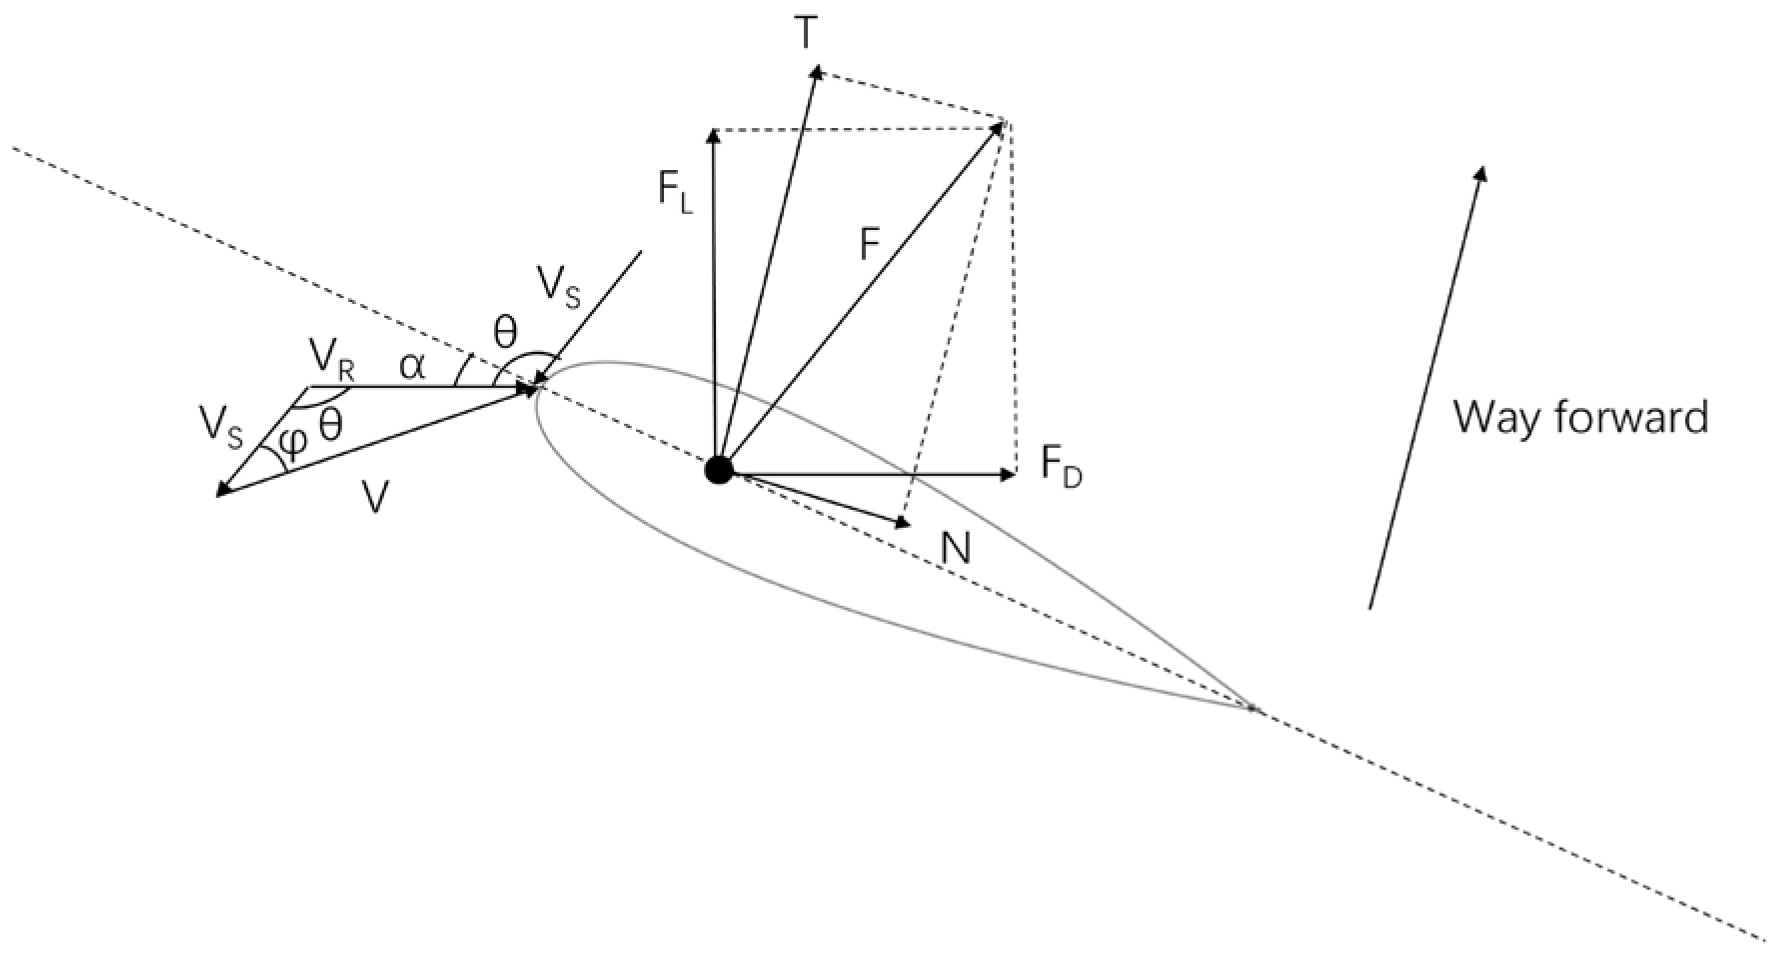
The wing sail is the primary component that determines the wind-catching efficiency of the unmanned sailboat. The force principle is illustrated in Figure 4. V represents the true wind speed, Vs. denotes the wind brought to the wing sail by the sailboat, and VR is the relative wind speed (i.e., the wind experienced on the sailboat). VR is the vector sum of V and VS, i.e., VR = V + VS. α is the angle between VR and the chord direction of the wing sail, i.e., the angle of attack [15]; φ is the angle between V and the Vs. direction, i.e., the wind direction angle; θ is the angle between Vs. and VR, i.e., the relative wind direction angle.
The wing sail is affected by the wind, generating drag (FD) in the direction relative to the wind and lift (FL) in the direction perpendicular to the wind [16]. When analyzing the power generated by the wing sail on the sailboat, the resultant force (F) of FD and FL is decomposed into the component force in the heading direction, known as thrust (T), and the component force perpendicular to the heading direction, known as side thrust (N). The dimensionless lift coefficient (CL), drag coefficient (CD), thrust coefficient (CT), and side thrust coefficient (CN) are used to measure the aerodynamic performance of the sail. The calculation formula is as follows:
C L = F L 1 2 ρ V R 2 A S
C D = F D 1 2 ρ V R 2 A S
C T = C L sin θ C D cos θ
C N = C L cos θ + C D sin θ
where ρ is the fluid density; AS is the projected area of the wing sail [17].

3.2. Computational Method

During the navigation process of the unmanned sailboat discussed in this paper, the surrounding airflow velocity is low, and the annual average air temperature at sea level in the country is approximately 15 °C. Under these conditions, the surrounding airflow velocity during navigation is low (Mach number Ma < 0.3), and the temperature is relatively low, allowing the air around the unmanned sailboat to be treated as an incompressible fluid. Given that changes in physical quantities such as air velocity, density, and temperature within the fluid domain over time are negligible, the flow can be considered steady [18]. Based on this assumption, this paper employs a steady-state flow model for computation, ensuring calculation accuracy while reducing computational effort and improving efficiency. To this end, the Reynolds-averaged Navier–Stokes (RANS) equation [19] is employed for analysis, and the continuity equation is combined with the Navier–Stokes equation [20] for fluid dynamics analysis.
u i x i = 0
u i t + ρ ( u i u j ) x i = p x i + ρ x j [ μ ( u i x j + u j x i ) ] + ρ g i
Here, u i represents the velocity component in the x i direction in the three-dimensional coordinate system, u j denotes the velocity component in the x j direction, ρ is the fluid density, p is the pressure, μ is the dynamic viscosity of the fluid, and g i is the mass force.
The SST k-ω model integrates the advantages of both the k-ε model and the k-ω model. The k-ω model is applied in the near-wall region, while the k-ε model is employed in the far-field region [21]. In scenarios involving a strong pressure gradient around the sail and more complex flow separation, the SST k-ω model can yield more accurate simulation results [22]. The transport equation for this model is as follows:
ρ ¯ k t + x j ( ρ ¯ u j k ) = x j [ ( μ + σ * μ t ) k x j ] + P k β * ρ ω k
ρ ¯ ω t + x j ( ρ ¯ u j ω ) = x j [ ( μ + σ μ t ) ω x j ] + α ω k P k β ρ ¯ ω 2
P k = ρ ¯ u i u j ¯ u i x j
μ t = C μ ρ ¯ k ω
Here, k represents the turbulent kinetic energy, ω is the specific dissipation rate, Pk is the generation term for turbulent kinetic energy k , μ is the molecular viscosity coefficient, μ t is the eddy viscosity coefficient, ρ is the fluid density, u j is the fluid velocity, β * is the balance coefficient between turbulent kinetic energy k and specific dissipation rate ω , and C μ is the low Reynolds number correction factor.

3.3. Meshing

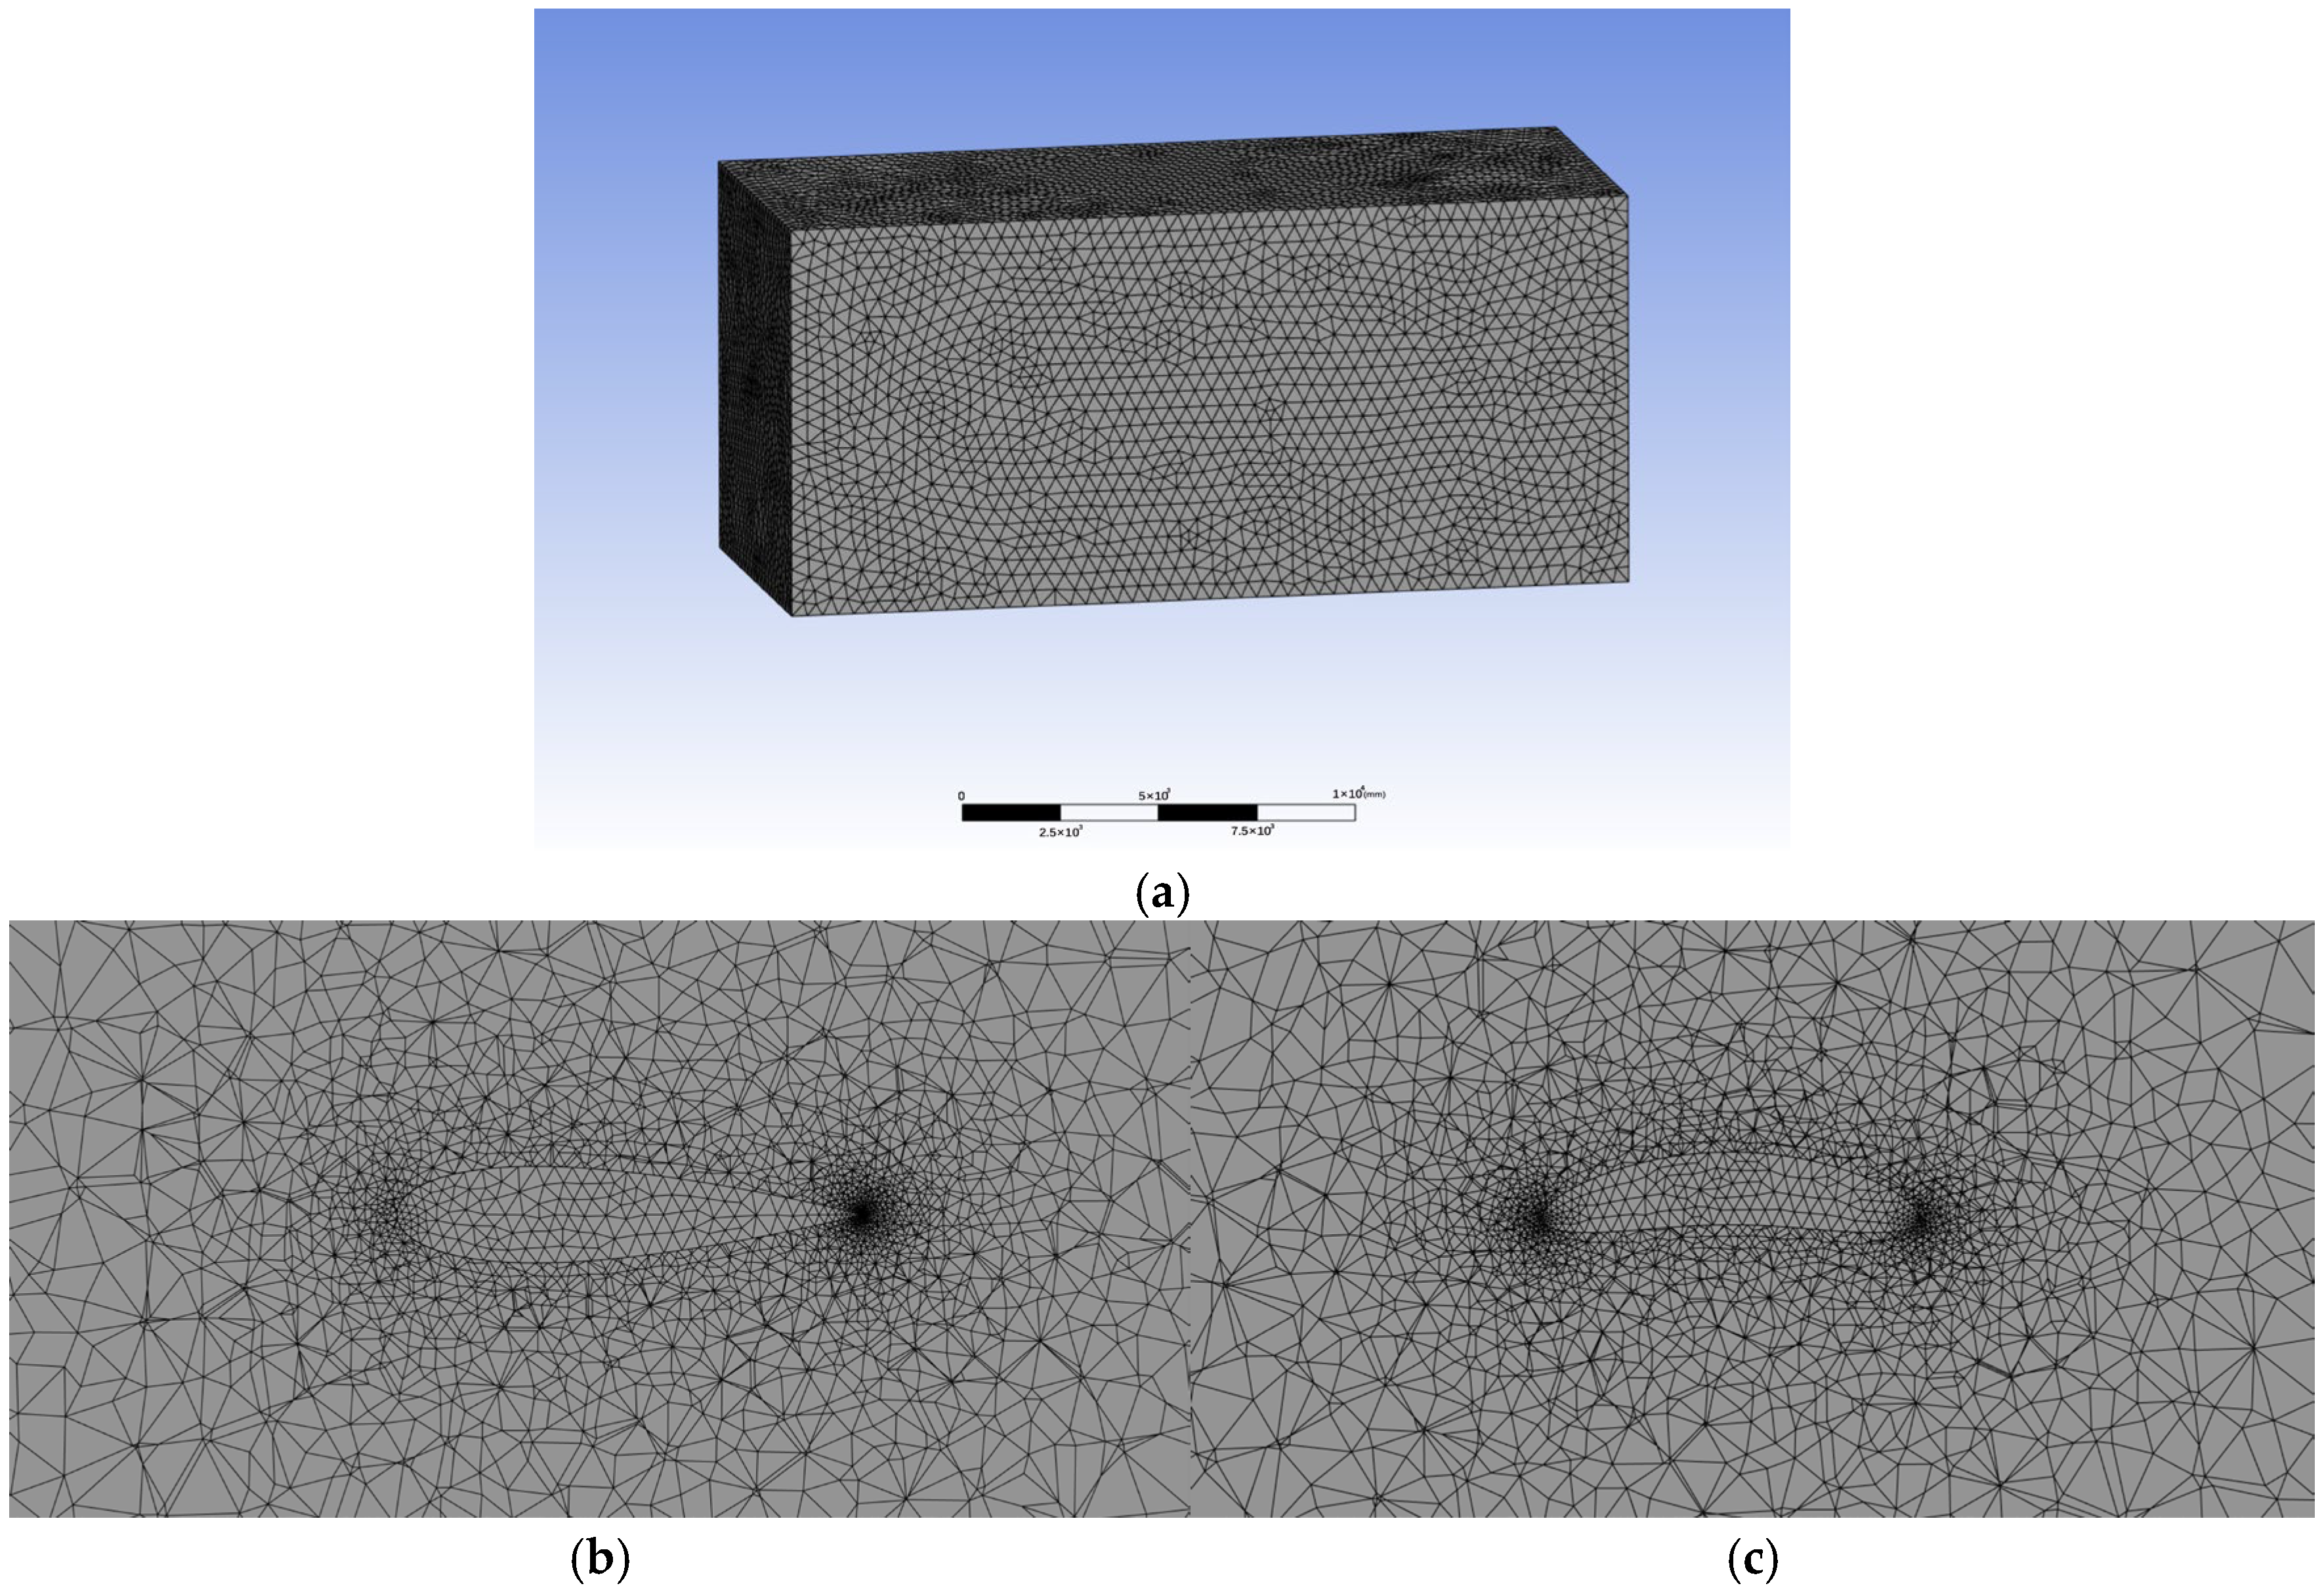
In Fluent, a computational fluid dynamics platform, when defining the fluid domain, the domain size is set to 35 times the chord length of the wing sail in length, 15 times the chord length in width, and 16 times the chord length in height to avoid the influence of boundary conditions on calculation accuracy [23]. The specific dimensions are illustrated in Figure 5a. Figure 5b is a local mesh diagram of the NACA 0021 wing sail, and Figure 5c is a local mesh diagram of the HF-14-CE-01 wing sail.
The left boundary of the computational domain is defined as a velocity inlet boundary condition, with the incoming flow velocity set to 8 m/s. The right boundary is specified as a pressure outlet boundary condition, with the outlet pressure set to standard atmospheric pressure. The airfoil adopts the no-slip wall condition [24]. To ensure the accuracy and stability of the calculation results, the grid quality standard requires that the skewness of the grid unit be less than 0.9 and the orthogonal quality be greater than 0.1 [25].
Mesh independence verification optimizes computational efficiency while ensuring accuracy, ensuring mesh-independent results. The external flow field was calculated using the SST k-ω model, with the wing sail angle of attack α set to 18° and a wind speed of 8 m/s. The lift and drag coefficients of the wing sail were calculated for different mesh sizes, as shown in Table 1 and Table 2. The results varied by less than ±5%. Analysis shows that the NACA 0021 wing sail has a grid convergence index (GCI) of approximately 0.0472% for the lift coefficient and less than 0.01% for the drag coefficient. The HF-14-CE-01 wing sail has a GCI of approximately 0.556% for the lift coefficient and approximately 0.54% for the drag coefficient. A GCI < 1% indicates minimal mesh error, relatively reliable results, and substantial mesh independence.

4. Simulation and Analysis of the Rigid Wing Sail

4.1. Parameter Settings for Simulation

Fluid simulations were conducted using Fluent 2022 R2 software. The relevant operating conditions are provided in Table 3. The angle of attack of the wing sail was adjusted using a rotational model.

4.2. Comparative Analysis of Two Wing Sail Types

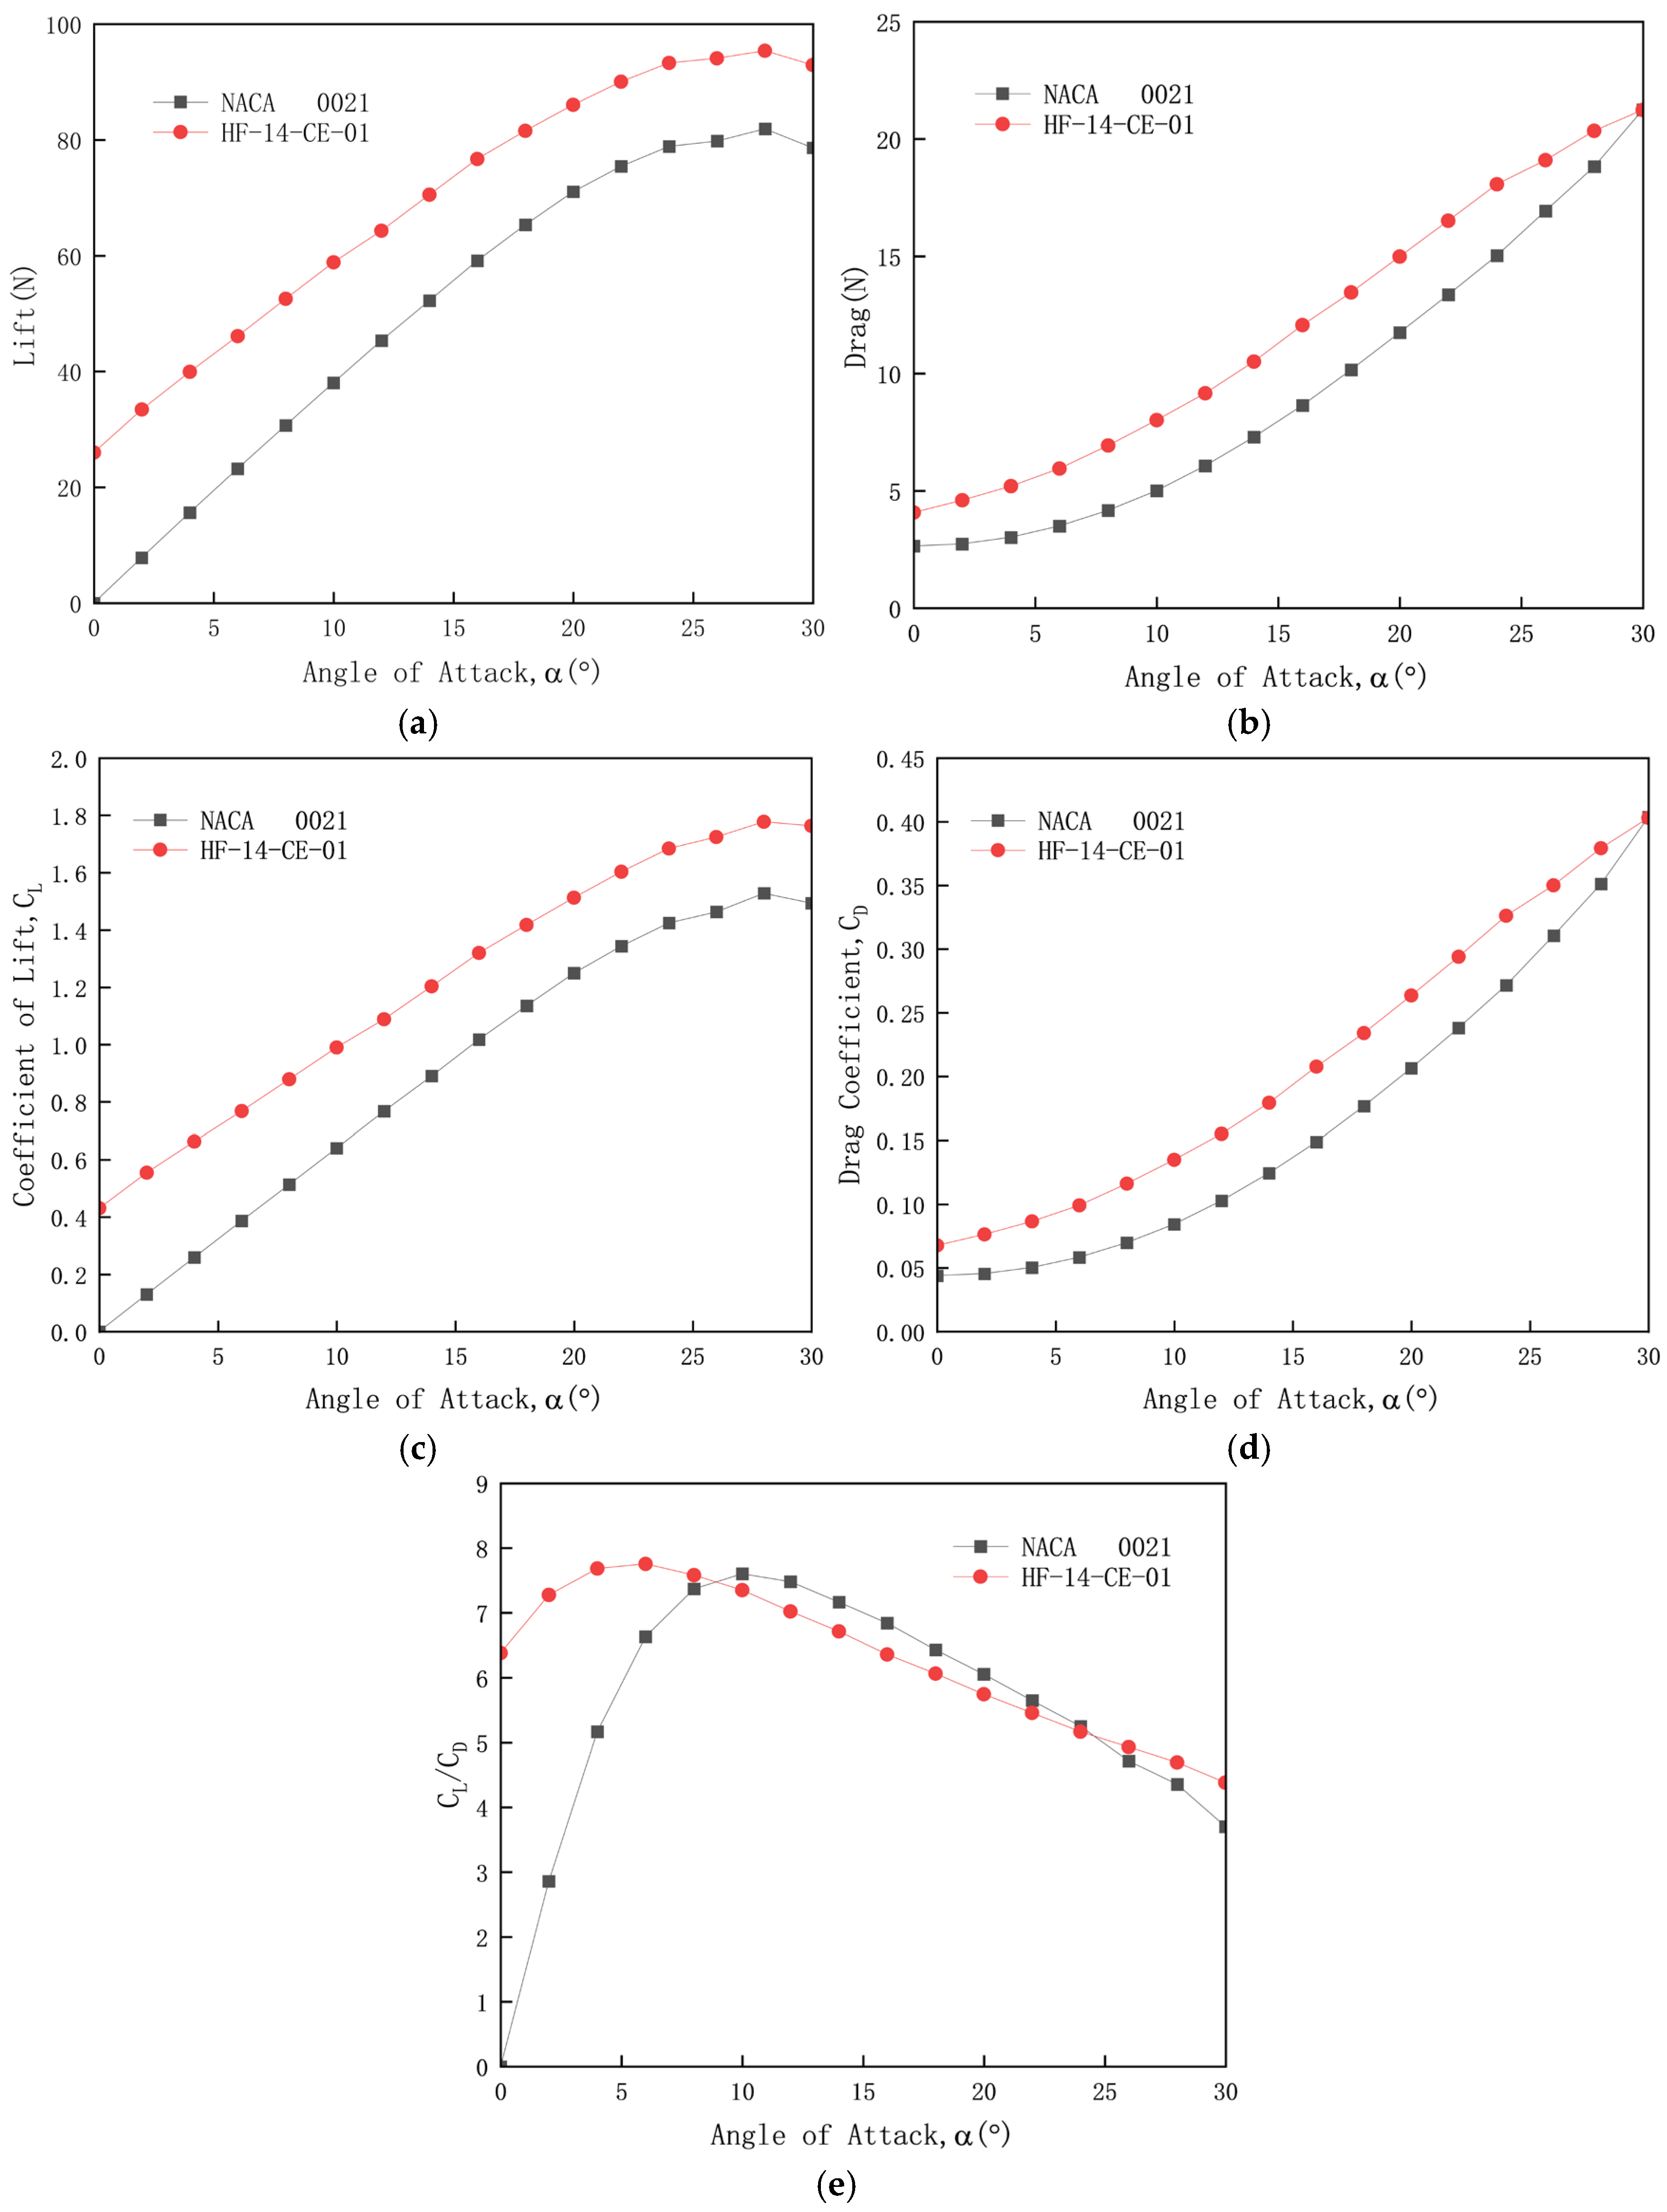
Aerodynamic parameters for the two wing sails were obtained through Fluent simulations, with the results presented in Figure 6. Analysis of Figure 6 reveals that the HF-14-CE-01 wing sail outperforms the NACA 0021 wing sail in terms of overall performance. Figure 6a,c indicate that both the lift and lift coefficient of the HF-14-CE-01 wing sail exceed those of the NACA 0021 wing sail. Figure 6b,d demonstrate that the drag and drag coefficient of the HF-14-CE-01 wing sail are greater than those of the NACA 0021. The observed increase in the overall drag coefficient is likely attributable to the influence of the leading edge. Figure 6e illustrates the lift-to-drag ratio of the two sails. It is evident that, within the angle of attack range from 0° to 8°, the lift-to-drag ratio of the HF-14-CE-01 sail is significantly higher than that of the NACA 0021 sail, indicating that the former has greater aerodynamic efficiency, capable of providing stronger propulsion to the vessel, thereby enhancing sailing speed and stability. The camber distribution of the HF-14-CE-01 wing sail likely allows it to generate significant positive lift near zero angle of attack, while maintaining a low drag increase. This means that at the same low angle of attack, lift is relatively high, resulting in a higher lift-to-drag ratio. The NACA 0021, on the other hand, is a symmetrical airfoil, resulting in a slower lift increase at low angles of attack, resulting in a relatively poor lift-to-drag ratio. Between angles of attack from 8° to 30°, the lift-to-drag ratios of both wing sails are similar, and their trends are also comparable.
When the wind comes from a specific direction, the rotation of the wing sail is categorized into five directional intervals, as shown in Figure 7: (a), (b), (c), (d), and (e). For unmanned sailboats, their sailing conditions can be classified into three categories: downwind, crosswind, and upwind [26]. In upwind sailing conditions, the unmanned sailboat cannot directly generate forward thrust and thus cannot sail directly. This range is referred to as the wind-prohibited zone, as shown in the shaded area at the top of Figure 7. Different vessels have varying wind-prohibited zone ranges, but most fall within the ±30° to ±45° range. The shaded area at the bottom of Figure 7 represents the wind-induced low-efficiency zone, where the unmanned sailboat is in a downwind sailing state. Regardless of the wing sail’s rotation, the maximum thrust exerted on the vessel equals the resistance on the wing sail, which hinders the unmanned sailboat’s speed and prevents it from reaching optimal sailing velocity. As a result, the sailing efficiency in this zone is low.
As shown in Figure 8 and Figure 9, the unmanned sailboat is sailing downwind, with the wind direction perpendicular to the wing sail, and the maximum thrust exerted on the sailboat is equal to the resistance encountered by the wing sail. Further analysis, as shown in Figure 8a and Figure 9a, indicates that the speed at the leading edge of the NACA 0021 sail exceeds that at the trailing edge, while the pressure at the leading edge is lower than at the trailing edge, resulting in an uneven pressure distribution. As shown in Figure 8b and Figure 9b, the speed at the leading edge of the HF-14-CE-01 wing sail is similar to that at the trailing edge, with a uniform pressure distribution across both edges. A uniform load distribution ensures that the wing sail retains its shape during sailing, is easier to adjust, and has a longer service life, which is crucial for equipment used in ocean-going applications. The HF-14-CE-01 wing sail’s structural design offers excellent resistance to gusts. Moreover, it is controlled by a single motor, which simplifies the algorithm for automatic angle adjustment compared to that of combination sails.
In summary, within the wind-induced low-efficiency zone, the HF-14-CE-01 wing sail is optimized relative to the NACA 0021 wing sail, improving the wind direction utilization efficiency, ensuring uniform force distribution, facilitating easier adjustment, and extending its service life.

4.3. Impact of Aspect Ratio on the Aerodynamic Performance of Wing Sails

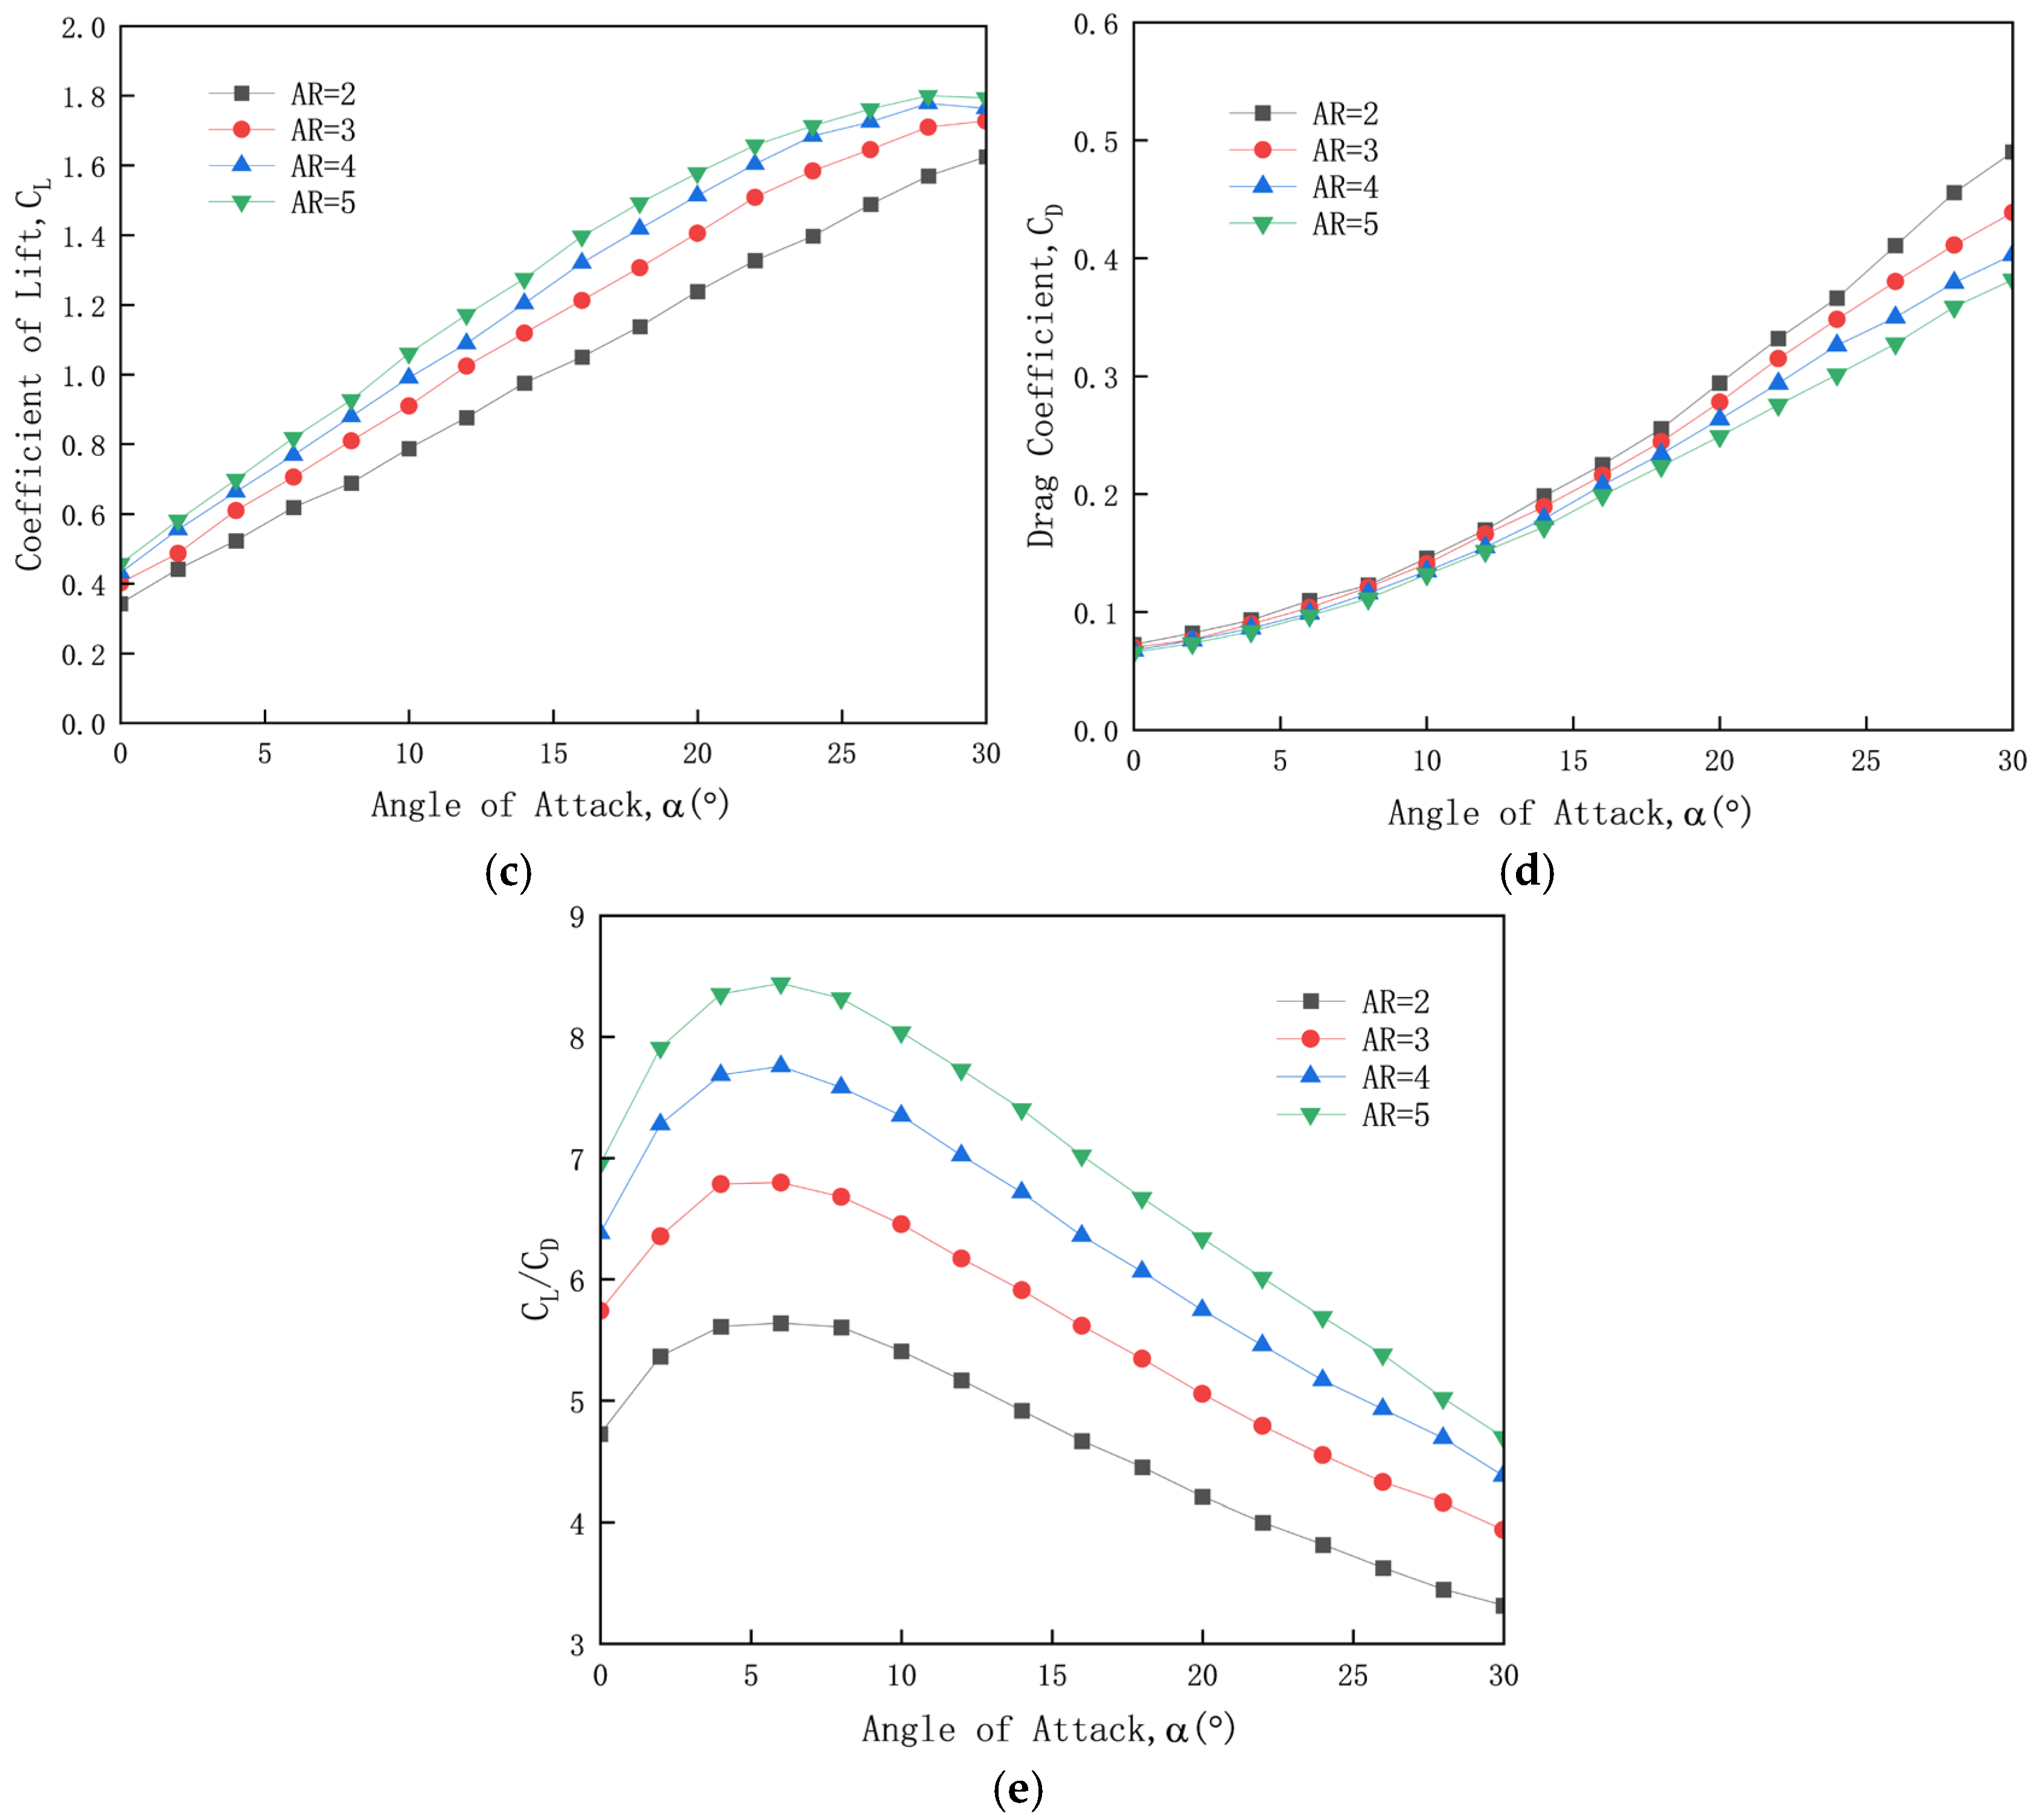
The aspect ratio is a critical parameter for assessing the shape of a wing sail, and its value directly influences the aerodynamic efficiency and sailing performance of the sail [27]. A higher aspect ratio leads to a more slender wing sail, which can enhance lift efficiency by reducing wingtip vortices, making it suitable for racing sailboats aiming for higher speeds. In contrast, a lower aspect ratio results in a wider and shorter wing sail, which, although it has slightly higher drag, provides a more compact structure and enhanced maneuverability, making it better suited for recreational sailing or navigating complex wind conditions [28]. This study examines the impact of different aspect ratios (AR = 2, 3, 4, 5) on the aerodynamic performance of the HF-14-CE-01 wing sail, with additional operating parameters provided in Table 3. As illustrated in Figure 10, the HF-14-CE-01 wing sail with a higher aspect ratio generates greater lift and drag compared to the version with a lower aspect ratio. The increase in lift is more significant than the increase in drag, resulting in a higher lift coefficient, a lower drag coefficient, and a better lift-to-drag ratio.
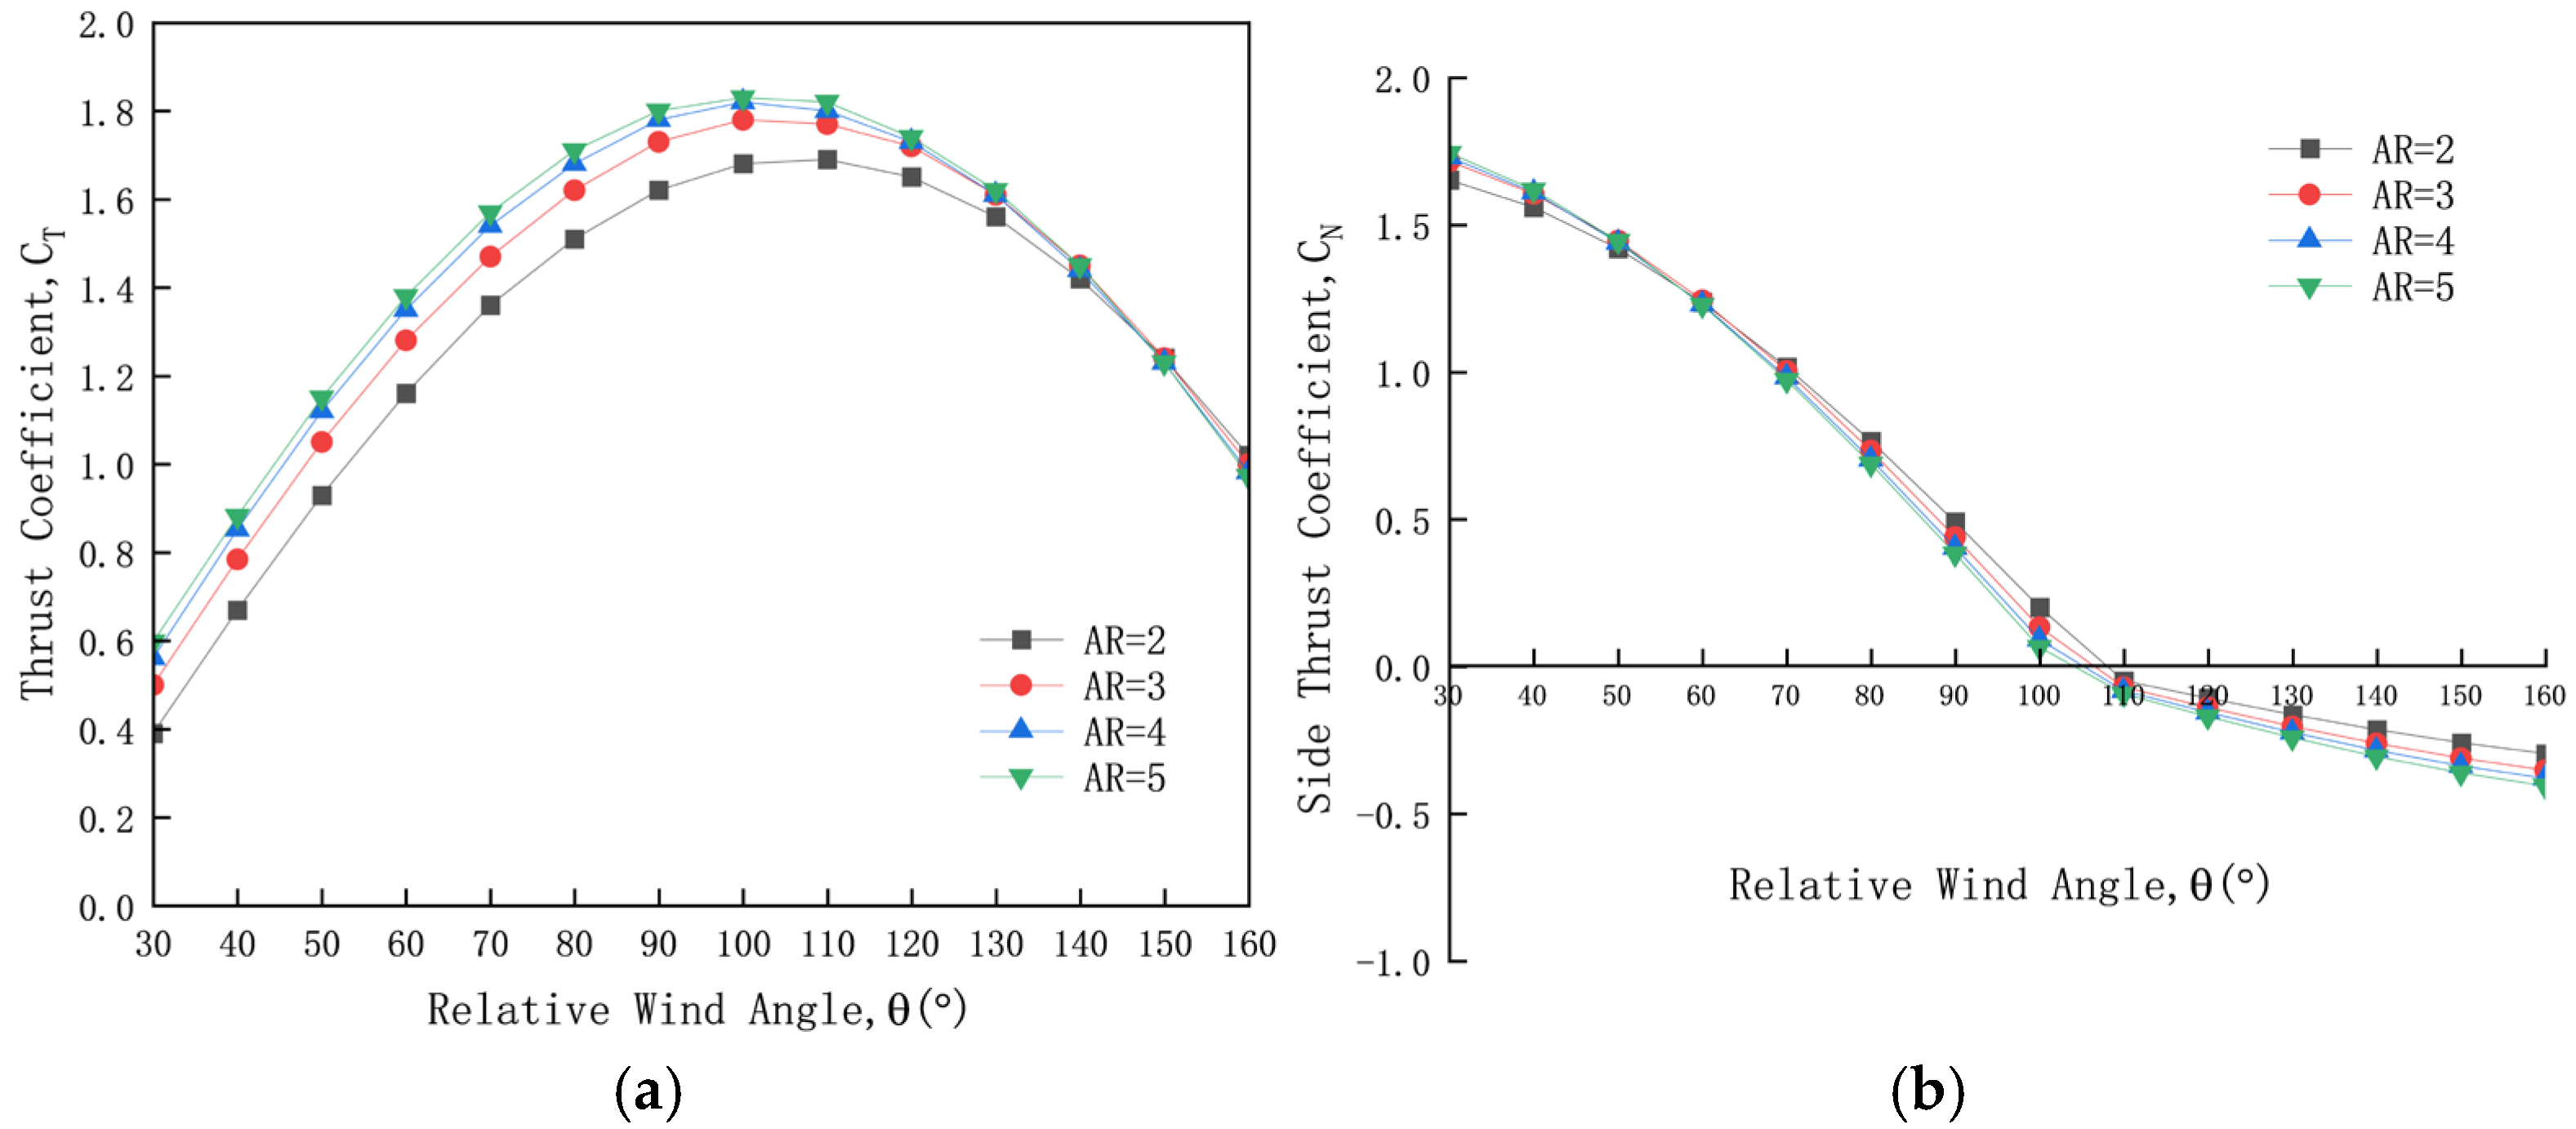
For unmanned sailboats, thrust is the primary force driving propulsion; therefore, research on the lift characteristics of wing sails must ultimately be translated into an investigation of thrust characteristics. Referring to the relationship between various forces and angles in Figure 4 and based on Equations (4) and (5), the lift and drag coefficients are converted into the thrust coefficient and the corresponding side thrust coefficient [29], respectively. The results are presented in Figure 11. Figure 11 illustrates the variations in the maximum thrust coefficient and side thrust coefficient as the relative wind angle (θ) [30] ranges from 30° to 160°. Within the range of 30° to 100°, as the relative wind angle (θ) increases, the thrust coefficient rises while the side thrust coefficient decreases, which benefits the navigation of unmanned sailboats. At θ = 100°, the thrust coefficient attains its maximum value. Between 100° and 160°, the thrust coefficient decreases as the wind angle increases. Meanwhile, the side thrust coefficient shows a general decreasing trend within the range of 30° to 160°, becoming negative between 100° and 110°, indicating a reversal in the direction of side thrust. In summary, the selection of the aspect ratio involves a comprehensive balance between power, drag, stability, and application scenarios. Therefore, the aspect ratio (AR) of the HF-14-CE-01 wing sail is set to 4.

4.4. Speed and Static Pressure Distribution of the HF-14-CE-01 Wing Sail at Various Angles of Attack

The aspect ratio (AR) of the HF-14-CE-01 wing sail is set to 4. As shown in Figure 12, at an angle of attack (α) = 0°, a low-pressure region is observed on the upper surface of the HF-14-CE-01 sail, indicating the generation of lift, as confirmed by the data in Figure 6a. This contrasts with the NACA 0021 sail, which generally does not generate lift at an angle of attack (α) = 0°, as the air pressure on both sides of the sail is equal.
As shown in Figure 13, at an angle of attack (α) = 20°, the airspeed at the leading edge of the HF-14-CE-01 sail is higher than that at the trailing edge. According to Bernoulli’s principle, the higher the airspeed, the lower the air pressure in that region, which results in lower pressure above the leading edge.
As shown in Figure 14, at an angle of attack (α) = 28°, a distinct wake is observed at the trailing edge of the HF-14-CE-01 wing sail, and the airflow separates from the rear surface of the sail. As the angle of attack increases, the airflow over the curved front surface of the wing sail becomes increasingly separated, reaching the maximum lift at a specific point. This point is defined as the critical angle of attack [31]. In aviation, this is also referred to as the stall angle of attack. The critical angle of attack of the HF-14-CE-01 wing sail is 28°, as confirmed by the data in Figure 6.
It should be noted that the SST k-ω turbulence model, while generally providing improved predictions of boundary layer separation compared to the k-ε model, is known to influence the dissipation rate of turbulent vortices. In steady RANS simulations, vortex dissipation represents the conversion of turbulent kinetic energy into thermal energy through viscous effects. If the model overpredicts dissipation, large-scale vortical structures in the wake may be attenuated too rapidly, leading to the underestimation of separation length, vortex strength, and consequently, lift and thrust coefficients—particularly at higher angles of attack where flow separation is more pronounced. Conversely, the underprediction of dissipation can result in excessive vortex persistence, potentially overestimating drag. Since the present study relies on steady-state RANS with the SST k-ω model, these effects may introduce discrepancies between numerical results and real-world performance, especially in highly unsteady or vortex-dominated flow regimes. Future work could address this limitation by employing transient simulations (e.g., URANS or LES) and by conducting validation against experimental data.
Atkinson conducted three-dimensional CFD simulations of segmented rigid sails and proposed a circular arc sail structure. The HF-14-CE-01 wing sail proposed herein delivers a higher lift coefficient for sailboats under identical wind speed and angle of attack conditions. The comparative results are presented in Table 4.

5. Conclusions

This paper employs CFD technology to investigate the aerodynamic characteristics of the wing sail, compares the aerodynamic performance of the NACA 0021 and HF-14-CE-01 wing sails, examines the effect of aspect ratio on the aerodynamic performance and thrust characteristics of the HF-14-CE-01 wing sail for the unmanned sailboat, and analyzes the velocity and static pressure cloud diagrams of the HF-14-CE-01 wing sail at various attack angles. The following conclusions are derived from the analysis:
(1) The lift and lift coefficient of the HF-14-CE-01 wing sail are significantly superior to those of the NACA 0021 wing sail, and its maximum lift-to-drag ratio moves forward.
(2) In the wind-induced low-efficiency zone, the HF-14-CE-01 wing sail is optimized relative to the NACA 0021 wing sail, improving wind direction utilization efficiency, ensuring uniform force distribution, facilitating easier adjustment, and extending its service life.
(3) Using a high-aspect-ratio wing sail enhances aerodynamic performance; however, slender wing sails experience high bending stresses during operation. Considering both performance and structural requirements, the aspect ratio (AR) of the HF-14-CE-01 wing sail was ultimately chosen to be 4. For relative wind angles θ ranging from 30° to 100°, the thrust coefficient (CT) of the unmanned sailboat increases with θ, peaking at approximately 100°; the corresponding lateral thrust coefficient (CN) gradually decreases with θ and changes direction between 100° and 110°.
(4) The velocity and static pressure contours of the HF-14-CE-01 wing sail at various angles of attack visually illustrate the sail’s performance, further confirming the data presented in Figure 6. The critical angle of attack of the HF-14-CE-01 wing sail is 28°, as visually represented.

Author Contributions

Conceptualization, C.X. and C.T.; methodology, C.X. and C.T.; software, C.X.; validation, C.X. and T.D.; formal analysis, H.W.; investigation, C.X.; resources, C.T.; data curation, C.X.; writing—original draft preparation, C.X.; writing—review and editing, C.X.; visualization, T.D.; supervision, C.T.; project administration, H.W.; funding acquisition, C.T. All authors have read and agreed to the published version of the manuscript.

Funding

This research was funded by the Shandong Province science and technology SMES innovation ability improvement project of China (Grant No. 2023TSGC0350).

Data Availability Statement

All data generated during this study are included in this published article.

Conflicts of Interest

The authors declare no conflicts of interest.

Nomenclature

SymbolUnitMeaning
C1mmNACA 0021 chord length
C2mmHF-14-CE-01 chord length
B1mmNACA 0021 wingspan
B2mmHF-14-CE-01 wingspan
AR-aspect ratio
PN/m2pressure at a certain point in the fluid
ρkg/m3fluid density
vm/sflow velocity of the fluid at that point
gm/s2acceleration due to gravity
hmheight of the point
c-constant
Vm/strue wind speed
VSm/swind brought to the wing sail by the sailboat
VRm/svector sum of V and VS
α°angle of attack
φ°wind direction angle
θ°relative wind direction angle
FDNdrag
FLNlift
FNresultant force
TNthrust
NNside thrust
CL-lift coefficient
CD-drag coefficient
CT-thrust coefficient
CN-side thrust coefficient
ASm2projected area of the wing sail
x i -direction in the three-dimensional coordinate system
x j -direction in the three-dimensional coordinate system
u i m/s velocity   component   in   the   x i direction in the three-dimensional coordinate system
u j m/s velocity   component   in   the   x j direction in the three-dimensional coordinate system
μ Pa·sdynamic viscosity of the fluid
g i Nmass force
k m2/s2turbulent kinetic energy
ω S−1specific dissipation rate
Pk-generation term for turbulent kinetic energy k
μ t kg/(m·s)eddy viscosity coefficient
β * -balance coefficient between turbulent kinetic energy k and specific dissipation rate ω
C μ -low Reynolds number correction factor
CL/CD-lift/drag ratio

References

  1. Qin, H.; Xiang, K.; Cao, X.; Qi, B.; Huang, X.; Wang, Y. Optimization design and experimental verification of unmanned sailboat sails. Phys. Fluids 2025, 37. [Google Scholar] [CrossRef]
  2. Sun, Z.; Feng, A.; Yu, J.; Zhao, W.; Huang, Y. Development of autonomous sailboat sails and future perspectives: A review. Renew. Sustain. Energy Rev. 2025, 207, 114918. [Google Scholar] [CrossRef]
  3. Chiodi, A.M.; Zhang, C.; Cokelet, E.D.; Yang, Q.; Mordy, C.W.; Gentemann, C.L.; Cross, J.N.; Lawrence-Slavas, N.; Meinig, C.; Steele, M.; et al. Exploring the Pacific Arctic seasonal ice zone with saildrone USVs. Front. Mar. Sci. 2021, 8, 640690. [Google Scholar] [CrossRef]
  4. Fer, I.; Peddie, D. Near surface oceanographic measurements using the SailBuoy. In Proceedings of the 2013 MTS/IEEE OCEANS-Bergen, Bergen, Norway, 10–13 June 2013; IEEE: New York, NY, USA, 2013; pp. 1–15. [Google Scholar]
  5. Ouchi, K.; Uzawa, K.; Kanai, A. Huge hard wing sails for the propulsor of next generation sailing vessel. In Proceedings of the Second International Symposium on Marine Propulsors, Hamburg, Germany, 17 June 2011. [Google Scholar]
  6. Viola, I.M.; Biancolini, M.E.; Sacher, M.; Cella, U. A CFD-based wing sail optimisation method coupled to a VPP. In Proceedings of the 5th High Performance Yacht Design Conference, Auckland, New Zealand, 9–11 March 2015. [Google Scholar]
  7. Atkinson, G.M. Analysis of lift, drag and CX polar graph for a 3D segment rigid sail using CFD analysis. J. Mar. Eng. Technol. 2019, 18, 36–45. [Google Scholar] [CrossRef]
  8. Chen, Z.; Cai, W.; Zeng, Q. A numerical study on the thrust and interaction of a three-sail wind-assisted propulsion system. In Proceedings of the International Conference on Offshore Mechanics and Arctic Engineering, Hamburg, Germany, 5–10 June 2022; American Society of Mechanical Engineers: New York, NY, USA, 2022; Volume 85925, p. V007T08A056. [Google Scholar]
  9. Zhu, H.; Yao, H.-D.; Thies, F.; Ringsberg, J.W.; Ramne, B. Propulsive performance of a rigid wingsail with crescent-shaped profiles. Ocean. Eng. 2023, 285, 115349. [Google Scholar] [CrossRef]
  10. Ives, R.; Bassey, E.; Hamad, F.A. Investigation of the flow around an aircraft wing of section NACA 2412 utilising ANSYS fluent. INCAS Bull. 2018, 10, 95–104. [Google Scholar] [CrossRef]
  11. Guo, H.; Li, G.; Zou, Z. Numerical simulation of the flow around NACA0018 airfoil at high incidences by using RANS and DES methods. J. Mar. Sci. Eng. 2022, 10, 847. [Google Scholar] [CrossRef]
  12. Hewitt, P.G. Bernoulli’s principle. Sci. Teach. 2004, 71, 51. [Google Scholar]
  13. Tinoco, V.; Malheiro, B.; Silva, M.F. Design, modeling, and simulation of a wing sail land yacht. Appl. Sci. 2021, 11, 2760. [Google Scholar] [CrossRef]
  14. bin Mohamed Nadzri, M.A.A.; Ahmed, Y.A. Feasibility study of wing sail technology for commercial ship. J. Mek. 2021, 44, 26–45. [Google Scholar]
  15. Mi, B.; Yu, J. A New Grid-Slat Fusion Device to Improve the Take-Off and Landing Performance of Amphibious Seaplanes. J. Mar. Sci. Eng. 2024, 12, 2303. [Google Scholar] [CrossRef]
  16. Li, D.; Zhang, Y.; Li, P.; Dai, J.; Li, G. Aerodynamic performance of a new double-flap wing sail. Pol. Marit. Res. 2019, 26, 61–68. [Google Scholar] [CrossRef]
  17. Chen, Y.; Liu, S.; Xie, T.; Zhang, Z.; Zhang, Y.; Lin, W.; Jiang, K.; Wang, T. Parameter Identification of an Unmanned Sailboat Combining Experiments and Numerical Analysis. J. Mar. Sci. Eng. 2024, 12, 2226. [Google Scholar] [CrossRef]
  18. Kleinstreuer, C. Modern Fluid Dynamics; CRC Press: Boca Raton, FL, USA, 2018. [Google Scholar]
  19. Kajishima, T.; Taira, K. Reynolds-averaged navier–stokes equations. In Computational Fluid Dynamics: Incompressible Turbulent Flows; Springer International Publishing: Cham, Germany, 2016; pp. 237–268. [Google Scholar]
  20. Łukaszewicz, G.; Kalita, P. Navier–stokes equations. Adv. Mech. Math. 2016, 34, 11–39. [Google Scholar]
  21. Matyushenko, A.A.; Garbaruk, A.V. Adjustment of the k-ω SST turbulence model for prediction of airfoil characteristics near stall. In Journal of Physics: Conference Series; IOP Publishing: Bristol, UK, 2016; Volume 769, p. 012082. [Google Scholar]
  22. Zhao, M.; Wan, D.; Gao, Y. Comparative study of different turbulence models for cavitational flows around NACA0012 hydrofoil. J. Mar. Sci. Eng. 2021, 9, 742. [Google Scholar] [CrossRef]
  23. Liu, J.; Jiang, Z.; Du, L.; Lv, Z.; Cui, H.; Li, X.; Liang, G. Hydrodynamic and Vibroacoustic Simulation Analysis of the Main Float in an Acoustic Submerged Buoy System. J. Mar. Sci. Eng. 2025, 13, 1254. [Google Scholar] [CrossRef]
  24. Golshan, R.; Tejada-Martínez, A.E.; Juha, M.; Bazilevs, Y. Large-eddy simulation with near-wall modeling using weakly enforced no-slip boundary conditions. Comput. Fluids 2015, 118, 172–181. [Google Scholar] [CrossRef]
  25. Katz, A.; Sankaran, V. Mesh quality effects on the accuracy of CFD solutions on unstructured meshes. J. Comput. Phys. 2011, 230, 7670–7686. [Google Scholar] [CrossRef]
  26. Tipsuwan, Y.; Sanposh, P.; Techajaroonjit, N. Overview and control strategies of autonomous sailboats—A survey. Ocean. Eng. 2023, 281, 114879. [Google Scholar] [CrossRef]
  27. Kuang, L.; Li, H.; Su, X.; Song, X.; Wang, Z.; Zhang, Y.; Ma, W. Effect of chord length ratio on aerodynamic performance of two-element wing sail. Ocean. Eng. 2023, 287, 115946. [Google Scholar] [CrossRef]
  28. Li, Y.; Hu, J.; Zhao, Q.; Pan, Z.; Ma, Z. Hydrodynamic performance of autonomous underwater gliders with active twin undulatory wings of different aspect ratios. J. Mar. Sci. Eng. 2020, 8, 476. [Google Scholar] [CrossRef]
  29. Burgers, P. Dimensionally and Physically Proper Lift, Drag, and Thrust-Related Numbers as Figures of Merit: Normalized Lift, Drag, and Thrust, η L, η D, and η T. J. Aerosp. Eng. 2017, 30, 04016091. [Google Scholar] [CrossRef]
  30. Yasuda, A.; Taniguchi, T.; Katayama, T. Numerical Investigation of Aerodynamic Interactions between Rigid Sails Attached to Ship. J. Mar. Sci. Eng. 2024, 12, 1425. [Google Scholar] [CrossRef]
  31. Wu, C.H.; Chen, J.Z.; Lo, Y.L.; Fu, C.-L. Numerical and Experimental Studies on the Aerodynamics of NACA64 and DU40 Airfoils at Low Reynolds Numbers. Appl. Sci. 2023, 13, 1478. [Google Scholar] [CrossRef]
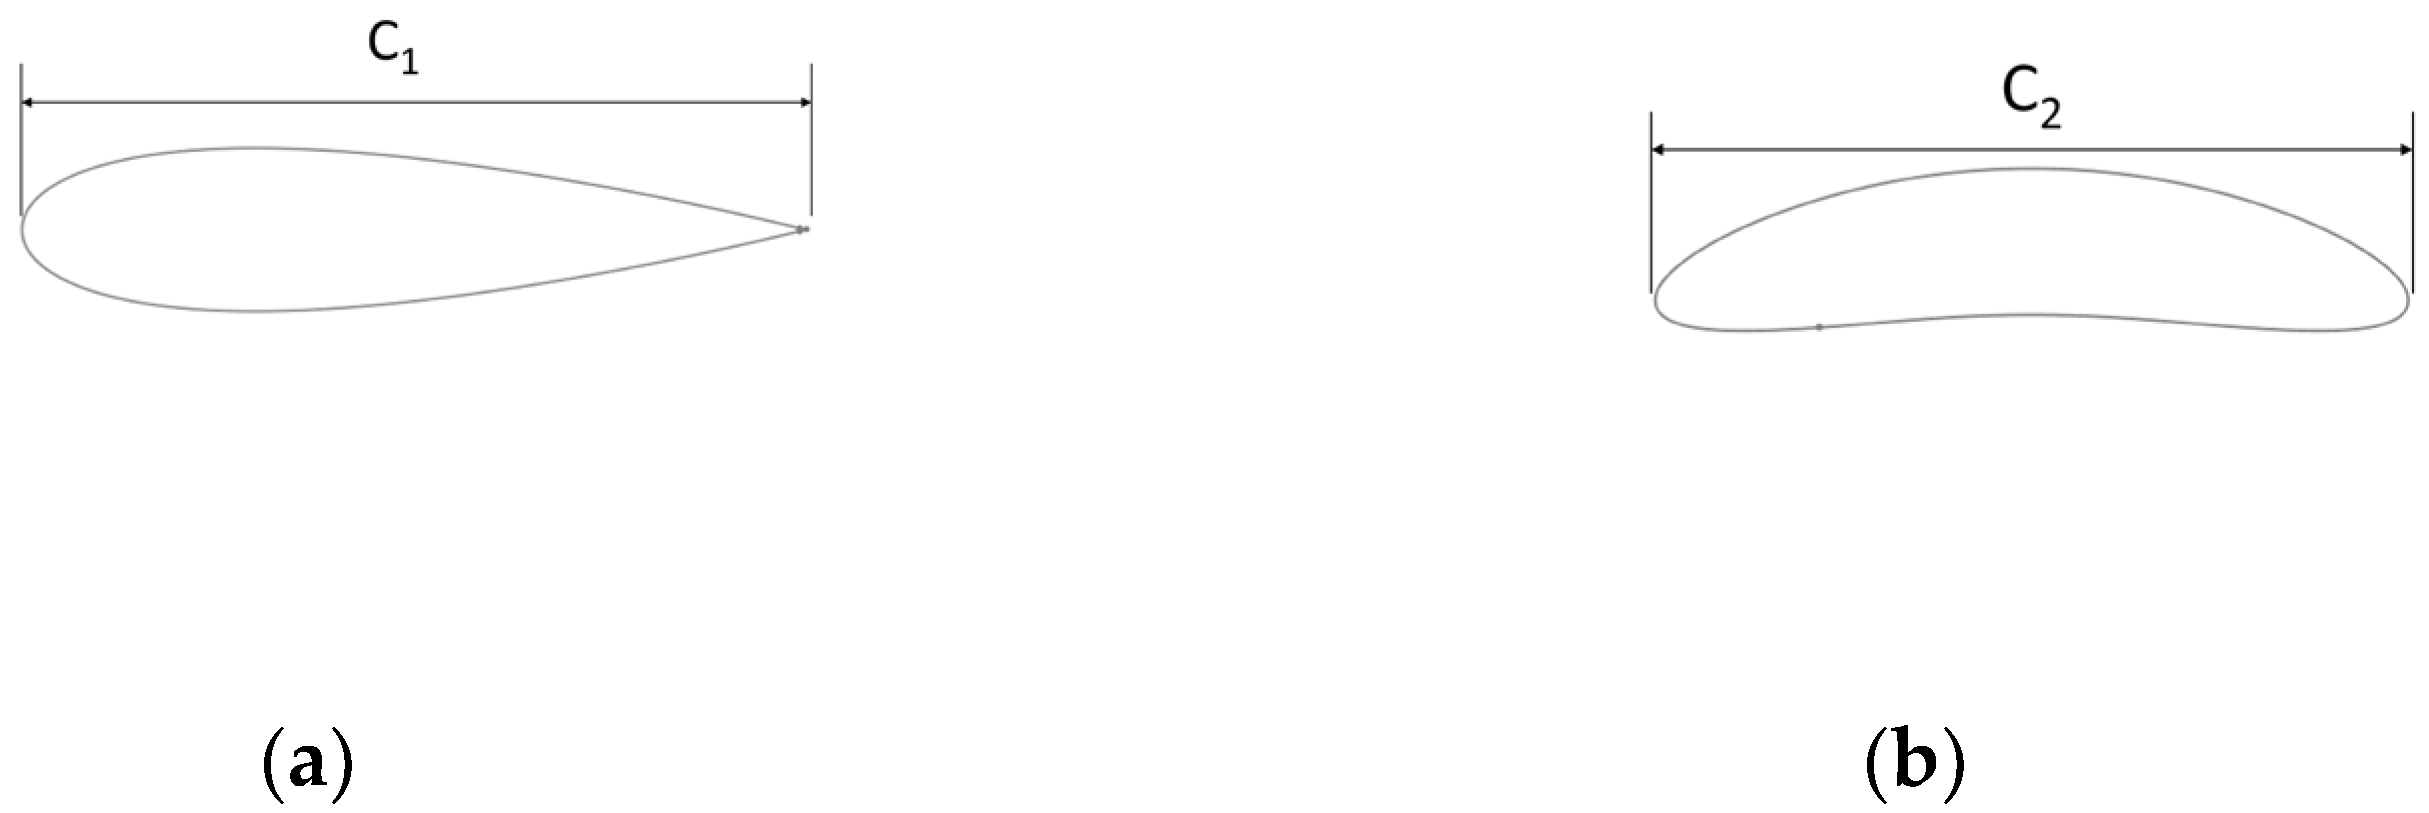
Figure 1. Cross-sectional view of the wing sail: (a) NACA 0021 type; (b) HF-14-CE-01 type.
Applsci 15 09052 g001
Figure 2. Main parameters of the wing sail: (a) NACA0021 type; (b) HF-14-CE-01 type.
Applsci 15 09052 g002
Figure 3. Simulation models of the wing sail: (a) NACA0021 type; (b) HF-14-CE-01 type.
Applsci 15 09052 g003
Figure 4. Principle of force acting on wing sails.
Applsci 15 09052 g004
Figure 5. Meshing: (a) fluid domain; (b) local mesh diagram of the NACA 0021; (c) local mesh diagram of the HF-14-CE-01.
Applsci 15 09052 g005
Figure 6. Lift/drag characteristics curves of two types of wing sail type: (a) lift; (b) drag; (c) lift coefficient; (d) drag coefficient; (e) lift/drag ratio.
Applsci 15 09052 g006
Figure 7. Range of wing sail directions: (a) NACA0021 type; (b) HF-14-CE-01 type.
Applsci 15 09052 g007
Figure 8. Speed vector diagram: (a) NACA0021 type; (b) HF-14-CE-01 type.
Applsci 15 09052 g008
Figure 9. Pressure cloud map: (a) NACA0021 type; (b) HF-14-CE-01 type.
Applsci 15 09052 g009
Figure 10. Lift/drag characteristics curves of the HF-14-CE-01 wing sail at different aspect ratios: (a) lift; (b) drag; (c) lift coefficient; (d) drag coefficient; (e) lift/drag ratio.
Applsci 15 09052 g010aApplsci 15 09052 g010b
Figure 11. Thrust and lateral thrust curves of the HF-14-CE-01 wing sail at different aspect ratios: (a) thrust coefficient; (b) side thrust coefficient.
Applsci 15 09052 g011
Figure 12. HF-14-CE-01 wing sail at angle of attack α = 0°: (a) speed cloud map; (b) pressure cloud map.
Applsci 15 09052 g012
Figure 13. HF-14-CE-01 wing sail at angle of attack α = 20°: (a) speed cloud map; (b) pressure cloud map.
Applsci 15 09052 g013
Figure 14. HF-14-CE-01 wing sail at angle of attack α = 28°: (a) speed cloud map; (b) pressure cloud map.
Applsci 15 09052 g014
Table 1. NACA 0021 mesh independence verification.
Number of MeshesLift Coefficient CLDrag Coefficient CD
6 × 1051.1400.178
9 × 1051.1370.177
13.5 × 1051.1380.177
Table 2. HF-14-CE-01 mesh independence verification.
Number of MeshesLift Coefficient CLDrag Coefficient CD
5.5 × 1051.4200.239
8.3 × 1051.4110.233
12.3 × 1051.4060.231
Table 3. Simulation parameter configuration.
Flow field velocity8 m/s
Angle of attack α0°, 2°, 4°, 6°, 8°, 10°, 12°, 14°, 16°, 18°, 20°, 22°, 24°, 26°, 28°, and 30°
Viscous equationSST k-ω
Fluid domain materialAtmosphere
Calculated reference areaThe projected area of the mainsail in the Y direction
Calculated reference length0.62 m
Solution methodSecond-order SIMPLEC algorithm
Reporting definitionsLift, drag, lift coefficient, and drag coefficient
Number of iterations103
Table 4. Comparison of lift coefficient and drag coefficient.
Angle of AttackLift Coefficient of the 3D Segment Rigid SailDrag Coefficient of the 3D Segment Rigid SailLift Coefficient of the HF-14-CE-01 Wing SailDrag Coefficient of the HF-14-CE-01 Wing Sail
0.450.060.310.06
10°1.020.130.710.16
20°1.550.261.050.34
30°1.800.371.340.65
Disclaimer/Publisher’s Note: The statements, opinions and data contained in all publications are solely those of the individual author(s) and contributor(s) and not of MDPI and/or the editor(s). MDPI and/or the editor(s) disclaim responsibility for any injury to people or property resulting from any ideas, methods, instructions or products referred to in the content.