Article

Modeling Relative Permeability-Resistivity Relationships from Seepage Experiment Laws

1
College of Geo-Science, Northeast Petroleum University, Daqing 163318, China
2
State Key Laboratory of Continental Shale Oil, Northeast Petroleum University, Daqing 163318, China
3
College of Petroleum Engineering, Northeast Petroleum University, Daqing 163318, China
4
Laboratory of Enhanced Oil Recovery of Education Ministry, Daqing 163318, China
5
Research Institute of Exploration and Development, Dagang Oil Field, PetroChina, Tianjin 300280, China
*
Author to whom correspondence should be addressed.
Appl. Sci. 2025, 15(16), 8963; https://doi.org/10.3390/app15168963
Submission received: 19 July 2025 / Revised: 9 August 2025 / Accepted: 12 August 2025 / Published: 14 August 2025

Abstract

Featured Application

The established relative permeability–resistivity model incorporates the characteristics of complex argillaceous sandstone reservoirs, providing improved characterization of multiphase fluid flow behavior in porous rocks and thus significantly enhancing the calculation accuracy of relative permeability. This model establishes a novel methodology for accurately determining relative permeability using formation resistivity parameters, providing an innovative solution for reservoir evaluation.

Abstract

Relative permeability, as a key parameter characterizing multiphase fluid flow behavior in porous media, holds significant importance across various fields, such as reservoir evaluation and engineering geology. However, measuring relative permeability is time-consuming and costly. Considering the analogy between fluid flow and electrical current conduction provides a novel approach for studying multiphase flow characteristics using resistivity data. An integrated oil–water relative permeability and resistivity co-measurement experiment was specifically designed for a complex argillaceous sandstone reservoir in a block, referred to as Block A. Research has shown that as the resistance coefficient increases, the water and oil relative permeability decrease and increase, respectively. As the porosity–permeability comprehensive index increases and the shale content decreases, corresponding to the same resistance coefficient, the water and oil relative permeability show increasing and decreasing trends, respectively. The integration of tortuous capillary tube theory and three-water model concepts, combined with the flow-current similarity principle, has enabled the development of a novel relative permeability–resistivity correlation model that is applicable to complex argillaceous sandstone formations. The application of actual data from the study area shows that the relative errors of the water- and oil-phase relative permeability calculated by the proposed model are both small, at 16% and 8.6%, respectively. The model is validated to better characterize multiphase fluid flow in rocks, offering a new approach for accurately calculating relative permeability based on formation resistivity data.

1. Introduction

As a key parameter in reservoir evaluation and oilfield development, oil–water relative permeability is essential and important data for multiphase fluid parameter calculation, oilfield dynamic analysis, and numerical simulation [1,2,3,4]. At present, steady-state and non-stationary methods are the most commonly used methods for testing relative permeability in laboratories. However, due to the difficulty of simulating reservoir conditions in the laboratory, the process of measuring relative permeability in core experiments is time-consuming and costly. As a result, scholars have successively proposed models for calculating relative permeability using capillary pressure curves, the usability of which are limited by a lack of measuring parameters, such as capillary pressure [5]. Research has shown that three important parameters, namely resistivity, capillary pressure, and relative permeability, are all functions of fluid saturation in porous media [6,7,8]. Compared to the difficulty of obtaining oil–water relative permeability data, resistivity data is easier to obtain due to the extensive use of resistivity logging methods and the ease of conducting indoor core resistance experiments [9]. Therefore, scholars have successively proposed using resistivity data to predict oil–water relative permeability, taking into account factors such as rock saturation [10,11,12,13,14].
Based on the analysis of experimental data and the analogy between fluid flow and electrical current conduction [15], Li et al. proposed a practical semi-empirical model to calculate relative permeability from the resistivity index via the introduction of empirical coefficients, thereby establishing an effective methodology with which to derive continuous relative permeability profiles from resistivity well logging data [16,17]. Considering that relative permeability is not only affected by fluid saturation but also by microstructure [18,19,20], Pairoys et al. [21] tested the Li model and found that in some cases, the calculated relative permeability of the water phase in the model was much larger than the experimental data. This is significant considering the high relative permeability of the water phase resulting from the lack of microstructure parameters. Therefore, based on the fractal characteristics of porous media, Shi Yujiang et al. applied fractal geometry theory to characterize pore structure and study fluid flow and revealed the significant influence of structural parameters on the resistivity index and relative permeability, providing an effective method with which to calculate relative permeability from resistivity data [22]. In addition, when determining model parameters through core analysis, it is necessary to consider the differences in pore structure due to its significant influence on the tortuosity ratio and resistivity index of wetting phases [23,24,25]. Ma Dong derived a new model for inferring the relative permeability of two phases from resistivity index data, including the tortuosity ratio of wetting phases, thus improving on the Li model in terms of matching relative permeability data [26]. In summary, previous models primarily employ regression analyses of experimental data to derive empirical formulas that describe the relationship between oil–water relative permeability and parameters, such as water saturation and capillary pressure. However, these established empirical models lack a solid theoretical foundation and their regression coefficients are applicable only to specific experimental samples and formation properties, exhibiting significant empirical limitations. Furthermore, these models fail to adequately account for various factors relating to reservoir characteristics, such as pore size, distribution, and channel tortuosity, which significantly influence relative permeability curves; as such, they cannot accurately reflect the variation patterns of complex rock pore structure parameters. Consequently, these models are unable to properly characterize the flow behavior of multiphase fluids in formations. To address these limitations, this study proposes an improved new model based on the fundamental theories of the tortuous capillary model and the three-water model.
In porous media, while clarifying the theoretical relationship between relative permeability and the resistivity index is crucial for interpreting multiphase fluids using the electrical characteristics of rocks, there is limited research on this topic, particularly in terms of experimental research basic data and analysis and comparisons of experimental rules. Compared to empirical regression formulas established in different regions, the formulas used for the complex argillaceous sandstone reservoirs in this study area are less empirical and have significant calculation errors, which cannot accurately reflect the correlation between phase permeability parameters and conductivity characteristics. Therefore, this study proposes an integrated experimental design and measurement protocol for the simultaneous determination of oil–water relative permeability and resistivity in complex argillaceous rocks, ensuring all pore-structure-sensitive tests are performed on identical core samples. The experimental approach systematically analyzes how variations in shale content and pore structure affect the oil–water relative permeability–resistivity relationship. Contrastingly, this study thoroughly accounts for the distinct conductive pathways between bound water and movable water as well as the influence of argillaceous conductivity on both fluid flow and electrical conduction characteristics in rocks. This article focuses on the characteristics of a complex argillaceous sandstone reservoir in a block, referred to as Block A for reasons of confidentiality. Block A is located in the western region of the Changyuan structural belt, northern Songliao Basin. Compared with conventional reservoirs, it exhibits complex geological characteristics including intricate pore structures, complicated oil–water relationships, high shale content, and well-developed thin interbeds of sandstone and mudstone. Considering these characteristics, this study designed an integrated experimental protocol measuring both oil–water relative permeability and resistivity (with supporting parameter measurements) on cored samples from Block A, therefore characterizing the correlation between rock electrical properties and multiphase flow behavior more accurately. The experimental data is fully utilized to systematically analyze the influence of such factors as rock pore structure characteristics and shale content changes on the relationship between oil–water relative permeability and resistivity. By combining the theoretical basis of seepage and conductivity and considering the curved capillary and resistivity models, we establish an oil–water relative permeability and resistivity relationship model that is suitable for complex argillaceous sandstone reservoirs in the research area. The correctness and practicality of the established model are theoretically and practically verified using physical boundary conditions and experimental measurement data. The research results provide a feasible solution to accurately calculation oil–water relative permeability in Block A, which has important practical significance for improving the exploration and development efficiency and economic benefits of the oilfield, thus ensuring its sustainable development.

2. Experimental Design and Measurement

Relative permeability is a key parameter for the characterization of flow characteristics of multiphase fluids in porous media and is thus essential data for dynamic analysis, numerical simulation, and production calculation in oilfield development processes. However, due to the difficulty of simulating complex reservoir conditions in the laboratory, the process of measuring relative permeability in core experiments is time-consuming and expensive [27]. In contrast, core resistivity data is easier to obtain and can directly measure reservoir resistivity values at different underground depths through electrical logging methods [28]. However, current scholars know very little about the theoretical relationship between relative permeability and resistivity parameters, which is the key to using rock electrical parameters to explain multiphase fluid flow parameters in porous media. Therefore, in order to more accurately describe the correlation between rock electrical properties and multiphase fluid flow characteristics, this study uses 26 core samples from the core section of the Block A reservoir to conduct a simultaneous measurement experiment of steady-state oil–water relative permeability and resistivity. At the same time, combined with other related basic parameter measurements of rock samples [29,30], the experimental measurement data analysis results are used to clarify the correlation between oil–water relative permeability and fluid saturation, resistivity index, rock pore structure, shale content, etc., in complex reservoirs, thus laying a foundation for better predicting oil–water relative permeability using resistivity data.
The twenty-six core samples selected in the research area were sequentially subjected to four experiments, namely pore permeability, nuclear magnetic resonance, steady-state oil–water relative permeability and resistivity simultaneous measurements, and particle size analysis. To ensure consistency, all pore-structure-sensitive experimental measurements were conducted on identical core samples to eliminate potential deviations in experimental analysis and derived correlations that could arise from using different samples across various tests. The detailed experimental procedure is illustrated in Figure 1. All reported data represent averaged values from multiple measurements, ensuring both accuracy and repeatability. The basic parameters of each rock sample were obtained through the above experimental measurement process. For example, the porosity and permeability measurements were obtained using Core Laboratories’ CM-300 system to determine the porosity ϕ and permeability K of the core, both of which can be used to calculate the comprehensive pore permeability index (PERMI = K / ϕ ), used to reflect the pore structure of the rock. This parameter is routinely utilized to characterize reservoir properties and evaluate fluid transport capacity in porous media [31,32], serving as a fundamental basis for subsequent analysis of the impact of pore structure characteristics on experimental behavior. The nuclear magnetic resonance measurements were performed using a GeoSpec2 NMR core analyzer (Oxford Instruments, UK) to determine the irreducible water saturation of rock samples ( S w i ). The relative permeability experiments were conducted using an XYS-3 relative permeability–resistivity simultaneous measurement system. The particle size analysis was performed using a MASTERSIZER-2000 laser particle size analyzer to determine the shale content of each core sample ( V s h ). The basic parameter measurements of each rock sample in the study area are shown in Table 1.
The steady-state method was employed to measure relative permeability and resistivity values at varying water saturation levels for the 26 core samples from Block A, with both injected water and formation water resistivity being maintained at 1.116 Ω m. All core measurements were conducted under controlled laboratory conditions of 25 °C and pressure of 10 MPa. Taking the A-1 rock sample as an example, the simulated water type in the rock sample is Na2CO3 solution. The results of the oil–water relative permeability and resistivity simultaneous measurement experiment using steady-state method are shown in Table 2. The comprehensive experimental data above can lay a solid foundation for the subsequent study of oil–water relative permeability experimental laws and the establishment and verification of phase permeability and resistivity models.

3. Research on Experimental Rules

The experimental data were analyzed to investigate the effects of petrophysical characteristics—particularly pore structure and shale content—on the relationship between relative permeability and the resistivity index. During the analysis, core samples must be grouped following the principle that only one single variable within each group exhibits significant variation. When analyzing core samples within each group for the influence of pore structure on experimental patterns, similar values should be maintained for all variable parameters except for the porosity–permeability composite index, which should exhibit significant variation. Conversely, samples in each group must simultaneously demonstrate comparable porosity–permeability characteristics with minimal variation and a wide range of shale content values when evaluating the impact of shale content to effectively analyze its effect on relative permeability behavior.
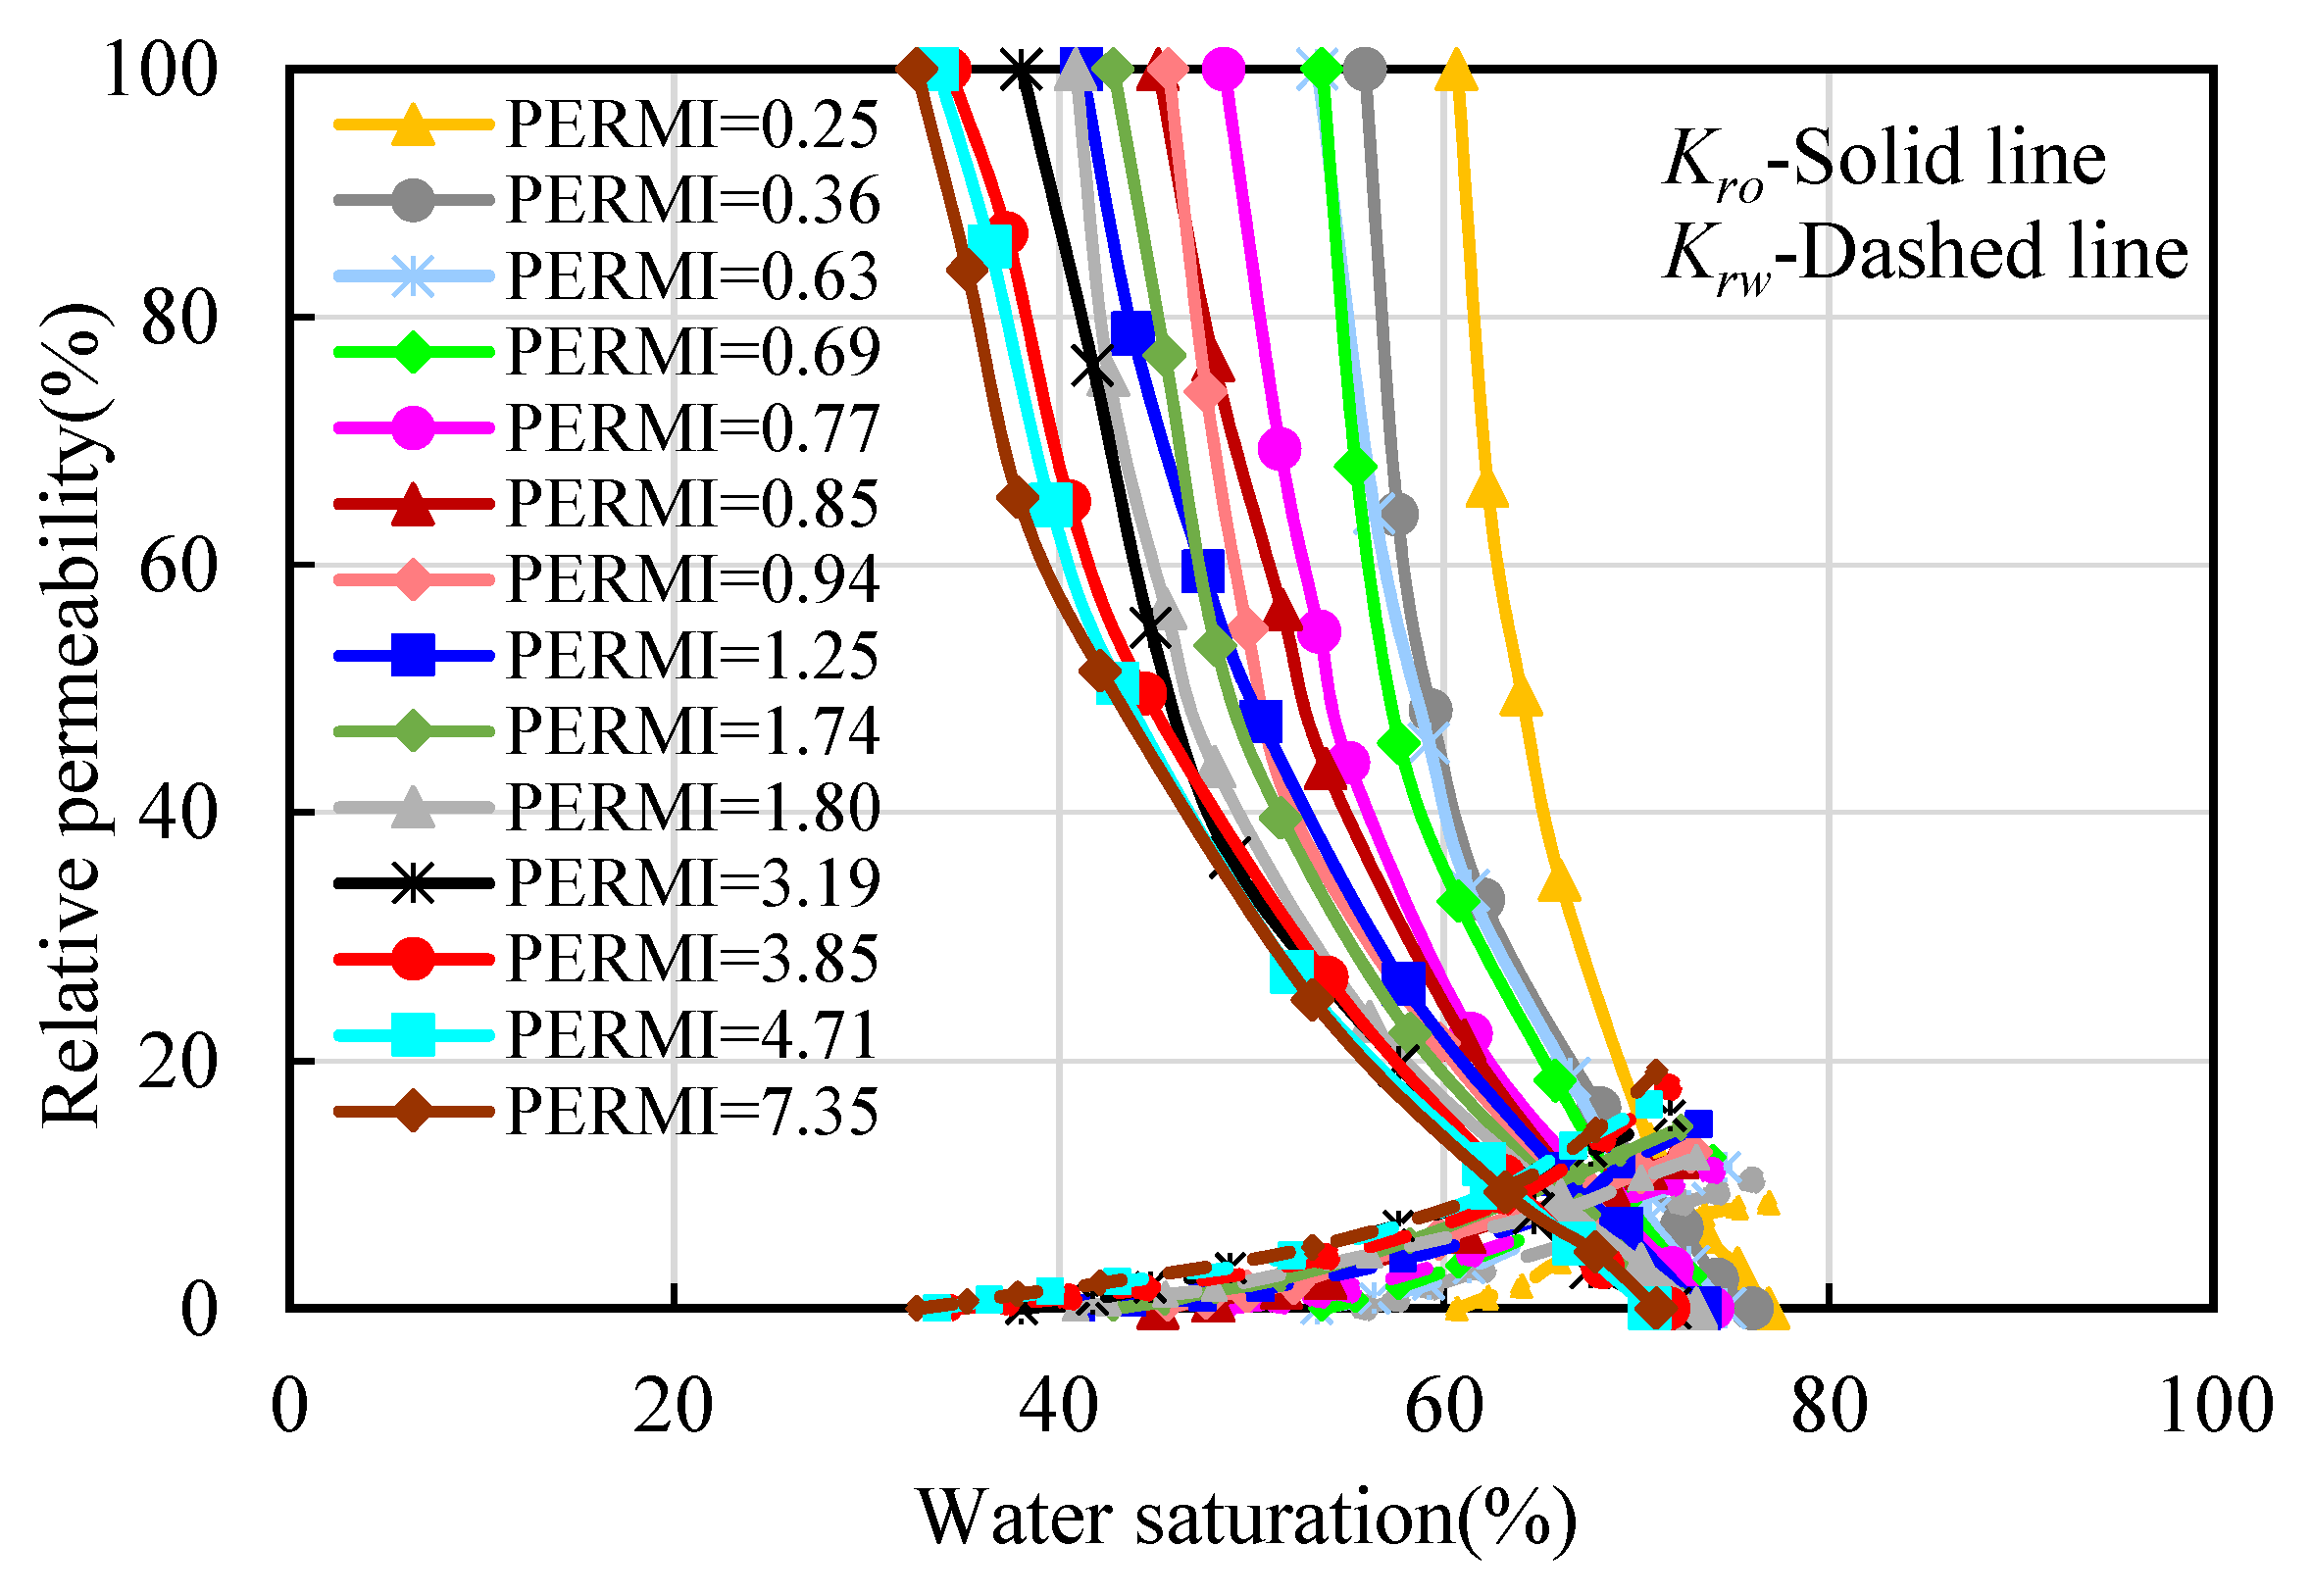
Firstly, based on the experimental measurement data of rock samples in the study area, 14 representative rock samples with significant differences in basic parameters were selected. The relationship between oil–water relative permeability and water saturation from different rock samples was established using phase permeability experimental data. Through comparative analysis, it can be seen that the differences in phase permeability curves between rock samples in the study area vary most significantly with the comprehensive index of pore permeability (PERMI = K / ϕ ), as shown in Figure 2. The oil-phase relative permeability of rock samples decreases with the increase in water saturation; for the same oil-phase relative permeability value, as the comprehensive index of pore permeability (PERMI) of rock samples increases, the corresponding water saturation shows a decreasing trend, with the phase permeability curve gradually showing a steep gradient. Conversely, the relative permeability value of the water phase increases with the increase in water saturation; for the same water-phase relative permeability value, as the comprehensive permeability index of the rock sample increases, the corresponding water saturation also shows a decreasing trend. From this, it can be seen that changes in the pore structure of rocks have a significant impact on the relationship between oil–water relative permeability and water saturation.
Secondly, a graph showing the relationship between oil–water relative permeability and simultaneous measurement resistivity was established for each core sample in the study area. Taking the A-1 rock sample as an example (as shown in Figure 3), it can be observed that as the water saturation Sw increases, the oil-phase relative permeability value Kro decreases, the water-phase relative permeability value Krw increases, and the simultaneous measurement rock resistivity value Rt decreases. Moreover, we observed an increase in the inverse value (1/I) of the resistivity increase coefficient, calculated using the simultaneous measurement resistivity and the resistivity of the water-saturated rock sample. From this, it can be inferred that the oil–water relative permeability parameter of rocks is closely related not only to the fluid saturation parameter but also to the resistivity index. In order to further clarify the influence of various factors on the relationship between relative permeability and resistivity, we propose to classify rock samples based on the basic parameter values measured in experiments and separately study the experimental rules of water- and oil-phase relative permeability.

3.1. Research on Empirical Laws of Water Relative Permeability

Based on experimental measurements from 26 natural core samples in Block A, this study analyzes the influences of key petrophysical characteristics, including pore structure types and shale content, on the relationship between relative permeability and the resistivity index.

3.1.1. Effects of Pore Structure

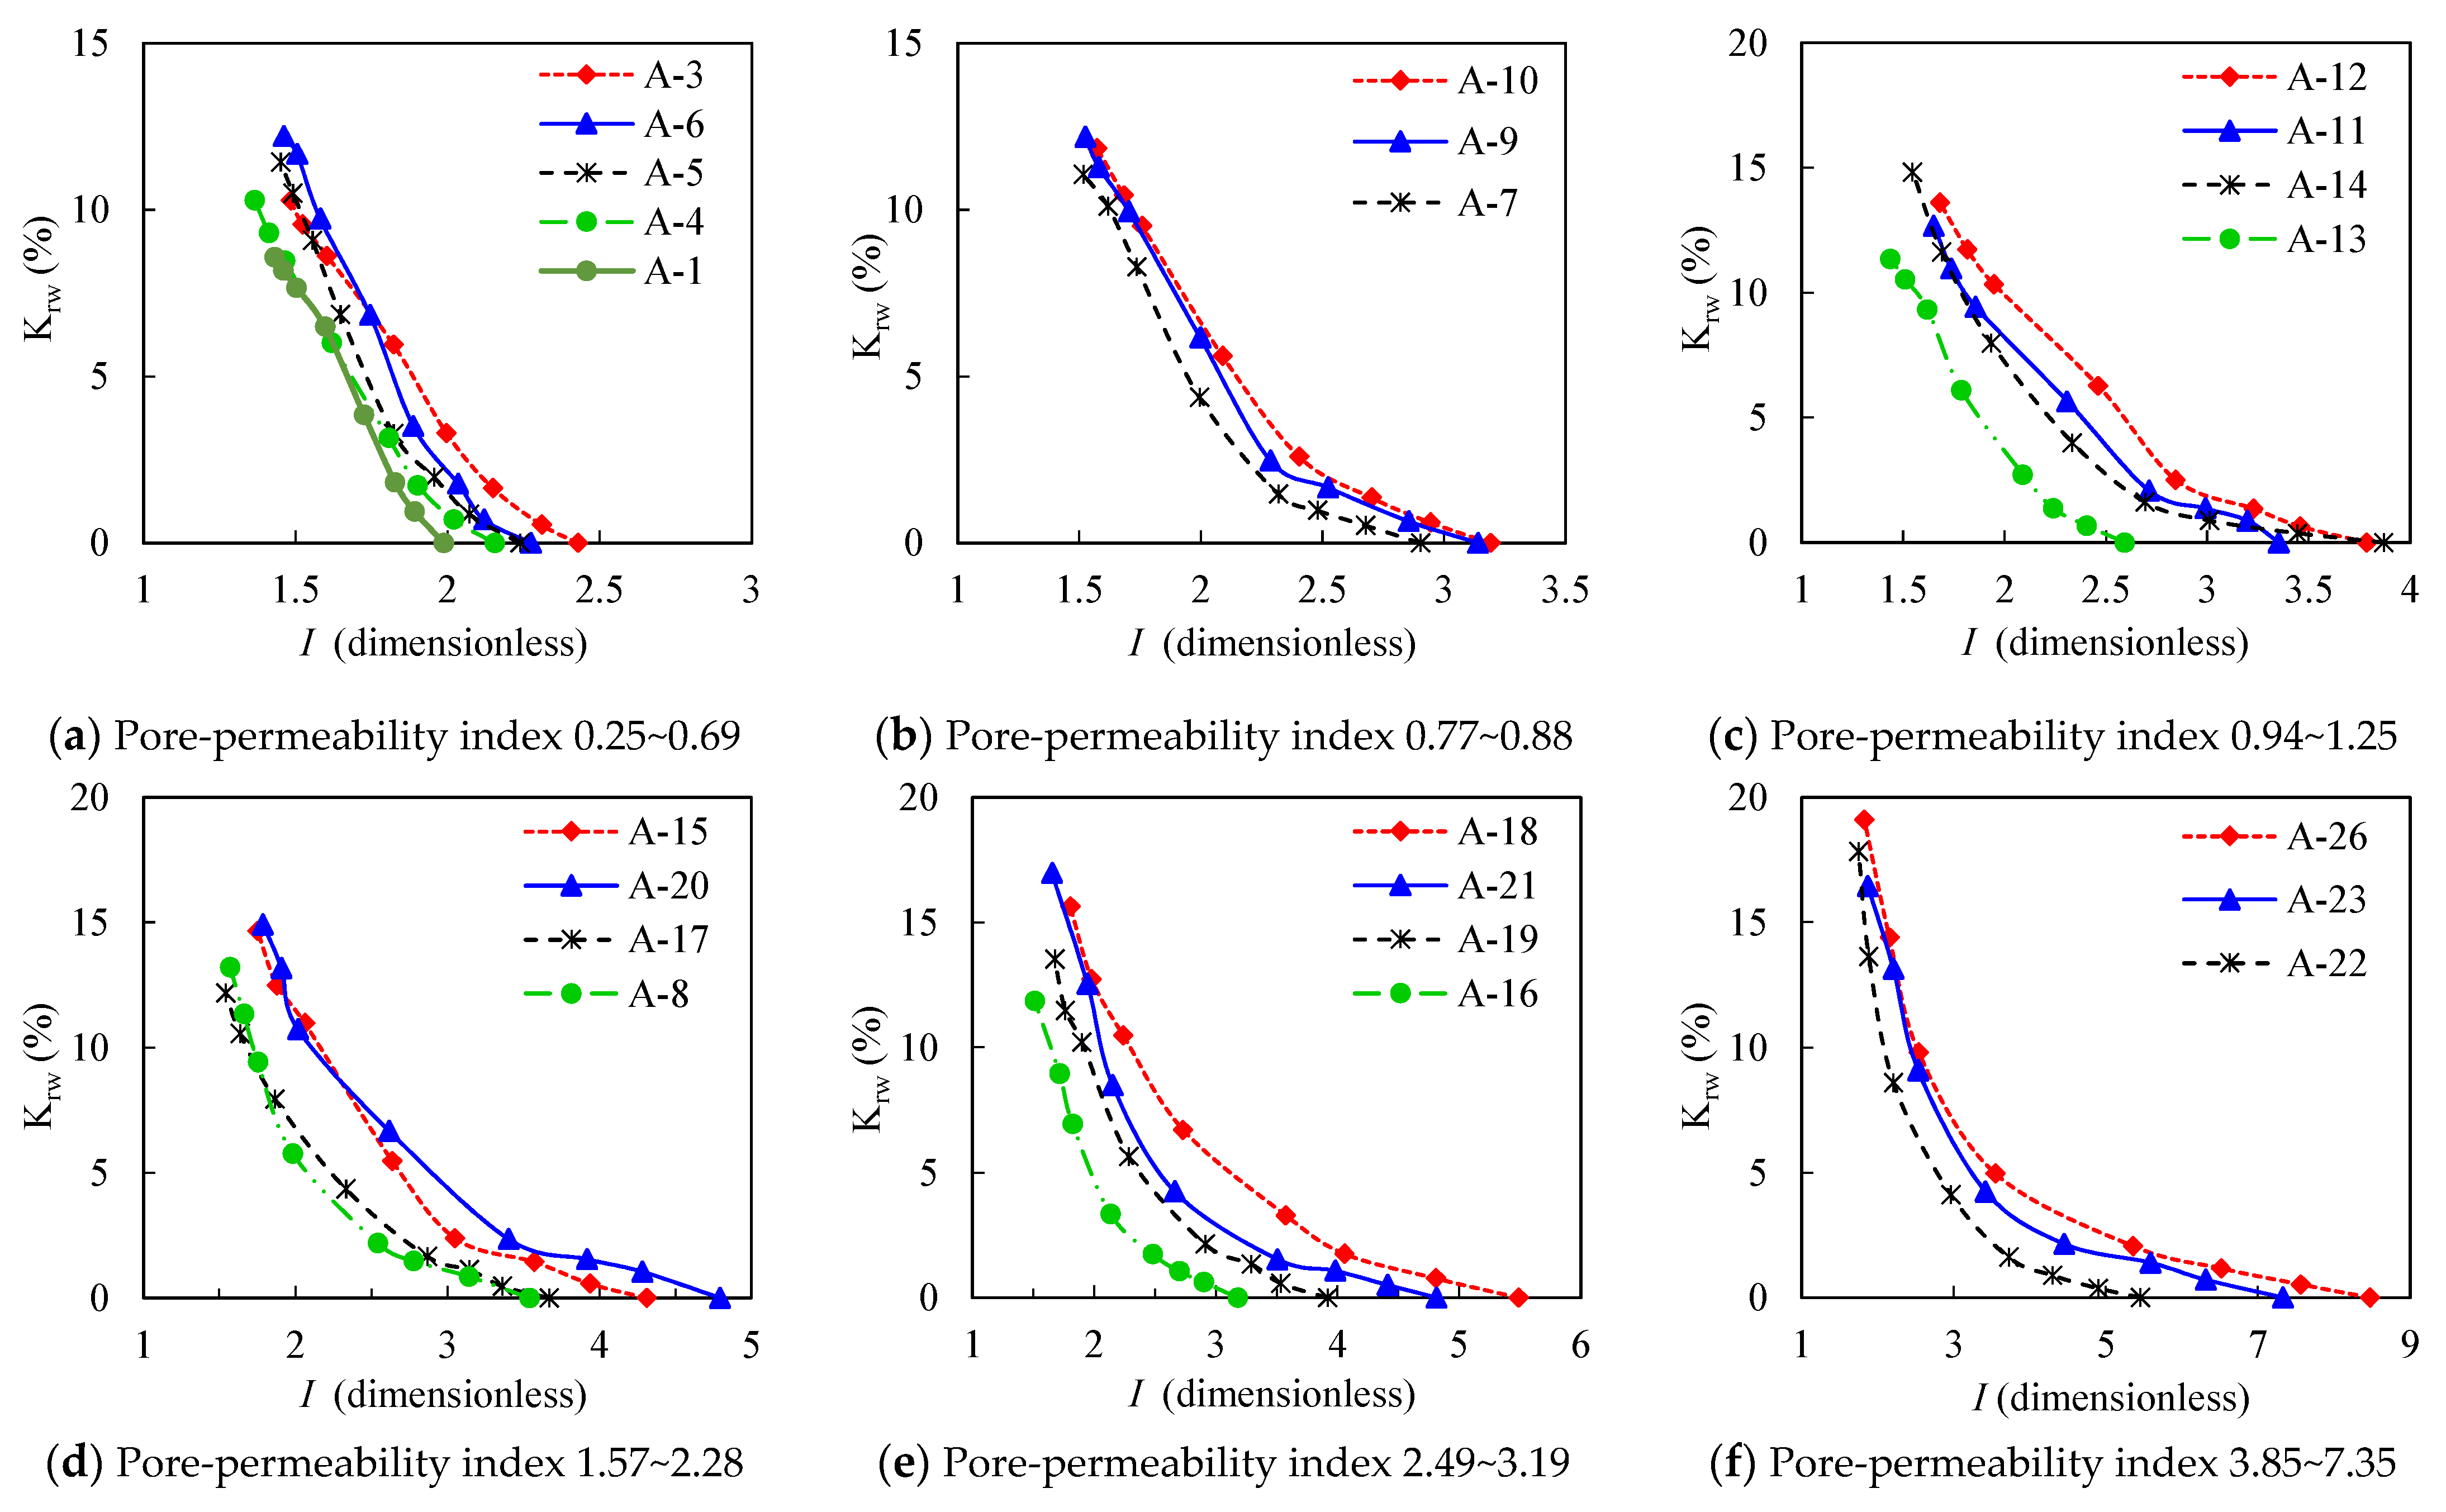
Based on the simultaneous measurement of oil–water relative permeability and resistivity and other relevant experimental data, the natural rock cores of Block A were classified according to the pore structure characteristics of the rock samples. Core samples with similar shale contents in the study area were used to analyze the influence of changes in the pore-permeability composite index ( K / ϕ ) on the relationship between the relative permeability of the water phase and the resistivity index. The first group selected six rock samples with similar low shale contents (parameters are shown in Table 1) and a distribution range of 4.44%~8.11%. However, the pore-permeability composite index increases sequentially and varies greatly, with values of 5.3, 8.8, 10.7, 31.9, 47.5, and 73.5, as shown in Figure 4a. The second group selected seven rock samples, with small differences in their moderate shale contents and a distribution range of 9.0% to 11.55%. However, the pore-permeability composite index increased sequentially to 2.54, 6.3, 7.68, 17.9, 24.86, 31, and 38.5, as shown in Figure 4b. The third group consists of three rock samples with high shale contents, with the shale content distribution ranging from 17.3% to 22.59%. However, the measured porosity–permeability composite indices of the core samples are 4.98, 17.98, and 22.84, respectively, demonstrating significant variation (as shown in Figure 4c). A cross-plot analysis of water relative permeability (Krw) versus the resistivity index (I) from the three core samples demonstrates an inverse correlation between Krw and I. These results are consistent with the physics of the considered porous media flow. Comparing each set of cross plots, it can be found that the resistivity index of different rock samples shows an increasing trend when the shale content is similar with the increase in the pore-permeability composite index of rock samples corresponding to the same relative permeability of the water phase.

3.1.2. Effect of Shale Content

Using the simultaneous measurement experiment to measure oil–water relative permeability resistivity and any supporting experimental data in the research area, the natural rock cores of Block A were classified based on the distribution of shale content within the rock samples. Six groups of rock samples with similar pore structures and pore-permeability composite index values were selected to analyze the influence of shale content changes on the relationship between water relative permeability and the resistivity increase coefficient. The first group selected five core samples with relatively small and approximately equal pore-permeability composite index values, with a distribution range of 0.25–0.69. However, the shale content increased sequentially and varied greatly, with values of 5.3%, 6.2%, 9.1%, 10.0%, and 10.004% (as shown in Figure 5a). The selection principles for the second to sixth groups of rock samples are similar, with each group consisting of multiple rock samples with similar pore-permeability composite index values but a large range of variation in shale content values. The specific range of numerical variation is shown in Figure 5b–f. By observing and analyzing the Krw-I cross plots of the six rock samples, it can be concluded that as the relative permeability of the water phase decreases as the resistivity index of the rock samples increases. By comparing each cross plot, it can be concluded that when the pore-permeability composite index is similar, that is when the pore structure characteristics of the rock are similar, the resistivity index of the rock samples shows a decreasing trend for the same water-phase relative permeability as the shale content of the rock samples increases.

3.2. Research on Empirical Laws of Oil Relative Permeability

3.2.1. Effects of Pore Structure

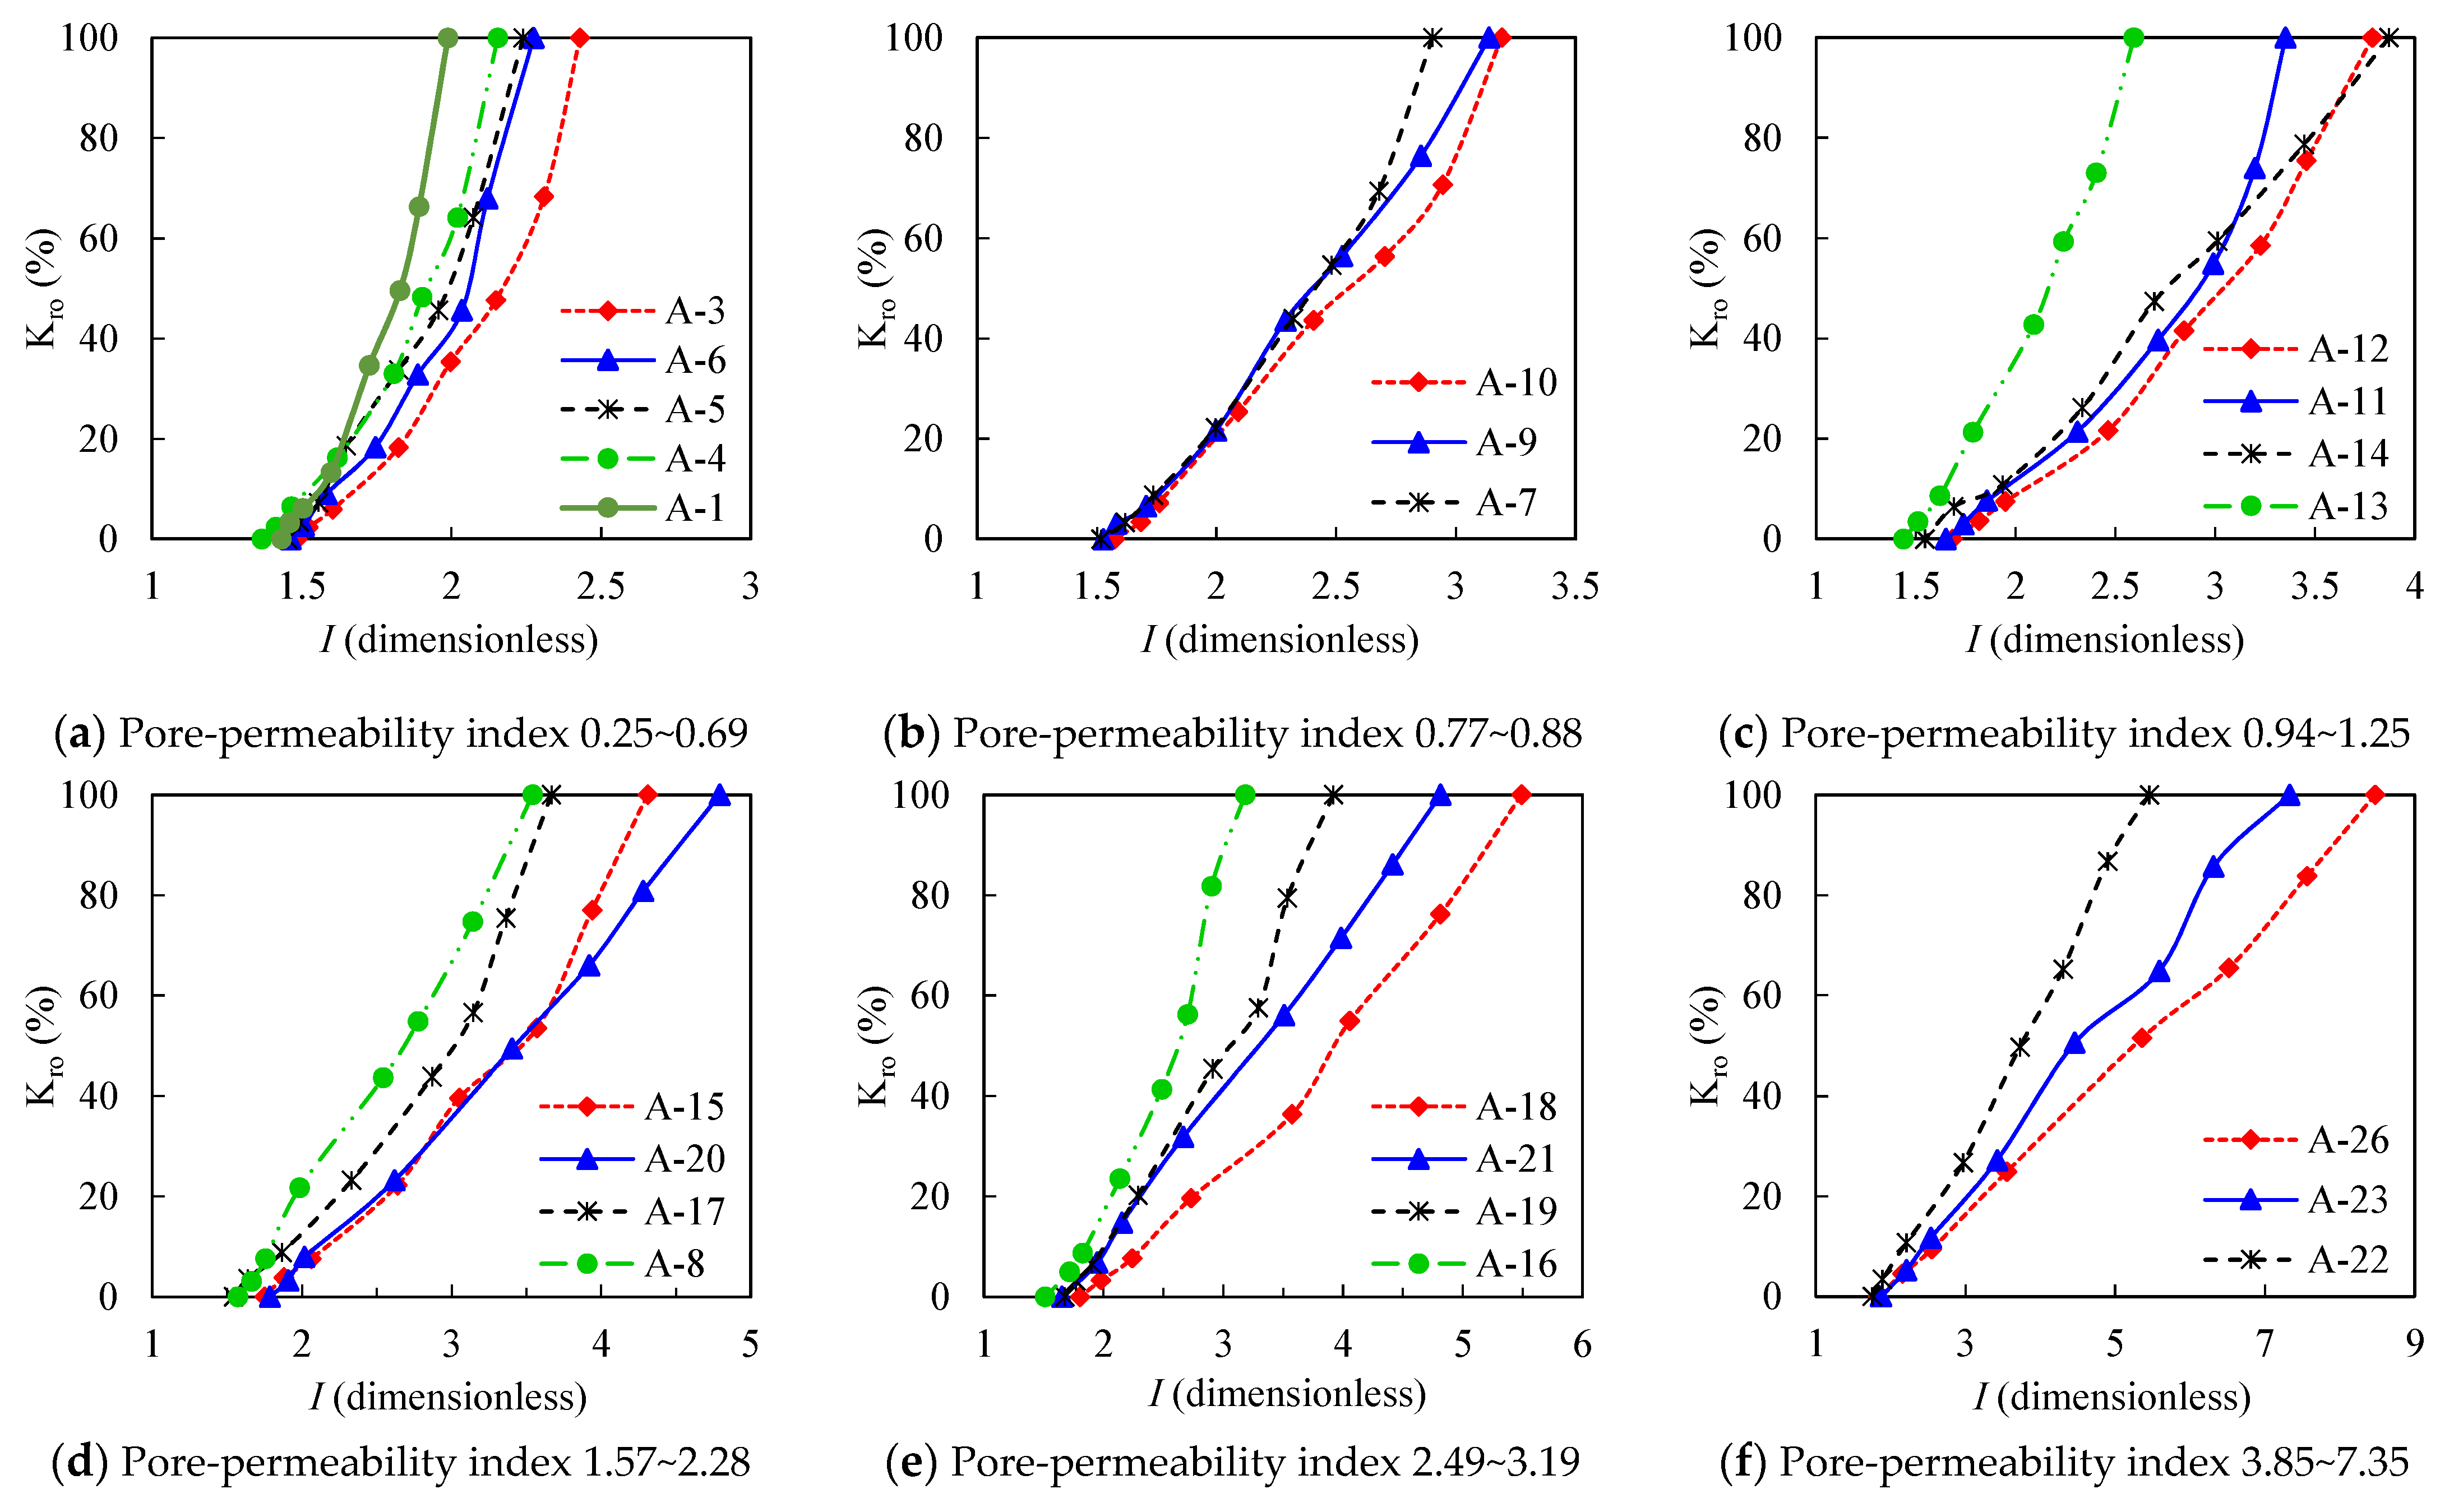
Using experimental data from Block A, three groups of core samples with similar and equal shale contents were selected to study the relationship between water-phase relative permeability and resistivity. The pore-permeability composite index in each group of core samples increased sequentially, and further analysis was conducted on the changes in pore structure, analyzing the influence of changes in the pore-permeability composite index on the relationship between oil-phase relative permeability and the resistivity index. According to the Kro-I cross plot of the oil-phase relative permeability of three rock samples (as shown in Figure 6), it can be observed that, for the same sample, as the resistivity index I value of the rock sample increases, the oil phase relative permeability Kro also increases. Comparing the relationships between different core samples reveals that when the shale content is approximately equal, the resistivity index I value of the rock sample shows an increasing trend as the pore-permeability composite index of the rock sample increases, corresponding to the relative permeability of the same oil phase.

3.2.2. Effect of Shale Content

Using the above experimental data and grouping principal, six sets of core samples with similar pore structures, i.e., similar pore-permeability composite index values, were selected for the analysis of the influence of shale content changes on the relationship between oil-phase relative permeability and the resistivity index. By analyzing the Kro-I intersection plots of six rock samples (Figure 7), it can be concluded that the resistivity index I of the rock samples and the relative permeability of the oil phase increase simultaneously. By comparing the Kro-I cross plots of different groups, it can be concluded that when the pore-permeability composite index, representing the pore structure characteristics of the rock, is similar, the resistivity index I value and the shale content of the rock sample show decreasing and increasing trends, respectively, corresponding to the relative permeability of the same oil phase.

4. Modeling

According to the above experimental analysis results, for argillaceous sandstone reservoirs with complex pore structures, it is necessary to fully consider the influence of rock pore structure characteristics and shale content changes on rock conductivity and oil–water relative permeability characteristic parameters. Additionally, it is necessary to address the limitations of previously proposed empirical regression equations in adequately capturing the impact of these features on seepage parameters. For instance, the Li model [16,17] established a relationship between wetting-phase relative permeability, water saturation, and the resistivity increase factor while also improving the calculation method for non-wetting-phase relative permeability by introducing the pore size distribution index (λ). Similarly, Ma Dong et al. [26,29] proposed a resistivity increase factor–relative permeability model that incorporates the effects of irreducible water saturation. Furthermore, Wang Yuzhu et al. [12] enhanced the relative permeability calculation through several refinements, the most significant of which was introducing residual oil saturation parameters to modify the normalized saturation. This study uses the resistivity curved capillary model to effectively characterize the pore structure characteristics of different rocks, combining the concept of three-water model to effectively solve the influence of argillaceous conductivity. Full use is also of the Poiseuille equation and Darcy’s law in the seepage theory to establish a general model of the relationship between oil–water relative permeability and resistivity that is suitable for argillaceous sandstone reservoir, and the rationality and correctness of the model is also analyzed and verified using the physical boundary conditions. The complete model derivation process flowchart is shown in Figure 8.

4.1. Relationship Model Between Water Relative Permeability and Resistivity

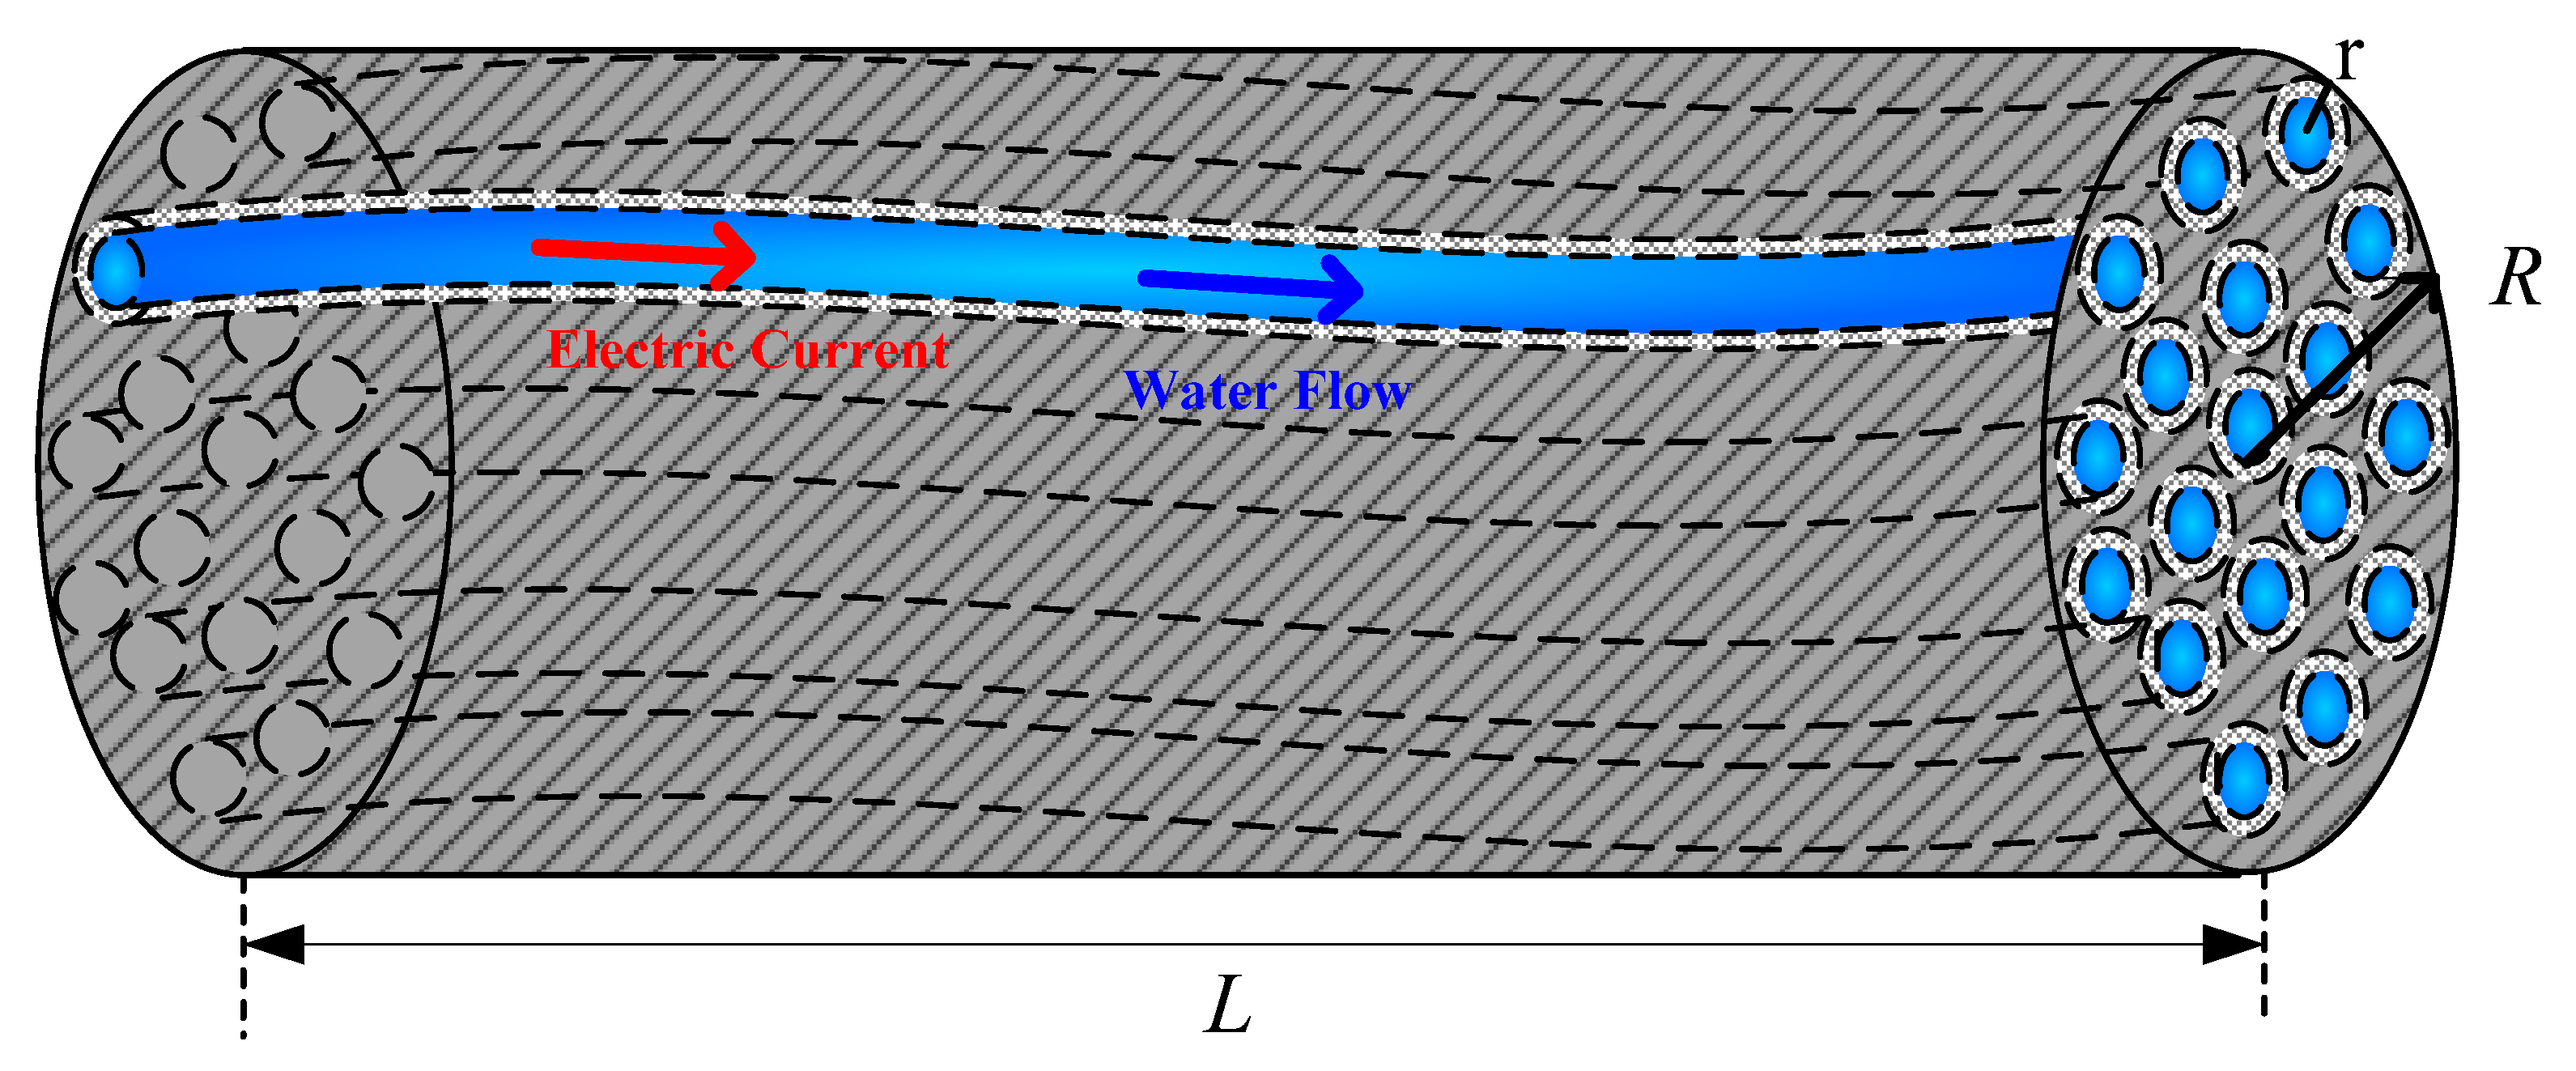
Firstly, if rock pores are saturated with mobile water, the conductivity of the rock depends on the conductivity of the water. The conductive path of the rock is similar to the flow path of the mobile water in the pores, meaning that the flow of water in the rock follows the conduction path of the current, as shown in Figure 9. For pure rocks saturated with water, the formula for the flow rate of movable water can be characterized by Darcy’s law as follows:
Q 1 = K Δ P π R 2 μ w L
where Q1, K, ΔP, R, μw, and L are the flow rate through rocks per unit time, cm3/s; the rock permeability, μm2; the pressure difference between the two ends of the rock, ×105 Pa; the radius of the rock sample, cm; the viscosity of water, ×10−3 (Pa·s); and the total length of the rock, cm, respectively.
In contrast, for a single curved capillary tube, the Poiseuille equation can be applied to characterize the flow rate of movable water. If the radius of a single capillary tube is assumed to be r, the expression for the water flow rate is calculated as follows:
Q 2 = π r 4 Δ P 8 μ w L × 10 8
where Q2 is the flow rate through a single capillary tube per unit time, cm3/s.
Applying the theory of three pore conductivity [33,34], the conductive properties of water in saturated argillaceous sandstone pores are considered to result from parallel conduction with three components: free fluid water (movable water), micro-pore water, and clay-bound water. This approach retains the concept of clay water from the dual-water model while distinguishing the conductive paths between micro-pore water and movable water. Comprehensively considering the differences in conductive characteristics among these three types of water provides a more accurate description of the conductive behavior in complex argillaceous sandstone formations. Assuming that the movable water pores in rocks are composed of n capillary tubes with radius r and length l (as shown in Figure 9), the complex pore structure characteristics of different rocks can be characterized by introducing the tortuosity τ of the movable water pore capillary tubes, allowing l = L τ to be obtained. At this point, the movable water volume Vw in the rock can be defined by the volume of n curved capillaries and the water saturation of the rock as follows:
V w = n π r 2 l = π R 2 ϕ t 1 S w i S w b L
where ϕ t , Swi, and Swb are the total porosity of argillaceous sandstone; the micro-pore water saturation of argillaceous sandstone; and the clay water saturation of argillaceous sandstone, all measured in decimals.
Combining Darcy’s law and the Poiseuille equation, which can be used to characterize the flow rate of mobile water, we can express that of mobile water pores in cemented rocks as follows:
Q w = n r 2 8 Δ P π r 2 μ w l × 10 8 = K Δ P π R 2 μ w L
Substituting the relationship between the rock and the radius and length of the curved capillary tube given in Equation (3) into Equation (4) allows it to be simplified to obtain the expression for the permeability of cement-based rocks:
K = ϕ t 2 1 S w i S w b 2 R 2 8 n τ 3 × 10 8
In contrast to water-saturated rocks, a portion of the movable water in oil-containing argillaceous rocks will be replaced by oil. Assuming that the movable water pores in oil-containing argillaceous rocks are composed of nw capillaries with a radius of r, the length of the capillaries is lw, and the tortuosity of the capillaries is τ w , then l w = τ w L w . At this point, the movable water volume Vw’ in the rock can be defined by the volume of curved capillaries and the water saturation of the rock as follows:
V w = n w π r 2 l w = π R 2 ϕ t S w t S w i S w b L
where Swt is the total water saturation of oil-bearing argillaceous rocks.
Similarly, according to the Poiseuille equation and Darcy’s law, the flow rate Qw′ of movable water pores in oil-bearing argillaceous rocks can be expressed as follows:
Q w = n w r 2 8 Δ P π r 2 μ w l w × 10 8 = K w Δ P π R 2 μ w L
where Kw is the effective permeability of the water phase in oil-bearing argillaceous rocks, μm2.
By combining Equations (6) and (7), the expression for the water-phase effective permeability Kw in oil-bearing argillaceous rocks can be obtained as follows:
K w = ϕ t 2 S w t S w i S w b 2 R 2 8 n w τ w 3 × 10 8
According to the definition of relative permeability, Krw = Kw/K, the relationship between the water-phase relative permeability in oil-bearing argillaceous rocks and the number, tortuosity, and saturation of movable water pore curved capillaries can be obtained by linking Equations (5) and (8):
K r w = K w K = n n w τ τ w 3 S w f 2 , S w f = S w t S w i S w b 1 S w i S w b
In order to further establish the relationship between water-phase relative permeability and electrical resistivity, based on the three-pore conductivity theory combined with the parallel conductivity theory, the formula for calculating the electrical resistivity, Ro, of water-saturated rocks can be obtained as follows:
1 R o L A = 1 R w L w A w + 1 r m a
where Ro, A, Rw, Lw, Aw, and rma are the electrical resistivity of water-saturated rocks that only conduct electricity through movable water, Ω·m; the cross-sectional area of the rock, cm2; the movable water resistivity in rocks, Ω·m; the equivalent length of movable water conductivity in rocks saturated with water, cm; the movable cross-sectional area of water-saturated rocks, cm2; and the resistance of the skeleton in the rock, Ω.
Analyzing the above equation leads us to conclude that rma can be considered to approach infinity due to the lack of conductivity of rock skeleton particles. According to the rock volume physics model mentioned above, the cross-sectional area of the rock can be obtained as A = πR2. Therefore, simplifying Equation (10) above yields the following:
R o = π R 2 A w L w L R w
In contrast with cement-based rocks, it can be seen that the length L and the cross-sectional area A of oil-containing argillaceous rocks does not change, but some of the water in the rock pores is replaced by oil. Therefore, the formula for calculating its resistivity Rt can be expressed as follows:
1 R t L A = 1 R w L w A w + 1 r o + 1 r m a
where Rt, Lw′, Aw′, and ro are the electrical resistivity of oil-bearing argillaceous rocks, Ω·m; the equivalent length of movable water conductivity for oil-bearing argillaceous rocks, cm; the movable water cross-sectional area of oil-bearing argillaceous rocks, cm2; and the resistance of the oil phase in rocks, Ω.
Since the rock skeleton particles and oil-phase medium in the above equation do not display conductivity, that is, rma and ro both tend to infinity, the above equation can be simplified as follows:
R t = π R 2 A w L w L R w
For the above conductivity equations, we define the equivalent tortuosity for the conductivity of movable water-saturated cementitious rocks as τ e = L w / L . The equivalent tortuosity of movable water conductivity in oil-bearing argillaceous rocks is τ e = L w / L . Simultaneously, based on the theory of three pore conductivity, the concepts of total porosity ϕ t , total water saturation of oil-bearing argillaceous S w t , micro-pore water saturation S w i , and clay water saturation S w b are introduced and simplified into Equations (11) and (13):
τ e 2 = R o R w ϕ t 1 S w i S w b
and
τ e = R t R w ϕ t S w t S w i S w b
Based on the similarity between the flow of movable water and electric current in rocks, the equivalent tortuosity τ e and τ e of movable water conductivity that can reflect argillaceous rocks in Equations (14) and (15) can be replaced by the movable water flow capillary curvature τ and τ w , as derived from the seepage formula for argillaceous rocks in the previous text. The concept of the resistivity increase coefficient is thus introduced; simultaneously, the above relationship is incorporated into Equation (9) in the previous text, used to calculate water-phase relative permeability of oil-containing argillaceous rocks. It can therefore be concluded that
K r w = n n w I 1.5 S w f 0.5
where Swf is the movable fluid saturation of argillaceous sandstone, decimal.
In order to further improve the universality of the phase permeability model in the actual well treatment and interpretation process, the formula for calculating the relationship between water phase relative permeability and resistivity in Equation (16) was improved by adding parameter variables. The improved model for the relationship between water-phase relative permeability and rock-resistivity increase coefficient values was established as follows:
K r w = a I k 1 S w f k 2 , S w f = S w t S w i S w b 1 S w i S w b
We verified the validity of the proposed water-phase relative permeability model by examining its boundary conditions under theoretical extremes, specifically ensuring physical consistency in both fully water-saturated and fully oil-saturated formations.
(1) When the local layer is completely water-bearing, Swt = 1.0, I = Rt/Ro = 1.0. By substituting this into Equation (17), we have Swf = 1.0 and the constant a = 1, Krw = 1, verifying the established model.
(2) When the local layer is saturated with oil, i.e., there is no mobile water, then Swt = Swi + Swb, I→∞. By substituting this into Equation (17), Swf = 0 and Krw = 0 can be obtained, verifying the established model formula.
The final model incorporates three parameter variables (a, k1, and k2). As derived from the preceding section, these represent the formula coefficients and exponents governing the Krw-I relationship, thus significantly enhancing the model’s practical applicability across diverse oilfield conditions. The introduced parameter Swf was derived from the three-water conductivity theory and characterizes the saturation distribution of three conductive water types in pore systems, providing superior characterization of conductive properties in complex argillaceous sandstone reservoirs.

4.2. Relationship Model Between Oil Relative Permeability and Resistivity

The oil-phase relative permeability model first considers that some movable water in the pores of oil-bearing argillaceous is replaced by oil. Assuming that the movable oil in rock pores is composed of nnw capillaries with a root radius of rnw, the length of the capillaries is lnw, and the tortuosity of the capillaries is τ w , then l n w = τ n w L , and the volume of movable oil Vo′ can be expressed using the definition formula of the volume of bent capillaries and the water saturation of the rock as follows:
V o = n n w π r n w 2 l n w = π R 2 ϕ t 1 S w t L
Similarly, according to the Poiseuille equation and Darcy’s law, the flow rate Qo′ of the movable oil pore composed of nnw root capillaries is calculated as follows:
Q o = n n w r n w 2 8 Δ P π r n w 2 μ n w l n w × 10 8 = K o Δ P π R 2 μ n w L
where Qo′, μnw, and Ko are the movable oil flow rate of oil-bearing argillaceous rocks, cm3/s; the viscosity of oil, ×10−3 (Pa·s); and the effective permeability of the oil phase in oil bearing argillaceous rocks, μm2.
The expression for oil-phase effective permeability in oil-bearing argillaceous rocks can be obtained by combining Equations (18) and (19) as follows:
K o = ϕ t 2 1 S w t 2 R 2 8 n n w τ n w 3 × 10 8
The relationship between oil-phase relative permeability in oil-bearing argillaceous rocks and the number, tortuosity, and saturation of pore bending capillaries can be obtained by using the definition formula Kro = Ko/K for relative permeability and combining Equations (5) and (20) as follows:
K r o = n n n w τ τ n w 3 1 S w f 2
To further establish the relationship between oil-phase relative permeability and conductivity parameters, based on previous research results, the correlation between permeability parameters and parameters such as pore curvature and capillary tortuosity is established by introducing the specific surface area definition as follows [30]:
8 K τ 2 ϕ t 1 S w i t S w b × 10 4 = 8 K w τ w 2 ϕ t S w t S w i t S w b × 10 4 + 8 K o τ n w 2 ϕ t 1 S w t × 10 4
By simplifying the aforementioned equation and applying the substitutions Krw = Kw/K and Kro = Ko/K, the following expression is derived:
1 = K r w S w f τ w τ + K r o 1 S w f τ n w τ
Based on the derivation process of water-phase relative permeability in the previous text and the similarity between the flow of movable water and the flow of electric current in rocks, the parameter relationships in Equations (14)–(16) are substituted into Equation (23). Combining this with the oil-phase relative permeability in Equation (21) from the previous text, used for oily argillaceous rocks, it can be concluded that
K r o = n n w n 2 1 n n w S w f 1 4 I 1 4 6 1 1 S w f
Similarly, in order to improve the applicability of the oil-phase relative permeability model in practical processing, the parameter variables in the oil-phase relative permeability calculation formula are defined and improved. A general relationship between the oil-phase relative permeability and rock resistivity increase coefficient value is established as follows:
K ro = b 1 S wf k 3 1 S wf I k 4 + 1 - b 1 S wf k 5 1 S wf I k 6
The validity of the oil-phase relative permeability model was verified by examining its boundary conditions at theoretical limits, specifically ensuring physical consistency for both the completely water-saturated and oil-saturated formation scenarios.
(1) When the local layer is completely water-containing, with Swt = 1.0, then Swf = 1, I = 1. Substituting into Equation (25) obtains Kro = 0, verifying the established model formula.
(2) When the local layer is saturated with oil and absent of mobile water, then Swt = Swi + Swb, I→∞. Substituting Equation (25) obtains b = 1.0 and Kro = 1, verifying the established model formula.
The parameters (b, k3, k4, k5, and k6) incorporated in the final model were derived through formula simplification in the preceding derivation process, representing coefficients and exponents that effectively characterize the Krw-I relationship. These parameters not only ensure the theoretical correctness of the model but also significantly enhance its practical performance in field applications. Furthermore, the introduction of Swf from the three-water conductivity theory enables more accurate characterization of the conductive properties of argillaceous sandstone reservoirs.

4.3. Analysis and Evaluation Examples

Based on experimental data from the study area, the measured relative permeability values were first normalized to the [0, 1] range to satisfy the theoretical boundary condition requirements established during the model’s formula derivation process. The optimal solutions for the model’s universal parameters were determined through multivariate regression analysis. By establishing correlations between these parameters and reservoir characteristic data (including porosity, permeability, and shale content), an optimized methodology was developed to determine relative permeability model parameters in practical applications. Finally, the accuracy comparison analysis between the oil–water relative permeability value calculated by the model and the measured value of the core experiment is carried out to further evaluate the correctness and practicality of the model established in this study.
Firstly, based on Equation (17) of the water-phase relative permeability and resistivity relationship model, 26 core samples from Block A were selected, with their oil–water relative permeability and resistivity simultaneous measurement experimental data then being used to calculate the resistivity increase coefficient I, movable fluid saturation Swf, and other parameters of each rock sample. These parameters were then incorporated into the model and optimized through the simultaneous measurement experimental data of phase permeability and resistivity of each rock sample under constraint conditions to calculate the parameter variables a, k1, and k2 of this block. To enhance the practical application effect of the model, the correlation between model parameters and easily obtainable reservoir parameters, such as shale content, porosity, permeability, and the pore-permeability composite index, must be established to determine model parameters using conventional data and further calculate relative permeability. The undetermined coefficients (a, k1, and k2) in the water-phase relative permeability and resistivity relationship model were calculated for the 26 rock samples. Multiple regression methods were then used to establish the relationship between the three coefficients and various reservoir parameters. The optimal correlation between the water-phase relative permeability model parameters and porosity ϕ in Block A was obtained, as shown in Figure 10. Finally, the calculation equations for each parameter were determined to be a = 0.008 ϕ + 1.18 , k 1 = 0.15 ϕ 1.36 , and k 2 = 0.067 ϕ + 2.05 .
Similarly, for Equation (25), using the experimental measurement data of Block A, the simultaneous oil-phase relative permeability and resistivity measurement experimental data of each rock sample under the constraint conditions were optimized to obtain the undetermined coefficients (b, k3, k4, k5, and k6) in the oil-phase relative permeability model that are applicable to this block. Multiple regression methods were used to establish the relationship between each coefficient and the reservoir parameters. The optimal oil-phase relative permeability model for Block A was obtained. Parameter b was relatively stable and distributed around a constant value of 0.54, while the other parameters had the best correlation with porosity ϕ , as shown in Figure 11. The parameters in the model were therefore established. The calculation equations for the values are b = 0.54 , k 3 = 0.33 ϕ + 10.84 , k 4 = 0.623 ϕ 9.79 , k 5 = 0.083 ϕ + 2.47 , k 6 = 0.09 ϕ 1.356 .
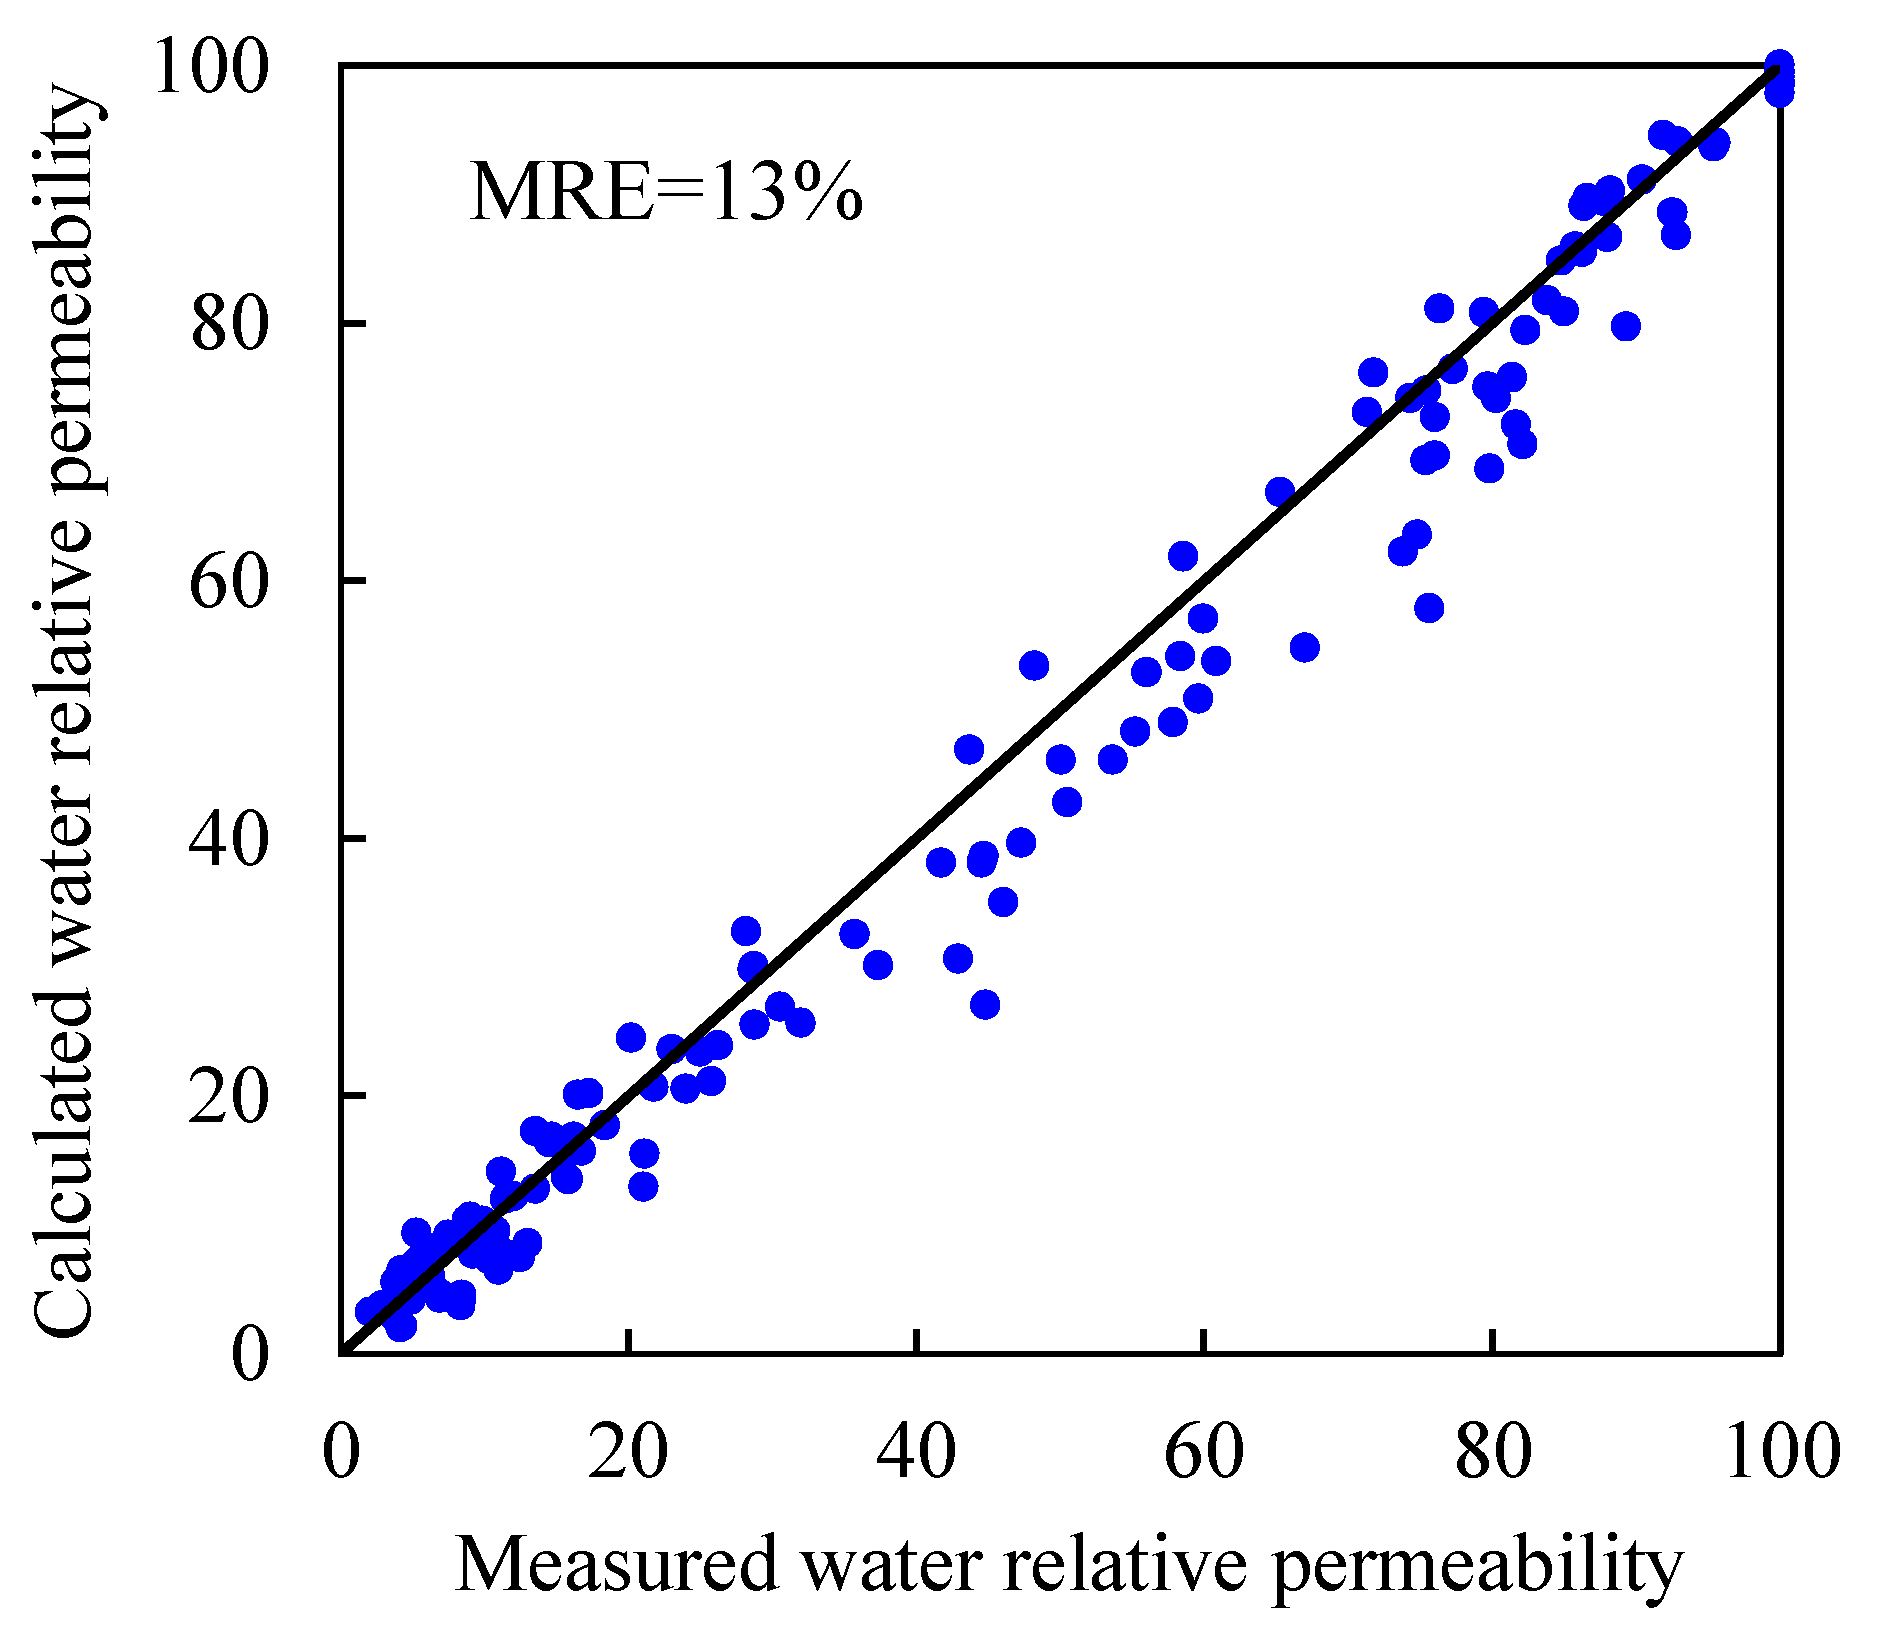
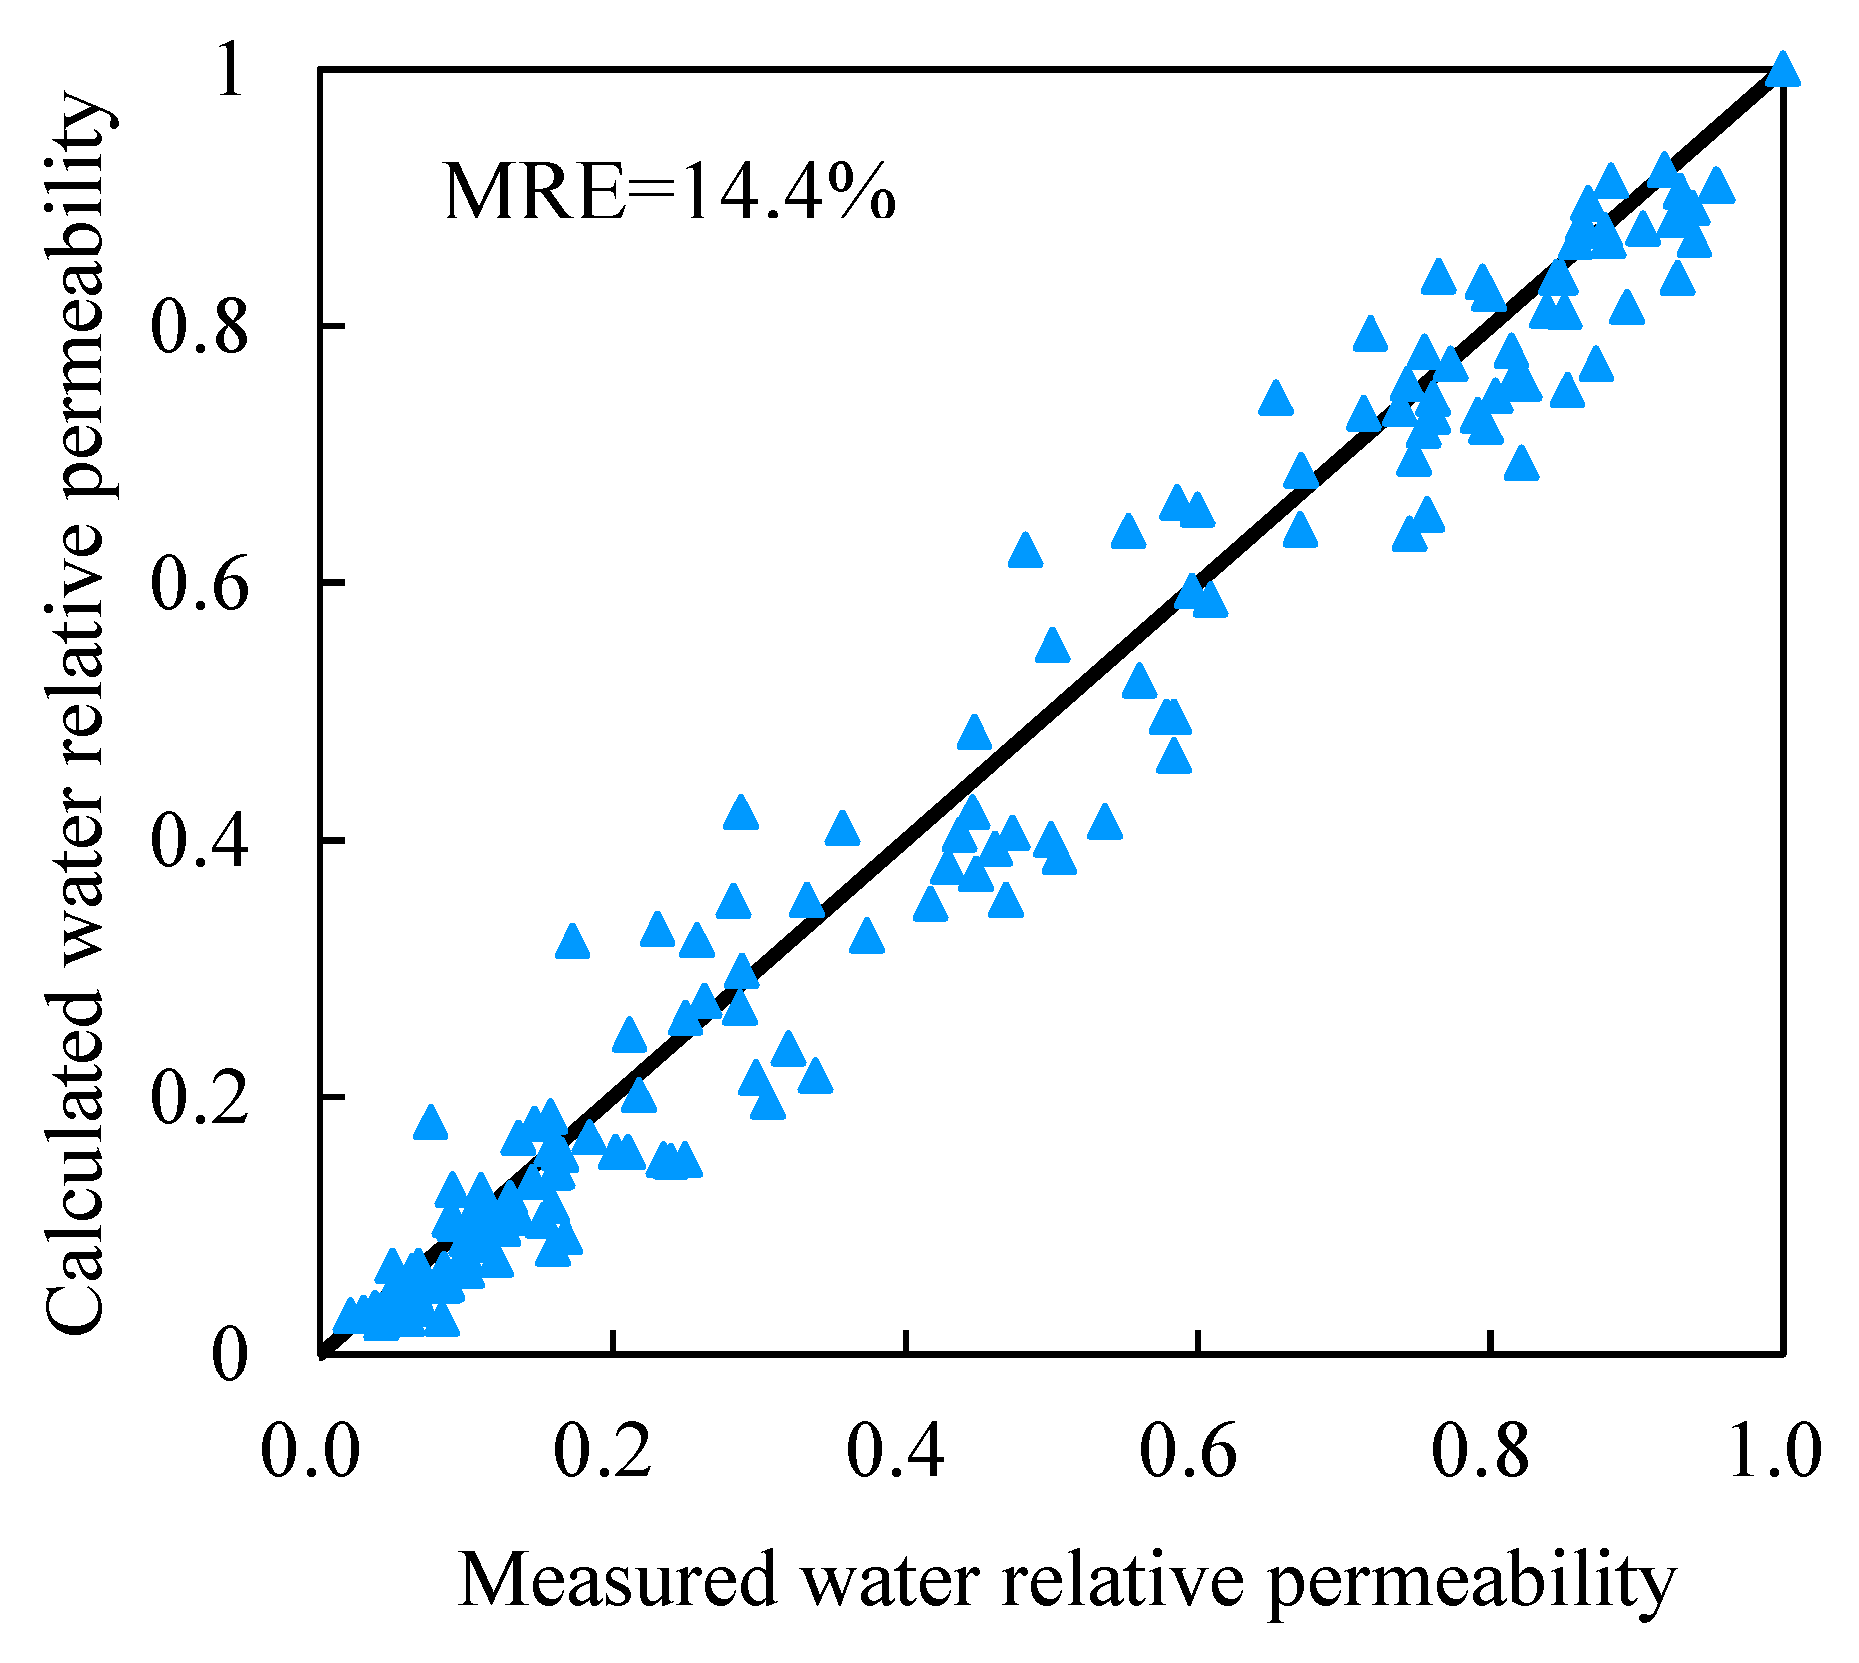
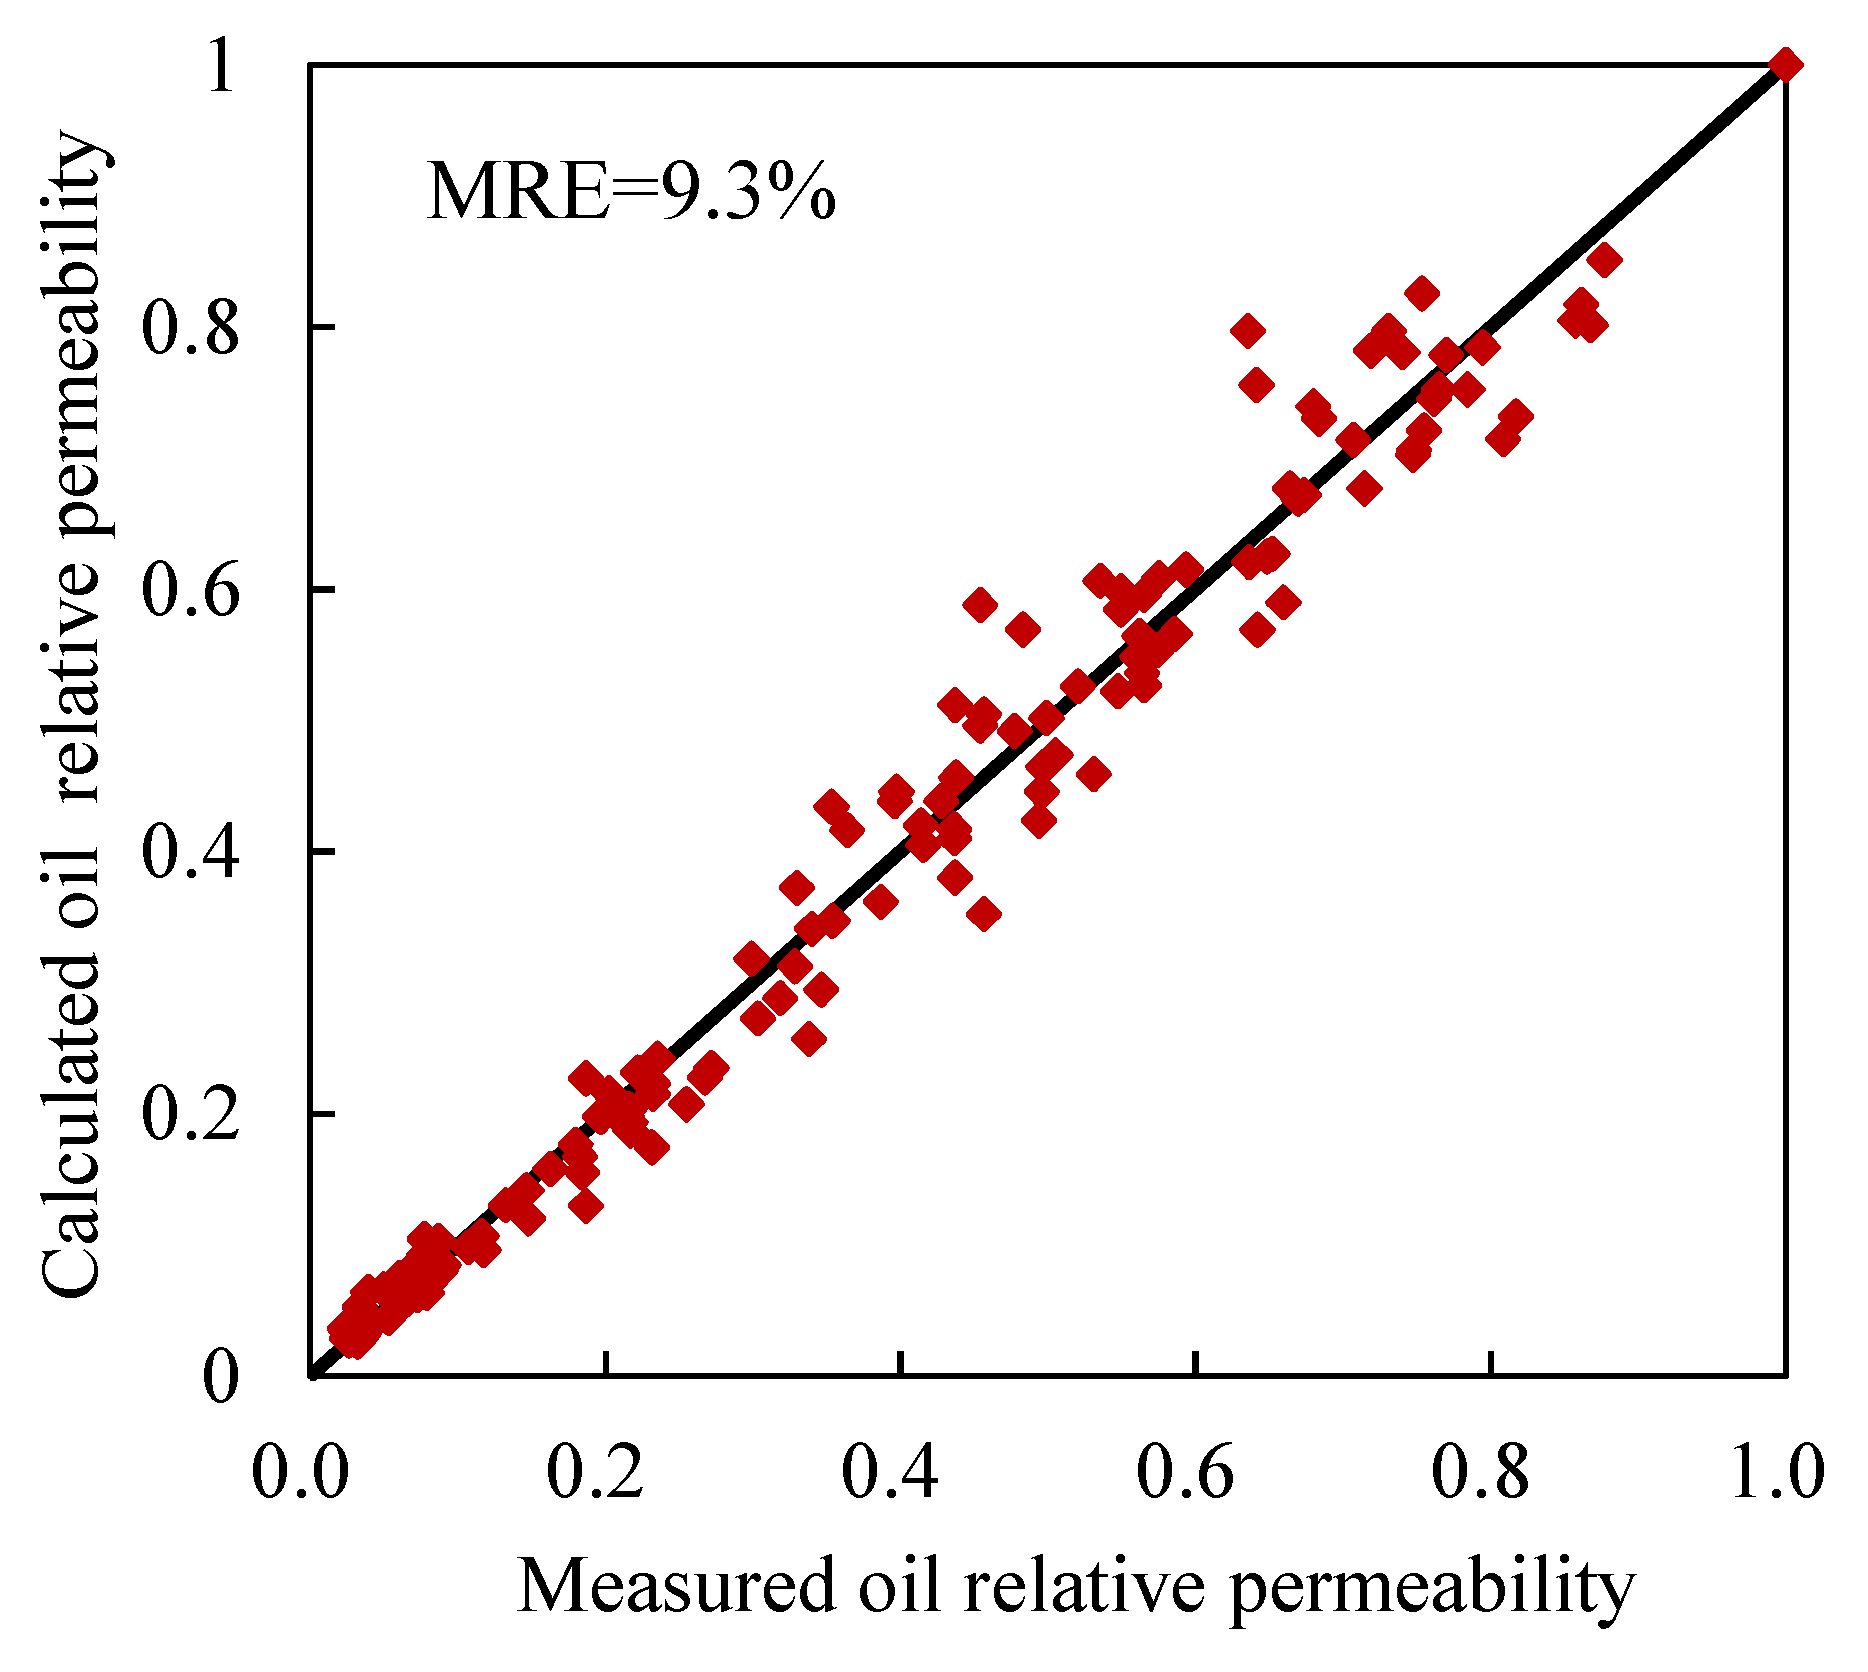
The derived parametric equations were integrated into the relative permeability model to fulfill the practical requirements of determining model variables using more readily calculable reservoir parameters (e.g., porosity) from the study area. Comparative analysis between the model-calculated values and experimental measurements (Figure 12 and Figure 13) revealed relatively small relative errors of 13% and 8.1% for water- and oil-phase relative permeability, respectively. Comparative analysis with existing models reveals that while the Li model demonstrates significantly higher accuracy than other conventional models, it still produces average relative errors of 14.4% and 9.3% for oil- and water-phase relative permeability calculations, respectively, under the complex argillaceous sandstone reservoir conditions in our study area (as shown in Figure 14 and Figure 15). Notably, these error margins remain substantially higher than those achieved by our improved model.
The empirical formula proposed by previous researchers only considered the water saturation parameter for calculating relative permeability, whereas the oil–water relative permeability and resistivity relationship model proposed in this study considers reservoir characteristics such as rock pore structure and shale content changes, greatly improving the calculation accuracy. This further verifies that the established relative permeability model can better describe the flow law of oil–water two-phase fluid rocks, effectively improving the calculation accuracy of oil–water relative permeability in the study area. It has also established new solutions and methods with which studies can calculate relative permeability data using parameters such as geological electrical properties in the future.
The model developed in this study is specifically designed for reservoirs with complex argillaceous sandstone characteristics. However, various reservoirs with different geological features and conditions are commonly encountered in actual oilfield development practices, including carbonate reservoirs, low-resistivity oil reservoirs, unconventional oil and gas reservoirs with low porosity and ultra-low permeability characteristics, and water-flooded zones encountered during middle-to-late stages of oilfield production. The derivation process above demonstrates that the parameter variables in our proposed model effectively addresses key influencing factors, including complex pore structures and argillaceous conductivity. However, for reservoirs with mineral conductivity or other lithologies such as carbonate formations, the inherent differences between their flow and conductive conditions may impact the universal applicability of our established model. Therefore, future research should incorporate additional influencing factors—such as conductive minerals and formation water salinity—to further investigate their impacts on the relative permeability–resistivity relationship, thereby improving the model’s generalizability.

5. Conclusions

A set of experimental procedures were designed and developed to measure oil–water relative permeability, resistivity, and related basic parameters of complex argillaceous sandstone rock samples. The methodology ensures all pore-structure-sensitive tests are performed on identical core specimens, thereby laying a foundation for the subsequent study of experimental rules and the establishment and verification of oil–water relative permeability–resistivity models.
The analysis and study of experimental measurement data indicate that the water-phase relative permeability is negatively correlated with the resistivity index. With the increase in the porosity–permeability comprehensive index and the decrease in shale content, the resistivity index of rock sample shows an increasing trend, corresponding to the same water relative permeability. The oil-phase relative permeability exhibits a positive correlation with the resistivity index. With the increase in the porosity–permeability comprehensive index and the decrease in shale content, the resistivity index shows an increasing trend, corresponding with the relative permeability of the same oil phase.
Combined with the measured data of the relative permeability experiment, introducing the concepts of the curved capillary and three-water models has allowed us to model the relationship between oil–water relative permeability and resistivity suitable for complex argillaceous sandstone reservoirs. This study has significantly improved the calculation accuracy of relative permeability for such reservoirs in field applications, yet certain limitations remain. For reservoirs with mineral conductivity or other lithologies such as carbonate formations, inherent differences between their flow and conductive conditions may affect the model’s universal applicability. Future research should therefore incorporate additional influencing factors—such as conductive minerals and formation water salinity—to further investigate their impacts on the relative permeability–resistivity relationship.

Author Contributions

Methodology, Z.G. and Q.F.; experiments and measurements, Y.Z.; software, Z.L.; validation, Z.G., Q.F. and S.G.; data analysis, Y.Z.; writing—original draft preparation, Z.G.; writing—review and editing, Q.F., Z.L. and Y.Z.; funding acquisition, Z.G. All authors have read and agreed to the published version of the manuscript.

Funding

This research was funded by the Guiding Innovation Fund Project of Northeast Petroleum University, “Study on evaluation method of reservoir productivity based on two-phase flow seepage law” (No. 2022YDL-02).

Data Availability Statement

The original data used in this study are included in this article. Further inquiries can be directed to the corresponding author.

Acknowledgments

The authors acknowledge all the participants and administrators in this study.

Conflicts of Interest

The authors declare no conflicts of interest.

References

  1. Liu, J.; Sun, W.; Shi, L.; Wang, X.; Liu, Z.; Teng, T. New Method for Productivity Prediction with Resistivity Logging Data. Well Logging Technol. 2021, 45, 411–415. [Google Scholar]
  2. Zheng, Y.; Shi, X.; Yue, B.; Zhang, B. A method for permeability evaluation based on relative permeability experiments and pressure mobility. Pet. Sci. Bull. 2024, 9, 563–573. [Google Scholar]
  3. Song, Y.; Liu, Y.; Tang, X.; Zhang, Z. Evaluation Method of Total Organic Carbon Content in Shale Based on Stacking Algorithm Ensemble Learning. Well Logging Technol. 2024, 48, 163–178. [Google Scholar]
  4. Zhou, Y.; Luo, S.; Mu, Y.; Lei, L.; Chen, L.; Lin, W. A New Method for Fluid Identification of Low-Contrast Oil Layers in the Western Margin of Ordos Basin. Well Logging Technol. 2024, 48, 117–126. [Google Scholar]
  5. Bai, S.; Wan, J.; Cheng, D.; Li, G.; Zhao, J.; Yang, L.; Wang, M. Study of relationship between petrophysical experimental parameters: Capillary pressure, NMR τ2 distribution, resistivity index, relative permeability. J. Chengdu Univ. Technol. (Sci. Technol. Ed.) 2014, 41, 483–491. [Google Scholar]
  6. Li, K. Interrelationship between Resistivity Index, Capillary Pressure and Relative Permeability. Transp. Porous Media 2011, 88, 385–398. [Google Scholar] [CrossRef]
  7. Dernaika, M.; Kalam, M.; Basioni, M.; Skjæveland, S. Hysteresis of Capillary Pressure, Resistivity Index and Relative Permeability in Different Carbonate Rock Types. Petrophysics 2012, 53, 316–332. [Google Scholar]
  8. Hou, B.; Cui, P.; Liang, W.; Wang, X.; Wang, Q. Correlation analysis between the capillary pressure and resistivity of the reservoir rock based on the rock-electric test. Pet. Geol. Oilfield Dev. Daqing 2022, 41, 75–82. [Google Scholar]
  9. Ma, D.; Wu, H.; Zeng, M. A new method for estimating relative permeability with resistivity data. Oil Gas Geol. 2015, 36, 695–700. [Google Scholar]
  10. Hu, W.; Yang, S.; Liu, G.; Wang, Z.; Wang, P.; Lie, H. A New Correction Method for Oil-Water Relative Permeability Curve on the Basis of Resistivity and Water Saturation Relationship. Transp. Porous Media 2015, 109, 527–540. [Google Scholar] [CrossRef]
  11. Pei, J. Model for Estimating Relative Permeability Based on Resistivity Index. Well Logging Technol. 2015, 39, 685–688. [Google Scholar]
  12. Wang, Y.; Pan, B.; Guo, Y. Relationship between relative permeability and electrical parameters of tight sandstone reservoirs. World Geol. 2017, 36, 1277–1283. [Google Scholar]
  13. MA, D.; Liu, C.; Xu, H.; Liu, B.; Tang, T. A new method for calculating relative permeability of polymer flooding based on core-electrical parameters. J. China Univ. Pet. (Ed. Nat. Sci.) 2017, 41, 118–123. [Google Scholar]
  14. Kolesnikov, B.; Arushanyan, R. The percolation model of relative conductivities and phase permeabilities. J. Phys. Conf. Ser. 2022, 2150, 012005. [Google Scholar] [CrossRef]
  15. Song, Y.; Wang, H.; Tang, X.; Deng, X.; Liu, Y. Relationship Between Oil-water Relative Permeability and Resistivity of Shaly Rock Based on the Similarity Between Water Flow and Electric Current. Well Logging Technol. 2015, 39, 543–549. [Google Scholar]
  16. Li, K. A New Method for Calculating Two-Phase Relative Permeability from Resistivity Data in Porous Media. Transp. Porous Media 2008, 74, 21–33. [Google Scholar] [CrossRef]
  17. Li, K.; Shapiro, M.; Horne, R.; Stanford, U.; Ma, S.; Hajari, A.; Mudhhi, M. In-situ Estimation of Relative Permeability from Resistivity Measurements. In Proceedings of the CPS/SPE International Oil & Gas Conference and Exhibition, Beijing, China, 8–10 June 2010. [Google Scholar]
  18. Li, H.; Fan, Z.; Xie, Y.; Gong, X.; Hao, B.; Sun, L.; Lei, X.; Yan, J. Characterization method of pore throat structure in dense sandstone based on NMR and CMP experiments. Bull. Geol. Sci. Technol. 2025, 44, 25–35. [Google Scholar]
  19. Lu, Y.; Liu, Z.; Liao, X.; Li, C.; Li, Y. Automatic classification of pore structures of low-permeability sandstones based on self-organizing-map neural network algorithm. Bull. Geol. Sci. Technol. 2024, 43, 318–330. [Google Scholar]
  20. Tian, J.; Wang, L.; Sima, L.; Fang, S.; Liu, H. Characterization of reservoir properties and pore structure based on micro-resistivity imaging logging: Porosity spectrum, permeability spectrum, and equivalent capillary pressure curve. Pet. Explor. Dev. 2023, 50, 553–561. [Google Scholar] [CrossRef]
  21. Pairoys, F.; Al–Zoukani, A.; Keskin, A. Correlation between Resistivity and Petrophysical Parameters of a Carbonate Rock During Two–Phase Flow Displacements. In Proceedings of the SPE Saudi Arabia Section Technical Symposium and Exhibition, Al–Khobar, Saudi Arabia, 19–22 May 2013. [Google Scholar]
  22. Shi, Y.; Meng, H.; Liu, T.; Zhang, H.; Wang, C. Evaluation of Relative Permeability from Resistivity Data for Fractal Porous Media. Petrophysics 2020, 61, 303–317. [Google Scholar] [CrossRef]
  23. Guo, Y.; Pan, B.; Liu, W. A research on the relationship between resistivity index and relative permeability at different measurement conditions based on the pore structure. Environ. Fluid Mech. 2016, 16, 1129–1141. [Google Scholar] [CrossRef]
  24. Zhang, J.; Wang, X.; Hu, Y.; Li, J.; Su, J. Relationship between Rock Resistivity Increasing Coefficient and Water Saturation Based on Phase Percolation Analysis. Well Logging Technol. 2016, 40, 137–141. [Google Scholar]
  25. Zhao, D.; Hou, J.; Wang, X.; Liu, Y.; Chen, Y.; Zhang, Z. Controlling mechanism of pore-throat structure of different litholacies on gas-water relative permeability characteristics of tight sandstone gas reservoir: A case study of the Lower Shihezi Formation in the Well J72 block of the Dongsheng Gas Field, Ordos Basin. Bull. Geol. Sci. Technol. 2023, 42, 163–174. [Google Scholar]
  26. Ma, D.; Liu, C.; Cheng, C. New Relationship between Resistivity Index and Relative Permeability. J. Energy Resour. Technol. 2015, 137, 1–7. [Google Scholar] [CrossRef]
  27. Wu, J.; Zhang, L.; Liu, Y.; Ma, K.; Luo, X. Effect of Displacement Pressure Gradient on Oil–Water Relative Permeability: Experiment, Correction Method, and Numerical Simulation. Processes 2024, 12, 330. [Google Scholar] [CrossRef]
  28. Song, Y.; Zhou, Y.; Tang, X.; Fu, J.; Hou, L. Method for Determination of Permeability of Shaly Sand Formation with Low Porosity and Permeability Based on Efficient Flow Pore. Prog. Geophys. 2016, 31, 327–333. (In Chinese) [Google Scholar]
  29. Ma, D.; Zhang, K.; Hu, J.; Li, H.; Ma, L.; Tang, T. Correlation between relative permeability, capillary pressure and resistivity index. Oil Gas Geol. 2019, 40, 190–195. [Google Scholar]
  30. Guo, Z. Experimental Study on Relationship Between Oil-Water Relative Permeability and Resistivity of Matrix-Conducting Shaly Rock. Ph.D. Thesis, Northeast Petroleum University, Heilongjiang, China, 2019. [Google Scholar]
  31. Song, Y.; Jiang, Y.; Song, Y.; Zhang, Y. Experimental Research on the Influencing Factors of m and n of Low Resistivity Oil Reservoirs in Southern Gulong Area. J. Jilin Univ. (Earth Sci. Ed.) 2014, 44, 704–714. [Google Scholar]
  32. Li, J.; Gao, C.; Zhao, B.; Cheng, X. Permeability Upscaling Conversion Based on Reservoir Classification. Processes 2024, 12, 1653. [Google Scholar] [CrossRef]
  33. Li, Z.; Mo, X. Study on the electric property of shaly sand and its interpretation method. J. Geosci. Res. Northeast Asia 1999, 2, 110–114. [Google Scholar]
  34. Mo, X.; He, D.; Li, Z.; Wen, X.; Li, G. The Application of Three—water Conduction Model in the Interpretation of Low—Resistivity Reservoir. J. Chang. Univ. Sci. Technol. 2001, 31, 92–95. [Google Scholar]
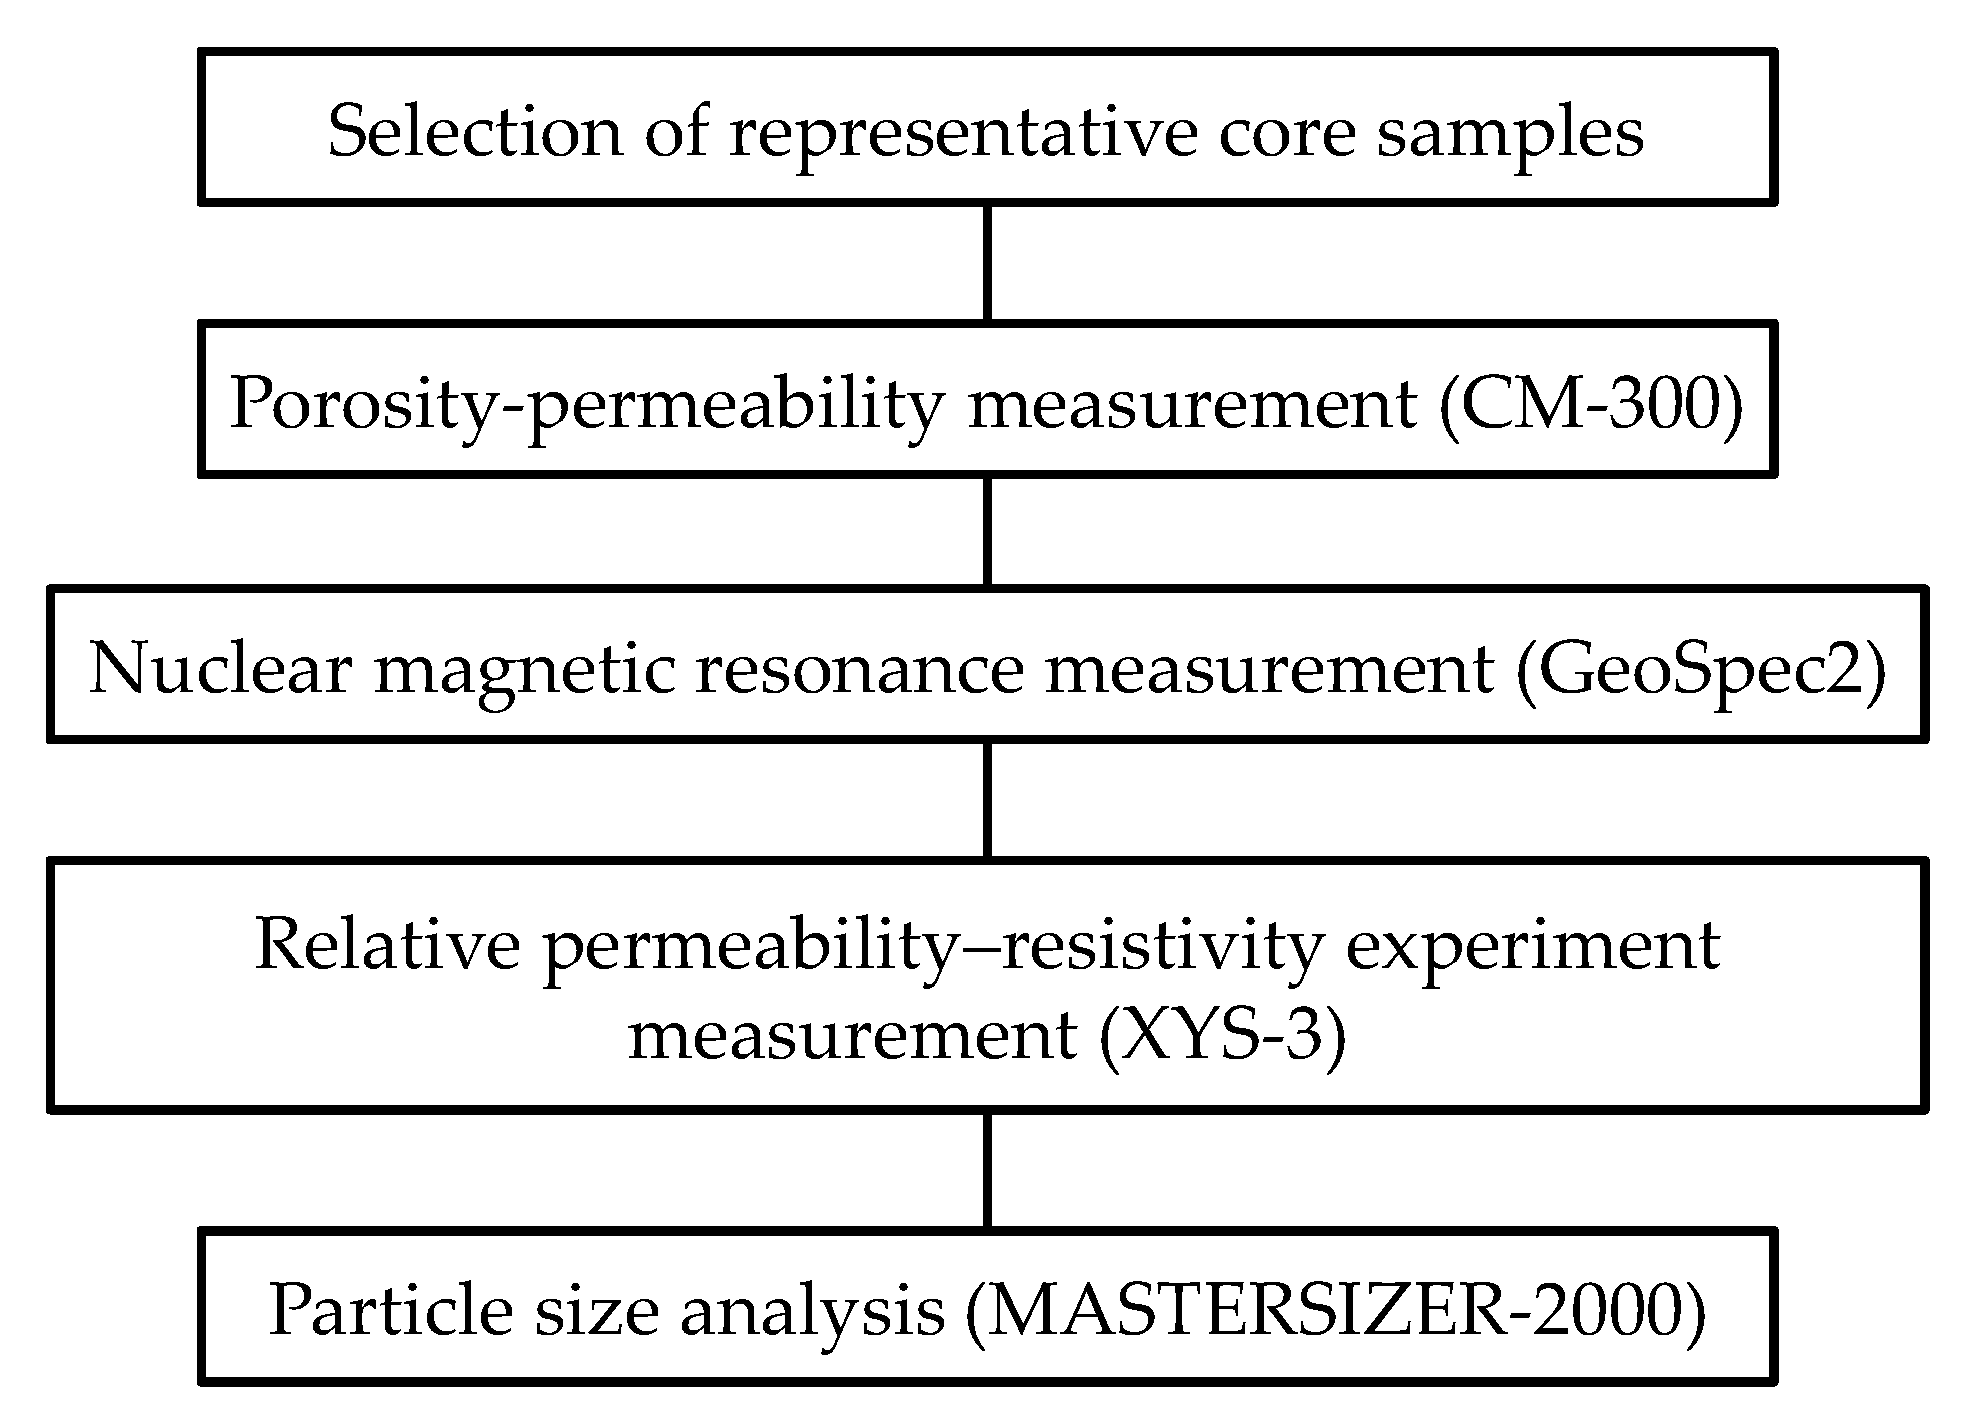
Figure 1. Schematic diagram of experimental measurement procedure.
Applsci 15 08963 g001
Figure 2. Relationship between oil–water relative permeability and water saturation.
Applsci 15 08963 g002
Figure 3. Relationship between oil–water relative permeability and resistivity.
Applsci 15 08963 g003
Figure 4. Relationship between water-phase relative permeability and resistivity index with different pore structures.
Applsci 15 08963 g004
Figure 5. Relationship between water-phase relative permeability and resistivity index with different shale contents.
Applsci 15 08963 g005
Figure 6. Relationship between oil-phase relative permeability and resistivity index with different pore structures.
Applsci 15 08963 g006
Figure 7. Relationship between oil-phase relative permeability and resistivity index with different shale content.
Applsci 15 08963 g007
Figure 8. Schematic flowchart of model derivation process.
Applsci 15 08963 g008
Figure 9. Volumetric physical model schematic showing rock–water flow and electric current flow analogies.
Applsci 15 08963 g009
Figure 10. Determination of parameters for water-phase relative permeability model.
Applsci 15 08963 g010
Figure 11. Determination of parameters for oil-phase relative permeability model.
Applsci 15 08963 g011
Figure 12. Comparison of calculation accuracy of water-phase relative permeability model.
Applsci 15 08963 g012
Figure 13. Comparison of calculation accuracy of oil-phase relative permeability model.
Applsci 15 08963 g013
Figure 14. Comparison of calculation accuracy of water-phase relative permeability model (Li model).
Applsci 15 08963 g014
Figure 15. Comparison of calculation accuracy of oil-phase relative permeability model (Li model).
Applsci 15 08963 g015
Table 1. Parameter measurement values of 26 core samples in Block A.
NumberingCore SamplePorosityPermeabilityShale ContentIrreducible Water SaturationPore Permeability Composite Index
(%)(mD)(%)(%)
1A-113.90.910.0060.70.25
2A-418.92.510.0055.90.36
3A-215.73.917.8452.00.50
4A-317.34.85.3051.70.53
5A-513.85.59.1553.40.63
6A-617.48.36.2053.70.69
7A-721.612.810.9048.60.77
8A-924.517.98.5845.10.85
9A-1017.913.86.0343.40.88
10A-1118.016.112.7045.70.94
11A-1219.322.17.6642.11.07
12A-1319.223.514.1750.81.11
13A-1420.431.613.3241.21.25
14A-822.254.729.2043.01.57
15A-1523.671.29.3042.81.74
16A-1617.656.411.5544.21.79
17A-1716.954.622.5940.91.80
18A-2017.189.017.2940.32.28
19A-1923.9147.89.7141.32.49
20A-2125.5245.59.0039.03.10
21A-1824.3248.08.1138.13.19
22A-2223.4346.411.5534.33.85
23A-2321.9485.18.2533.74.71
24A-2426.9606.74.9634.84.75
25A-2524.7571.53.8135.44.81
26A-2625.51377.54.4432.67.35
Table 2. Experimental data on simultaneous measurement of oil–water relative permeability and resistivity of core samples in Block A (Sample A-1 as an example).
Core SampleResistivity of Water-Saturated Rock SampleWater SaturationOil Relative PermeabilityWater Relative PermeabilityResistivity of Rock SampleResistivity Index
(Ω·m)(%)(%)(%)(Ω·m)(Dimensionless)
A-128.160.7100.000.0055.751.99
62.366.360.9453.051.89
64.049.551.8151.251.83
66.034.633.8448.401.73
70.713.256.4844.791.60
73.56.177.6542.171.50
75.33.268.1840.941.46
76.90.008.5740.161.43
Disclaimer/Publisher’s Note: The statements, opinions and data contained in all publications are solely those of the individual author(s) and contributor(s) and not of MDPI and/or the editor(s). MDPI and/or the editor(s) disclaim responsibility for any injury to people or property resulting from any ideas, methods, instructions or products referred to in the content.