Article

Strength Deterioration and Sensitivity Analysis of Coal Samples Under Different Immersion Times for Underground Water Reservoirs

1
State Key Laboratory of Water Resource Protection and Utilization in Coal Mining, National Institute of Clean and Low Carbon Energy, Beijing 102211, China
2
State Key Laboratory for Fine Exploration and Intelligent Development of Coal Resources, China University of Mining and Technology, Xuzhou 221116, China
*
Author to whom correspondence should be addressed.
Appl. Sci. 2025, 15(16), 8957; https://doi.org/10.3390/app15168957 (registering DOI)
Submission received: 2 July 2025 / Revised: 11 August 2025 / Accepted: 12 August 2025 / Published: 14 August 2025
(This article belongs to the Section Civil Engineering)

Abstract

In the coal pillar dam of underground water reservoirs, groundwater exerts a certain degree of dissolution and erosion on the coal body, inducing the development of internal cracks and the deterioration of its mechanical properties. To this end, coal samples with varying moisture contents were prepared through a water-absorption experiment; the changes in the mechanical strength of coal samples with five moisture contents (0%, 3.62%, 4.93%, 5.52%, and 6.11%) were tested via uniaxial compression tests, uniaxial tension tests, and variable-angle shear tests; and the degradation in mechanical performance in water-immersed coal samples and their sensitivity to moisture content were evaluated. The experiment yielded the following results: (1) The moisture content of coal samples increases with the increase in immersion time, and the water-absorption rate first rises, then decelerates and gradually becomes stable. When the immersion time is about 72 h, the coal sample reaches a saturated state. (2) As the samples transition from a dried state to full saturation, the uniaxial compressive strength of coal samples decreases from 29.17 MPa to 7.38 MPa, and the uniaxial tensile strength decreases from 0.78 MPa to 0.33 MPa. The peak shear strength also decreases with an increase in immersion time and the increase in shear angle, while the deterioration degree gradually increases with the increase in immersion time and tends to be stable. (3) Based on a sensitivity analysis, the mechanical performance evolution of water-immersed coal samples can be divided into four stages based on the moisture content: tensile-dominated stage, shear-dominated stage, compression catching-up stage, and compression-dominated stage.

1. Introduction

In recent years, China’s energy demand has steadily increased, and resources in the eastern mining regions have gradually been depleted. Thus, the main focus of mining operations has gradually shifted to the western regions of China. Currently, coal production in the western mining areas accounts for over 70% of the nation’s total output [1]. However, the western area is characterized by extensive sandy terrain and a severe shortage of water resources. As a result, ecological degradation, underground water shortages, and disruptions to the groundwater system have emerged as critical issues hindering the sustainable and high-quality development of coal mining operations [2,3]. In the process of coal mining, the use of mine production water, groundwater influx, water seepage within rock strata, and other activities generate a significant volume of mine water. The intense extraction of coal seams leads to the disruption of surrounding rock formations and induces damage to the hydrogeological structure, thereby wasting mine water resources [4].
Coal mine underground reservoir technology allows for the efficient mining of coal resources without adverse impacts and can facilitate the storage and utilization of mine water resources, providing a valuable approach for high-quality green mining in coal mines [5,6]. During the implementation of this technology, the goaf and cracks in the overburden are used as storage space, while boundary coal pillars and artificial structures serve as dam bodies for the underground reservoir. Additionally, devices for water storage and access are installed to facilitate the storage, utilization, and treatment of mine water [7].
The coal pillar dam is the main component of the underground reservoir dam, and mine water exerts a certain degree of dissolution and erosion effect on the coal body. This process induces the development of internal cracks, reduces the friction between coal particles, dissolves the minerals therein, disrupts its overall skeleton, and ultimately leads to the deterioration of the mechanical performance of the coal body. Furthermore, the coal pillar structure is relatively loose compared to the artificially constructed dam body and is more susceptible to the intrusion effect of mine water. Therefore, a stable coal pillar dam is necessary for the safe operation of the underground reservoir [8,9,10].
Extensive research on the mechanical properties of coal and rock masses and how they are affected by water has been conducted through experiments and simulations. Regarding compressive performance, Qian et al., using uniaxial compression tests and a digital imaging technique, found that an increase in coal moisture content leads to a decrease in peak strength and Young’s modulus, and the failure mode of the coal sample changes from a tensile–shear composite type to a shear-dominated type [11]. Wang et al. revealed through triaxial seepage tests that raw coal permeability decreases exponentially with increasing volumetric stress. The authors noted that while high moisture (4%) reduces the initial permeability, fracture networks may partially mitigate water’s adverse effects [12]. Wang points out that the strength and deformation characteristics of soft coal masses are significantly affected by the moisture content: as the moisture content increases, both the compressive strength and Young’s modulus first increase, peak, and then decrease [13]. By establishing models for different types of rock mass, Karakul and Ulusay et al. found that an increase in water saturation leads to a decrease in the uniaxial compressive strength index, and rocks with high clay content exhibit a more substantial decrease in strength [14]. Through compression tests, Yilmaz showed that the uniaxial compressive strength of gypsum in a saturated state is 64% lower than that in a dry state and proposed an exponential strength prediction model [15]. Through triaxial compression tests, Iyare et al. found that the strength of high-porosity mudstone is greatly reduced after saturation, and the brittle–ductile transition pressure threshold is significantly reduced [16]. Talesnick et al. studied the mechanical response mechanism of high-porosity chalk at different moisture contents and concluded that water reduces the strength of chalk by weakening inter-particle cement and pore pressure effects [17]. Using laboratory experiments and numerical simulation methods, Poulsen et al. systematically evaluated the influence of water saturation on the mechanical properties of coal pillars and surrounding rocks, revealing that water saturation reduces the overall strength of composite coal pillars [18]. In terms of shear performance, Kim et al. conducted experiments to compare the shear strength of three types of sandstone. The results show that the shear strength of the sandstone in a saturated condition decreased by 20–40%, and the porosity and strength are negatively correlated [19]. Sakhuo discovered that when mudstone moisture exceeds a critical threshold (3.5%), cohesion decays exponentially and friction angle decreases linearly [20]. In terms of tensile performance, Hashiba et al. discovered through uniaxial tension experiments that the reduction rate of tensile strength in water-saturated rocks is 1.6 times higher than that of the compressive strength, and the reduction in crack extension resistance leads to an increase in deformation [21]. Zhu observed that short-term immersion (≤7 days) enhances coal plasticity while reducing brittleness. The authors of another study reported that tensile strength initially increases and then decreases with rising moisture, showing a strong negative correlation with porosity [22]. Han et al. found that the tensile strength of coal decreases exponentially with moisture content using the Brazilian splitting method [23]. In terms of the damage evolution mechanism, Yao et al. found, through uniaxial compression tests, that increased moisture content reduces Young’s modulus and increases the peak strain of coal samples, inhibiting the generation of tensile cracks while promoting the development of shear cracks [24]. Using discrete element simulation, Wang et al. illustrated how excessive moisture content alters the crack distribution pattern [25].
In summary, researchers have conducted extensive studies on the influence of moisture content on the mechanical properties of coal rock masses, and the mechanical performance and crack development of coal samples under long-term water immersion have been the main focus. However, these studies mostly compared the mechanical parameters of coal samples at a single moisture content. Thus, there has been insufficient systematic investigation into how tensile, compressive, and shear mechanical properties change with varying moisture contents and how their failure modes transform. Additionally, no sensitivity analyses have been conducted on the variation patterns of mechanical properties in water-containing coal samples.
In this study, fully dried coal samples were used as research objects, and coal samples with different moisture contents were prepared through water-absorption experiments. Subsequently, the changes in the tensile, compressive and shear properties of the coal samples at different moisture contents were analyzed, and their failure modes and patterns of deterioration were explored. A vertical offset power function model was utilized to establish the relationship between the moisture content of the coal samples and their degree of deterioration. Based on sensitivity analysis, the changes in the mechanical performance of water-containing coal samples were divided into four stages according to the moisture content. This research provides theoretical support for maintaining the stability of coal pillars in underground reservoirs.

2. Sample Preparation and Test Methods

2.1. Preparation of Water-Immersed Coal Samples

The coal samples used in the test were taken from the coal pillar dam of the underground reservoir of Shigetai Coal Mine in the Shendong Mining Area, China. Samples were obtained from the upper, middle, and lower vertical sections of the coal pillar dams to ensure representative spatial distribution. The collected coal samples were processed into various specimens with different sizes, with adjacent faces perpendicular to each other, the angle deviation not greater than 0.5°, and the non-parallelism between relative faces less than 0.1 mm. Specifically, 24 cylindrical specimens with a size of Φ 50 mm × H 100 mm were prepared. Among these, 3 specimens were used to test the water immersion behavior of coal samples, 15 were subjected to compression tests, and the remaining 6 were reserved. Additionally, 21 cylindrical specimens with a size of Φ 50 mm × H 25 mm were processed, of which 15 were used for tensile tests, and the remaining 6 were reserved; 60 cylindrical specimens with a size of Φ 50 mm × H 50 mm were processed, of which 45 were employed for shear tests, and the remaining 15 were reserved.
The following method was used to prepare coal samples under different immersion times: Firstly, coal samples were placed in an electric blast drying oven, with the temperature set at 105 °C, and dried for 24 h. After drying, coal samples were transferred to a dryer for further cooling until they reached room temperature; then, coal samples were weighed to obtain their dry mass. Secondly, at least three dry coal samples were placed in the immersion equipment, and samples were retrieved at predetermined intervals and weighed to test the mass variation in the coal samples under different immersion times. The samples were considered to have reached a saturated state when their mass no longer changed. Before the experiment, the coal samples were wrapped and sealed with plastic wrap to prevent the samples from weathering. Figure 1 shows the flow chart for preparing coal samples with different immersion times.
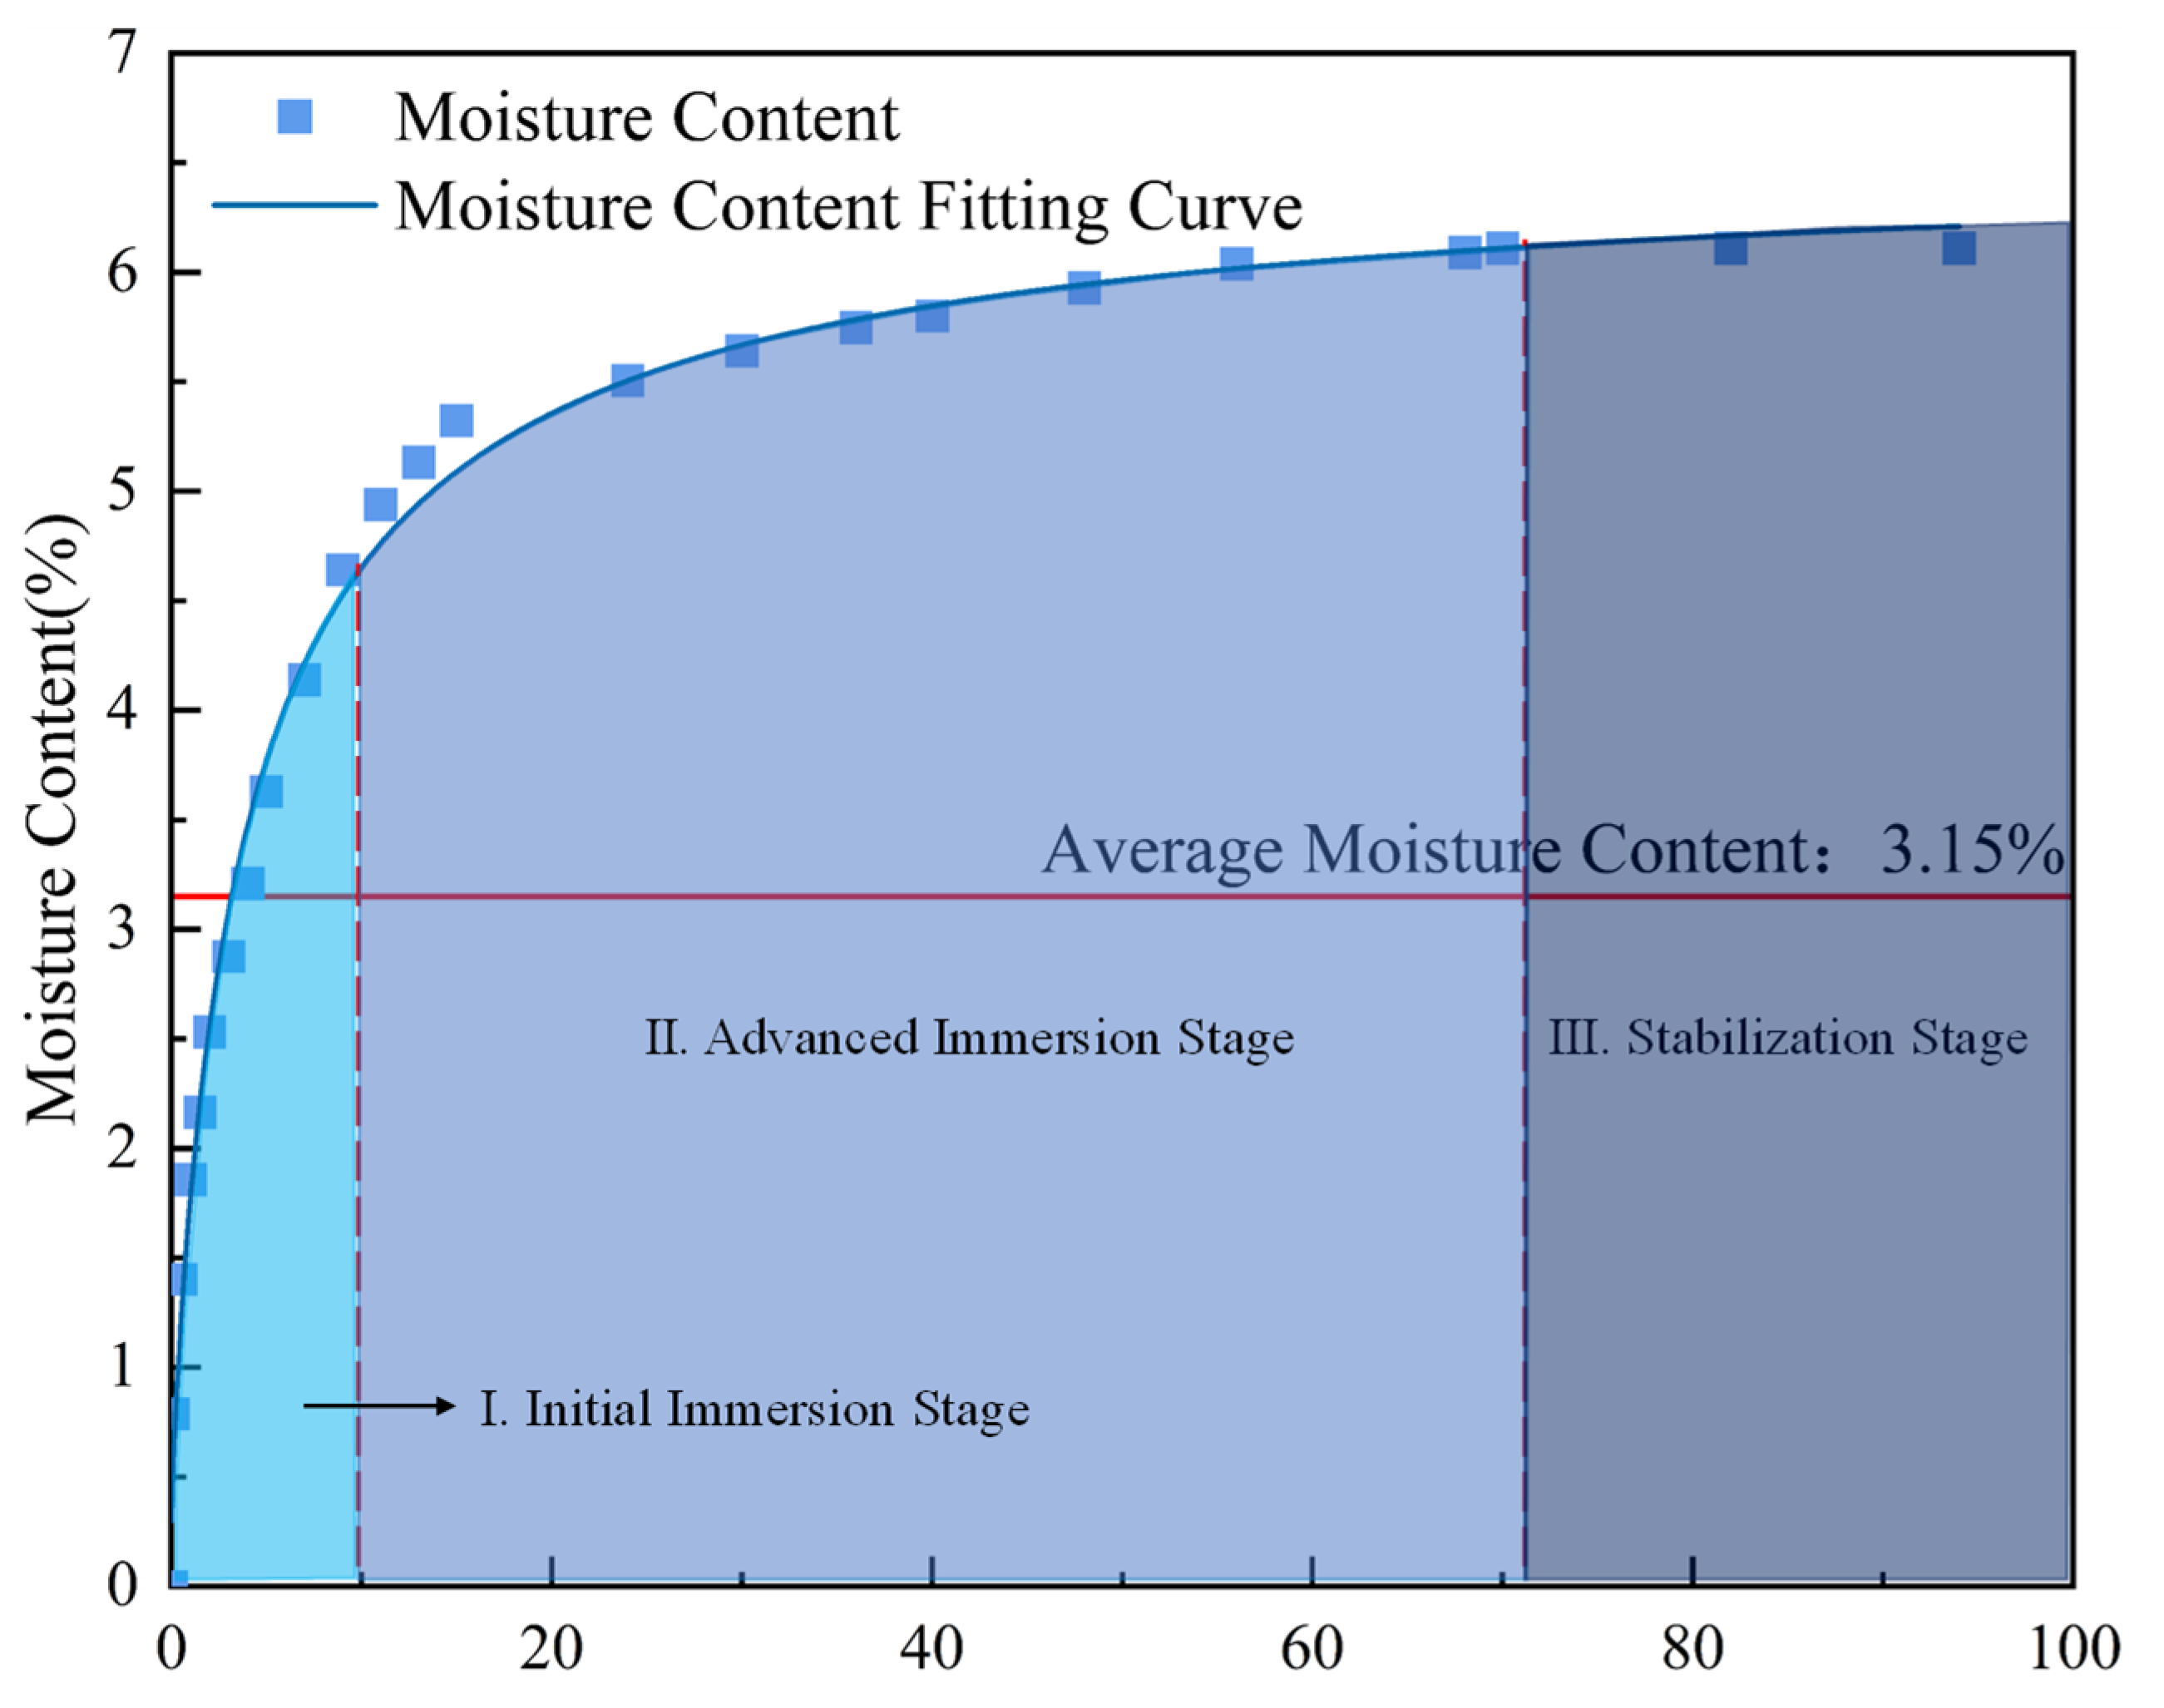
Using the results obtained from the coal sample immersion experiment, the test data were fitted with nonlinear regression. It is evident that there is a significant logistic function relationship between the moisture content and immersion time, as shown in Figure 2.
As shown in Figure 2, the moisture content of the coal sample increases with the increase in immersion time, and the water-absorption rate rises rapidly at first, slows down, and finally becomes stable. The immersion process can be divided into three stages: the early immersion stage, the late immersion stage and the stable stage. In the early immersion stage, with the increase in immersion time, the moisture content of the coal sample increases almost linearly, exhibiting a rapid growth rate. In the late immersion stage, with the increase in immersion time, the moisture content of the coal sample increases logarithmically, exhibiting a slow growth rate. When the immersion time is about 72 h, the stable stage is activated. The moisture content of the coal sample remains unchanged and progressively approaches saturation; after 72 h of non-destructive immersion, the moisture content of the coal sample is 6.11%, which is considered the saturation point.
To study the fundamental mechanical performance of coal samples with different moisture contents, moisture contents of 0%, 3.62%, 4.93%, 5.52% and 6.11% (saturated) were used for mechanical testing, according to the evolution of moisture content with immersion time. Table 1 shows the relationship between the immersion time and moisture content.

2.2. Test Plan and Test Equipment

Mechanical testing of coal samples with varying moisture gradients quantified the moisture-dependent changes in the tensile, compressive, and shear properties of the coal samples. The stress–strain relationship, compressive strength, and other mechanical properties were also analyzed to demonstrate the degradation of the mechanical performance of water-immersed coal samples under tensile stress, compressive stress and shear stress, and then the changes in the coal samples’ mechanical properties and degree of degradation were determined. If the test results in the same group were highly discrete or there was a test error, the reserved specimens were used for retesting. Each set of experiments was conducted three times. Table 2 shows the testing scheme for the fundamental mechanical properties of coal samples with different moisture contents.
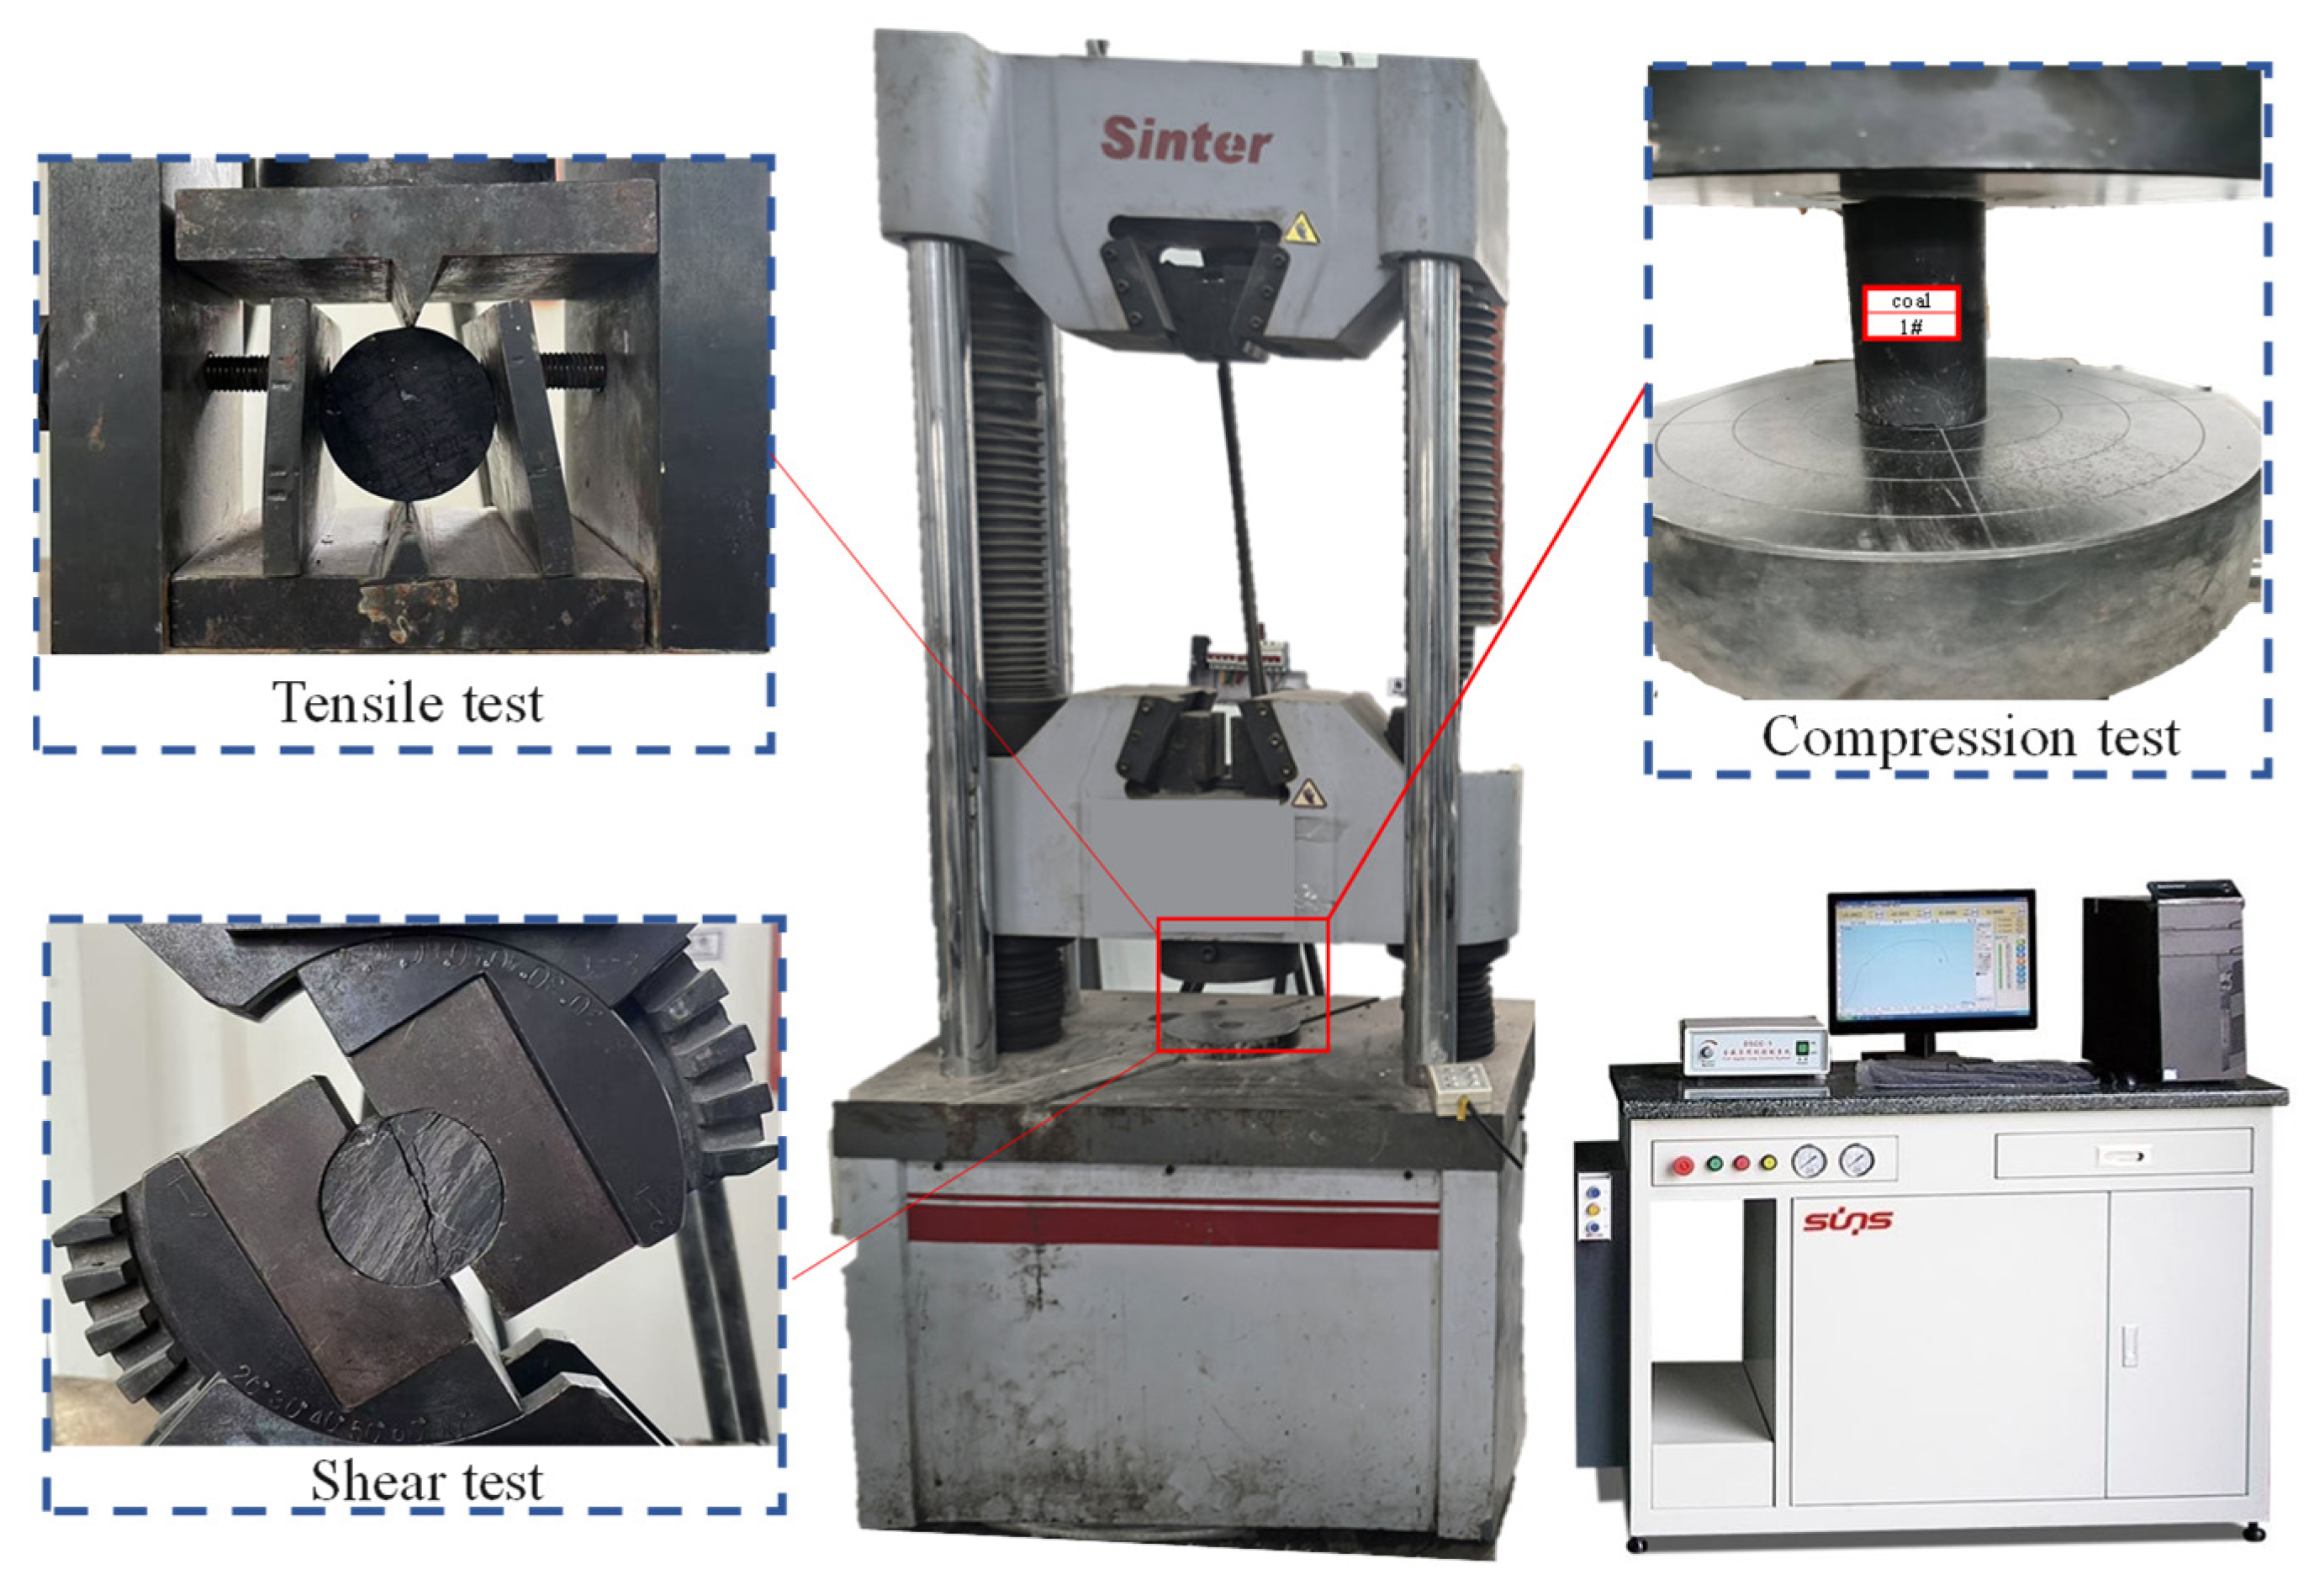
The fundamental mechanical properties of coal samples with different moisture contents were tested using a WAW-1000D microcomputer-controlled electro-hydraulic servo universal testing machine, manufactured by Sinter in Changchun, China, and purchased directly from the manufacturer. The equipment consisted of a host system, a servo-hydraulic source system, a microcomputer measurement and control system, a crossbeam, and a hydraulic chuck operating system. The maximum test force was 1000 kN, and the indication accuracy was 0.5. Figure 3 shows the process of testing coal samples with different moisture contents.

3. Mechanical Performance Degradation of Water-Immersed Coal Samples

3.1. Effect of Moisture Content on the Compressive Performance of Coal Samples

3.1.1. Stress–Strain Curves

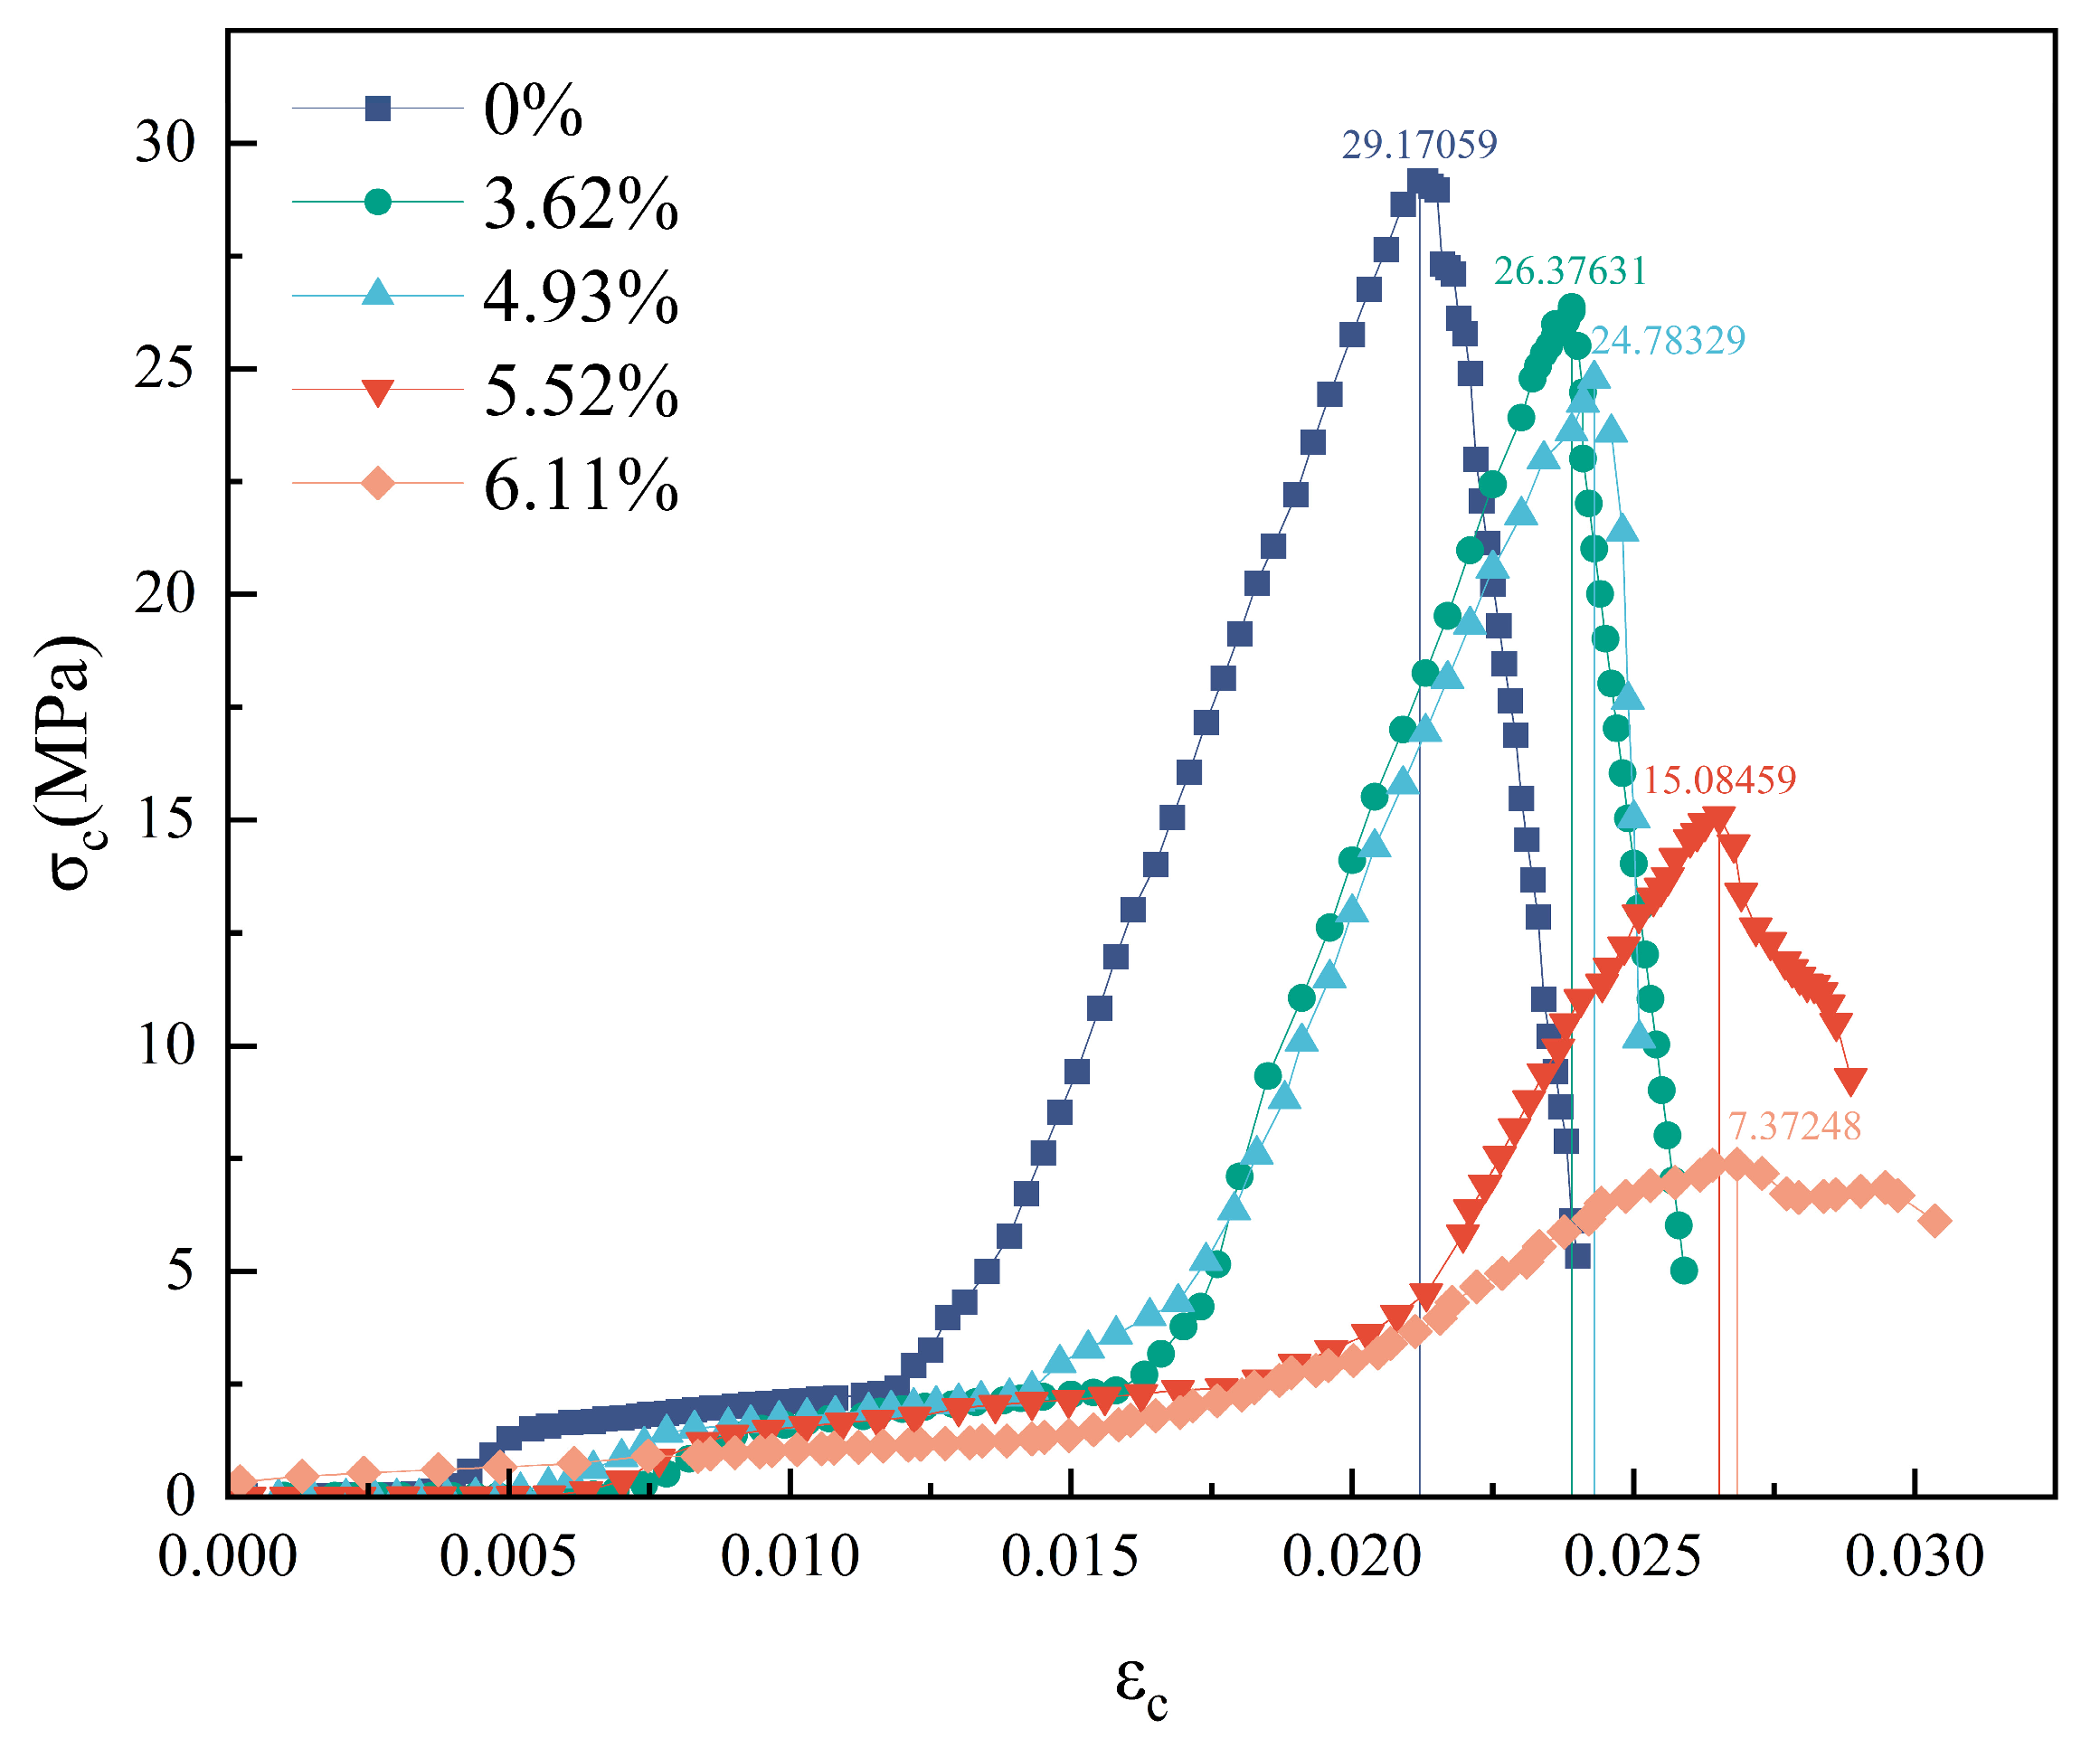
The coal samples, at all five moisture contents, underwent four stages under uniaxial compression load: pore crack compaction, linear elastic deformation, unstable fracture development, and the post-fracture stage. The stress–strain curves of the coal samples with different moisture contents under uniaxial compression are shown in Figure 4 [26,27].
As shown in Figure 5, water exerts a certain degree of dissolution and erosion on the coal sample. During this process, pore water pressure is generated, and coal samples soften, resulting in the degradation of their compressive performance. In the pore crack compaction stage, coal samples with higher moisture content exhibit more stable mechanical behavior, and their stress–strain curves are more linear, with a relatively steeper slope. In the linear-elastic deformation stage and the unstable fracture development stage, as the moisture content increases, the coal sample softens, leading to a continuous reduction in the slope of the stress–strain curve and a decline in peak strength. In the post-fracture stage, as the moisture content increases, the peak strain of the coal sample increases from 0.0212 in the dry state to 0.0268 in the saturated state. This is because the dry coal sample undergoes brittle failure under pressure [28,29]. When the moisture content increases, water leads to the expansion of internal cracks within the coal sample, causes mineral dissolution, and weakens its mechanical properties, gradually transforming from tensile failure into plastic failure. This process shows obvious plastic characteristics, and the strain required for failure increases [30,31,32]. After failure, the dry coal sample experiences a sharp decline in stress, exhibiting evident characteristics of brittle failure. In contrast, the coal sample that has reached a saturated state retains residual strength after failure, demonstrating plastic characteristics.

3.1.2. Compression Performance

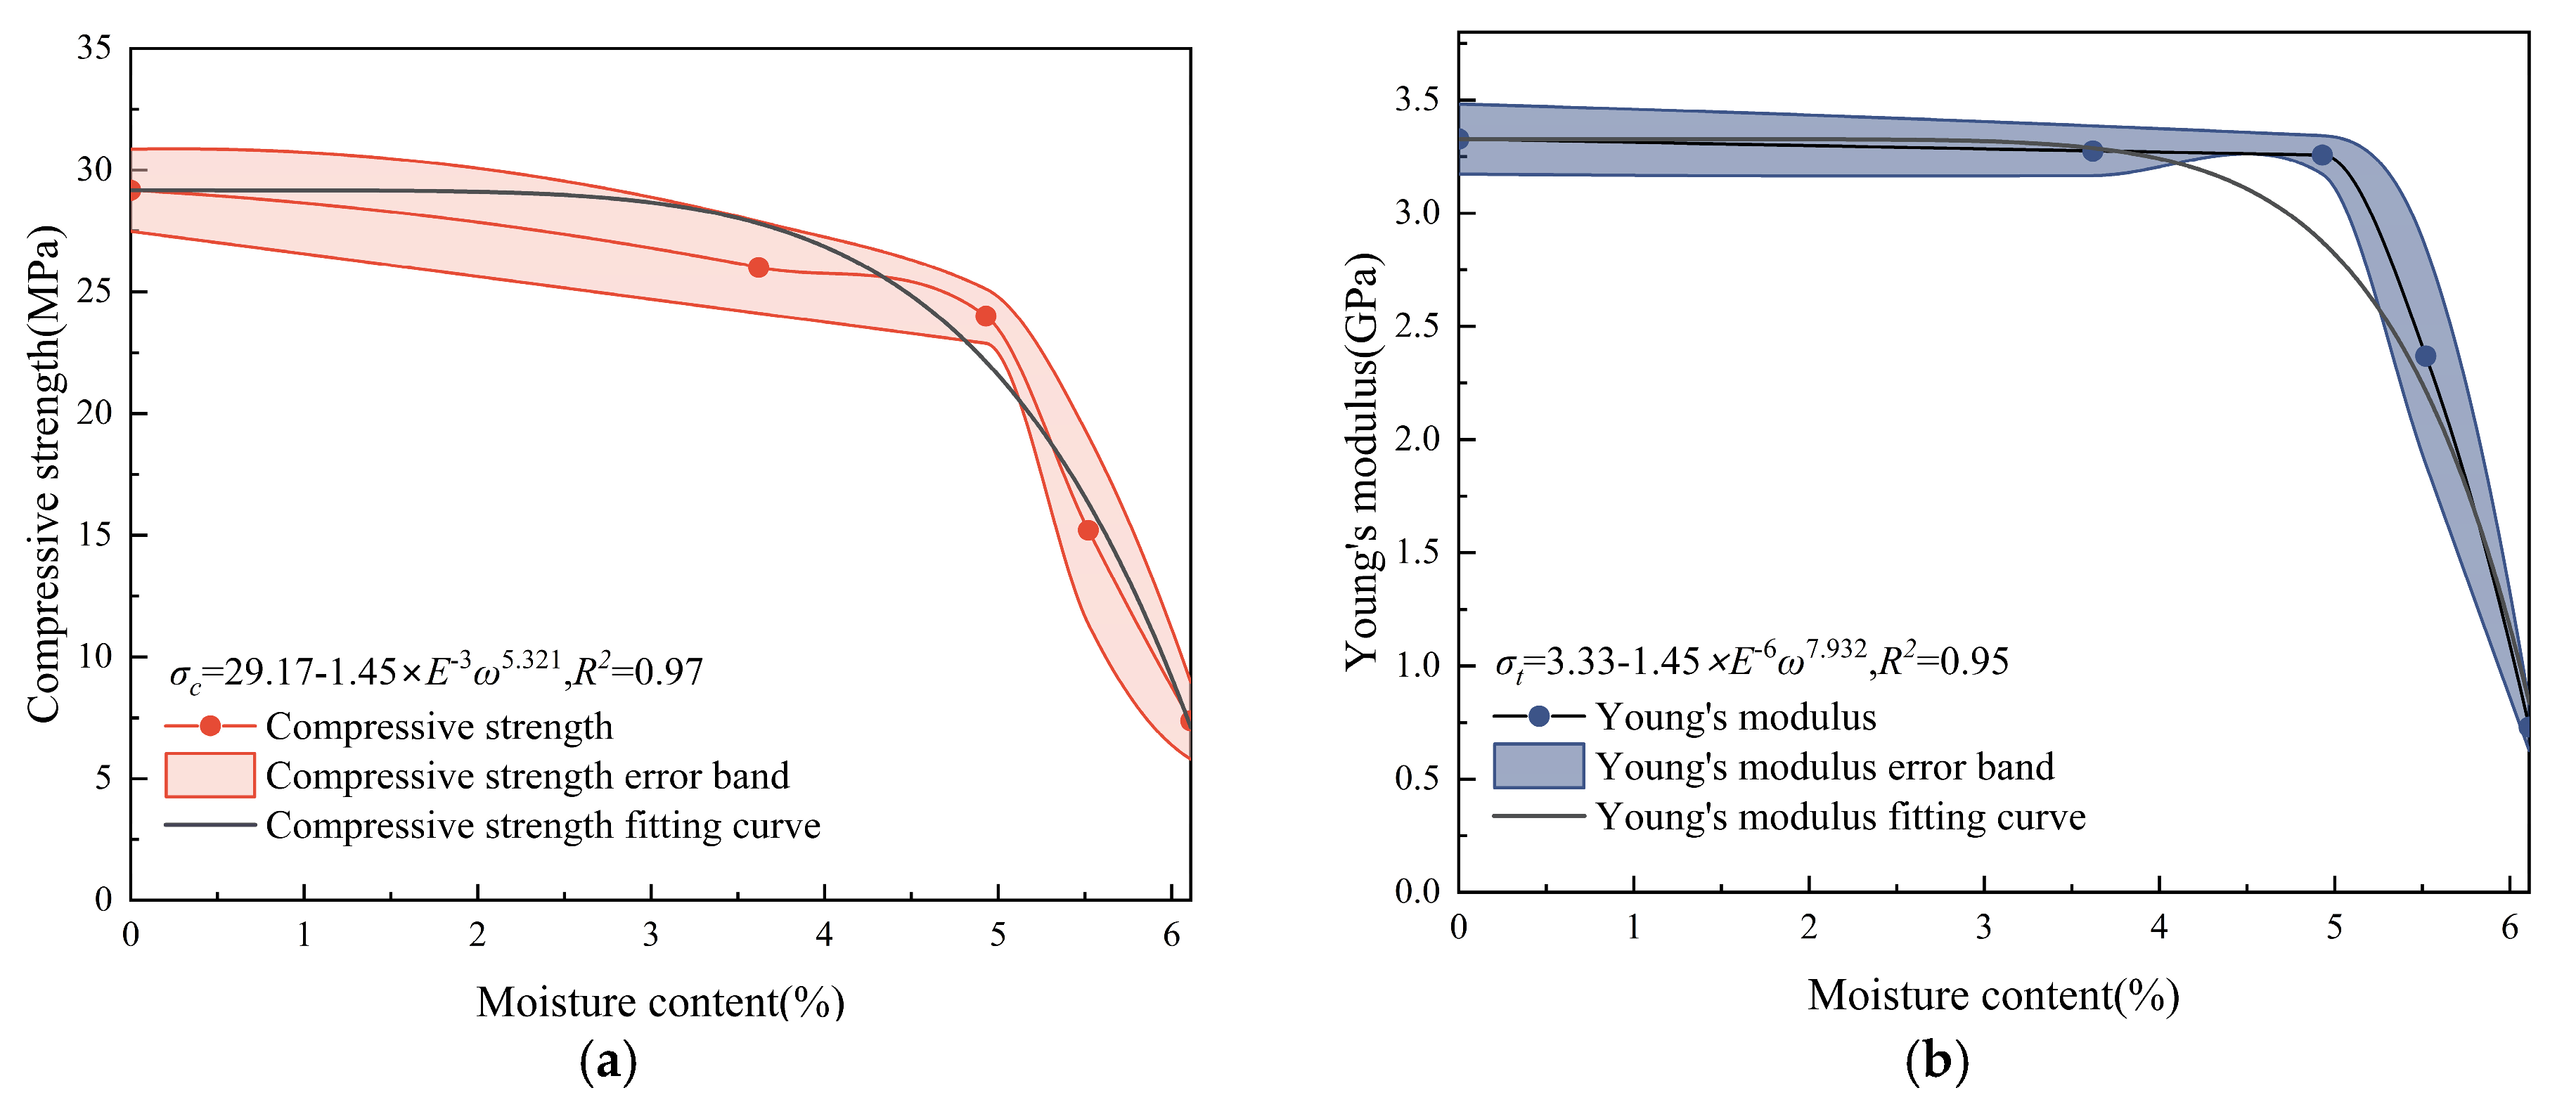
As the moisture content increases, the compressive strength and Young’s modulus of the coal sample continue to decrease. Young’s modulus is defined as the ratio of stress to strain during linear elastic deformation. When they are fitted to the vertical offset power function relationship, a negative correlation trend is obtained. The fitting correlation equation is as follows:
σ c = 29.17 1.45 × E 3 ω 5.321 , R 2 = 0.97 E c = 3.33 1.45 × E 6 ω 7.932 , R 2 = 0.95
where σ c is the uniaxial compressive strength, MPa; Ec is Young’s modulus, MPa; ω is the moisture content, %; and R2 is the goodness of fit.
Figure 5 displays the test results and fitting curves, showing the influence of different moisture contents on the reduction in coal samples’ compressive performance.
As shown in Figure 5, the compressive strength of coal samples is negatively correlated with the moisture content. As the coal sample transitions from a dry state to a saturated state, its compressive strength decreases from 29.17 MPa to 7.37 MPa, a decrease of 74.7%; Young’s modulus drops from 3.33 GPa to 0.73 GPa, a decrease of 80%. The decrease in Young’s modulus is greater than that in compressive strength, and the power of the fitting curve is lower. This shows that the compressive strength of coal significantly deteriorated due to water exposure. Additionally, given that the microstructure of coal samples is mostly damaged under low moisture content conditions, it can be inferred that Young’s modulus is more sensitive to the early development of microcracks and interfacial weakening in coal samples, while the compressive strength is more sensitive after the formation of cracks due to macroscopic damage in the coal samples.

3.2. Effect of Moisture Content on Tensile Performance of Coal Samples

3.2.1. Stress–Strain Curves

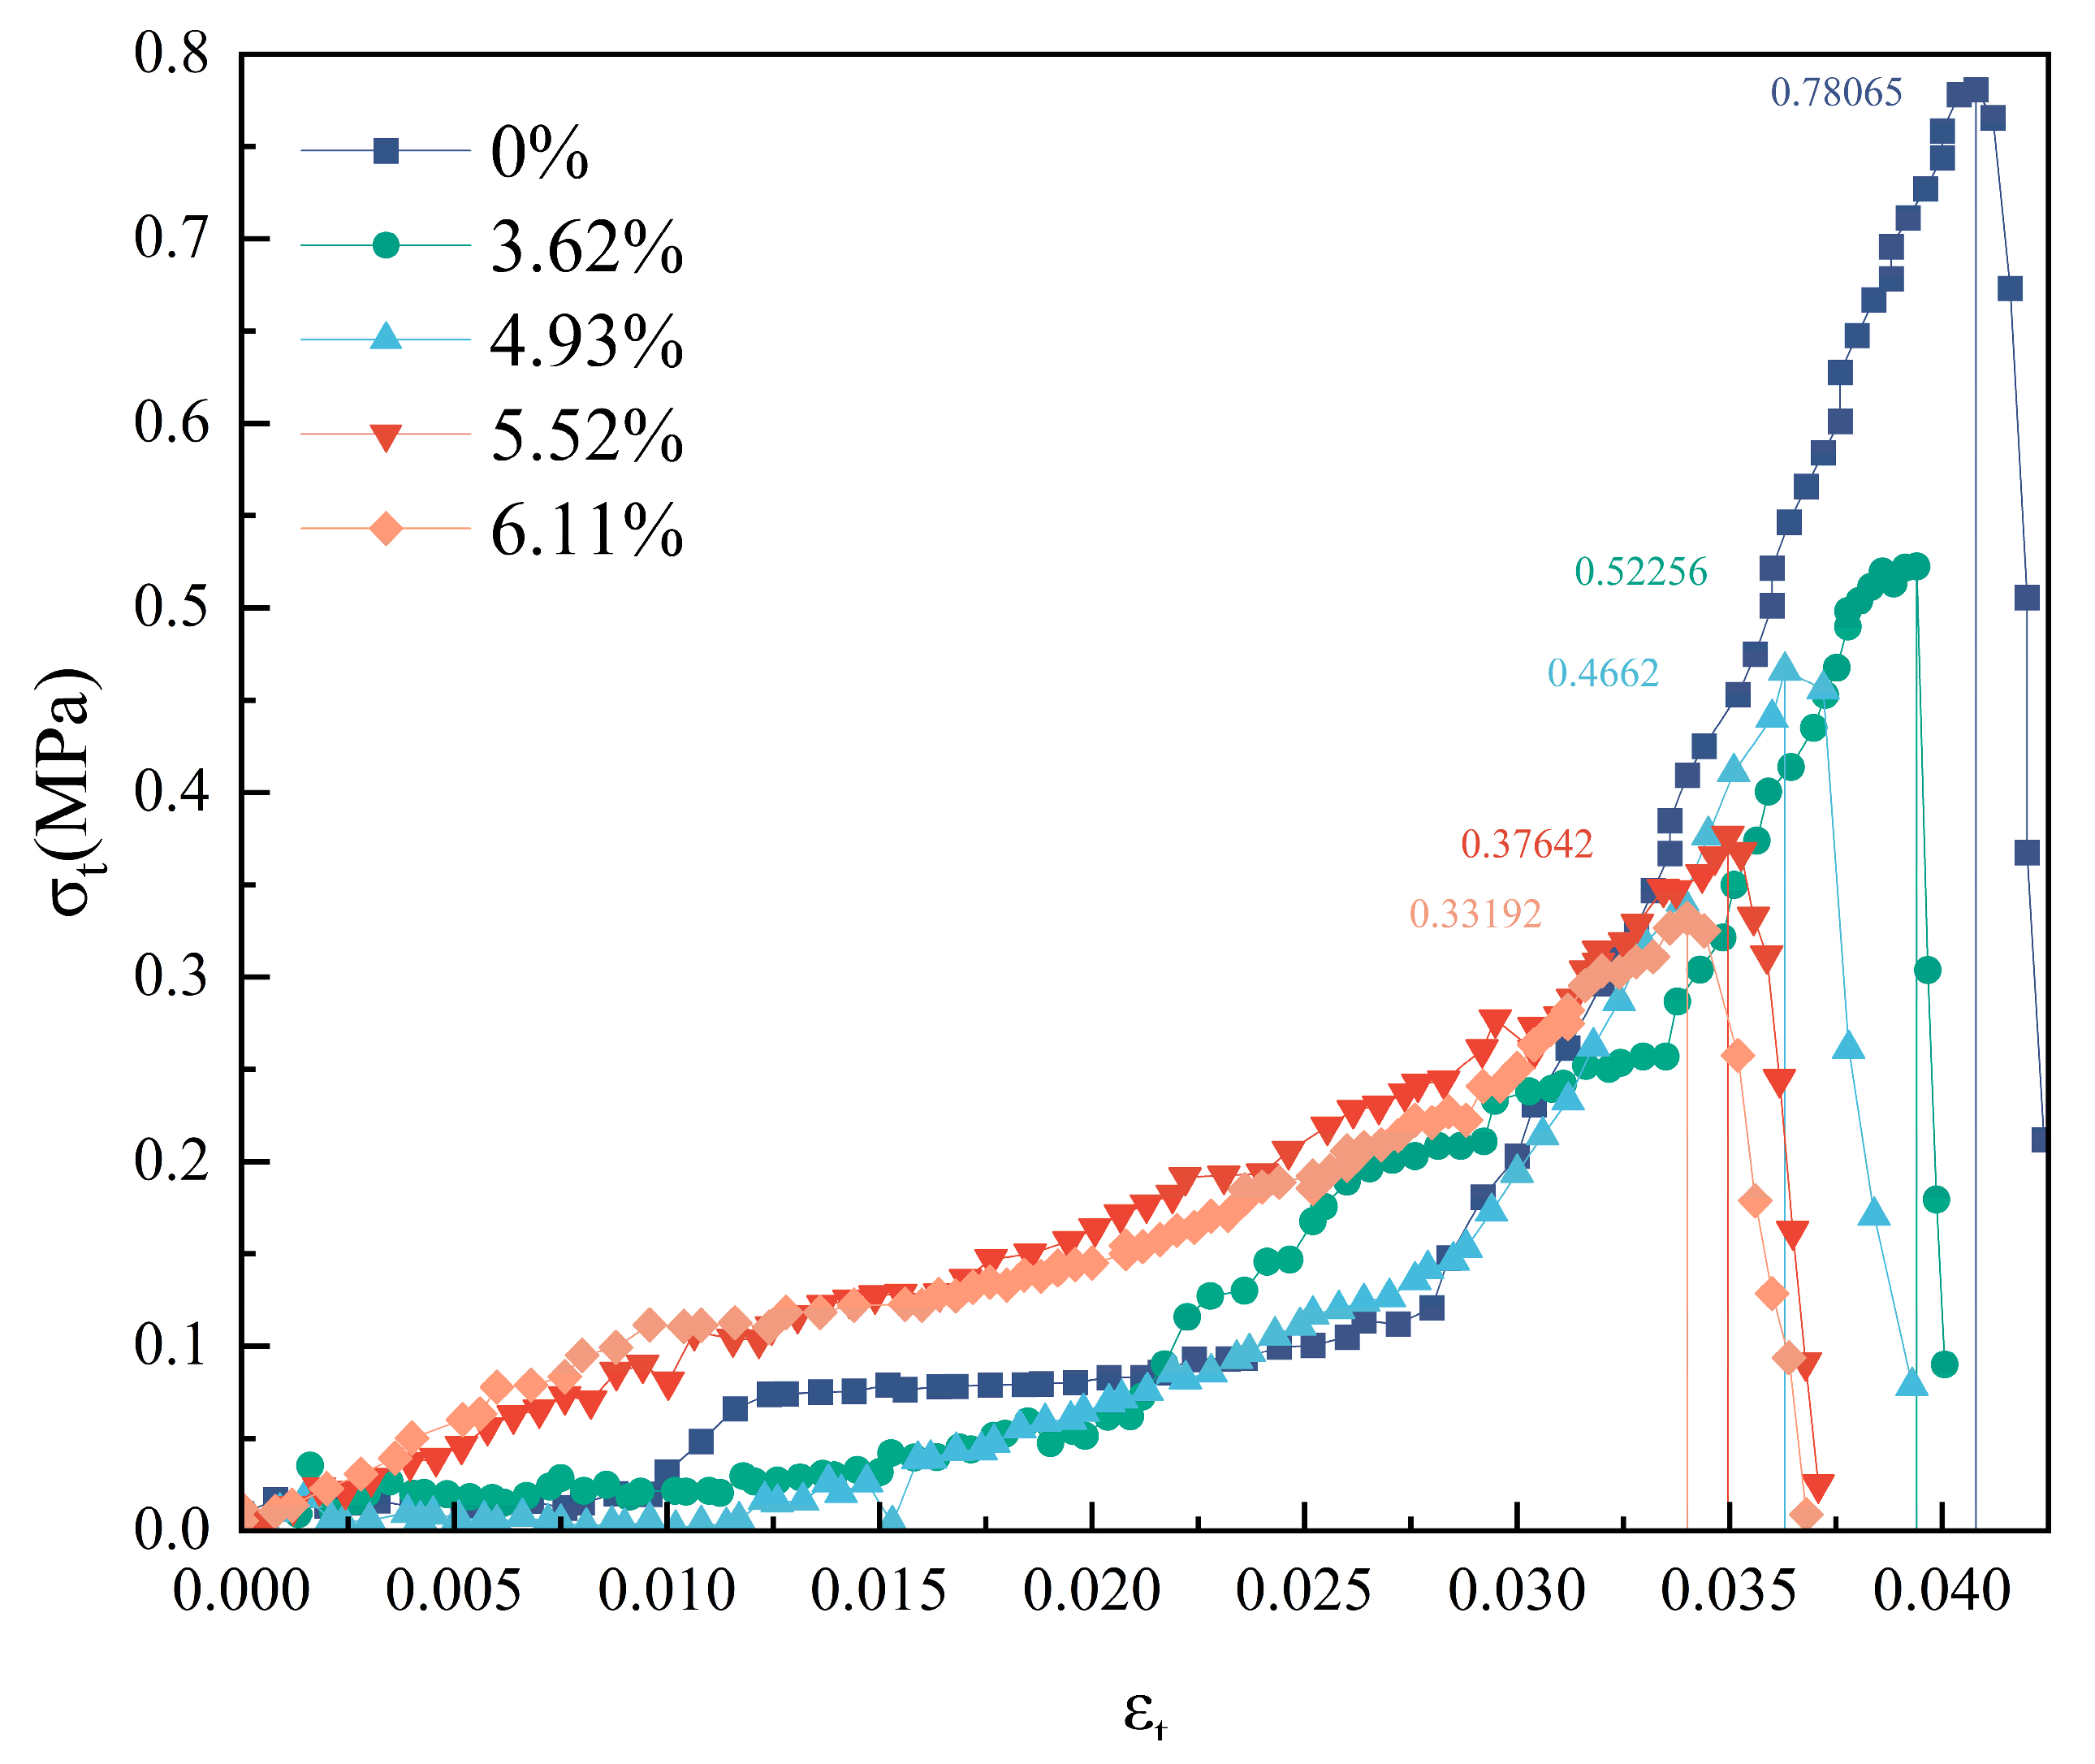
Figure 6 displays the tensile stress–strain curves of coal samples with different moisture contents.
As shown in Figure 6, the mechanical response of the coal sample becomes more stable with higher moisture content, and the stress–strain curve becomes more linear. As the moisture content increases, the coal sample softens, the slope of the stress–strain curve decreases continuously, and the peak strength decreases. However, the stress–strain curve differs in the post-fracture stage. In the post-fracture stage, as the moisture content increases, the peak strain of the coal sample decreases from 0.041 in the dry state to 0.034 in the saturated state. This is because during tensile failure, the cracks preferentially expand along the crack surface with lower strength rather than destroying the entire coal body. Under the condition of low moisture content, the original microcracks in the coal sample can be significantly expanded, and the strain required for tensile failure is reduced.

3.2.2. Tensile Performance

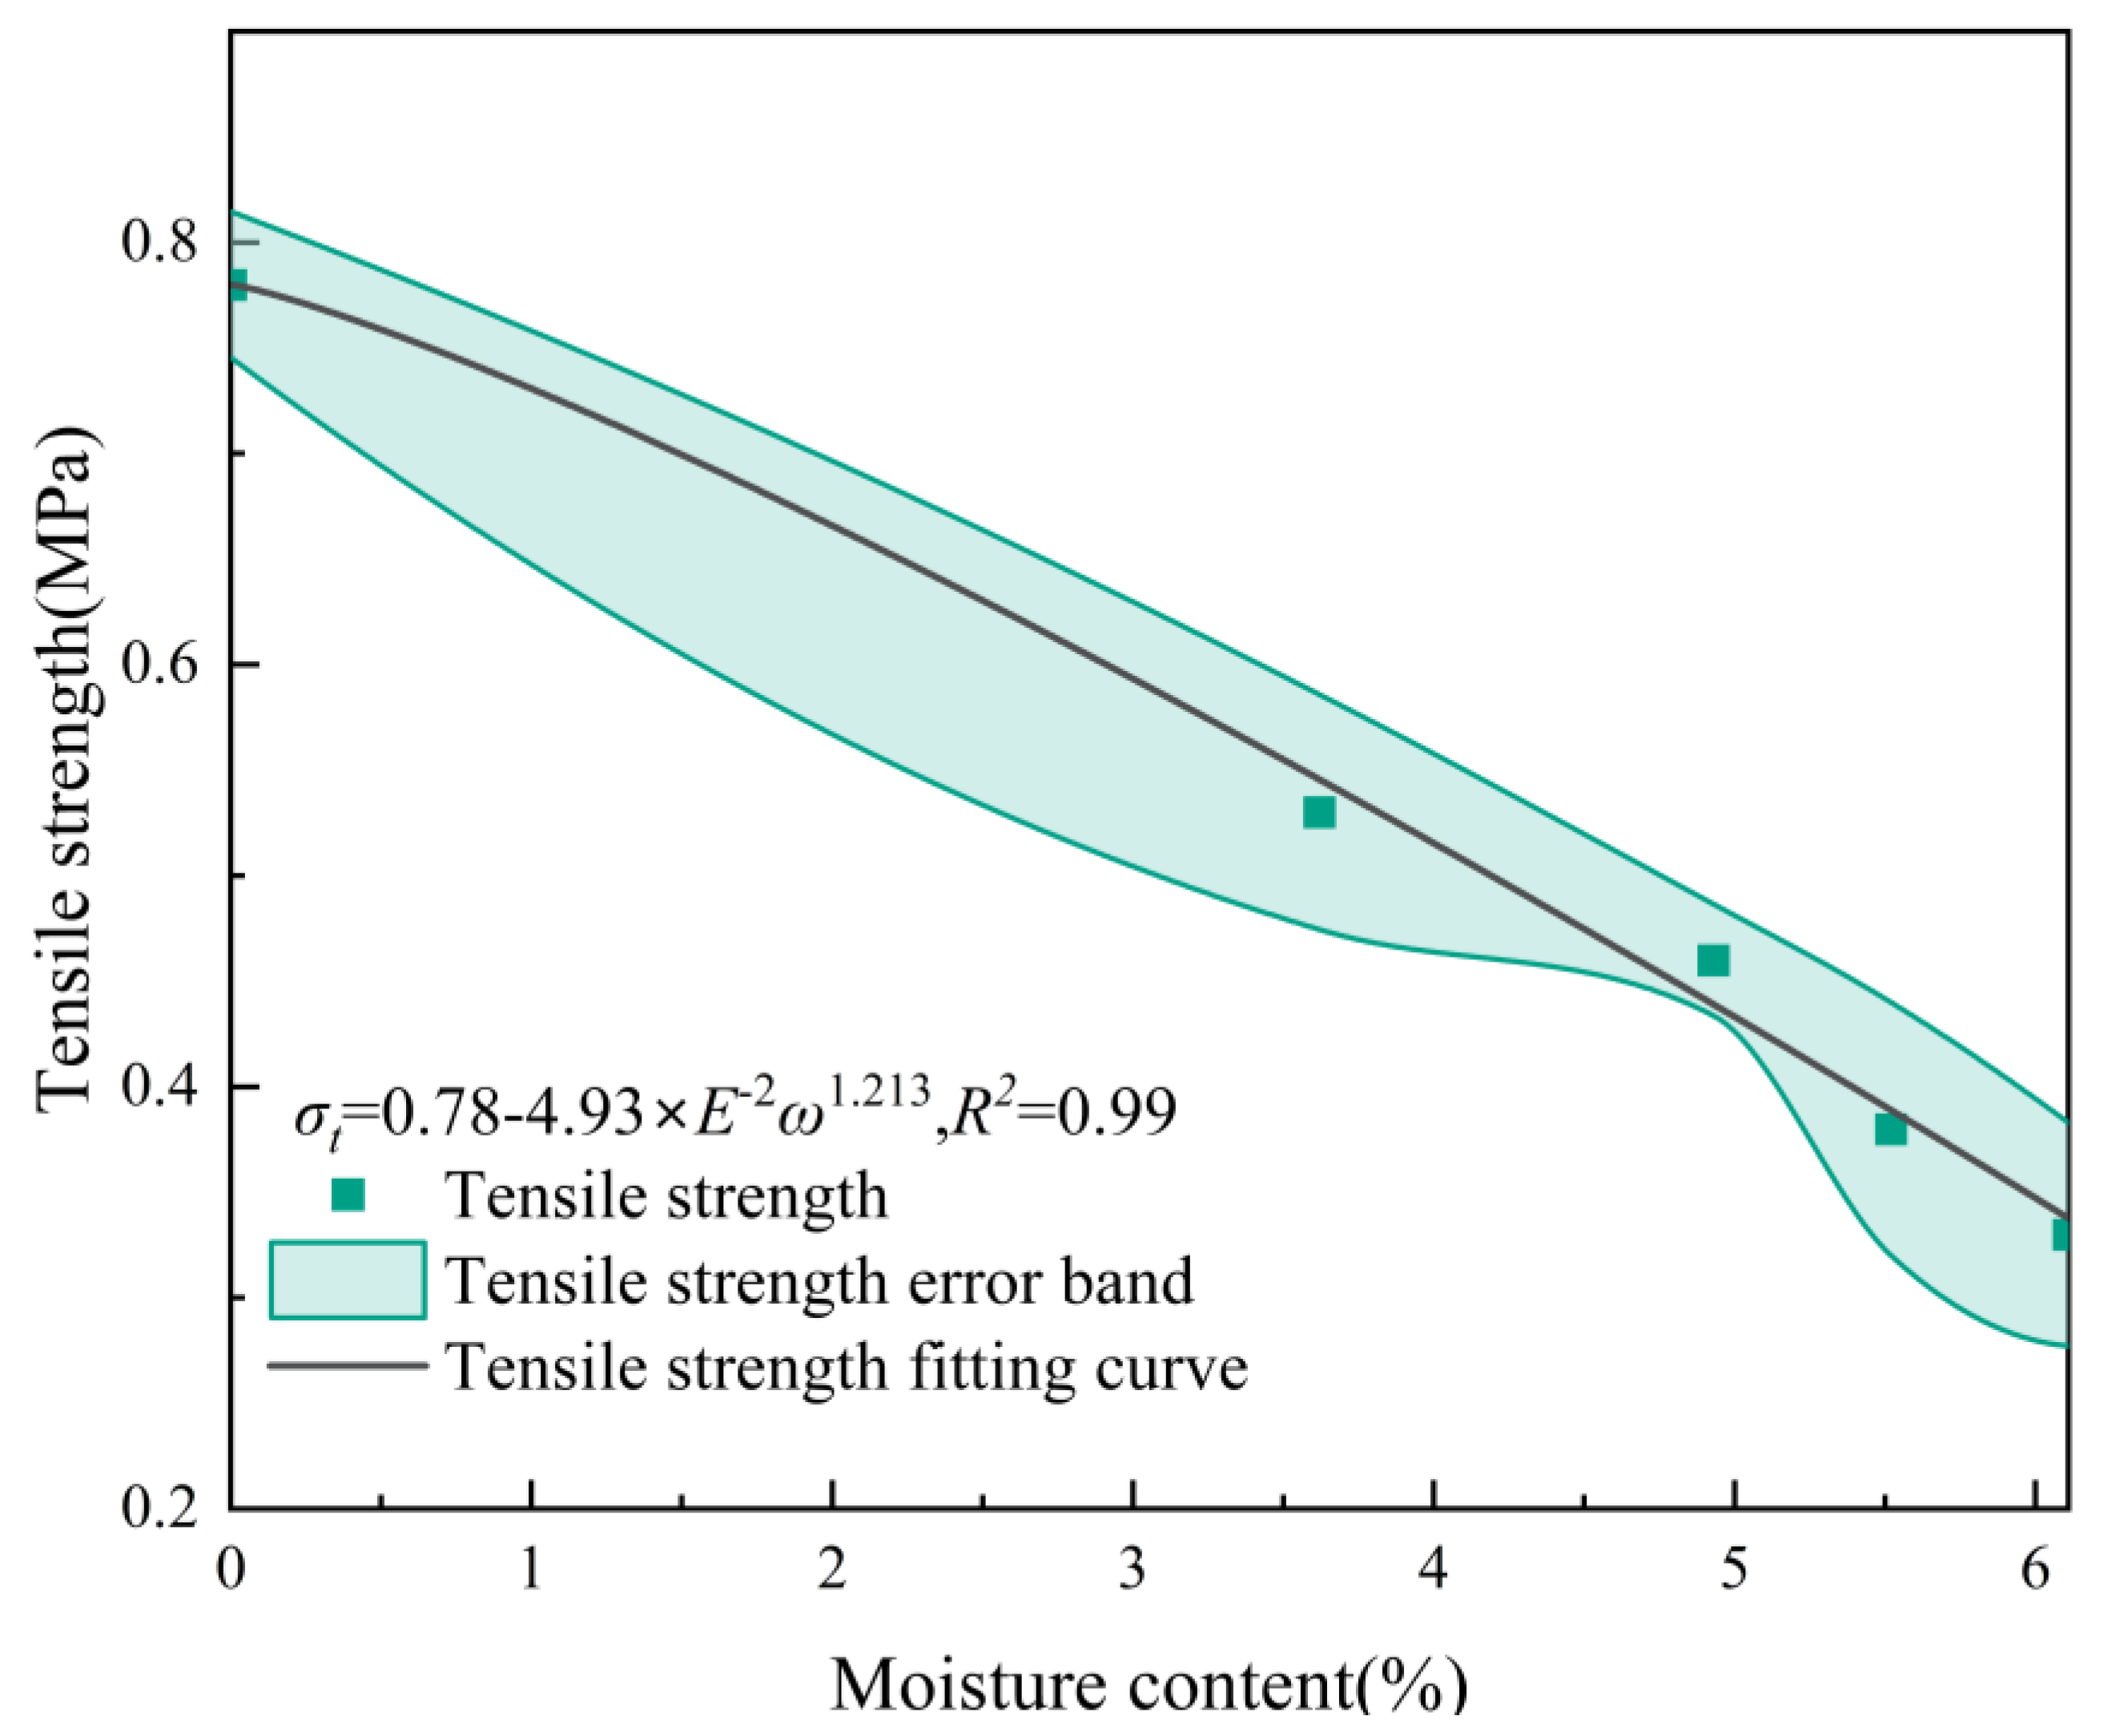
With the increase in moisture content, the tensile strength of the coal sample exhibits a continuous decline. This relationship can be described using a vertically offset power function, showing a negative correlation. From this, the corresponding fitted correlation equation can be derived:
σ t = 0.78 4.93 × E 2 ω 1.213 , R 2 = 0.99
where σ t is the uniaxial tensile strength, MPa.
Figure 7 shows the test results and fitting curves, illustrating the influence of different moisture contents on the reduction in coal samples’ tensile performance.
As described in Figure 7, the tensile strength of the coal sample is negatively correlated with the moisture content. As the coal transitions from a dry condition to a fully saturated state, its tensile strength reduces from 0.78 MPa to 0.33 MPa, a decrease of 57.7%. This shows that the tensile strength of the coal sample deteriorates due to the action of water. The relationship between moisture content and tensile strength in the coal sample follows a linear trend, with no distinct phases observed.

3.3. Effect of Moisture Content on the Shear Performance of Coal Samples

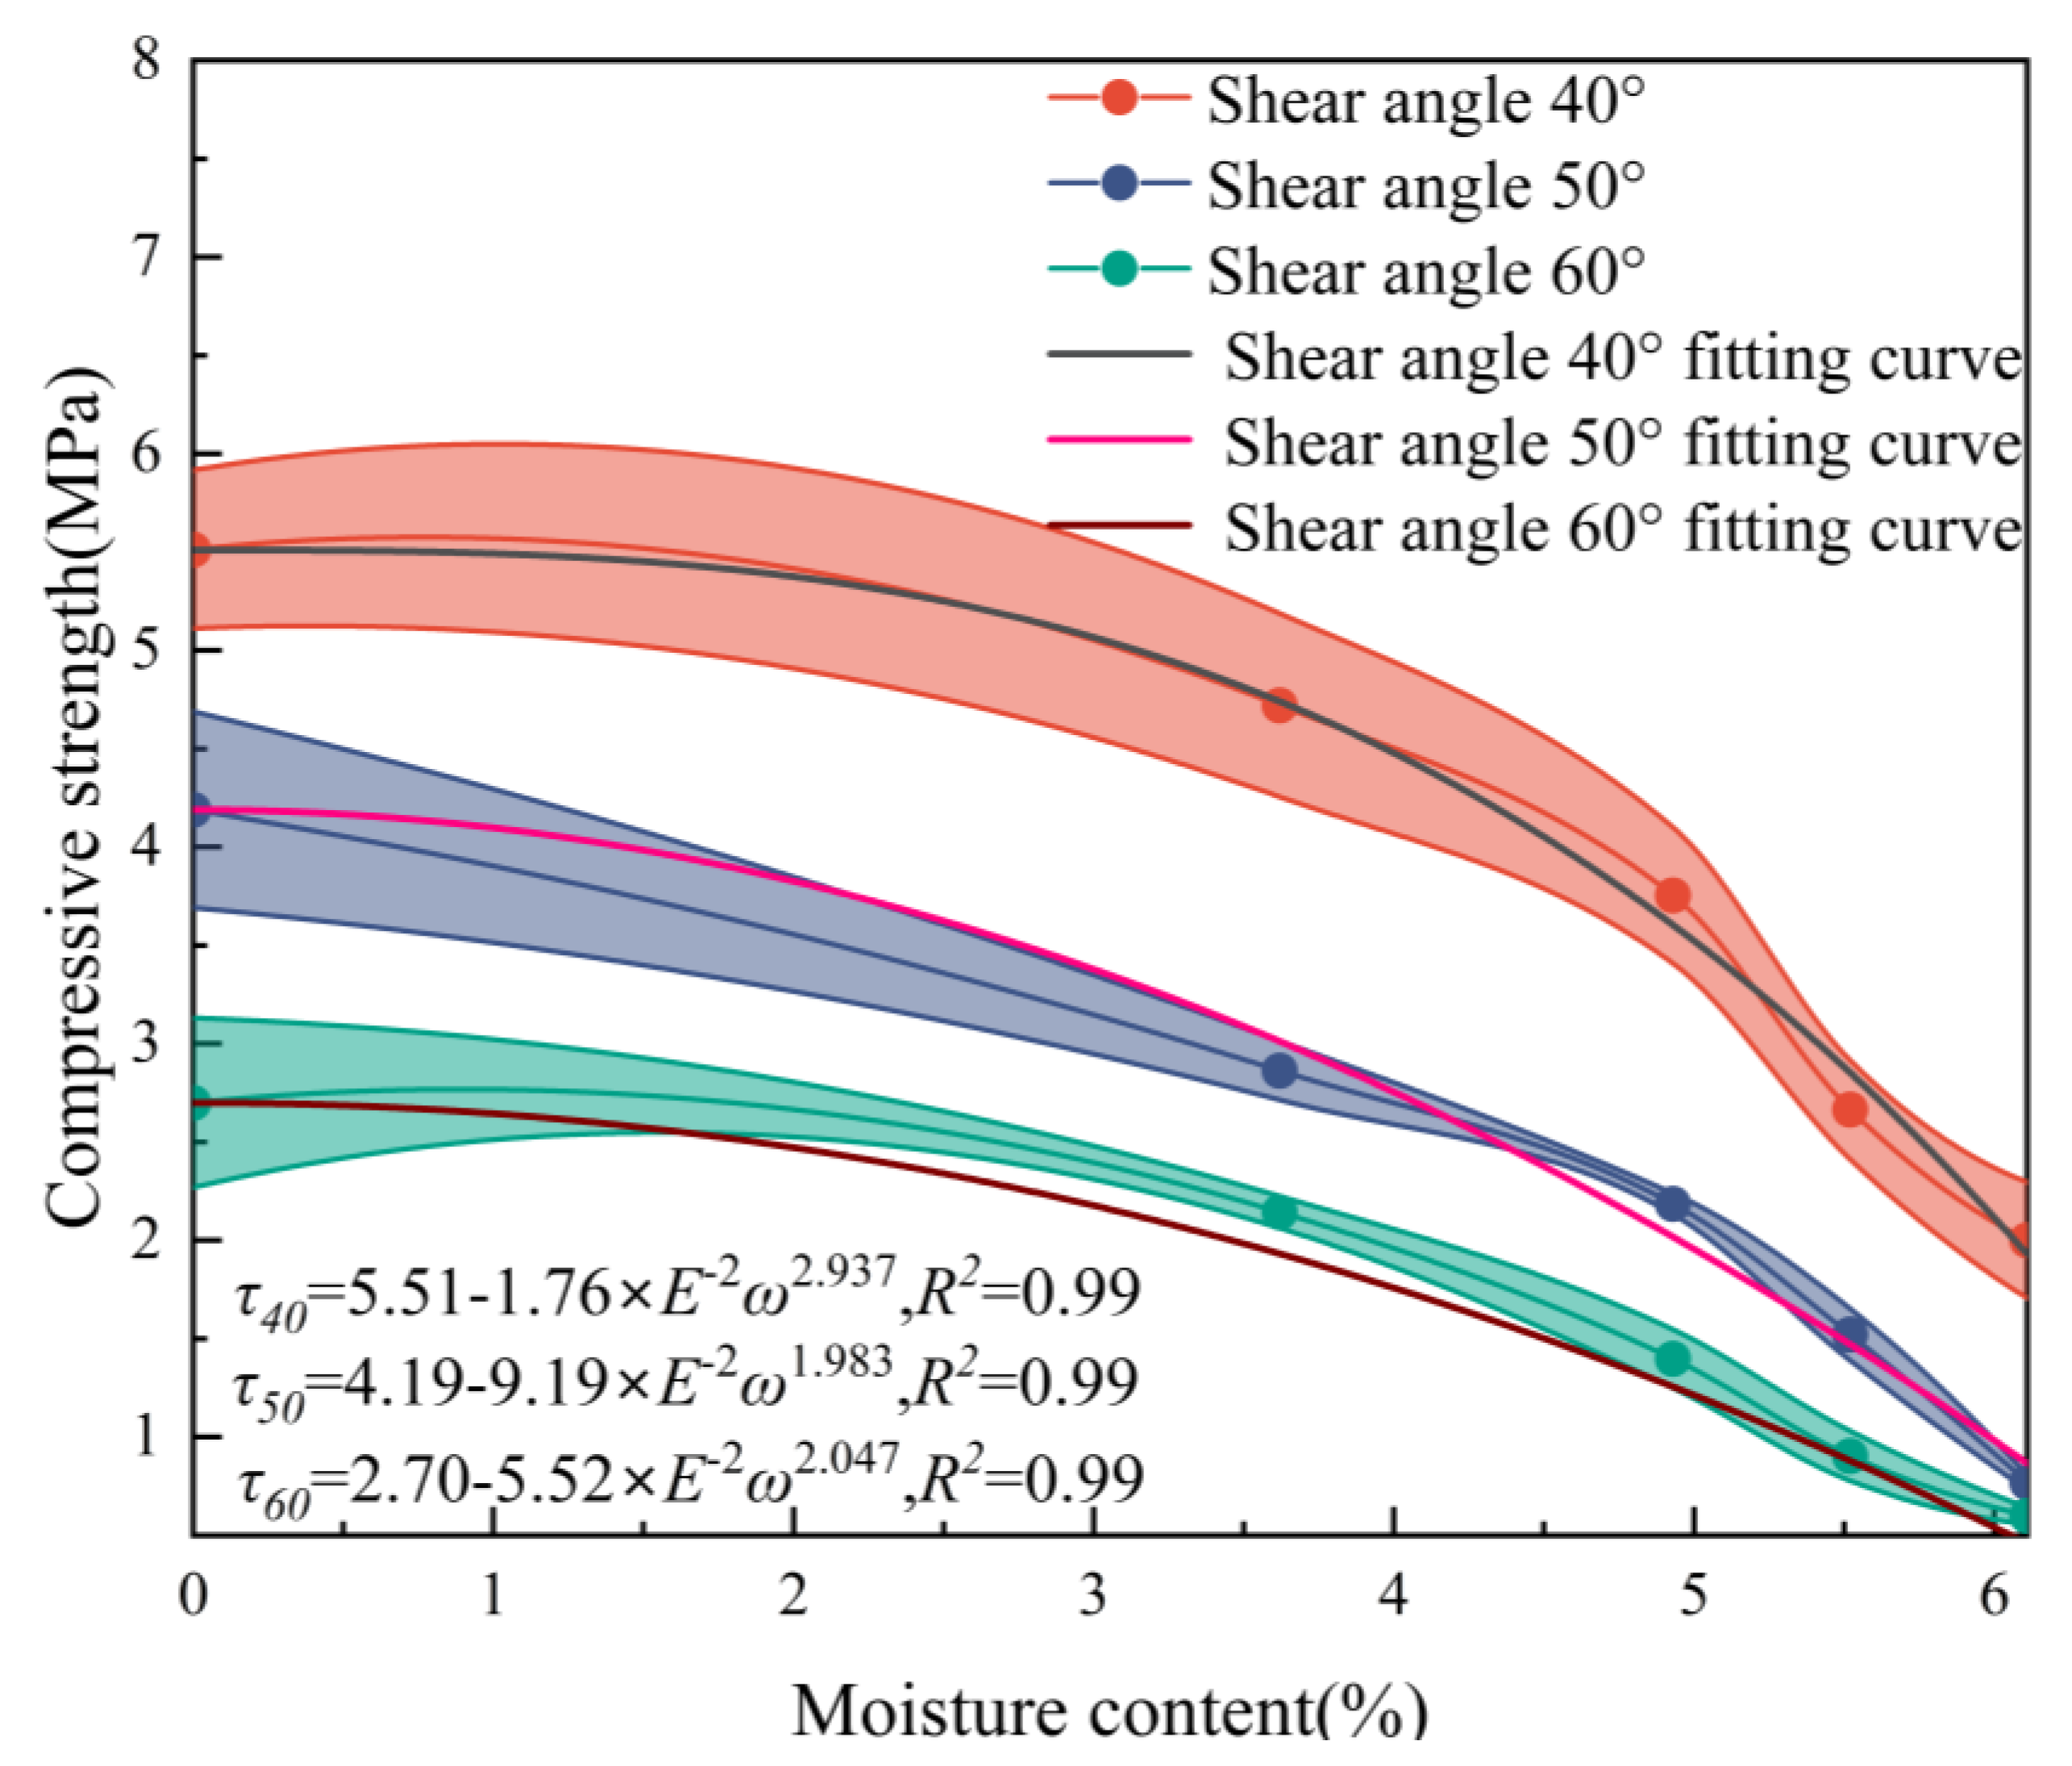
By adjusting the shear angle, peak shear strength test results were obtained for the water-immersed coal samples under different shear angles. The fitting equation is as follows:
τ 40 = 5.51 1.76 × E 2 ω 2.937 R 2 = 0 . 99   τ 50 = 4.19 9.19 × E 2 ω 1.982 R 2 = 0 . 99 τ 60 = 2.70 5.52 × E 2 ω 2 . 047 R 2 = 0 . 99
where τ 40 , 50 , 60 represents the peak shear strength of the water-immersed coal sample under different shear angles.
Figure 8 displays the test results and fitting curves, showing the influence of different moisture contents and shear angles on the reduction in coal samples’ peak shear strength.
As displayed in Figure 8, the peak shear strength of the coal sample is negatively correlated with the moisture content. Under a shear angle of 40°, the moisture content of the coal sample increases from 0% to 6.11%, and the peak shear strength decreases from 5.51 MPa to 2.00 MPa, a decrease of 60.86%. Under a shear angle of 50°, the peak shear strength of the coal sample decreased from 4.19 MPa to 0.77 MPa, a decrease of 81.62%. Under a shear angle of 60°, the peak shear strength of the coal sample decreases from 2.70 MPa to 0.60 MPa, a decrease of 77.78%. Under the three shear angles, the peak shear strength of coal samples similarly varies with moisture content. This indicates that as the moisture content increases, the peak shear strength of coal samples decreases accordingly. Under the five moisture content conditions, the peak shear strength of coal samples varies with the shear angle in a similar manner. Specifically, as the shear angle increases, the peak shear strength of the coal samples decreases accordingly. The reduction in the coal samples’ strength at a shear angle of 50° is significantly higher than that at 40° and 60°. This can be explained as follows: Under a shear angle of 40°, the shear surface is dominated by the composite compression-shear failure, and the higher normal pressure inhibits the expansion of cracks. Under a shear angle of 60°, the shear surface is dominated by tensile failure, with a higher degree of crack development. Under a shear angle of 50°, the mixed failure mode results in a higher level of crack development in coal samples compared to the other two scenarios, with the most significant decrease in peak shear strength.
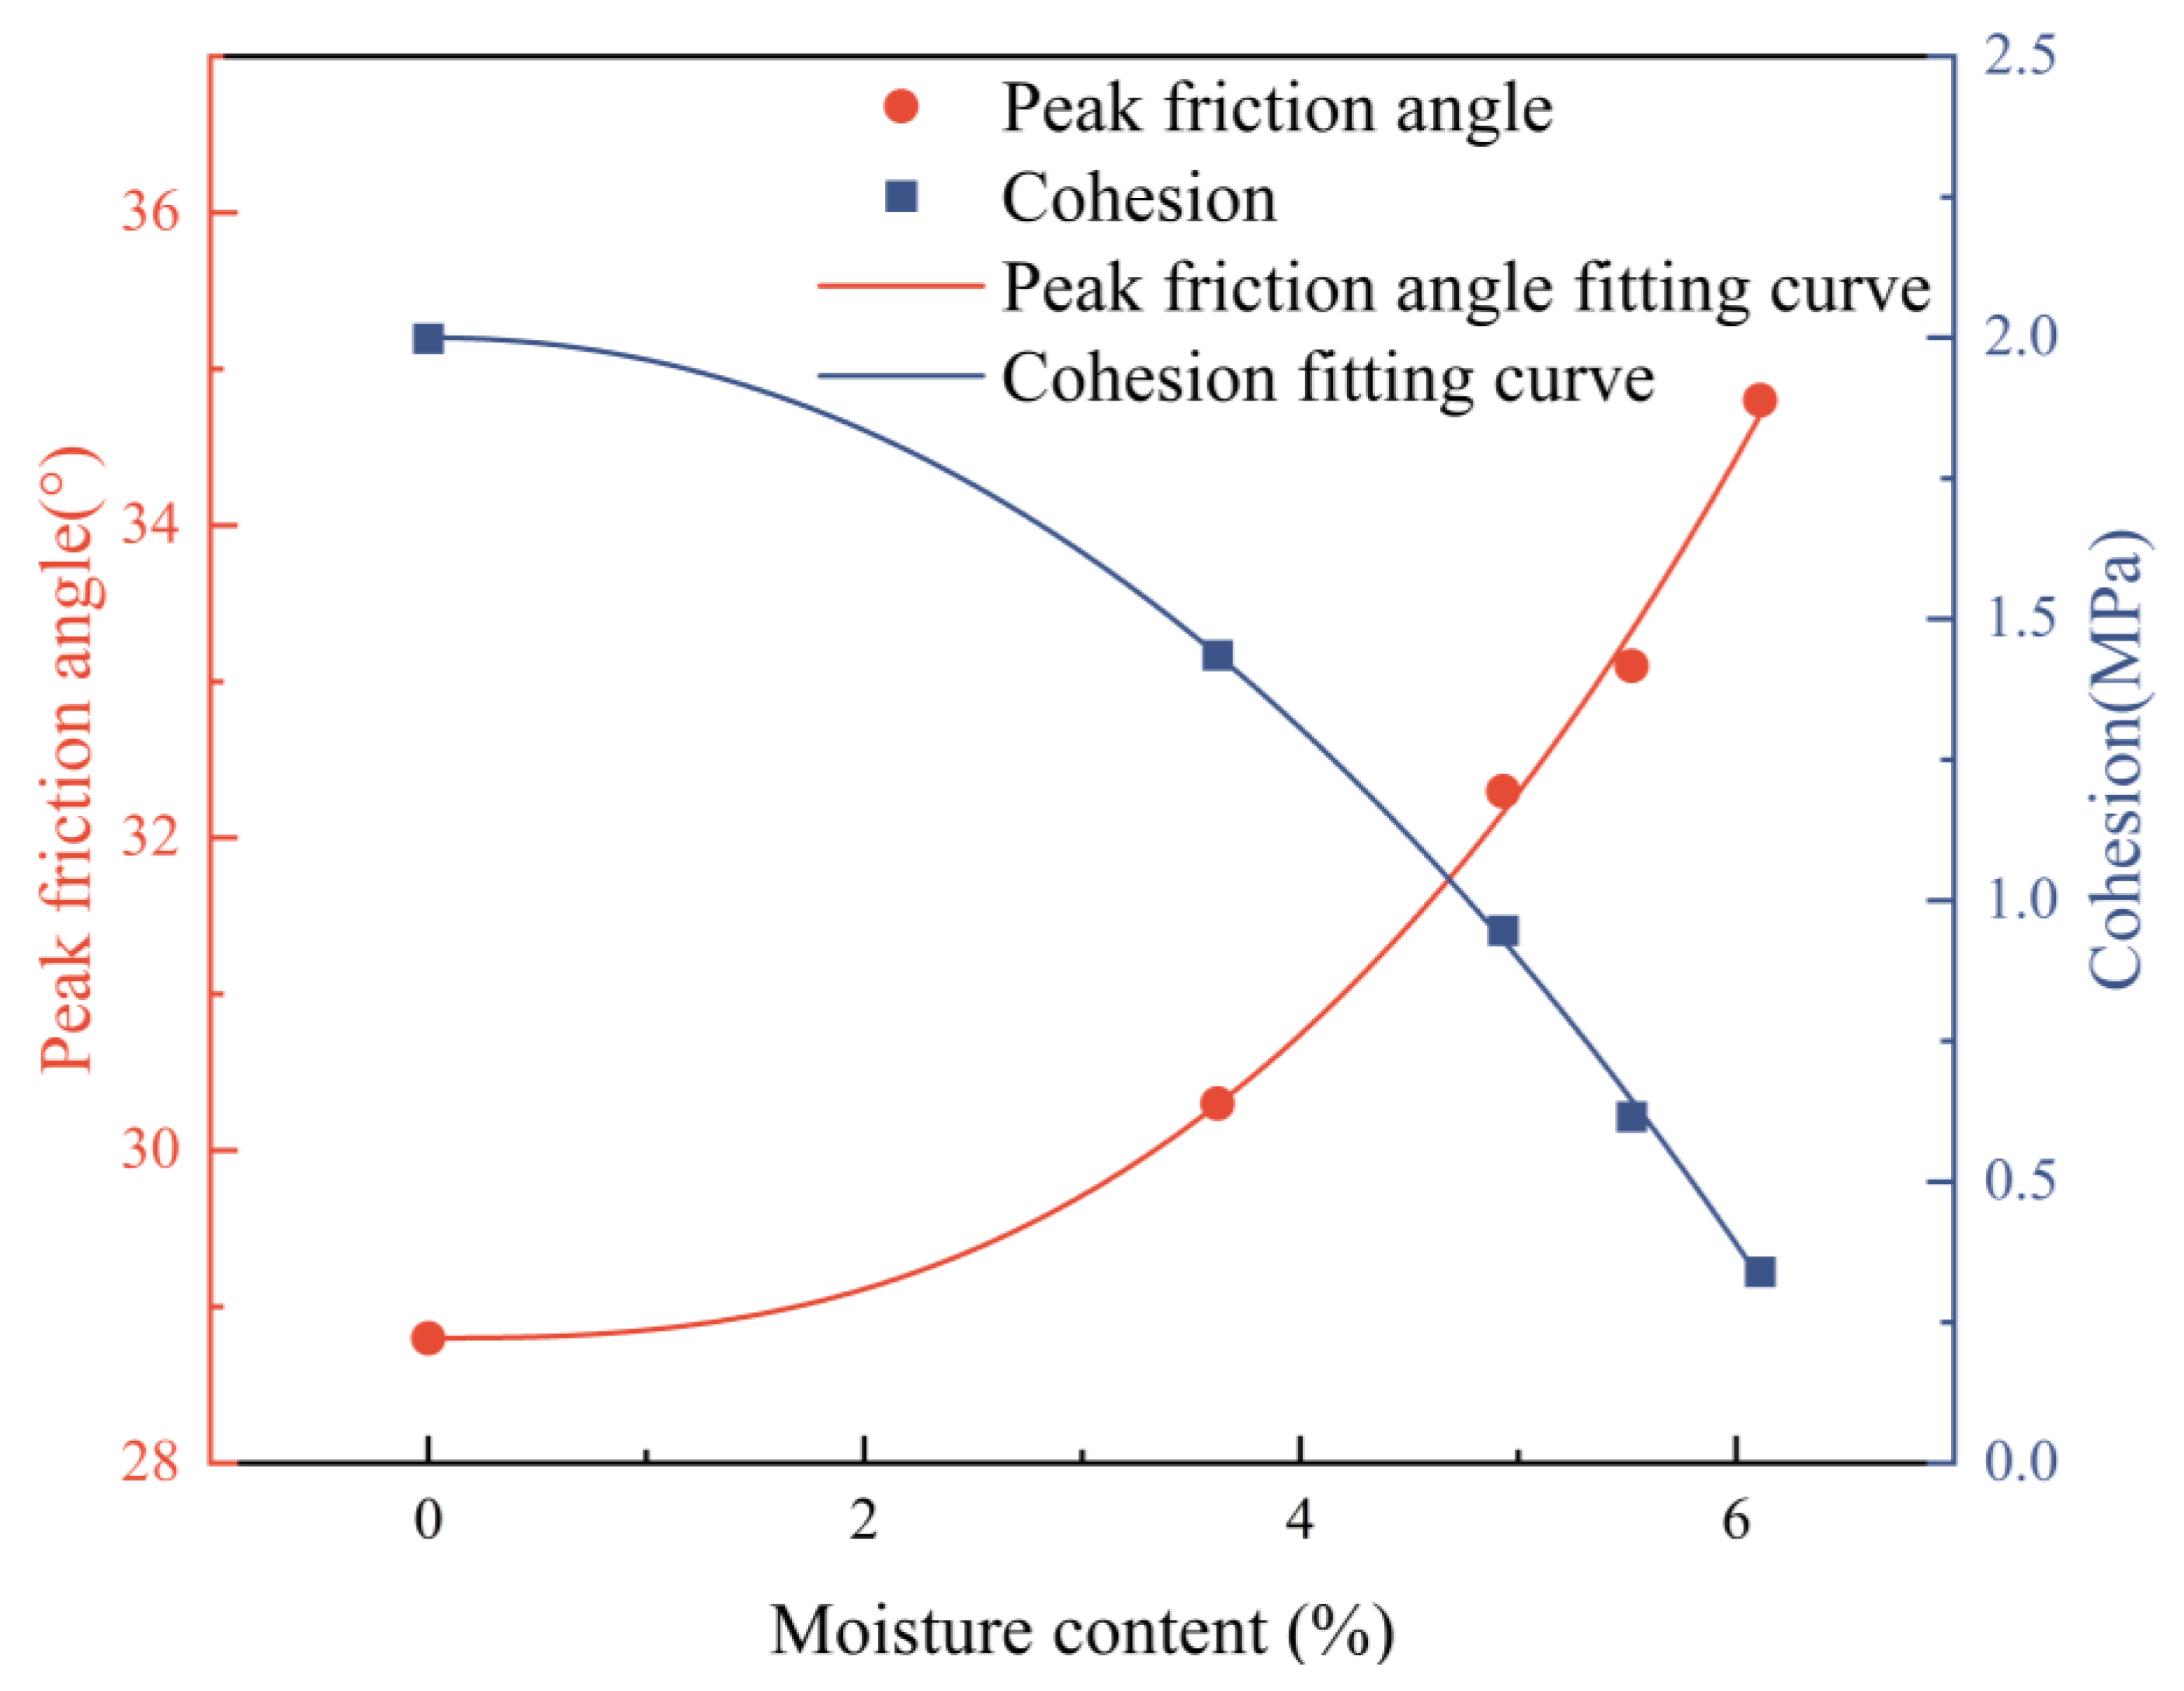
Based on the Mohr–Coulomb shear strength criterion, the peak friction angle and cohesion of coal samples under different moisture contents were obtained and fitted. The equation is as follows:
c = 2.00 3.49 × E 2 ω 2.138 ( R 2 = 0.99 ) φ = 28.81 + 5.11 × E 2 ω 2.326 ( R 2 = 0.99 )
where c represents the cohesion of coal samples with different moisture contents, and φ represents the peak friction angle of coal samples with different moisture contents.
Figure 9 reveals the test results and fitting curves, illustrating the influence of different moisture contents on coal samples’ cohesion and peak friction angle.
As shown in Figure 9, the cohesion of the coal samples is negatively correlated with the moisture content, while the peak friction angle is positively correlated with the moisture content. As the coal sample changes from the dry state to the saturated state, its cohesion decreases from 1.999 MPa to 0.34 MPa, a decrease of 83%. The growth pattern follows a negative power function, exhibiting a slow initial phase followed by a rapid increase. This is because pore water pressure is formed after water penetrates into the pores of the coal body. Consequently, the effective contact stress between coal particles is reduced, mineral dissolution is induced, and the internal cementation structure of the coal body is damaged, thus reducing the cohesion of the coal sample. As the coal sample changes from the dry state to the saturated state, the peak friction angle increases from 28.8° to 34.8°. This growth pattern follows a positive power function type, exhibiting a slow initial phase followed by a rapid increase. This is because water leads to the cementation inside the coal body to dissolve, resulting in a rough morphology on the particle surface. As a result, coal particles are rearranged, and the peak friction angle increases.

4. Degradation Degree for Mechanical Performance of Coal Samples Under Different Moisture Contents and Sensitivity Analysis

4.1. Establishment of Classification Standard for Degradation Degree of Mechanical Performance of Coal Samples

As an organic sedimentary rock, coal exhibits markedly inferior mechanical properties compared to common inorganic rocks. The experimental parameters used in the degradation degree analysis were all average values from previous mechanical tests. To qualitatively evaluate the relationship between the degree of mechanical performance degradation in coal samples and variations in moisture content, a function for calculating the degradation degree of coal samples based on moisture content is proposed and defined as follows [33,34,35]:
S = K i K w i K d i K w i
where S is the degree of deterioration; Ki is the mechanical parameter of the coal sample; Kdi is the mechanical parameter of the dry coal sample; and Kwi is the mechanical parameter of the saturated coal sample.
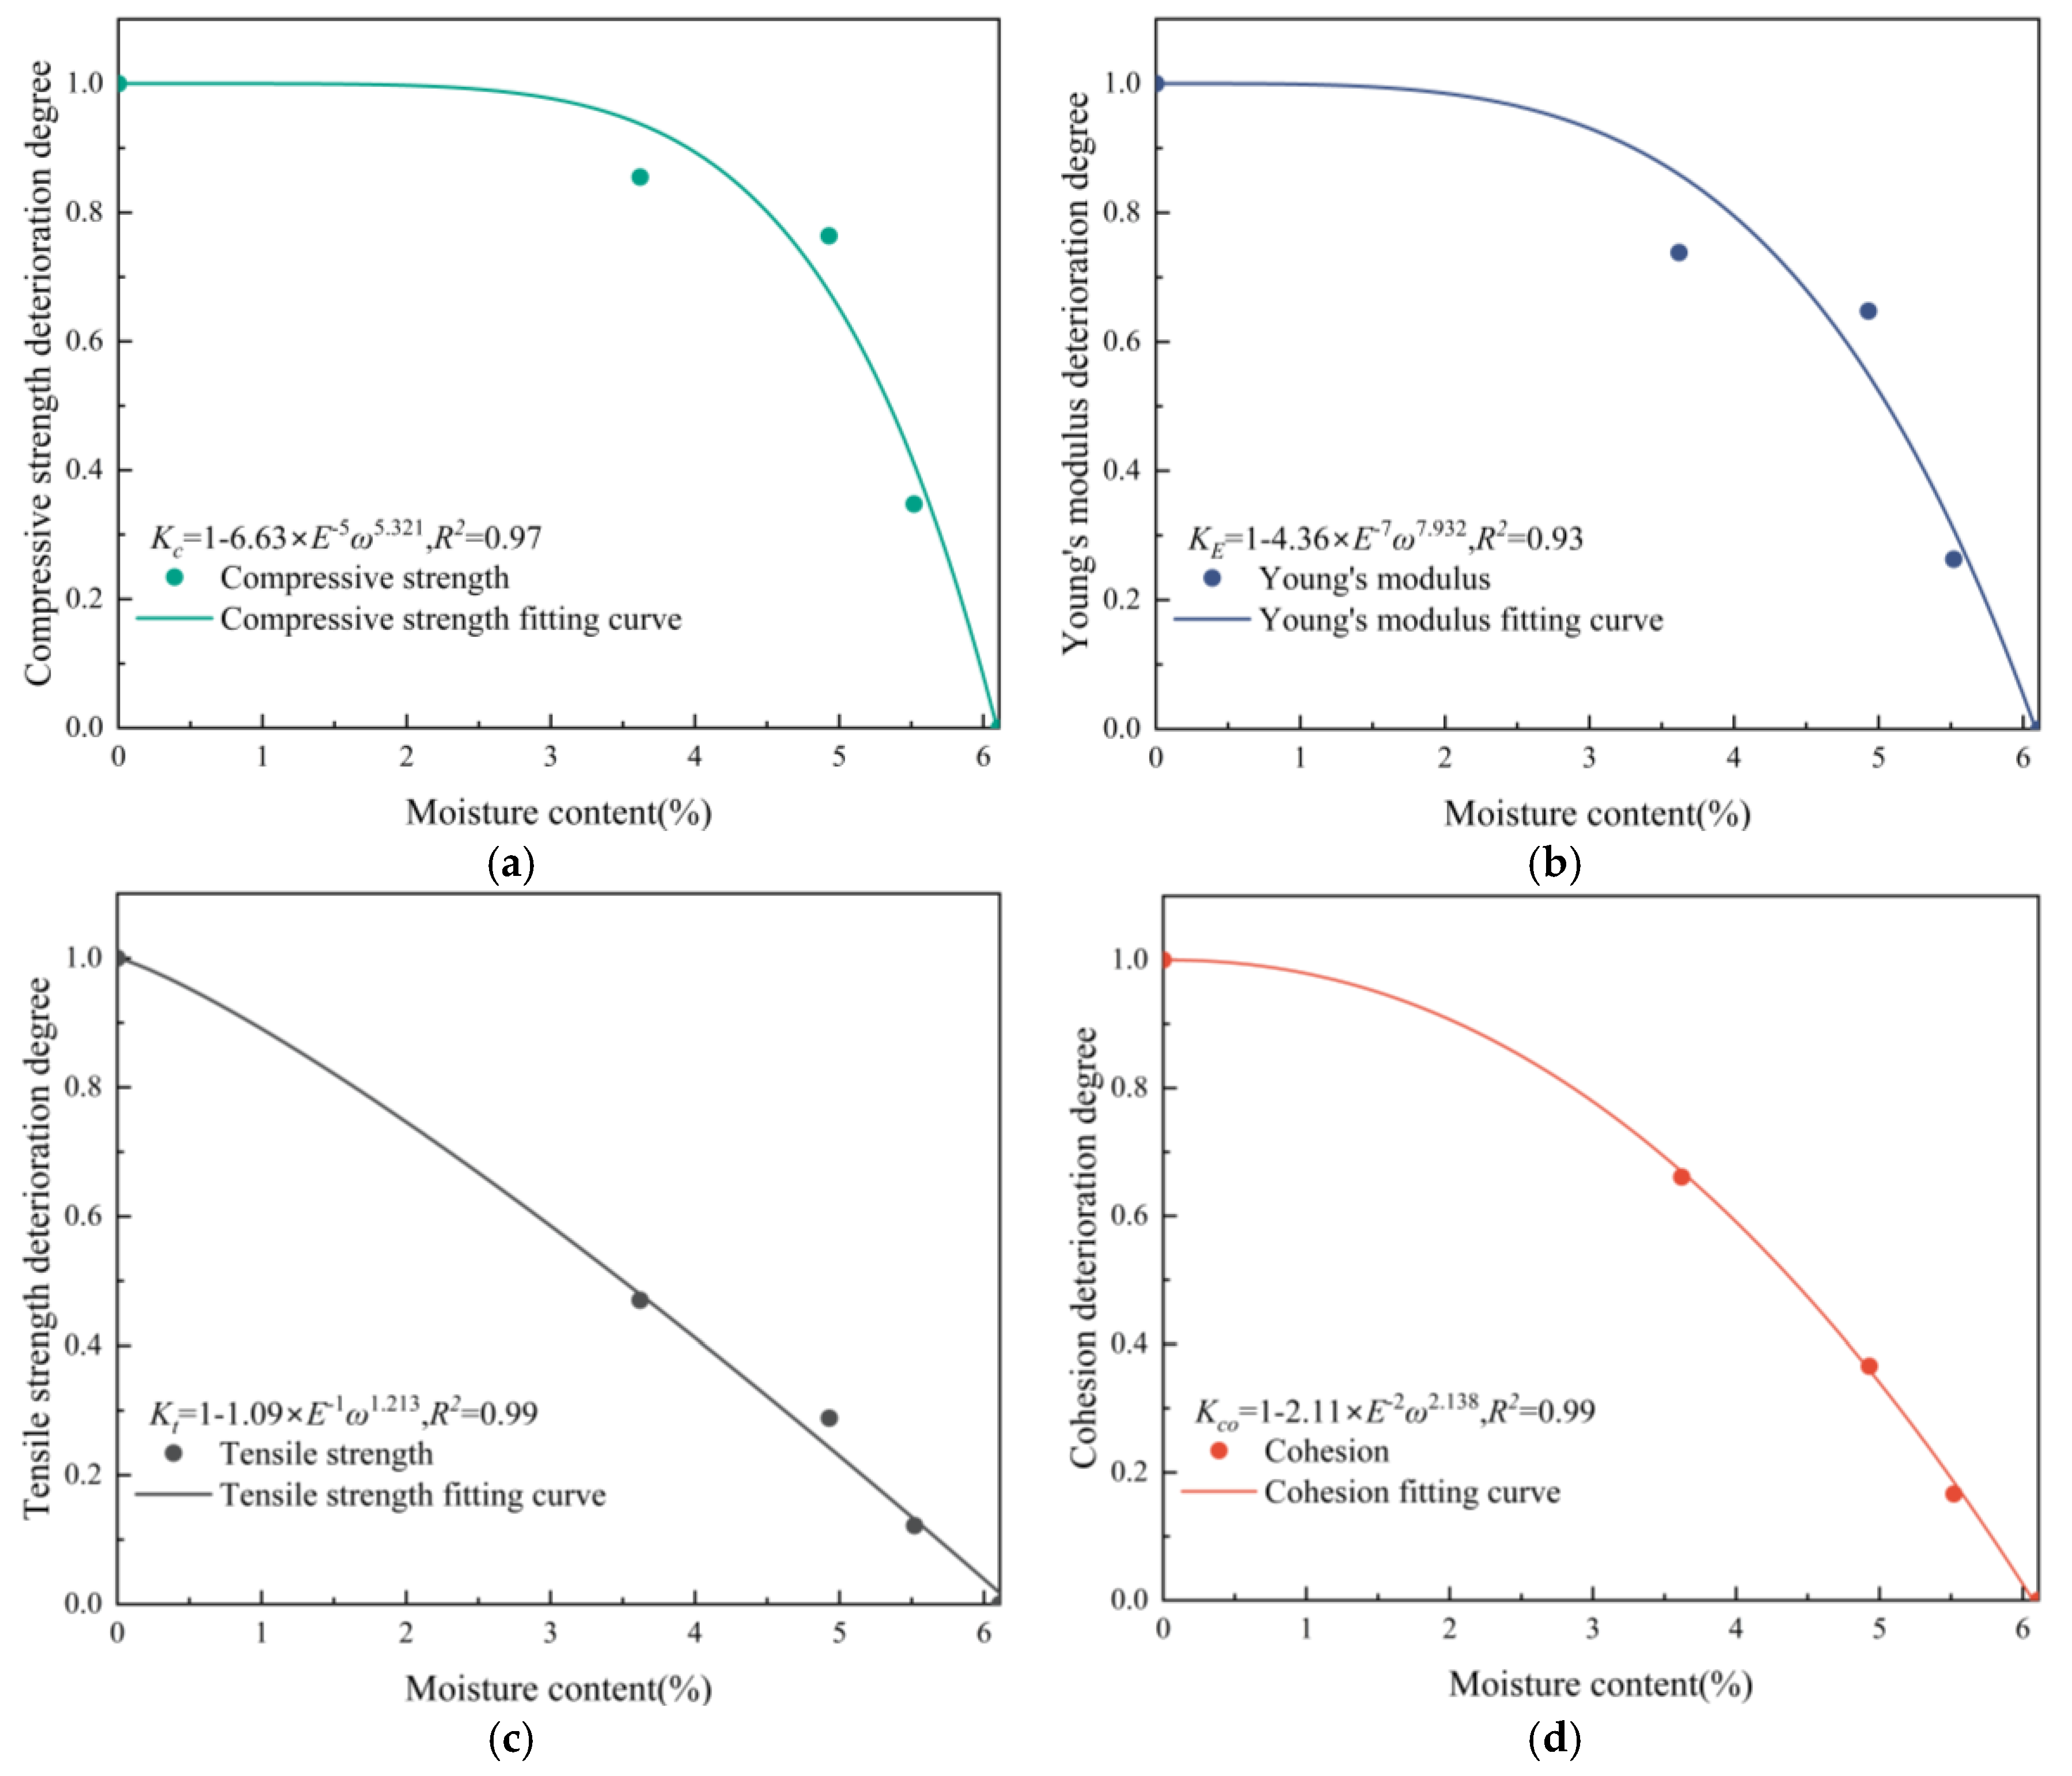
Substituting the test data into the above function, the deterioration degree of the coal sample at different moisture contents is obtained. The relationship between degradation degree and moisture content was obtained by fitting with the vertical offset power function model, as shown in Figure 10. The functional relationship is obtained as follows:
K c = 1 6.63 × E 5 × ω 5.321 , R 2 = 0.97 K E = 1 4.36 × E 7 × ω 7.932 , R 2 = 0.93 K t = 1 1.09 × E 1 ω 1.213 , R 2 = 0.99 K c o = 1 2.11 × E 2 ω 2.138 , R 2 = 0.99
When the coal sample is in a dry state, based on the defined mechanical performance degradation index function, its corresponding degradation index is 1. This indicates that there is no occurrence of mechanical performance degradation. With the increase in moisture content, the S value gradually decreases, indicating that the degradation degree of the peak shear strength of the coal sample gradually increases. When the coal sample is in a saturated state, its corresponding degradation index is 0, indicating that the mechanical performance degradation caused by water has reached its peak.
As shown in Figure 10, with an increase in moisture content, the compressive strength, Young’s modulus, tensile strength, and cohesive deterioration degree of the coal sample all show a continuous downward trend, indicating that the mechanical properties of the coal sample continue to decay with an increase in moisture content. Among them, the distribution position of the compressive strength curve is the highest. In the initial stage, as the moisture content rises from 0% to 3.62%, the reduction in the degradation degree of compressive strength is minimal, reaching only 0.855. When the moisture content increases to 4.93% and 5.52%, the deterioration degree of compressive strength decreases to 0.763 and 0.359. When the moisture content increases from 0% to 3.62%, 4.93%, and 5.52%, the deterioration degree of Young’s modulus decreases to 0.753, 0.677, and 0.266, respectively. As moisture content increases from 0% to 3.62%, 4.93%, and 5.52%, the degradation degree of cohesion decreases to 0.661, 0.366, and 0.166, respectively. When the moisture content increases from 0% to 3.62%, 4.93%, and 5.52%, the degradation degree of tensile strength decreases to 0.444, 0.311 and 0.111, respectively.
This shows that a low moisture content can cause a high degradation in tensile performance, a low degradation in shear performance, and a low degradation in compressive performance. As the moisture content continues to increase, the degradation of tensile performance tends to be stable, the degradation of shear performance increases relatively, and the degradation of compressive performance increases significantly.
Comparing the changes in the degree of deterioration of the four groups with the corresponding mechanical performance parameters, the correlations were found to be 97.46%, 95.42%, 99.23%, and 99.99%, respectively. This indicates a strong, significant correlation between the two sets of data. It can be seen that the degradation degree S of the coal sample can well reflect the degradation degree of the mechanical properties of coal samples at different moisture contents. Considering that the variation law of the mechanical properties of different coal samples with moisture content is related to their own properties, the S values computed from different coal samples vary. However, the overall trends of these variations remain largely consistent. In summary, the degradation degree provides a new means for the study of the mechanical properties of coal samples and lays a foundation for the study of moisture content and mechanical performance sensitivity indicators.

4.2. Sensitivity Index of Mechanical Performance to Moisture Content and Its Stage Division

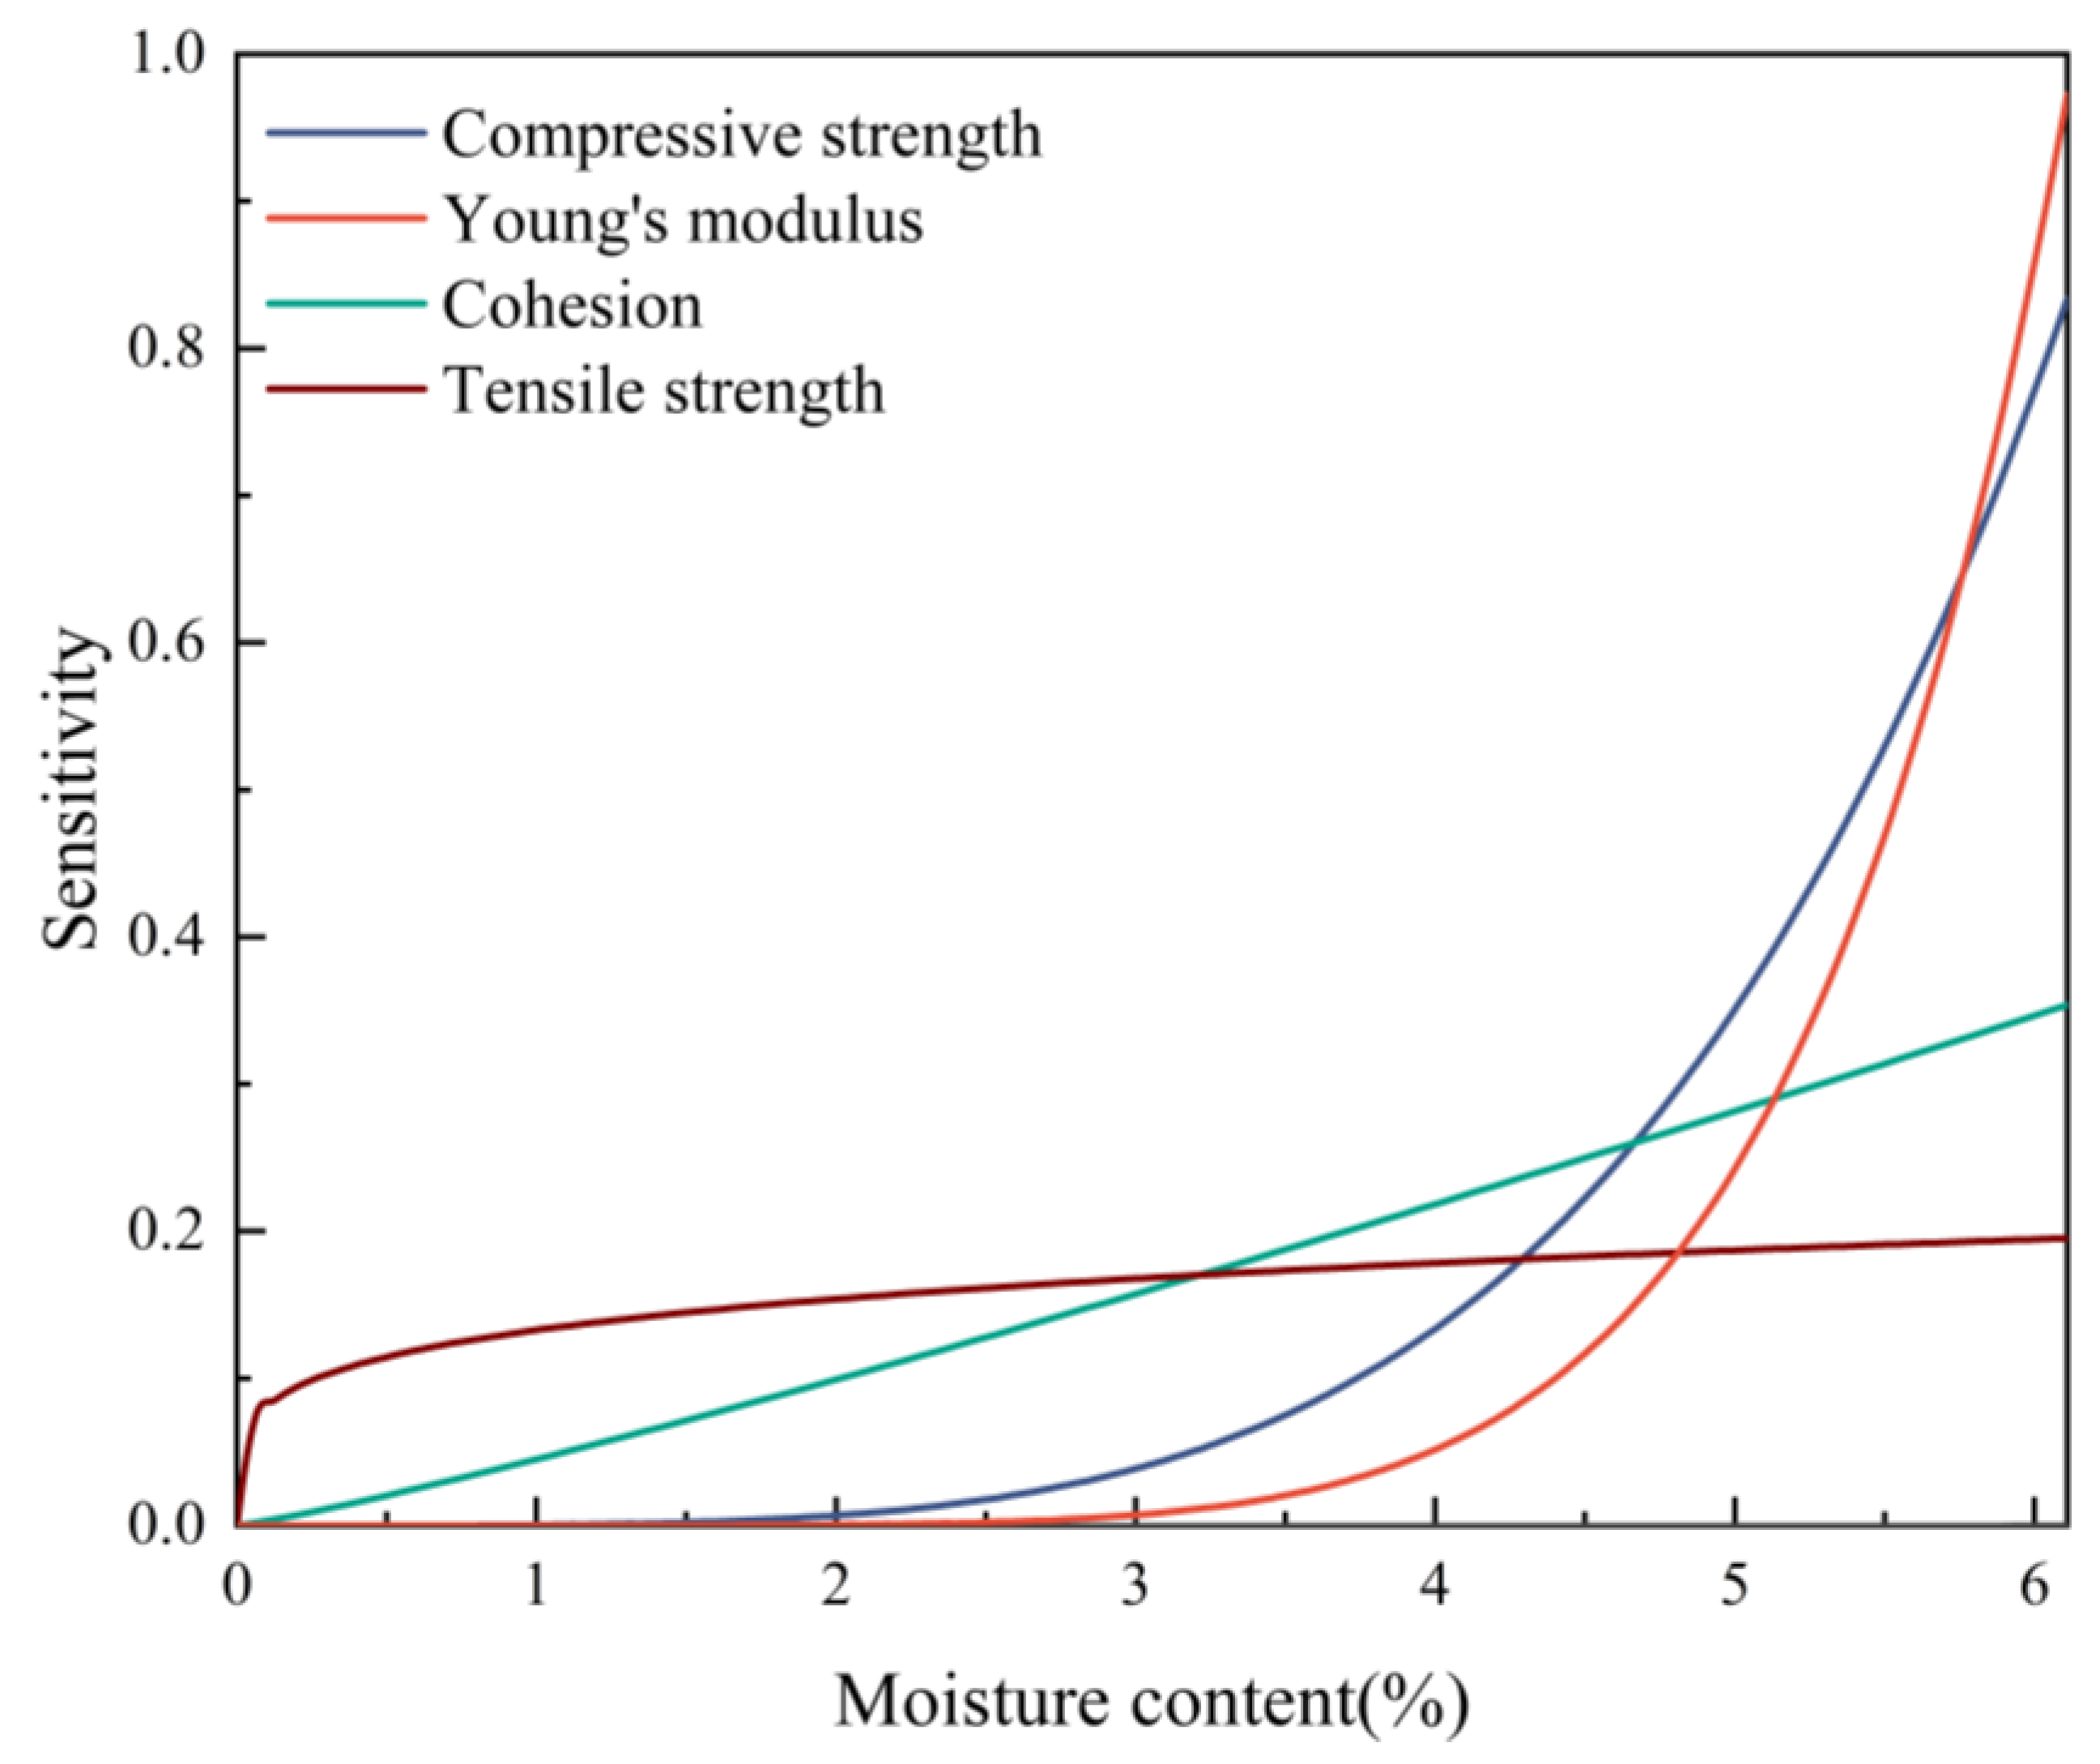
The sensitivity index of mechanical performance to moisture content (SA) is defined as the attenuation rate of the mechanical parameters of the coal sample caused by a unit of moisture content change. It characterizes the dynamic effect of moisture content on the mechanical properties of the coal body, that is, the derivative of the mechanical parameters with the change in moisture content [36]. The fitting curve is shown in Figure 11.
S A c = d σ c d ω = 3.35 × E 4 ω 4.321 S A e = d E d ω = 3.46 × E 6 ω 6.932 S A t = d σ t d ω = 1.33 × E 1 ω 0.213 S A c o = d c d ω = 4.51 × E 2 ω 1.138
where SAc is the sensitivity index of compressive strength to moisture content; SAe is the sensitivity index of Young’s modulus to moisture content; SAt is the sensitivity index of tensile strength to moisture content; and SAco is the sensitivity index of cohesion to moisture content.
As displayed in Figure 11, due to the different deterioration mechanisms of the tensile, compressive and shear properties caused by the water–coal mechanism, the sensitivity shows significant power differences and presents a staged variation law. Among them, the compressive performance is mainly affected by the overall structure and bearing capacity of the coal sample; the shear performance is affected by multiple factors such as the friction angle between particles and the development of cracks and cementation; the tensile performance is often related to local defects, and the promotion effect of water on the expansion of defects is limited. Therefore, it can be divided into four stages according to the changes in its sensitivity index.
When 0% ≤ ω ≤ 3.2%, it is the tensile-sensitive stage. In this stage, the sensitivity index of tensile strength to moisture content is the highest, followed by that of the cohesion, and the sensitivity indexes of compressive strength and Young’s modulus are extremely low. Since the sensitivity index of tensile performance has the lowest power and the sensitivity index of compressive performance has the highest power, the tensile performance plays a dominant role in the initial water immersion stage. When the moisture content reaches 3.2%, the sensitivity index of tensile strength and cohesion of the coal sample both reach 0.169, while that of the Young’s modulus and the compressive strength is only 0.063 and 0.011. At this stage, the coal sample contains a relatively low amount of free water, which primarily congregates at the crack tips, thereby increasing the likelihood of local defect formation. Given the limited moisture content, its capacity to alter clay minerals and reduce cohesion is restricted, making it challenging to damage the coal body skeleton.
When 3.2% ≤ ω ≤ 4.3%, it is the shear-sensitive stage. At this stage, the sensitivity index of cohesion is the highest, followed by that of tensile strength, and the sensitivity indexes of compressive strength and Young’s modulus are extremely low. After the moisture content reaches 3.2%, the sensitivity index of cohesion becomes greater than that of tensile strength, with shear resistance becoming the dominant factor. When the moisture content reaches 4.3%, the sensitivity index of cohesion of the coal sample reaches 0.234, while the sensitivity indexes of tensile strength and compressive strength both reach 0.181. In contrast, the sensitivity index of the Young’s modulus is only 0.079. At this point, the coal sample holds a considerable amount of free water, and the cracks are widened, leaving limited room for further expansion. In the opinion of the authors, the pore spaces have not been fully saturated with water, resulting in minimal pore water pressure. However, a large amount of clay minerals is dissolved, and the shear performance is significantly deteriorated.
When 4.3% ≤ ω ≤ 5.1%, it is the compressive catch-up stage. In this stage, the sensitivity index of cohesion is the highest, followed by the sensitivity index of compressive strength, and the sensitivity indexes of tensile strength and Young’s modulus are the lowest. After the moisture content reaches 4.3%, the shear performance still plays a leading role, while the sensitivity index of compressive strength exceeds that of tensile strength and increases at a rapid pace. When the moisture content reaches 5.1%, the sensitivity indexes of compressive strength reach 0.389, those of cohesion and compressive strength are both 0.287, and that of tensile strength is only 0.188. At this stage, the free moisture content in the coal sample is relatively high, and the effective stress in the coal sample is gradually reduced through the pore water pressure, making it more susceptible to shear failure. Concurrently, the porosity of the coal sample continues to increase, the coal sample undergoes slight structural damage, and the bearing capacity is weakened.
When 5.1% ≤ ω ≤ 6.1% (saturated moisture content), it is the compression-sensitive stage. In this stage, the sensitivity index of compression performance is the highest, that of shear performance is second, and that of tensile performance is the lowest. After the moisture content reaches 5.1%, the compressive performance plays a leading role, and its sensitivity index increases rapidly. When the moisture content reaches 6.1%, the sensitivity indexes of compressive strength and Young’s modulus reach 0.834 and 0.972, while those of cohesion and tensile strength are only 0.354 and 0.195. At this stage, the structure of the coal sample is severely damaged, a large number of pores are connected, the mineral skeleton collapses, and the bearing capacity decreases significantly.

5. Conclusions

In this study, the deterioration effect of water on coal pillar dams in underground reservoirs was investigated. Coal samples with different moisture contents were taken as research objects. The tensile, compressive, and shear properties of coal samples with different moisture contents were tested. The influence of moisture content on the mechanical properties of coal samples was studied, and the evolution of the degradation degree of the mechanical properties of coal samples with different moisture contents was evaluated. These findings carry significant engineering implications for underground reservoir construction and related geotechnical engineering fields. The main conclusions are as follows:
(1) The moisture content of coal samples increases with an increase in immersion time, and the immersion process can be divided into three stages based on the water absorption rate of coal samples after immersion: the early immersion stage, the late immersion stage, and the stable stage. In the early stage, the moisture content of the coal sample increases almost linearly with an increase in immersion time, and the growth rate is relatively fast. In the later stage, the moisture content of the coal sample increases logarithmically with the increase in immersion time, and the growth rate is relatively slow. After approximately 72 h of immersion, the stable stage is reached. In this stage, the moisture content of the coal sample remains unchanged as it becomes fully saturated.
(2) Under the uniaxial compression load, the coal sample undergoes four stages: the pore crack compaction stage, linear elastic deformation stage, unstable fracture development stage and post-fracture stage. Because water induces dissolution and erosion, the coal samples’ stress–strain curves and failure characteristics vary according to the moisture content, and the compressive performance of the coal sample deteriorates significantly with an increase in moisture content.
(3) The variation patterns of the peak shear strength of coal samples at three different shear angles are consistent, indicating that the peak shear strength of coal samples decreases with an increase in moisture content. When the shear angle increases, the coal samples’ peak shear strength decreases. There is a negative correlation between the cohesion of coal samples and moisture content, while there is a positive correlation between the peak friction angle of coal samples and moisture content.
(4) A method to calculate the deterioration degree of coal samples is proposed. A vertical offset power function model is utilized to establish the relationship between the coal samples’ moisture content and their degree of deterioration. Based on the sensitivity analysis, the variation in the mechanical performance of water-containing coal samples is divided into four stages according to the moisture content: the tensile-dominated stage, the shear-dominated stage, the compressive catch-up stage, and the compression-dominated stage.

Author Contributions

Conceptualization, M.L.; original draft preparation, Y.Z., Z.Y., L.W. and Y.W.; review and editing, M.L., Z.Y. and S.X.; funding acquisition, M.L., Y.Z. and L.W. All authors have read and agreed to the published version of the manuscript.

Funding

This work is supported by Open Fund of State Key Laboratory of Water Resource Protection and Utilization in Coal Mining (Grant No. GJNY-20-113-02).

Institutional Review Board Statement

Not applicable.

Informed Consent Statement

Not applicable.

Data Availability Statement

Data are contained within the article.

Acknowledgments

The authors thankfully acknowledge the support and facilities provided by China University of Mining and Technology and State Key Laboratory of Water Resource Protection and Utilization in Coal Mining.

Conflicts of Interest

The authors declare no conflicts of interest.

References

  1. Liu, X.X.; Zeng, Y.F.; Wu, Q.; Meng, S.H.; Liang, J.Y.; Hou, Z.P. Ecological-based mining: A coal–water–thermal collaborative paradigm in ecologically fragile areas in western China. Engineering 2024, 38, 209–222. [Google Scholar] [CrossRef]
  2. Zeng, Y.F.; Meng, S.H.; Wu, Q.; Mei, A.S.; Bu, W.Y. Ecological water security impact of large coal base development and its protection. J. Hydrol. 2023, 619, 129319. [Google Scholar] [CrossRef]
  3. Chi, M.B.; Zhang, D.S.; Zhao, Q.; Yu, W.; Laing, S.S. Determining the scale of coal mining in an ecologically fragile mining area under the constraint of water resources carrying capacity. J. Environ. Manag. 2021, 279, 111621. [Google Scholar] [CrossRef]
  4. Mardonova, M.; Han, Y.S. Environmental, hydrological, and social iMPacts of coal and nonmetal minerals mining operations. J. Environ. Manag. 2023, 332, 117387. [Google Scholar] [CrossRef]
  5. Jiang, B.B.; Gao, J.; Du, K.; Deng, X.; Zhang, K. Insight into the water–rock interaction process and purification mechanism of mine water in underground reservoir of Daliuta coal mine in China. Environ. Sci. Pollut. Res. 2022, 29, 28538–28551. [Google Scholar] [CrossRef]
  6. Jiang, B.B.; Zhao, Z.; Liu, D.Q.; Cao, Z.G.; Tang, J.W.; Wu, M.; Zhang, H.Q.; Li, P.; Liang, D.C. Study on the interaction mechanism between residual coal and mine water in goaf of coal mine underground reservoir. Sustainability 2023, 15, 15106. [Google Scholar] [CrossRef]
  7. Chi, M.B.; Li, Q.S.; Cao, Z.G.; Fang, J.; Wu, B.Y.; Zhang, Y.; Wei, S.R.; Liu, X.Q.; Yang, Y.M. Evaluation of water resources carrying capacity in ecologically fragile mining areas under the influence of underground reservoirs in coal mines. J. Clean. Prod. 2022, 379, 134449. [Google Scholar] [CrossRef]
  8. Fan, J.Y.; Li, Z.; Feng, G.R.; Zhang, H.D.; Qi, C.G.; Zhang, J.Y. Failure analysis of coal pillars and overburden from underground water reservoir under the mining-water invasion coupling effect. Eng. Fail. Anal. 2023, 151, 107406. [Google Scholar] [CrossRef]
  9. Qian, R.P.; Liu, X.L.; Ma, Q.; Feng, G.R.; Bai, J.W.; Guo, J.; Zhang, S.; Wen, X.Z. Effect of water intrusion on mechanical behaviors and failure characteristics of backfill body and coal pillar composite specimens under uniaxial compression. J. Clean. Prod. 2025, 502, 145388. [Google Scholar] [CrossRef]
  10. Sakhno, I.; Sakhno, S.; Skyrda, A.; Popova, O. Numerical modeling of controlling a floor heave of coal mine roadways with a method of reinforcing in wet soft rock. Geofluids 2022, 2022, 3855799. [Google Scholar] [CrossRef]
  11. Qian, R.P.; Feng, G.R.; Guo, J.; Wang, P.F.; Wen, X.Z.; Song, C. Experimental investigation of mechanical characteristics and cracking behaviors of coal specimens with various fissure angles and water-bearing states. Theor. Appl. Fract. Mech. 2022, 120, 103406. [Google Scholar] [CrossRef]
  12. Wang, J.; Wan, Z.; Wang, Y.; Liu, Z.; Liu, S.; Zhang, H.; Pei, Q. Effect of Stress and Moisture Content on Permeability of Gas-Saturated Raw Coal. Geofluids 2020, 2020, 8837758. [Google Scholar] [CrossRef]
  13. Wang, L.; Zhu, C.Q.; Yin, Z.Q.; Hou, J.L. Research on soft coal mechanics characteristic test for moisture content effect. J. Min. Saf. Eng. 2016, 33, 1145–1151. [Google Scholar] [CrossRef]
  14. Karakul, H.; Ulusay, R. Empirical correlations for predicting strength properties of rocks from P-wave velocity under different degrees of saturation. Rock Mech. Rock Eng. 2013, 46, 981–999. [Google Scholar] [CrossRef]
  15. Yilmaz, I. Influence of water content on the strength and deformability of gypsum. Int. J. Rock Mech. Min. Sci. 2010, 47, 342–347. [Google Scholar] [CrossRef]
  16. Iyare, U.C.; Blake, O.O.; Frash, L.P.; Carey, J.W.; Jones, D.; Ramjarrie, K. Water-weakening effects on the failure behavior of mudstones. Rock Mech. Rock Eng. 2023, 56, 9171–9185. [Google Scholar] [CrossRef]
  17. Talesnick, M.; Shehadeh, S. The effect of moisture content on the mechanical response of a high-porosity chalk. Int. J. Rock Mech. Min. Sci. 2007, 44, 584–600. [Google Scholar] [CrossRef]
  18. Poulsen, B.A.; Shen, B.; Williams, D.J.; Huddlestone-Holmes, C.; Erarslan, N.; Qin, J. Strength reduction on saturation of coal and coal measures rocks with implications for coal pillar strength. Int. J. Rock Mech. Min. Sci. 2014, 71, 41–52. [Google Scholar] [CrossRef]
  19. Kim, E.; Stine, M.A.; de Oliveira, D.B.M.; Changani, H. Correlations between the physical and mechanical properties of sandstones with changes of moisture content and loading rates. Int. J. Rock Mech. Min. Sci. 2017, 100, 255–262. [Google Scholar] [CrossRef]
  20. Sakhno, I.; Sakhno, S. Numerical studies of floor heave mechanism and the effectiveness of grouting reinforcement of roadway in soft rock containing the mine water. Int. J. Rock Mech. Min. Sci. 2023, 170, 105484. [Google Scholar] [CrossRef]
  21. Hashiba, K.; Fukui, K. Effect of water on the deformation and failure of rock in uniaxial tension. Rock Mech. Rock Eng. 2015, 48, 1751–1761. [Google Scholar] [CrossRef]
  22. Zhu, H.; Wang, P.; Zhang, K.; Gao, Y.; Qi, Z.; Cai, M. Influence of Water Immersion on Coal Rocks and Failure Patterns of Underground Coal Pillars Considering Strength Reduction. Appl. Sci. 2025, 15, 6700. [Google Scholar] [CrossRef]
  23. Han, P.; Zhao, Y.; Zhang, C.; Wang, X.J.; Wang, W. Effects of water on mechanical behavior and acoustic emission characteristics of coal in Brazilian tests. Theor. Appl. Fract. Mech. 2022, 122, 103636. [Google Scholar] [CrossRef]
  24. Yao, Q.L.; Chen, T.; Tang, C.J.; Sedighi, M.; Wang, S.W.; Huang, Q.X. Influence of moisture on crack propagation in coal and its failure modes. Eng. Geol. 2019, 258, 105156. [Google Scholar] [CrossRef]
  25. Wang, D.; Ju, F.; Xu, J.; Yan, C.S.; Xiao, M.; Ning, P.; Wang, T.F.; Si, L.; Wang, Y.B. Effects of Moisture Content and Loading Rate on Coal Samples: Mechanical Properties and Failure Mechanisms. Rock Mech. Rock Eng. 2024, 58, 3391–3416. [Google Scholar] [CrossRef]
  26. Hou, P.Y.; Cai, M.; Zhang, X.W.; Feng, X.T. Post-peak stress–strain curves of brittle rocks under axial-and lateral-strain-controlled loadings. Rock Mech. Rock Eng. 2022, 55, 855–884. [Google Scholar] [CrossRef]
  27. Hou, P.Y.; Cai, M. Post-peak stress–strain curves of brittle hard rocks under different loading environment system stiffness. Rock Mech. Rock Eng. 2022, 55, 3837–3857. [Google Scholar] [CrossRef]
  28. Singh, S.P. Brittleness and the mechanical winning of coal. Min. Sci. Technol. 1986, 3, 173–180. [Google Scholar] [CrossRef]
  29. Liu, Y.B.; Yin, G.Z.; Li, M.H.; Zhang, D.M.; Huang, G.; Liu, P.; Liu, C.; Zhao, H.G.; Yu, B.C. Mechanical properties and failure behavior of dry and water-saturated anisotropic coal under true-triaxial loading conditions. Rock Mech. Rock Eng. 2020, 53, 4799–4818. [Google Scholar] [CrossRef]
  30. Xie, H.X.; Li, X.H.; Shan, C.H.; Xia, Z.; Yu, L.Q. Study on the damage mechanism and energy evolution characteristics of water-bearing coal samples under cyclic loading. Rock Mech. Rock Eng. 2023, 56, 1367–1385. [Google Scholar] [CrossRef]
  31. Yao, Q.L.; Chen, T.; Ju, M.H.; Liang, S.; Liu, Y.P.; Li, X.H. Effects of water intrusion on mechanical properties of and crack propagation in coal. Rock Mech. Rock Eng. 2016, 49, 4699–4709. [Google Scholar] [CrossRef]
  32. Lyu, K.; Jiang, N.; Yin, D.W.; Meng, S.Y.; Gao, Z.Y.; Lyu, T. Deterioration of compressive properties of coal rocks under water and gas coupling. J. Cent. South Univ. 2024, 31, 477–495. [Google Scholar] [CrossRef]
  33. Fang, Z.; Harrison, J.P. A mechanical degradation index for rock. Int. J. Rock Mech. Min. Sci. 2001, 38, 1193–1199. [Google Scholar] [CrossRef]
  34. Fahimifar, A.; Soroush, H. A moisture index classification system for rocks (MiC System). Rock Mech. Rock Eng. 2007, 40, 63–79. [Google Scholar] [CrossRef]
  35. Mousavi, S.Z.S.; Mohammad, R. Correlation assessment between degradation ratios of UCS and non-destructive properties of rock under freezing-thawing cycles. Geoderma 2022, 428, 116209. [Google Scholar] [CrossRef]
  36. Leng, Y.Q.; Peng, J.B.; Wang, S.; Lu, F. Development of water sensitivity index of loess from its mechanical properties. Eng. Geol. 2021, 280, 105918. [Google Scholar] [CrossRef]
Figure 1. Preparation process for coal samples under different immersion times.
Applsci 15 08957 g001
Figure 2. Change curve of moisture content of coal samples with different immersion times.
Applsci 15 08957 g002
Figure 3. Test process for fundamental mechanical properties of coal samples.
Applsci 15 08957 g003
Figure 4. Stress–strain curves of coal samples with different moisture contents under uniaxial compression.
Applsci 15 08957 g004
Figure 5. Fitting curves for moisture content and compressive performance of coal samples. (a) Compressive strength, (b) Young’s modulus.
Applsci 15 08957 g005
Figure 6. Stress–strain curves of coal samples with different moisture contents under uniaxial tension.
Applsci 15 08957 g006
Figure 7. Fitting curves for moisture content and tensile performance of coal samples.
Applsci 15 08957 g007
Figure 8. Fitting curves for moisture content and peak shear strength of coal samples with different moisture contents.
Applsci 15 08957 g008
Figure 9. Fitting curves for moisture content, peak friction angle and cohesion of coal samples with different moisture contents.
Applsci 15 08957 g009
Figure 10. Fitting curves for moisture content and deterioration degree of coal samples. (a) Compressive strength, (b) Young’s modulus, (c) Tensile strength, (d) Cohesion.
Applsci 15 08957 g010
Figure 11. Fitting curves for sensitivity indexes to moisture content of coal samples.
Applsci 15 08957 g011
Table 1. Relationship between immersion time and moisture content of coal samples.
Immersion time/h0 h5 h11 h24 h96 h
Moisture content/%03.624.935.526.11 (saturated)
Table 2. Testing scheme for the fundamental mechanical properties of coal samples with different moisture content.
Moisture Content/%Compression Performance Test NumberSize/mm × mmTensile Performance Test NumberSize/mm × mmShear Performance Test NumberShear Angle/°Size/mm × mm
0Y-150 × 100L-150 × 25J-40-140°50 × 50
J-50-150°
J-60-160°
3.62Y-2L-2J-40-240°
J-50-250°
J-60-260°
4.93Y-3L-3J-40-340°
J-50-350°
J-60-360°
5.52Y-4L-4J-40-440°
J-50-450°
J-60-460°
6.11Y-5L-5J-40-540°
J-50-550°
J-60-560°
Disclaimer/Publisher’s Note: The statements, opinions and data contained in all publications are solely those of the individual author(s) and contributor(s) and not of MDPI and/or the editor(s). MDPI and/or the editor(s) disclaim responsibility for any injury to people or property resulting from any ideas, methods, instructions or products referred to in the content.