Article

Integrated Statistical Analysis and Spatial Modeling of Gas Hydrate-Bearing Sediments in the Shenhu Area, South China Sea

by
Xin Feng
1,2 and
Lin Tan
1,2,3,*
1
State Key Laboratory of Disaster Reduction in Civil Engineering, Tongji University, Shanghai 200092, China
2
Department of Geotechnical Engineering, Tongji University, Shanghai 200092, China
3
Water Supply Branch Company, Shanghai Chengtou Water Group Co., Ltd., Shanghai 200002, China
*
Author to whom correspondence should be addressed.
Appl. Sci. 2025, 15(16), 8857; https://doi.org/10.3390/app15168857
Submission received: 12 July 2025 / Revised: 5 August 2025 / Accepted: 6 August 2025 / Published: 11 August 2025

Abstract

Featured Application

The statistical and spatial analysis framework established in this study provides a practical tool for the preliminary screening of hydrate production targets in the Shenhu Area. By integrating geological exploration data and geostatistical modeling, the results can be directly applied to construct site-specific reservoir models for hydrate exploitation. This approach enables rapid parameter estimation and spatial heterogeneity simulation, supporting early-phase feasibility studies, risk assessments, and production planning in gas hydrate-bearing regions.

Abstract

Gas hydrate-bearing sediments in marine environments represent both a future energy source and a geohazard risk, prompting increasing international research attention. In the Shenhu area of the South China Sea, a large volume of drilling and laboratory data has been acquired in recent years, yet a comprehensive framework for evaluating the characteristics of key reservoir parameters remains underdeveloped. This study presents a spatially integrated and statistically grounded framework that captures regional-scale heterogeneity using multi-source in situ datasets. It incorporates semi-variogram modeling to assess spatial variability and provides statistical reference values for geological and geotechnical properties across the Shenhu Area. By synthesizing core sampling results, acoustic logging, and triaxial testing data, representative probability distributions and variability scales of hydrate saturation, porosity, permeability, and mechanical strength are derived, which are essential for numerical simulations of gas production and slope stability. Our results support the development of site-specific reservoir models and improve the reliability of early-phase hydrate exploitation assessments. This work facilitates the rapid screening of hydrate reservoirs, contributing to the efficient selection of potential production zones in hydrate-rich continental margins.

1. Introduction

Natural gas hydrates are considered a potential source of future energy due to massive reserves and high energy density. Estimates of global natural gas hydrate resources range from 100,000 to nearly 300,000,000 trillion cubic feet [1]. Extensive research activities are being carried out worldwide to explore and exploit these enormous energy resources. China has been actively involved in methane hydrate research and development programs since the mid to late 1990s. Nine government-funded drilling expeditions have been conducted in the South China Sea [2,3,4,5,6,7,8,9]. Moreover, successful offshore production tests on marine hydrates were conducted in 2017 and 2020 [10,11]. These activities have led to the drilling of numerous boreholes and the acquisition of substantial data through logging interpretation, core analyses, shipboard tests, and laboratory mechanical experiments. The collected data, in various formats, play a crucial role in developing a refined analysis and demonstrating the feasibility of extracting gas from oceanic hydrate reservoirs. This represents a key step in transitioning from experimental production tests to long-term commercial production.
Geostatistical modeling enables the construction of heterogeneous reservoirs by utilizing limited exploration data to infer the spatial distribution of key properties. This modeling approach, which accounts for heterogeneity, is critical for generating reliable predictive scenarios of gas production [12,13,14]. It allows for the evaluation of gas extraction feasibility through the accurate estimation of total gas hydrate inventory, as well as the prediction and assessment of associated economic benefits and environmental impacts [15,16,17,18]. However, these studies are constrained by the scarcity and heterogeneity of multi-source exploration data, which include basic mechanical and physical data, as well as engineering response data [19,20,21]. To address these challenges, researchers have increasingly adopted advanced geostatistical approaches [22]. Bayesian evidential learning provides a principled framework for incorporating uncertainty under sparse data conditions [23], while geospatial intelligence leverages machine learning and multi-source spatial data to uncover latent spatial patterns [24,25,26]. Both methods have shown strong promise for enhancing subsurface characterization in data-constrained geotechnical applications. Performing in-depth site investigations and elaborate laboratory tests to determine reservoir parameters is often impractical due to the exorbitant costs involved. Alternatively, low-cost approaches with sufficient accuracy are appealing, especially in reservoir-scale analysis mainly for rapid and preliminary screening.
Field data and laboratory results are of great value for reservoir characterization. The spatial distributions of essential properties, such as saturation, porosity, and strength parameters, are assigned within the delineated geometric boundaries when constructing a computational model. Logging boreholes are commonly employed to estimate saturation and porosity, utilizing statistical empirical relations with physical responses [27]. Additionally, coring boreholes are utilized for determining gas hydrate saturation through porewater and sedimentological geochemical analyses [28]. In situ acoustic logging has recently been used to understand the mechanical properties of gas–hydrate-bearing sediments. This is based on the empirical relationship established for conventional oil and gas reservoirs [29,30,31,32]. Laboratory tests are frequently conducted on artificially synthesized samples, employing direct shear systems or triaxial compression apparatus to obtain strength parameters [33,34,35,36]. A limited number of pressure cores from the field were tested in the laboratory after the sampling and transportation processes [37,38,39]. However, most of these published works focus on individual sites or expeditions, lacking analysis of spatial connections across multiple sites. Consequently, scientific studies on a reservoir-scale are often impeded by insufficient information. Compiling the available dataset not only facilitates descriptive statistics but also enables geostatistical analysis at the regional scale, which was previously unattainable with data from a single location.
This paper aims to compile and analyze published data, focusing on the statistical and spatial variability of reservoir properties in the Shenhu area. The objective of this study is to establish empirical relationships that enable low-cost approaches for preliminarily determining geometrical boundaries and provide a geostatistical characterization of essential geological and geotechnical parameters necessary for reservoir-scale computational studies on gas hydrate exploitation. The compiled dataset comprises logging and borehole data obtained from four drilling expeditions conducted by the Guangzhou Marine Geological Survey (GMGS) of China. To predict geotechnical parameters of the hydrate-bearing reservoir in a different manner from in situ boreholes, a great number of indoor test results from existing references were compiled exceptionally.

2. Data and Methods

2.1. Geological Setting

As shown in Figure 1a, the Shenhu Area is located in the Baiyun Sag of the Pearl River Mouth Basin, on the northern continental slope of the South China Sea [40]. During the Miocene, the Baiyun Sag experienced substantial marine sedimentation, establishing it as the primary region for deep-sea oil and gas hydrate accumulation within the Pearl River Mouth Basin [41]. Previous studies have identified fluid migration pathways in the Shenhu Area, including gas chimneys, faults, submarine slides, and localized foraminiferal deposits, indicating favorable conditions for gas hydrate formation [42,43,44,45].
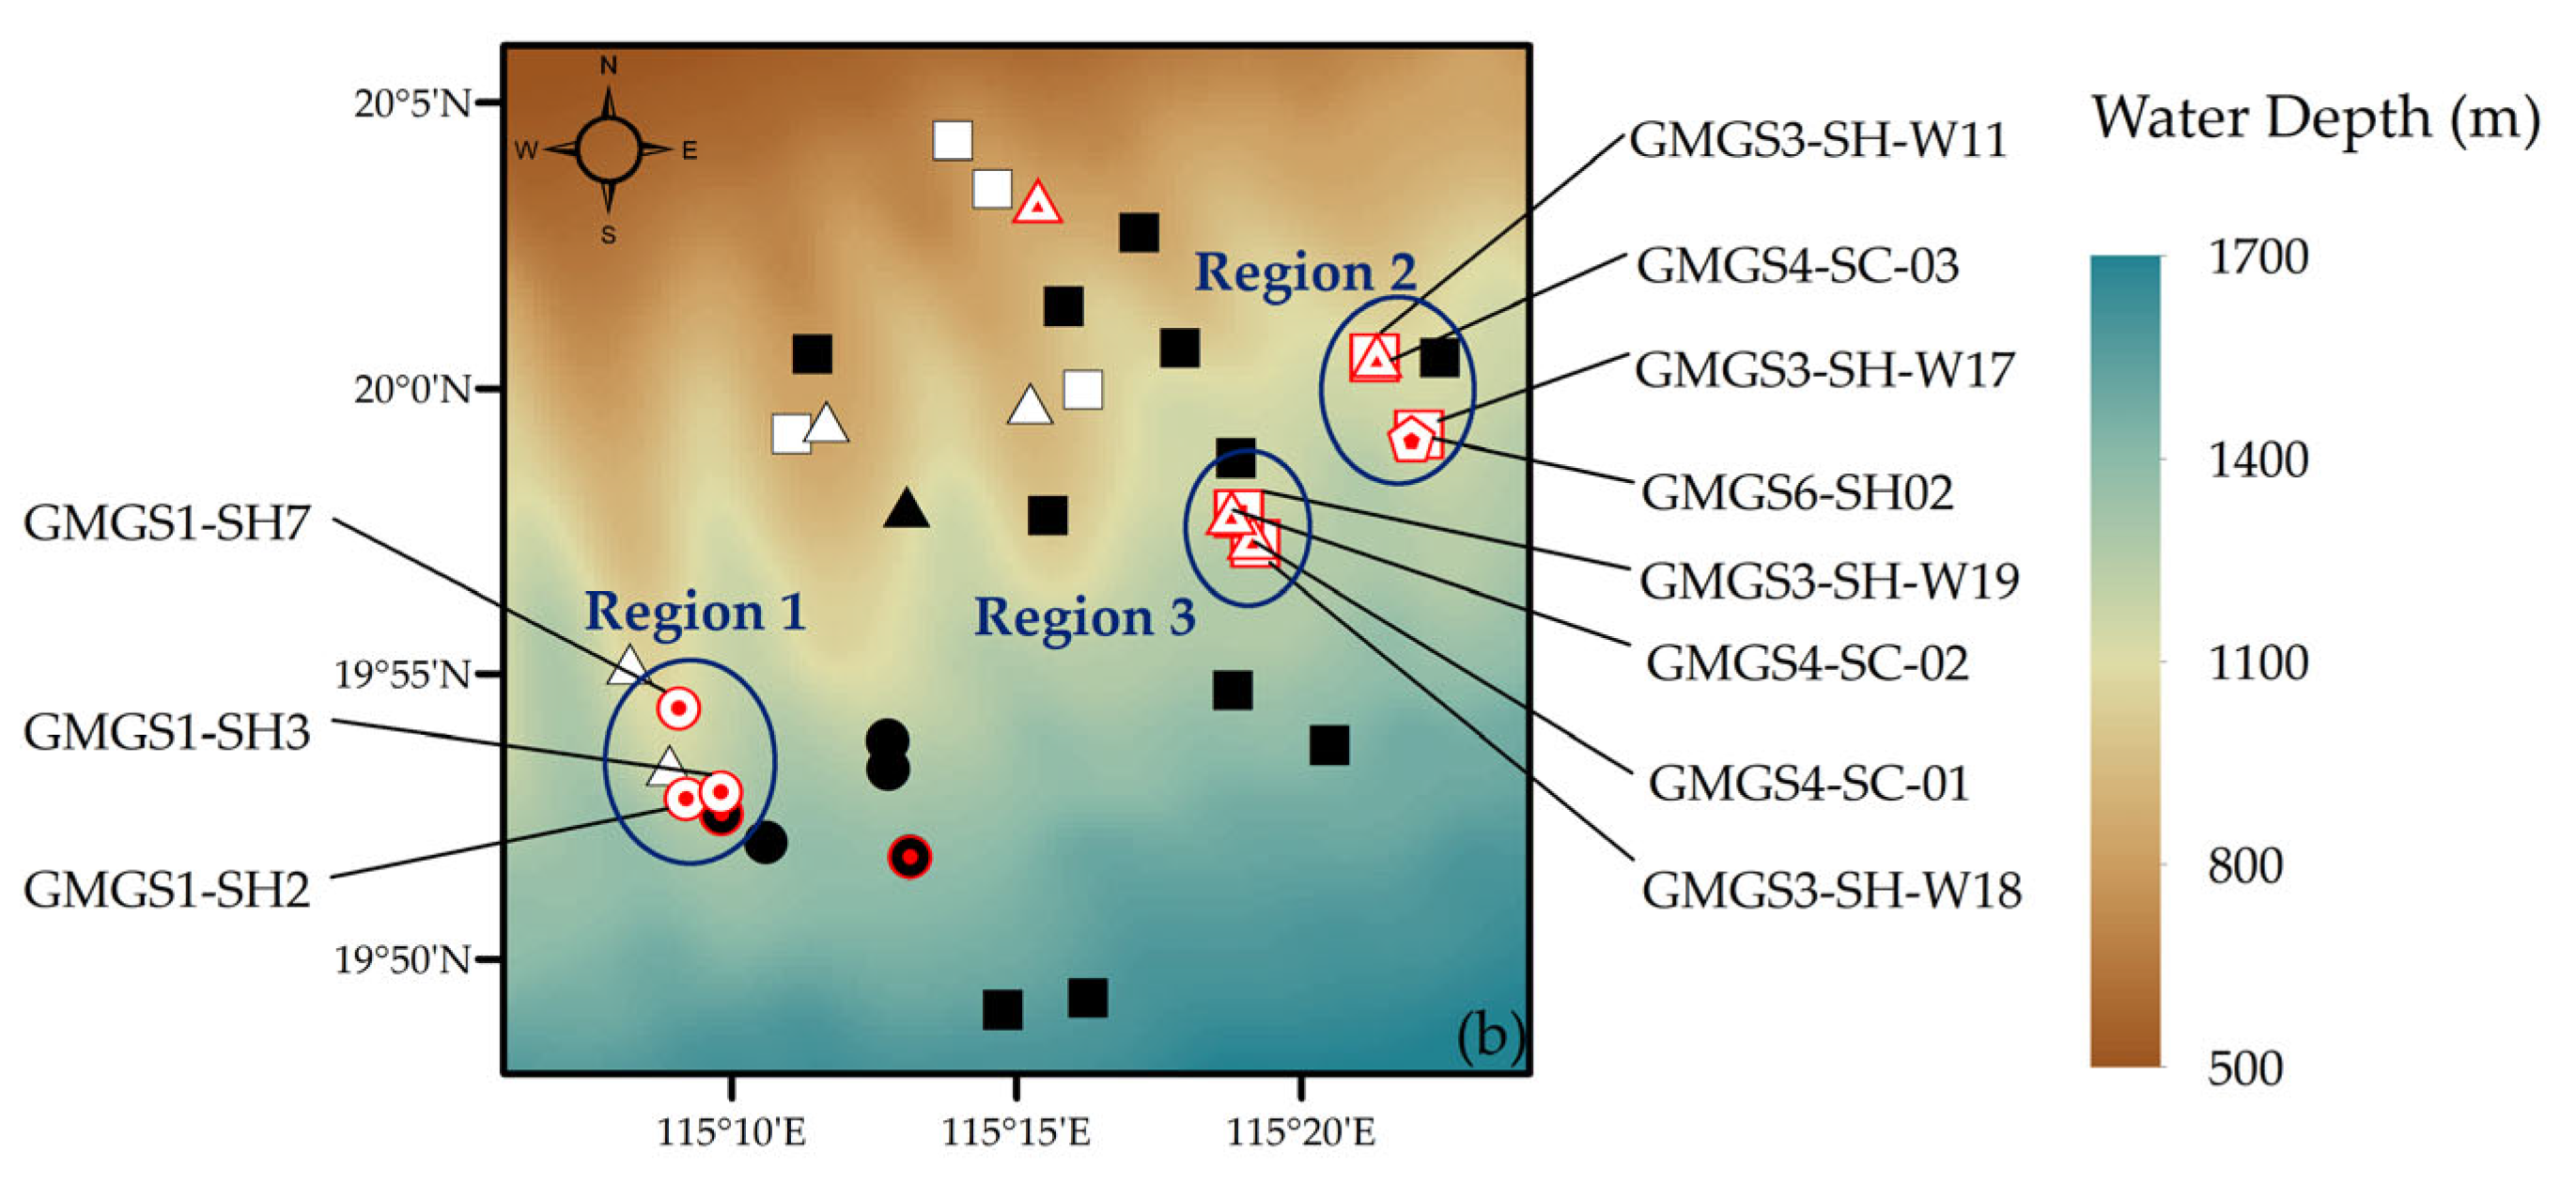
As illustrated in Figure 1b, this study focuses on a specific section within the Shenhu Area, covering approximately 60 km2. The seafloor is relatively flat, with an average slope of approximately 2° [46] and water depth between 800 and 2000 m [47]. The seafloor temperature ranges from 2 to 4 °C, with an estimated geothermal gradient of 45 to 67.7 °C/km [48]. To facilitate more detailed regional-scale analysis of hydrate reservoir characteristics, the drilling sites were categorized into three distinct geographic subregions based on the availability of relatively complete borehole data suitable for geostatistical analysis.
Since 2007, four natural gas hydrate drilling expeditions (GMGS1, GMGS3, GMGS4, and GMGS6) have been conducted in the Shenhu Area using various techniques, such as multi-channel seismic surveys, wireline logging, logging-while-drilling, and both conventional and pressure coring. Table 1 summarizes the details of these expeditions and the eleven drilling sites. The results show that hydrate-bearing zones are typically located at depths of 100~250 m below the seafloor (mbsf), with thicknesses ranging from 10 to 80 m [2,4,5,11,49]. The hydrates mainly exhibit pore-filling habits and are predominantly composed of methane, with hydrate saturation ranging from 5% to 70% [21,50,51,52]. The hydrate-bearing sediments consist primarily of argillaceous silt and silty mud, with average grain size between 6 and 9 μm [7,53].

2.2. Data Sources

Field investigation in the Shenhu Area involved both logging and coring operations. During the GMGS expeditions, geophysical logging was conducted using either conventional wireline logging or logging-while-drilling techniques, providing continuous vertical profiles of parameters such as natural gamma-ray, bulk density, electrical resistivity, and P-wave velocity [55]. Electrical resistivity logging is employed to estimate gas hydrate saturation based on Archie’s equation [56]. Bulk density is utilized to determine porosity of the reservoir, as the derived results are generally exhibit better consistency with core measurements compared to those estimated from neutron and sonic logs [57]. Gamma-ray logging is applied to infer grain size of the reservoir, which is subsequently used in permeability estimation [58]. Additionally, P-wave velocity logs could be used to estimate the mechanical parameters such as cohesion and frictional angle via empirical or semi-empirical relationship.
Borehole cores are utilized to estimate gas hydrate saturation with pore-water freshening analysis and methane mass balance calculations [29]. Additionally, they also contribute to determination of the mechanical properties of reservoir sediments through laboratory tests [37,38,39].
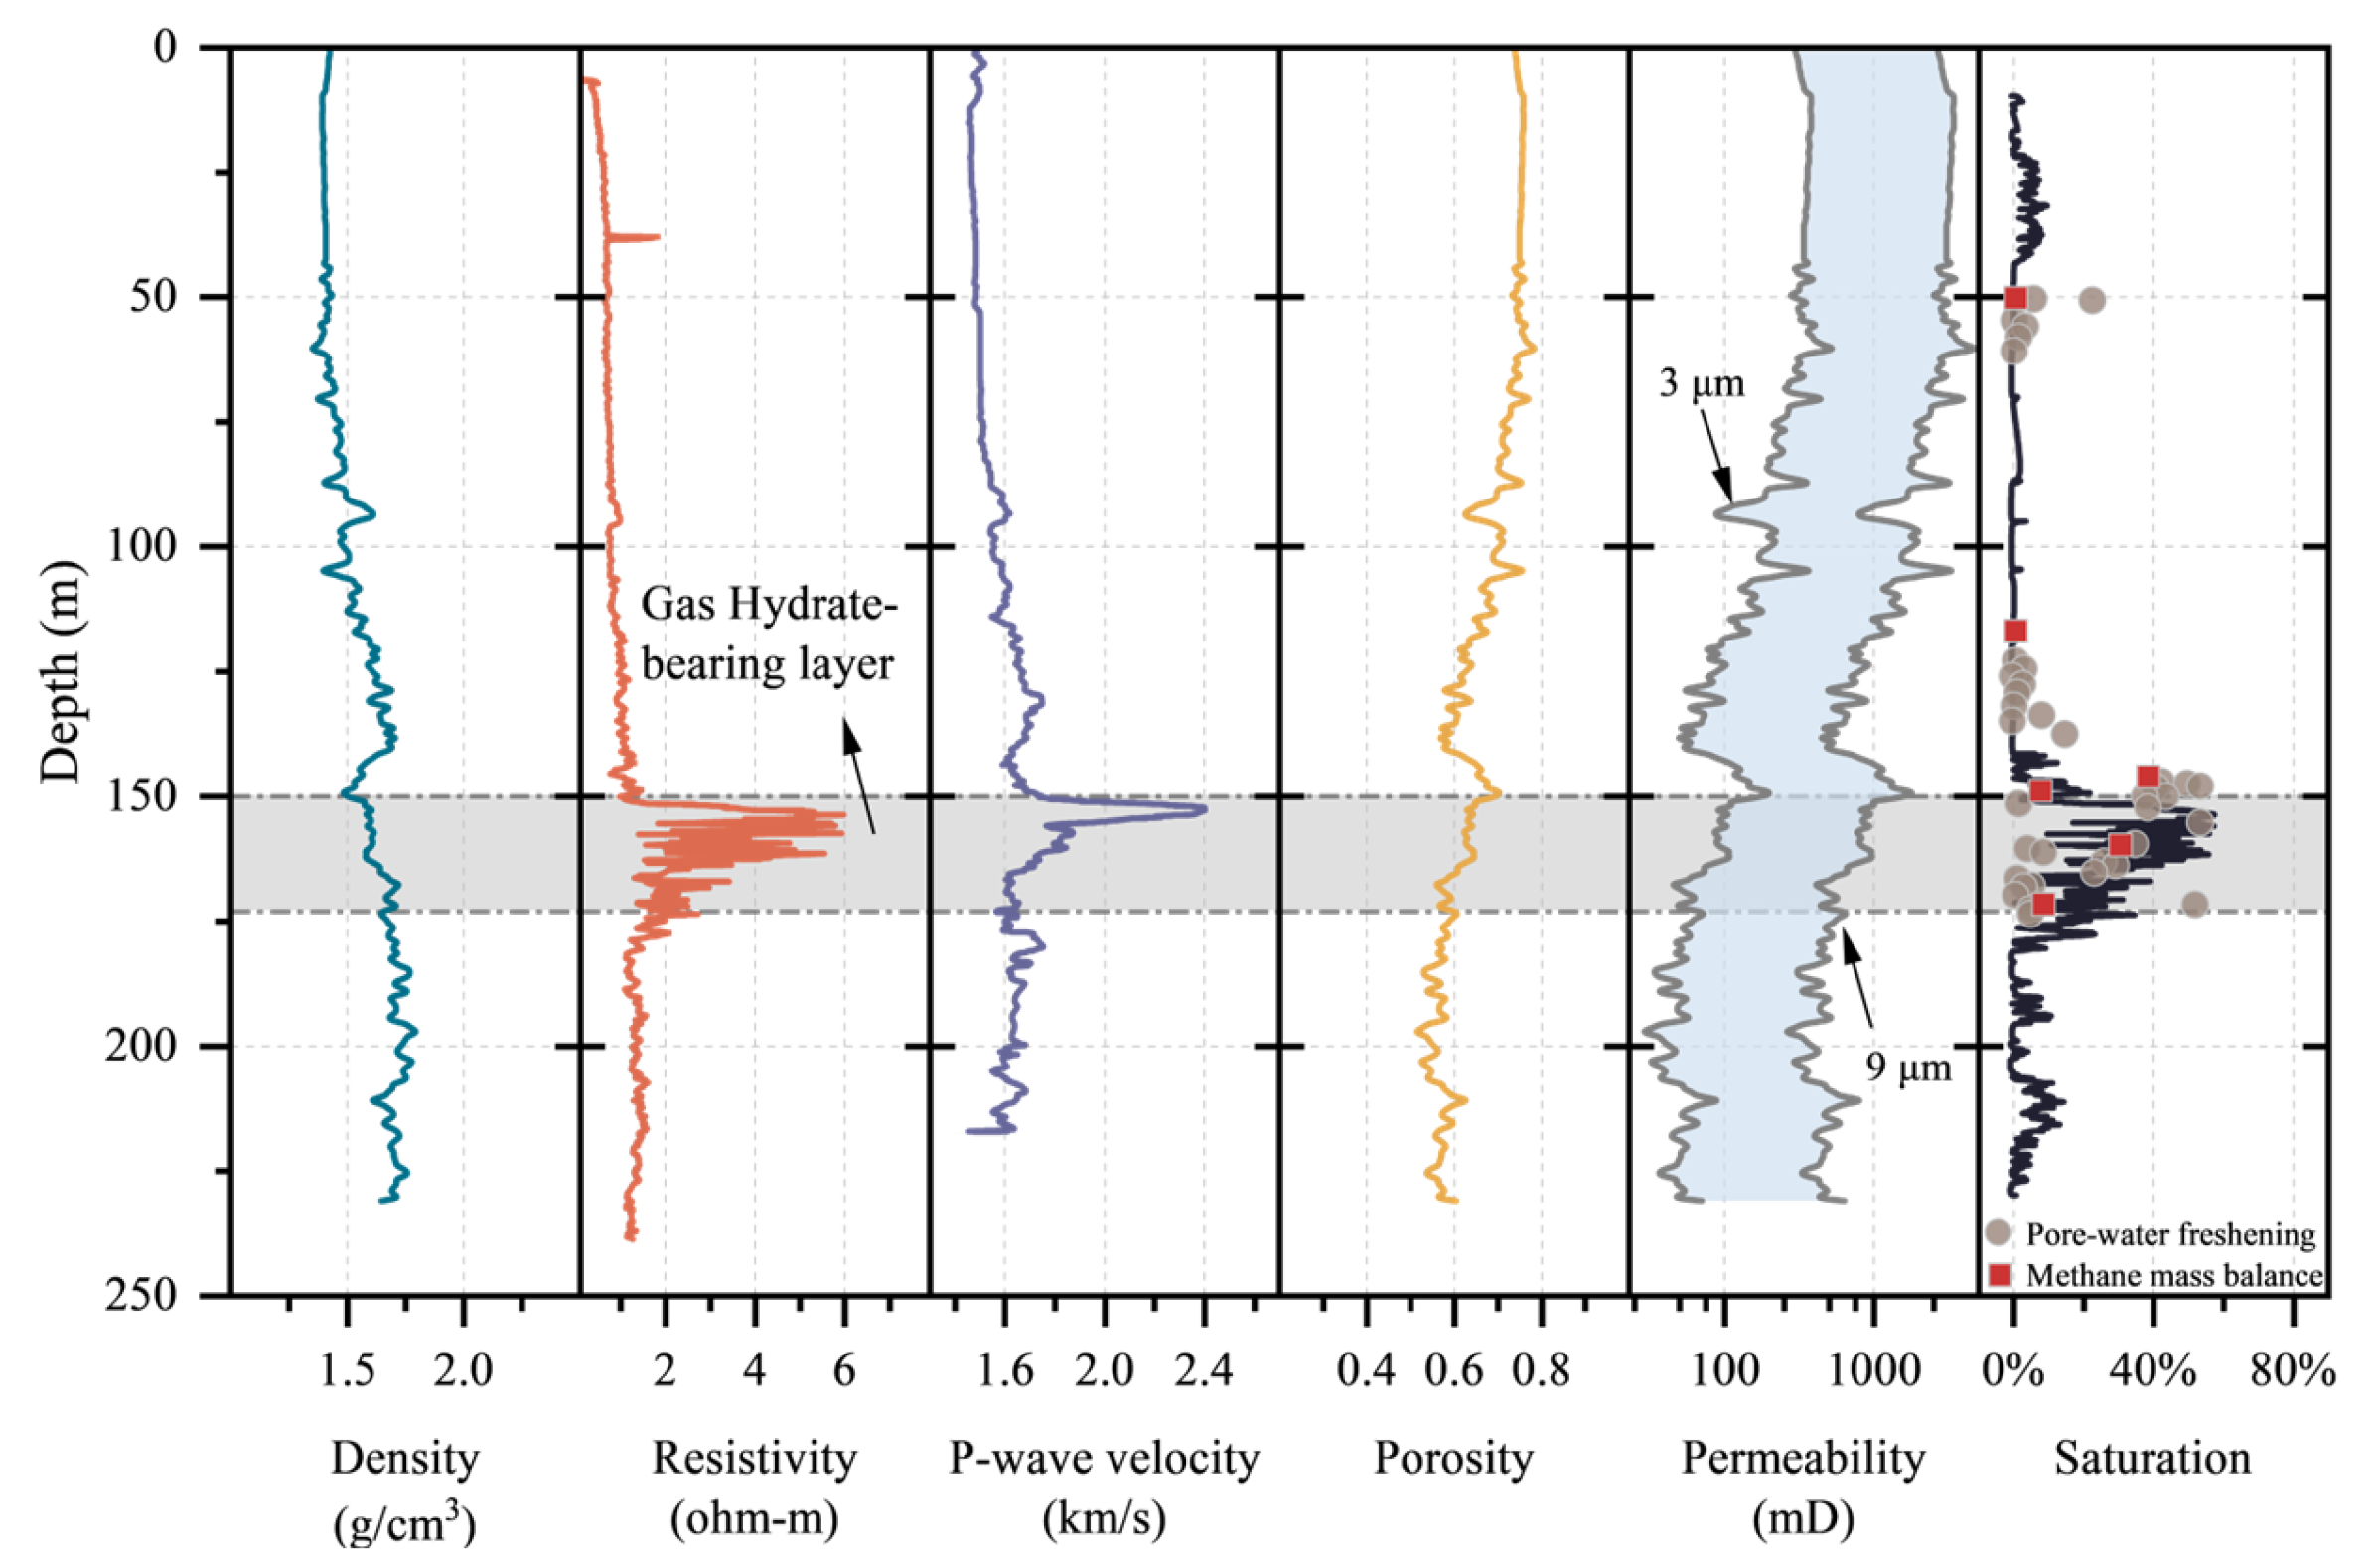
In this study, parameter profiles from various published sources were carefully digitized and compiled into a unified digital dataset. Data acquisition was centered on gas hydrate-bearing layers, aiming to evaluate reservoir properties, including gas hydrate saturation, porosity, and grain size which is critical factors influencing reservoir permeability [59]. Figure 2 displays the digitized vertical profiles at site GMGS3-W18-2015. For mechanical strength properties, results of laboratory tests with synthesizing hydrate samples are also digitized, apart from P-wave velocity loggings which are used to estimate mechanical strength parameters. Table 2 presents representative test results compiled in this study, including seven triaxial and three direct shear tests.

2.3. Data Processing

Prior to statistical analysis, the digitized logging profiles were resampled at fixed depth intervals to reduce scale mismatches between logging data and core sample measurements, and to minimize frequency-related errors introduced by manual sampling during the digitization process. An interval of 50 cm was selected to maintain consistency with typical core thickness (ranging from 20 cm to 1 m), ensuring adequate resolution while reducing statistical noise. After resampling, and constrained by the top and base boundaries of hydrate-bearing layers listed in Table 1, the number of derived data points for each parameter is summarized in Figure 3. A total of 891 data points for gas hydrate saturation were compiled, comprising 643 from logging and 248 from core samples. Additionally, the total number of porosity and P-wave velocity data points are 832 and 680, respectively. These data are compiled in a dataset which is used to evaluate the statistical and spatial variability of the properties of hydrate reservoir in the Shenhu Area.

3. Characterization of Hydrate-Bearing Sediments

3.1. Stratigraphic Boundaries

The stratigraphic boundaries of hydrate reservoirs, particularly the top and base interfaces, are essential input parameters for geological modeling of hydrate reservoir. The spatial extent of gas hydrate stability zones is primarily governed by thermodynamic equilibrium conditions, especially pressure and temperature. This study prioritizes establishing quantitative relationships between reservoir boundary constraints and readily measurable field parameters.
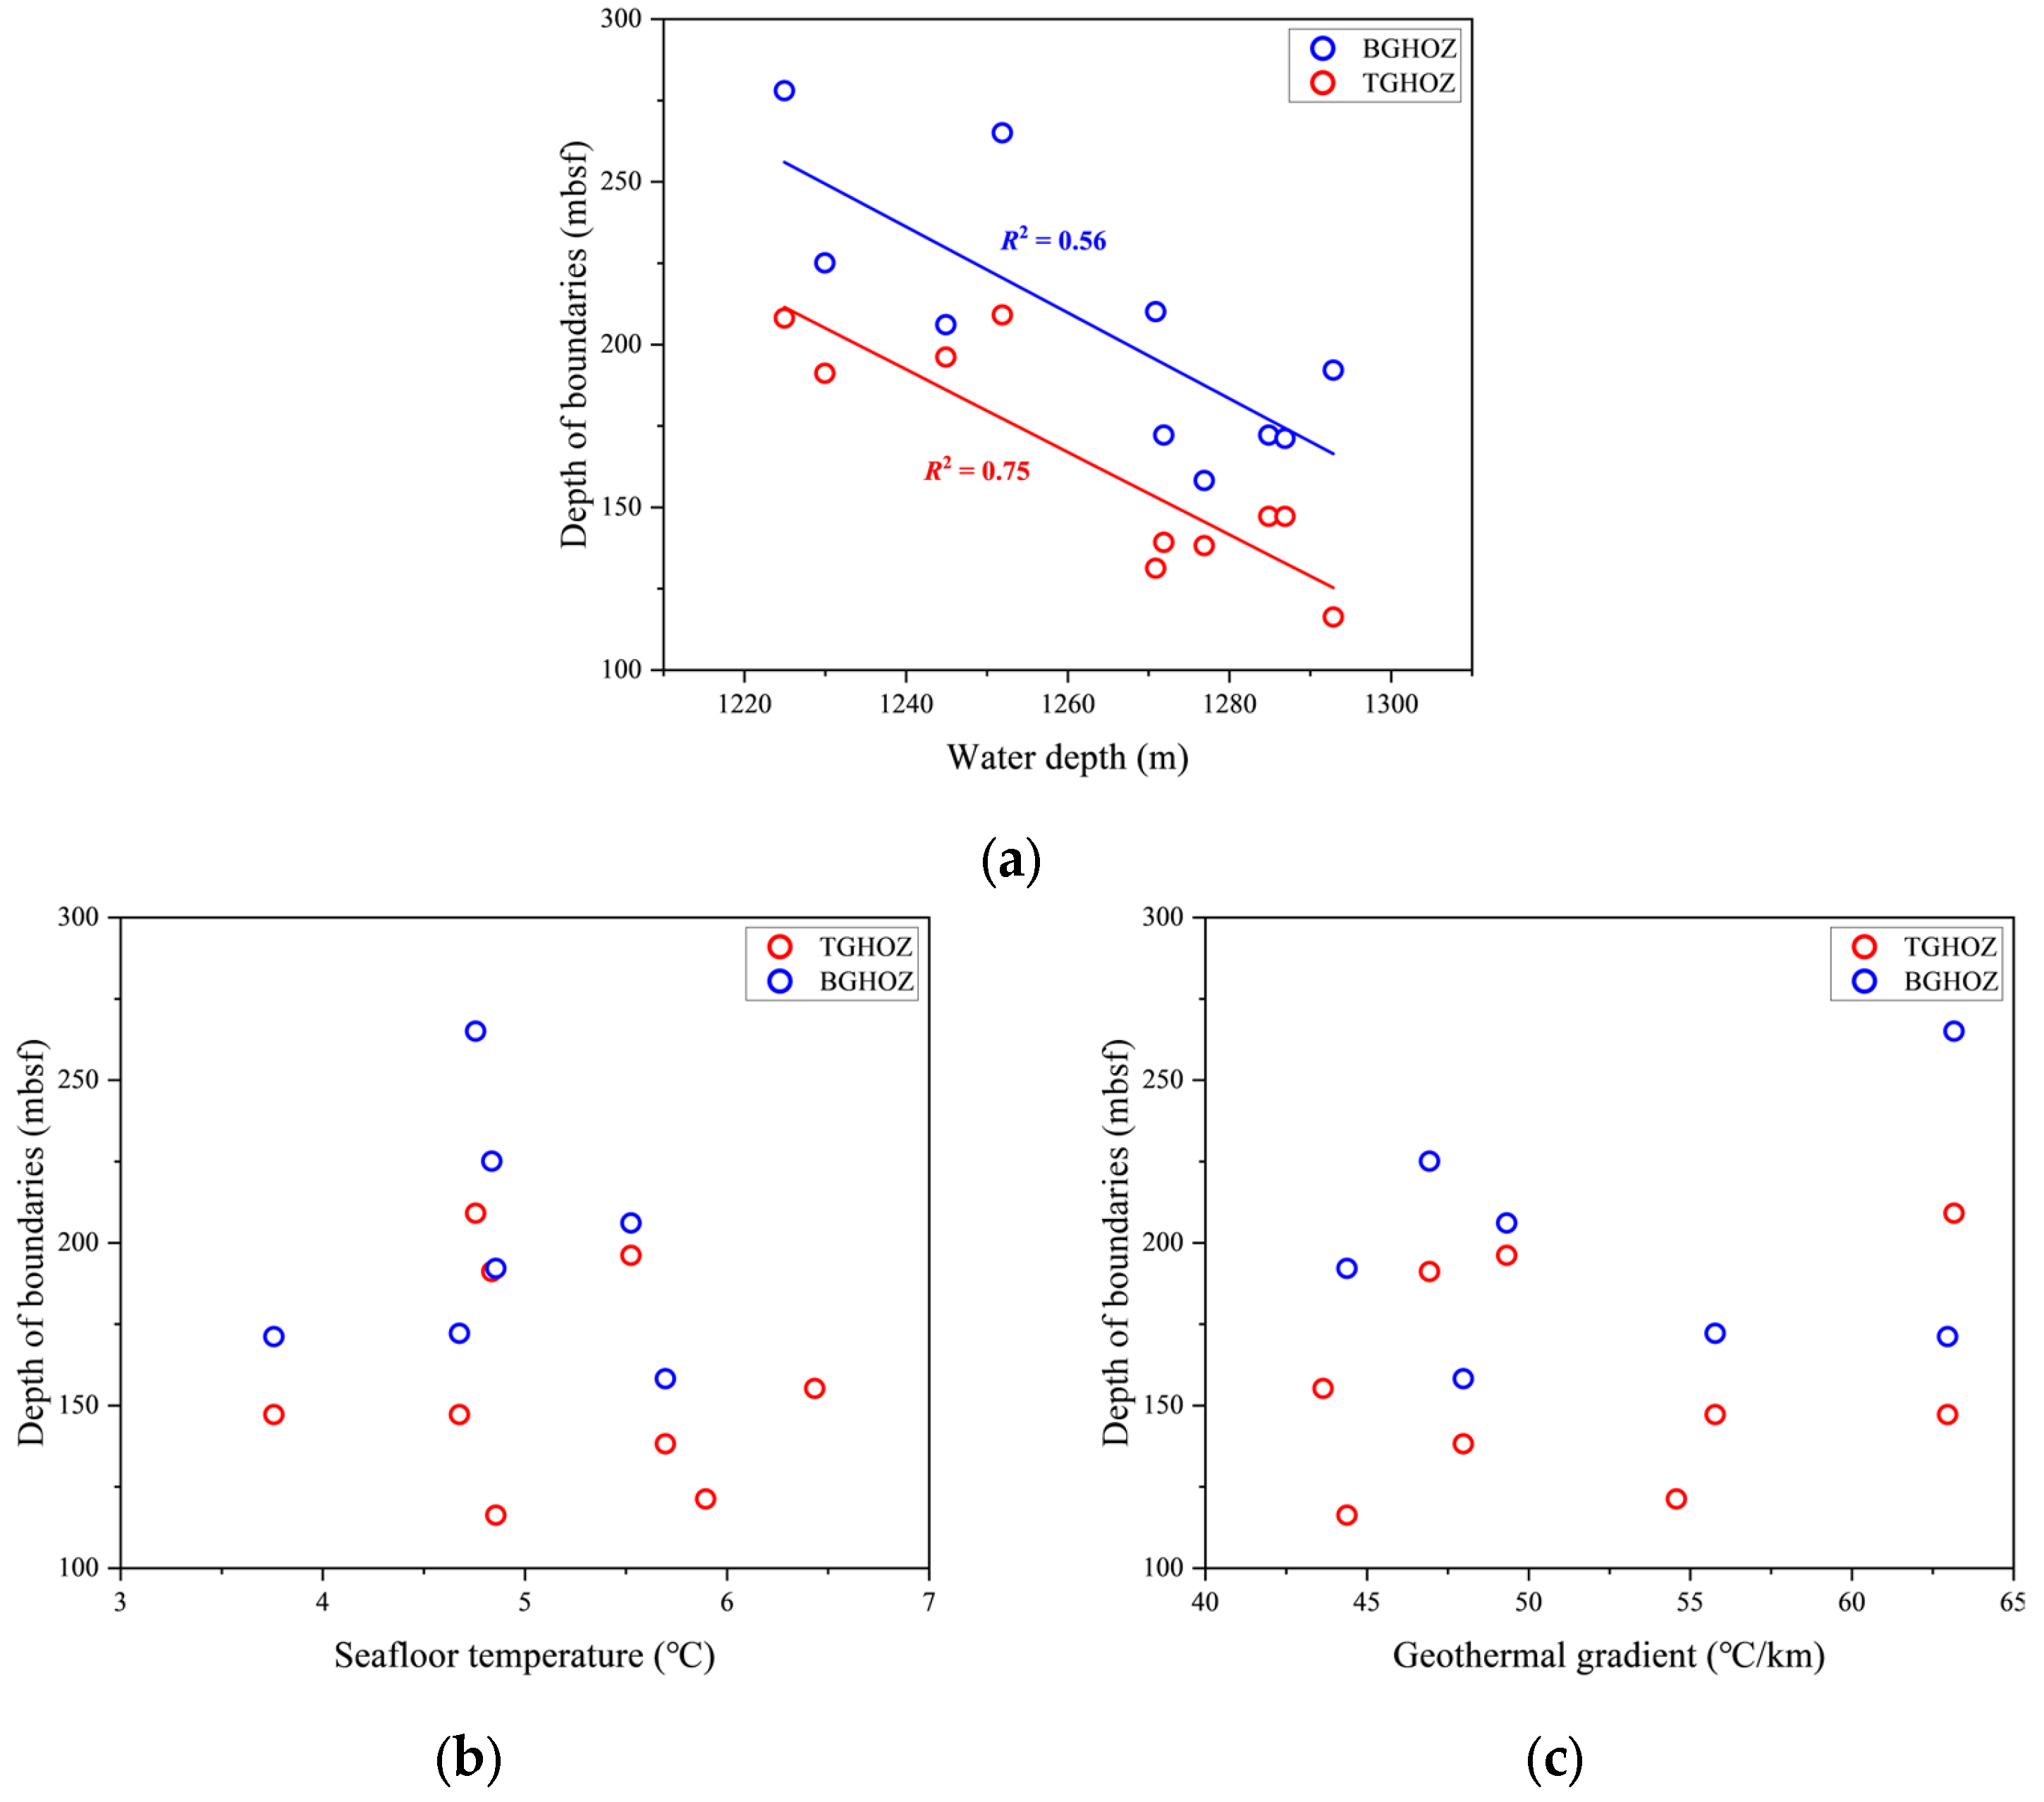
To characterize the impact of pressure, water depth is adopted as a key proxy. Figure 4a illustrates the relationship between water depth and the boundaries of the Gas Hydrate Stability Zone (GHSZ), showing both the base (BGHSZ) and top (TGHSZ). The boundaries are expressed in meters below seafloor, which offers a more geologically relevant representation of hydrate distribution, as it directly reflects sedimentary layering and depositional context. The corresponding regression equations describing these relationships are presented below:
D B G H O Z = 1872 1.32 × D W
D T G H O Z = 1767 1.27 × D W
where DW denotes the water depth; DBGHOZ and DTGHOZ correspond to the depths of the lower and upper boundaries of the Gas Hydrate Stability Zone, respectively. The coefficients of determination (R2) between water depth and the GHSZ boundaries are 0.56 for the base (BGHSZ) and 0.75 for the top (TGHSZ), indicating moderate to strong correlations.
The lower correlation observed may be attributed to the fact that the formation of hydrate-bearing sediments is not solely controlled by pressure–temperature conditions. A sufficient supply of methane is also essential, which depends on factors such as the presence of deep thermogenic gas sources, biogenic methane production, fluid migration pathways, and sediment permeability. These additional geological and geochemical constraints can lead to considerable variability in hydrate occurrence, thereby limiting the strength of the correlation. This limitation highlights the intended use of the current models as rapid screening, which may be further refined using multivariate regression or machine learning techniques when more site-specific data become available.
While pressure constraints demonstrate strong predictive capacity in defining stratigraphic boundaries, this study further investigates the role of thermal parameters. Specifically, two readily measurable temperature-related variables, seafloor temperature and geothermal gradient, were incorporated into a linear regression model to assess their combined influence. However, as shown in Figure 4b,c, no clear or statistically significant correlation was identified between these thermal parameters and the stratigraphic boundaries.
In addition to thermobaric controls, local geochemical conditions, particularly the depth of the sulfate–methane transition (SMT) zone [66], dissolved methane concentrations [67] and porewater sulfate levels [68], are also recognized as critical factors influencing hydrate occurrence. Although such variables were not included in the present model due to data limitations, their incorporation into future regression frameworks, alongside pressure and temperature, could contribute to a more comprehensive understanding of hydrate stratigraphy.

3.2. Gas Hydrate Saturation

3.2.1. Descriptive Statistics

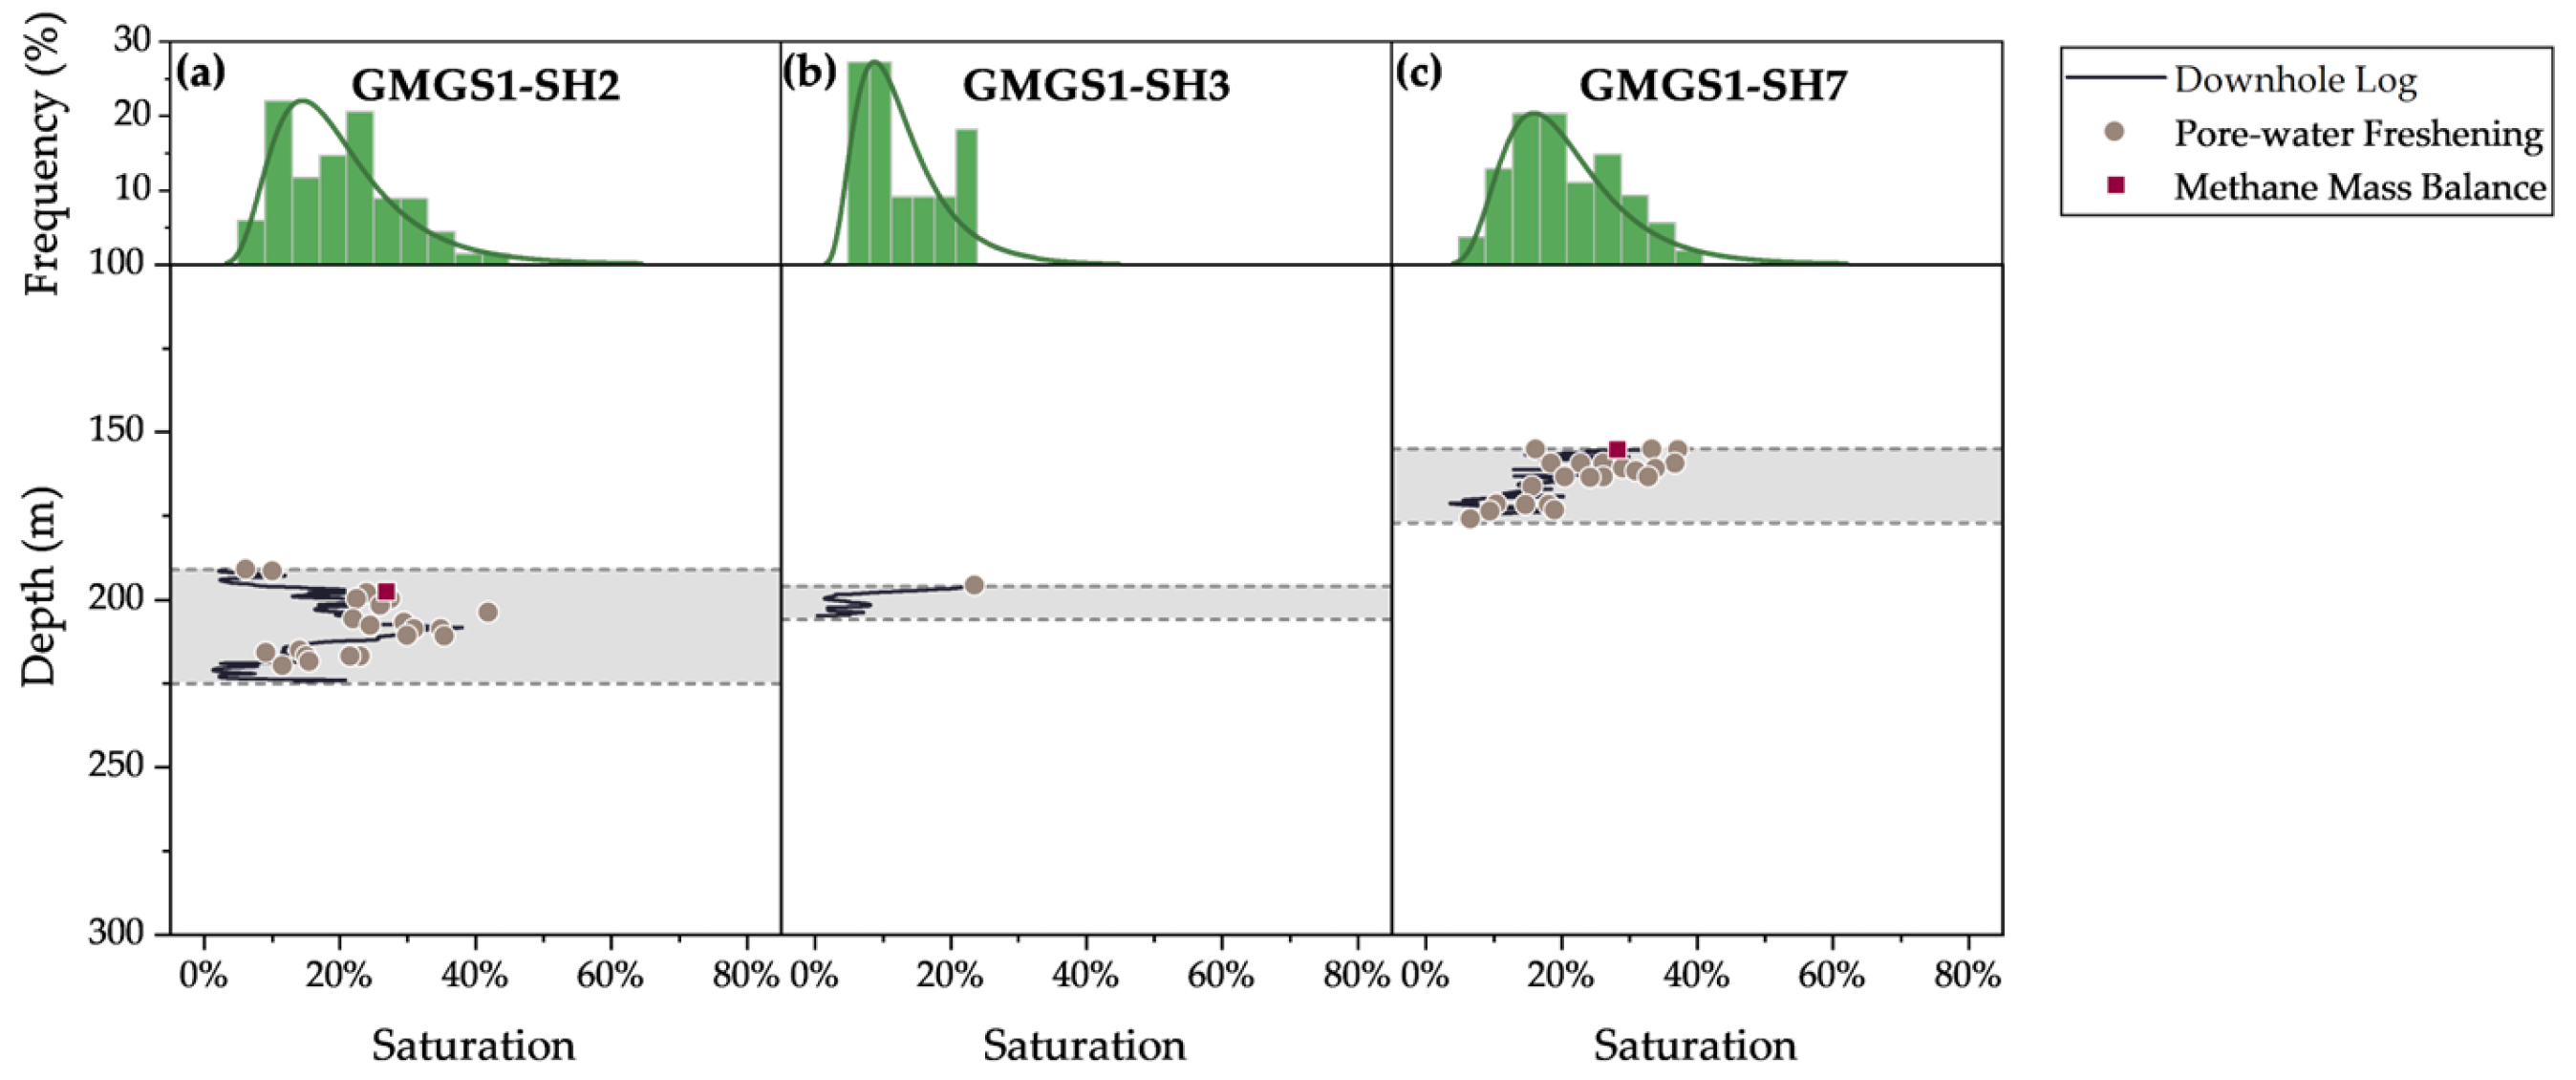
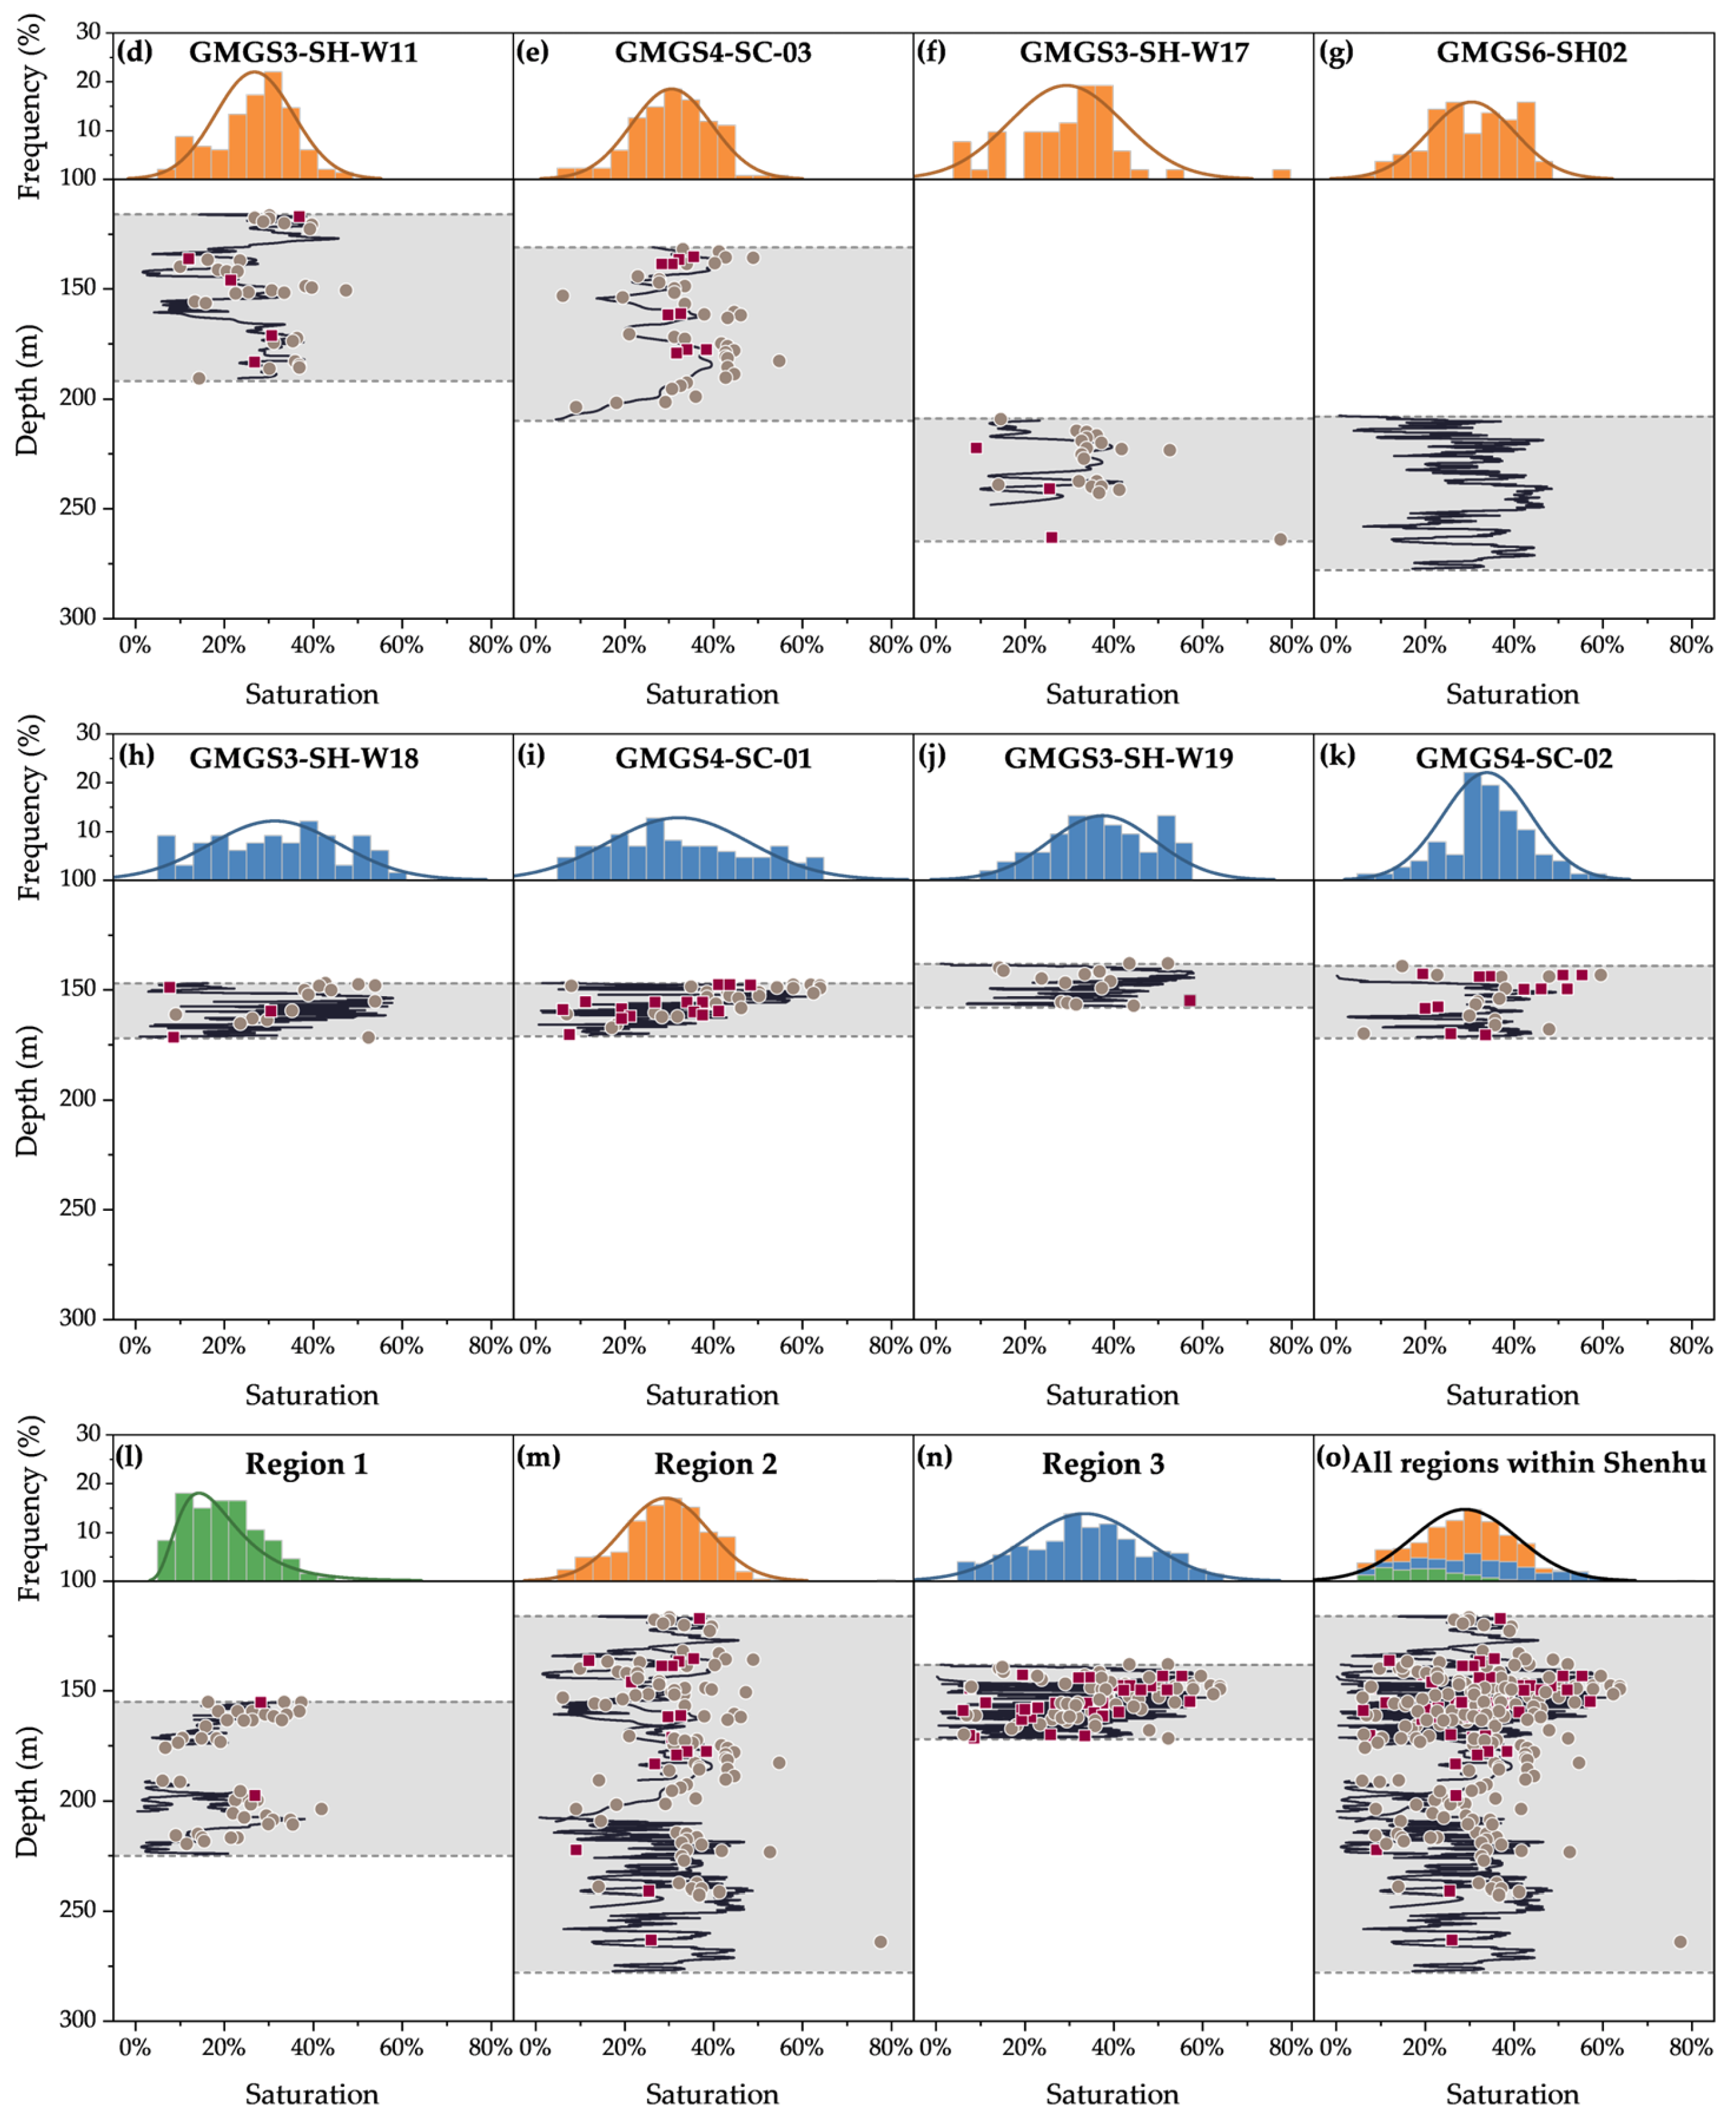
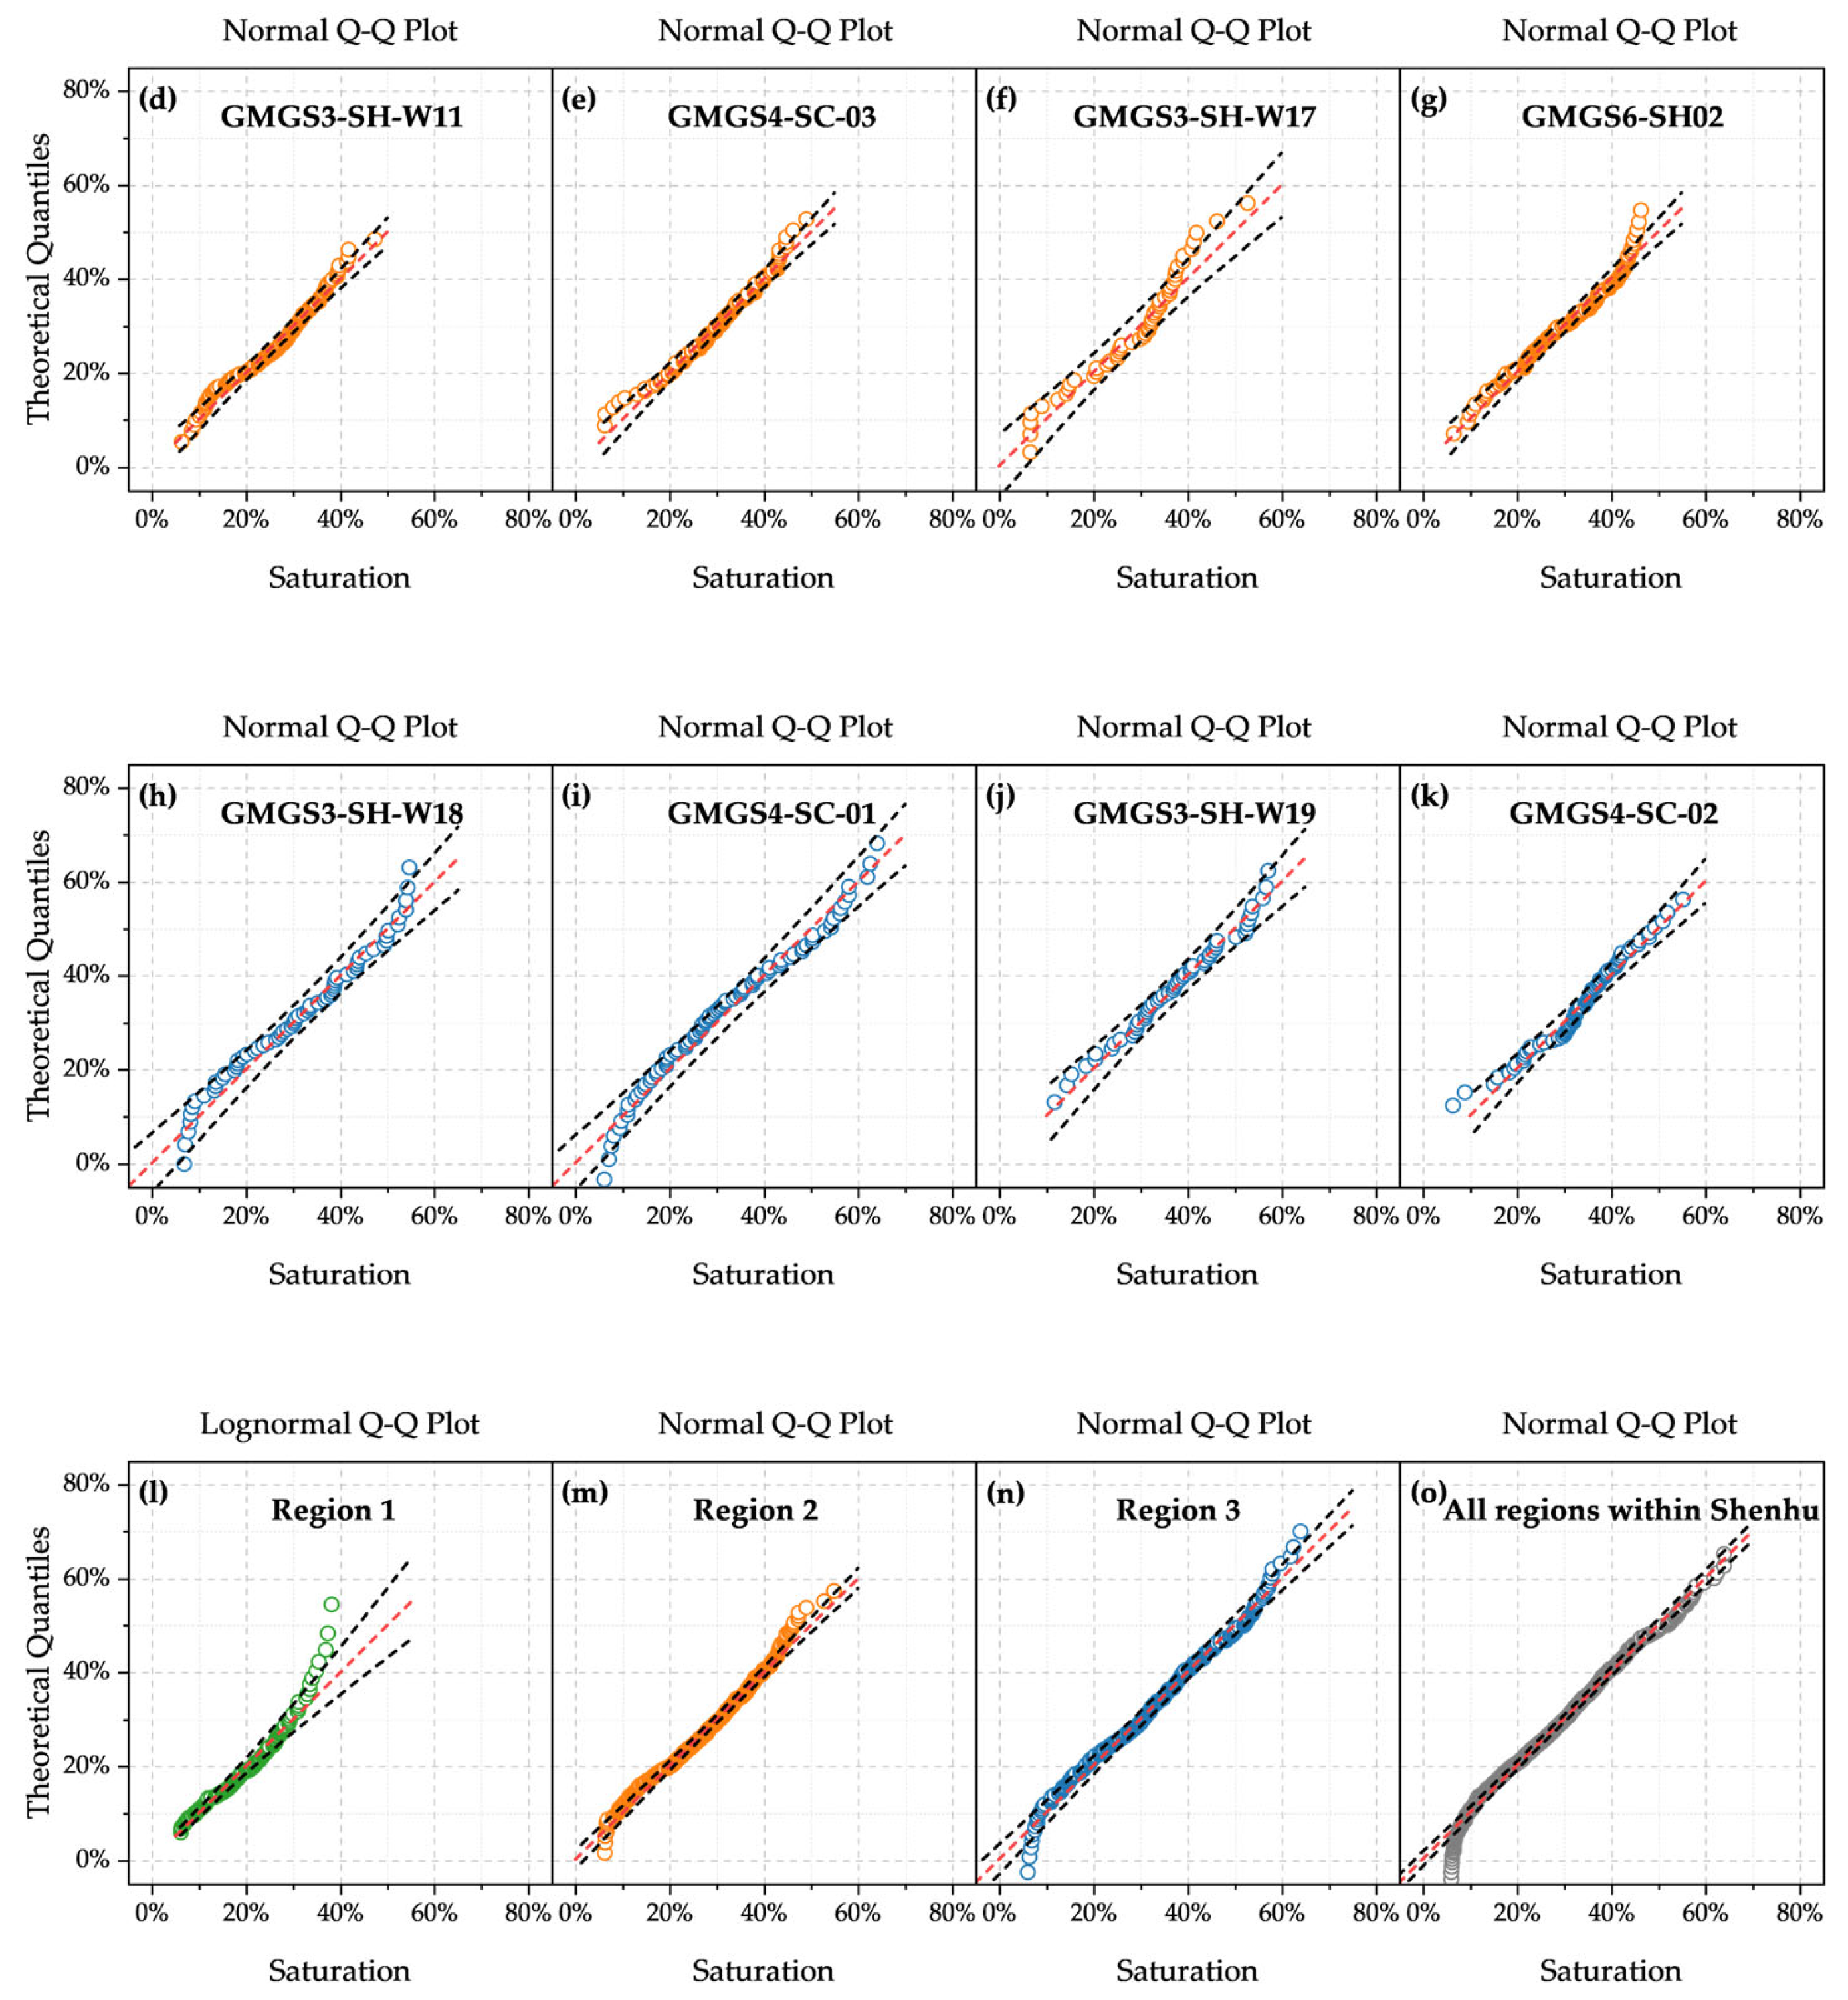
The mean and standard deviation of hydrate saturation are summarized in Table 3. Figure 5 presents the histograms and the probability distribution curves. An overall normal distribution pattern is observed in Region 2 and Region 3. The data in Region 1 follow a predominantly log-normal distribution. The near-linear trends in the Q–Q plots support the validity of the assumed distributions, confirming a reasonable goodness of fit (Figure 6). Across all regions in the Shenhu area, hydrate saturation ranges from 10% to 60%, with a mean value of 29% and a standard deviation of 12%. Notably, 60% of values cluster in the range of 20% to 40%.
Descriptive statistical analysis reveals substantial regional differences in gas hydrate saturation. Region 1 has the lowest mean saturation among the three regions, with a maximum value of only 40%. The relatively low saturation observed in Region 1 probably result from either reduced flux intensity or the development alternative migration pathways [69]. Further evidence from Black Sea hydrate-bearing sediments indicates that spatial heterogeneity stems from lithological intercalations, which disrupt lateral continuity, and from seabed morphology, which modulates bottom-water heat exchange and regional heat flow, thereby producing patchy distributions [70,71]. Although Region 3 exhibits the highest mean value, the data points show considerable dispersion, with the highest standard deviation among all regions. This variability is further evidenced by the pronounced vertical fluctuations observed in the saturation logging curves (Figure 5h–k). This phenomenon may be attributed to the occurrence of thin gas hydrate layers interbedded with mud and sand [72]. Such lithological alternation disrupts the vertical continuity of hydrate accumulations and leads to inconsistent saturation values across sampling depths [54]. While Region 2 has a slightly lower mean gas hydrate saturation than Region 3, the overall saturation ranges of the two regions are comparable. Region 2 is further characterized by a more clustered distribution and lower standard deviation. Logging data reveal the presence of vertically continuous, high-saturation hydrate-bearing layers with thicknesses exceeding 50 m. These favorable reservoir characteristics supported the selection of Region 2 as the site for China’s two gas hydrate trial production projects [10,11].

3.2.2. Spatial Variability

Geostatistical modeling is based on the principle of spatial dependence, wherein observations at nearby locations tend to be more similar due to inherent spatial continuity. Using this spatial correlation, geostatistical methods can infer hydrate saturation in unsampled or sparsely surveyed areas, thereby improving the spatial resolution of reservoir characterization. Such modeling typically involves quantifying spatial correlation by calculating a variogram, which describes how the similarity between data points decreases as the Euclidean distance between them increases (commonly referred to as the lag distance):
γ h = 1 2 N h N h Z x Z x + h 2
where Z represents the variable in the random field; h denotes the lag distance; and N is the number of data pairs separated by distance h.
The variogram provides three critical parameters: the nugget, which represents measurement error or microscale variability; the range, which defines the distance beyond which spatial dependence becomes negligible; and the sill, defined as the sum of the nugget and partial sill, represents the total variability, encompassing both structural variation and random noise [73]. In this study, the spatial distribution of hydrate saturation was primarily characterized by calculating the experimental variogram using available data across multiple lag distances. Subsequently, exponential model were fitted to the experimental variogram to derive the spatial parameters required for geostatistical simulation [74]:
γ h = C 0 + C C 0 × 1 exp 3 h a
where C0, C, and a denote the nugget, sill and range, respectively.
Empirical variograms were constructed using ordinary kriging. A lag spacing of 0.5 m was selected to match the resolution of the processed well logs and ensure sufficient data pairs for stable variogram modeling, while a bandwidth of 1.0 m was applied to constrain sample pairing within a narrow vertical window.
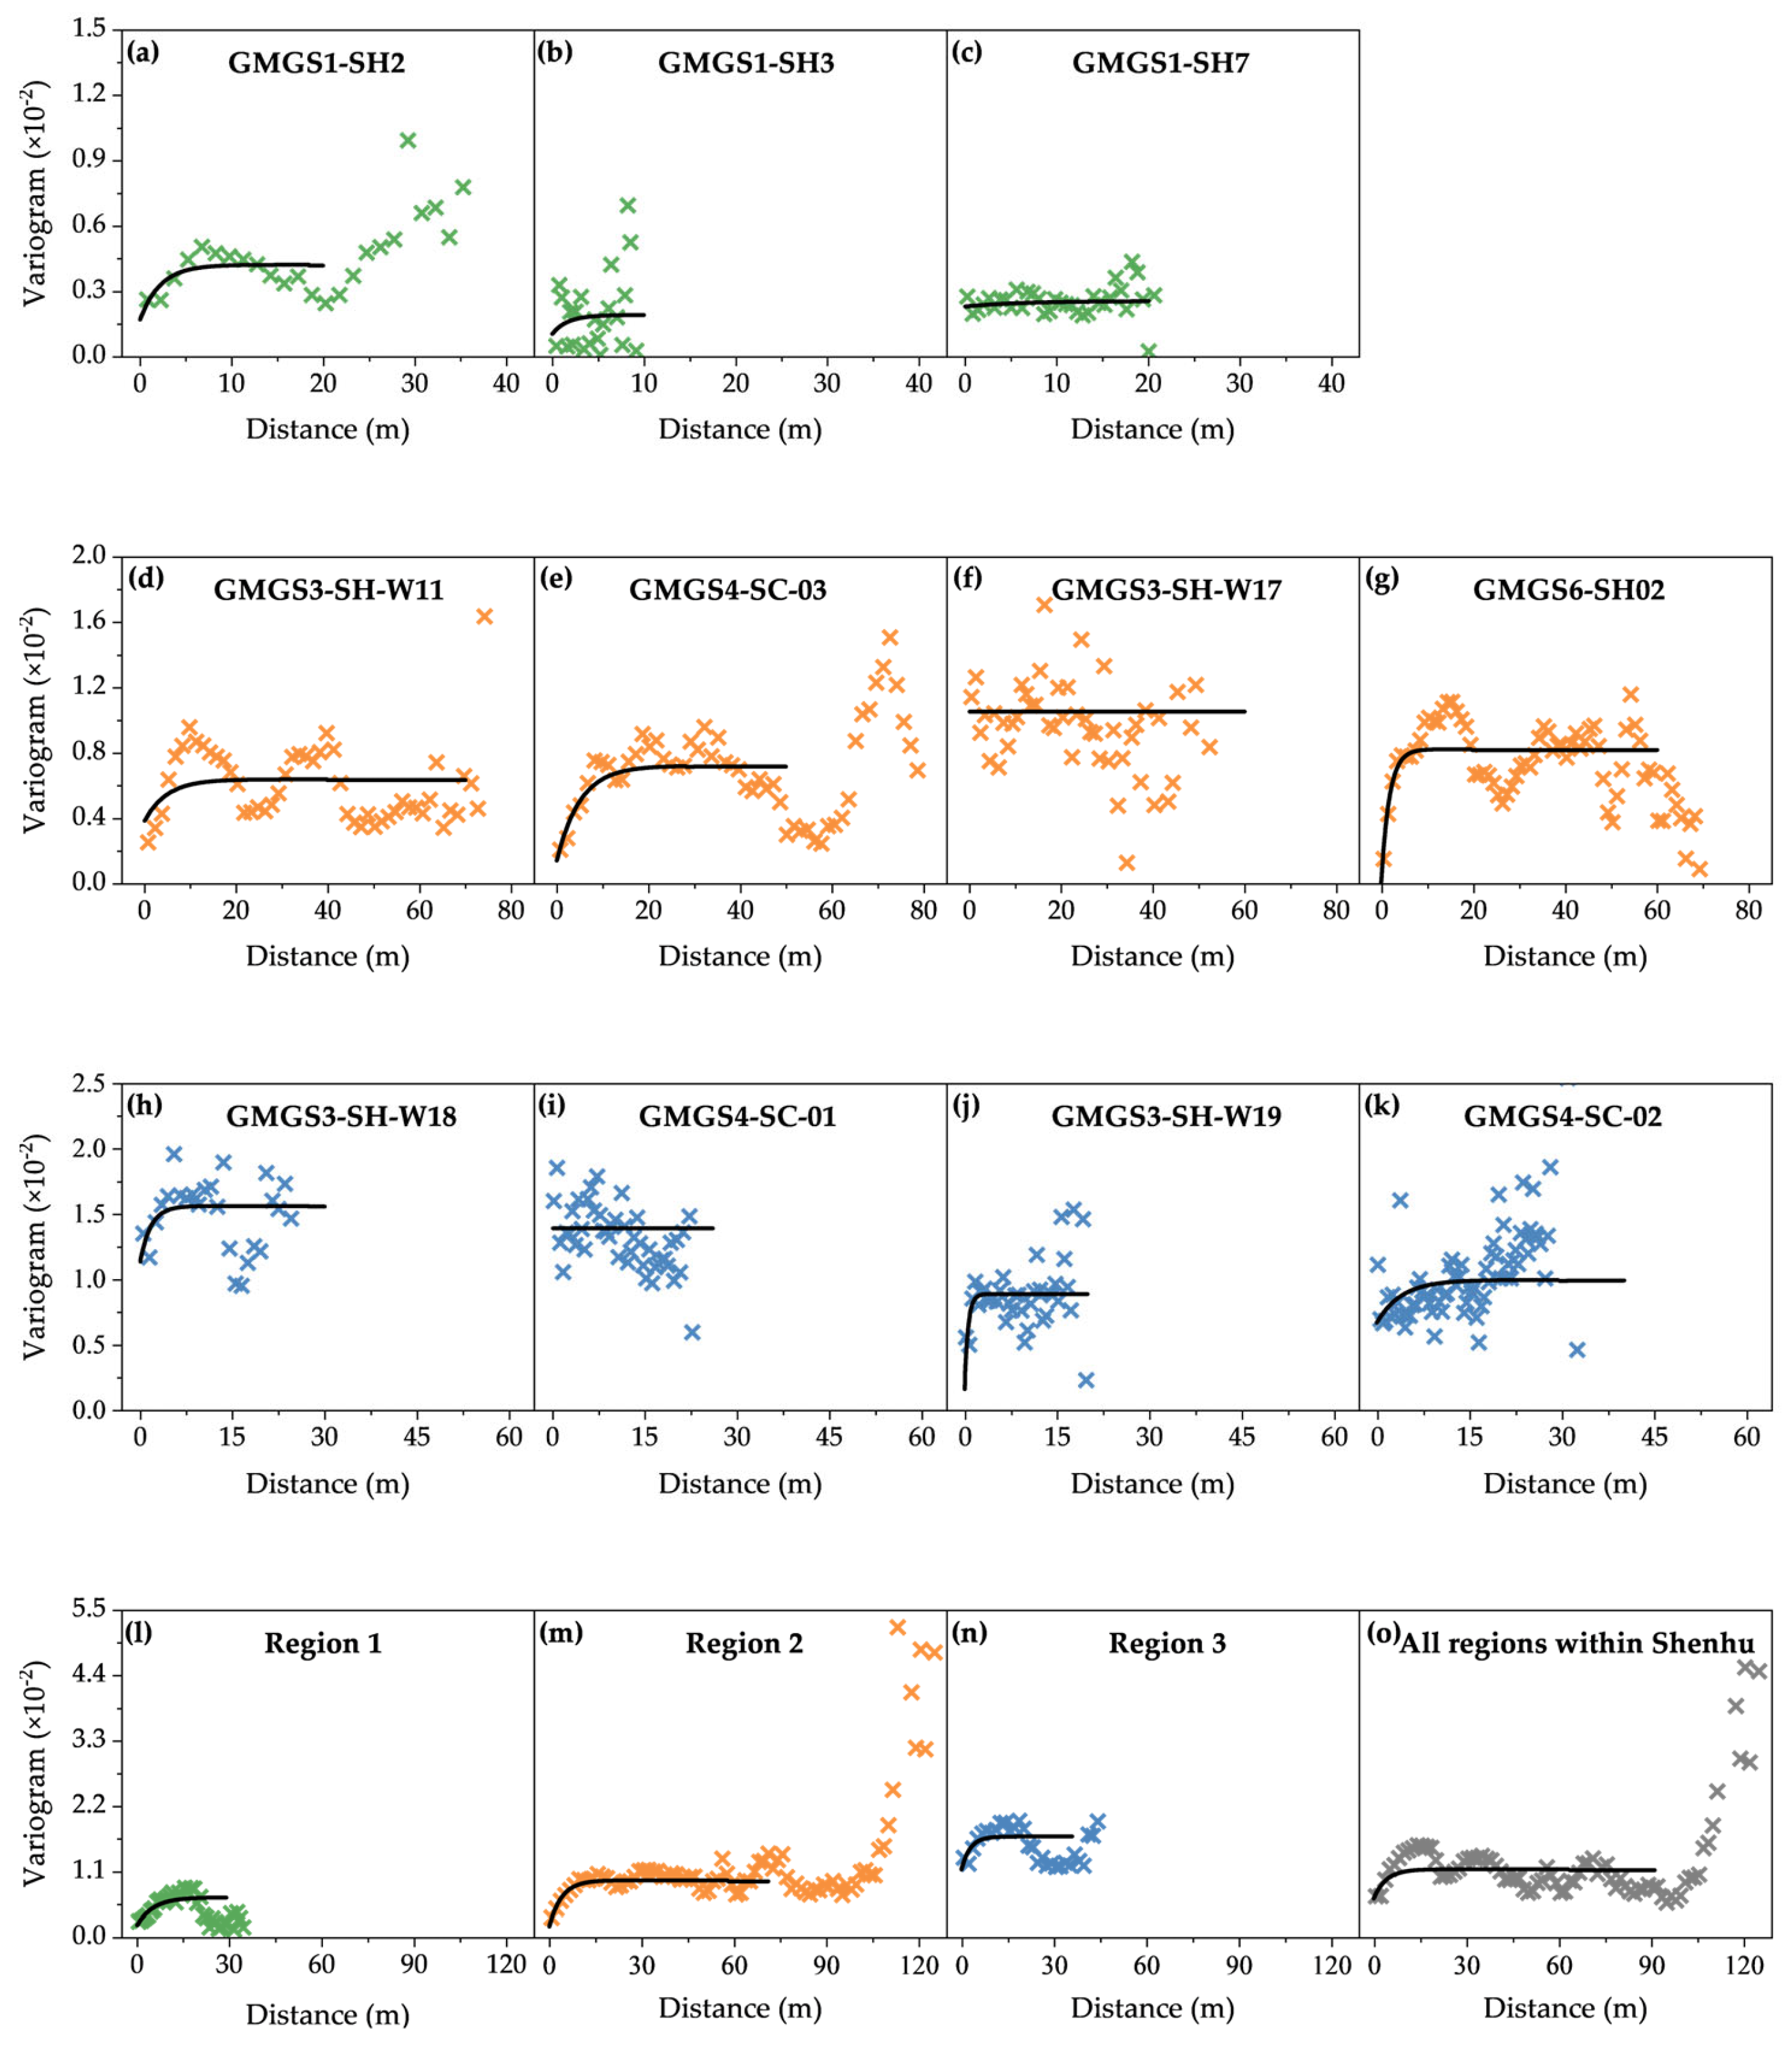
Figure 7 presents the experimental variograms of hydrate saturation derived from various sites and regions, along with their corresponding fitted theoretical curves. Most sites and subregions demonstrate clear spatial correlation, as evidenced by experimental variograms that increase with lag distance and then flatten out at the sill, excluding SH3, SH7, W17, SC01, and SC02 without such a trend. Beyond this point, the variograms reach a plateau, indicating that the data points become spatially uncorrelated and behave in a random pattern.
A summary of the fitted model parameters is provided in Table 4. For the Shenhu Area, the fitted variogram model is characterized by a vertical range of 12 m and a sill of 0.012, with the nugget effect accounting for 0.007 and the partial sill for 0.005. The root mean squared error (RMSE) of the fitting indicates effectively identified the range parameters. This vertical range indicates that spatial correlation between two points along the depth direction remains strong when the lag distance is less than 12 m. Beyond this threshold, the correlation becomes weak or negligible. The nugget effect in the Shenhu Area accounts for 0.007 of the total variance, indicating a relatively small component of variability that occurs at very short spatial distances (microscale) or arises from measurement errors.
Moreover, the strong vertical spatial continuity of hydrate saturation is reflected by the high partial sill values. In particular, Region 2 exhibited the highest partial sill (0.008) among all regions, indicating a greater degree of spatial correlation along the depth direction compared to others. A more detailed comparison of the four sites within Region 2 further reveals that W17 stands out, with a partial sill value of 0.011, suggesting strong stratigraphic continuity of hydrate-bearing layers at this location. This finding is consistent with seismic observations from the W17 ore body, where the seismic data revealed a rare hydrate-bearing structure characterized by vertically continuous and well-developed thick layers [75]. Consequently, W17 was selected as the preferred target area for China’s first gas hydrate test production in 2017 [76].
Figure 8 analyzes the horizontal distribution characteristics in the Shenhu area. Owing to the spatial separation of over 5 km between regions, the experimental variogram displays only a few isolated clusters of data points. This phenomenon arises from the use of regionally sparse borehole data in the variogram calculation, which fails to adequately capture meaningful spatial continuity. Furthermore, even within each individual region, the sparse horizontal distribution of boreholes results in an insufficient number of data pairs for computing reliable horizontal variograms. As a result, horizontal spatial correlation cannot be effectively assessed, and the geostatistical analysis in this study is constrained to the vertical direction.

3.3. Sediment Properties

3.3.1. Porosity

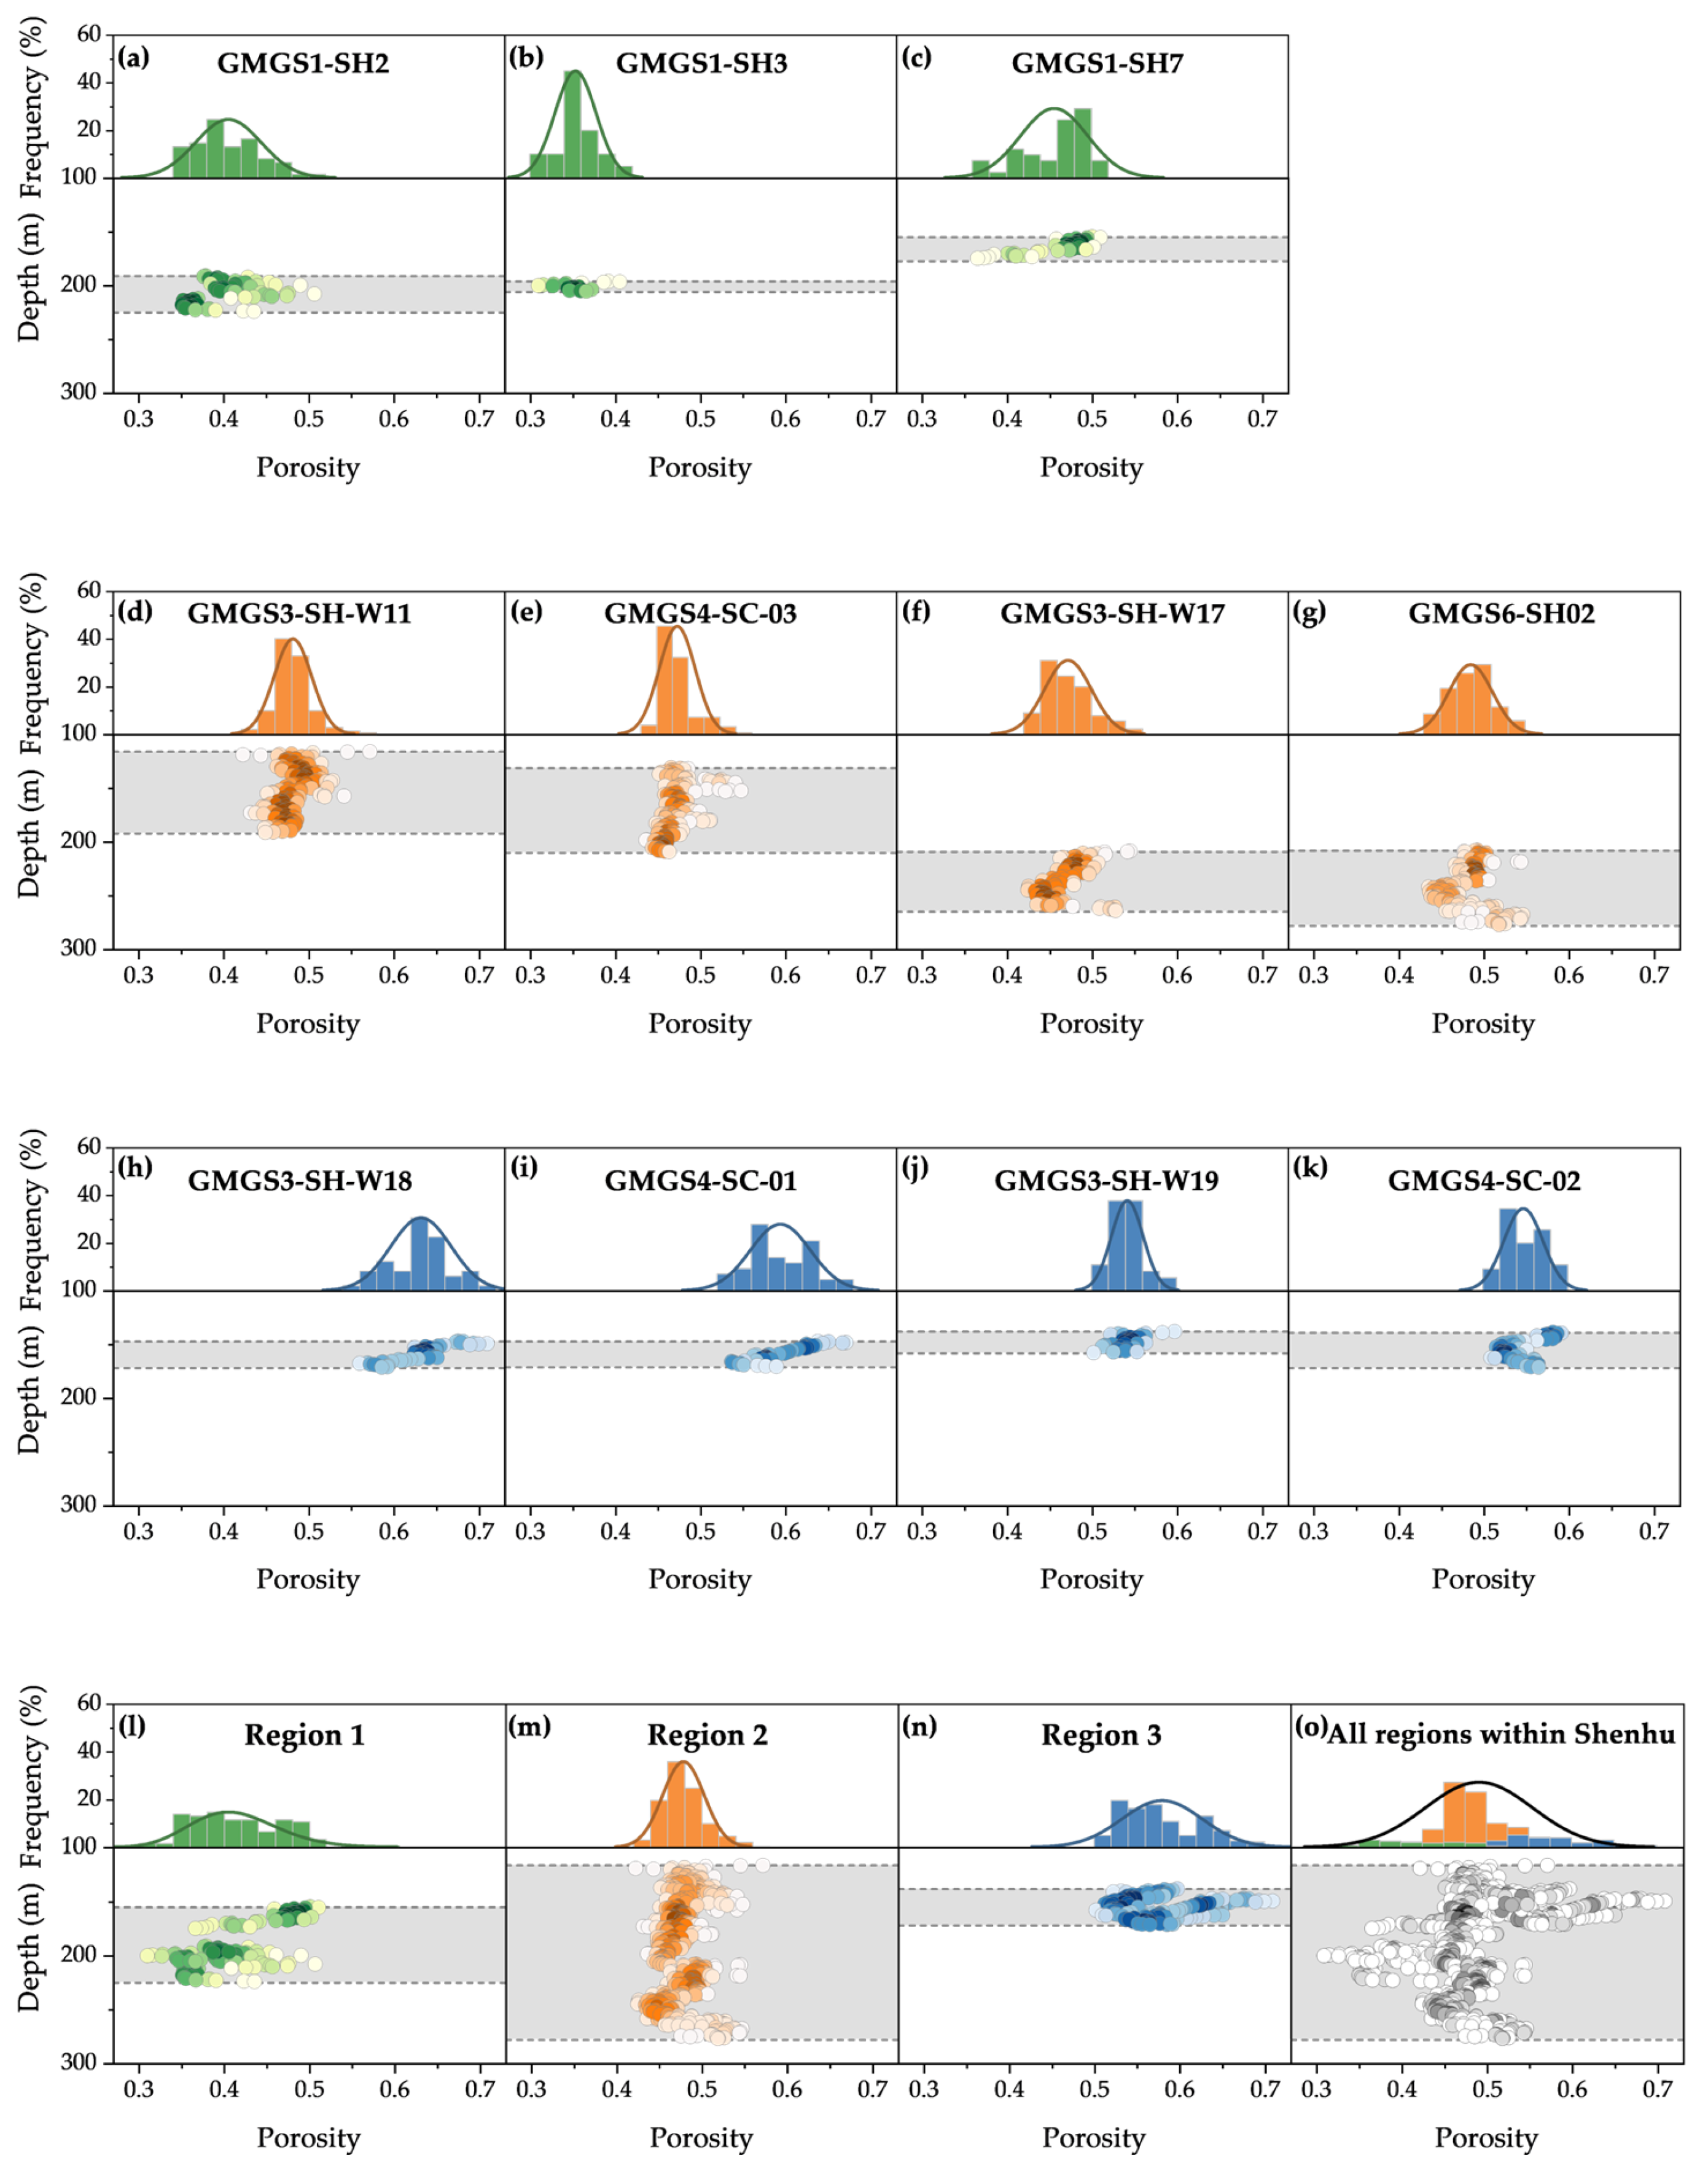
The formation porosity is a critical parameter that indicates the storage capacity of sediments and is commonly used to assess resource potential [77]. Regions with higher porosity tend to have more developed pore networks, promoting the occurrence and accumulation of gas hydrates, and may also serve as major pathways or accumulation zones for gas migration [78,79]. Figure 9 reveals pronounced differences in porosity among the sites, with point colors mapped according to the local sampling density in the plot.
As presented in Table 5, A total of 832 data points for porosity from the Shenhu Area were analyzed, yielding a mean of 0.49 and a standard deviation of 0.06. And the average porosity values follow the order: Region 3 > Region 2 > Region 1. This trend is closely linked to regional differences in sediment composition. Region 1 exhibited the lowest porosity, which may be attributed to the presence of more compacted or clay-rich sediments [80]. The highest porosity observed in Region 3 likely reflects a sedimentary environment dominated by coarse-grained or loosely packed materials, resulting in a more developed pore structure.
Region 2 showed a mean porosity of 0.48 with the lowest variability among the three regions. This reduced variability likely reflects a more homogeneous depositional setting and consistent sediment characteristics. These sites in this region may correspond to preferential zones for hydrate accumulation, with implications for reservoir quality and production potential. Overall, these findings provide valuable insights into the spatial heterogeneity of hydrate-bearing sediments in the Shenhu Area.

3.3.2. Permeability

In this study, the intrinsic permeability of hydrate-bearing sediments is estimated using the Kozeny-Carman equation, which incorporates both grain size and the nonlinear influence of porosity. It is based on the closely graded ball packing theory, wherein the sediment matrix is idealized as a collection of uniformly sized spherical particles [81].
k 0 = Φ 3 d 2 180 1 Φ 2
where k0 represents the intrinsic permeability of the hydrate-bearing sediments; d is the average diameter of the sediment particles, and Φ denotes the porosity. Intrinsic permeability values were calculated based on representative particle sizes and porosity data, with the latter derived from site-specific averages obtained through statistical analysis. According to the survey, the Shenhu Area is predominantly composed of fine-grained sediments that host two primary types of hydrate reservoirs, clay and siltstone [50]. The average diameters for these sediments are approximately 3 μm and 9 μm, respectively [82].
Effective permeability refers to the actual fluid flow capacity of hydrate-bearing sediments, which is typically reduced due to pore space occupation by hydrates during dissociation. Numerous researchers have conducted experimental investigations to better characterize this behavior and quantify the impact of hydrate presence on flow dynamics. A common approach involves using normalized permeability, defined as the ratio of the permeability of hydrate-bearing sediments to the intrinsic permeability of the host sediment matrix. Yin demonstrated that the fitted empirical relationship offers a more accurate estimation of permeability for low-permeability, weakly consolidated sediments in the South China Sea [83].
k r = k e k 0 = 1 S h 3.6 1 + S h 2.58
Table 6 presents the derived intrinsic permeability range corresponding to this spectrum of particle sizes, with values spanning nearly two orders of magnitude, from 5.1 to 822 mD (equivalent to 5.10 × 10⁻¹⁵ to 8.22 × 10⁻¹³ m2). This pronounced variability in permeability reflects the strong dependence of fluid flow capacity on particle size, porosity, and sediment structure. The estimated effective permeability ranges from 3 to 100 mD. Permeability reduction reaches up to 92% relative to hydrate-free conditions, with typical reductions clustering around 20%.

3.4. Strength Parameters

3.4.1. Logging-Based Estimation

The strength parameters of hydrate-bearing sediments are estimated using extended logging-based empirical correlations, which are widely applied in oil and gas exploration [84,85]. The cohesion and internal friction angle of the sediments are correlated with P-wave and shear-wave velocities, where the shear-wave velocity is calculated using an empirical relationship proposed by [86].
c = 5.44 × 1 0 - 3 1 + μ d 1 μ d 2 × ρ 2 v p 4 1 + 0.78 V c 1
φ = 2.564 l g N + N 2 + 1 + 20
where
v s = v p 1.36 / 1.16
μ d = v p 2 2 v s 2 / 2 v p 2 v s 2
V c 1 = 2.88 v p 5.18 v p + 0.9
N = 58.93 1.785 × c
The strength parameters derived from acoustic logging data are presented in Table 7. The cohesion ranges from 0.5 to 3 MPa, while the internal friction angle is confined between 25.2° and 25.3°. This narrow range suggests that the presence of gas hydrates does not significantly affect the internal friction angle. According to statistical analysis, the cohesion in the Shenhu area has a mean value of approximately 1.34 MPa with a standard deviation of ±0.5 MPa, while the internal friction angle averages around 25.26° with a standard deviation of ±0.02°. The mean values of both strength parameters are comparable across the three regions, indicating minimal regional differences in mechanical strength. This suggests that the mechanical behavior of hydrate-bearing sediments in the Shenhu area is relatively consistent at the regional scale.
As shown in Figure 10, zones with higher gas hydrate saturation generally correspond to higher cohesion values. This is attributed to the role of hydrates as intergranular cementing agents, which substantially enhance sediment cohesion. In contrast, the internal friction angle exhibits a slightly decreasing trend with increasing hydrate saturation. This behavior may be related to the fact that the coefficient of friction between hydrate crystals is generally lower than that of mineral grains, particularly when hydrates form part of the sediment skeleton. The presence of gas hydrates appears to have minimal influence on the internal friction angle, and the probability density curves are sharply peaked, indicating limited variability with depth.

3.4.2. Laboratory Measurement

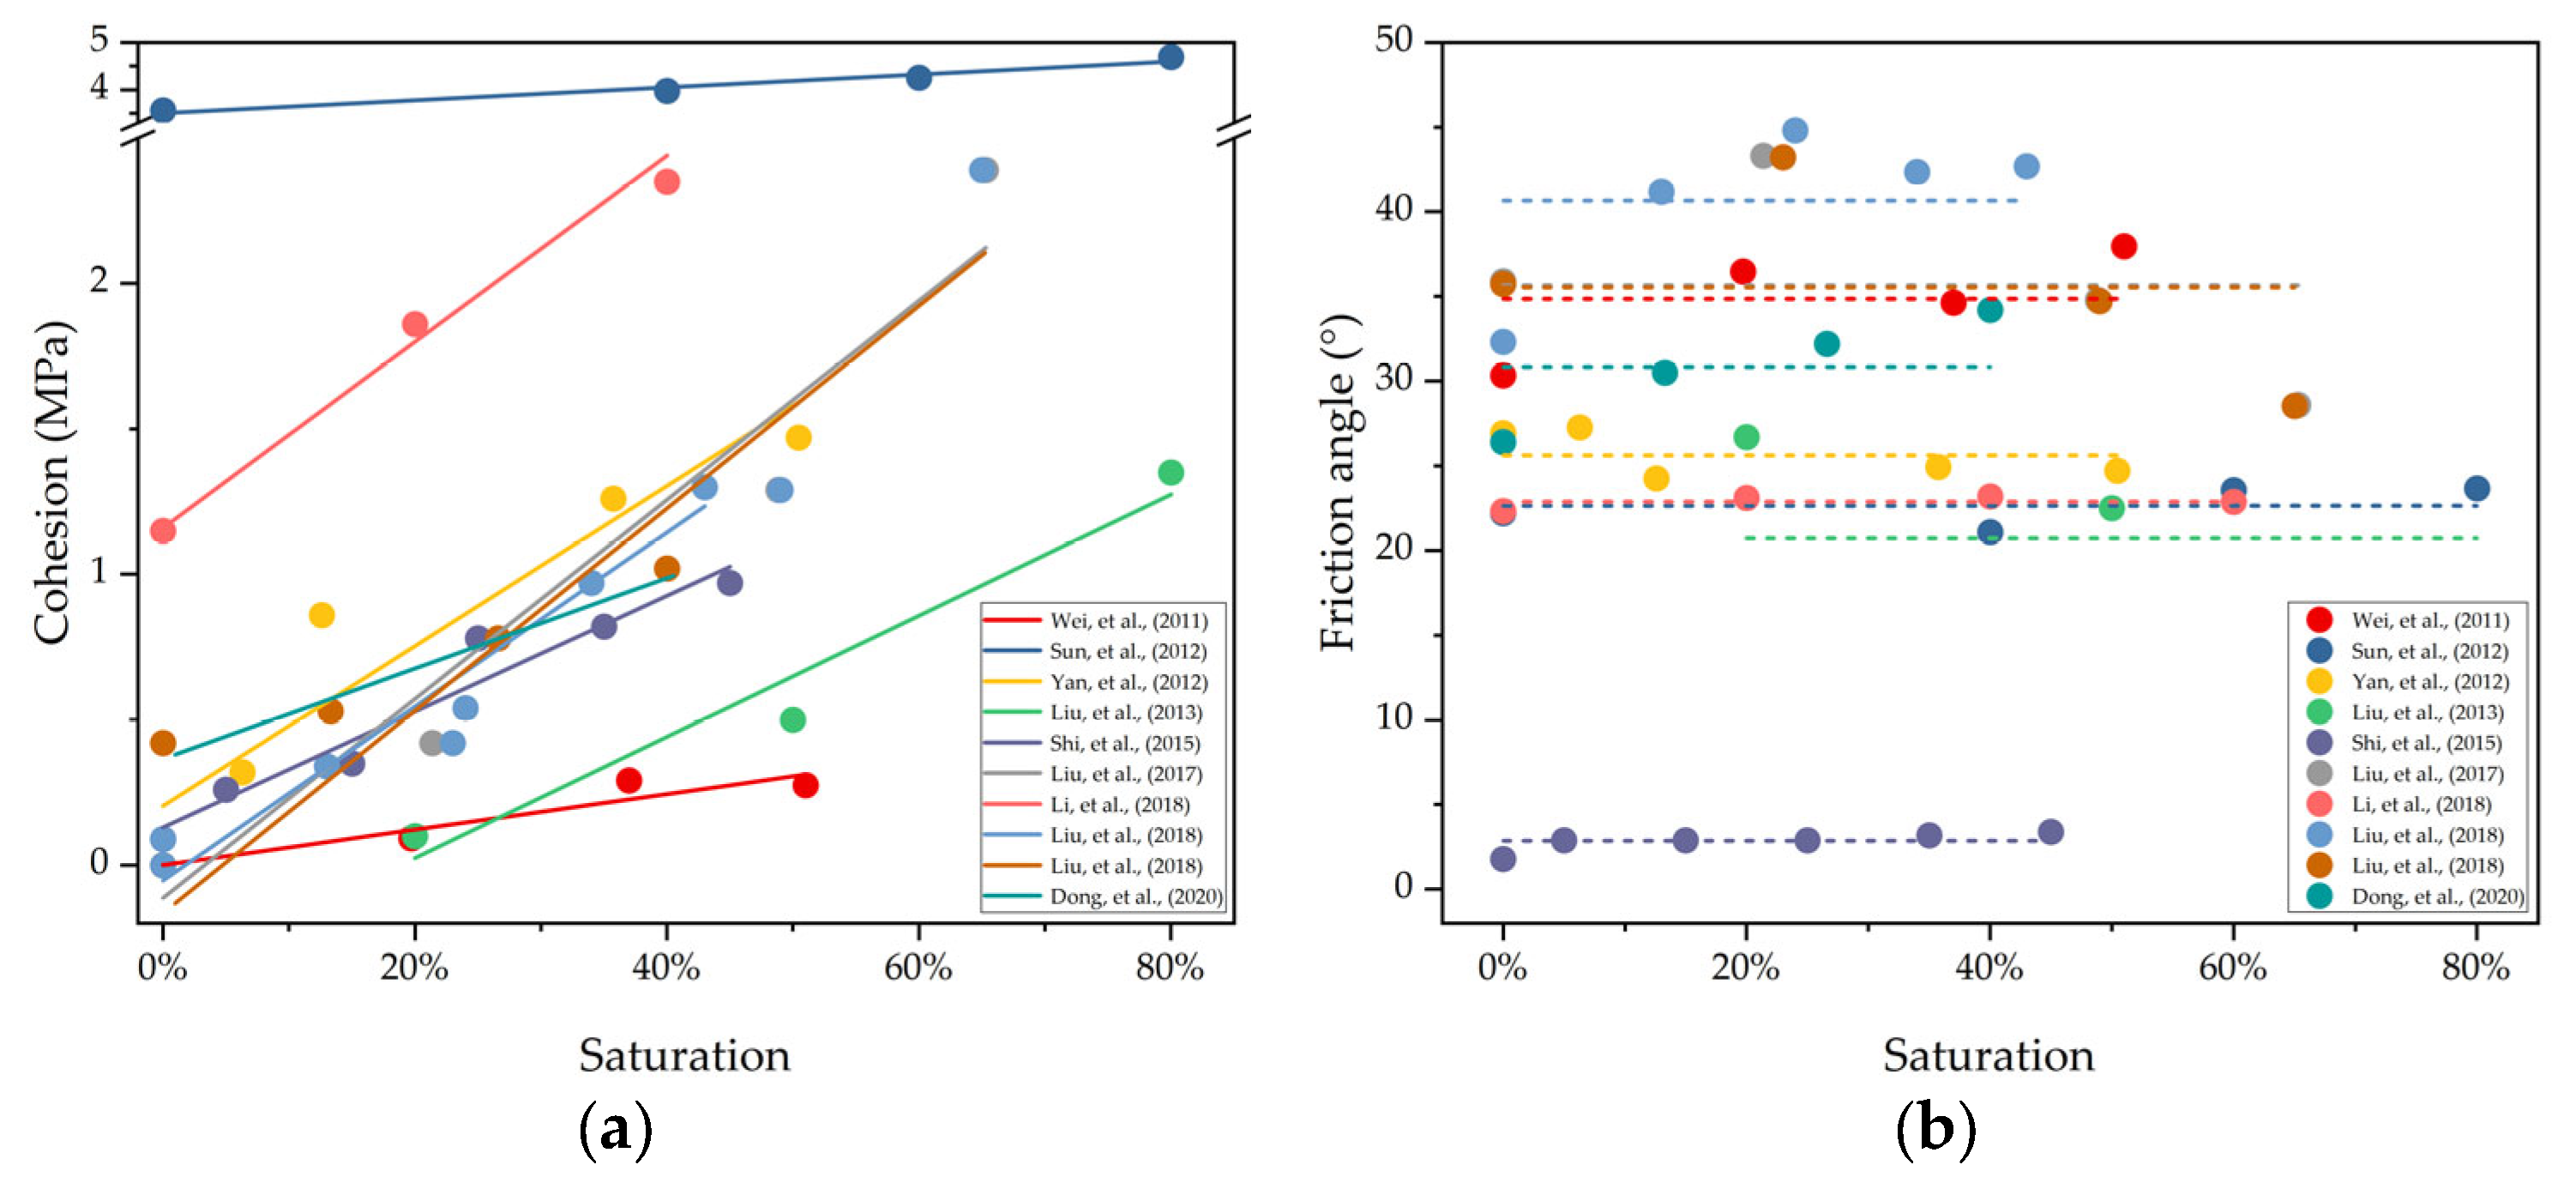
In addition to the preliminary estimation of hydrate reservoir mechanical parameters based on logging data, the relationship between strength parameters and hydrate saturation has also been investigated through laboratory experiments. Figure 11 summarizes published values of cohesion and internal friction angle for hydrate-bearing sediments derived from laboratory tests. The cohesion values obtained from laboratory experiments predominantly range between 0.5 and 2.5 MPa, which are slightly lower than those estimated from acoustic velocity-based calculations, yet remain within the same order of magnitude. In contrast, the friction angles measured in laboratory settings tend to be marginally higher than the logging-based estimates, but do not exceed 45°.
As shown in Figure 11a, cohesion exhibits a linear increase with increasing hydrate saturation, consistent with findings from previous studies [87,88,89]. The fitting results (Table 8) showed that the experimental data from different studies yielded high R2 values. This suggests that, under certain conditions requiring rapid estimation, the cohesive strength of hydrate-bearing sediments can be reasonably predicted from hydrate saturation using a first-order linear equation. While the internal friction angle appears to be nearly independent of hydrate saturation, as illustrated in Figure 11b, which is consistent with the trends observed from the logging-based estimates.

4. Conclusions

This study compiled and analyzed drilling data from eleven boreholes across four drilling expeditions in the Shenhu Area of the South China Sea to characterize hydrate reservoir properties. The resulting database and geostatistical workflows lay the foundation for cost-effective, reservoir-scale 3D modeling of hydrate reservoirs.
By establishing first-order relationships between water depth and the depths of the top and base of the gas hydrate occurrence zone, this study enables the preliminary estimation of stratigraphic boundaries within acceptable error margins. Statistical analyses of key geological parameters, such as hydrate saturation, formation porosity, and the intrinsic permeability of hydrate-bearing sediments, yielded representative mean values of 29.2%, 0.49, and range of 23~204 mD, for the Shenhu Area. The results provide essential input for geological modeling and gas production forecasting from hydrate reservoirs. In addition, the mechanical strength parameters were estimated based on logging and laboratory tests, with cohesion and internal friction angle predicted to be approximately 1.34 MPa and 25.26°, respectively. These data are essential for evaluating potential engineering hazards related to hydrate exploitation.
Beyond basic statistics, the spatial variability of hydrate saturation was also investigated. A geostatistical analysis of Region 2 (covering the W11–W17 boreholes) revealed a vertical correlation range of 12 m, minimal nugget effects of 0.002 indicating strong local continuity. These findings offer guidance for the preferential selection of hydrate target zones.

Author Contributions

Conceptualization, L.T.; methodology, L.T. and X.F.; formal analysis, X.F.; data curation, X.F.; writing—original draft preparation, X.F.; writing—review and editing, L.T.; visualization, X.F.; funding acquisition, L.T. All authors have read and agreed to the published version of the manuscript.

Funding

This research was funded by the Chinese National Natural Science Foundation, grant numbers 42206219, U20B6005.

Institutional Review Board Statement

Not applicable.

Informed Consent Statement

Not applicable.

Data Availability Statement

Data associated with this research are available and can be obtained by contacting the corresponding author upon reasonable request.

Conflicts of Interest

Author Lin Tan was employed by the company Water Supply Branch Company. The remaining authors declare that the research was conducted in the absence of any commercial or financial relationships that could be construed as a potential conflict of interest.

References

  1. Collett, T. Natural Gas Hydrates—Vast Resource, Uncertain Future; US Geological Survey: Reston, CA, USA, 2001. [Google Scholar]
  2. Wu, N.Y.; Holland, M.; Schultheiss, P.J. Successful and surprising results for China’s first gas hydrate drilling expedition. Fire Ice Methane Hydrate Newsl. 2007, 7, 6–9. [Google Scholar]
  3. Zhang, G.; Yang, S.; Zhang, M.; Liang, J.; Lu, J.; Holland, M.; Schultheiss, P. GMGS2 expedition investigates rich and complex gas hydrate environment in the South China Sea. Fire Ice Methane Hydrate Newsl. 2014, 14, 1–5. [Google Scholar]
  4. Yang, S.; Zhang, M.; Liang, J.; Lu, J.; Zhang, Z.; Holland, M.; Schultheiss, P.; Fu, S.; Sha, Z. Preliminary Results of China’s Third Gas Hydrate Drilling Expedition: A Critical Step From Discovery to Development in the South China Sea. Fire Ice Methane Hydrate Newsl. 2015, 15, 1–6. [Google Scholar]
  5. Yang, S.; Liang, J.; Lei, Y.; Gong, Y.; Xu, H. GMGS4 gas hydrate drilling expedition in the South China Sea. Fire Ice Methane Hydrate Newsl. 2017, 17, 7–11. [Google Scholar]
  6. Ye, J.; Wei, J.; Liang, J.; Lu, J.; Lu, H. Complex gas hydrate system in a gas chimney, South China Sea. Mar. Pet. Geol. 2019, 104, 29–39. [Google Scholar] [CrossRef]
  7. Qin, X.W.; Lu, J.A.; Lu, H.L.; Qiu, H.J.; Liang, J.Q.; Kang, D.J.; Zhan, L.S.; Lu, H.F.; Kuang, Z.G. Coexistence of natural gas hydrate, free gas and water in the gas hydrate system in the Shenhu Area, South China Sea. China Geol. 2020, 3, 210–220. [Google Scholar] [CrossRef]
  8. Kang, D.; Zhang, Z.; Lu, J.; Phillips, S.C.; Liang, J.; Deng, W.; Zhong, C.; Meng, D. Insights on gas hydrate formation and growth within an interbedded sand reservoir from well logging at the Qiongdongnan basin, South China Sea. Mar. Geol. 2024, 475, 107343. [Google Scholar] [CrossRef]
  9. Kuang, Z.; Cook, A.; Ren, J.; Deng, W.; Cao, Y.; Cai, H. A Flat-Lying Transitional Free Gas to Gas Hydrate System in a Sand Layer in the Qiongdongnan Basin of the South China Sea. Geophys. Res. Lett. 2023, 50, e2023GL105744. [Google Scholar] [CrossRef]
  10. Li, J.F.; Ye, J.L.; Qin, X.W.; Qiu, H.J.; Wu, N.Y.; Lu, H.L.; Xie, W.W.; Lu, J.A.; Peng, F.; Xu, Z.Q.; et al. The first offshore natural gas hydrate production test in South China Sea. China Geol. 2018, 1, 5–16. [Google Scholar] [CrossRef]
  11. Ye, J.L.; Qin, X.W.; Xie, W.W.; Lu, H.L.; Ma, B.J. Main progress of the second gas hydrate trial production in the South China Sea. Geol. China 2020, 47, 557–568. [Google Scholar]
  12. Lall, D.; Vishal, V.; Lall, M.V.; Ranjith, P.G. The role of heterogeneity in gas production and the propagation of the dissociation front using thermal stimulation, and huff and puff in gas hydrate reservoirs. J. Pet. Sci. Eng. 2022, 208, 109320. [Google Scholar] [CrossRef]
  13. Gong, Y.; Xu, T.; Yuan, Y.; Xin, X.; Zhu, H. Optimal design of the field hydrate production test in the offshore India: Insights from the vertically heterogeneous hydrate reservoir model. J. Nat. Gas Sci. Eng. 2022, 103, 104645. [Google Scholar] [CrossRef]
  14. Cao, X.; Sun, J.; Ning, F.; Zhang, H.; Wu, N.; Yu, Y. Numerical analysis on gas production from heterogeneous hydrate system in Shenhu area by depressurizing: Effects of hydrate-free interlayers. J. Nat. Gas Sci. Eng. 2022, 101, 104504. [Google Scholar] [CrossRef]
  15. Niu, Q.; Zhao, X.; Chang, J.; Qi, X.; Shangguan, S.; Wang, W.; Yuan, W.; Wang, Q.; Ma, K.; Zhang, Z.; et al. Numerical simulation on physical composite stimulation and geothermal development performance of hot dry rock: A Case study from Matouying Uplift, China. Appl. Therm. Eng. 2025, 267, 125714. [Google Scholar] [CrossRef]
  16. Wang, F.T.; Zhao, B.; Li, G. Prevention of Potential Hazards Associated with Marine Gas Hydrate Exploitation: A Review. Energies 2018, 11, 2384. [Google Scholar] [CrossRef]
  17. Chen, X.; Lu, H.; Zhang, J.; Ye, J.; Xie, W. Economic Critical Resources for the Industrial Exploitation of Natural Gas Hydrate. Acta Geol. Sin. (Engl. Ed.) 2022, 96, 663–673. [Google Scholar] [CrossRef]
  18. Niu, Q.; Hu, M.; Chang, J.; Wang, W.; Yuan, W.; Wang, Q.; Zheng, Y.; Shang, S. Explosive fracturing mechanism in low-permeability sandstone-type uranium deposits considering different acidification reactions. Energy 2024, 312, 133676. [Google Scholar] [CrossRef]
  19. Jin, J.; Wang, X.; Guo, Y.; Li, J.; Li, Y.; Zhang, X.; Qian, J.; Sun, L. Geological controls on the occurrence of recently formed highly concentrated gas hydrate accumulations in the Shenhu area, South China Sea. Mar. Pet. Geol. 2020, 116, 104294. [Google Scholar] [CrossRef]
  20. Su, P.; Liang, J.; Zhang, W.; Liu, F.; Wang, F.; Li, T.; Wang, X.; Wang, L. Natural gas hydrate accumulation system in the Shenhu sea area of the northern South China Sea. Nat. Gas Ind. 2020, 40, 77–89. [Google Scholar]
  21. Wang, X.; Jin, J.; Guo, Y.; Li, J. The characteristics of gas hydrate accumulation and quantitative estimation in the north slope of South China Sea. Earth Sci. 2021, 46, 1038–1057. Available online: https://www.scielo.br/j/eagri/a/XRdYQpjHFQSwSCWxT3QtxDv/?format=pdf&lang=pt (accessed on 5 August 2025).
  22. Hassan, W.; Qasim, M.; Alshameri, B.; Shahzad, A.; Khalid, M.H.; Qamar, S.U. Geospatial intelligence in geotechnical engineering: A comprehensive investigation into SPT-N, soil types, and undrained shear strength for enhanced site characterization. Bull. Eng. Geol. Environ. 2024, 83, 380. [Google Scholar] [CrossRef]
  23. Yang, H.Q.; Chu, J.; Qi, X.; Wu, S.; Chiam, K. Bayesian evidential learning of soil-rock interface identification using boreholes. Comput. Geotech. 2023, 162, 105638. [Google Scholar] [CrossRef]
  24. Zhang, R.; Li, T.; Liu, C.; Li, F.; Deng, X.; Shi, H. Three-dimensional joint inversion of gravity gradient data based on data space and sparse constrains. Chin. J. Geophys. 2021, 64, 1074–1089. [Google Scholar]
  25. Shi, C.; Wang, Y. Data-driven construction of Three-dimensional subsurface geological models from limited Site-specific boreholes and prior geological knowledge for underground digital twin. Tunn. Undergr. Space Technol. 2022, 126, 104493. [Google Scholar] [CrossRef]
  26. Lei, J.; Fang, H.; Zhu, Y.; Chen, Z.; Wang, X.; Xue, B.; Yang, M.; Wang, N. GPR detection localization of underground structures based on deep learning and reverse time migration. NDT E Int. 2024, 143, 103043. [Google Scholar] [CrossRef]
  27. Wang, X.; Wu, S.; Lee, M.; Guo, Y.; Yang, S.; Liang, J. Gas hydrate saturation from acoustic impedance and resistivity logs in the shenhu area, south china sea. Mar. Pet. Geol. 2011, 28, 1625–1633. [Google Scholar] [CrossRef]
  28. Yang, S.; Lei, Y.; Liang, J.; Holland, M.; Schultheiss, P.; Lu, J. Concentrated Gas Hydrate in the Shenhu Area, South China Sea: Results From Drilling Expeditions GMGS3 & GMGS4. In Proceedings of the 9th International Conference on Gas Hydrates, Denver, CO, USA, 25–30 June 2017; Available online: http://www.geotek.co.uk/wp-content/uploads/2017/10/YangHollandICGH9.pdf (accessed on 5 August 2025).
  29. Ning, F.; Wu, N.; Li, S.; Zhang, K.; Yu, Y.; Liu, L.; Sun, J.; Jiang, G.; Sun, C.; Chen, G. Estimation of in-situ mechanical properties of gas hydrate-bearing sediments by well logging. Pet. Explor. Dev. 2013, 40, 507–512. [Google Scholar] [CrossRef]
  30. Liu, Z.; Wei, H.; Peng, L.; Wei, C.; Ning, F. An easy and efficient way to evaluate mechanical properties of gas hydrate-bearing sediments: The direct shear test. J. Pet. Sci. Eng. 2017, 149, 56–64. [Google Scholar] [CrossRef]
  31. Liu, Z.; Dai, S.; Ning, F.; Peng, L.; Wei, H.; Wei, C. Strength Estimation for Hydrate-Bearing Sediments From Direct Shear Tests of Hydrate-Bearing Sand and Silt. Geophys. Res. Lett. 2018, 45, 715–723. [Google Scholar] [CrossRef]
  32. Dong, L.; Li, Y.; Liao, H.; Liu, C.; Chen, Q.; Hu, G.; Liu, L.; Meng, Q. Strength estimation for hydrate-bearing sediments based on triaxial shearing tests. J. Pet. Sci. Eng. 2020, 184, 106478. [Google Scholar] [CrossRef]
  33. Winters, W.J.; Dallimore, S.R.; Collett, T.S.; Jenner, K.A.; Katsube, J.T.; Cranston, R.E.; Wright, J.F.; Nixon, F.M.; Uchida, T. Relation between gas hydrate and physical properties at the Mallik 2L-38 research well in the Mackenzie delta. Ann. N. Y. Acad. Sci. 2000, 912, 94–100. [Google Scholar] [CrossRef]
  34. Winters, W.J.; Waite, W.F.; Mason, D.H.; Gilbert, L.Y.; Pecher, I.A. Methane gas hydrate effect on sediment acoustic and strength properties. J. Pet. Sci. Eng. 2007, 56, 127–135. [Google Scholar] [CrossRef]
  35. Masui, A.; Haneda, H.; Ogata, Y.; Aoki, K. Mechanical properties of sandy sediment containing marine gas hydrates in deep sea offshore Japan. In Proceedings of the ISOPE Ocean Mining Symposium, Lisbon, Portugal, 1–6 July 2007; pp. 53–56. [Google Scholar]
  36. Yoneda, J.; Masui, A.; Konno, Y.; Jin, Y.; Egawa, K.; Kida, M.; Ito, T.; Nagao, J.; Tenma, N. Mechanical behavior of hydrate-bearing pressure-core sediments visualized under triaxial compression. Mar. Pet. Geol. 2014, 66, 451–459. [Google Scholar] [CrossRef]
  37. Yoneda, J.; Hyodo, M.; Yoshimoto, N.; Nakata, Y.; Kato, A. Development of high-pressure low-temperature plane strain testing apparatus for methane hydrate-bearing sand. Soils Found. 2013, 53, 774–783. [Google Scholar] [CrossRef]
  38. Yoneda, J.; Masui, A.; Tenma, N.; Nagao, J. Triaxial testing system for pressure core analysis using image processing technique. Rev. Sci. Instrum. 2013, 84, 114503. [Google Scholar] [CrossRef]
  39. Santamarina, J.; Dai, S.; Terzariol, M.; Jang, J.; Waite, W.; Winters, W.; Nagao, J.; Yoneda, J.; Konno, Y.; Fujii, T.; et al. Hydro-bio-geomechanical properties of hydrate-bearing sediments from Nankai Trough. Mar. Pet. Geol. 2014, 66, 434–450. [Google Scholar] [CrossRef]
  40. Su, P.B.; Liang, J.Q.; Sha, Z.B.; Fu, S.Y. Gas Sources Condition of Gas Hydrate Formation in Shenhu Deep Water Sea Zone. J Southwest Pet. Univ (Sci. Technol. Ed.) 2014, 36, 1–8. [Google Scholar] [CrossRef]
  41. Qin, K.; Sun, Y.; Zhao, T.; Chu, H.; Yang, Y.; Zhang, X. The distribution of gas chimney structures in Shenhu area and their influence on gas hydrate accumulation. Mar. Geol. Front. 2015, 31, 23–28. [Google Scholar]
  42. Sun, Q.; Wu, S.; Cartwright, J.; Dong, D. Shallow gas and focused fluid flow systems in the Pearl River Mouth Basin, northern South China Sea. Mar. Geol. 2012, 315, 1–14. [Google Scholar] [CrossRef]
  43. Wang, X.; Collett, T.S.; Lee, M.W.; Yang, S.; Guo, Y.; Wu, S. Geological controls on the occurrence of gas hydrate from core, downhole log, and seismic data in the Shenhu area, South China Sea. Mar. Geol. 2014, 357, 272–292. [Google Scholar] [CrossRef]
  44. Zhang, X.; Du, Z.; Luan, Z.; Wang, X.; Xi, S.; Wang, B.; Li, L.; Lian, C.; Yan, J. In Situ Raman Detection of Gas Hydrates Exposed on the Seafloor of the South China Sea. Geochem. Geophys. Geosyst. 2017, 18, 3700–3713. [Google Scholar] [CrossRef]
  45. Zhong, G.; Liang, J.; Guo, Y.; Kuang, Z.; Su, P.; Lin, L. Integrated core-log facies analysis and depositional model of the gas hydrate-bearing sediments in the northeastern continental slope, South China Sea. Mar. Pet. Geol. 2017, 86, 1159–1172. [Google Scholar] [CrossRef]
  46. Qiao, S.; Su, M.; Kuang, Z.; Yang, R.; Liang, J.; Wu, N. Canyon-related undulation structures in the Shenhu area, northern South China Sea. Mar. Geophys. Res. 2015, 36, 243–252. [Google Scholar] [CrossRef]
  47. Liu, C.; Ye, Y.; Meng, Q.; He, X.; Lu, H.; Zhang, J.; Liu, J.; Yang, S. The Characteristics of Gas Hydrates Recovered from Shenhu Area in the South China Sea. Mar. Geol. 2012, 307, 22–27. [Google Scholar] [CrossRef]
  48. Liang, J.Q.; Wang, H.B.; Su, X.; Fu, S.Y.; Wang, L.F.; Guo, Y.Q.; Chen, F.; Shang, J.J. Natural gas hydrate formation conditions and the associated controlling factors in the northern slope of the South China Sea. Nat. Gas Ind. 2014, 34, 128–135. [Google Scholar]
  49. Zhang, W.; Liang, J.; He, J.; Cong, X.; Su, P.; Lin, L.; Liang, J. Differences in natural gas hydrate migration and accumulation between GMGS1 and GMGS3 drilling areas in the Shenhu area, northern South China Sea. Nat. Gas Ind. 2018, 38, 138–149. [Google Scholar]
  50. Wang, X.; Hutchinson, D.R.; Wu, S.; Yang, S.; Guo, Y. Elevated gas hydrate saturation within silt and silty clay sediments in the Shenhu area, South China Sea. J. Geophys. Res. Solid Earth 2011, 116, 1–18. [Google Scholar] [CrossRef]
  51. Makogon, Y.F. Natural gas hydrates—A promising source of energy. J. Nat. Gas Sci. Eng. 2010, 2, 49–59. [Google Scholar] [CrossRef]
  52. Lei, X.; Xueqin, L.; Huaishan, L.; Zhiliang, Q.; Benjun, M. Research on the Construction of a Petrophysical Model of a Heterogeneous Reservoir in the Hydrate Test Area in the Shenhu Area of the South China Sea (SCS). Geofluids 2021, 2021, 5586118. [Google Scholar] [CrossRef]
  53. Wei, J.; Fang, Y.; Lu, H.; Lu, H.; Lu, J.; Liang, J.; Yang, S. Distribution and characteristics of natural gas hydrates in the Shenhu Sea Area, South China Sea. Mar. Pet. Geol. 2018, 98, 622–628. [Google Scholar] [CrossRef]
  54. Yang, C.; Luo, K.; Liang, J.; Lin, Z.; Zhang, B.; Liu, F.; Su, M.; Fang, Y. Control effect of shallow-burial deepwater deposits on natural gas hydrate accumulation in the Shenhu sea area of the northern South China Sea. Nat. Gas Ind. 2020, 40, 68–76. [Google Scholar] [CrossRef]
  55. Riedel, M.; Collett, T.S. Observed correlation between the depth to base and top of gas hydrate occurrence from review of global drilling data. Geochem. Geophys. Geosyst. 2017, 18, 2177–2199. [Google Scholar] [CrossRef]
  56. Archie, G.E. The Electrical Resistivity Log as an Aid in Determining Some Reservoir Characteristics. Trans. AIME 2003, 146, 54–62. [Google Scholar] [CrossRef]
  57. Kang, D.; Liu, J.; Li, H.; Qu, C.; Lu, J. A quantitative evaluation method for the natural gas hydrate reservoir parameters in the Shenhu Area, South China Sea. Geoscience 2024, 38, 385–397. [Google Scholar]
  58. Nazeer, A.; Abbasi, S.A.; Solangi, S.H. Sedimentary facies interpretation of Gamma Ray (GR) log as basic well logs in Central and Lower Indus Basin of Pakistan. Geod. Geodyn. 2016, 7, 432–443. [Google Scholar] [CrossRef]
  59. Suzuki, K.; Ebinuma, T.; Hideo, N. Estimation of the in-situ permeabilities of nankai trough hydrate bearing sediments from pressure temparature core damplar. In Proceedings of the Offshore Technology Conference, Houston, TX, USA, 5–8 May 2008. [Google Scholar]
  60. Wei, H.; Yan, R.; Chen, P.; Tian, H.; Wu, E.; Wei, C. Deformation and failure bahavior of carbon dioxide hydrate-bearing sands with different hydrate contents under triaxial shear tests. Rock Soil Mech. 2011, 32, 198–203. [Google Scholar] [CrossRef]
  61. Sun, X.; Cheng, Y.; Li, L.; Cui, Q.; Li, Q. Triaxial compression test on synthetic core sample with simulated hydrate-bearing sediments. Pet. Drill. Tech. 2012, 40, 52–57. [Google Scholar]
  62. Yan, R.T.; Wei, C.F.; Wei, H.Z.; Tian, H.H.; Wu, E.L. Effect of hydrate formation on mechanical strength of hydrate-bearing sand. Yantu Gongcheng Xuebao/Chin. J. Geotech. Eng. 2012, 34, 1234–1240. [Google Scholar]
  63. Liu, F.; Kou, X.Y.; Jiang, M.J.; Xiong, J.H.; Wu, X.F. Triaxial shear strength of synthetic hydrate-bearing sediments. Yantu Gongcheng Xuebao/Chin. J. Geotech. Eng. 2013, 35, 1565–1571. [Google Scholar]
  64. Shi, Y.H.; Zhang, X.H.; Lu, X.B.; Wang, S.Y.; Wang, A.L. Experimental study on the satatic mechanical properties of hydrate-bearing silty-clay in the South China Sea. Chin. J. Theor. Appl. Mech. 2015, 47, 521–528. [Google Scholar]
  65. Li, Q.; Cheng, Y.; Li, Q.; Zhang, C.; Ansari, U.; Song, B. Establishment and evaluation of strength criterion for clayey silt hydrate-bearing sediments. Energy Sources Part A Recover. Util. Environ. Eff. 2018, 40, 742–750. [Google Scholar] [CrossRef]
  66. Bhatnagar, G.; Chatterjee, S.; Chapman, W.G.; Dugan, B.; Dickens, G.R.; Hirasaki, G.J. Analytical theory relating the depth of the sulfate-methane transition to gas hydrate distribution and saturation. Geochem. Geophys. Geosyst. 2011, 12, 3397. [Google Scholar] [CrossRef]
  67. Li, K.; Chen, B.; Yang, M.; Song, Y.; Sum, A.K. Methane hydrate phase equilibrium considering dissolved methane concentrations and interfacial geometries from molecular simulations. J. Chem. Phys. 2023, 159, 244505. [Google Scholar] [CrossRef] [PubMed]
  68. Ai, X.; Zha, R.; Lai, Y.; Yang, T.; Su, P. Pore-Water Geochemical Gradients of Sulfate, Calcium, Magnesium, and Iodide Correlated With Underlying Gas Hydrate Potential: A Case Study of the Shenhu Area, South China Sea. Front. Earth Sci. 2022, 10, 882207. [Google Scholar] [CrossRef]
  69. Su, M.; Yang, R.; Wang, H.; Sha, Z.; Liang, J.; Wu, N.; Qiao, S.; Cong, X. Gas hydrates distribution in the Shenhu area, Northern South China sea: Comparisons between the eight drilling sites with gashydrate petroleum system. Geol. Acta 2016, 14, 79–100. [Google Scholar] [CrossRef]
  70. Bondarenko, V.I.; Sai, K.S. Process pattern of heterogeneous gas hydrate deposits dissociation. Nauk. Visnyk Natsionalnoho Hirnychoho Universytetu. 2018, 2, 21–28. [Google Scholar] [CrossRef]
  71. Bazaluk, O.; Sai, K.; Lozynskyi, V.; Petlovanyi, M.; Saik, P. Research into Dissociation Zones of Gas Hydrate Deposits with a Heterogeneous Structure in the Black Sea. Energies 2023, 14, 1345. [Google Scholar] [CrossRef]
  72. Kang, D.J.; Xie, Y.F.; Lu, J.A.; Wang, T.; Liang, J.Q.; Lai, H.F.; Fang, Y.X. Assessment of natural gas hydrate reservoirs at Site GMGS3-W19 in the Shenhu area, South China Sea based on various well logs. China Geol. 2022, 5, 383–392. [Google Scholar] [CrossRef]
  73. Isaaks, E.H.; Srivastava, R.M. An Introduction to Applied Geostatistics; Oxford University Press: New York, NY, USA, 1989. [Google Scholar]
  74. Anderson, T.W. An Introduction to Multivariate Statistical Analysis, 3rd ed.; John Wiley: New York, NY, USA, 2003. [Google Scholar]
  75. Wang, X.; Han, L.; Liu, J.; Jin, J.; Kuang, Z.; Zhou, J. Geophysical characteristics and identification of the coexistence of gas hydrate and free gas. Earth Sci. Front. 2025, 32, 20–35. [Google Scholar]
  76. Qian, J.; Wang, X.; Collett, T.S.; Guo, Y.; Kang, D.; Jin, J. Downhole log evidence for the coexistence of structure II gas hydrate and free gas below the bottom simulating reflector in the South China Sea. Mar. Pet. Geol. 2018, 98, 662–674. [Google Scholar] [CrossRef]
  77. Boswell, R.; Collett, T.S. Current perspectives on gas hydrate resources. Energy Environ. Sci. 2011, 4, 1206–1215. [Google Scholar] [CrossRef]
  78. Wang, J.; Zhao, J.; Zhang, Y.; Wang, D.; Li, Y.; Song, Y. Analysis of the effect of particle size on permeability in hydrate-bearing porous media using pore network models combined with CT. Fuel 2016, 163, 34–40. [Google Scholar] [CrossRef]
  79. Yang, R.; Su, M.; Qiao, S.; Cong, X.; Su, Z.; Liang, J.; Wu, N. Migration of methane associated with gas hydrates of the Shenhu Area, northern slope of South China Sea. Mar. Geophys. Res. 2015, 36, 253–261. [Google Scholar] [CrossRef]
  80. Wang, H.B.; Yang, S.X.; Wu, N.Y.; Zhang, G.X.; Liang, J.Q.; Chen, D.F. Controlling factors for gas hydrate occurrence in Shenhu area on the northern slope of the South China Sea. Sci. China Earth Sci. 2013, 56, 513–520. [Google Scholar] [CrossRef]
  81. Bear, J. Dynamics of Fluids in Porous Media; Elsevier: New York, NY, USA, 1972. [Google Scholar]
  82. Li, J.; Lu, J.; Kang, D.; Ning, F.; Lu, H.; Kuang, Z.; Wang, D.; Liu, C.; Hu, G.; Wang, J.; et al. Lithological characteristics and hydrocarbon gas sources of gas hydrate-bearing sediments in the Shenhu area, South China Sea: Implications from the W01B and W02B sites. Mar. Geol. 2019, 408, 36–47. [Google Scholar] [CrossRef]
  83. Yin, S.; Wang, D.; Zhang, Z.; Chai, H. Research on permeability prediction model of marine fine-grained sandy hydrate reservoirs. China Offshore Oil Gas. 2022, 34, 98–104. [Google Scholar]
  84. Ci, J.; He, S.; Li, R. Pre-spud study on mechanical stability of wellbore. Nat. Gas Ind. 2006, 44, 8–10. [Google Scholar]
  85. John, I.K.; Tamunobereton-Ari, I.; Horsfall, O.I.; Amakiri, A.R.C. The Effects of Clay Content and Porosity on Acoustic Velocity in clastic Sedimentary Formations, in parts of the Niger Delta, Nigeria. J. Softw. Eng. Simul. 2024, 10, 41–57. [Google Scholar] [CrossRef]
  86. Castagna, P.; Batzle, M.L.; Eastwood, R.L. Relationships between compressional-wave and shear-wave velocities in clastic silicate rocks. Geophysics 1985, 50, 571–581. [Google Scholar] [CrossRef]
  87. Waite, W.F.; Santamarina, J.C.; Cortes, D.D.; Dugan, B.; Espinoza, D.N.; Germaine, J.; Jang, J.; Jung, J.W.; Kneafsey, T.J.; Shin, H.; et al. Physical properties of hydrate-bearing sediments. Rev. Geophys. 2009, 47, 1–38. [Google Scholar] [CrossRef]
  88. Miyazaki, K.; Yamaguchi, T.; Sakamoto, Y.; Tenma, N.; Ogata, Y.; Aoki, K. Effect of Confining Pressure on Mechanical Properties of Sediment Containing Synthetic Methane Hydrate. J. Min. Mater. Process. Inst. Jpn. 2010, 126, 408–417. [Google Scholar] [CrossRef]
  89. Dong, L.; Liao, H.; Li, Y.; Liu, C. Measurement and assessment of mechanical properties of hydrate-bearing sediments. Mar. Geol. Front. 2020, 36, 34–43. [Google Scholar]
Figure 1. Locations of GMGS drilling sites in the Shenhu Area. Sites are classified by expedition: GMGS1 (circles), GMGS3 (squares), GMGS4 (triangles), and GMGS6 (pentagons). The white symbols indicate sites where hydrates are present, and the black symbols denote sites where hydrates are absent. The white symbols with red circle represent sites where core samples were collected. (a) Location of the Shenhu area in the South China Sea. (b) Drilling sites in the Shenhu area.
Applsci 15 08857 g001aApplsci 15 08857 g001b
Figure 2. Logging-while-drilling data at site GMGS3-W18-2015 [19]. From left to right: bulk density, ring resistivity, P-wave velocity, formation porosity, permeability estimated from porosity and grain size, gas hydrate saturation derived from ring resistivity, and estimates derived from pore-water freshening and methane mass balance methods. Gray-shaded intervals indicate gas hydrate-bearing sediments.
Applsci 15 08857 g002
Figure 3. Dataset overview for hydrate reservoir property analysis.
Applsci 15 08857 g003
Figure 4. Relationships between stratigraphic boundaries and environmental parameters. (a) Linear correlations between water depth and the depths of the base and top; (b) relationships between seafloor temperature and the depths of the base and top; (c) relationships between geothermal gradient and the depths of the base and top.
Applsci 15 08857 g004
Figure 5. Depth profiles and histograms of hydrate saturation at 11 sites (ak), 3 grouped regions (ln), and the entire Shenhu Area (o).
Applsci 15 08857 g005aApplsci 15 08857 g005b
Figure 6. Q–Q plots of hydrate saturation at 11 sites (ak), 3 grouped regions (ln), and the entire Shenhu Area (o).
Applsci 15 08857 g006aApplsci 15 08857 g006b
Figure 7. Experimental and fitted variograms of hydrate saturation in the vertical direction.
Applsci 15 08857 g007
Figure 8. Experimental variogram of hydrate saturation in the horizontal direction within the Shenhu Area.
Applsci 15 08857 g008
Figure 9. Depth profiles and histograms of formation porosity at 11 sites, 3 grouped regions, and the entire Shenhu Area. Point colors mapped according to the local sampling density in the plot.
Applsci 15 08857 g009
Figure 10. Depth profiles and histograms of strength parameters at 11 sites, 3 grouped regions, and the entire Shenhu Area.
Applsci 15 08857 g010
Figure 11. Reported cohesion and internal friction angle from laboratory tests. (a) Cohesion values with fitted linear regression lines; (b) friction angles compiled from various studies [30,31,32,60,61,62,64,65].
Applsci 15 08857 g011
Table 1. Summary of eleven GMGS drilling sites in the Shenhu area [19,43,53,54].
SiteExpeditionGeothermal
Gradient (°C/km)
Seafloor
Temperature (°C)
Water Depth
(m)
Gas Hydrate-Bearing Layer (mbsf)Layer
Thickness (m)
SH2GMGS146.954.841230191–22534
SH349.345.531245196–20610
SH743.656.441105155–17722
SH-W11GMGS344.394.861293116–19276
SH-W1763.204.761252209–26556
SH-W1855.804.681285147–17225
SH-W1948.005.701277138–15820
SC-01GMGS464.903.761287147–17122
SC-0261.20-1272139–17242
SC-03--1271131–21079
SH02GMGS6--1225208–27848
Note: “-” indicates data not available from literature sources.
Table 2. Summary of laboratory tests of synthesized hydrate-bearing sediments.
NoHost SoilHydrate
Composition
Test TypeHydrate
Saturation
Cohesion
(MPa)
Friction AngleReference
1sandCarbon dioxide CU0030.33°[60]
19.7%0.092436.48°
37.0%0.291434.63°
51.0%0.275437.96°
2sandMethaneCU03.5622.21°[61]
40.0%3.9721.10°
60.0%4.2523.57°
80.0%4.6923.67°
3sandCarbon dioxideCU0026.94°[62]
6.3%0.3227.28°
12.6%0.8624.26°
35.8%1.2624.94°
50.4%1.4724.71°
4sandTetrahydrofuranCU20.0%0.1026.7°[63]
50.0%0.5022.5°
80.0%1.3513.0°
5silty clayTetrahydrofuranCD00.091.8°[64]
5.0%0.262.9°
15.0%0.352.9°
25.0%0.782.9°
35.0%0.823.2°
45.0%0.973.4°
6siltCarbon dioxideDS00.0935.9°[30]
21.4%0.4243.3°
48.9%1.2934.8°
65.3%2.3928.6°
7clayey siltMethaneCU01.1522.33°[65]
20.0%1.8623.11°
40.0%2.3523.20°
60.0%3.1222.88°
8sandCarbon dioxideDS0032.33°[31]
13.0%0.3441.19°
24.0%0.5444.81°
34.0%0.9742.34°
43.0%1.3042.69°
9siltCarbon dioxideDS00.0935.74°
23.0%0.4243.21°
49.0%1.2934.72°
65.0%2.3928.54°
10sandMethaneCU00.4226.4°[32]
13.3%0.5330.5°
26.6%0.7832.2°
40.0%1.0234.2°
Note: CD refers to Consolidated Drained triaxial test, CU to Consolidated Undrained triaxial test, and DS to Direct Shear test.
Table 3. Statistical summary of hydrate saturation.
SiteNumber of DataMeanStandard Deviation
GMGS1-SH26819.7%8%
GMGS1-SH31112.8%7%
GMGS1-SH75420.7%8%
GMGS3-SH-W1115026.8%9%
GMGS4-SC-0313530.7%9%
GMGS3-SH-W175229.6%13%
GMGS6-SH0213930.8%10%
GMGS3-SH-W186631.4%15%
GMGS4-SC-018632.3%16%
GMGS3-SH-W195337.7%12%
GMGS4-SC-027734.2%10%
Region 113319.5%8%
Region 247629.4%10%
Region 328233.6%14%
All regions within Shenhu89129.2%12%
Table 4. Summary of fitted variogram model parameters.
SiteRange (m)NuggetPartial SillSillRMSE
GMGS1-SH270.0020.0030.0050.06
GMGS1-SH350.0010.0010.0020.32
GMGS1-SH7180.0020.00030.0030.55
GMGS3-SH-W11150.0040.0030.0070.05
GMGS4-SC-03150.0010.0060.0070.04
GMGS3-SH-W1780.01100.0110.13
GMGS6-SH02500.0080.0080.04
GMGS3-SH-W1850.0110.0040.0150.14
GMGS4-SC-01100.01400.0140.13
GMGS3-SH-W1920.0020.0070.0090.09
GMGS4-SC-02120.0070.0030.0100.10
Region 1150.0030.0050.0080.05
Region 2120.0020.0080.0090.06
Region 380.0110.0060.0170.05
All regions within Shenhu120.0070.0050.0120.08
Table 5. Statistical summary of formation porosity.
SiteNumber of DataMeanStandard Deviation
GMGS1-SH2610.410.04
GMGS1-SH3200.350.02
GMGS1-SH7410.460.04
GMGS3-SH-W111420.480.02
GMGS4-SC-031540.470.02
GMGS3-SH-W17900.470.03
GMGS6-SH021400.490.03
GMGS3-SH-W18490.630.04
GMGS4-SC-01430.590.04
GMGS3-SH-W19370.540.02
GMGS4-SC-02550.550.02
Region 11220.410.05
Region 25260.480.02
Region 31840.580.05
All regions within Shenhu8320.490.06
Table 6. Derived intrinsic and estimated effective permeability ranges.
SiteIntrinsic Permeability (mD)Effective Permeability (mD)
GMGS1-SH29.9~89.12.8~25.4
GMGS1-SH35.1~45.72.3~20.4
GMGS1-SH716.7~150.24.5~65.2
GMGS3-SH-W1120.4~184.03.6~32.4
GMGS4-SC-0318.5~166.32.5~22.3
GMGS3-SH-W1718.5~166.32.7~24.1
GMGS6-SH0222.6~203.53.0~27.1
GMGS3-SH-W1891.3~821.911.6~104.6
GMGS4-SC-0161.1~549.87.3~65.6
GMGS3-SH-W1937.2~334.93.0~26.7
GMGS4-SC-0241.1~369.74.3~38.4
Region 19.9~89.12.9~25.8
Region 220.4~184.03.0~52.6
Region 355.3~497.76.0~54.0
All regions within Shenhu22.6~203.53.4~30.3
Table 7. Statistical summary of strength parameters derived from acoustic logging.
SiteNumber of DataCohesion (MPa)Friction Angle (°)
MeanStandard DeviationMeanStandard Deviation
GMGS1-SH2641.310.2825.270.01
GMGS1-SH3180.880.2225.280.01
GMGS1-SH7341.660.3725.250.01
GMGS3-SH-W11891.270.3725.270.01
GMGS4-SC-03821.530.2825.260.01
GMGS3-SH-W17911.240.3425.270.01
GMGS6-SH021401.310.4725.270.02
GMGS3-SH-W18372.330.6425.230.02
GMGS4-SC-01371.070.3025.270.01
GMGS3-SH-W19321.040.4825.280.02
GMGS4-SC-02561.100.5025.270.02
Region 11161.350.3925.260.01
Region 24021.330.4025.270.01
Region 31621.360.7225.260.03
All regions within Shenhu6801.340.4925.260.02
Table 8. Summary of linear regression results.
ReferenceFitting Linear EquationR2
[60]c = 0.006 × Sh0.84
[61]c = 0.52 + 0.014 × Sh0.47
[62]c = 3.50 + 0.013 × Sh0.95
[63]c = 0.20 + 0.028 × Sh0.86
[64]c = −0.39 + 0.021 × Sh0.92
[30]c = 0.13 + 0.020 × Sh0.93
[65]c = −0.11 + 0.034 × Sh0.89
[31]c = 1.16 + 0.032 × Sh0.99
[31]c = −0.05 + 0.030 × Sh0.97
[32]c = −0.13 + 0.034 × Sh0.88
Disclaimer/Publisher’s Note: The statements, opinions and data contained in all publications are solely those of the individual author(s) and contributor(s) and not of MDPI and/or the editor(s). MDPI and/or the editor(s) disclaim responsibility for any injury to people or property resulting from any ideas, methods, instructions or products referred to in the content.