Article

Study on Seismic Response of Segmented Utility Tunnels Crossing Ground Fissures

1
Infrastructure Department, Xidian University, Xi’an 710071, China
2
School of Civil & Architecture Engineering, Xi’an Technological University, Xi’an 710021, China
3
School of Civil Engineering, Chang’an University, Xi’an 710061, China
*
Authors to whom correspondence should be addressed.
Appl. Sci. 2025, 15(16), 8845; https://doi.org/10.3390/app15168845
Submission received: 23 June 2025 / Revised: 22 July 2025 / Accepted: 7 August 2025 / Published: 11 August 2025
(This article belongs to the Section Civil Engineering)

Abstract

Taking the segmented utility tunnel crossing f5 ground fissures in Xi’an Xingfu forest belt as the research object, this paper investigates the acceleration response and the variation of displacement and stress of the segmented utility tunnel under the El-Centro seismic wave through 3D finite element simulation. The results show that under the orthogonal condition, the peak acceleration of foot wall soil is greater than that of hanging wall soil; conversely, under oblique loading, the hanging wall exhibits higher peak acceleration. In both loading conditions, the peak soil acceleration initially increases and then decreases with depth, while the amplification effect weakens as depth increases. Furthermore, the seismic response and deformation of the tunnel are more pronounced under oblique loading than under orthogonal loading. This study offers quantitative guidance for the seismic design of segmented utility tunnels crossing ground fissures.

1. Introduction

Utility tunnels are the key facility to ensure the normal service of the urban lifeline, which concentrates pipelines such as electricity, steam, water supply, and drainage [1,2]. But as a long, underground structure, underground utility tunnels are vulnerable to damage caused by natural disaster, especially under earthquake [3]. Damage to utility tunnels during earthquakes can lead to pipeline disruption, severe losses, and even explosions that threaten personal safety [4,5,6]. Furthermore, ground fissures are common in many parts around the world, and these ground fissures will bring great threat to municipal construction, industrial production, farmland, roads, and other facilities [7,8,9,10]. As long they remain underground structures, utility tunnels cannot avoid all the ground fissures. Thus, it is necessary to analyze the dynamic behavior of utility tunnels crossing ground fissures and improve their design specifications.
To this day, scholars [1,11,12,13] have achieved many results for underground utility tunnels through theoretical analyses. The use of a shaking table provides considerable convenience for researchers to gain a more realistic response of utility tunnels under earthquakes [14,15,16,17]. Furthermore, the combined methods of the physical model test and finite element analysis also helps people to study the seismic response of utility tunnels under the effects of multiple factors [18,19,20,21,22]. In practical engineering, the underground utility tunnels are often prefabricated and need junctions to connect. Therefore, the study of the junction failure of utility tunnels under earthquakes also has great significance [2,23,24,25]. It was found that the flexible joints of utility tunnels can effectively decrease the seismic response and reduce the risk of utility tunnel damage in an earthquake. However, there is still limited research on the seismic response of segmented utility tunnels with the junctions. In the multi-scale numerical model developed by Li et al. [26] for longitudinal seismic analysis of prefabricated utility tunnels, beam elements, shell elements, and nodal frames were employed to simulate tunnel segments, intersections, and joints, respectively. Comparative studies with different modeling approaches demonstrated the superior computational efficiency and accuracy of this model. Huang et al. [27] further investigated the nonlinear mechanical behavior of multi-directional joints and systematically analyzed the deformation characteristics of tunnel joints under P-wave oblique incidence through numerical simulations. However, the conventional beam–spring model fails to accurately capture localized deformation details at the joints of intersecting utility tunnels or account for the prestressing effects in precast connections. To address these limitations, a shell–spring model was developed specifically for seismic design of precast intersecting tunnels with asymmetric cross-sections [28]. Subsequent studies applied this modeling approach to investigate the longitudinal seismic performance of both T-shaped [28] and cross-shaped [29] precast utility tunnel intersections. Furthermore, a novel multi-scale modeling framework was proposed by integrating beam–spring and shell–spring models, enabling efficient simulation of global structural behavior while maintaining high-resolution local deformation analysis for precast tunnel intersections under longitudinal seismic loading [26]. Li [30] presented a relatively systematic study on the seismic responses of utility tunnels and internal pipeline systems considering the effects of utility tunnel joints
From the above content, it is not difficult to find that the existing studies on the seismic response of utility tunnels mostly focus on the integral continuous models. Although some studies have explored the seismic performance of prefabricated joints, few have investigated the seismic response of segmented utility tunnels crossing active ground fissures, especially under oblique intersection conditions, which is the focus of this study. In addition, the research on the seismic response of utility tunnels crossing ground fissures is still immature. The present paper takes the underground segmented utility tunnel crossing the f5 ground fissure of Xingfu Forest Belt in Xi’an city, China, as the research object to analyze the deformation characteristic and mechanical behavior of the tunnel. The numerical simulation results enable the determination of early-warning indicators for tunnel monitoring systems, offering essential theoretical guidance and engineering support for the segmented construction methodology of utility tunnels.

2. Project Overview

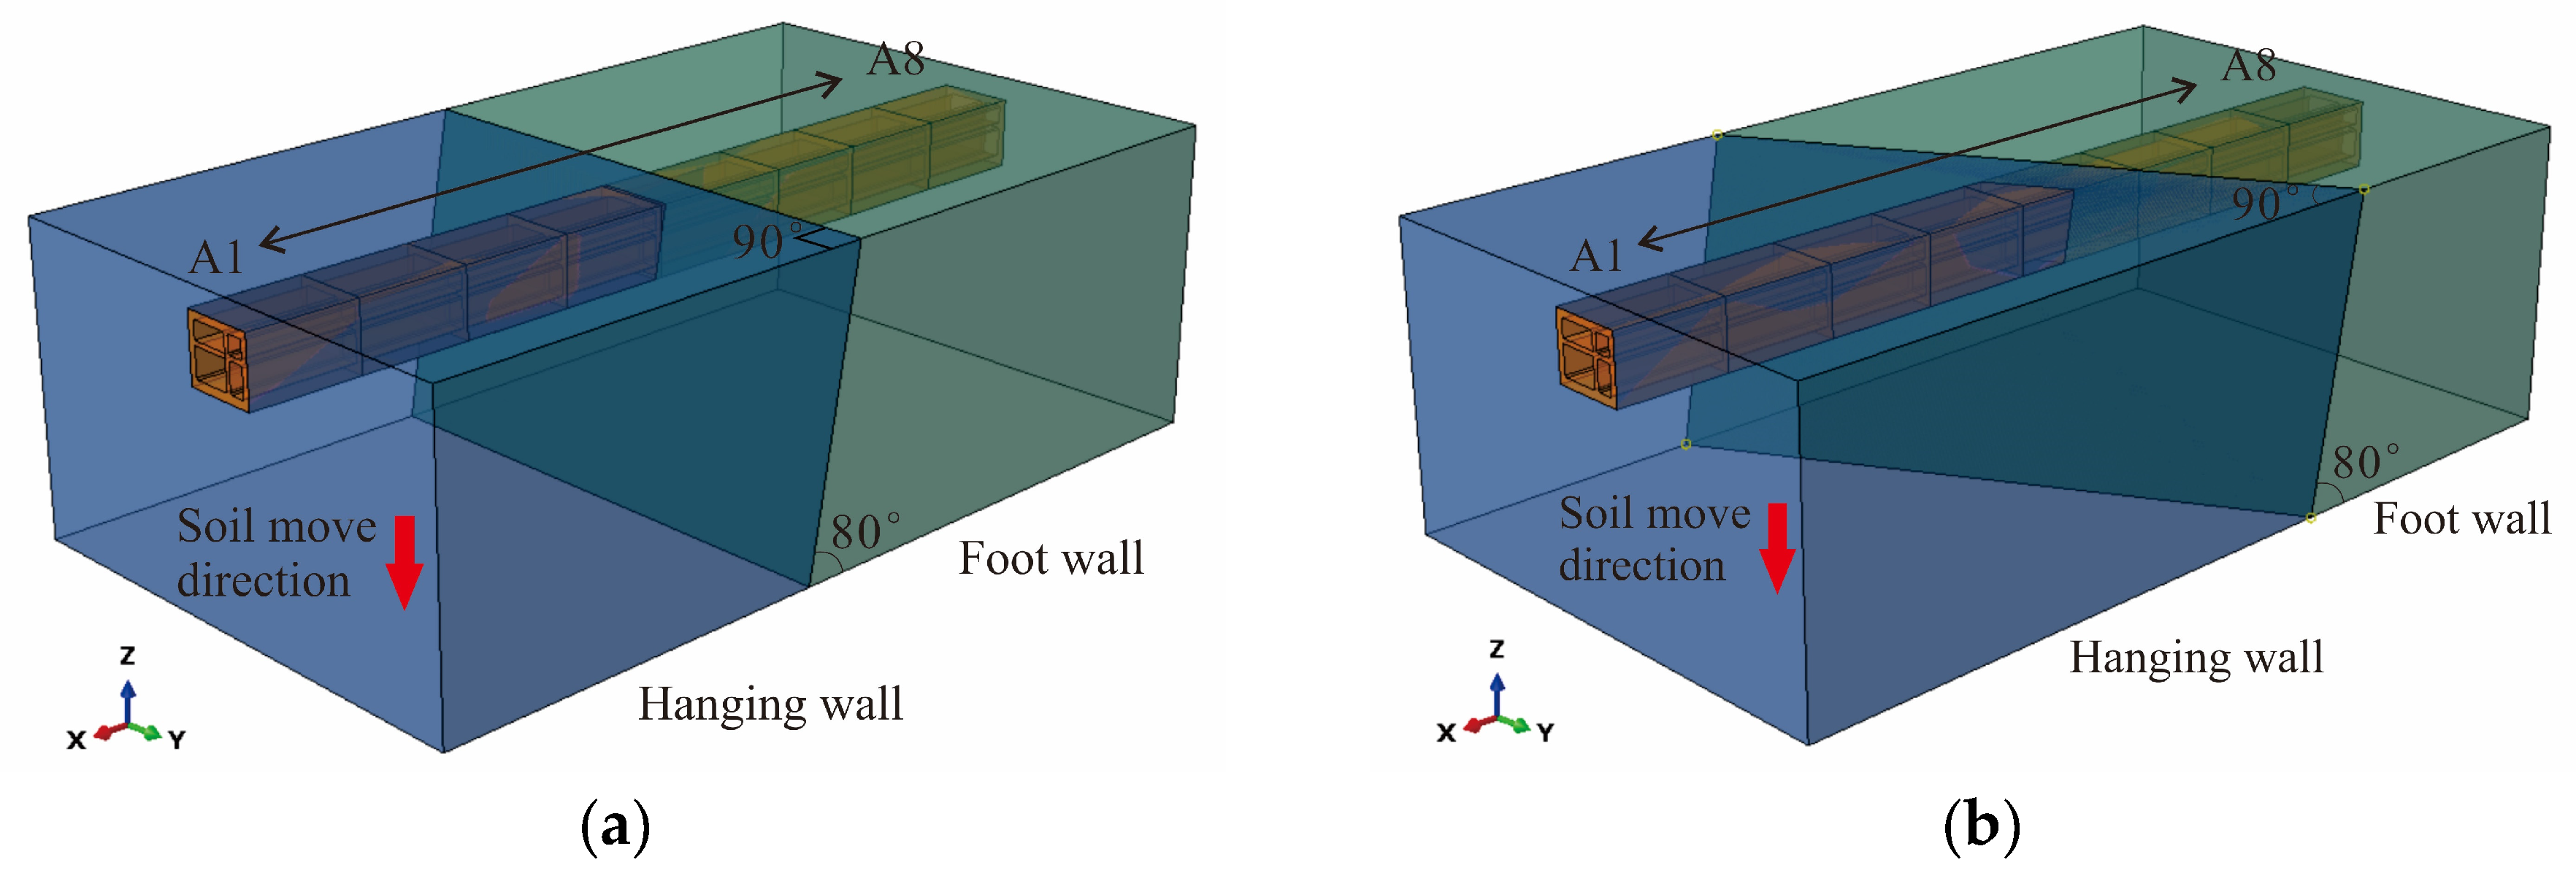
This research focuses on a utility tunnel project located in the Wangjiafen–Huaqing Road corridor of Xi’an, China. The tunnel alignment originates at Wangjiafen Station, extending southward along the western boundary of Xingfu Green Belt. The study investigates the mechanical behavior of precast segmental utility tunnels traversing f5-type ground fissures. The tunnel structure comprises reinforced concrete with C40-grade concrete and HRB400 steel reinforcement. Prefabricated assembly technology is employed, incorporating deformation joints and waterproof seals at segment connections. The tunnel is built using the open-cut method and covered with a 3 m thick backfill layer. The intersection angle between the tunnel and the ground fissure is 60°, and the inclination angle of the ground fissure is 80°. Details are shown in Figure 1 and Figure 2.
Geotechnical characterization derives from two key sources: (1) comprehensive survey data of D8KC-2 section (Xiying Road to Huaqing East Road) in Xi’an Metro Line 8; and (2) statistical analysis of geotechnical reports for Wangjiafen–Huaqing East Road segment. The stratigraphic profile is established as follows:
(1) Q 4 ml backfill layer; (2) Q 3 eol loess layer; (3) Q 3 el paleo-soil layer; (4) Q 2 eol loess layer; (5) Q 2 el paleo-soil layer; and (6) Q 2 al + 1 interlayer of silty clay layer and sand layer.
Due to the complex distribution of soil layers on the engineering site, minor modifications and simplifications are applied to make the soil evenly distributed. The site investigation reveals a six-layer stratigraphic profile with distinct dislocation characteristics between the hanging wall and foot wall. Detailed layer distribution parameters are presented in Table 1.

3. Finite Element Modeling

3.1. Model Establishment

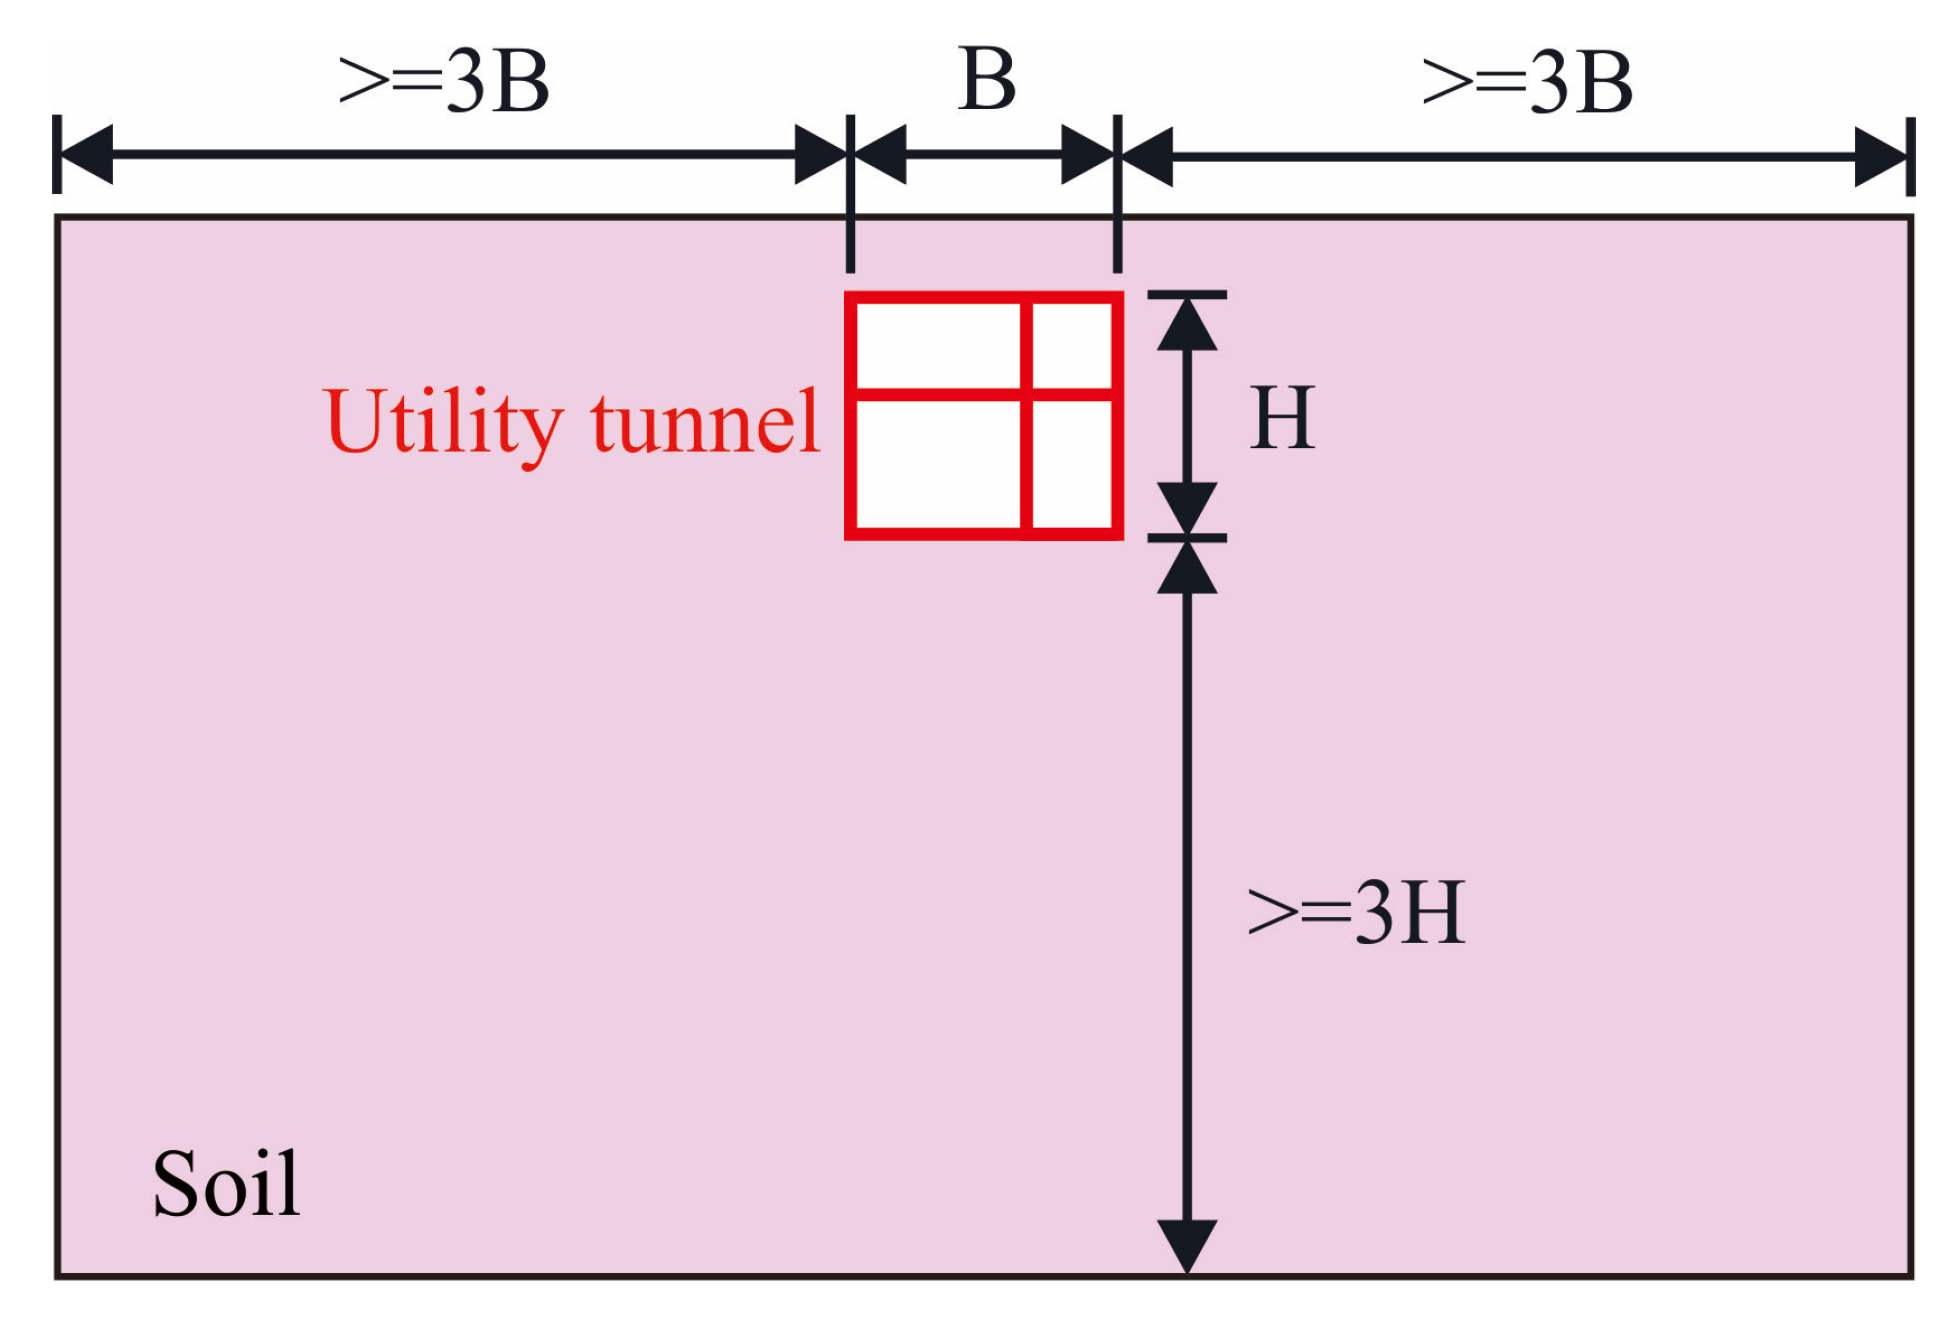
In this study, a numerical model of a buried utility tunnel crossing a ground fissure was developed using ABAQUS 6.14. For the purpose of eliminating the effect of boundary conditions on the simulation results, the soil scope and boundary conditions of the overall model shall meet the following principles [31]:
  • Lateral soil coverage extending ≥ 3D (where D represents tunnel width) on both sides.
  • Vertical embedment depth measuring ≥ 3H (where H denotes tunnel height) below the invert.
  • The boundary conditions on the length direction should be consistent.
  • When the length of the longitudinal boundary condition exceeds 100 m, the influence of the boundary condition on the tunnel can be ignored.
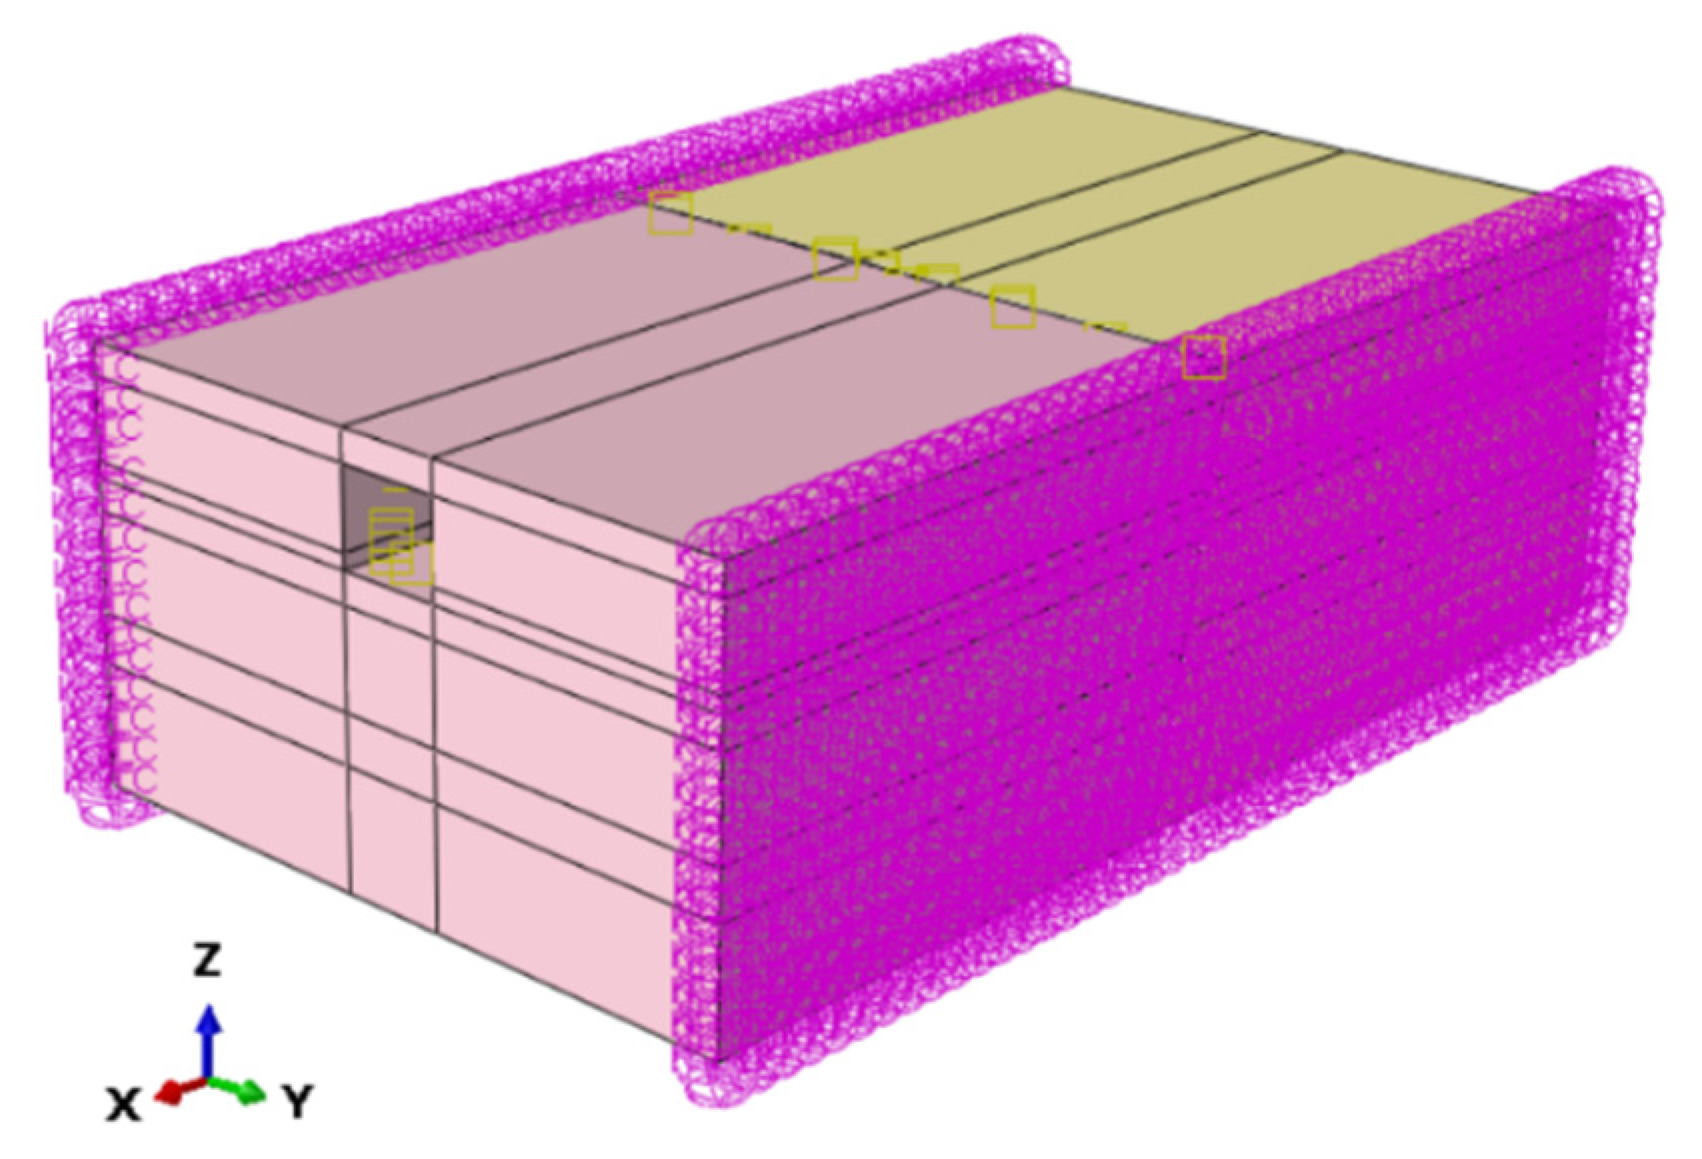
The analysis employs a soil mass dimensioned at 123.5 × 70 × 40 m3 (L × W × H), determined based on design principles and tunnel construction documents. Visual representations of the model boundaries and complete assembly appear in Figure 3 and Figure 4. The finite element mesh was generated using C3D8R elements (8-node linear brick with reduced integration). Finer meshes (1.0 m) were used in the tunnel, while coarser meshes (up to 3 m) were applied on soil. The complete model consisted of approximately 162,000 elements.
According to the construction drawings, the tunnel comprises eight sequentially labeled segments (A1–A8), as shown in Figure 5. Notably, segments A4 and A5 straddle the ground fissure, with their connection interface intersecting the discontinuity. Dimensionally, A5 and A6 measure 20 m and 13.5 m, respectively, while all other segments maintain a uniform 15 m length.
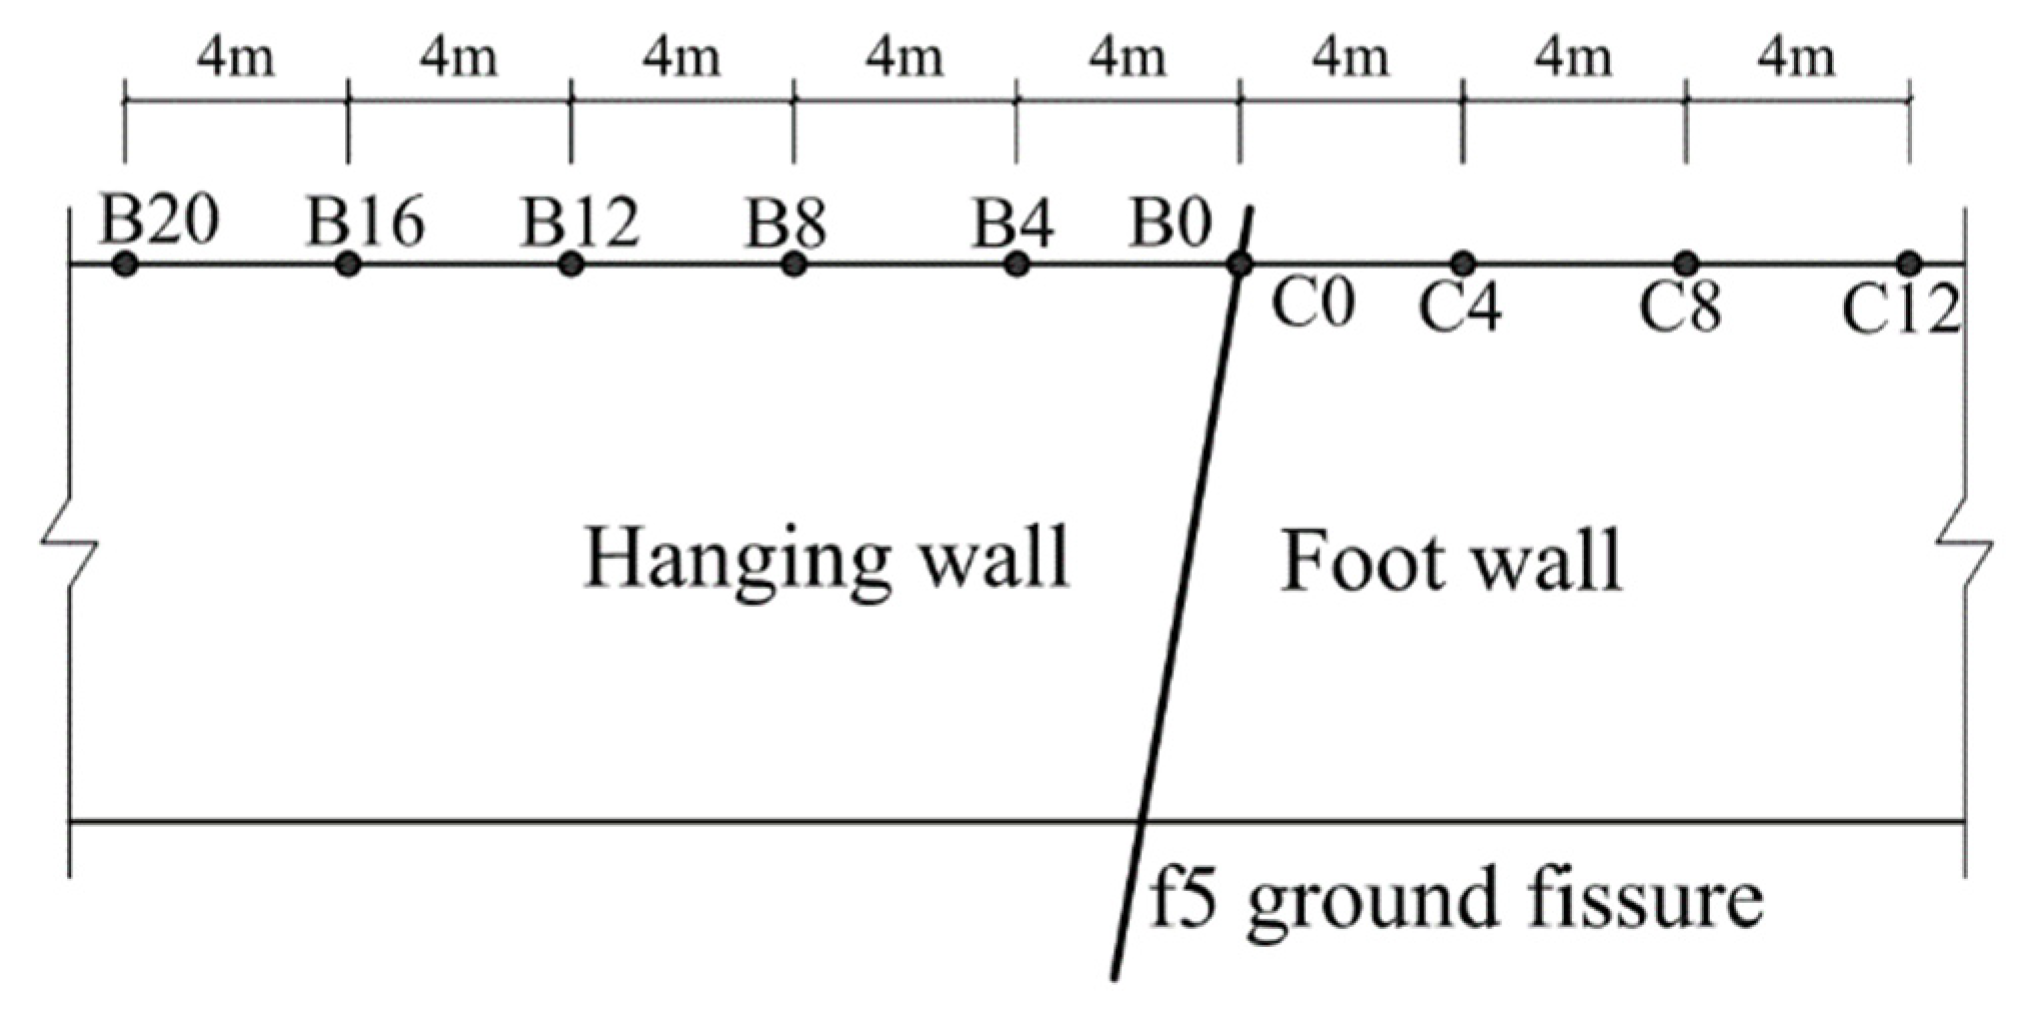
According to specification for site investigation and engineering design on Xi’an ground fractures (DBJ 61-6-2006) [32], the impact of ground fissures is 0–20 m at the hanging wall and 0–12 m at the foot wall. Therefore, ten measure points named B0, B4, B8, B12, B16, and B20 on the hanging wall and C0, C4, C8, and C12 on the foot wall were selected to analyze the soil acceleration as shown in Figure 6. Four measure points GL1, GL2, GL3, and GL4 were selected for seismic analysis of the tunnel. The prefabricated utility tunnel comprises four functional compartments: upper and lower integrated warehouses, power warehouse, and natural gas warehouse. With a cross-sectional dimension of 10.1 m (width) × 8.96 m (height), the structure features haunch dimensions of 0.2 m × 0.2 m for utility compartments and 0.2 m × 0.3 m for integrated warehouses. Figure 7 illustrates the sectional configuration and instrumentation layout.

3.2. Material Constitutive

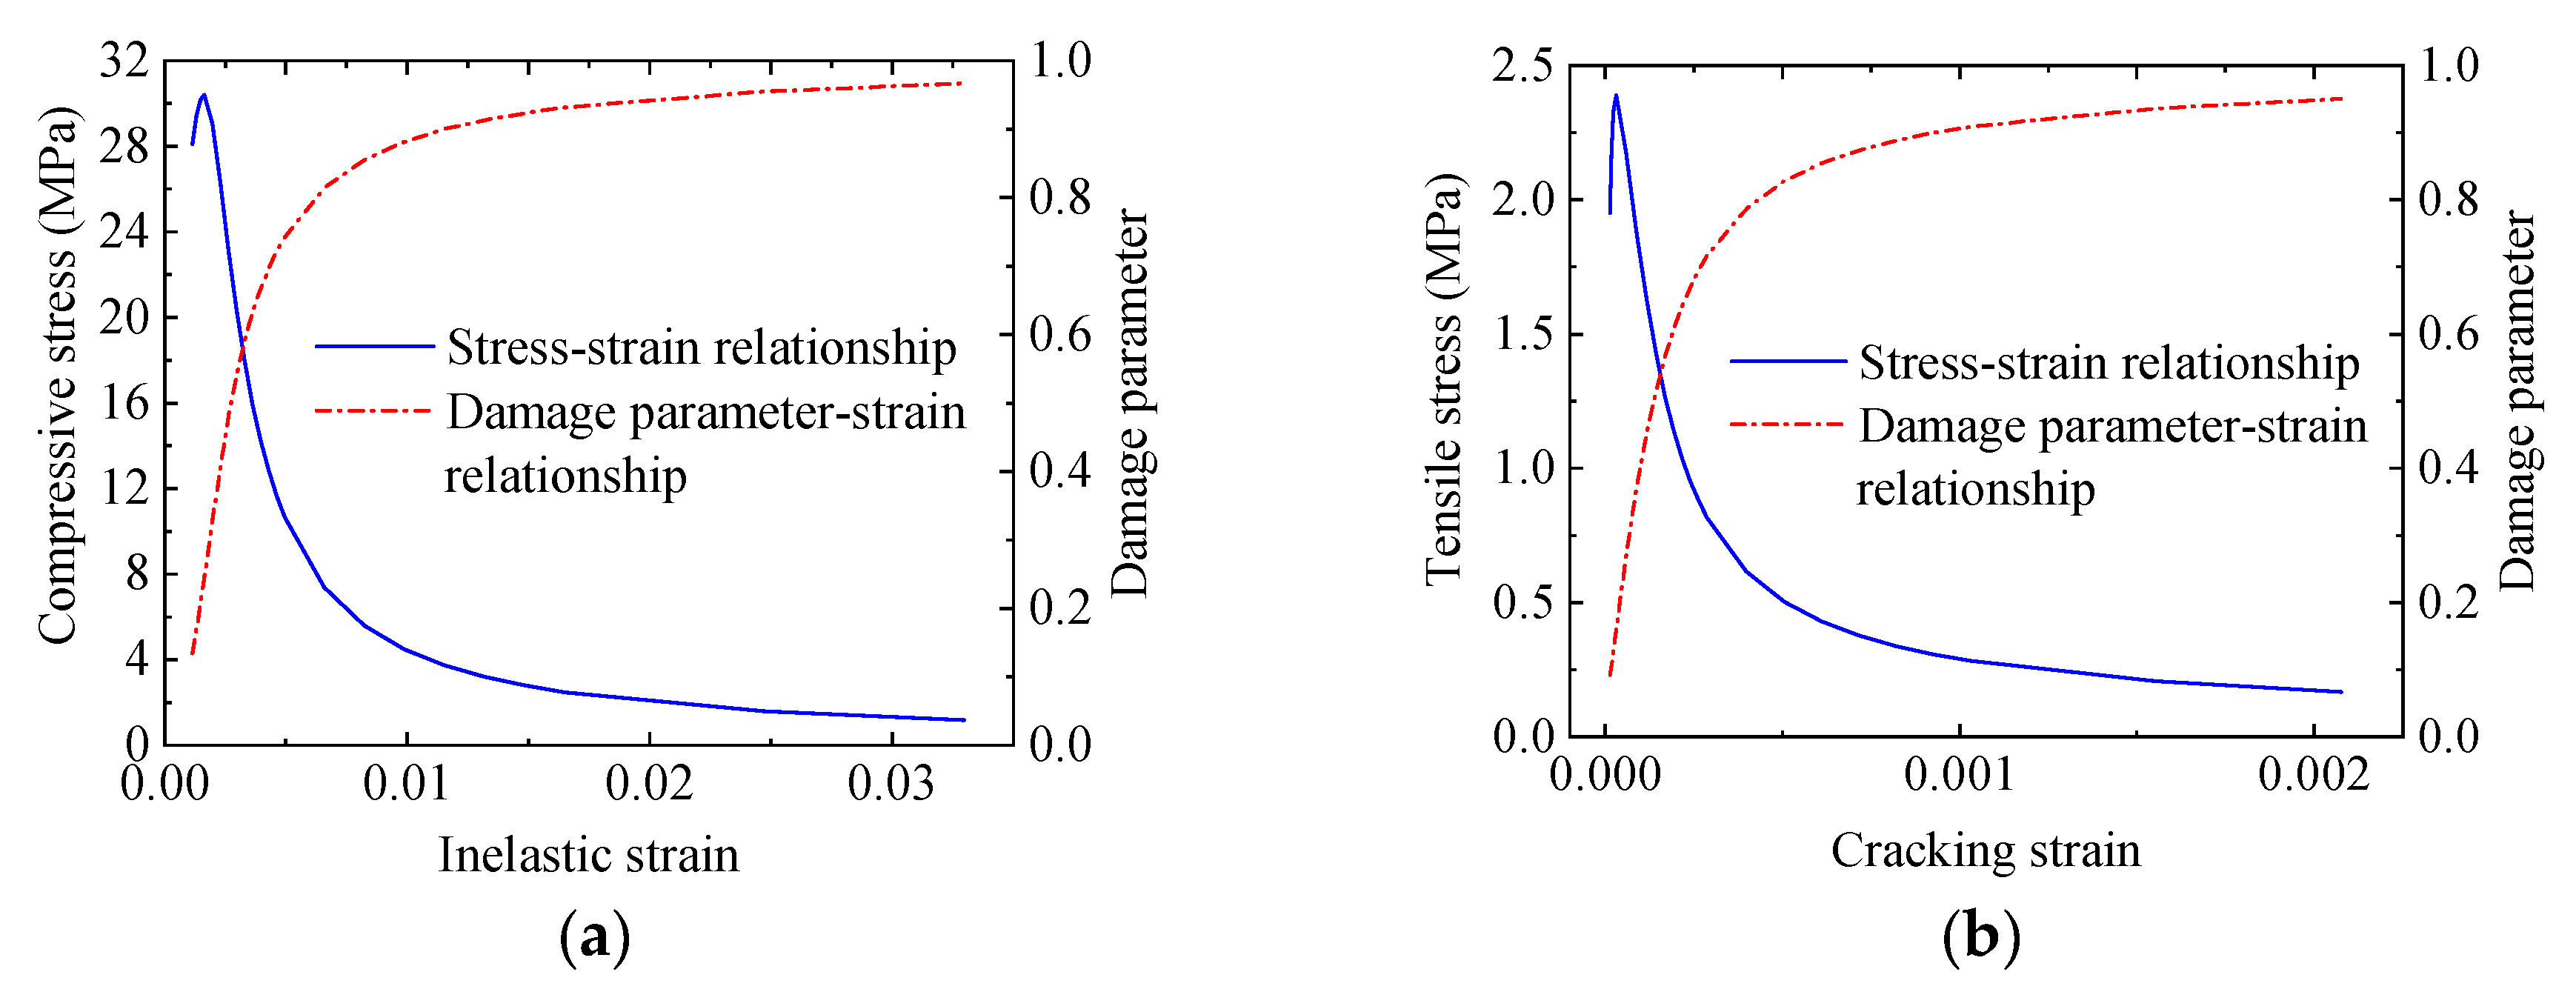
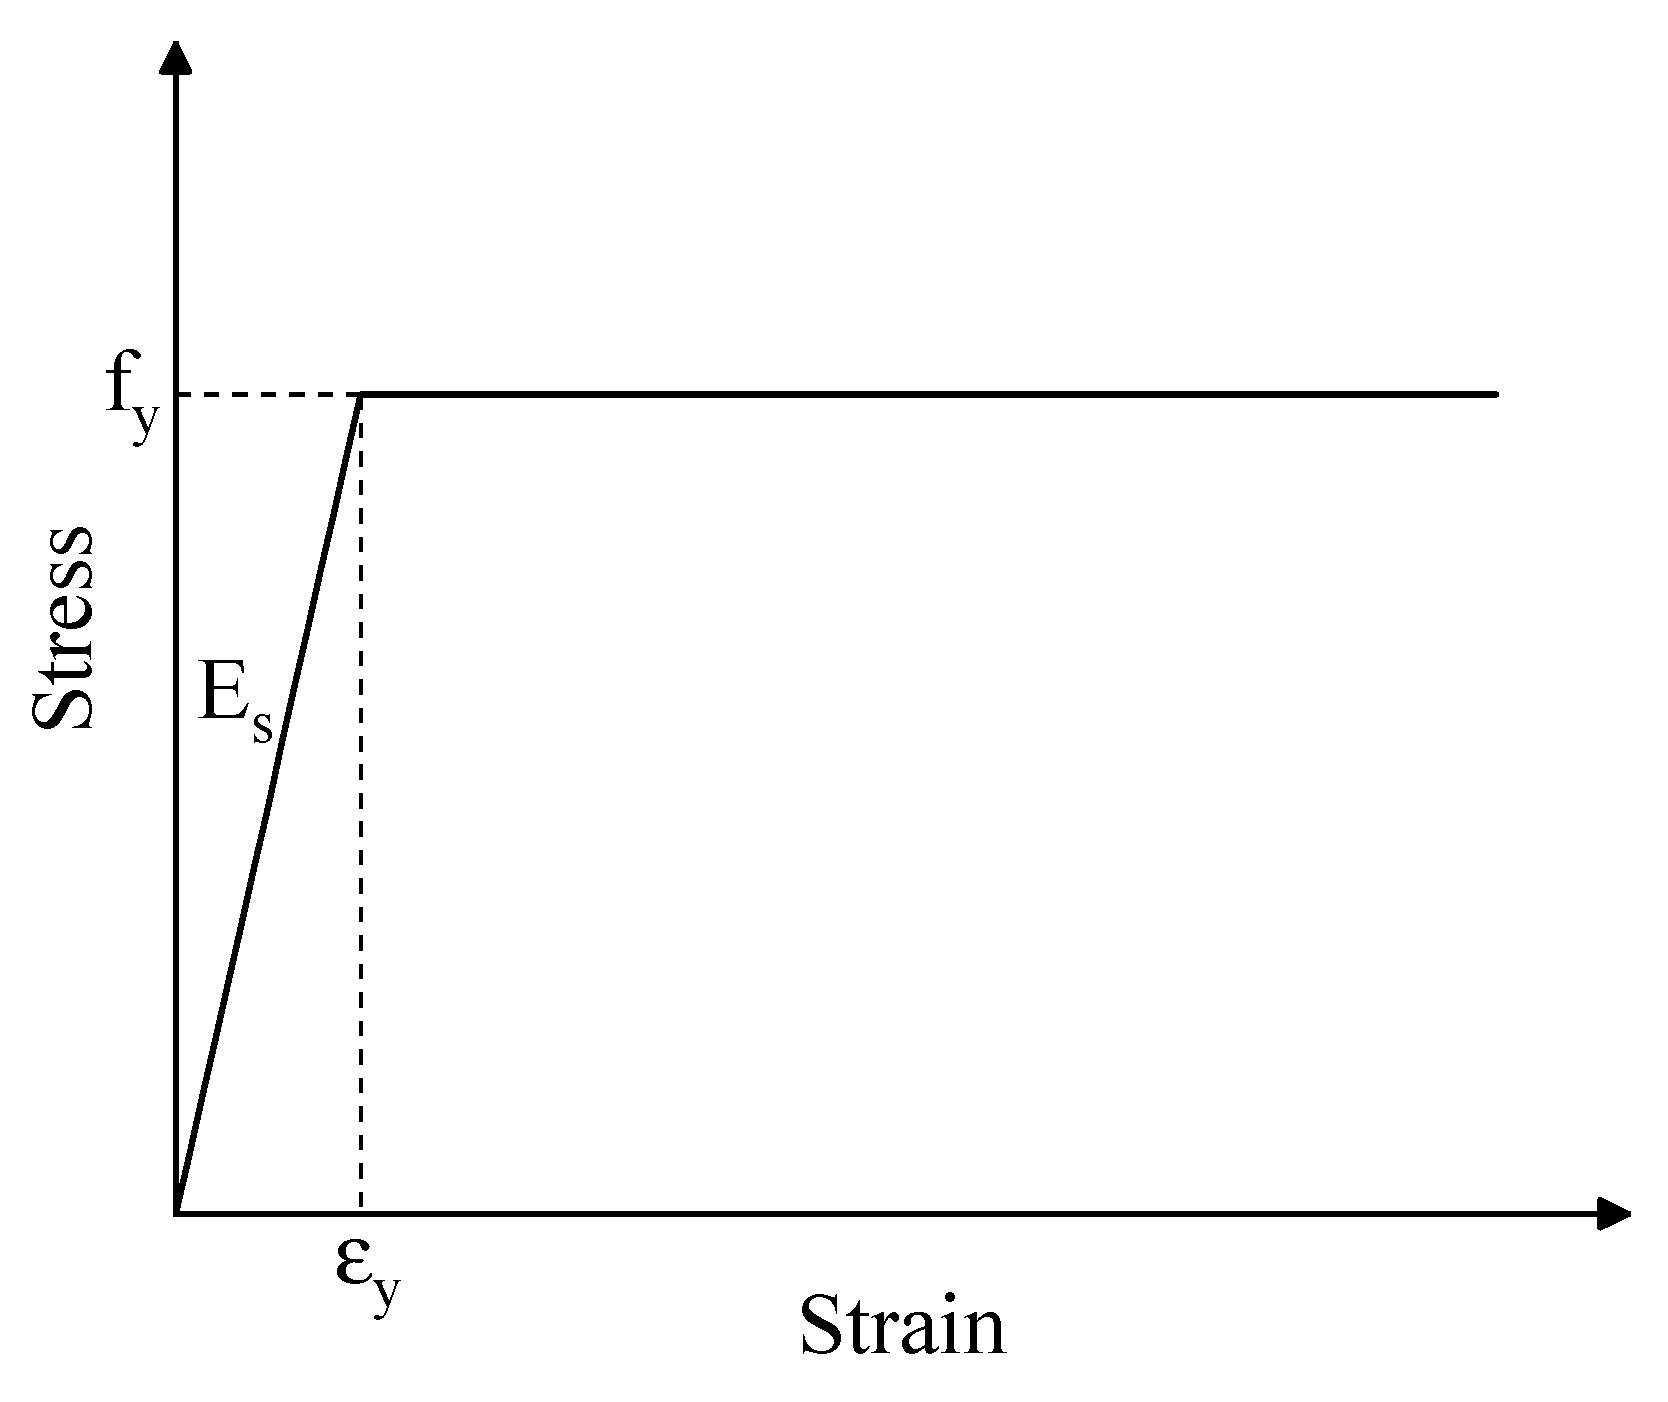
The Mohr–Coulomb criterion was employed for modeling the soil, with detailed geotechnical parameters tabulated in Table 2. The behavior of concrete was simulated using the Concrete Damaged Plasticity (CDP) constitutive model, which incorporates both isotropic damage and plastic deformation. Reference stress–strain curves from GB 50010-2010 [33] were utilized to determine damage parameters, as shown in Figure 8. Steel reinforcement was simulated using an idealized elastic–plastic model, omitting hardening and stiffness reduction considerations, as shown in Figure 9. In the figure, fy is reinforcement yield strength, ε y is the strain of steel bar at yielding, and Es is the elastic modulus of steel bar.

3.3. Contact and Boundary Conditions

The numerical simulation employed surface-to-surface contact algorithms to model interfacial interactions between components. Since ground fissure activity and seismic excitation will cause relative slip of the contact surface, the finite sliding formulation was adopted to accurately capture continuous contact interactions between slave surface nodes and the corresponding master surface throughout the analysis. In the model, the tunnel structure was designated as the master surface, while the surrounding soil was treated as the slave surface. For interactions between the hanging wall and footwall soils, the footwall was defined as the master surface and the hanging wall as the slave surface. Based on previous experimental studies [34,35] and preliminary test results, the interface friction coefficients were determined as 0.3 for the hanging wall–foot wall contact and 0.7 for tunnel–soil interaction.
The seismic response analysis was conducted as a dynamic elastic–plastic simulation under varying acceleration levels, with nonlinear springs employed to model the mechanical behavior of tunnel joints. The simulation consisted of two analysis steps. In Step 1, both the soil mass and the tunnel structure underwent self-weight consolidation to establish in situ stress equilibrium. The ground surfaces of both the hanging wall and footwall were left free of constraints. The boundary parallel to the seismic wave input direction was constrained in the Y-direction displacement and in rotation about the X- and Z-axes. The boundary perpendicular to the wave input direction was constrained in the normal displacement direction. In addition, the vertical (Z-direction) displacement at the bottom of the soil domain was also fixed [36]. In Step 2, the normal displacement constraint on the boundary perpendicular to the seismic wave input direction was removed and replaced by a viscoelastic artificial boundary condition [37,38], while all other constraints remained unchanged. The spring stiffness and damping coefficients in both the normal and tangential directions of the viscoelastic boundary were calculated based on the formulations proposed by Gu and Liu [39], as expressed by the following equations:
K B N = α N G R
C B N = ρ C P
K B T = α T G R
C B T = ρ C S
where K B N and K B T are normal spring stiffness and tangential spring stiffness, respectively, G is the shear modulus of medium, R is the distance from the wave source to the artificial boundary, ρ is media density, C P and C S are p-wave and s-wave velocity, respectively, and α N and α T are dimensionless empirical coefficients used in the formulation of the viscoelastic artificial boundary. For the 3D model, it is recommended that α N take 4/3 and α T take 2/3.
When seismic waves propagate through soil, they induce soil vibration. The resulting inertial forces lead to energy dissipation, a phenomenon referred to as the damping effect. In this study, damping was introduced by specifying damping coefficients both in the material properties and during the analysis steps. To determine the Rayleigh damping coefficients, a modal analysis was first conducted to obtain the natural frequencies of the overall system. Typically, the first two vibration modes are used for calculating the Rayleigh coefficients, based on the following formulas [40]:
ω 1 = 2 π f 1
ω 2 = 2 π f 2
α R = 2 ω i ω j ( ζ i ω j ζ j ω i ) ω j 2 ω i 2
β R = 2 ( ζ j ω j ζ i ω i ) ω j 2 ω i 2 ,   ζ = 0.05
where ω i , ω j , ζ i , ζ j are the natural frequency and damping ratio of the i and j order vibration modes of the structure, respectively, taking values of i = 1, j = 2.
In this paper, the seismic action was simulated by inputting s-wave (perpendicular to the tunnel) at the soil bottom. Therefore, the spring stiffness and damping coefficient in the normal direction were only considered when defining the viscous–elastic boundary. The area where the viscous–elastic artificial boundary is set is shown in Figure 10.

3.4. Seismic Waves

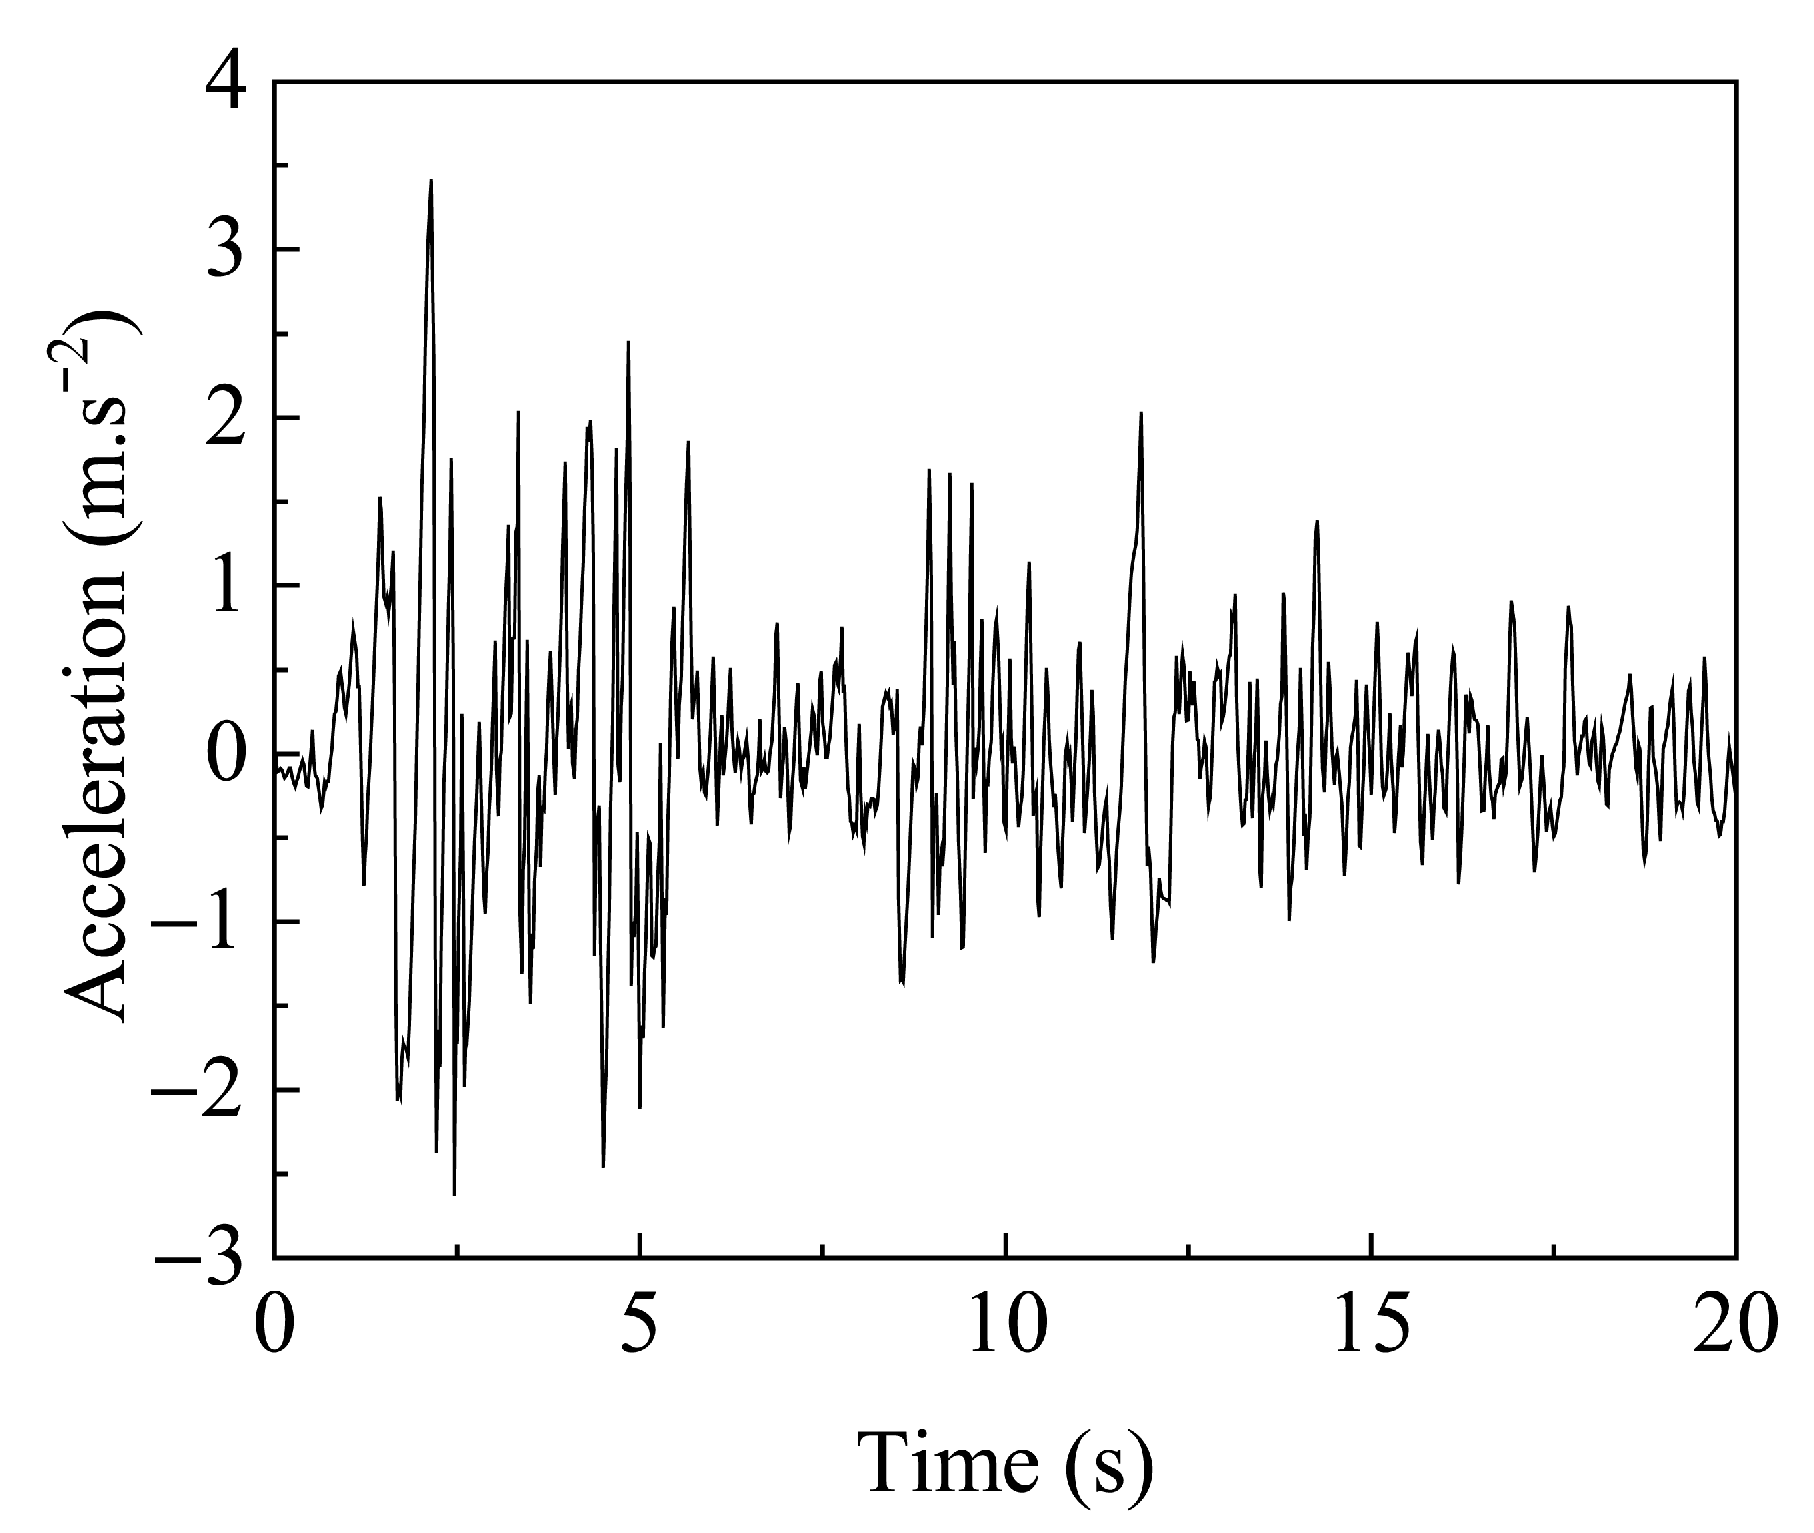
Xi’an is classified as Seismic Design Group II, with a seismic fortification intensity of 8 degrees. The basic design peak ground acceleration (PGA) for Type II sites is 0.20 g, and the corresponding design characteristic period is 0.40 s. According to the Standard for Classification of Seismic Protection of Building Constructions (GB50223-2008) [41], the proposed tunnel section is categorized as Seismic Class B, and the seismic grade of both the main structure and its ancillary components is Grade II. Based on the dynamic characteristics of the site soil, the El-Centro ground motion record (first 15 s) was selected as the input seismic wave, with a peak ground acceleration of 0.349 g, as shown in Figure 11. This study focuses on the seismic response of a segmented utility tunnel under both orthogonal and oblique seismic loading conditions, with input PGAs of 0.1 g, 0.2 g, and 0.4 g. Therefore, the original El-Centro acceleration–time curve was amplitude-scaled accordingly. The scaling formula is as follows:
a ( t ) = A m a x A ¯ m a x a ¯ ( t )
where a ¯ ( t ) , A ¯ m a x are adjusted seismic wave acceleration and peak value, respectively; a ( t ) , A m a x are seismic wave acceleration and peak value before adjustment, respectively.

3.5. Model Verification

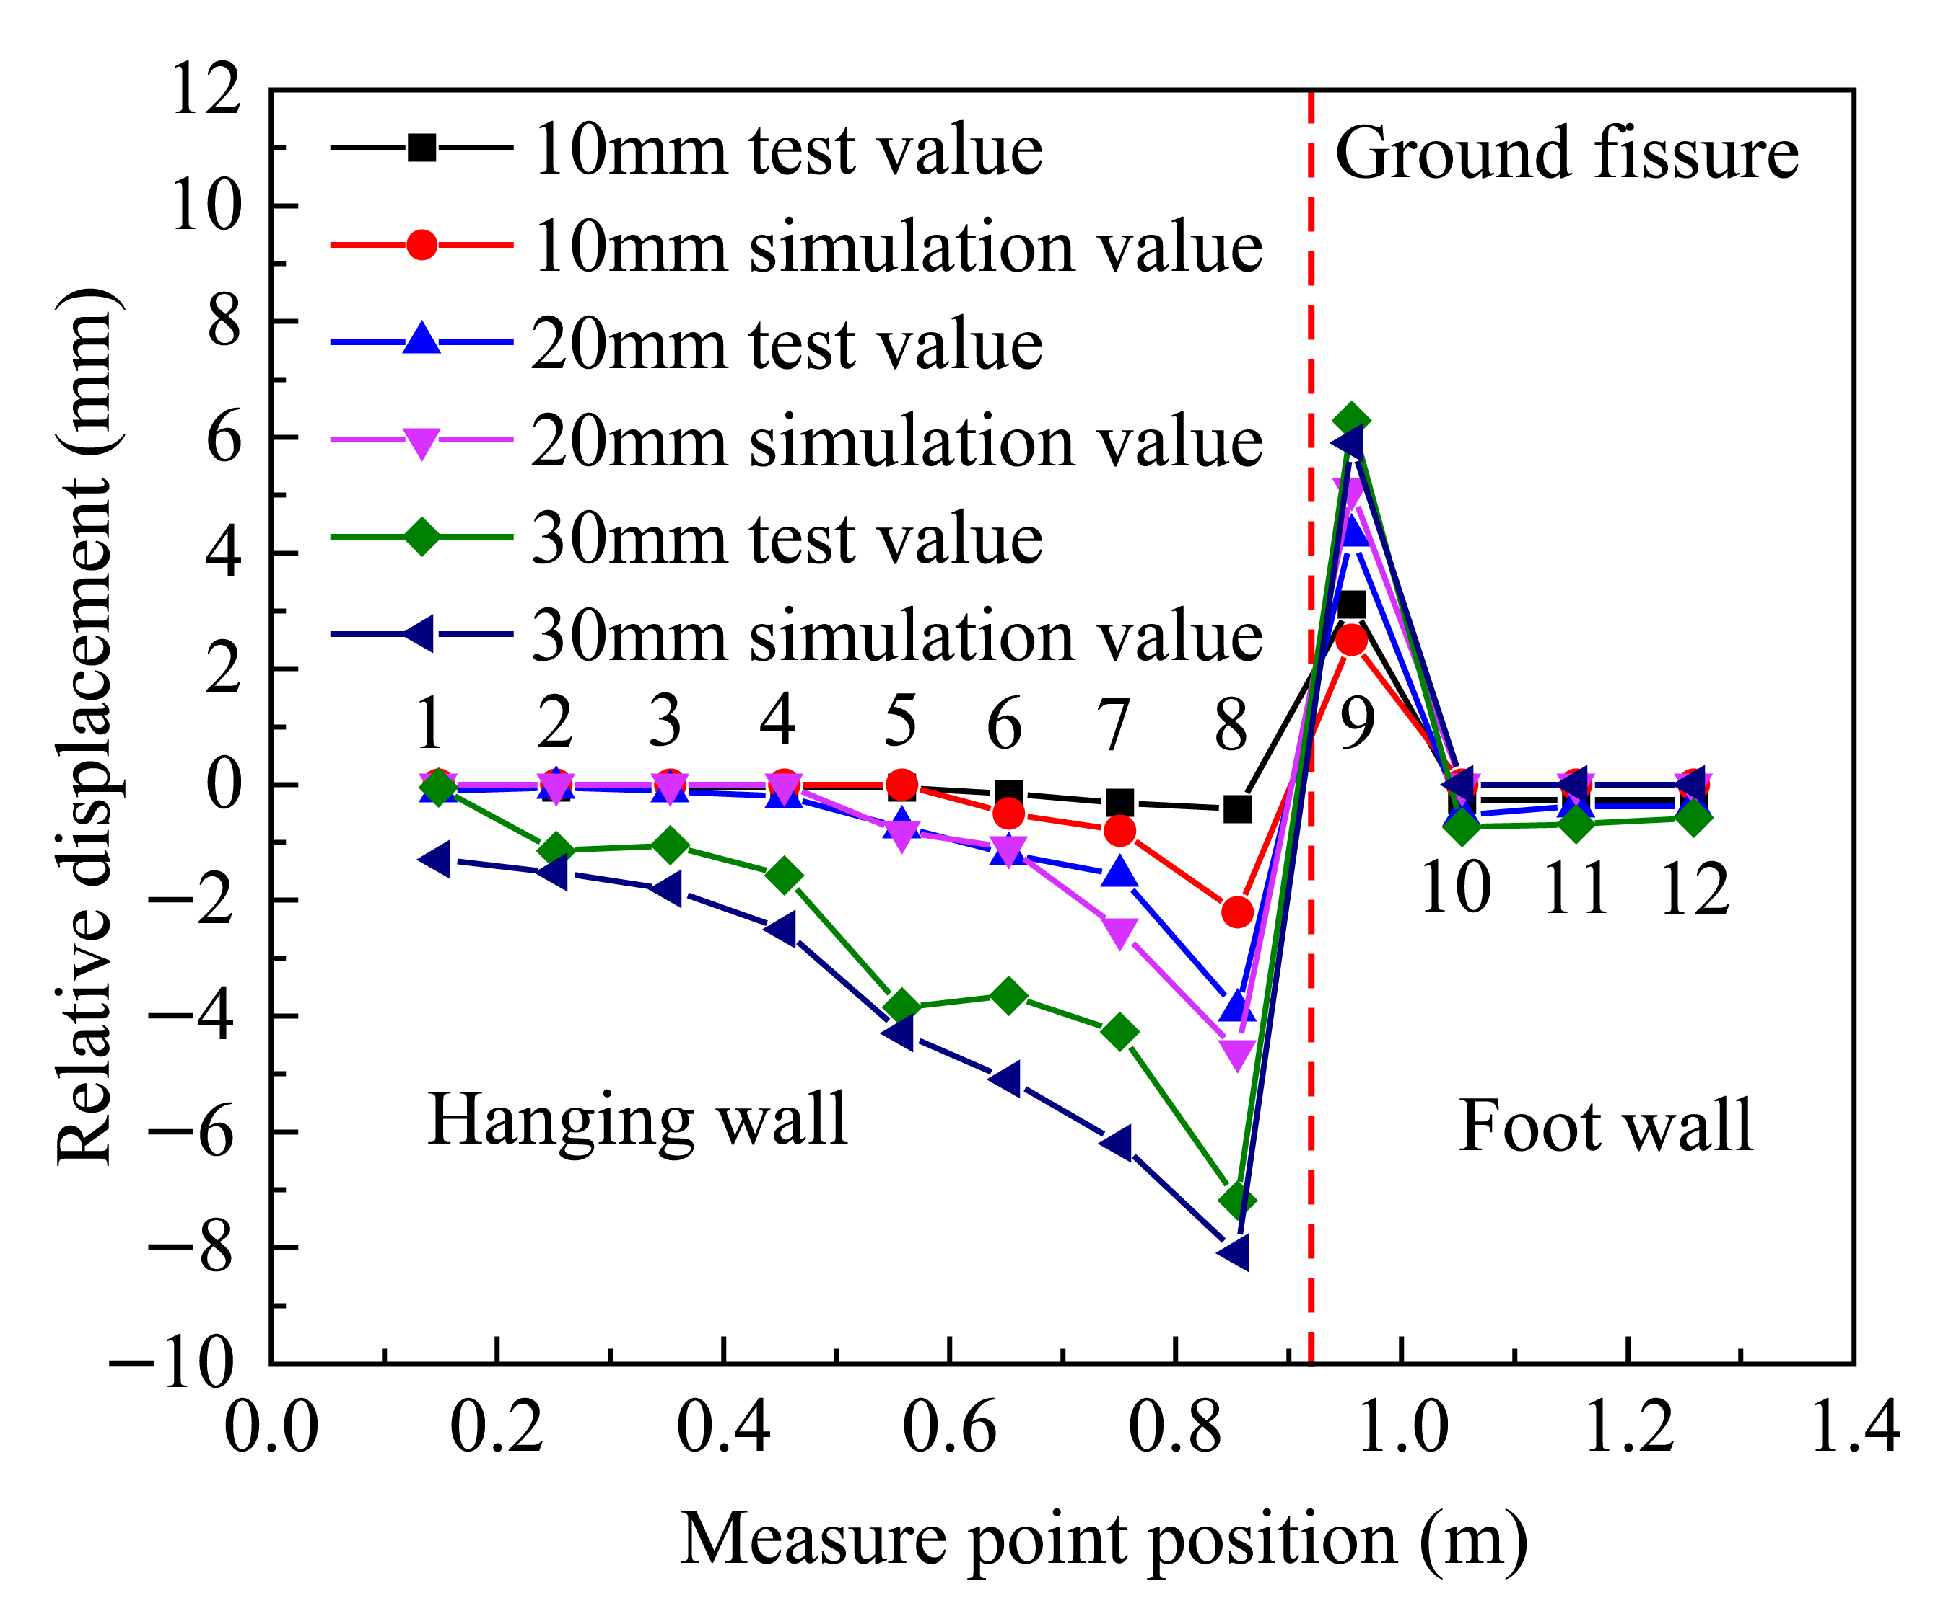
The test results reported by Li [42] were used to validate the rationality of the finite element model developed in this study. Li’s experimental setup was based on the 20 m soil profile reported by Huang et al. [43], with a geometric similarity ratio of 1:20. In the physical model, polymethyl methacrylate (PMMA, or plexiglass) was used in place of concrete for the tunnel structure. The relevant material parameters are listed in Table 3 and Table 4.
As shown in Figure 12, the finite element simulation results exhibit a strong correlation with the experimental data, confirming that the proposed numerical model can effectively capture the deformation behavior of segmental utility tunnels subjected to ground movement.

4. Results and Discussions

4.1. Soil Acceleration Analysis

4.1.1. Peak Acceleration of Soil Surface

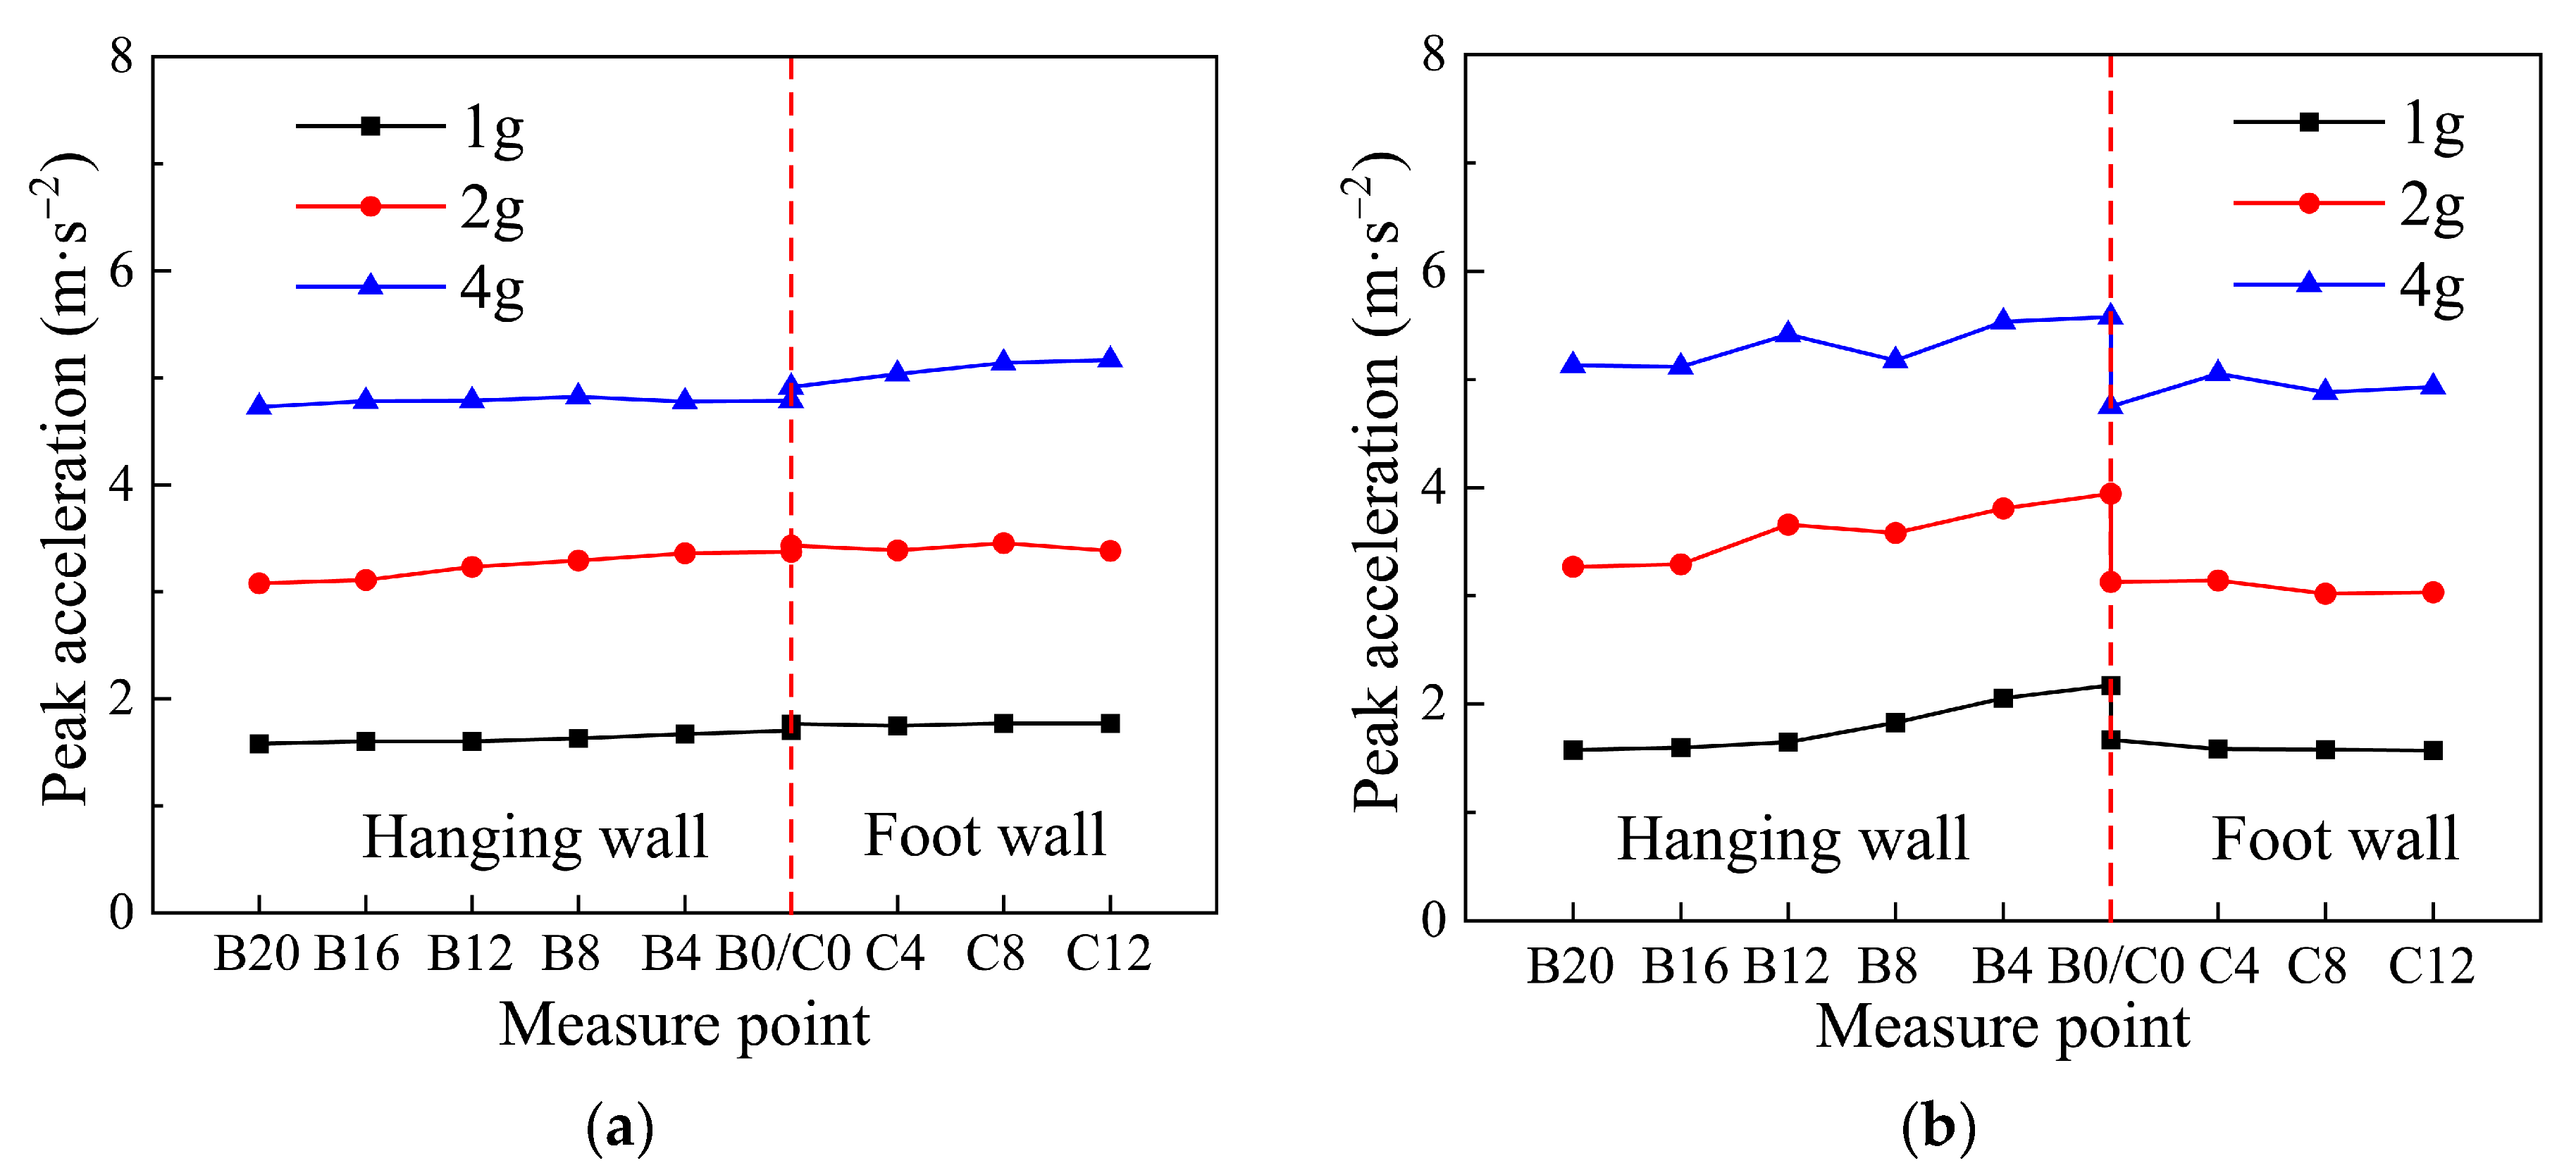
Under the seismic excitation of the El-Centro wave, the peak seismic acceleration (i.e., the maximum absolute value) in the site soil generally occurred at monitoring points B0 and C0—both located near the ground fissure—under both loading conditions, as shown in Figure 13. This indicates that seismic waves exert a more pronounced effect in the vicinity of ground fissures, thereby increasing the risk of damage to underground structures in these regions. Under orthogonal loading, the peak acceleration in the hanging wall soil was greater than that in the footwall. Similarly, under oblique loading, the hanging wall also experienced higher peak acceleration than the footwall. Moreover, the peak acceleration in the hanging wall under oblique loading was generally greater than that under orthogonal loading, suggesting that oblique incidence intensifies the seismic effect on the surrounding soil. When the input peak ground acceleration (PGA) was 0.1 g and 0.2 g, the variation in peak soil acceleration was relatively minor under both loading conditions. However, at a PGA of 0.4 g, the change became more significant. In addition, under uniform seismic excitation, the acceleration response of the soil exhibited minimal variation in the longitudinal direction. Therefore, this study focuses on analyzing the acceleration response with respect to depth. The decrease in peak acceleration observed below the tunnel depth is mainly caused by energy absorption and scattering at the tunnel–soil interface, as well as Rayleigh damping effects within the soil medium. Due to the use of artificial boundaries and large model dimensions, numerical boundary reflections are considered negligible.
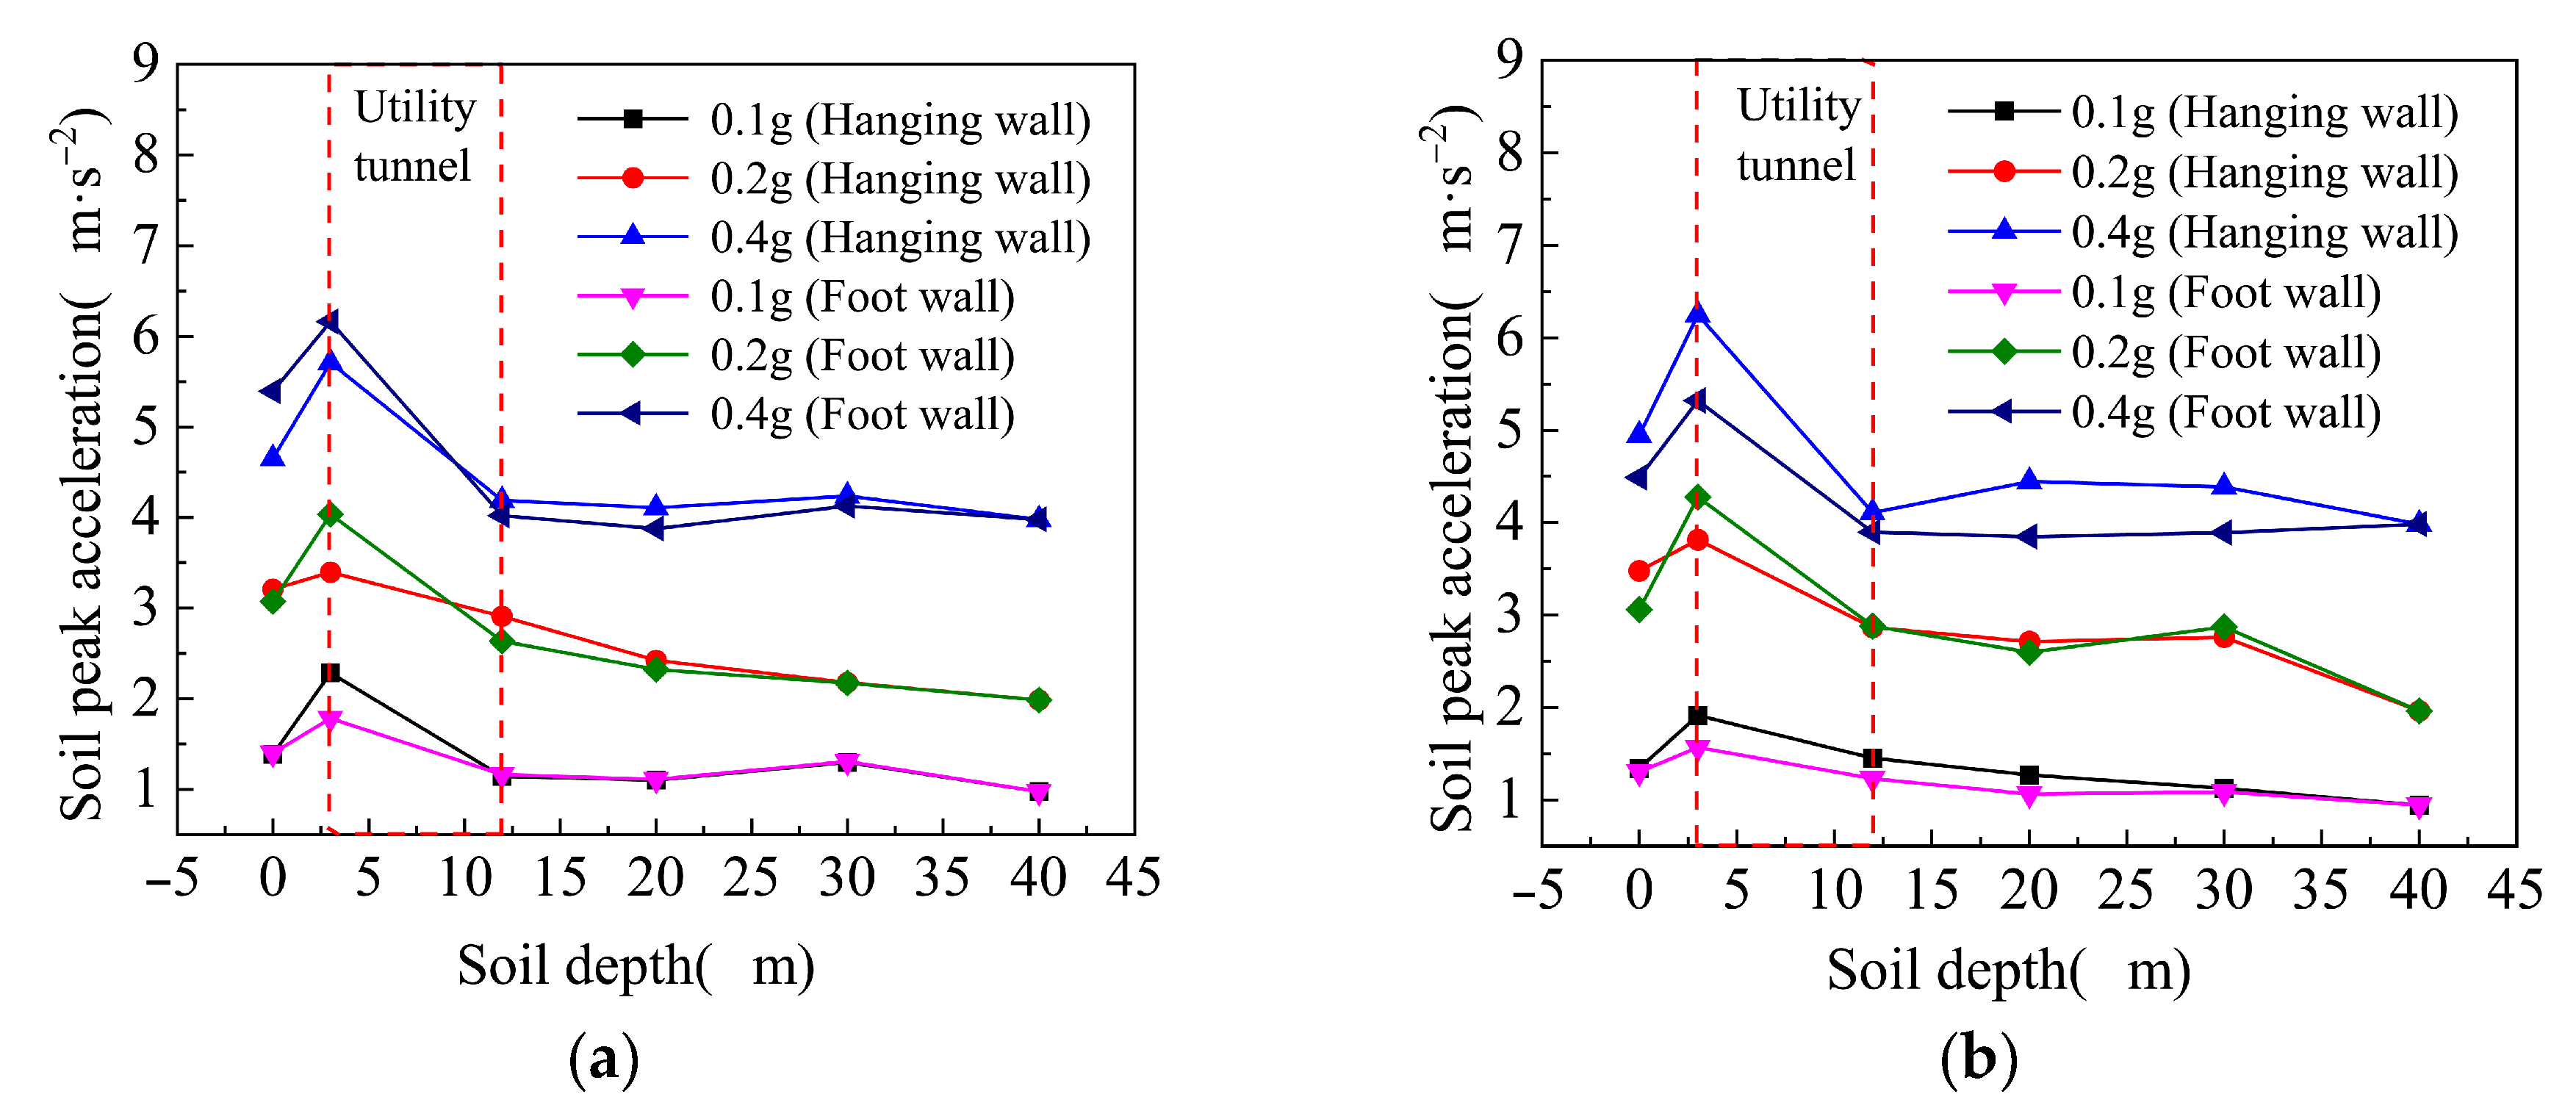
It can be seen from the above analysis that the maximum peak acceleration of soil mostly appeared at B0/C0 measure points. Therefore, six points with different soil depths at B0/C0 were selected to study the acceleration response and acceleration amplification effect of soil. The peak accelerations of these six points are shown in Figure 14.
As illustrated in Figure 14, under different input acceleration levels, both orthogonal and oblique loading conditions exhibited a general bottom-up amplification of soil acceleration along the depth direction. This observation aligns with the findings of Qu [30], indicating that seismic waves have a greater impact on shallow soil layers. Moreover, a significant reduction in peak soil acceleration was observed within the depth range occupied by the tunnel, suggesting that the presence of underground structures attenuates soil deformation. The variation trends of peak soil acceleration were similar under both orthogonal and oblique conditions. However, the magnitude of peak acceleration was consistently higher under oblique loading, indicating that the oblique incidence of seismic waves intensifies the acceleration response of the soil mass.

4.1.2. Soil Acceleration Amplification Coefficient

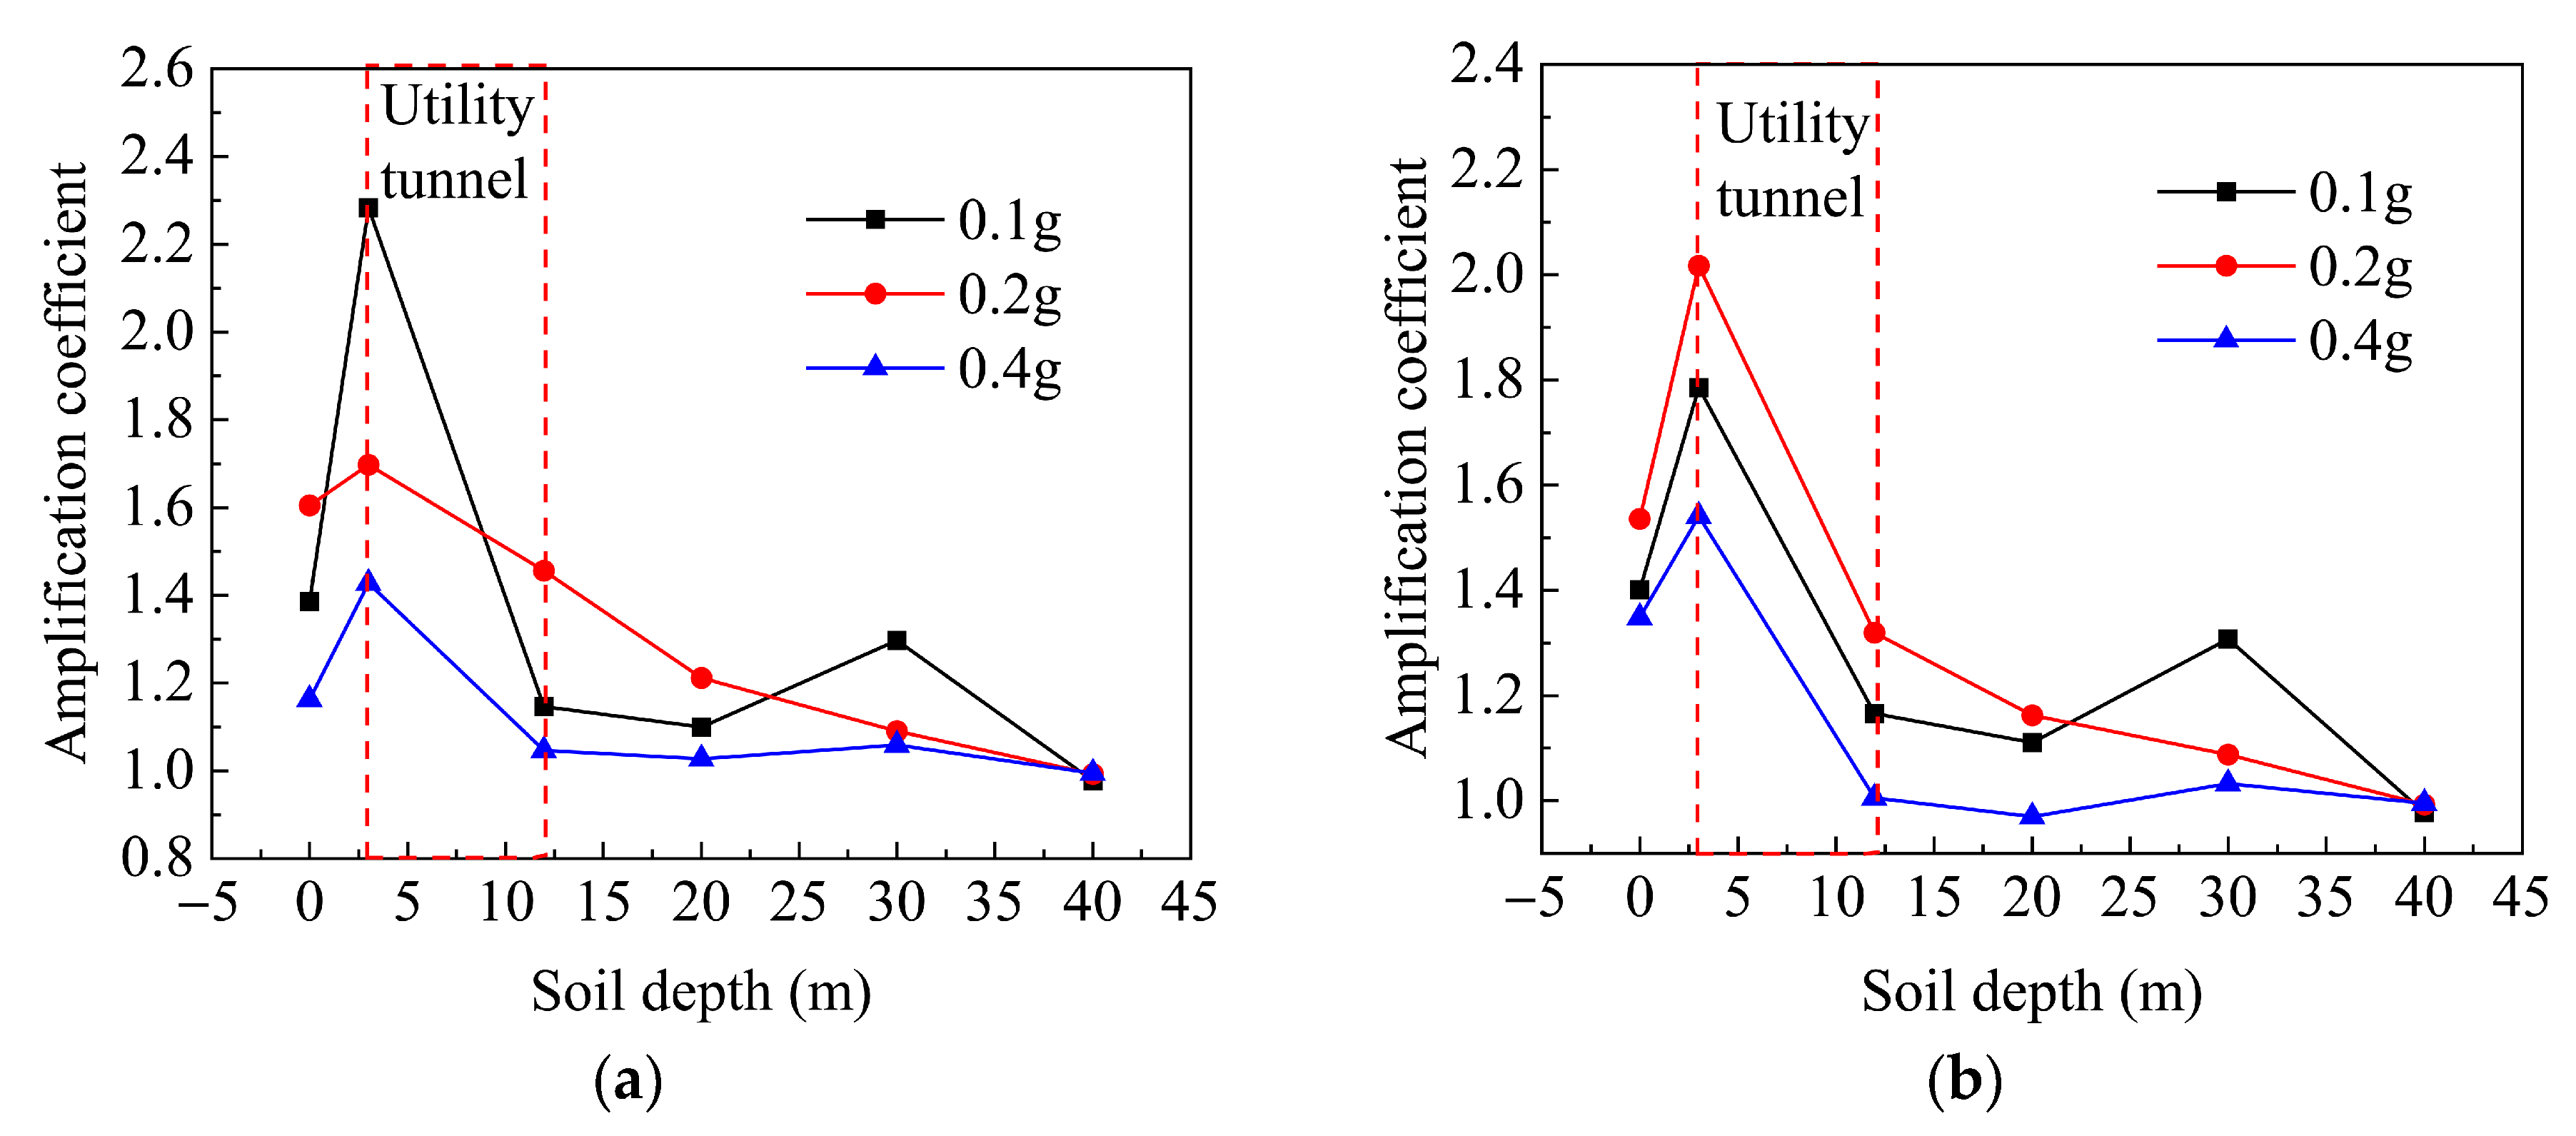
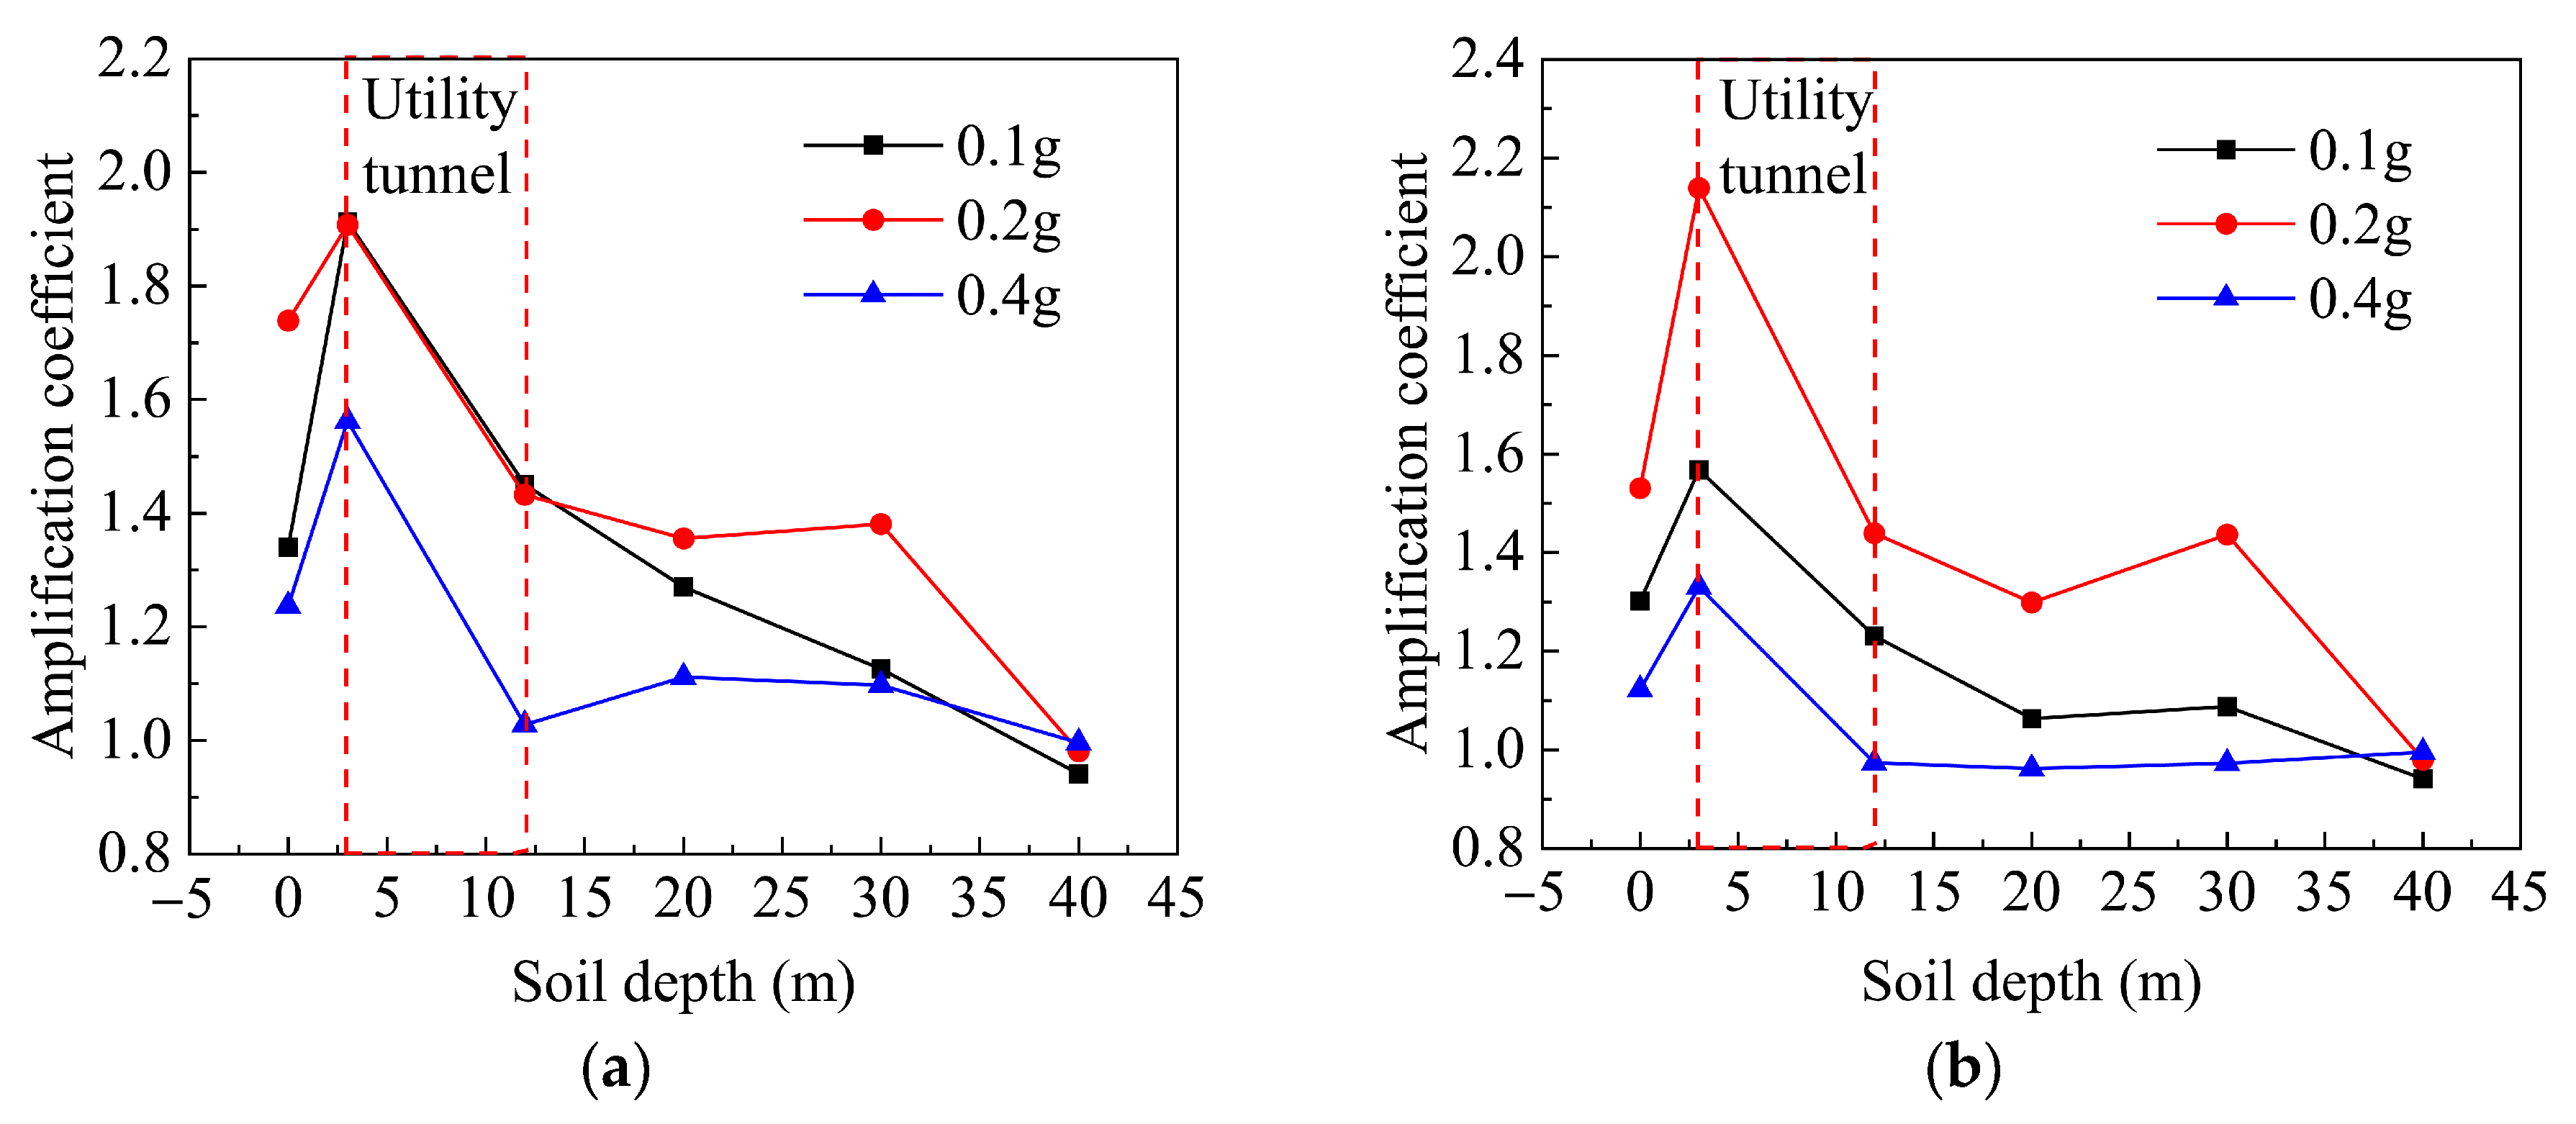
The variation curve of the soil acceleration amplification coefficient (defined as the ratio of peak acceleration to input seismic acceleration) provides a more intuitive representation of the soil’s amplification behavior. As shown in Figure 15 and Figure 16, the overall trend of the amplification coefficient for both hanging wall and footwall soils remains largely unaffected by different input acceleration levels. At a depth of 40 m, the amplification coefficient was approximately equal to one, indicating that the model’s boundary conditions were appropriately defined. Under both orthogonal and oblique loading conditions, the soil acceleration amplification coefficient reached its maximum value at an input acceleration of 0.2 g and its minimum value at 0.4 g. This pattern suggests that soil acceleration is more sensitive under frequent and moderate earthquake intensities, whereas its amplification effect diminishes under stronger seismic excitation. At 0.4 g input acceleration, the reduction in amplification coefficient is attributed to nonlinear effects in both soil and tunnel joints. Plastic strain localization near the tunnel–soil interface, combined with joint opening and sliding behavior, absorbs substantial seismic energy and reduces the surface acceleration response.

4.2. Tunnel Acceleration Analysis

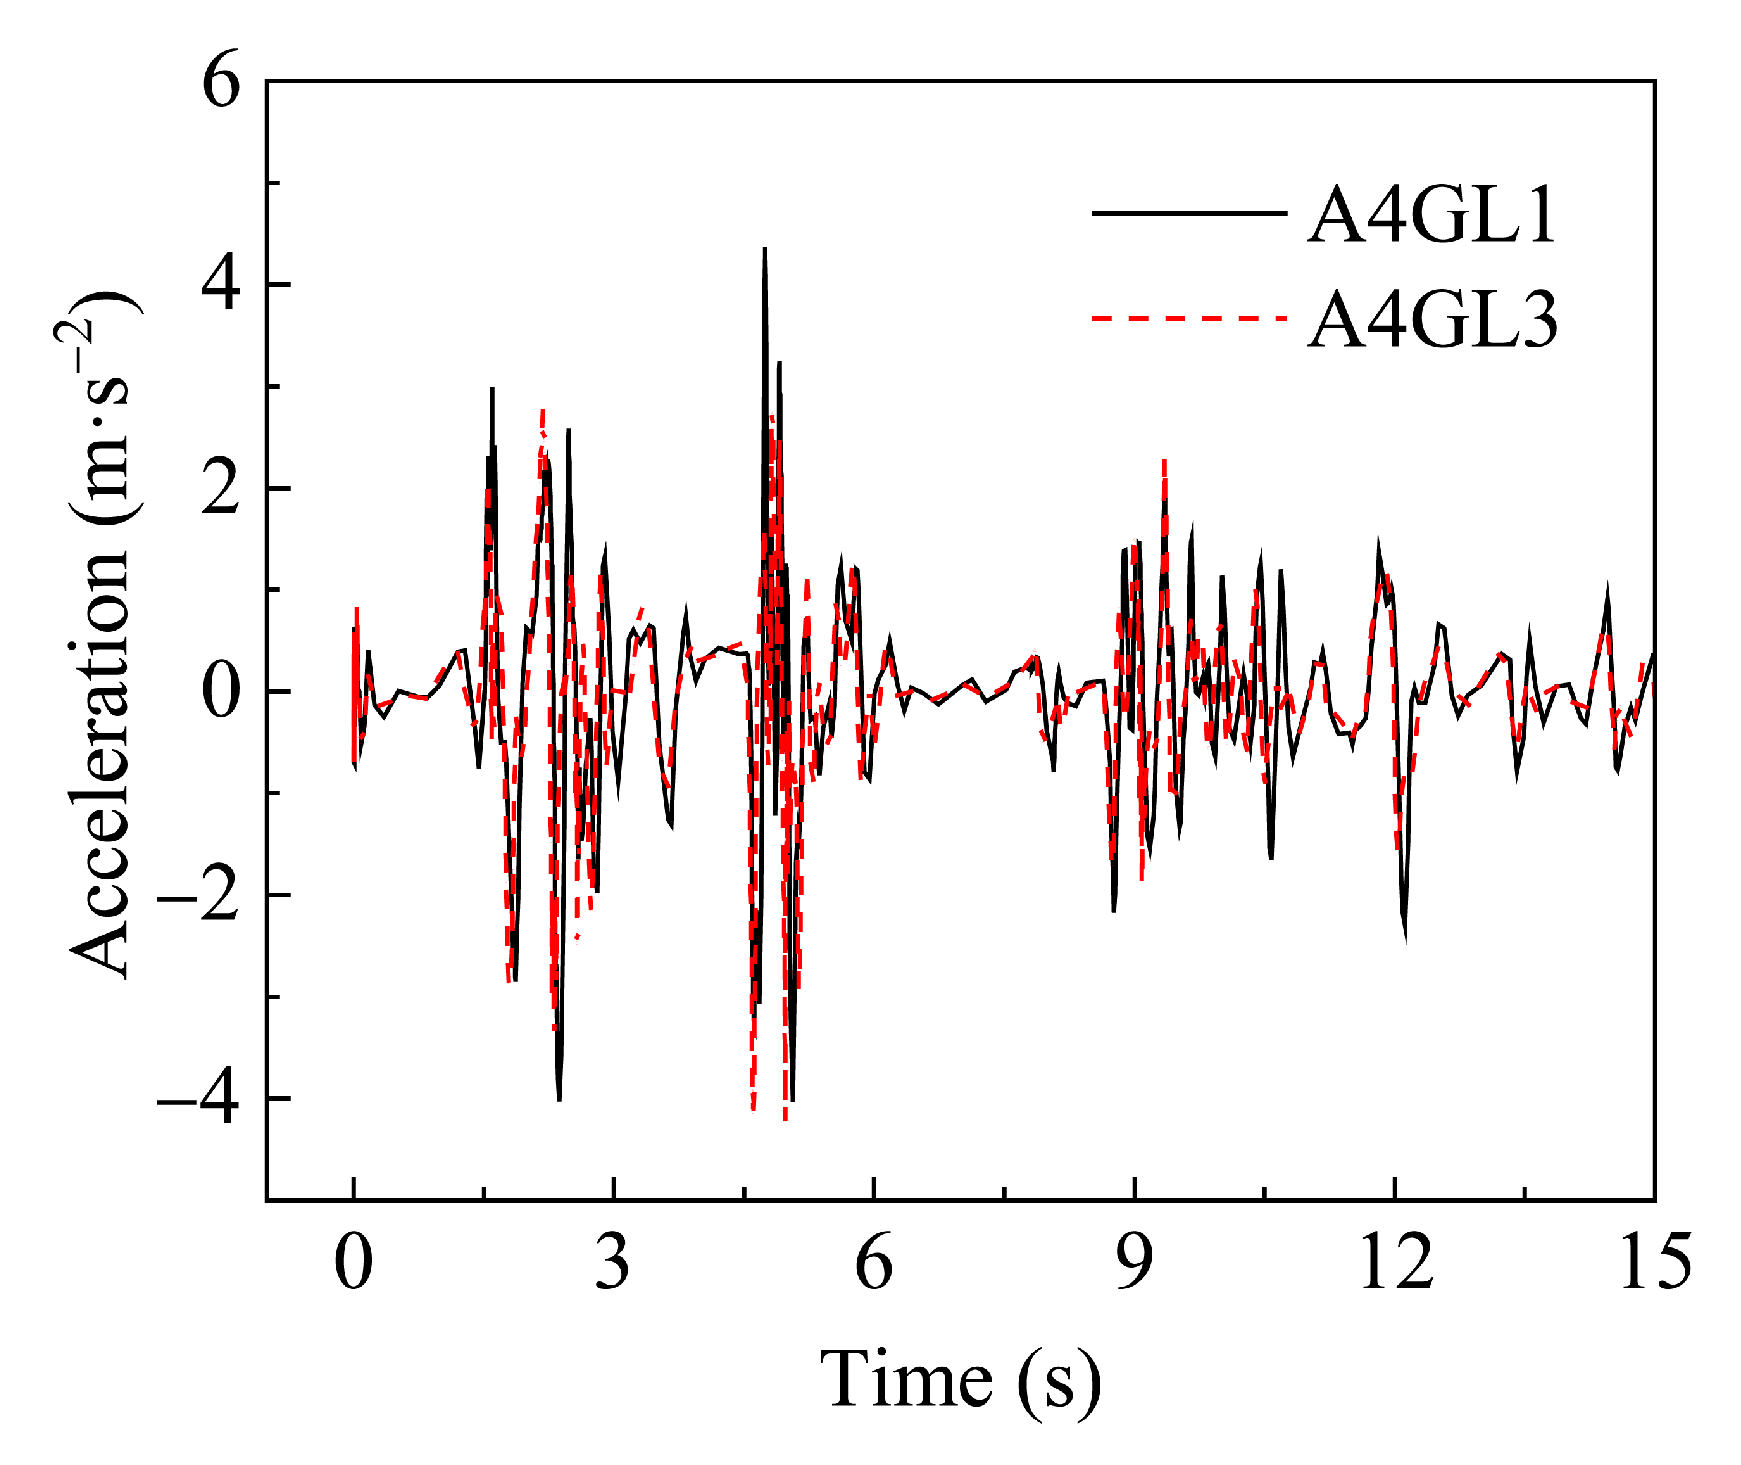
To analyze the acceleration response at the same height within the tunnel, monitoring point GL1 was selected from the A2 and A7 tunnel sections under oblique loading with an input acceleration of 0.2 g, as shown in Figure 17. Additionally, to evaluate the acceleration response at different heights within the tunnel, monitoring points GL1 and GL3 from the A4 tunnel section were selected under the same loading condition, as illustrated in Figure 18.
As shown in Figure 17, the acceleration–time curves of monitoring point GL1 in tunnel sections A2 and A7 are nearly identical. Both the peak acceleration and the overall variation trend are highly consistent, indicating that the acceleration response of the tunnel at the same elevation remains uniform under consistent seismic excitation. In Figure 18, the acceleration trends at monitoring points A4GL1 and A4GL3 are generally similar; however, the peak acceleration at A4GL3 is consistently lower than that at A4GL1. This indicates that the tunnel’s acceleration response decreases with increasing depth, which is consistent with the previously observed trend in soil acceleration amplification. This phenomenon can be attributed not only to the attenuation of ground motion with depth but also to the repeated reflection of seismic waves between the soil surface and the tunnel roof, which intensifies the response in upper sections.
Based on the soil acceleration analysis, the underground structure near monitoring points B0 and C0 exhibits a higher risk of failure. Therefore, tunnel section A4 was selected as the subject for subsequent detailed investigation.

4.2.1. Acceleration–Time History Analysis of Tunnel Under Orthogonal Condition

As shown in Figure 19 and Figure 20, the acceleration–time curves of monitoring points A4GL2 and A4GL4 closely overlap, indicating a similar seismic response at these locations. In contrast, the acceleration–time curves of A4GL1 and A4GL3 differ significantly, with A4GL1 exhibiting noticeably higher acceleration values than A4GL3. Figure 21 compares the peak accelerations at A4GL1, A4GL2, and A4GL3, clearly demonstrating that tunnel acceleration decreases with depth. Under orthogonal seismic loading, the acceleration is greatest at the tunnel roof, followed by the sidewall, and is lowest at the tunnel floor. These findings suggest that, in the seismic design of tunnels under orthogonal loading conditions, special attention should be given to reinforcing the tunnel roof, which experiences the most severe dynamic response.

4.2.2. Acceleration–Time History Analysis of Tunnel Under Oblique Condition

Figure 22 and Figure 23 show the acceleration–time history at monitoring points A4GL1, A4GL2, A4GL3, and A4GL4 under oblique loading conditions. Similar to the orthogonal loading case, the acceleration–time curves of A4GL2 and A4GL4 are highly consistent, whereas those of A4GL1 and A4GL3 differ significantly. Moreover, the acceleration values at all monitoring points under oblique loading are higher than those observed under orthogonal loading, indicating a stronger seismic response. As shown in Figure 24, when the input peak ground accelerations are 0.1 g and 0.2 g, the acceleration at A4GL2 is the highest, followed by A4GL1 and A4GL3. Under 0.4 g input, the peak acceleration at A4GL1 was 7.9 m/s2, which was significantly higher than the 7.1 m/s2 observed at A4GL3, indicating stronger acceleration response at the tunnel roof compared to the floor; however, the acceleration of A4GL2 is the smallest, which is contrary to the trend observed at lower excitation levels. This reversal results from increased joint deformation and energy dissipation at the sidewall under large seismic loading, which suppresses local acceleration transmission. Therefore, in the seismic design of tunnels under oblique conditions, attention should be given not only to reinforcing the tunnel roof but also to enhancing the strength of the sidewalls.

4.3. Tunnel Displacement Analysis

Under the action of s-wave seismic, the lateral displacement perpendicular to the tunnel is much greater than the displacement along axial and vertical directions. Therefore, this paper only analyzed the lateral displacement of the segmented utility tunnel.

4.3.1. Lateral Displacement of Tunnel Under Orthogonal Condition

The data at the time (13.11 s) when the lateral displacement of the tunnel was the largest under orthogonal conditions were selected to study the lateral displacement of tunnel roof (GL-1), sidewall (GL-2) and floor (GL-3) under different input accelerations (Figure 25).
As shown in Figure 25, under the action of different seismic input accelerations, the lateral displacement of GL-3 basically remains unchanged along the longitudinal direction. However, the lateral displacements of GL-1 and GL-2 at the junctions of the tunnel have obvious variation. When the input accelerations are 0.1 g and 0.2 g, the maximum lateral displacement differences of the tunnel are 2.25 mm and 1.56 mm, respectively. These small displacement differences show that the segmented utility tunnel can maintain good integrity under small and moderate earthquakes. But the maximum lateral displacement difference of the tunnel reaches 6.83 mm under 0.4 g input acceleration, and the large displacement difference mainly appears at the junctions of A4, A5, and A6 tunnel sections which are close to the ground fissure. The lateral displacement differences of the junctions between A1–A4 and A6–A8 tunnel sections are small, indicating that segmented utility tunnels can keep moving together under the action of earthquake to avoid the damage caused by the lateral displacement difference between tunnel sections.

4.3.2. Lateral Displacemen Analysis of Tunnel Under Orthogonal Condition

Similarly, the data of the maximum lateral displacement time (13.15 s) of the tunnel was selected to study the displacement variation of GL-1, GL-2, and GL-3 measure points, as shown in Figure 26.
In Figure 26, it can be seen that there are large lateral displacement differences between tunnel sections caused by input accelerations under oblique conditions. Under the input seismic acceleration of 0.1 g, 0.2 g, and 0.4 g, the maximum displacement difference is 7.64 mm, 16.67 mm, and 24.4 mm, respectively. Obviously, even under the action of a small earthquake, the maximum displacement difference under oblique conditions is greater than that under orthogonal conditions. In addition, under oblique conditions, the maximum displacement differences all appeared at the junctions between A4 and A5 tunnel sections. Compared with GL-1 and GL-2, the lateral displacement variation of GL-3 is small, which is similar to the phenomenon under orthogonal condition.
Regardless of whether the tunnel crosses the ground fissure orthogonally or obliquely, the lateral displacement difference between A4 and A5 tunnel sections is larger than the other areas in general. Furthermore, the tunnel has a higher risk of damage under oblique conditions. Therefore, in the design of a segmented utility tunnel, the tunnel should cross the ground fissure as orthogonal as possible. If segmented a tunnel must cross the ground fissure obliquely, the strength of the tunnel junctions should be improved, especially the junction between the two sections of the tunnel near the ground fissure.

4.4. Seismic Analysis and Design of Segmented Utility Tunnels

The lateral displacement analysis showed that the most dangerous area of the tunnel under earthquake was located at the junction of A4 and A5 tunnel sections (60 m longitudinal coordinate) crossing the ground fissure. Therefore, eight measure points A4GL1, A4GL2, A4GL3, A4GL4, and (at the right end of the A4 tunnel section), and A5GL1, A5GL2, A5GL3, and A5GL4 (at the left end of the A5 tunnel section) were selected for further displacement analysis under different input seismic accelerations. The ratio of the displacement difference of GL1 and GL3 to the height of the tunnel was defined as the shear angle to reflect the shear deformation of the tunnel. Define the displacement difference between A4GL2 and A5GL2 (or A4GL4 and A5GL4) as the dislocation amount of A4 and A5 tunnel sections. The data of the eight measure points are shown in Table 5, and the shear angle is shown in Table 6.
As shown in Figure 7, the lateral displacements of GL2 and GL4 are basically the same, while the data of GL1 (roof of the tunnel) and GL3 (floor of the tunnel) have great difference. The displacement difference between the roof and floor of the tunnel will lead to lateral shear deformation of the tunnel. It can be seen from Table 6 that as the input seismic acceleration increases, the shear angle of the A4 and A5 tunnel sections increases significantly. The shear angle of the A4 tunnel section under oblique conditions is larger than that under orthogonal conditions, indicating that the shear deformation of the tunnel under oblique conditions is greater, and the main structure of the tunnel is more prone to damage.
According to the provisions of the code for the seismic design of buildings (GB 50011-2010) [44], deformation checks of underground structures subjected to frequent earthquakes shall be carried out. However, the shear angle limit of thin-wall tunnels is not given. The data of Table 6 show that under 0.2 g input seismic acceleration, the maximum shear angles under orthogonal conditions and oblique conditions are 1/450 and 1/199, respectively. Under 0.4 g input seismic acceleration, the maximum shear angles are 1/138 and 1/116, respectively. It can be found that the maximum shear angle under orthogonal conditions is significantly smaller than that under oblique conditions with 0.2 g input seismic acceleration, while the maximum shear angels under these two conditions are similar when the input seismic acceleration reaches 0.4 g. Therefore, it is recommended that in the seismic design of underground segmented utility pipeline, the shear angle limit under frequent earthquakes shall be calculated separately in different conditions; under the action of rare earthquakes, the shear angel of segmented utility pipeline in different conditions can adopt the same limit value.
Table 7 shows the displacement differences between A4 and A5 tunnel sections to study the cooperative deformation of the tunnel area where it crosses the ground fissure. Obviously, the displacement difference of A4 and A5 tunnel sections is very small and is not greater than 10 mm under orthogonal condition. However, when the tunnel crosses the ground fissure obliquely, the displacement difference between A4 and A5 tunnel sections exceeded 10 mm under 0.2 g input acceleration. And, under 0.4 g input acceleration, the displacement difference even reached 20.7 mm in oblique conditions. In practical situations, the rubber flexible joint is often used in the waterstop at the junction of the tunnel. Consequently, under oblique conditions, a thicker waterstop is required between the tunnel sections across the ground fissure area to prevent water seepage and pipe spoilage due to dislocation of the tunnel.

4.5. Damage Analysis of Tunnel

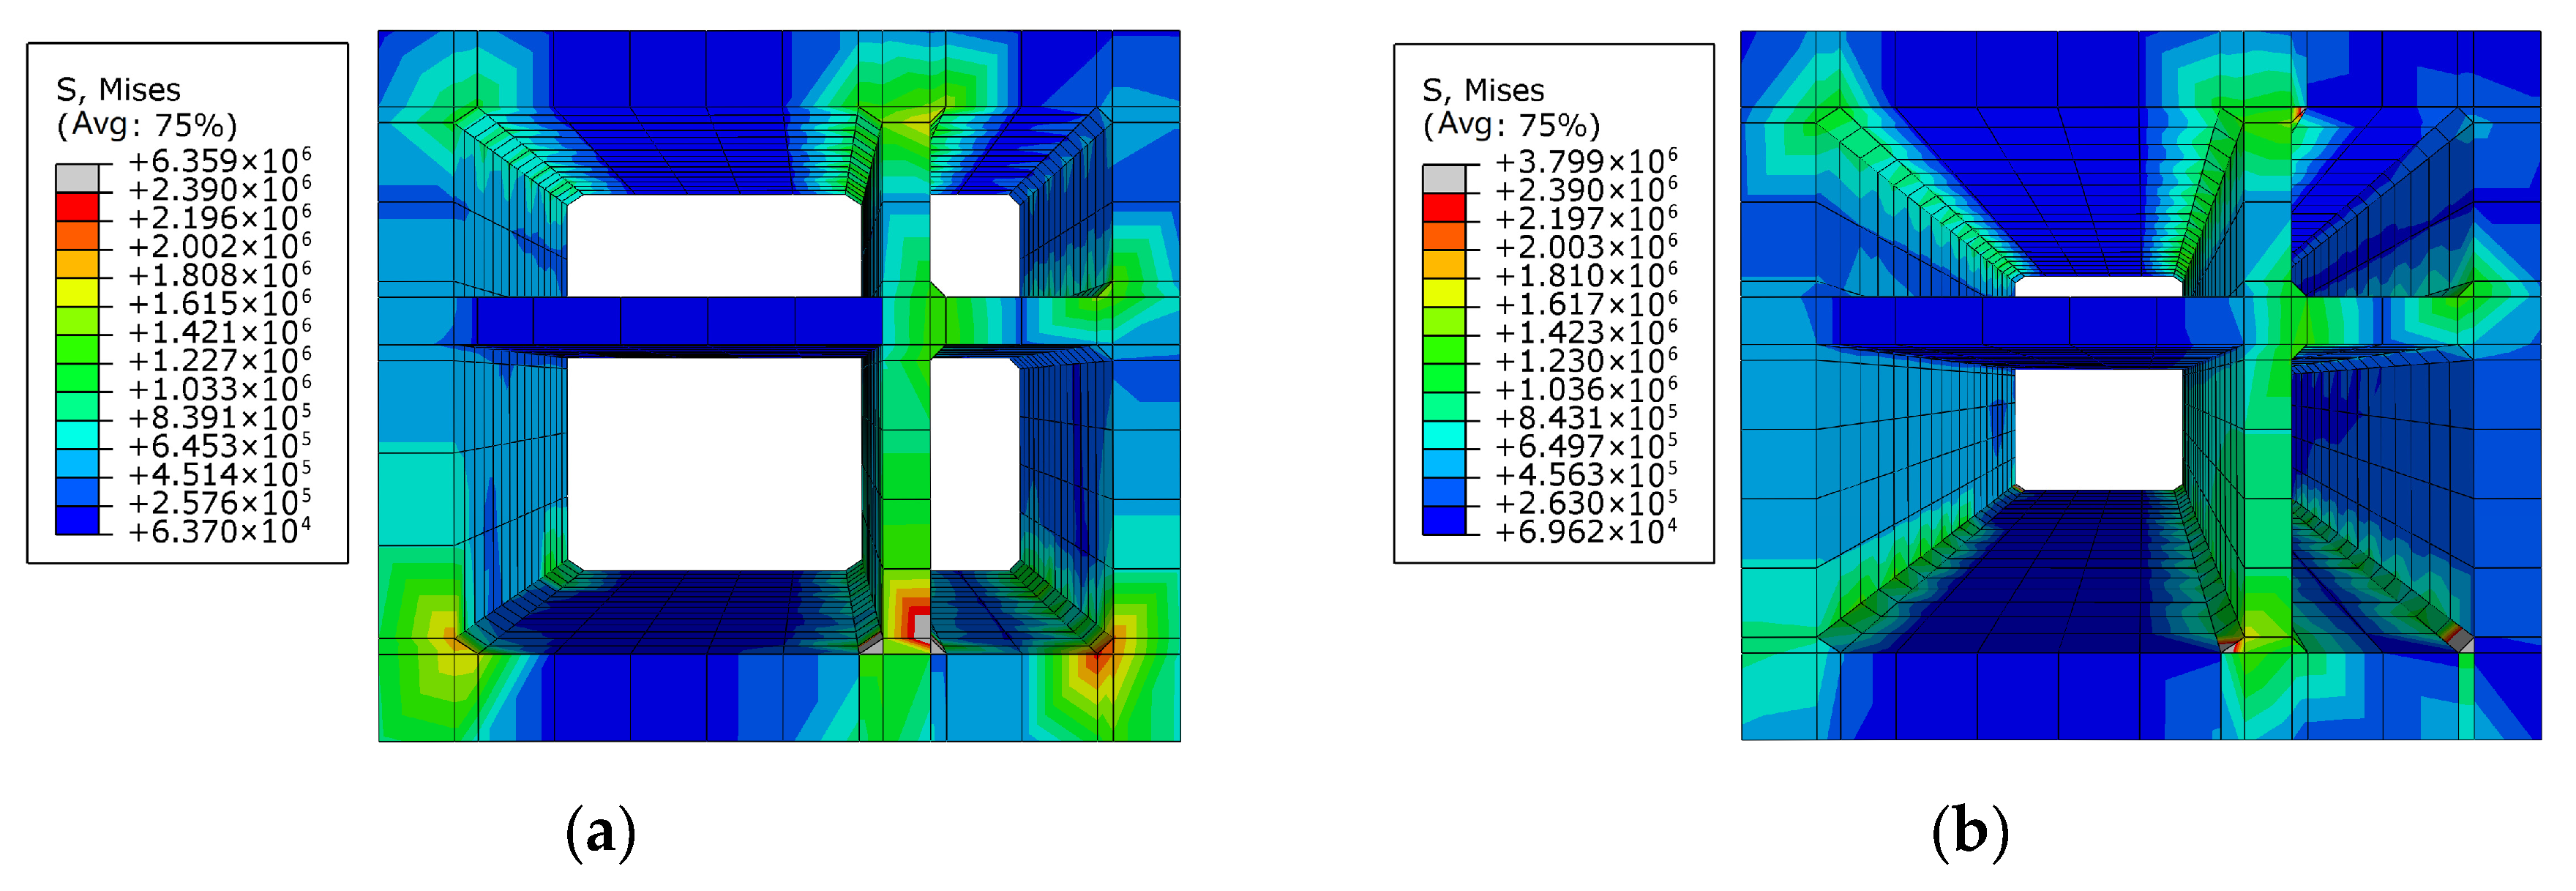
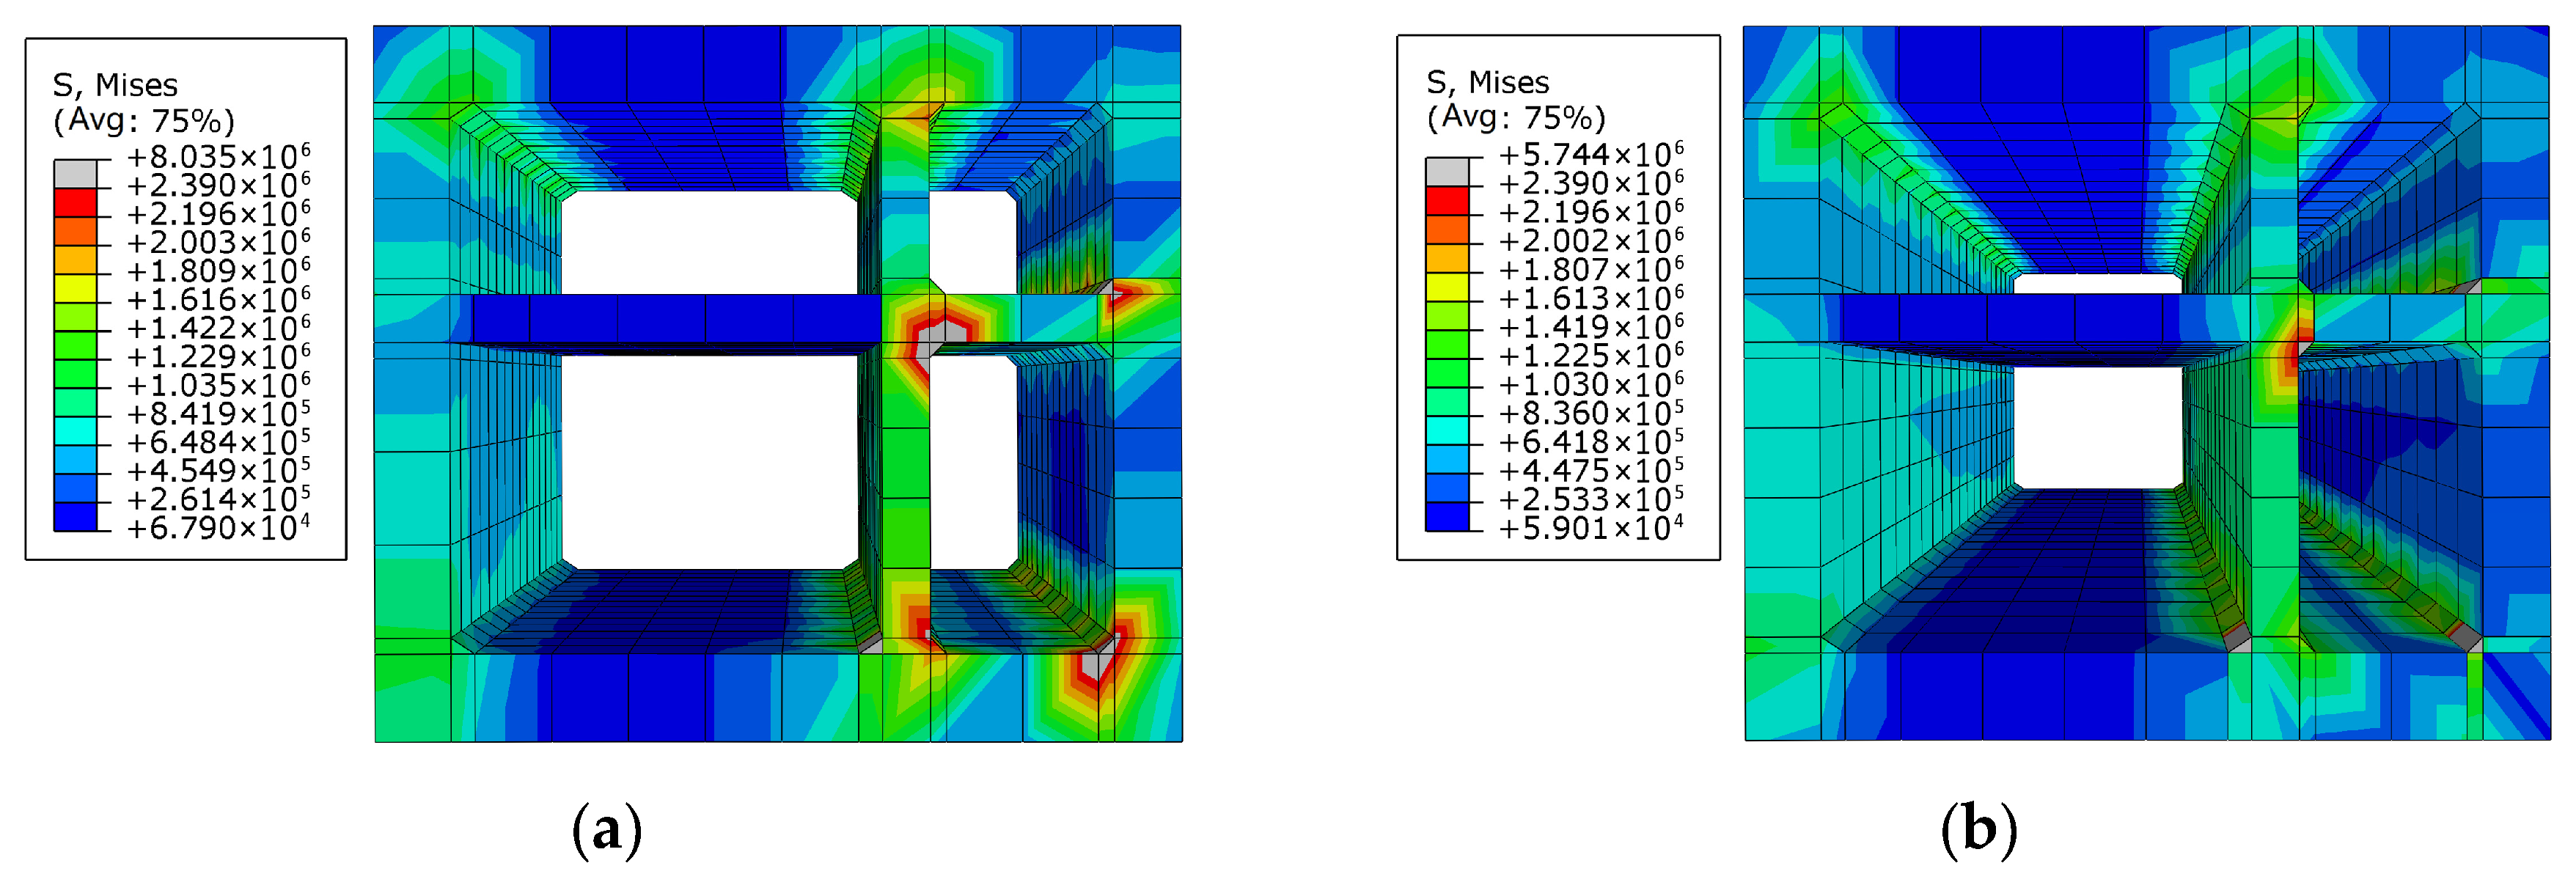
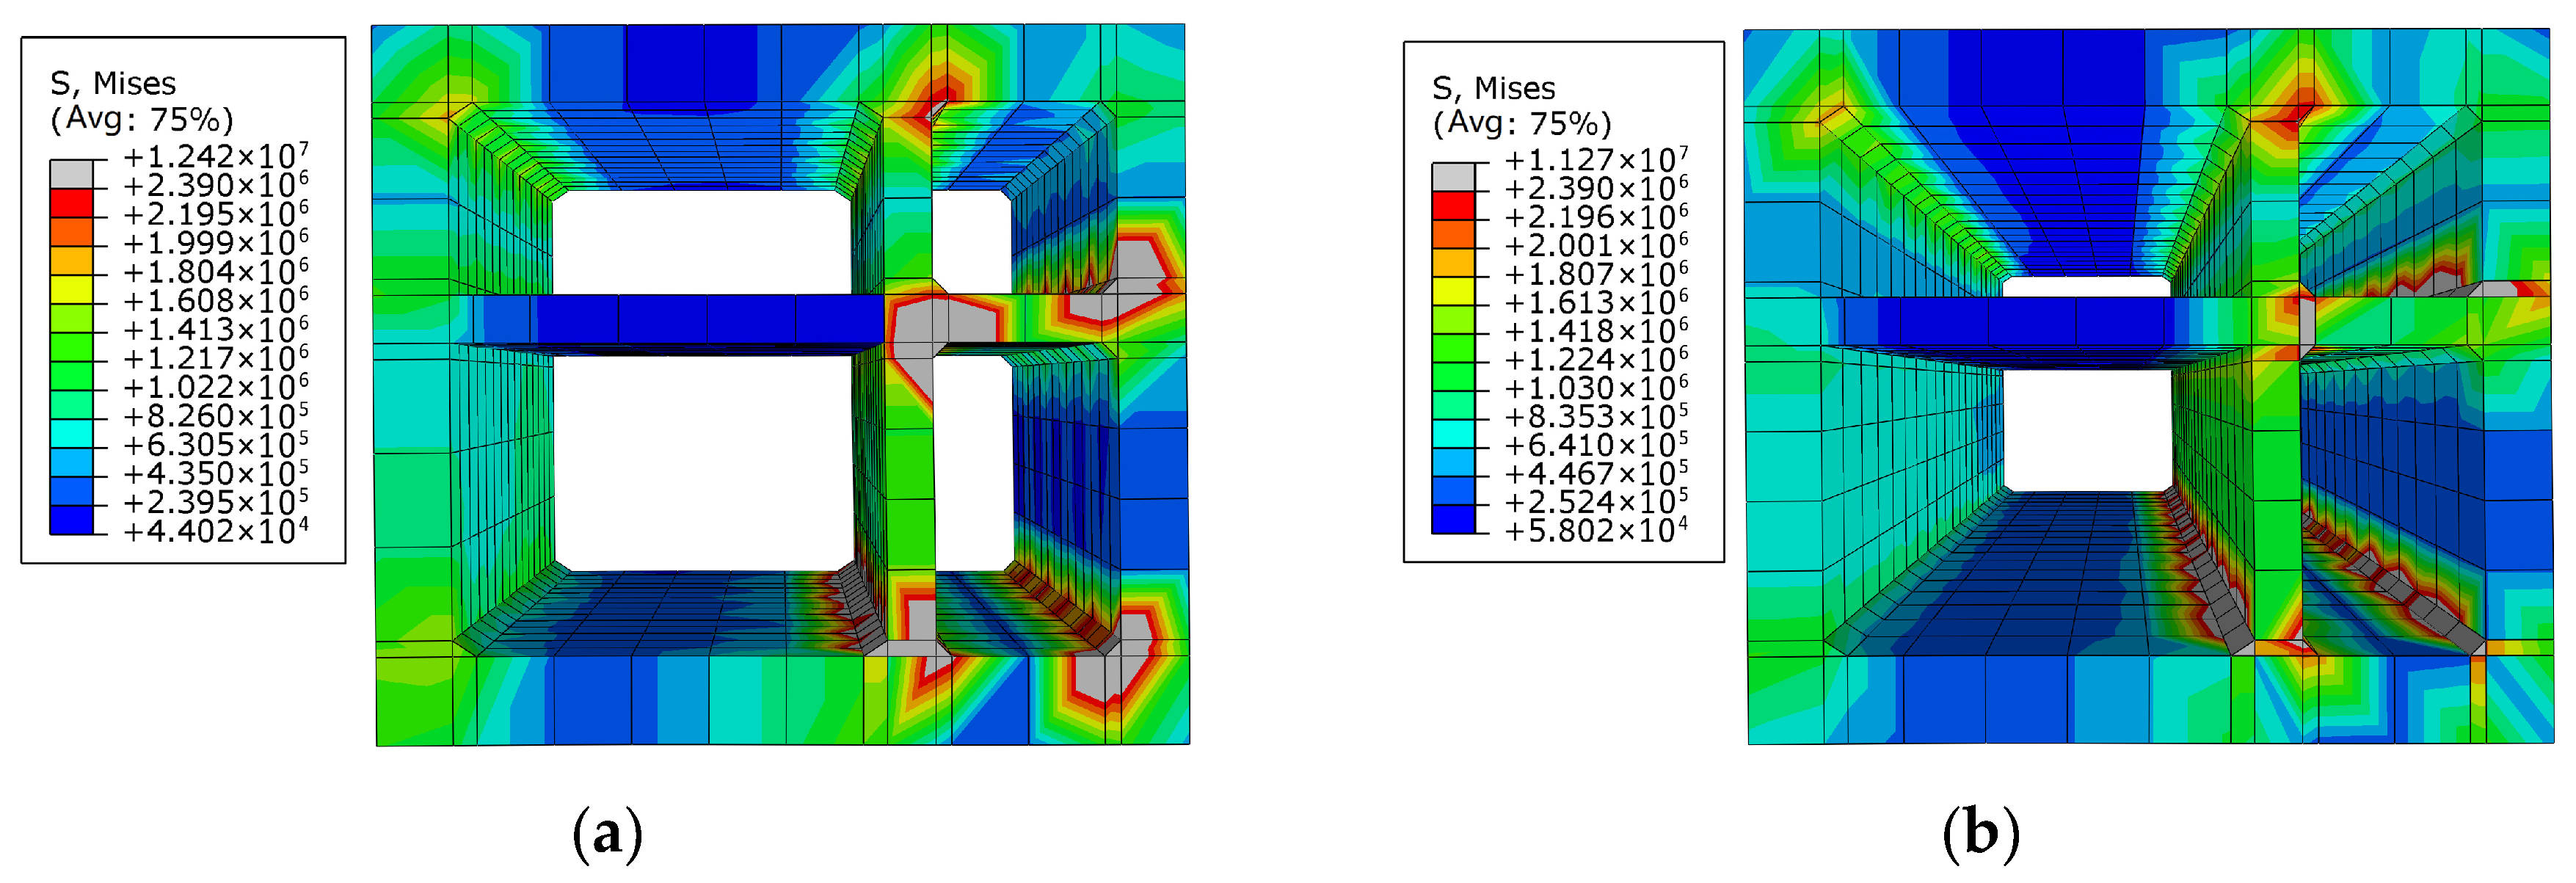
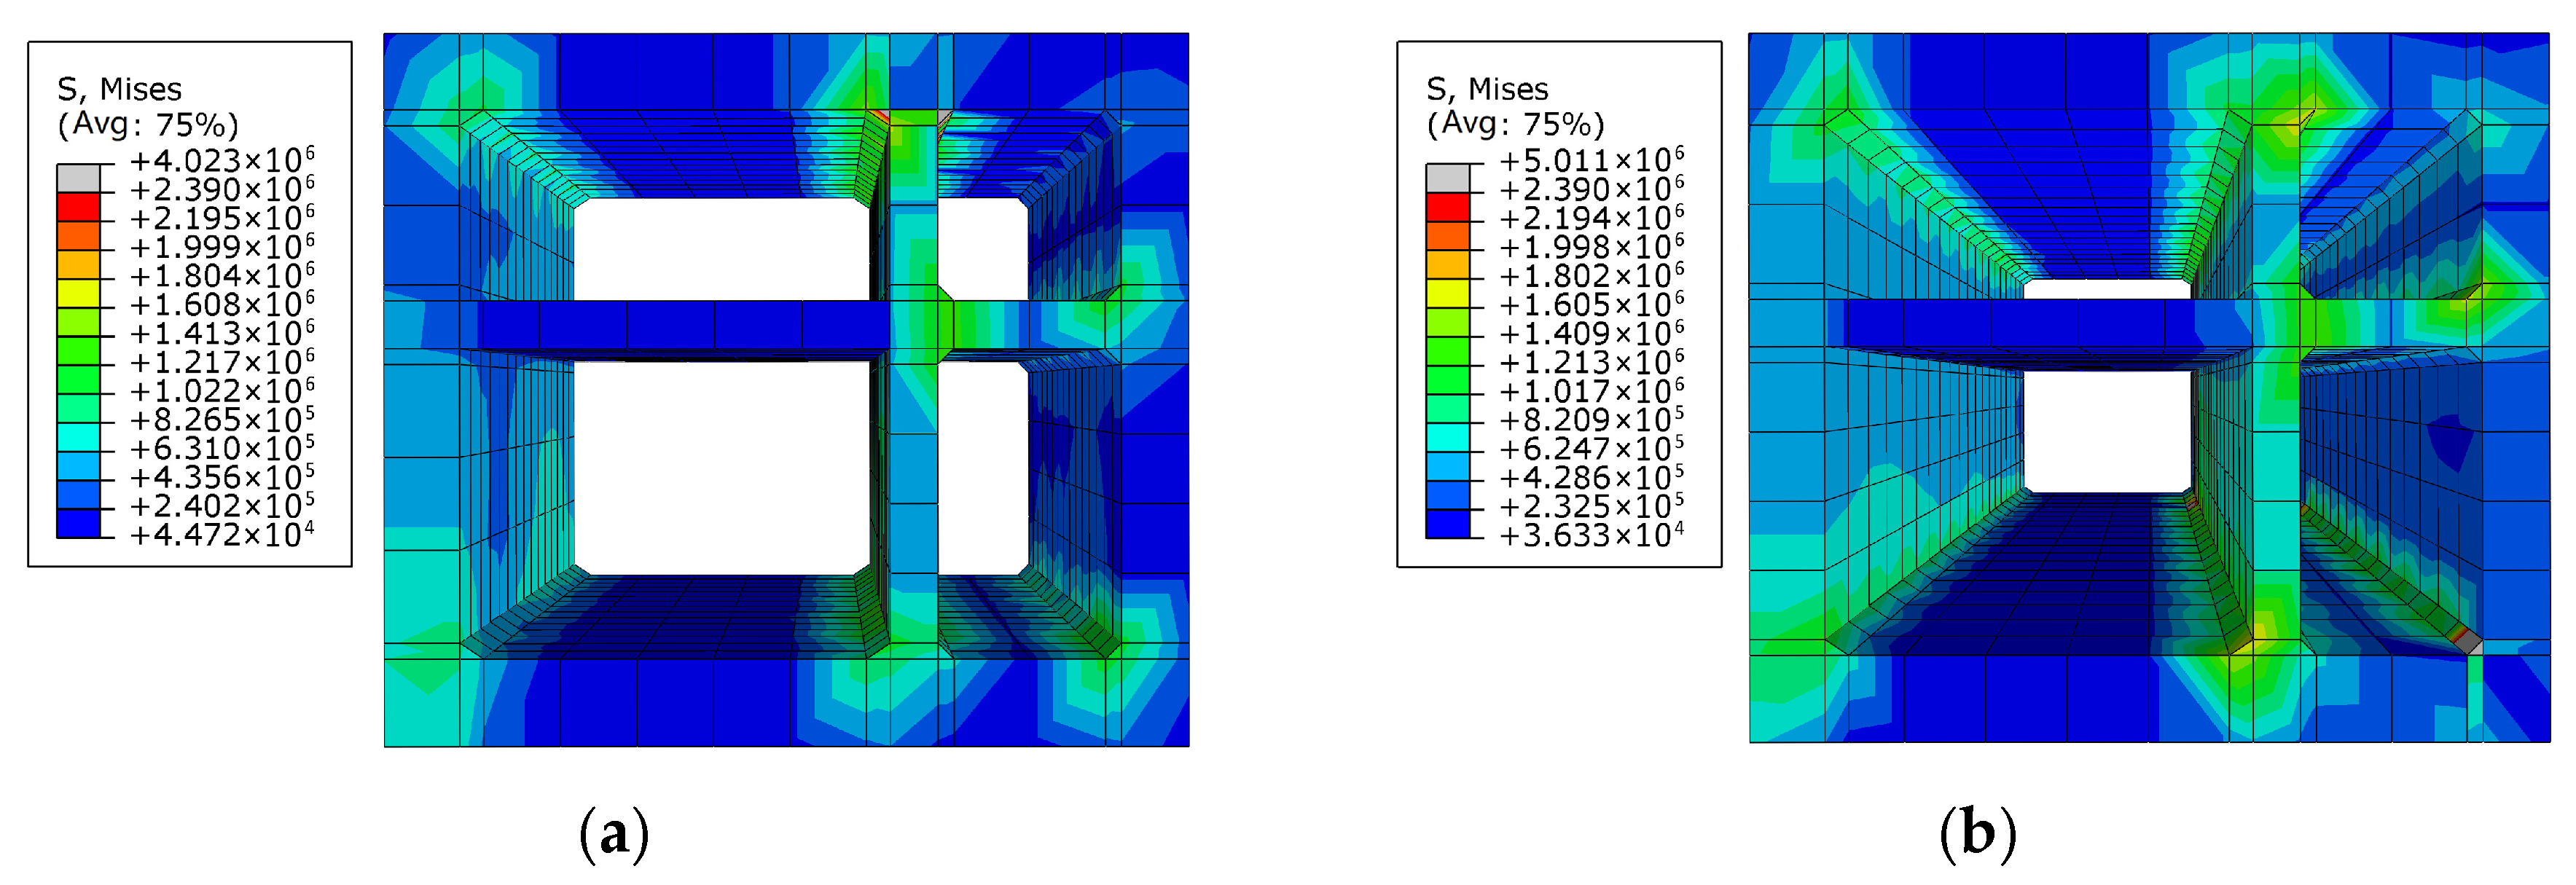
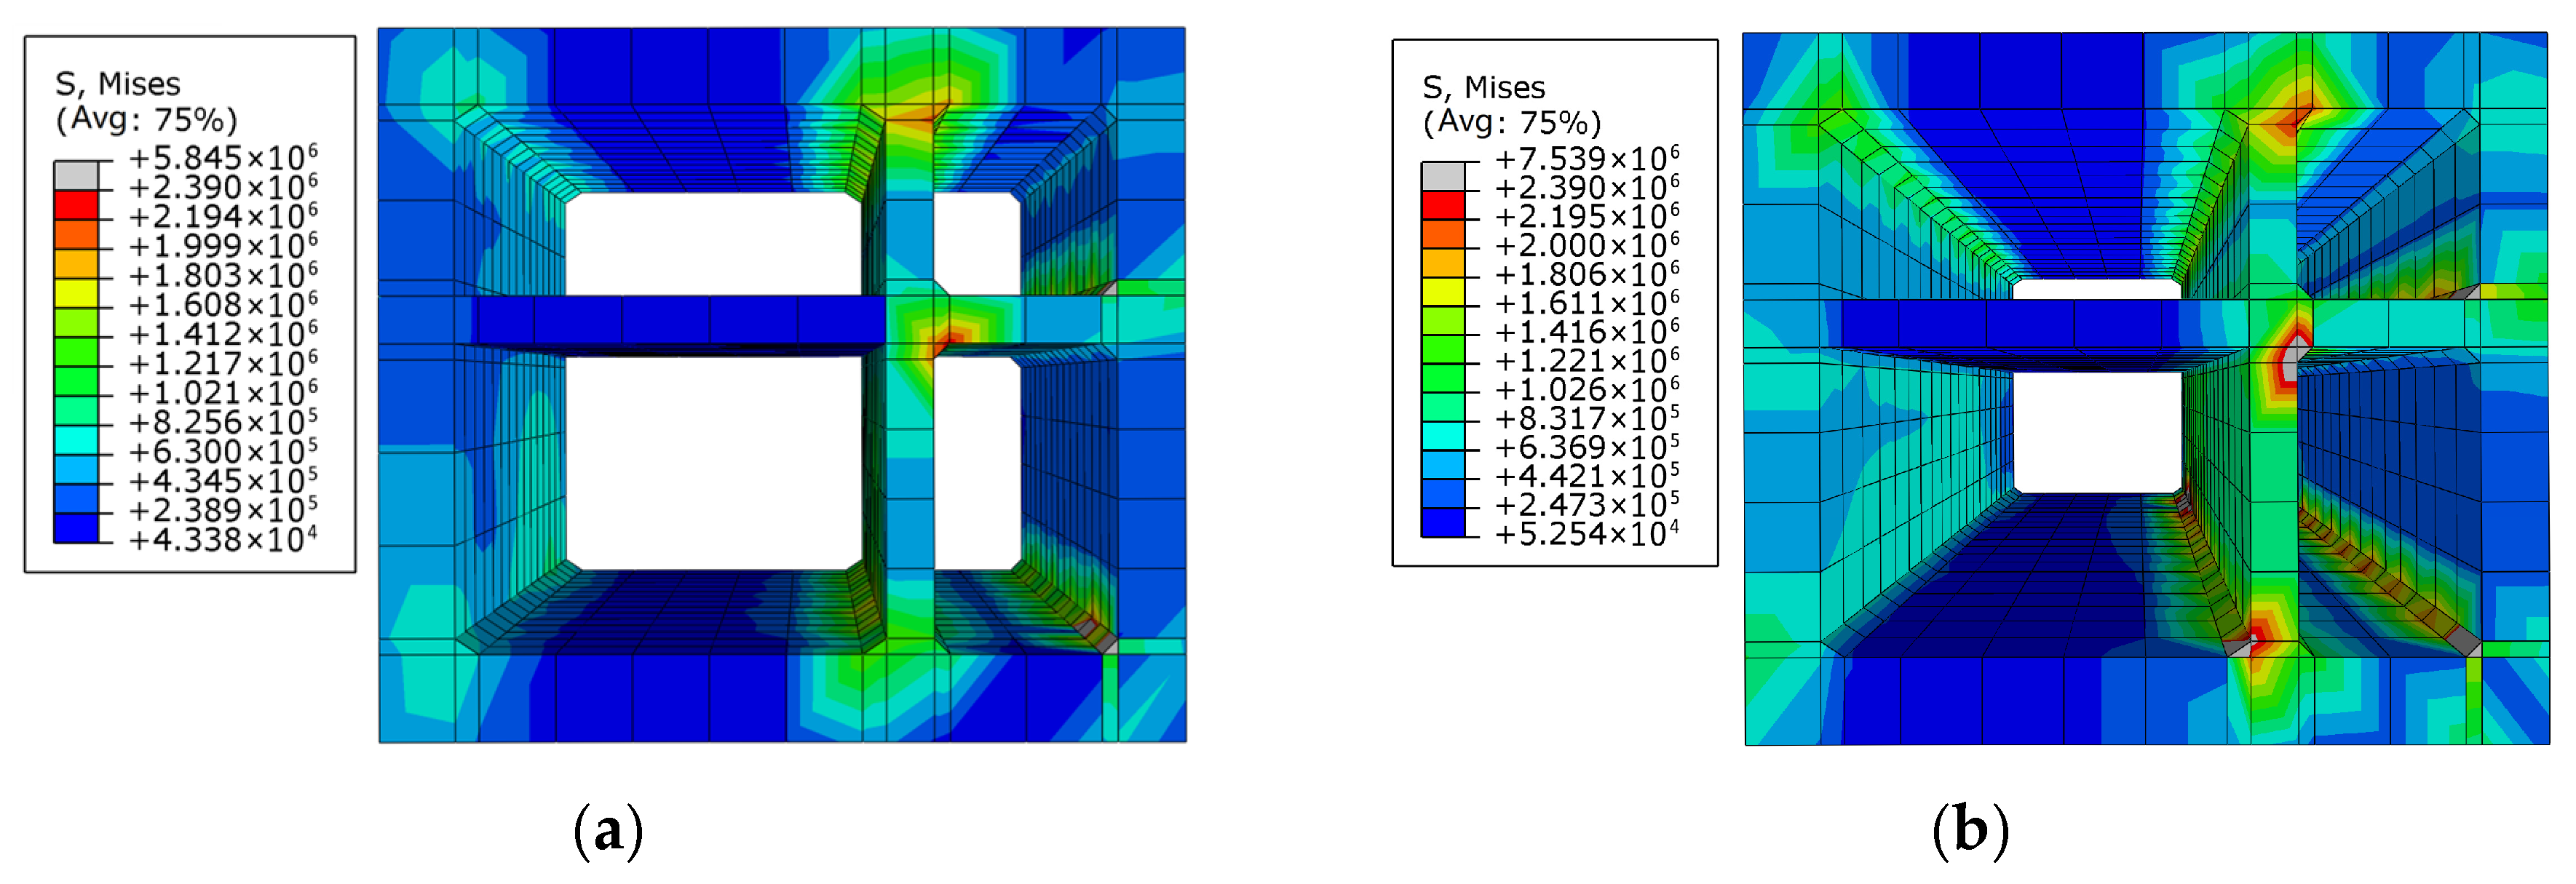
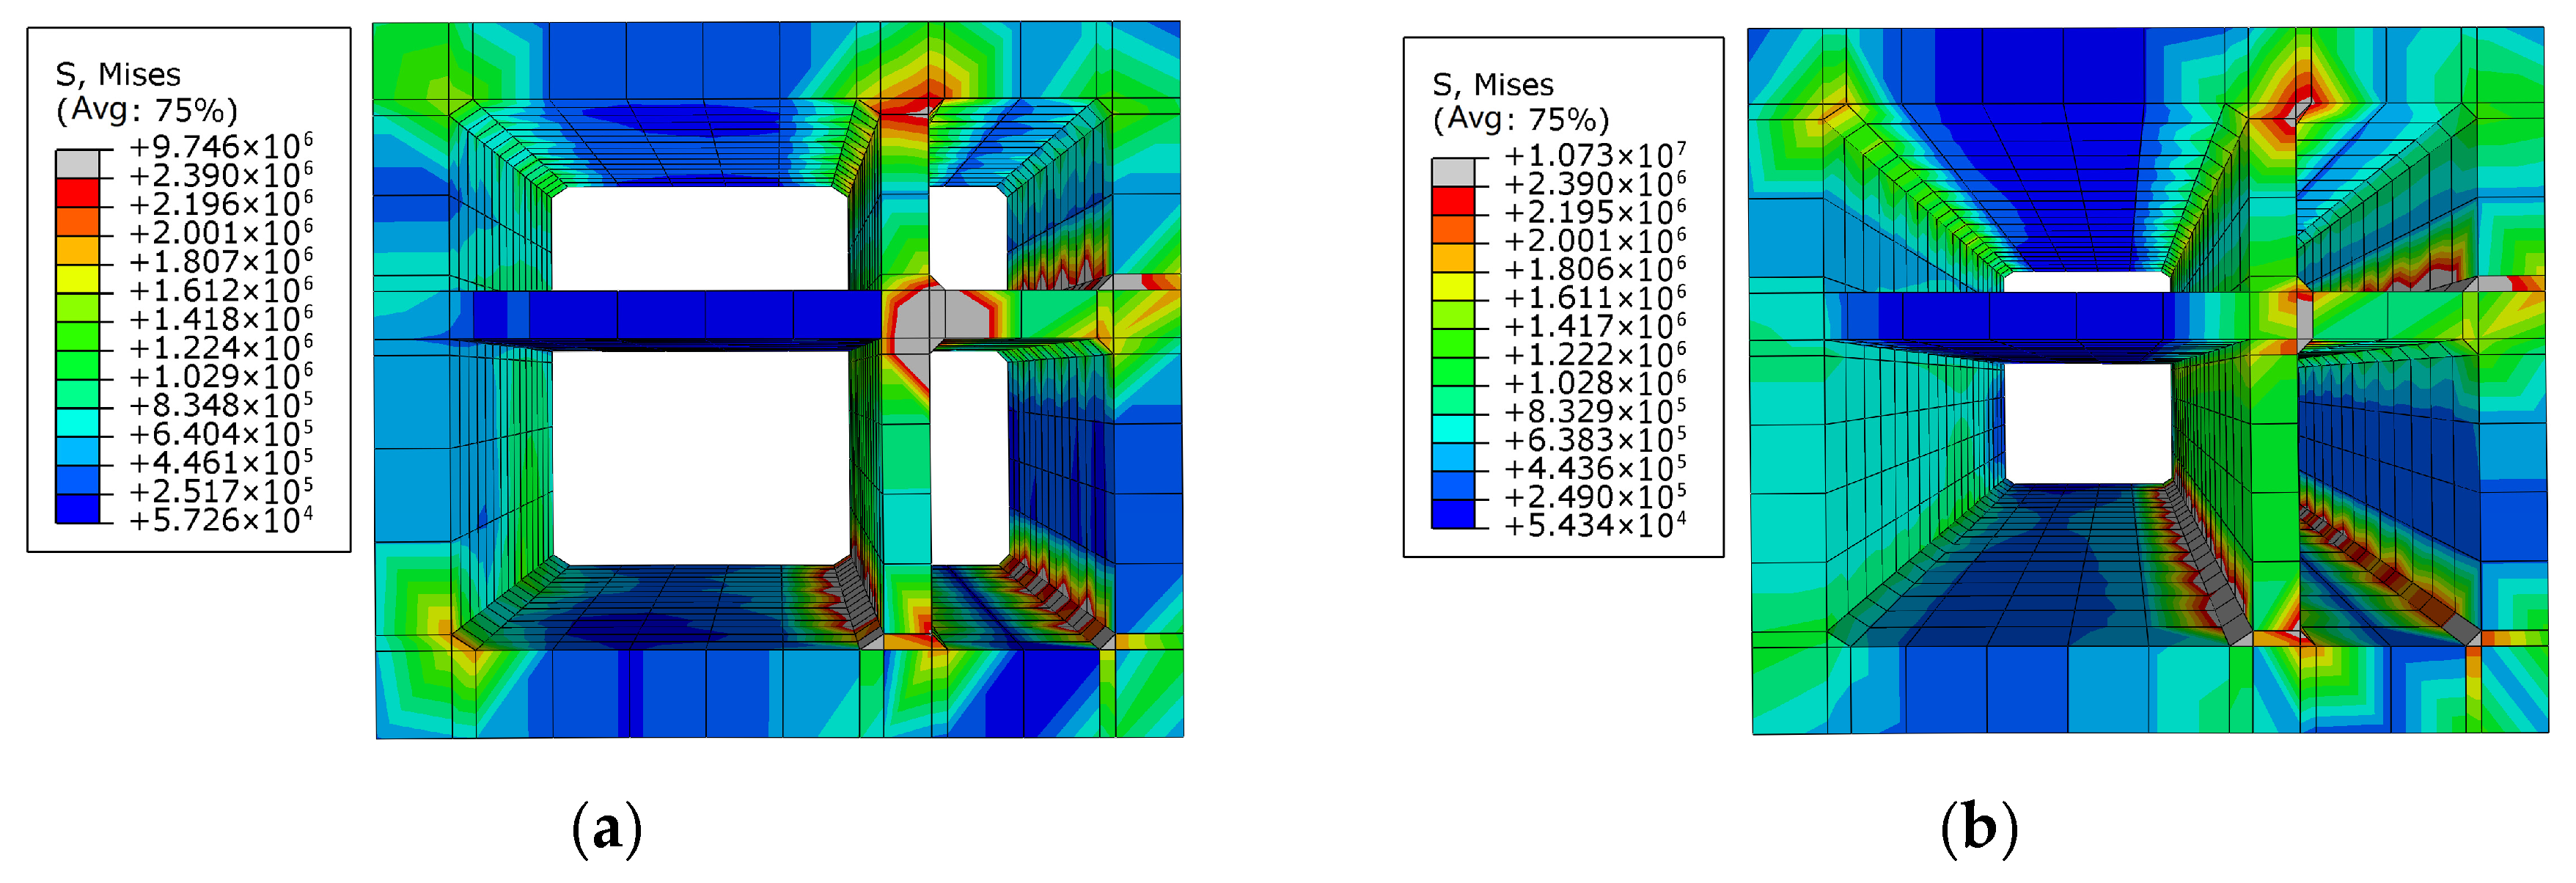
From the tunnel displacement analysis, it can be seen that the shear deformation and lateral displacement difference of the tunnel mainly occurred in the A4 and A5 tunnel sections. Therefore, only these two tunnel sections were selected to analyze the damage. The maximum stress nephogram of the tunnel in the finite element simulation was used to evaluate the failure characteristics and crack propagation of the tunnel under earthquake. The tensile strength standard value of C40 concrete is 2.39 MPa. When the tunnel stress was greater than 2.39 MPa, the concrete in this area will be damaged and cracks will appear.

4.5.1. Concrete Damage of Tunnel Under Orthogonal Conditions

As shown in Figure 27, Figure 28 and Figure 29, under orthogonal conditions, the concrete cracks only appeared at the floor haunches of the tunnel’s right warehouse when the input acceleration was 0.1 g. Under the action of 0.2 g input acceleration, the cracks appeared at the middle of the partition wall in the right warehouse in addition to tunnel floor. Even if the A4 and A5 tunnel sections were subjected 0.1 g or 0.2 g input acceleration, concrete damage only concentrated in a small area, and normal service of the segmented tunnel would not be affected. But when the input acceleration rose to 0.4 g, the concrete cracks extended to the whole tunnel along the longitudinal direction, and almost through the partition wall of the A4 tunnel section. Although the concrete damage of the tunnel’s right warehouse was severe under 0.4 g input acceleration, the overall structure of tunnel was still stable, and the probability of collapse was low.

4.5.2. Concrete Damage of Tunnel Under Oblique Conditions

Figure 30, Figure 31 and Figure 32 show the stress distribution of the tunnel under oblique conditions. Obviously, in this condition, the distribution and development of concrete damage in tunnels subjected to input accelerations were the same as those under orthogonal conditions. Although cracking penetrates the partition wall under rare earthquake conditions, the damaged surface area remains limited—approximately 9.8% and 7.3% of the total structural area in A4 and A5 sections, respectively, indicating localized damage rather than global failure. When the tunnel was subjected to a rare earthquake, the haunches of the right warehouse and the partition wall were seriously damaged, but the stability of the overall structure was not affected.
It can be seen from the above analysis that the segmented utility tunnel has the ability to maintain normal service under frequent earthquakes, and can ensure that the tunnel structure will not collapse under rare earthquakes. The haunches of the tunnel’s right warehouse are prone to damage under the action of earthquakes. Therefore, in the routine use of the tunnel, attention should be paid to the monitoring and maintenance at the haunches of the smaller warehouse, so as to avoid the problem of water seepage at the junction of the tunnel due to concrete damage and crack propagation in these areas.

4.6. Analysis of Steel Bar Stress

The comprehensive force condition of the segmented utility tunnel can be obtained through the stress analysis of steel bars, and the dangerous area of the tunnel can be determined by combining the damage analysis of concrete. Figure 33 and Figure 34 present the stress distribution of the steel bar under orthogonal and oblique conditions, respectively. The results show that under both conditions, the steel bar stress of the haunches at the lower right warehouse is large, and the steel bar yields in these positions under 0.4 g input acceleration. The observed concentration of steel stress at the right haunch is attributed to geometric discontinuity and stiffness transition between the roof and sidewall. Additionally, the smaller cross-sectional area of the right warehouse and the asymmetric layout cause higher deformation concentration under lateral seismic loading. Local interaction with fissured soil further amplifies this stress concentration. Furthermore, the steel bar on the floor of the left warehouse also has great stress value, but the stress of the concrete in this area is low. This phenomenon indicates that the floor of the left warehouse is mainly shown bending under earthquake action. Although there is almost no damage to the concrete of the floor in the left warehouse, if the steel bar yields here, the floor will be destroyed rapidly, which will bring a fatal impact to the tunnel. Therefore, in addition to strengthening the haunches of the smaller warehouse, attention should be paid to improving the strength of the larger warehouse’s floor when designing the segmented utility tunnel.

5. Conclusions

Through finite element simulation, the variation laws of displacement and stress of a segmented utility tunnel under different seismic accelerations are analyzed, and the following conclusions are obtained:
(1)
Under oblique conditions, the peak accelerations of both the soil and tunnel were larger than that under orthogonal conditions, indicating that the oblique angle between the tunnel and the ground fissure will aggravate the influence of seismic action. When the soil is under both orthogonal and oblique conditions, the amplification coefficient will decrease with the increasing of soil depth. Therefore, under the action of an earthquake, the shallower the buried depth, the more dangerous the underground structure is.
(2)
The maximum differential displacement between tunnel sections (e.g., A4–A5) under oblique seismic input was found to exceed 20 mm under 0.4 g acceleration. Based on these results, it is suggested that an allowable differential displacement threshold is 15 mm for segmented utility tunnels crossing active fissures under rare earthquakes, considering structural integrity and waterproofing constraints.
(3)
The acceleration–time curves of the segmented utility tunnel under uniform seismic excitation at the same height basically coincide, while the curves of the tunnel roof and floor have obvious differences, and the peak acceleration of the tunnel roof is larger than that of the floor.
(4)
The segmented utility tunnel is more prone to damage when the tunnel crosses the ground fissure obliquely. Both the lateral displacement difference between the tunnel sections and the tunnel shear angle were greater than those under orthogonal conditions when the tunnel crosses the ground fissure obliquely. In addition, it is recommended that the shear angle limit should be calculated separately in different conditions when the utility tunnel is subjected to frequent earthquakes, and the shear angel limit can select the same value under the action of rare earthquake. The maximum shear angle observed was approximately 1/116 under 0.4 g. For frequent earthquakes, the shear angle of 1/200 may serve as a preliminary limit to prevent joint damage.
(5)
Concrete damage of the tunnel mainly appeared at the haunches of the right warehouse (which is smaller than the left warehouse), and there is also a great probability of steel bar yielding in these areas. However, in addition to the haunches of the smaller warehouse, the steel bar at the floor of the larger warehouse is also subjected to high stress. Therefore, attention should be paid to the strength design of the above positions. Stress concentration consistently occurred in the right warehouse haunch and the floor of the left warehouse. Therefore, a minimum longitudinal reinforcement ratio in those critical regions is 1.0%, which is above the general code requirement for seismic zones (0.6%).
(6)
Under the most severe seismic conditions (0.4 g oblique), the maximum lateral displacement difference between tunnel sections reached 24.4 mm, and the maximum shear angle was 1/116. The peak stress in concrete reached 5.8 MPa, exceeding the C40 tensile limit, and the steel stress peaked at 375 MPa near the right haunch, indicating local yielding. These values support the need for targeted reinforcement in high-risk zones such as tunnel joints and sidewall haunches.
The segmented utility tunnel has good ability of cooperative deformation. Under the action of frequent earthquakes, the segmented utility tunnel can maintain normal service, and the serious damage which will affect the integrity of the structure cannot occur even if the tunnel is subjected to a rare earthquake.

Author Contributions

Conceptualization, Y.N., Z.F. and H.H.; methodology, all authors; simulation, X.L. and Y.N.; data curation, M.G. and Z.F.; formal analysis, Y.N. and X.L.; investigation, M.G., Z.F. and J.Z.; validation, Y.N. and M.G.; writing—original draft, Y.N.; writing—review and editing, all authors; visualization, Y.N. and X.L. All authors have read and agreed to the published version of the manuscript.

Funding

This research was funded by the National Natural Science Foundation of China (No: 51778060), the Natural Science Foundation of Shaanxi Province (No: 2020KW-067), and the Fundamental Research Funds for the Central Universities, CHD (No: 300102280711, 300102280713 and 300203211281).

Institutional Review Board Statement

Not applicable.

Informed Consent Statement

Not applicable.

Data Availability Statement

The original contributions presented in the study are included in the article. Further inquiries can be directed to the corresponding authors.

Conflicts of Interest

The authors declare no conflicts of interest.

References

  1. Canto-Perello, J.; Curiel-Esparza, J. An analysis of utility tunnel viability in urban areas. Civ. Eng. Environ. Syst. 2006, 23, 11–19. [Google Scholar] [CrossRef]
  2. Hu, Y.; Li, Z.; He, J.; Huang, Z. Experimental study on seismic performance of prefabricated joints of underground utility tunnel. IOP Conf. Ser. Earth Environ. Sci. 2019, 267, 042109. [Google Scholar] [CrossRef]
  3. Jiang, L. State-of-the-art of seismic response of utility tunnel. Appl. Mech. Mater. 2013, 353–356, 2202–2205. [Google Scholar] [CrossRef]
  4. Datta, T.K.; Mashaly, E.A. Seismic response of buried submarine pipelines. J. Energy Resour. Technol. 1988, 110, 208–218. [Google Scholar] [CrossRef]
  5. Sharma, S.; Judd, W.R. Underground opening damage from earthquakes. Eng. Geol. 1991, 30, 263–276. [Google Scholar] [CrossRef]
  6. Yan, K.M.; Zhang, J.J.; Wang, Z.J.; Liao, W.M.; Wu, Z.J. Seismic response of deep buried pipeline under non-uniform excitations from large scale shaking table test. Soil Dyn. Earthq. Eng. 2018, 113, 180–192. [Google Scholar] [CrossRef]
  7. Wijewickreme, D.; Karimian, H.; Honegger, D. Response of buried steel pipelines subjected to relative axial soil movement. Can. Geotech. J. 2009, 46, 735–752. [Google Scholar] [CrossRef]
  8. Peng, J.B.; Chen, L.W.; Huang, Q.B.; Men, Y.M.; Fan, W.; Yan, J.K. Physical simulation of ground fissures triggered by underground fault activity. Eng. Geol. 2013, 155, 19–30. [Google Scholar] [CrossRef]
  9. Zhang, D.; Hu, Z.P.; Lu, G.G.; Wang, R.; Ren, X. Calculation of the vertical strata load of utility tunnel crossing ground fissure zone. Shock Vib. 2020, 2020, 8877016. [Google Scholar] [CrossRef]
  10. Yan, Y.; Qiu, J.; Huang, Q.; Wang, Z.; Xie, Y.; Liu, T. Ground fissure geology in Xi’an and failure mitigation measures for utility tunnel system due to geohazard. Arab. J. Geosci. 2021, 14, 1243. [Google Scholar] [CrossRef]
  11. Hashash, Y.M.A.; Hook, J.J.; Schmidt, B.; Yao, J.I.C. Seismic design and analysis of underground structures. Tunn. Undergr. Space Technol. 2001, 16, 247–293. [Google Scholar] [CrossRef]
  12. Yu, H.; Zhang, Z.; Chen, J.; Bobet, A.; Zhao, M.; Yuan, Y. Analytical solution for longitudinal seismic response of tunnels liners with sharp stiffness transition. Tunn. Undergr. Space Technol. 2018, 77, 103–114. [Google Scholar] [CrossRef]
  13. Yu, H.; Cai, C.; Bobet, A.; Zhao, X.; Yuan, Y. Analytical solution for longitudinal bending stiffness of shield tunnels. Tunn. Undergr. Space Technol. 2019, 83, 27–34. [Google Scholar] [CrossRef]
  14. Chen, J.; Shi, X.; Li, J. Shaking table test of utility tunnel under non-uniform earthquake wave excitation. Soil Dyn. Earthq. Eng. 2010, 30, 1400–1416. [Google Scholar] [CrossRef]
  15. Wang, Z.Z.; Jiang, Y.J.; Zhu, C.A.; Sun, T.C. Shaking table tests of tunnel linings in progressive states of damage. Tunn. Undergr. Space Technol. 2015, 50, 109–117. [Google Scholar] [CrossRef]
  16. Yu, H.; Yan, X.; Bobet, A.; Yuan, Y.; Xu, G.; Su, Q. Multi-point shaking table test of a long tunnel subjected to non-uniform seismic loadings. Bull. Earthq. Eng. 2017, 16, 1041–1059. [Google Scholar] [CrossRef]
  17. Darli, C.M.; Tang, A.; Huang, D.; Zhang, J. Large scale shaking table model test and analysis on seismic response of utility tunnel in non-homogeneous soil. Earthq. Eng. Eng. Vib. 2021, 20, 505–515. [Google Scholar] [CrossRef]
  18. Jiang, L.; Chen, J.; Li, J. Seismic response of underground utility tunnels: Shaking table testing and FEM analysis. Earthq. Eng. Eng. Vib. 2010, 9, 555–567. [Google Scholar] [CrossRef]
  19. Cilingir, U.; Madabhushi, S.P.G. Effect of depth on the seismic response of square tunnels. Soils Found. 2011, 51, 449–457. [Google Scholar] [CrossRef]
  20. Baziar, M.H.; Moghadam, M.R.; Kim, D.S.; Choo, Y.W. Effect of underground tunnel on the ground surface acceleration. Tunn. Undergr. Space Technol. 2014, 44, 10–22. [Google Scholar] [CrossRef]
  21. Tsinidis, G.; Pitilakis, K.; Madabhushi, G.; Heron, C. Dynamic response of flexible square tunnels: Centrifuge testing and validation of existing design methodologies. Géotechnique 2015, 65, 401–417. [Google Scholar] [CrossRef]
  22. Tsinidis, G.; Pitilakis, K.; Madabhushi, G. On the dynamic response of square tunnels in sand. Eng. Struct. 2016, 125, 419–437. [Google Scholar] [CrossRef]
  23. Duan, X.; Dong, Q.; Ye, W. Experimental study on seismic performance of prefabricated utility tunnel. Adv. Civ. Eng. 2019, 2019, 8968260. [Google Scholar] [CrossRef]
  24. Zhang, J.; Yuan, Y.; Yu, H. Shaking table tests on discrepant response of shaft-tunnel junction in soil under transverse excitations. Soil Dyn. Earthq. Eng. 2019, 120, 345–359. [Google Scholar] [CrossRef]
  25. Ding, X.; Feng, L.; Wang, C.; Chen, Z.; Han, L. Shaking table testing of the seismic response of a utility tunnel with a joint connection. Soil Dyn. Earthq. Eng. 2020, 133, 106133. [Google Scholar] [CrossRef]
  26. Li, D.; Liang, J.; Dong, B.; Ba, Z. A multi-scale model for longitudinal seismic design of prefabricated utility tunnel based on multi-point constraints. Structures 2024, 62, 106176. [Google Scholar] [CrossRef]
  27. Huang, Z.; Feng, Y.; Tang, A.; Liu, Q. Influence of oblique incidence of p-waves on seismic response of prefabricated utility tunnels considering joints. Soil Dyn. Earthq. Eng. 2023, 167, 107797. [Google Scholar] [CrossRef]
  28. Li, D.; Liang, J.; Gan, M.; Zhao, H. A shell-spring model for longitudinal seismic design of underground cross utility tunnels. Eng. Mech. 2025, 42, 144–155. [Google Scholar] [CrossRef]
  29. Liang, J.; Zhou, Y.; Li, D.; Zhao, H. Longitudinal seismic analysis of underground cross precast utility tunnels. J. Earthq. Eng. Eng. Vib. 2023, 43, 182–189. [Google Scholar]
  30. Li, J.; Zhong, Z.; Han, C.; Li, G.; Shen, J. Seismic performance assessment of underground utility tunnel and internal pipeline considering effects of tunnel joints. Jpn. Geotech. Soc. Spec. Publ. 2024, 10, 710–714. [Google Scholar] [CrossRef]
  31. Qu, J. Dynamic Response of Utility Tunnel under the Effect of Oblique Incidence of Ground Motions. Master’s Thesis, Harbin Institute of Technology, Harbin, China, 2017. [Google Scholar]
  32. DBJ61-6-2006; Xi’an Ground Fissure Site Investigation and Engineering Design Specification. Shanxi Provincial Construction Press: Xi’an, China, 2006.
  33. GB 50010-2010; Code for Design of Concrete Structures. China Architecture and Building Press: Beijing, China, 2010.
  34. Zhu, L. Study on the Harm of Ground Fissures on Integrated Pipe Gallery in Loess Area. Master’s Thesis, Xi’an University of Technology, Xi’an, China, 2018. [Google Scholar]
  35. Xiong, Z.; Chen, X.; Gao, P.; Wei, J.; Huang, Y. Study on simulation of dynamic response of the structure crossing ground fissure in high-intensity of earthquake. J. Xi’an Univ. Archit. Technol. 2016, 48, 783–789. [Google Scholar] [CrossRef]
  36. Xiong, Z.; Zhang, C.; Huo, X. Shaking table tests on acceleration response of ground fissure site. Chin. J. Geotech. Eng. 2018, 40, 520–526. [Google Scholar] [CrossRef]
  37. Huang, Q.; Peng, J.; Fan, W. Metro tunnel hazards induced by active ground fissures in Xi’an and relevant control measures. Chin. J. Geotech. Eng. 2009, 31, 781–788. [Google Scholar] [CrossRef]
  38. Huang, H.; Qian, H.; Wu, C. Setback distance for seismic fortification and avoidance of structures in ground fissure sites. China Earthq. Eng. J. 2018, 40, 536–545. [Google Scholar] [CrossRef]
  39. Gu, Y.; Liu, J.; Du, Y. 3D consistent viscous-spring artificial boundary and viscous-spring boundary element. Eng. Mech. 2007, 24, 31–37. [Google Scholar] [CrossRef]
  40. Meng, H.; Chen, J.; Li, J. Shaking table test of soil-pipe dynamic interaction under non-uniform earthquake wave excitation. Chin. J. Undergr. Space Eng. 2008, 4, 852–859. [Google Scholar] [CrossRef]
  41. GB 50223-2008; Standard for Classification of Seismic Protection of Building Constructions. China Architecture & Building Press: Beijing, China, 2008.
  42. Li, K. Study on the Soil-Metro Tunnels Interactions in Ground Fissures Area. Ph.D. Thesis, Chang’an University, Xi’an, China, 2012. [Google Scholar]
  43. Huang, Q.; Peng, J.; Deng, Y. Design parameters of Xi’an metro line 2 tunnel passing through active ground fissure zones. Rock Soil Mech. 2010, 31, 2882–2888. [Google Scholar] [CrossRef]
  44. GB50011-2010; Seismic Design Code of Building. China Construction Industry Press: Beijing, China, 2016.
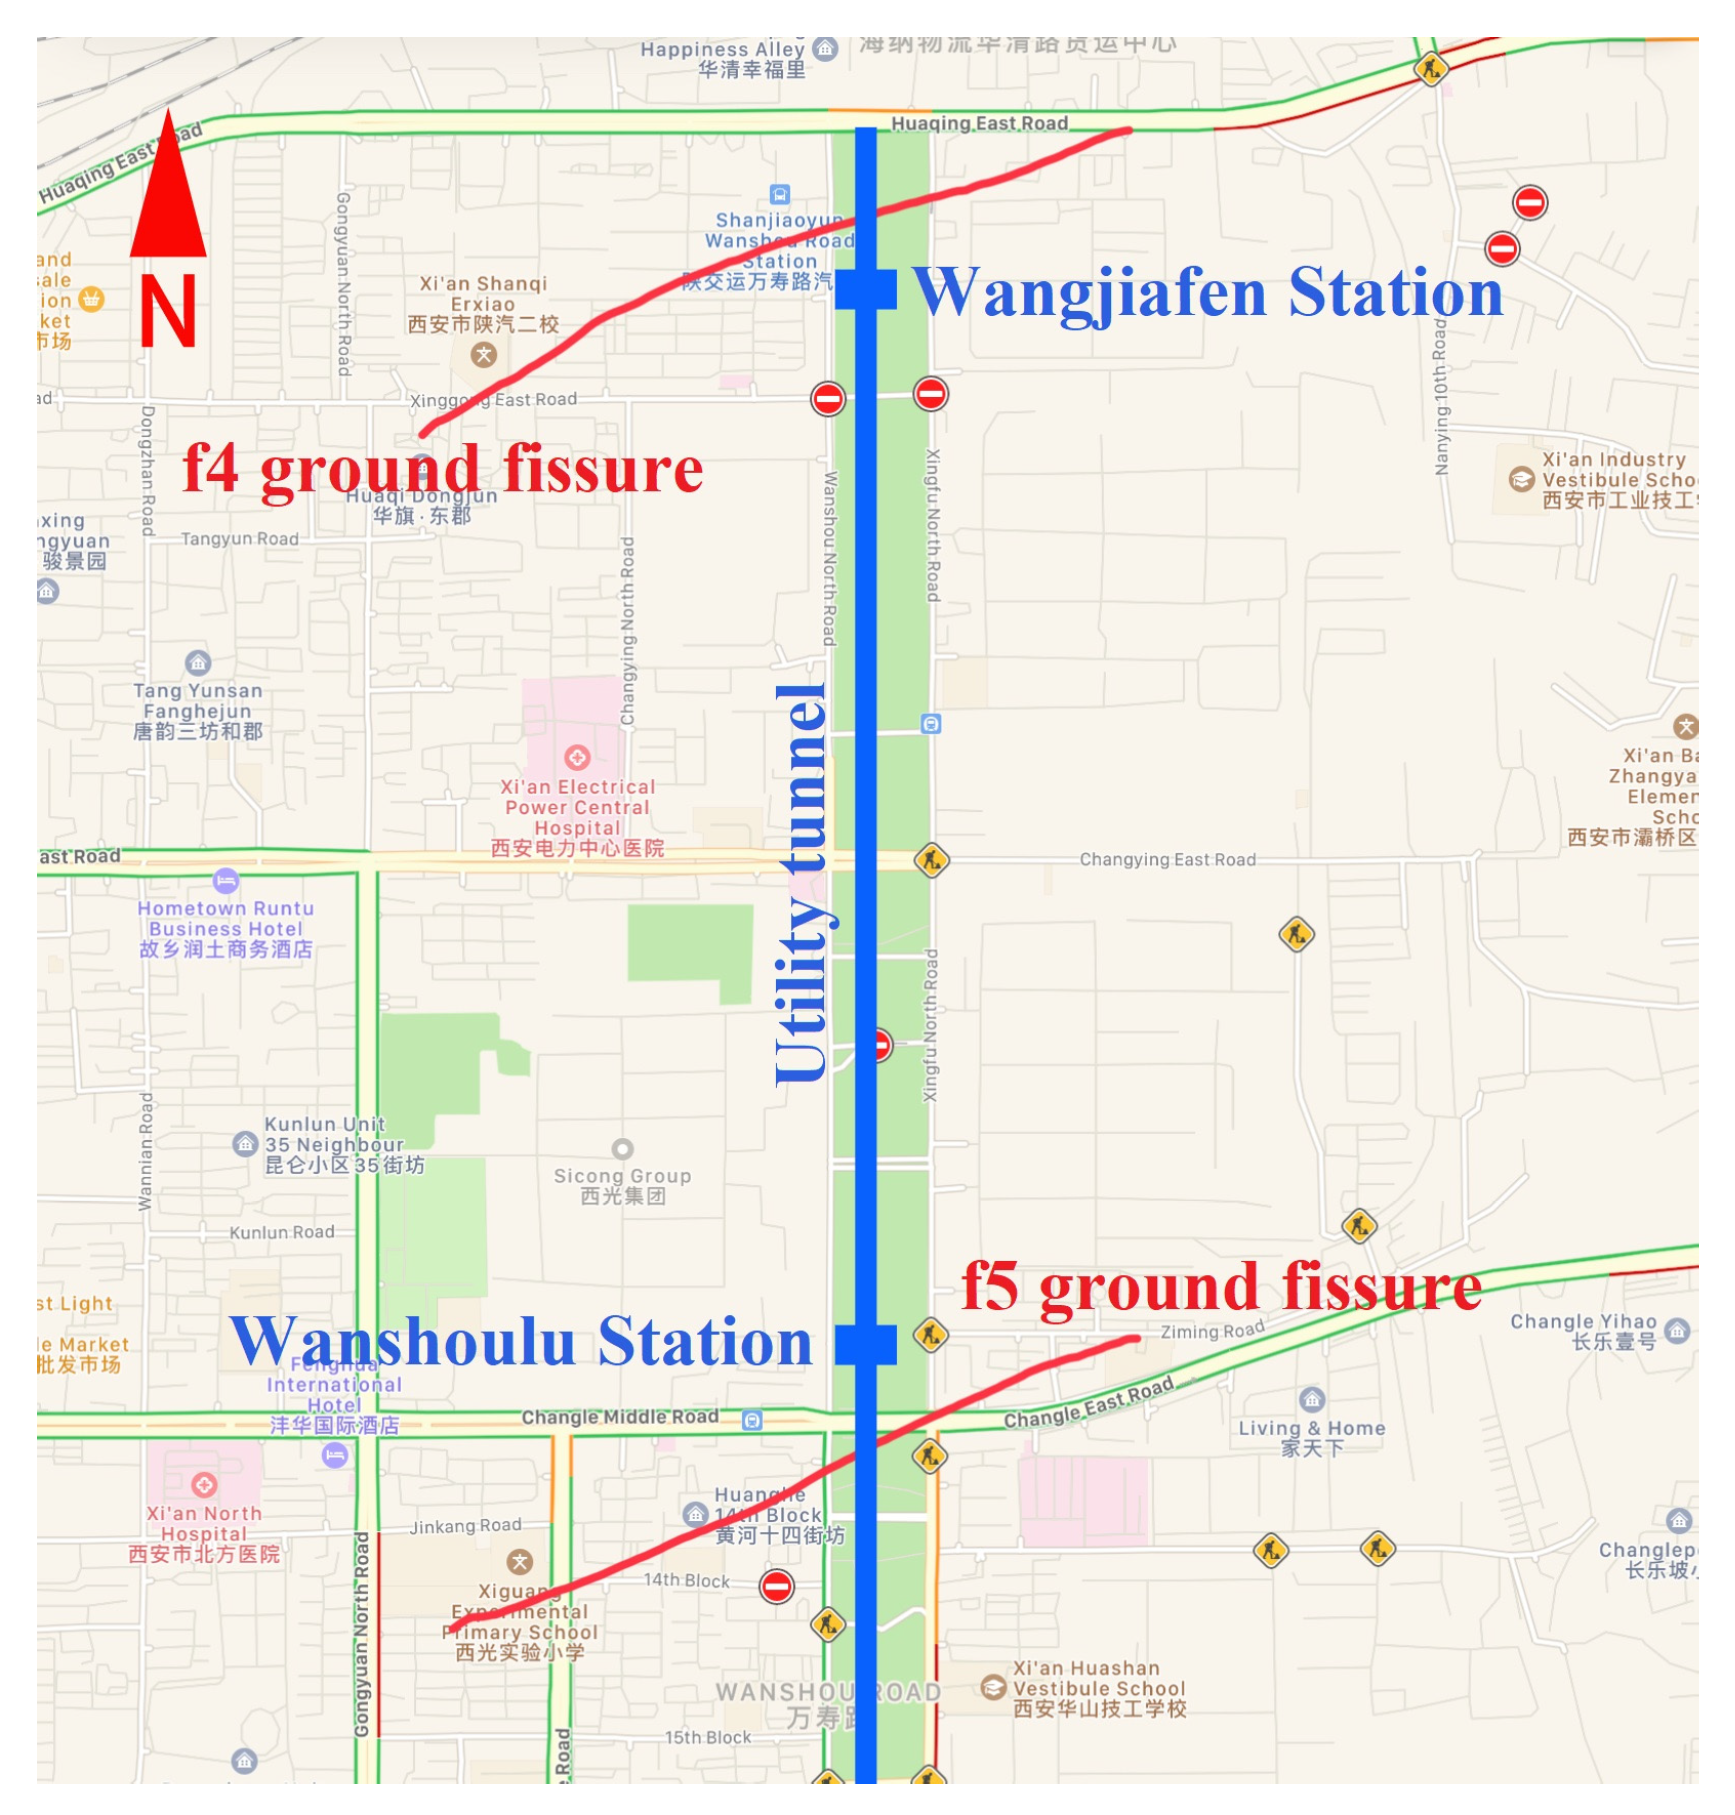
Figure 1. Site location.
Applsci 15 08845 g001
Figure 2. Schematic diagram of tunnel: (a) vertical view; and (b) sectional view (Note: The data unit in the figure is mm).
Applsci 15 08845 g002
Figure 3. Value range of soil boundary conditions.
Applsci 15 08845 g003
Figure 4. Overall models: (a) orthogonal condition; and (b) oblique condition.
Applsci 15 08845 g004
Figure 5. Tunnel numbering schematic (Note: The data unit in the figure is mm).
Applsci 15 08845 g005
Figure 6. Measure point layout of the soil.
Applsci 15 08845 g006
Figure 7. Sectional structure and measure point layout of the tunnel (Note: The data unit in the figure is mm).
Applsci 15 08845 g007
Figure 8. Relationship curves between stress and strain, damage factor, and strain of concrete: (a) compression; and (b) tension.
Applsci 15 08845 g008
Figure 9. Stress–strain relationship of steel bar.
Applsci 15 08845 g009
Figure 10. Viscoelastic artificial boundary.
Applsci 15 08845 g010
Figure 11. El-Centro seismic wave.
Applsci 15 08845 g011
Figure 12. Comparison curve of the relative displacement between tunnel bottom and underlying soil.
Applsci 15 08845 g012
Figure 13. Peak acceleration of soil: (a) orthogonal condition; and (b) oblique condition.
Applsci 15 08845 g013
Figure 14. Soil peak acceleration at B0/C0 with different depths: (a) orthogonal condition; and (b) oblique condition.
Applsci 15 08845 g014
Figure 15. Soil acceleration amplification coefficient under orthogonal condition: (a) hanging wall; and (b) foot wall.
Applsci 15 08845 g015
Figure 16. Soil acceleration amplification coefficient under oblique condition: (a) hanging wall; and (b) foot wall.
Applsci 15 08845 g016
Figure 17. Acceleration–time curve of tunnel at the same height.
Applsci 15 08845 g017
Figure 18. Acceleration–time curve of tunnel at different heights.
Applsci 15 08845 g018
Figure 19. Acceleration–time curves of A4GL2 and A4GL4 under orthogonal condition: (a) 0.1 g; (b) 0.2 g; and (c) 0.4 g.
Applsci 15 08845 g019
Figure 20. Acceleration–time curves of A4GL1 and A4GL3 under orthogonal condition: (a) 0.1 g; (b) 0.2 g; and (c) 0.4 g.
Applsci 15 08845 g020
Figure 21. Peak accelerations of A4GL1, A4GL2, and A4GL3 under orthogonal condition: (a) 0.1 g; (b) 0.2 g; and (c) 0.4 g.
Applsci 15 08845 g021
Figure 22. Acceleration–time curves of A4GL2 and A4GL4 under oblique condition: (a) 0.1 g; (b) 0.2 g; and (c) 0.4 g.
Applsci 15 08845 g022
Figure 23. Acceleration–time curves of A4GL1 and A4GL3 under oblique condition: (a) 0.1 g; (b) 0.2 g; and (c) 0.4 g.
Applsci 15 08845 g023
Figure 24. Peak accelerations of A4GL1, A4GL2, and A4GL3 under oblique condition: (a) 0.1 g; (b) 0.2 g; and (c) 0.4 g.
Applsci 15 08845 g024
Figure 25. Lateral displacement of tunnel under orthogonal condition: (a) 0.1 g; (b) 0.2 g; and (c) 0.4 g.
Applsci 15 08845 g025
Figure 26. Lateral displacement of tunnel under oblique conditions: (a) 0.1 g; (b) 0.2 g; and (c) 0.4 g.
Applsci 15 08845 g026
Figure 27. Stress nephogram of tunnel under 0.1 g input acceleration (orthogonal condition): (a) A4 tunnel section; and (b) A5 tunnel section.
Applsci 15 08845 g027
Figure 28. Stress nephogram of tunnel under 0.2 g input acceleration (orthogonal condition): (a) A4 tunnel section; and (b) A5 tunnel section.
Applsci 15 08845 g028
Figure 29. Stress nephogram of tunnel under 0.4 g input acceleration (orthogonal condition): (a) A4 tunnel section; and (b) A5 tunnel section.
Applsci 15 08845 g029
Figure 30. Stress nephogram of tunnel under 0.1 g input acceleration (oblique condition): (a) A4 tunnel section; and (b) A5 tunnel section.
Applsci 15 08845 g030
Figure 31. Stress nephogram of tunnel under 0.2 g input acceleration (oblique condition): (a) A4 tunnel section; and (b) A5 tunnel section.
Applsci 15 08845 g031
Figure 32. Stress nephogram of tunnel under 0.4 g input acceleration (oblique condition): (a) A4 tunnel section; and (b) A5 tunnel section.
Applsci 15 08845 g032
Figure 33. Nephogram of steel bar stress under orthogonal conditions: (a) 0.1 g; (b) 0.2 g; and (c) 0.4 g.
Applsci 15 08845 g033
Figure 34. Nephogram of steel bar stress under oblique conditions: (a) 0.1 g; (b) 0.2 g; and (c) 0.4 g.
Applsci 15 08845 g034
Table 1. Distribution of soil layers at ground fissure site (Note: ‘N/A’ indicates no staggered displacement between the hanging wall and foot wall for this layer).
Soil LayerSoil Depth
(m)
Soil Thickness
(m)
Staggered Distance Between Hanging Wall and Foot Wall
(m)
Foot WallHanging WallFoot WallHanging Wall
Q 4 ml 33330
Q 3 eol 1010.577.50.5
Q 3 el 13.714.93.74.40.7
Q 2 eol 22.624.18.99.20.3
Q 2 el 26.628.744.60.6
Q 2 al + 1 404013.411.3N/A
Table 2. Mechanical parameters of soil layers.
Soil LayerDensity
(kg·m−3)
Shear Modulus
(MPa)
Poisson’s RatioInternal Friction Angle
(°)
Dilation Angle
(°)
Cohesion
(MPa)
S-Wave Velocity
(m·s−1)
P-Wave Velocity
(m·s−1)
Q 4 ml 175535.800.3421.29.20.0256142.84290.07
Q 3 eol 1630305.810.2938.79.30.0371433.14901.46
Q 3 el 1710330.030.3042.8110.0785439.32913.12
Q 2 eol 1660421.790.3141.310.30.0293504.07978.24
Q 2 el 1730440.000.2942.8110.1047504.32999.05
Q 2 al + 1 1800489.750.3043.511.30.0493526.391012.3
Table 3. Soil mechanical parameters.
SourceMoisture Content
(%)
Bulk Density
(kN·m−3)
Cohesion
(MPa)
Internal Friction Angle
(°)
Compression Modulus
(MPa)
Prototype soil20.0018.200.03319.009.20
Simulated soil8.9021.500.0023521.000.51
Table 4. Test parameters of plexiglass.
Height
(mm)
Diameter
(mm)
Maximum Load
(kN)
Compression Modulus
(MPa)
Tensile Strength
(MPa)
Height
(mm)
30.0112.3510.362.4686.5630.01
Table 5. Lateral displacement of measure points (mm).
Working ConditionMeasure PointInput Accelerations
0.1 g0.2 g0.4 g
Orthogonal conditionA4GL115.4−11.0−39.0
A4GL29.8−27.9−85.4
A4GL38.2−30.8−99.8
A4GL49.8−28.027.3
A5GL113.0−11.8−33.1
A5GL28.0−27.7−78.7
A5GL37.0−31.7−97.9
A5GL48.0−28.8−79.0
Oblique conditionA4GL1−8.443.2−18.3
A4GL2−13.827.6−65.3
A4GL3−21.3−1.9−95.3
A4GL4−13.527.3−65.3
A5GL1−16.626.2−45.4
A5GL2−19.713.3−86.0
A5GL3−22.8−4.8−106.4
A5GL4−19.813.3−87.3
Table 6. Shear angle of tunnel.
Tunnel SectionWorking ConditionInput Acceleration
0.1 g0.2 g0.4 g
A4Orthogonal condition0.000810.002210.00679
Oblique condition0.001440.005030.00859
A5Orthogonal condition0.000670.002220.00723
Oblique condition0.000690.003460.00680
Note: Shear angle is the ratio of the lateral displacement difference of GL1 and GL3 to the height of the tunnel.
Table 7. Displacement difference between A4 and A5 tunnel sections (mm).
Working ConditionInput Accelerations
0.1 g0.2 g0.4 g
Orthogonal condition1.8−0.2−6.7
Oblique condition5.914.220.7
Note: Displacement difference of tunnel = A4GL2−A5GL2 and A4GL4−A5GL4. Since the two values are similar, only A4GL2−A5GL2 is listed.
Disclaimer/Publisher’s Note: The statements, opinions and data contained in all publications are solely those of the individual author(s) and contributor(s) and not of MDPI and/or the editor(s). MDPI and/or the editor(s) disclaim responsibility for any injury to people or property resulting from any ideas, methods, instructions or products referred to in the content.