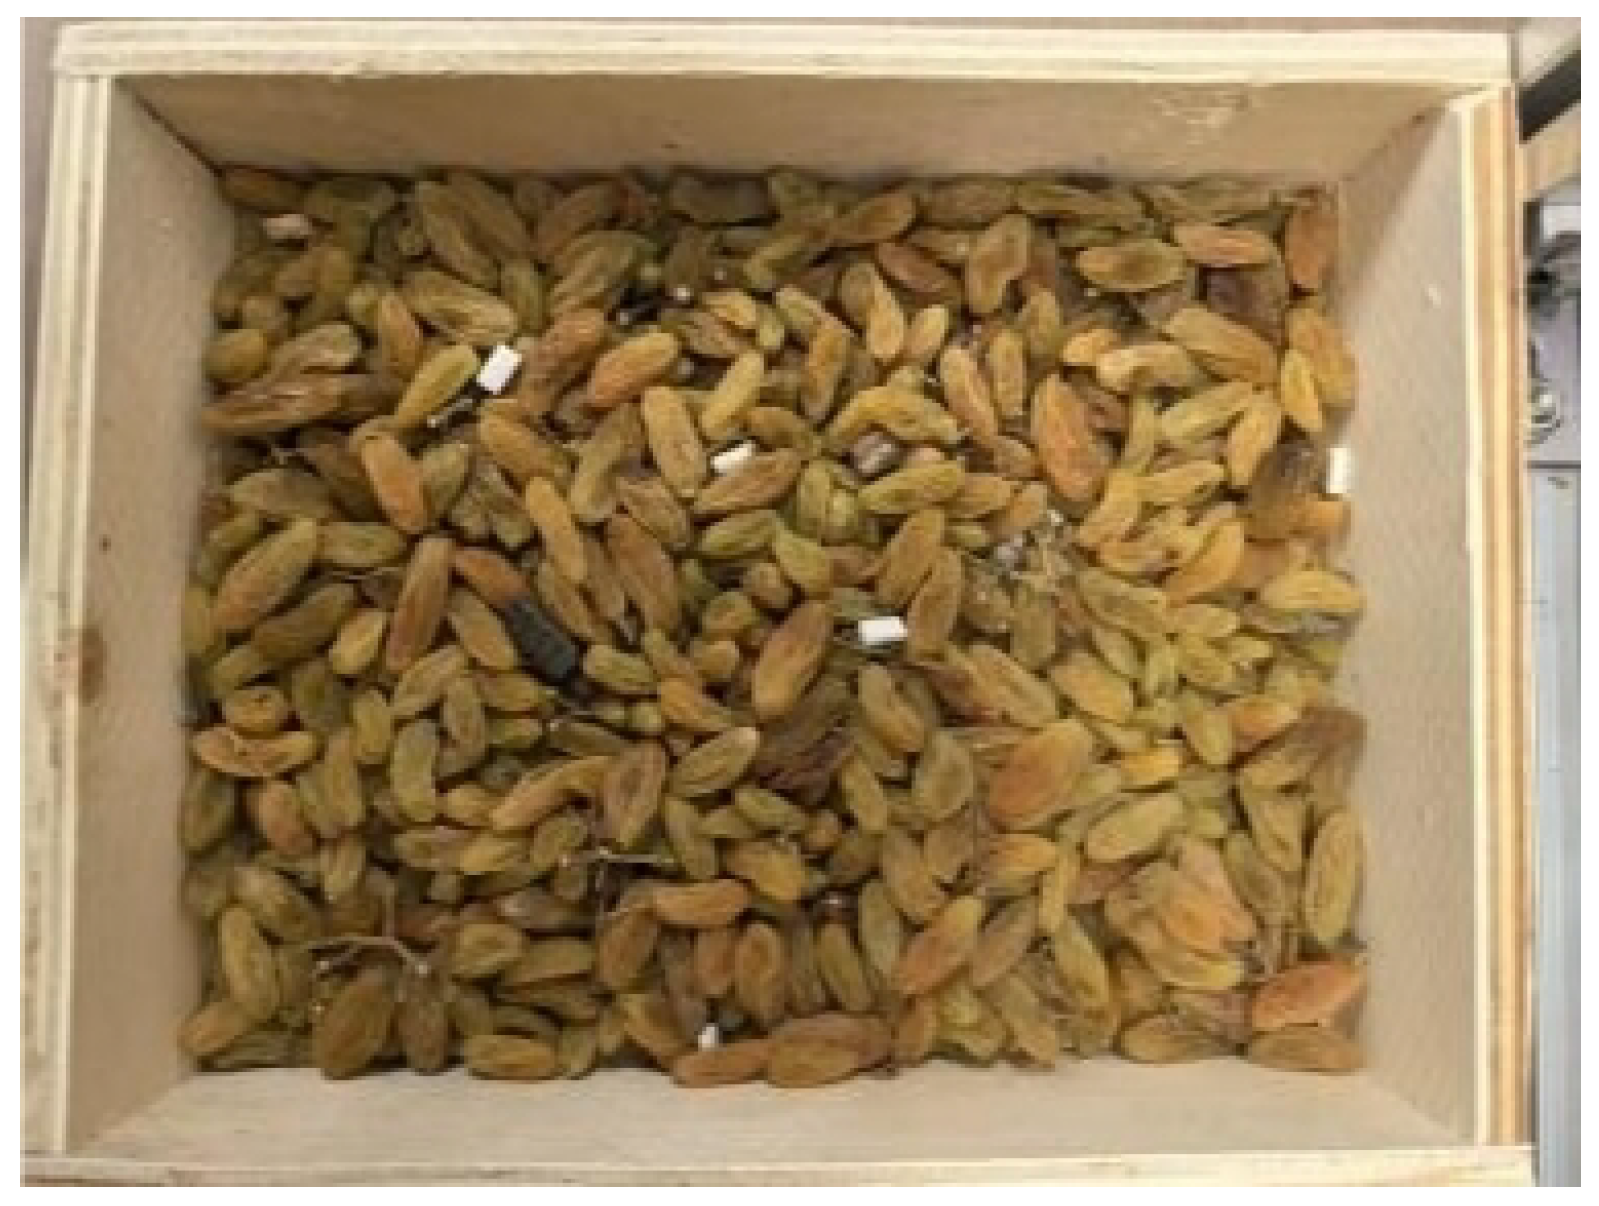
Figure 1.
Raisins and various foreign objects.
Figure 1.
Raisins and various foreign objects.
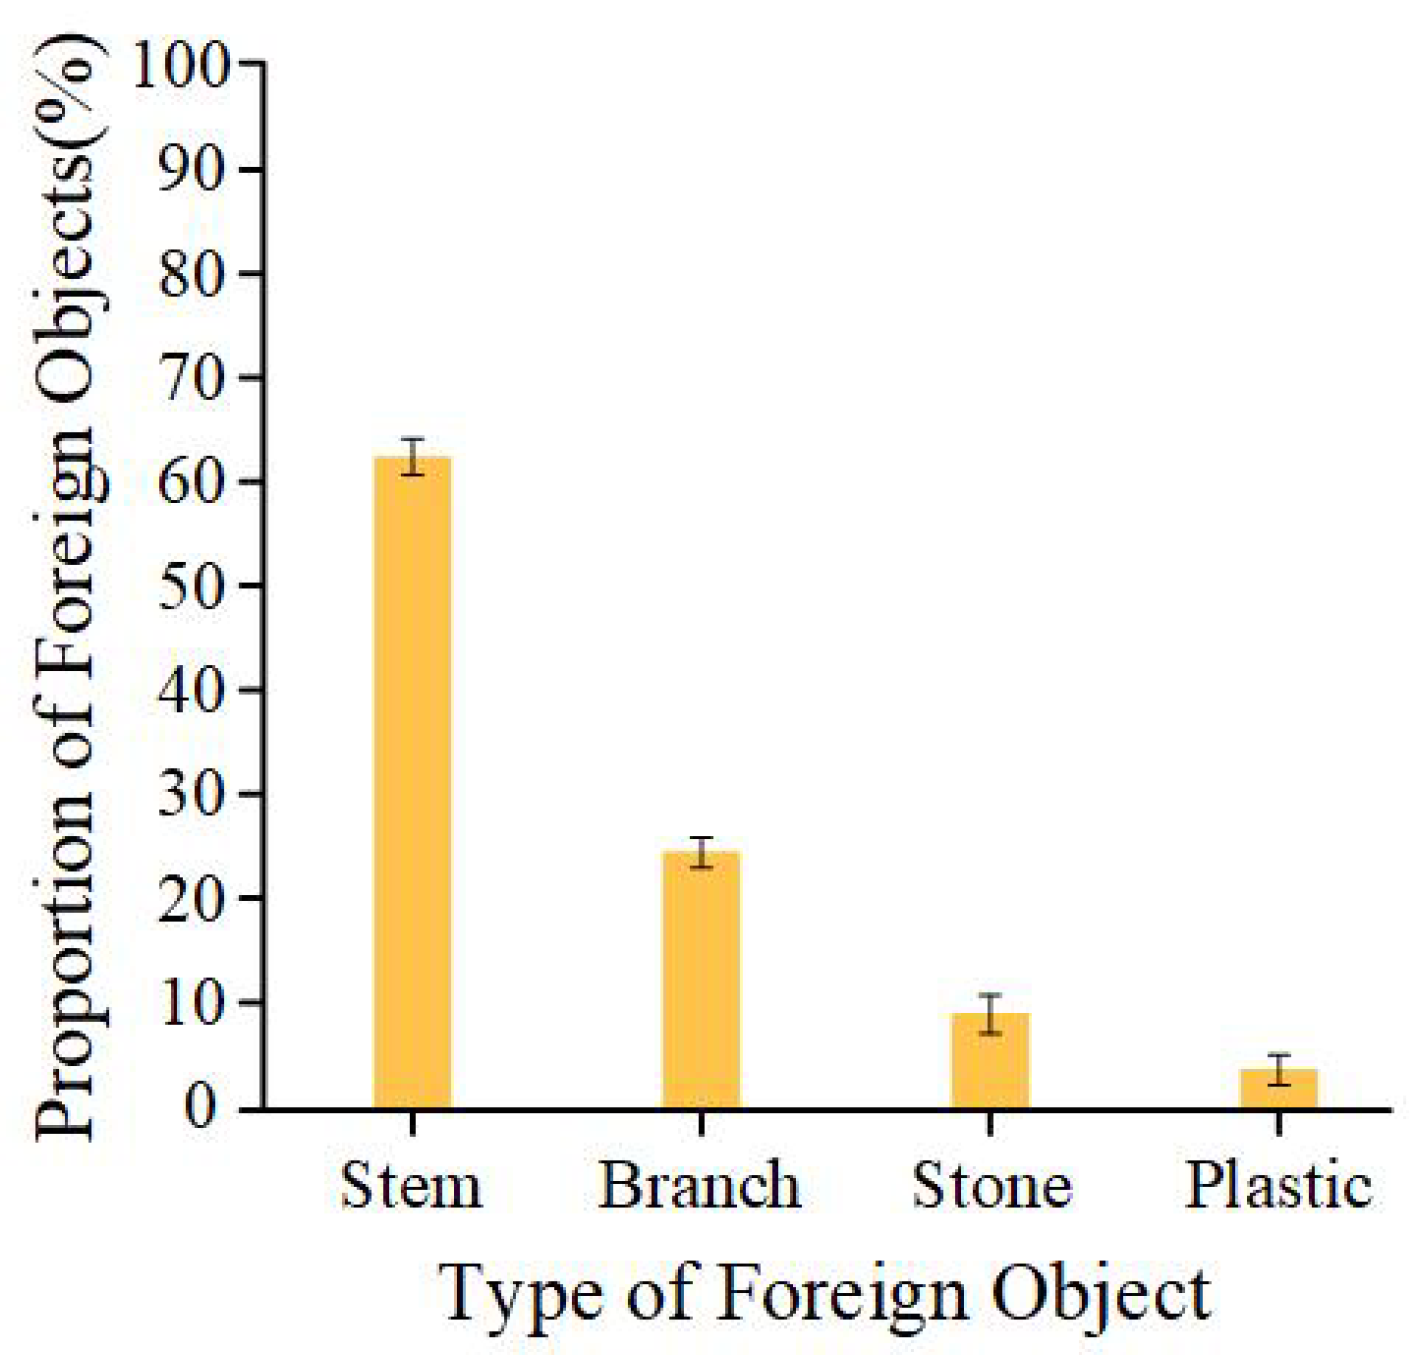
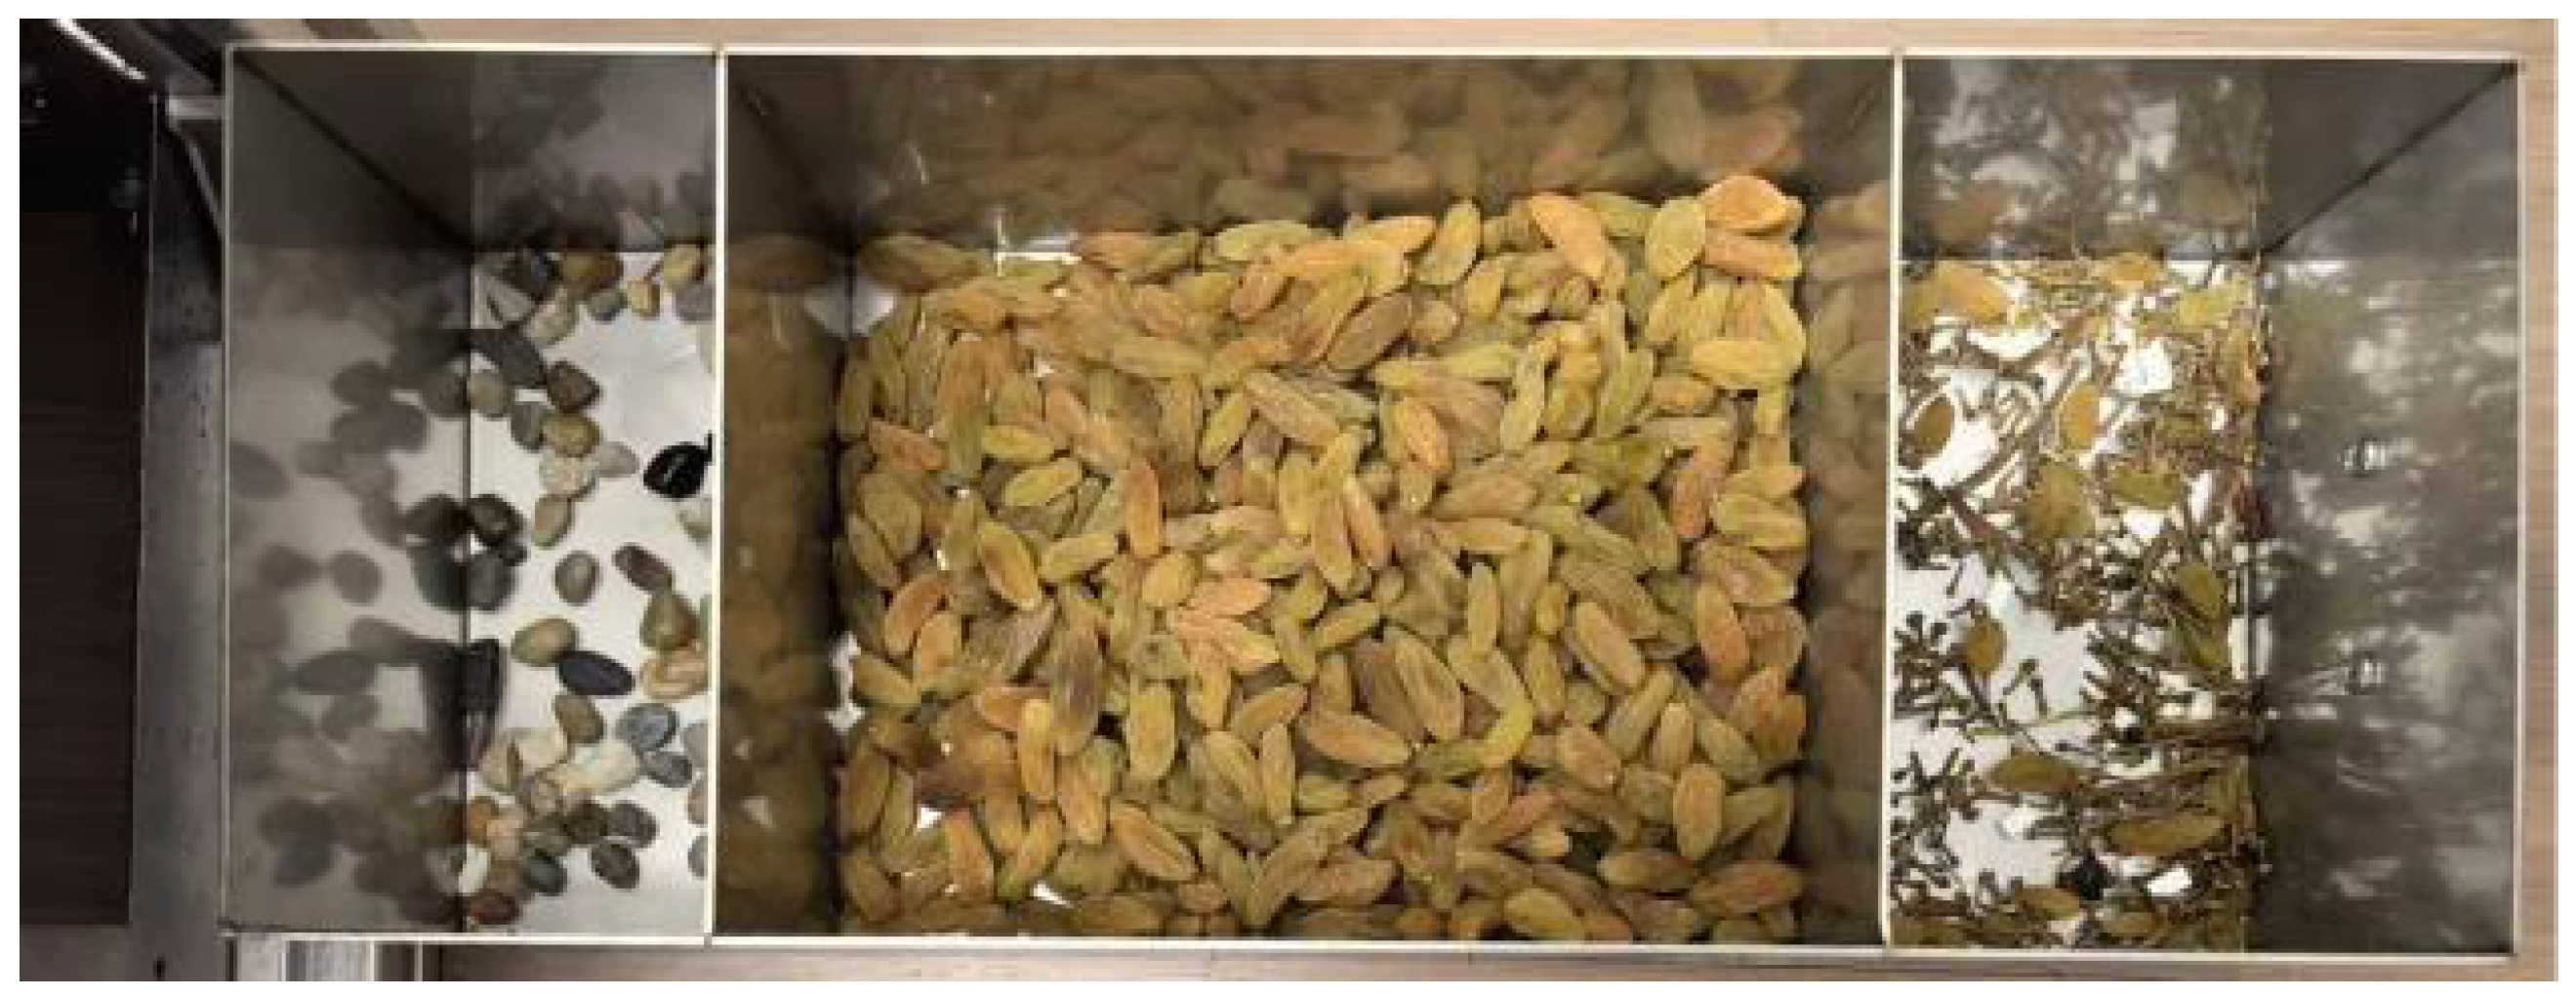
Figure 2.
Proportion of different types of foreign objects.
Figure 2.
Proportion of different types of foreign objects.
Figure 3.
Experimental samples.
Figure 3.
Experimental samples.
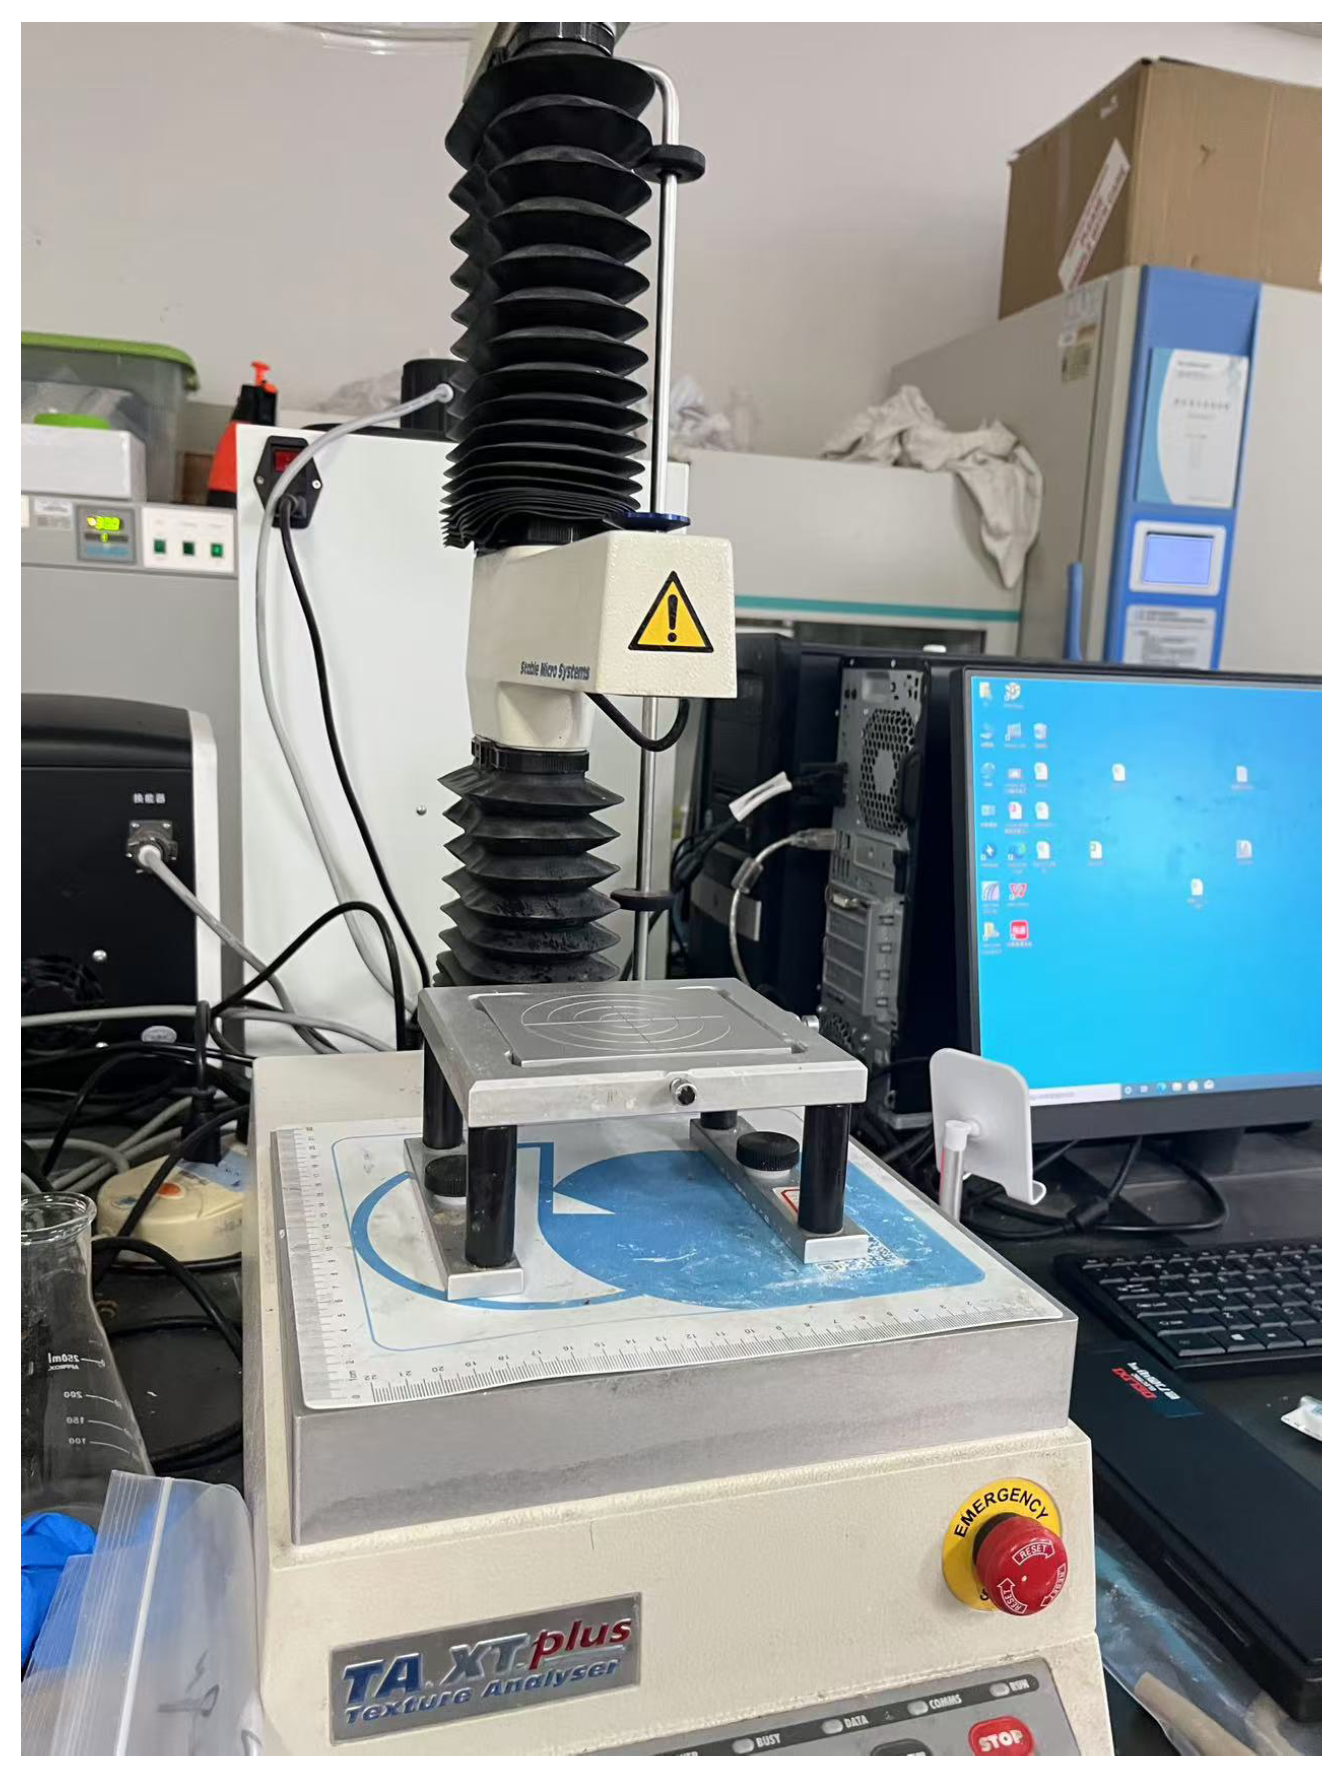
Figure 4.
TA-XT Plus Texture Analyzer.
Figure 4.
TA-XT Plus Texture Analyzer.
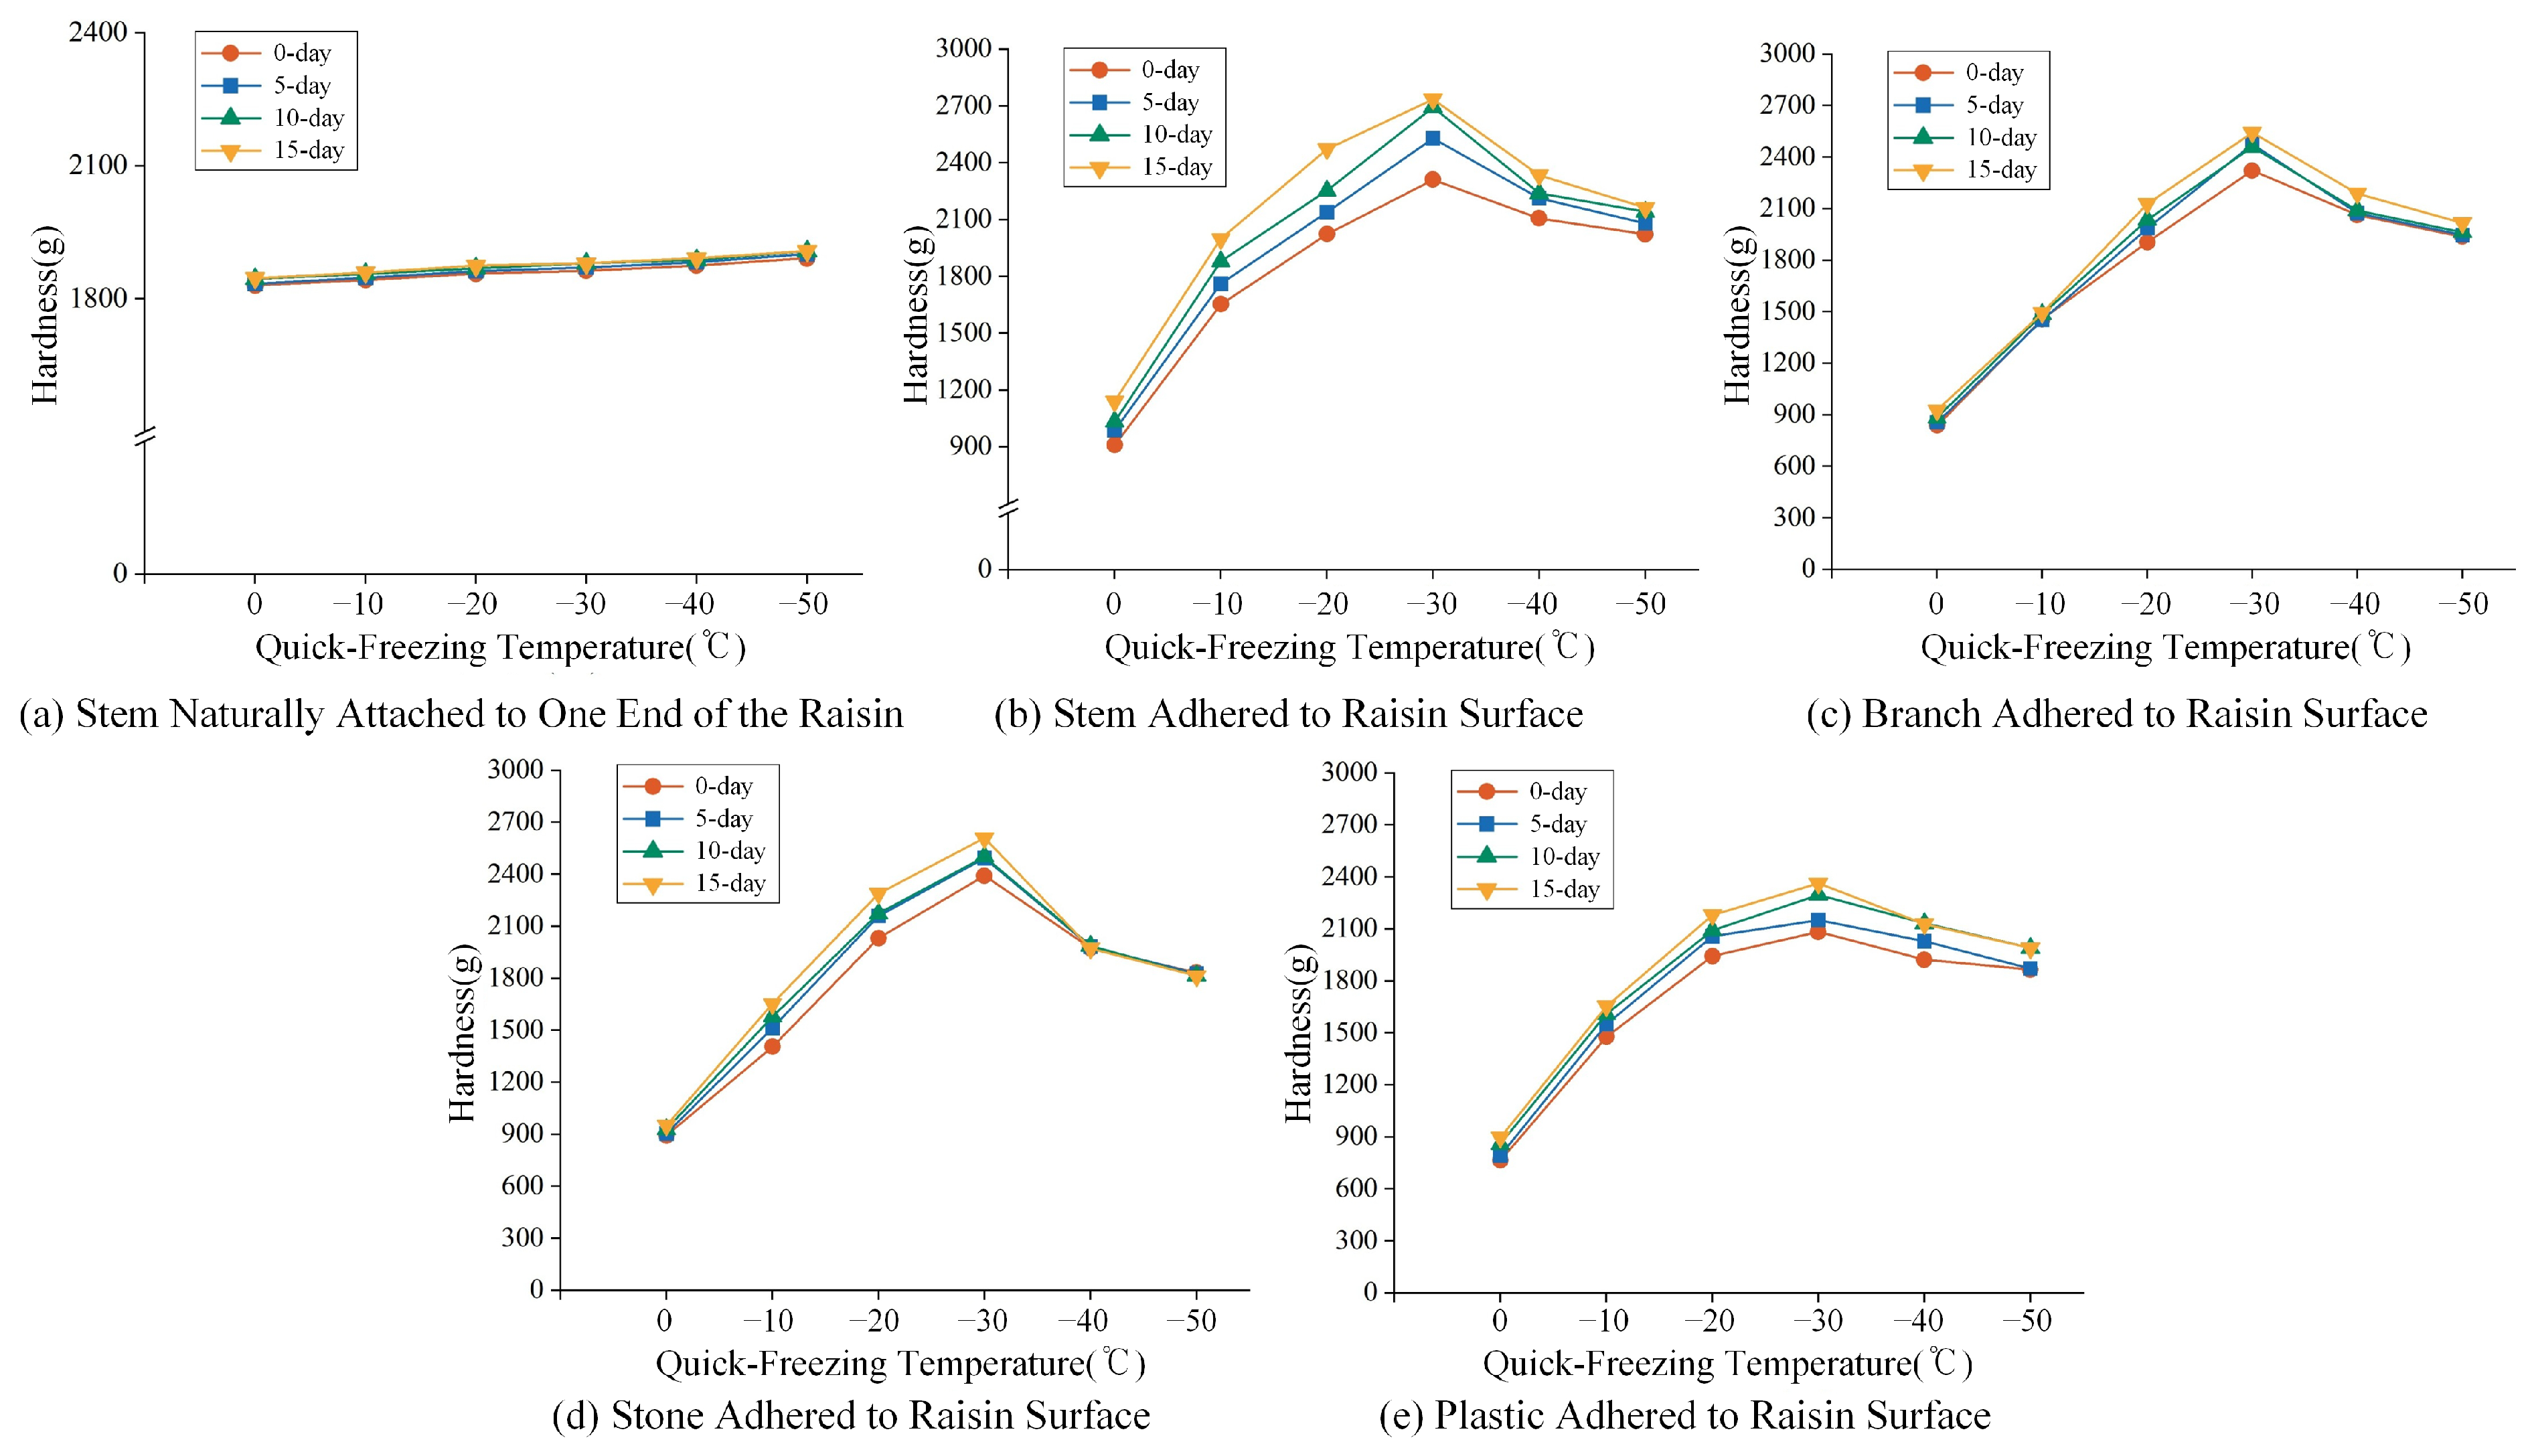
Figure 5.
Average tensile force required for separating different foreign materials adhered to raisin surfaces under varying quick-freezing temperatures.
Figure 5.
Average tensile force required for separating different foreign materials adhered to raisin surfaces under varying quick-freezing temperatures.
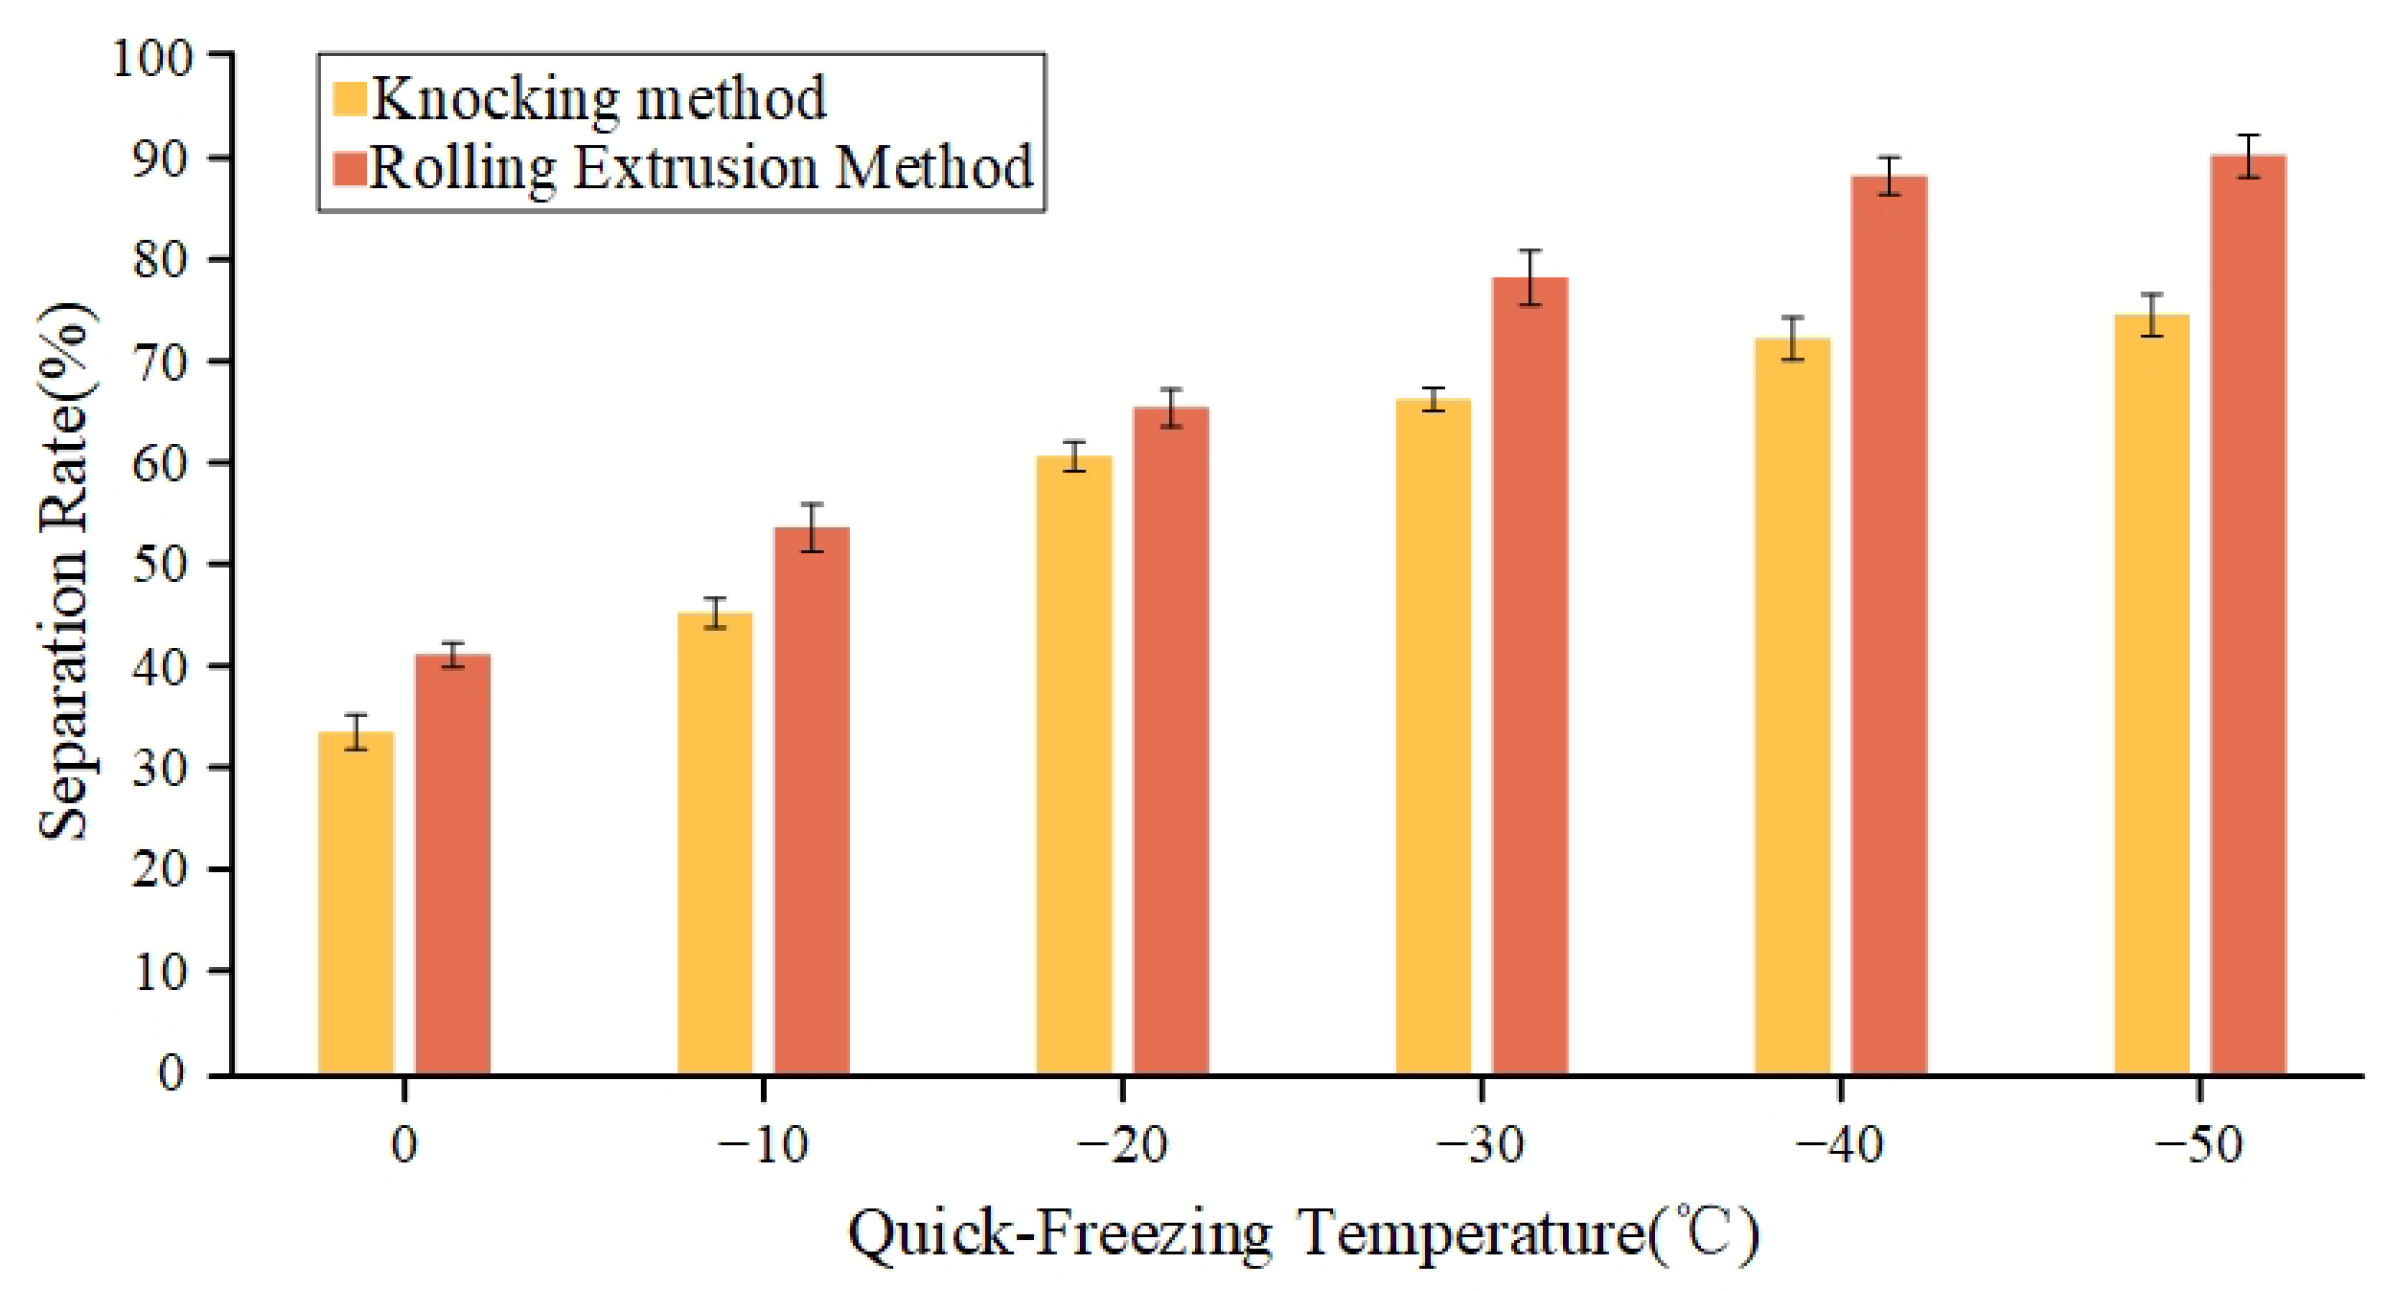
Figure 6.
Separation rate of materials subjected to different quick-freezing temperatures using various separation methods.
Figure 6.
Separation rate of materials subjected to different quick-freezing temperatures using various separation methods.
Figure 7.
Damage rate of materials subjected to different quick-freezing temperatures employing various separation methods.
Figure 7.
Damage rate of materials subjected to different quick-freezing temperatures employing various separation methods.
Figure 8.
Residue rate of materials subjected to different quick-freezing temperatures employing various separation methods.
Figure 8.
Residue rate of materials subjected to different quick-freezing temperatures employing various separation methods.
Figure 9.
Overall architecture of the elimination system for foreign objects in raisins.
Figure 9.
Overall architecture of the elimination system for foreign objects in raisins.
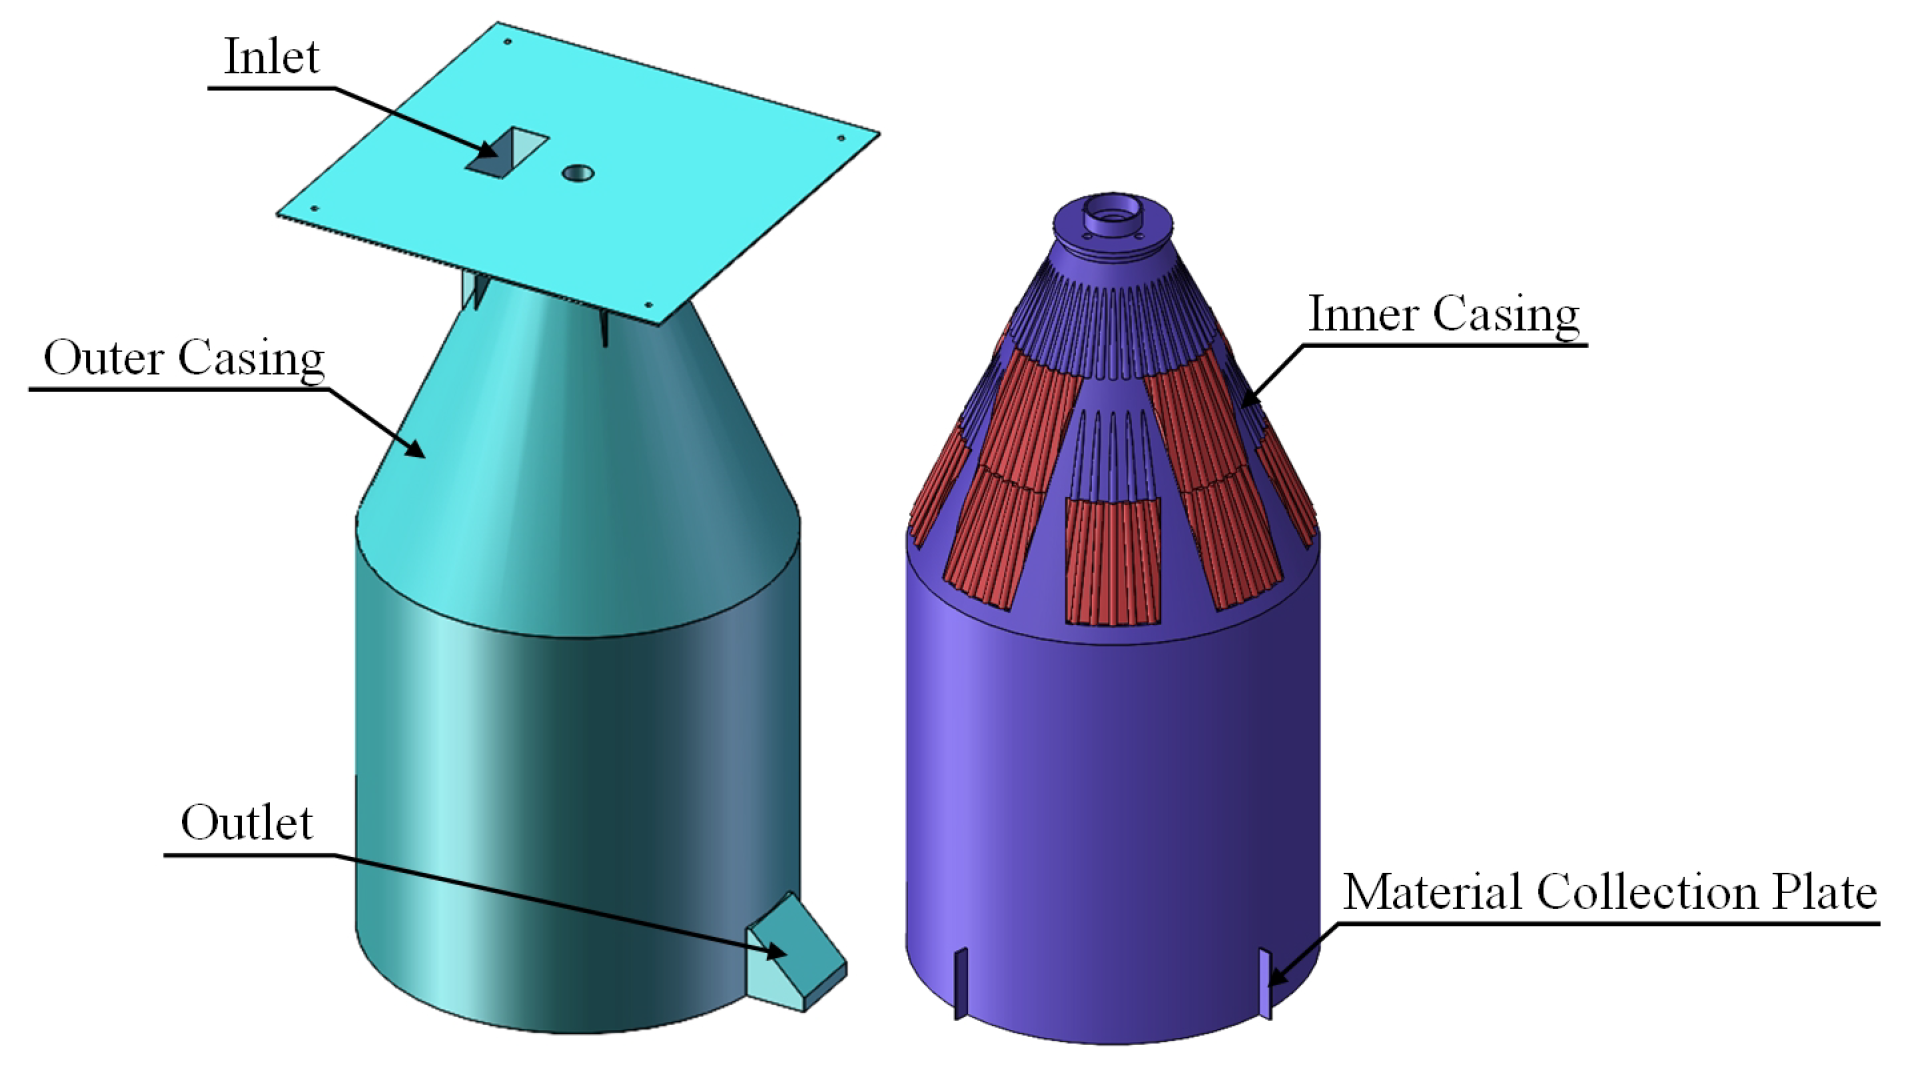
Figure 10.
Inner and outer housing design.
Figure 10.
Inner and outer housing design.
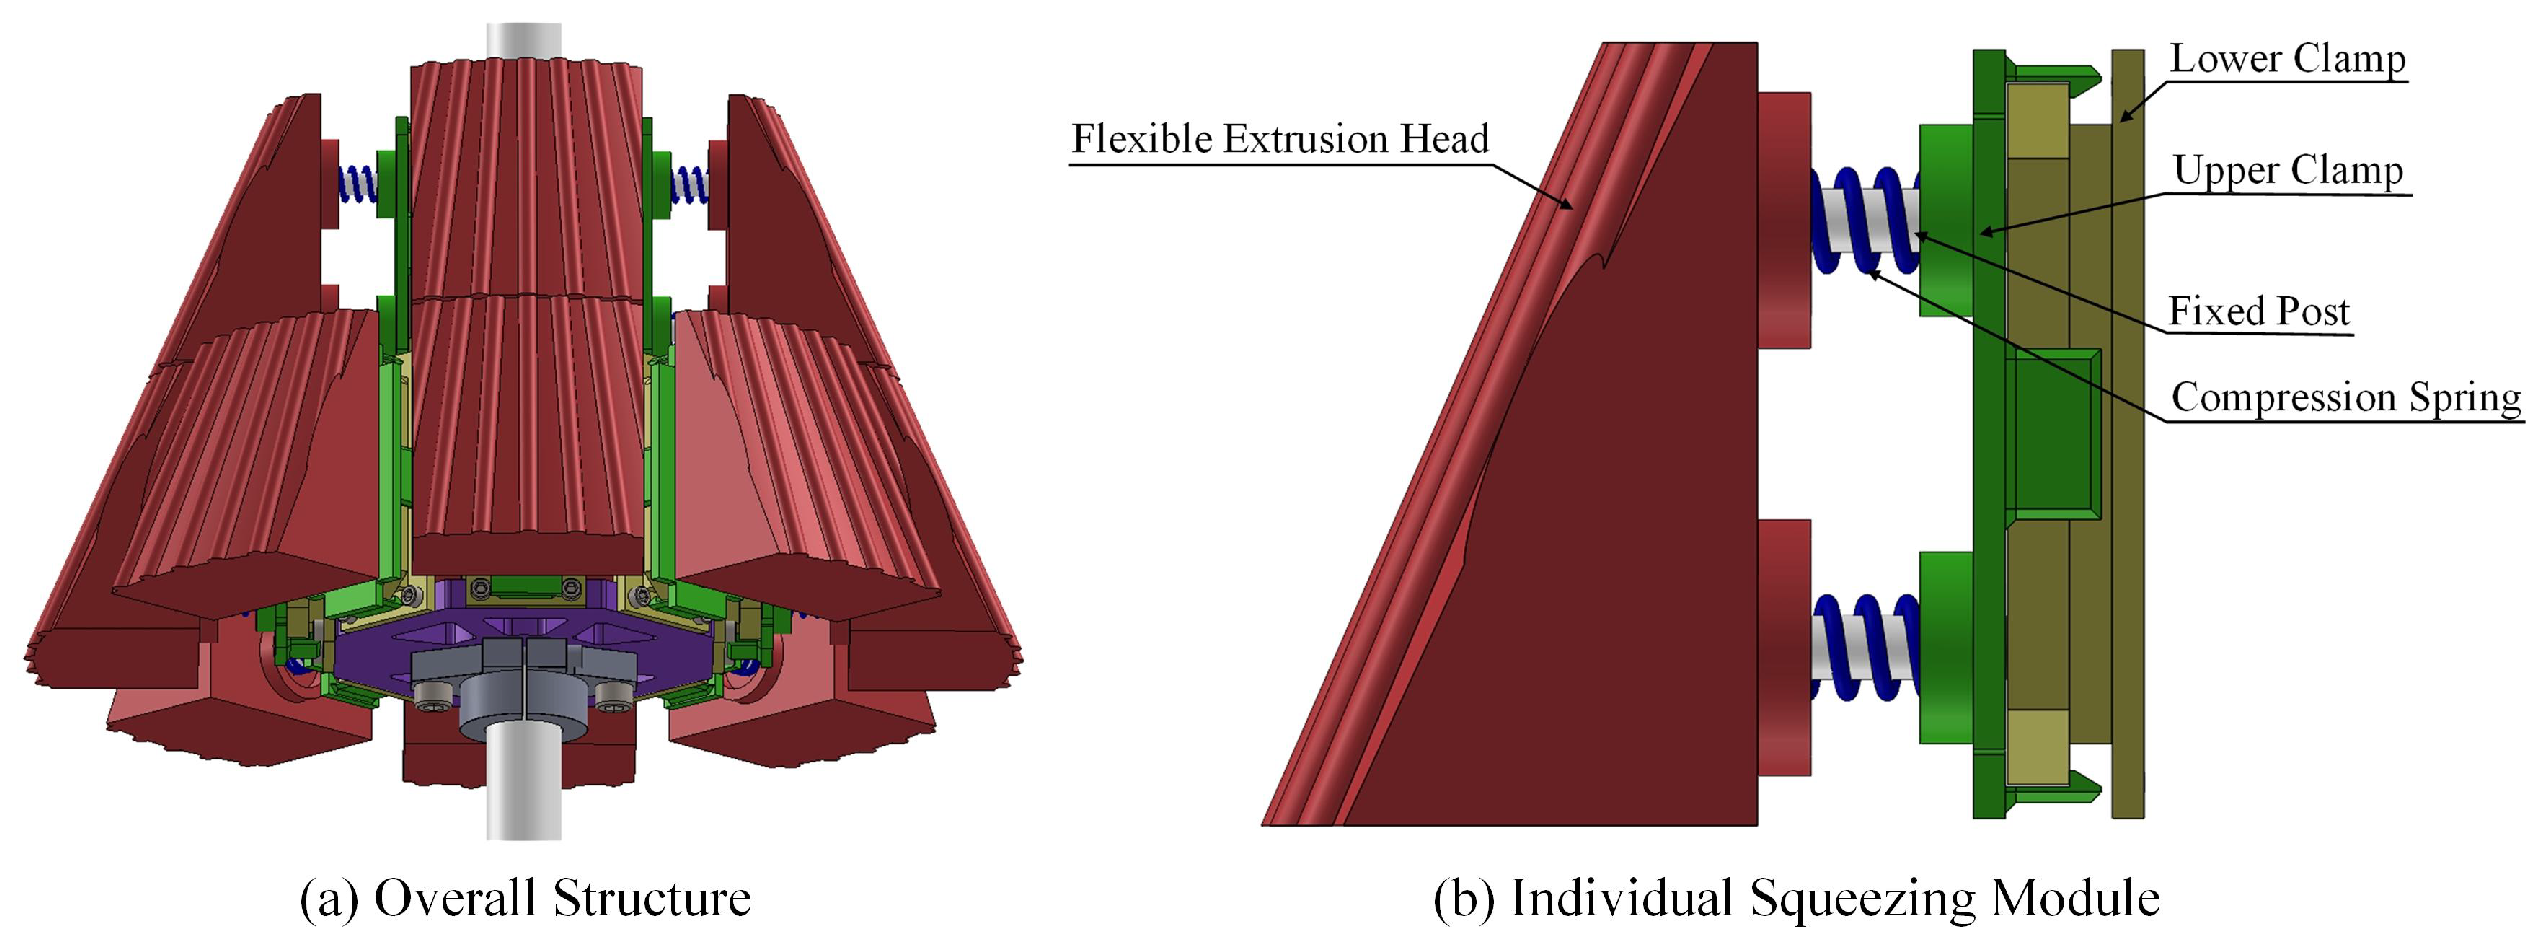
Figure 11.
Squeezing module.
Figure 11.
Squeezing module.
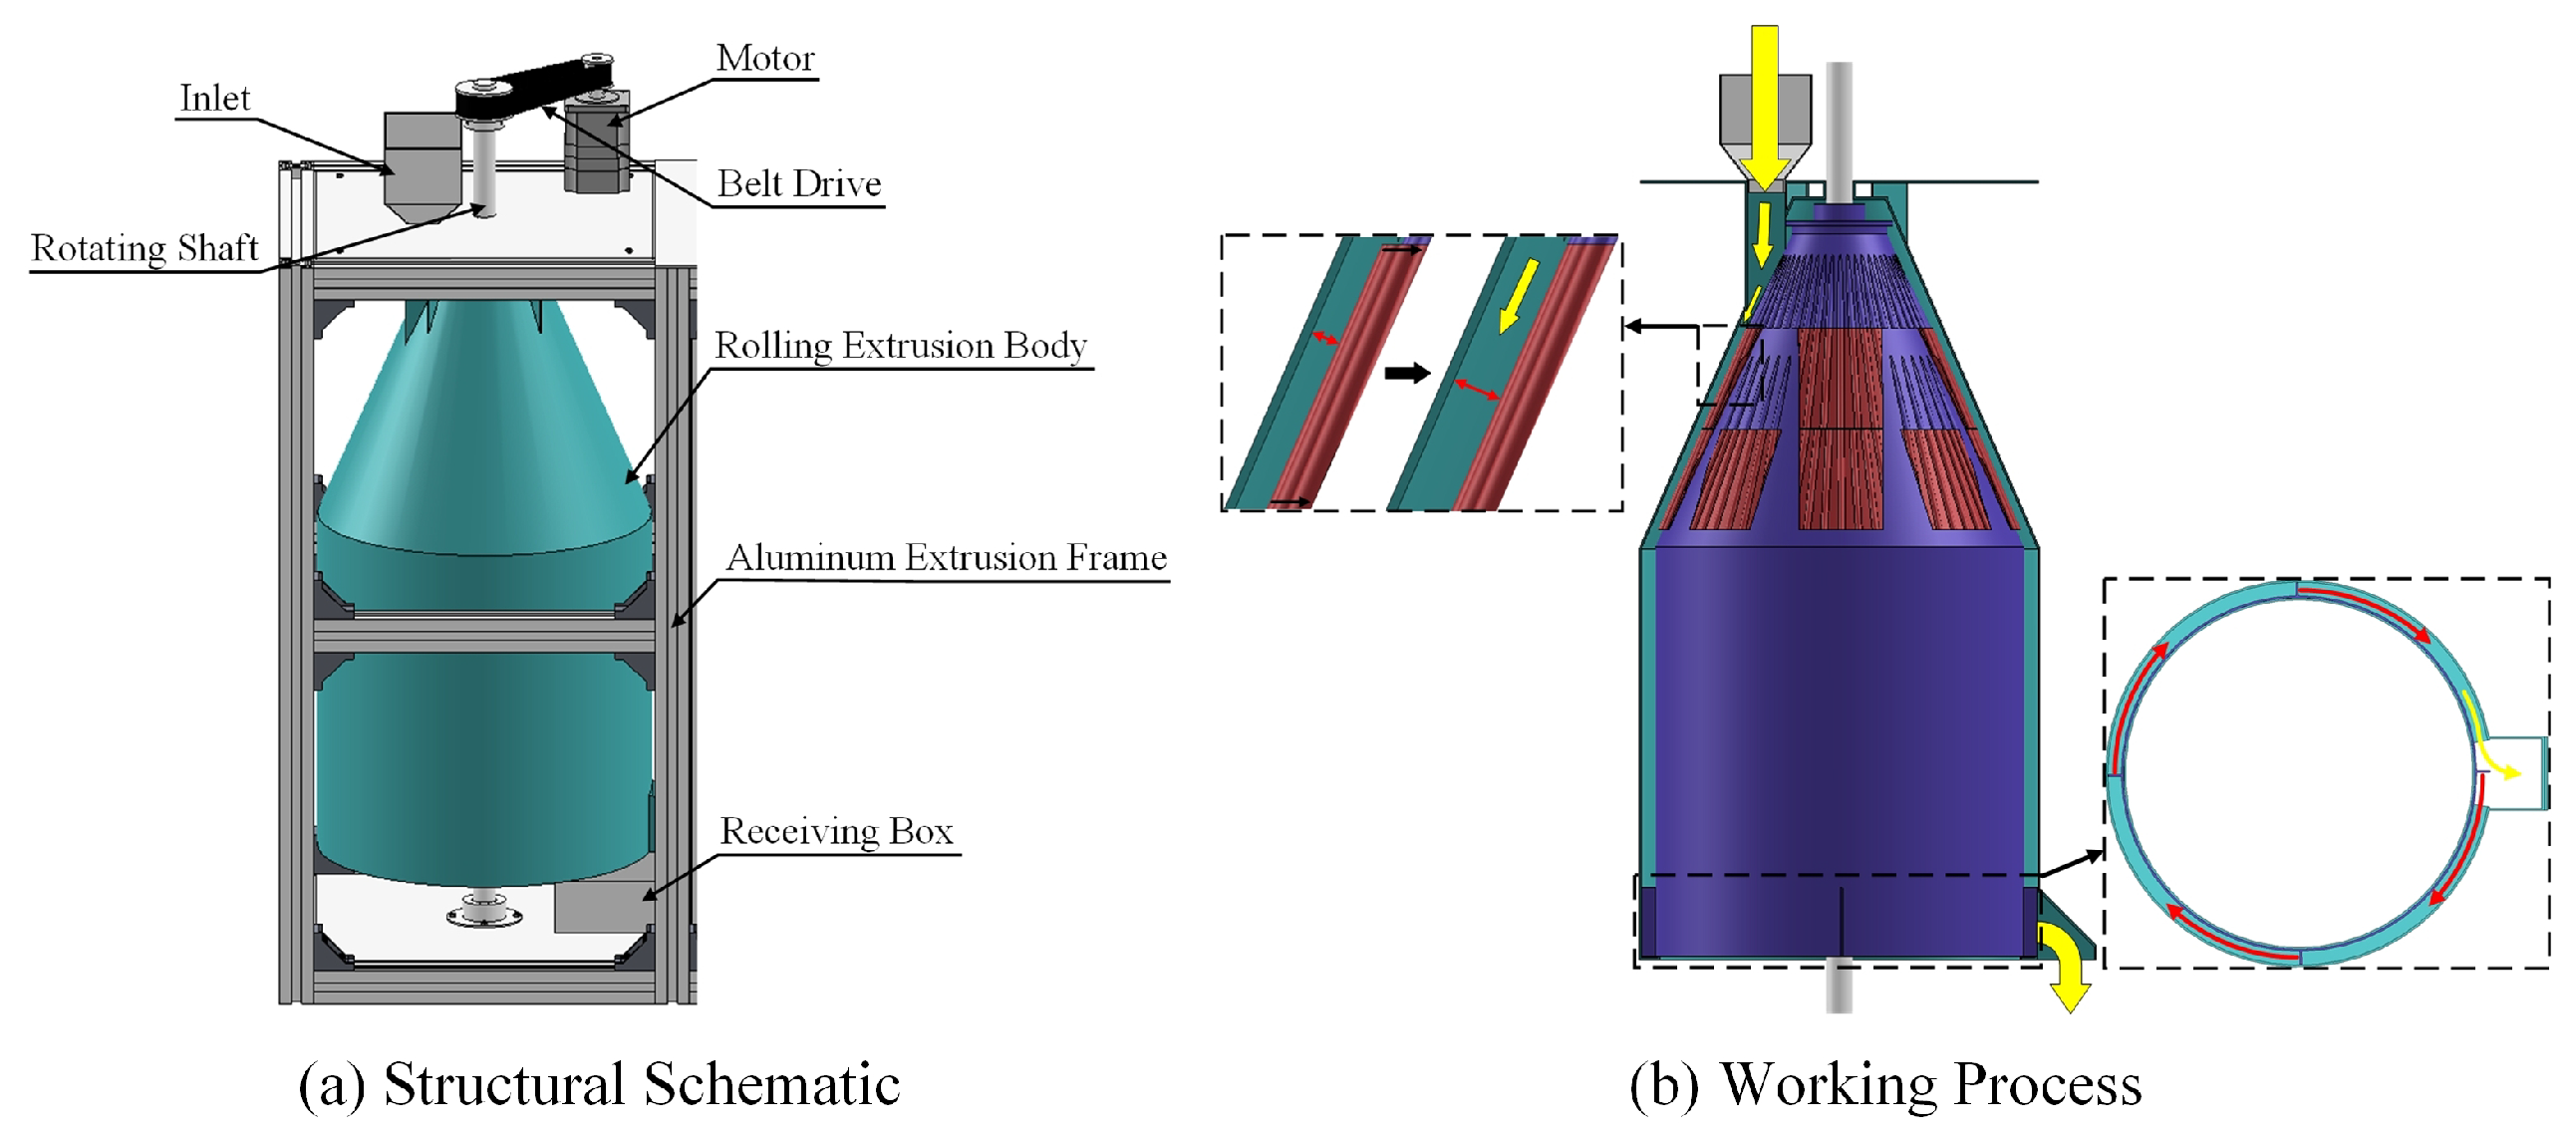
Figure 12.
Rolling extrusion module.
Figure 12.
Rolling extrusion module.
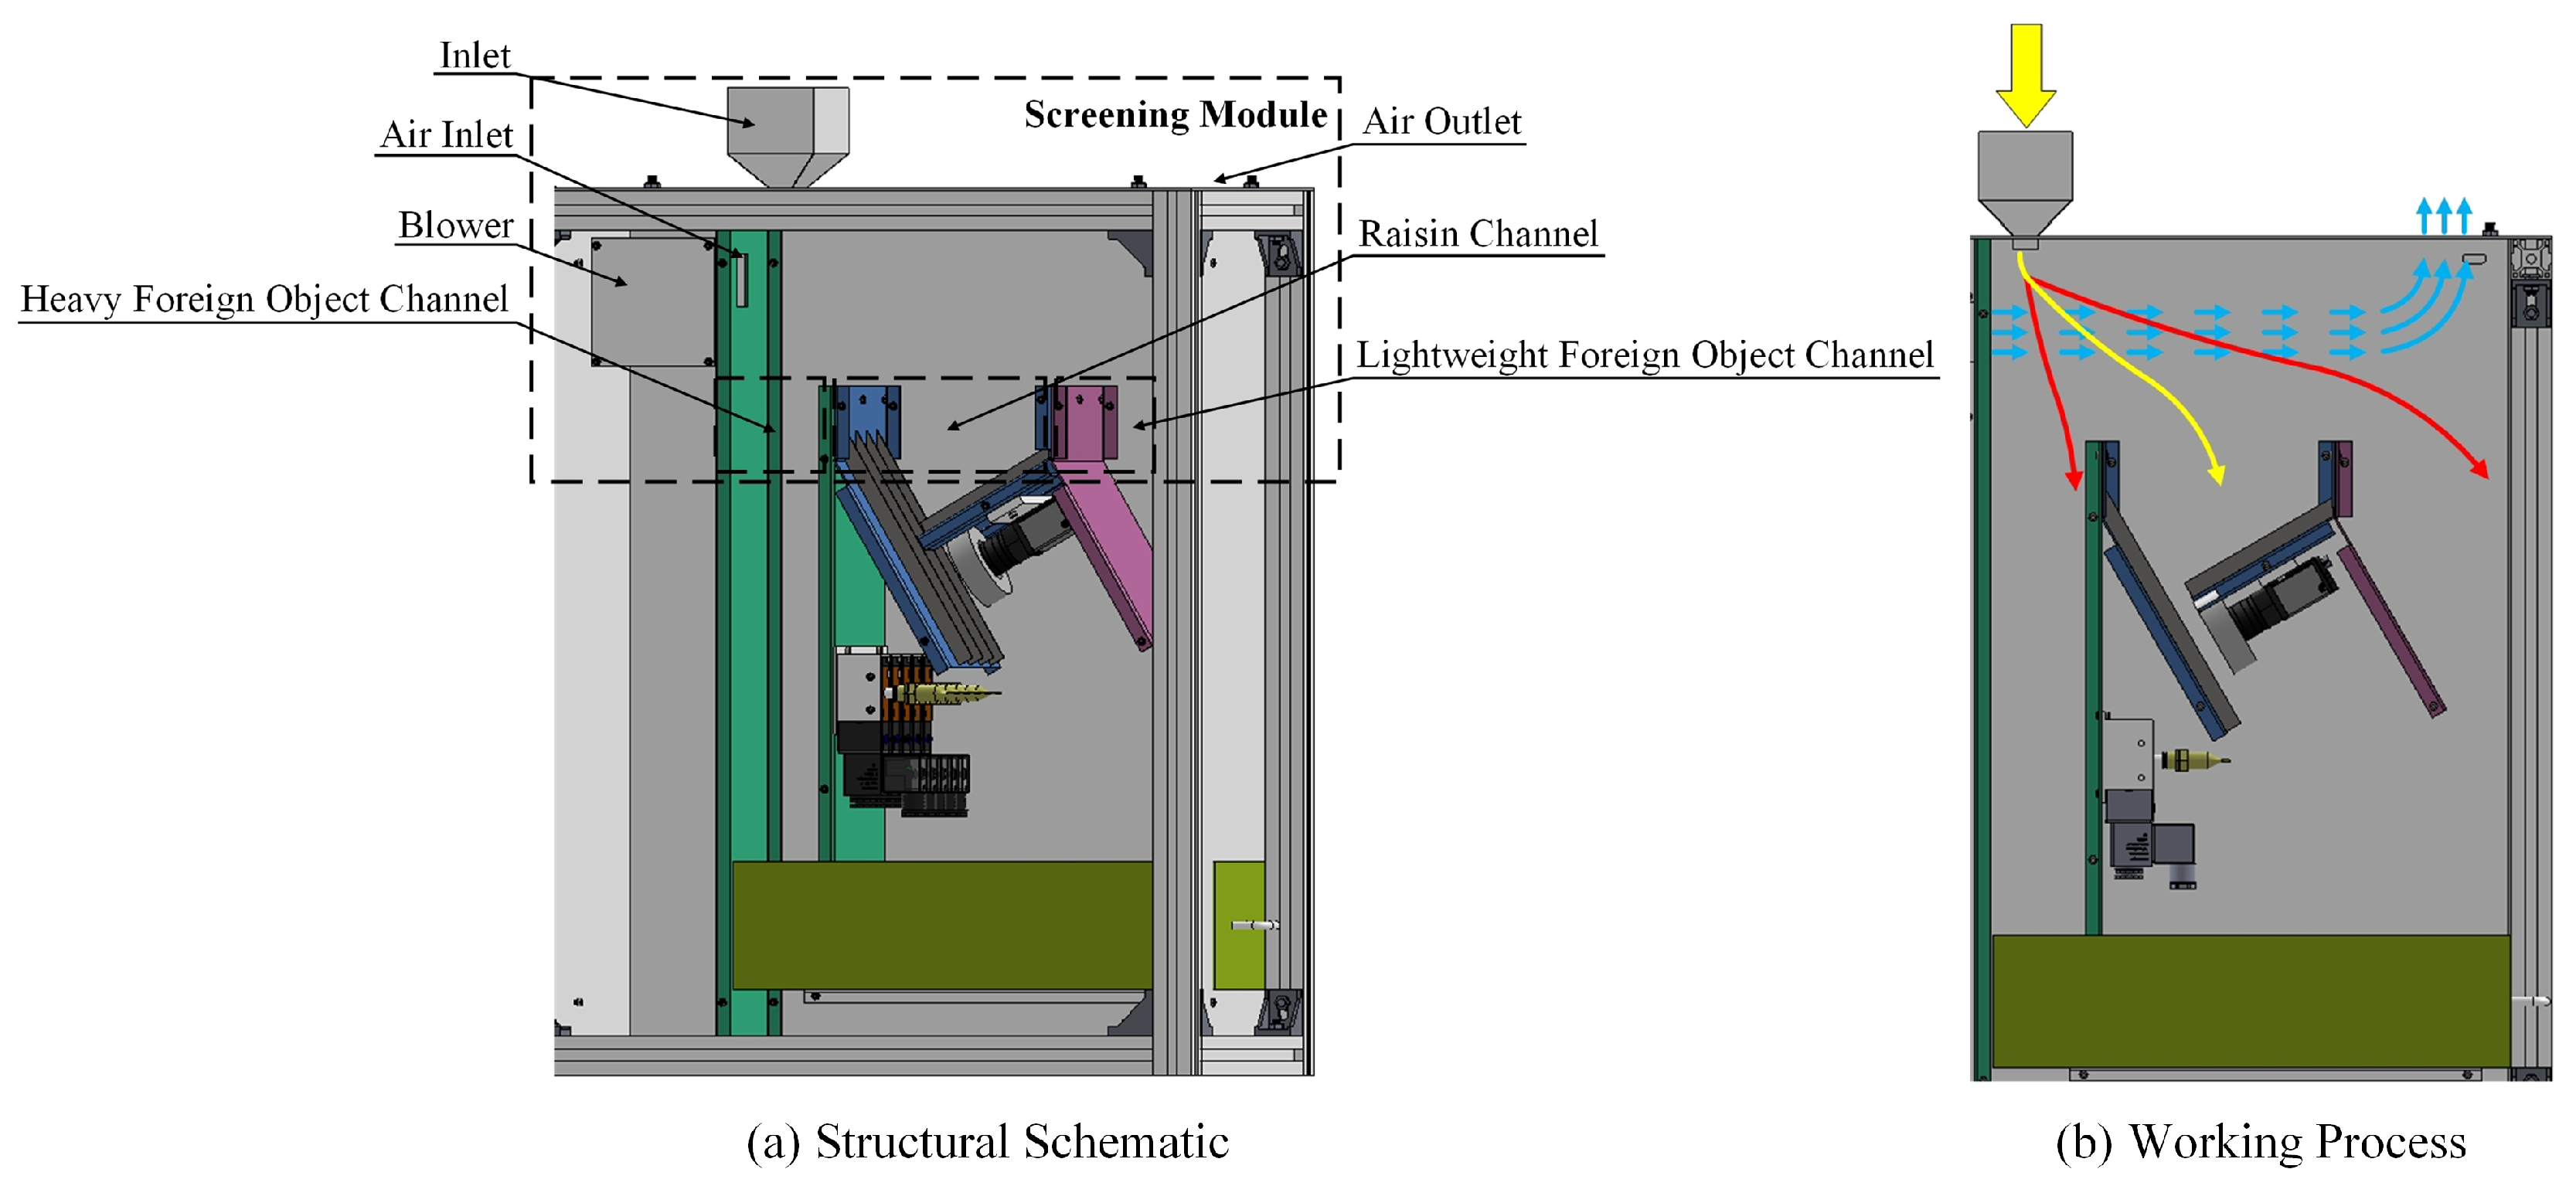
Figure 13.
Sieving module.
Figure 13.
Sieving module.
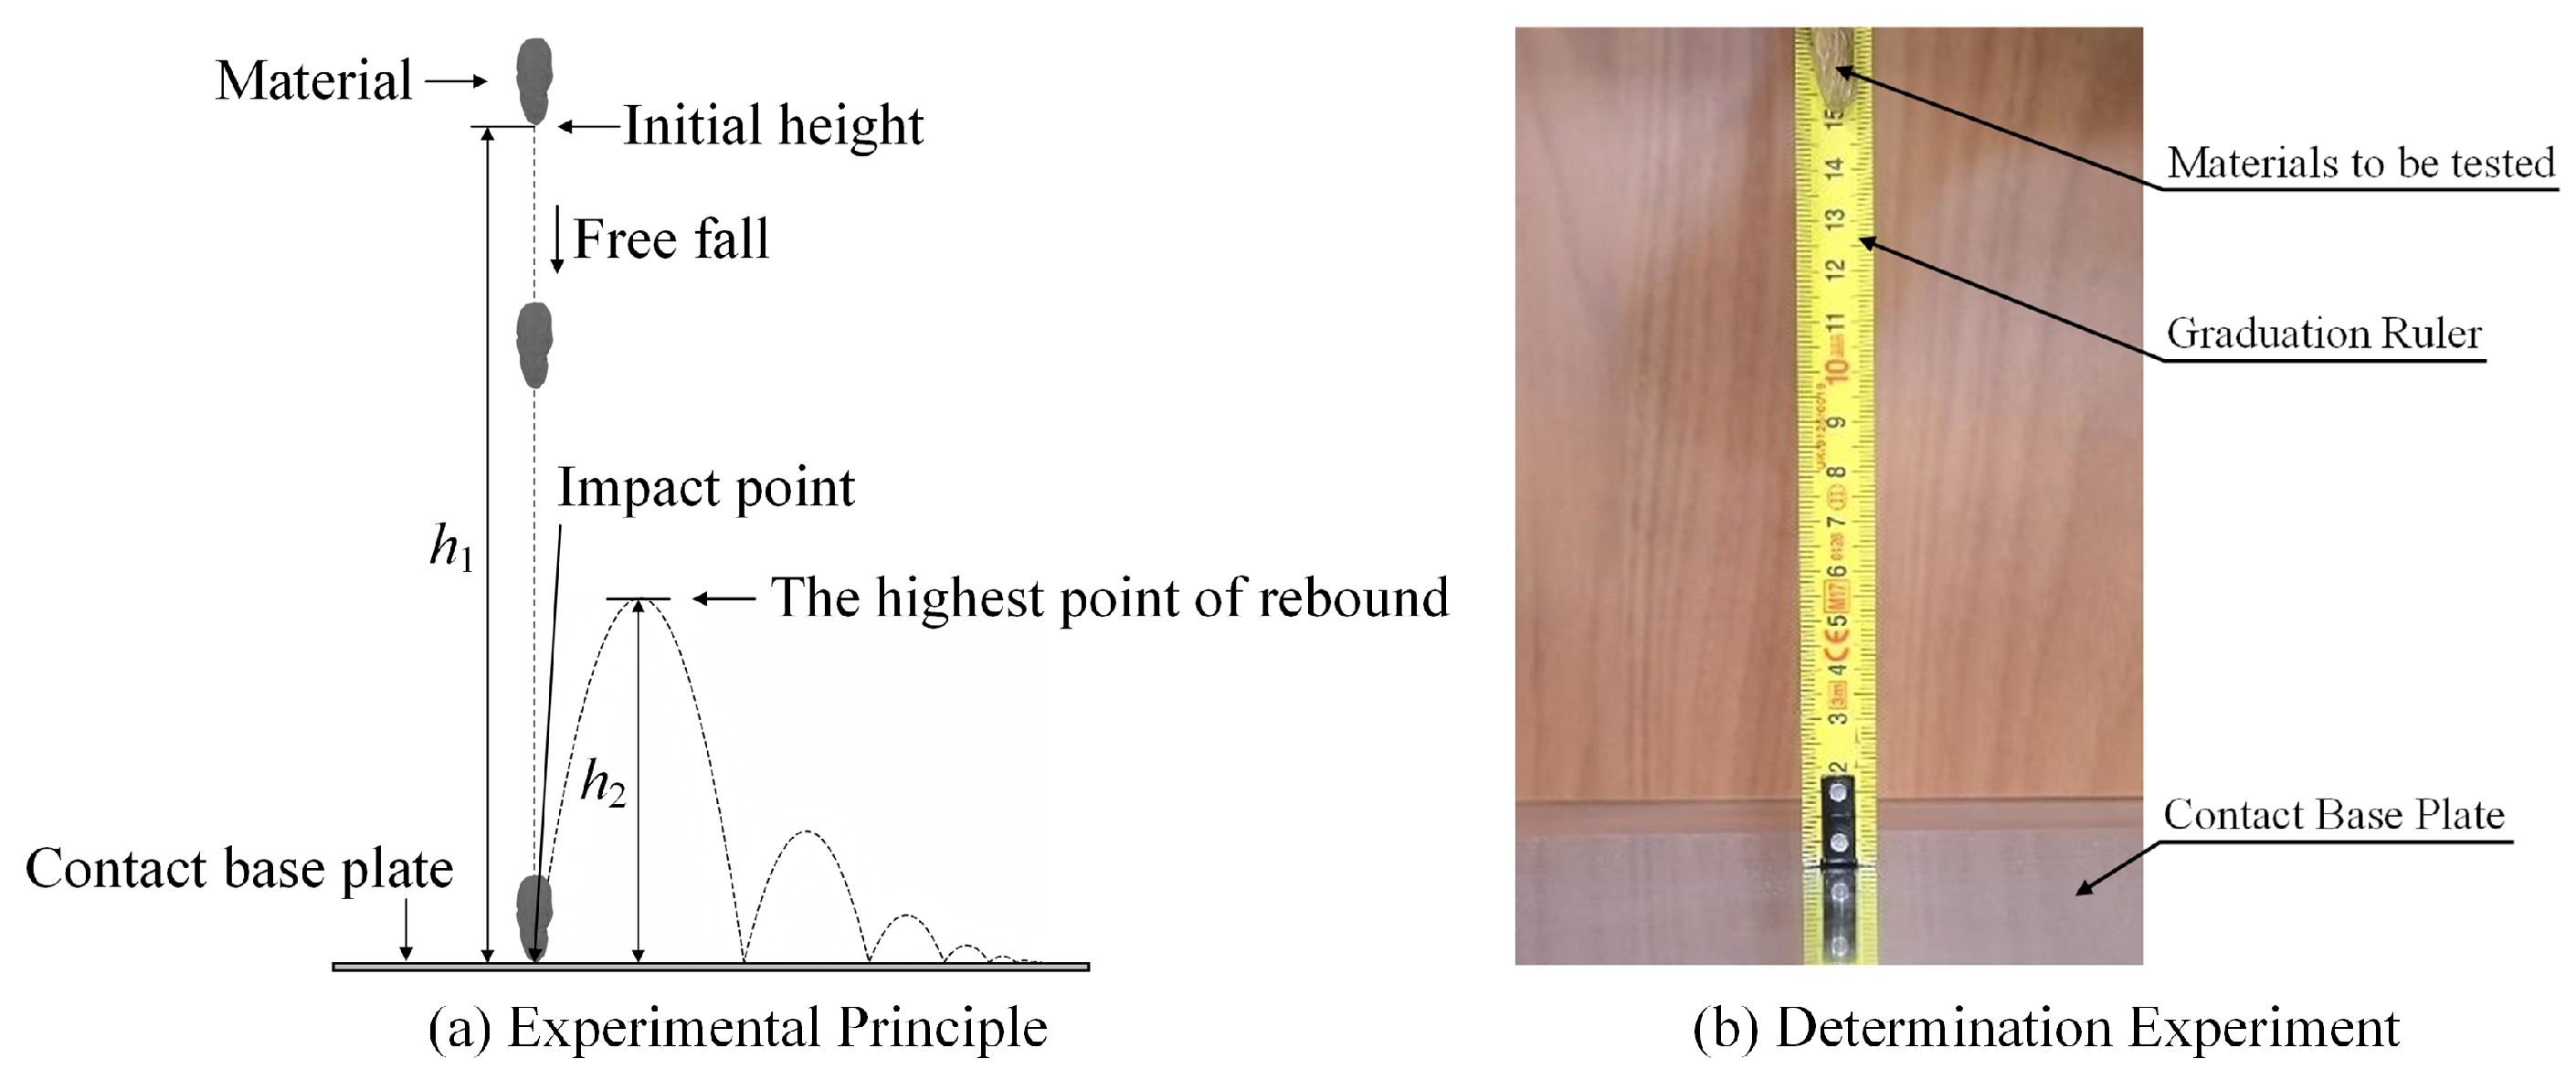
Figure 14.
Determination of the coefficient of restitution.
Figure 14.
Determination of the coefficient of restitution.
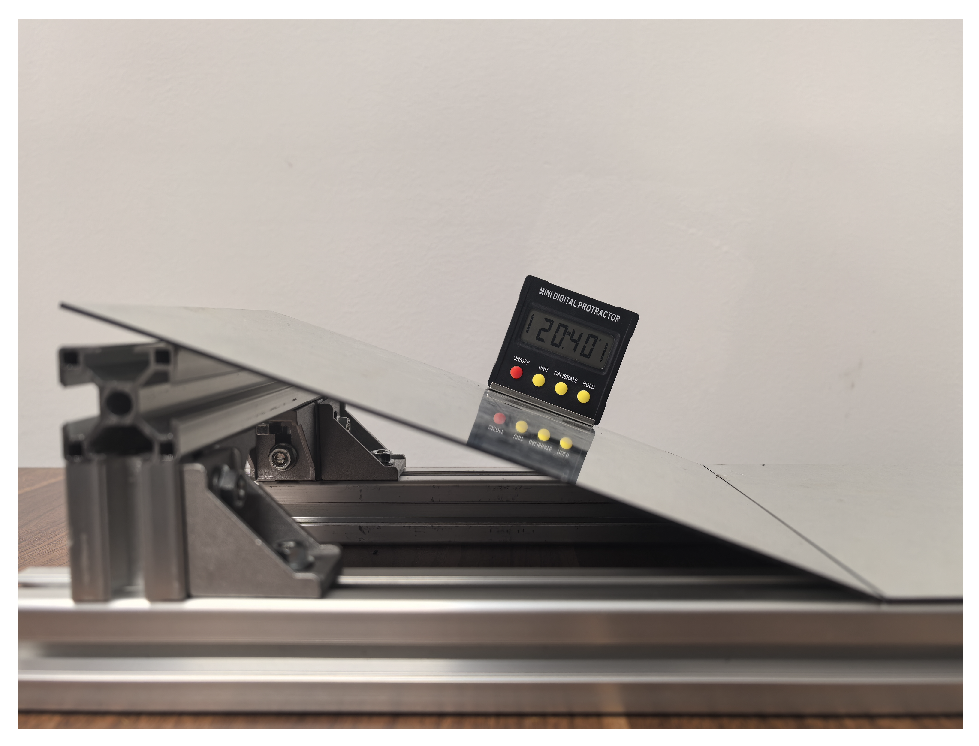
Figure 15.
Experimental determination of friction coefficients.
Figure 15.
Experimental determination of friction coefficients.
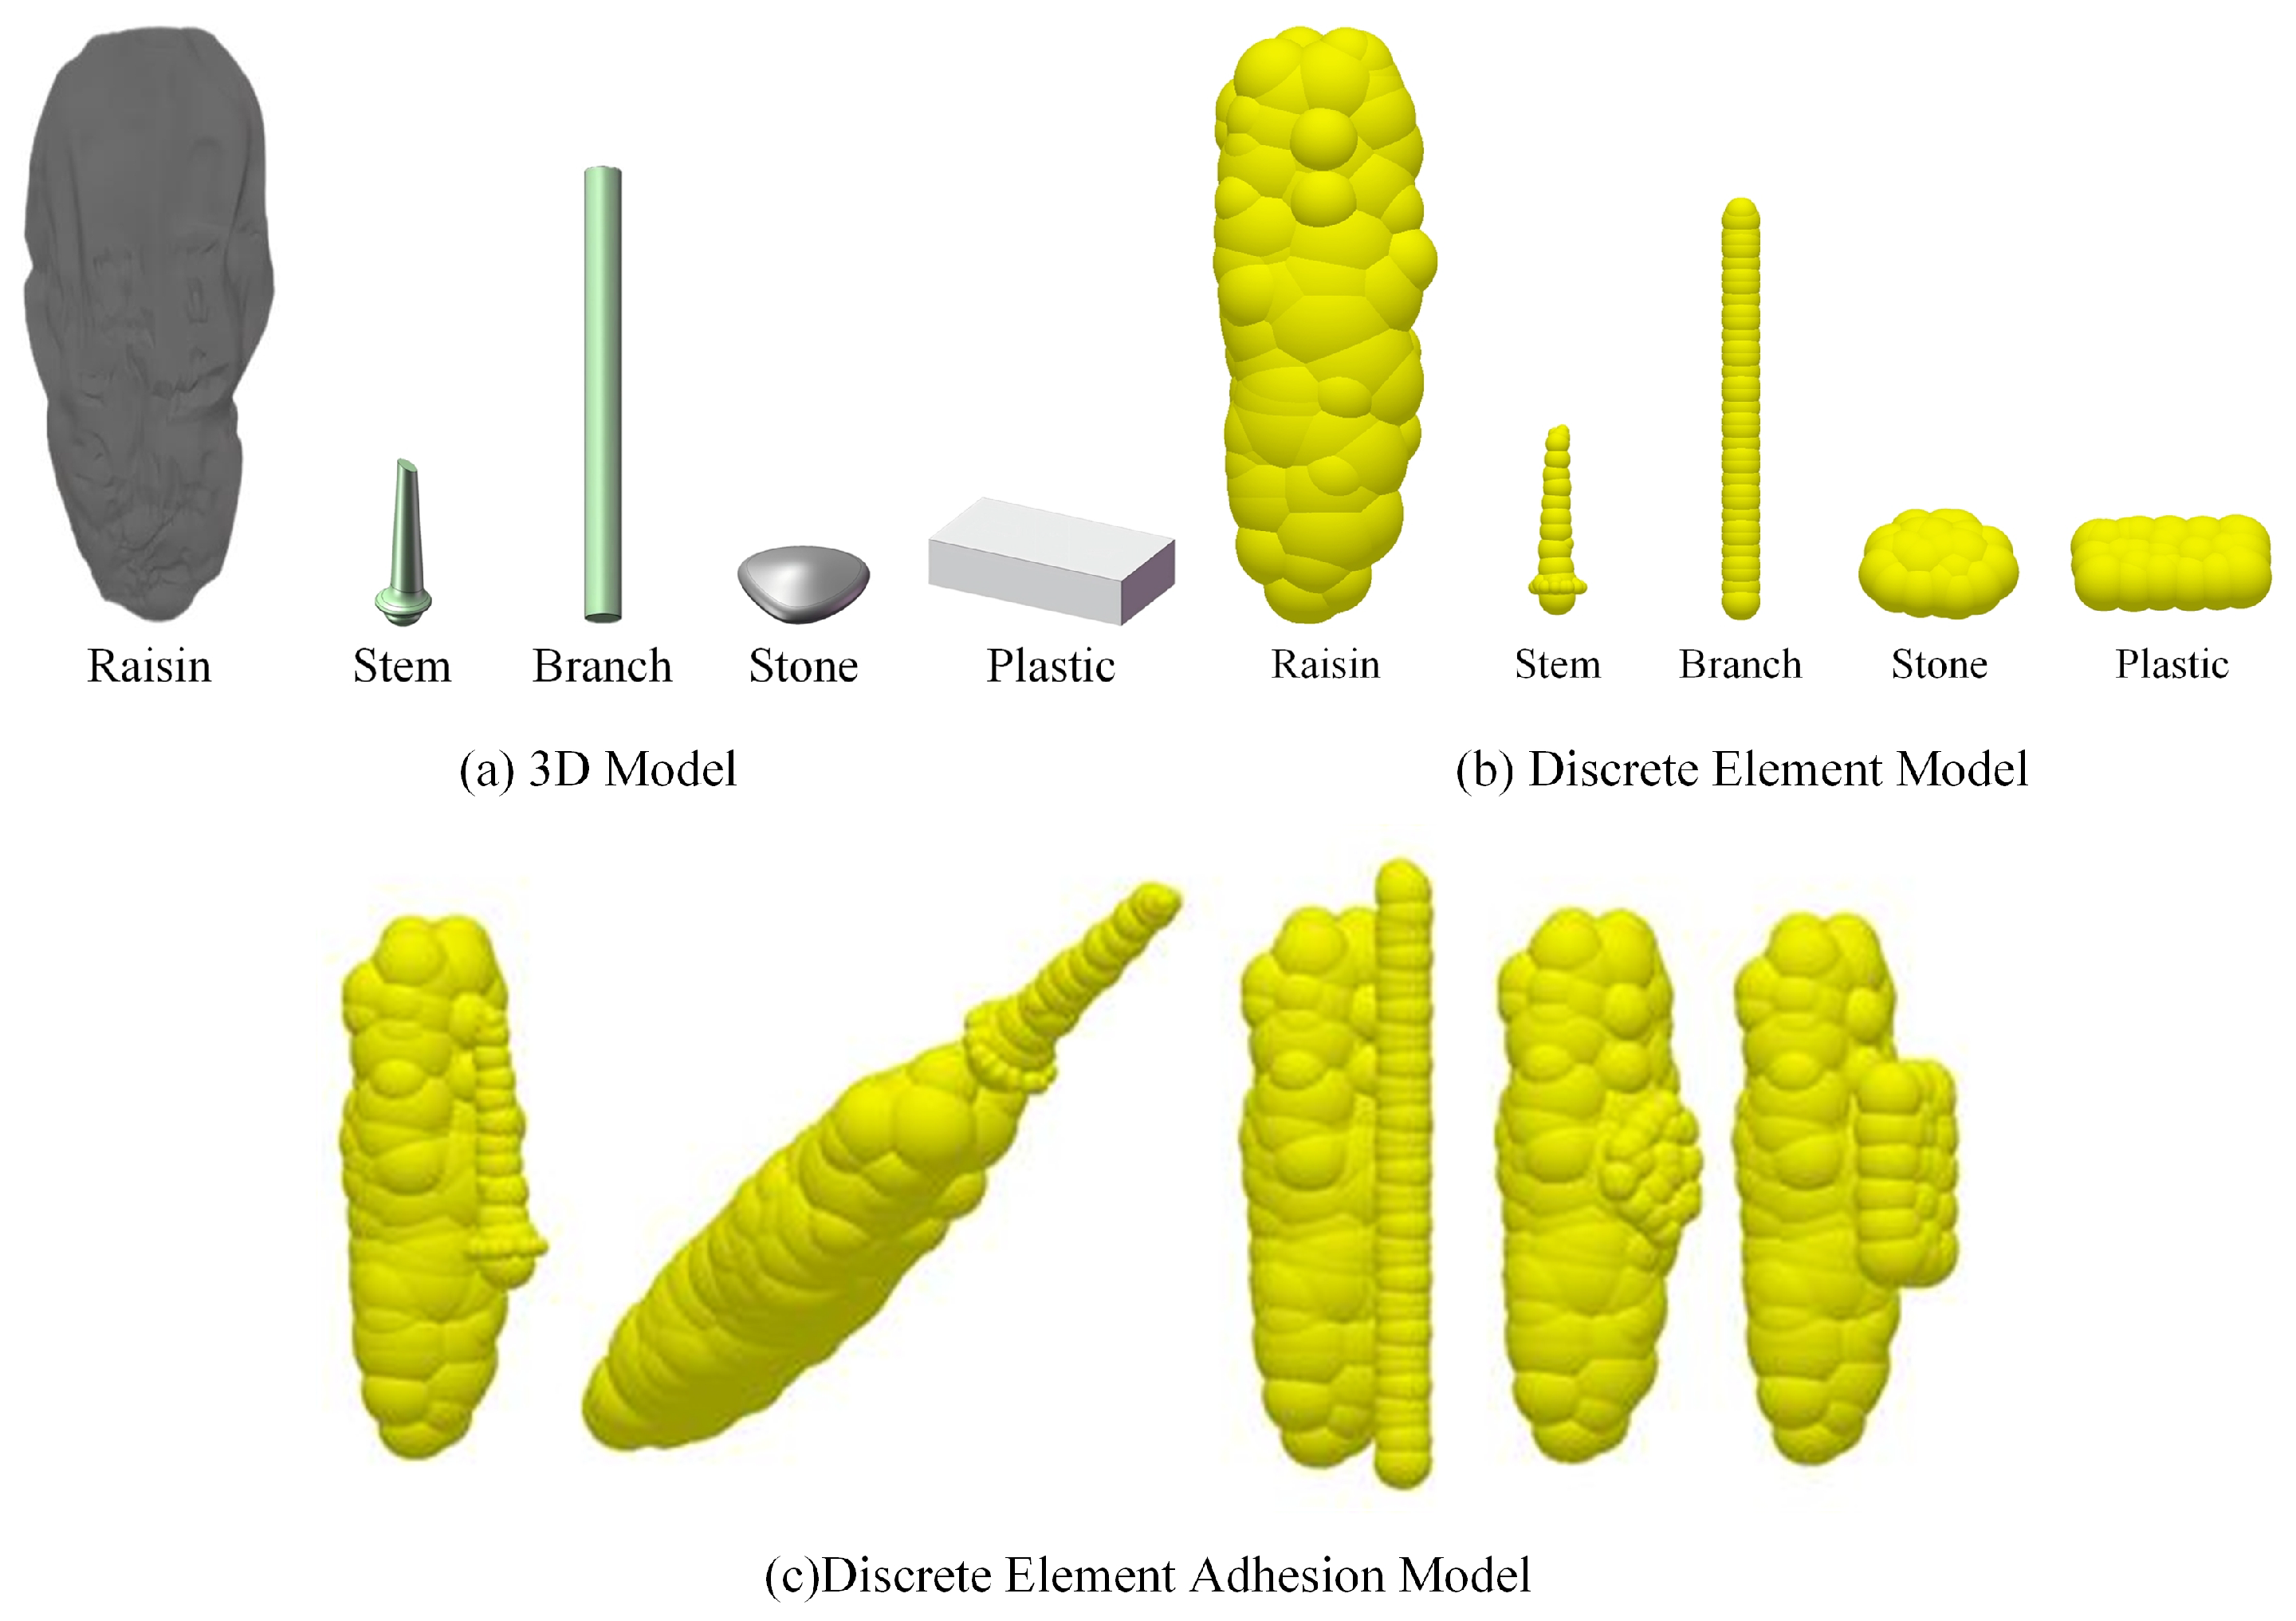
Figure 16.
Distinct material models. The discrete element model is used for EDEM simulation, while the discrete element adhesion model is used for EDEM-Fluent simulation.
Figure 16.
Distinct material models. The discrete element model is used for EDEM simulation, while the discrete element adhesion model is used for EDEM-Fluent simulation.
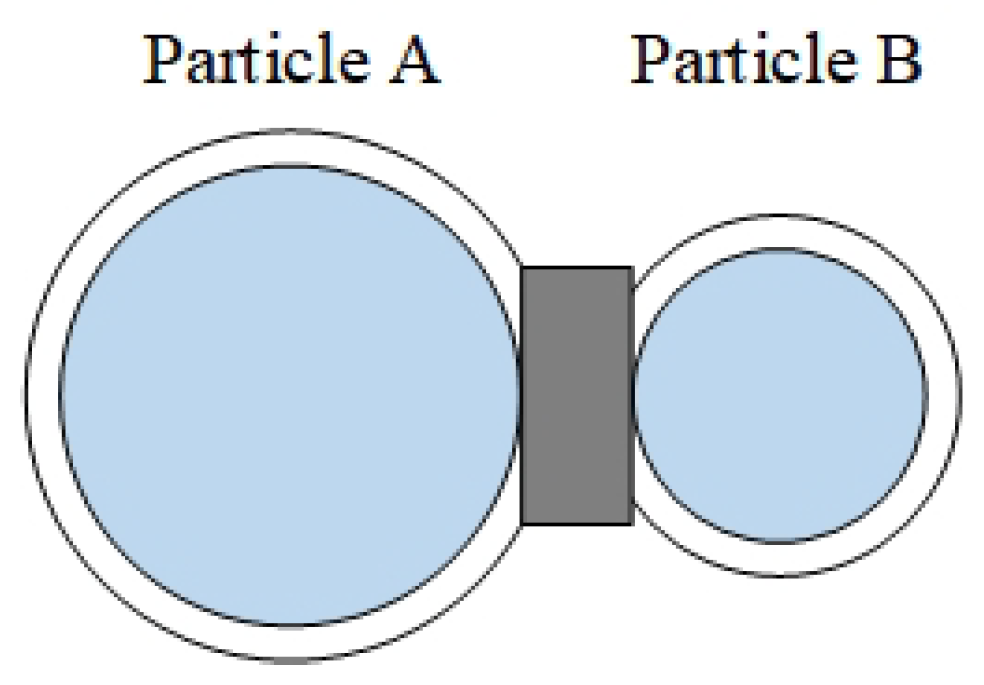
Figure 17.
Bonding contact model.
Figure 17.
Bonding contact model.
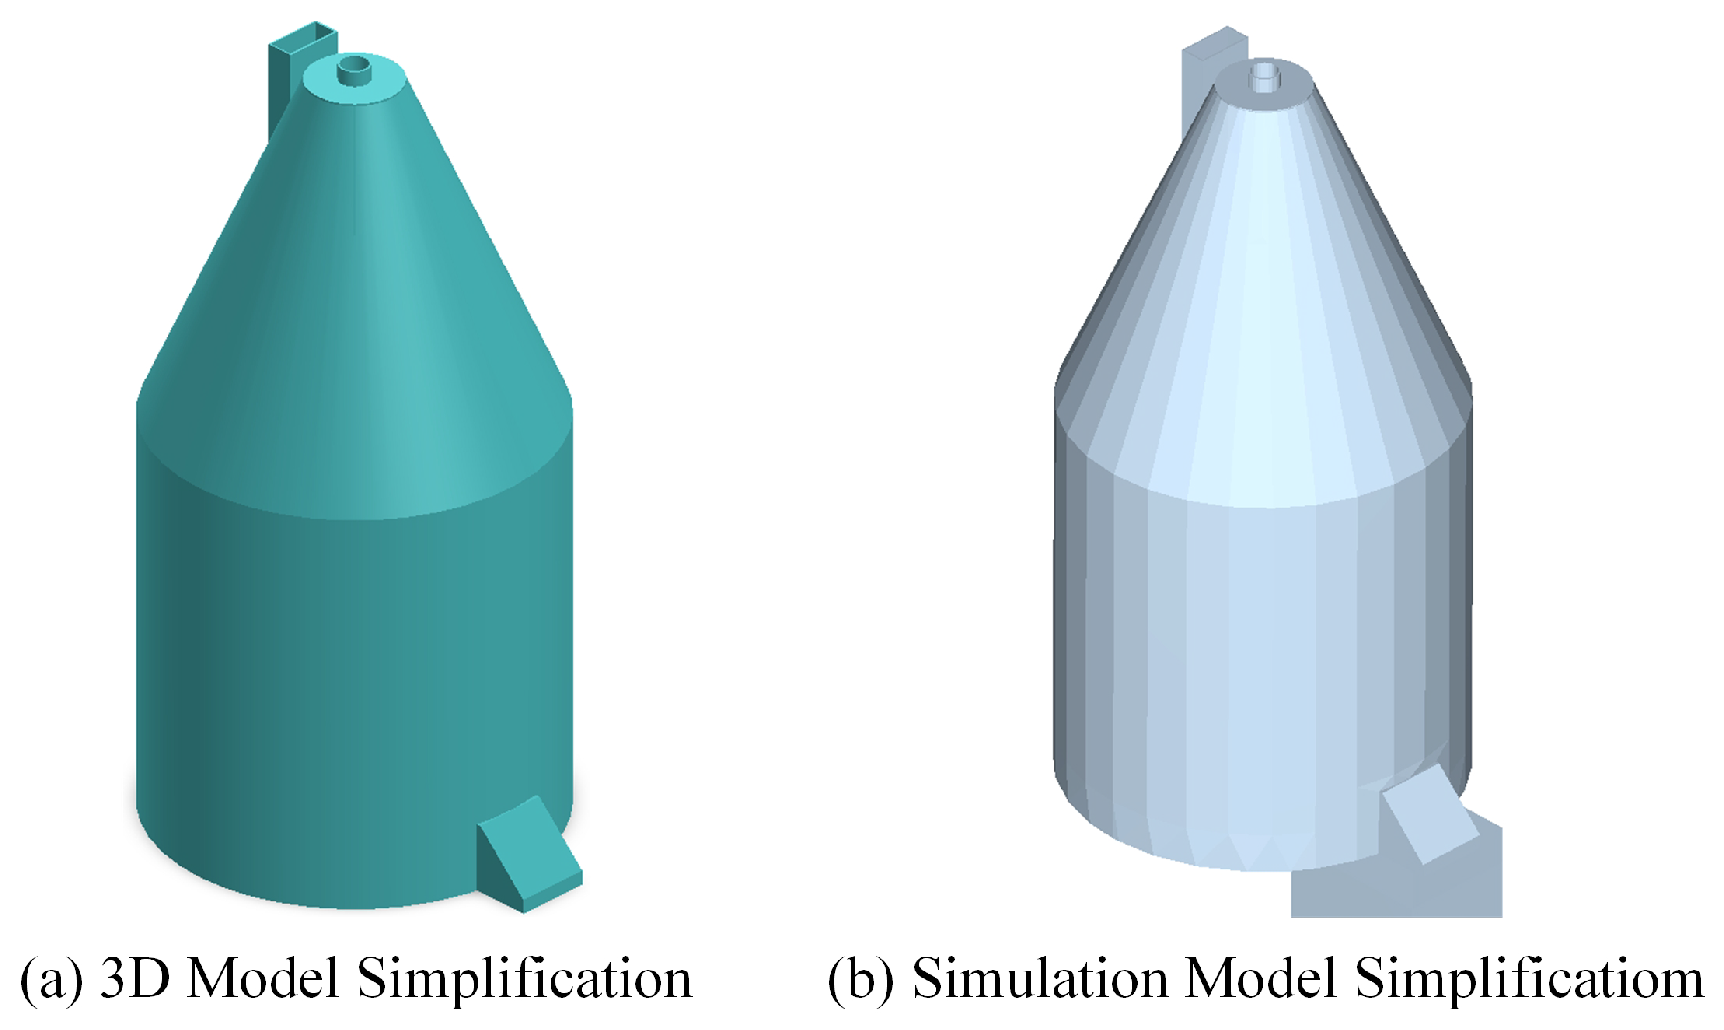
Figure 18.
Simplified model of the rolling extrusion module.
Figure 18.
Simplified model of the rolling extrusion module.
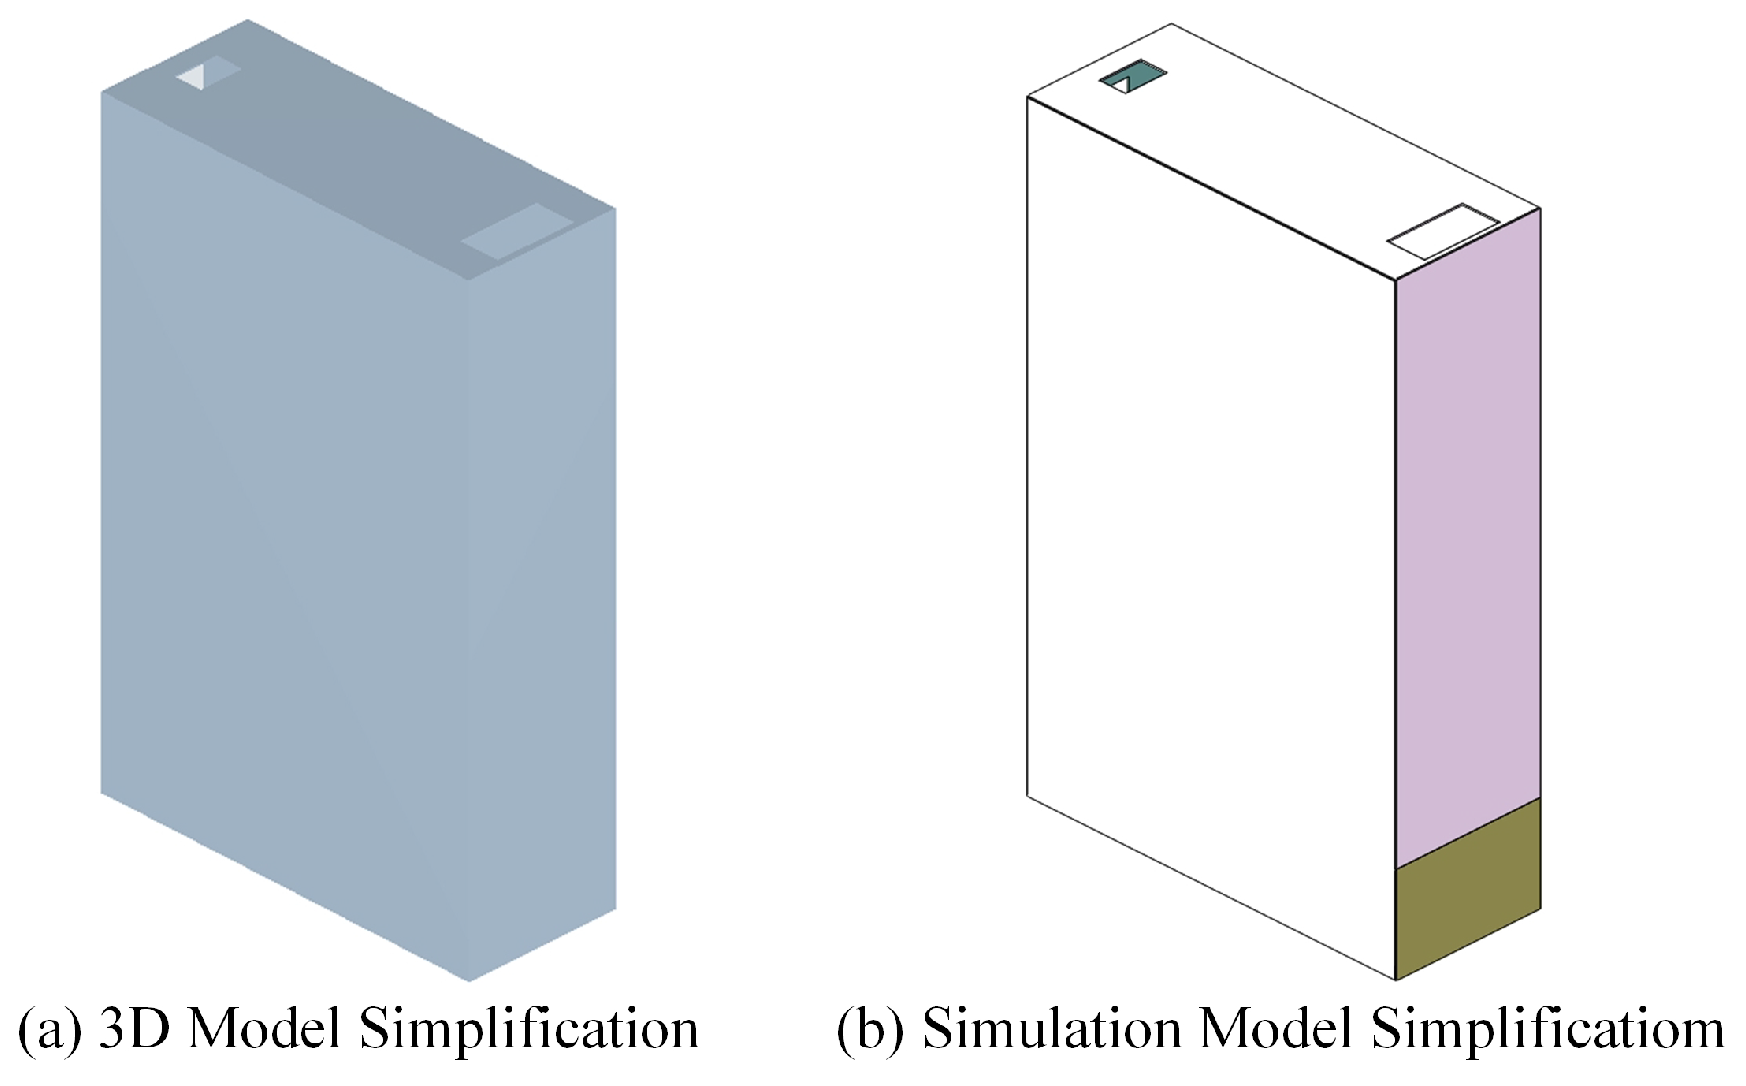
Figure 19.
Simplified model of the screening module.
Figure 19.
Simplified model of the screening module.
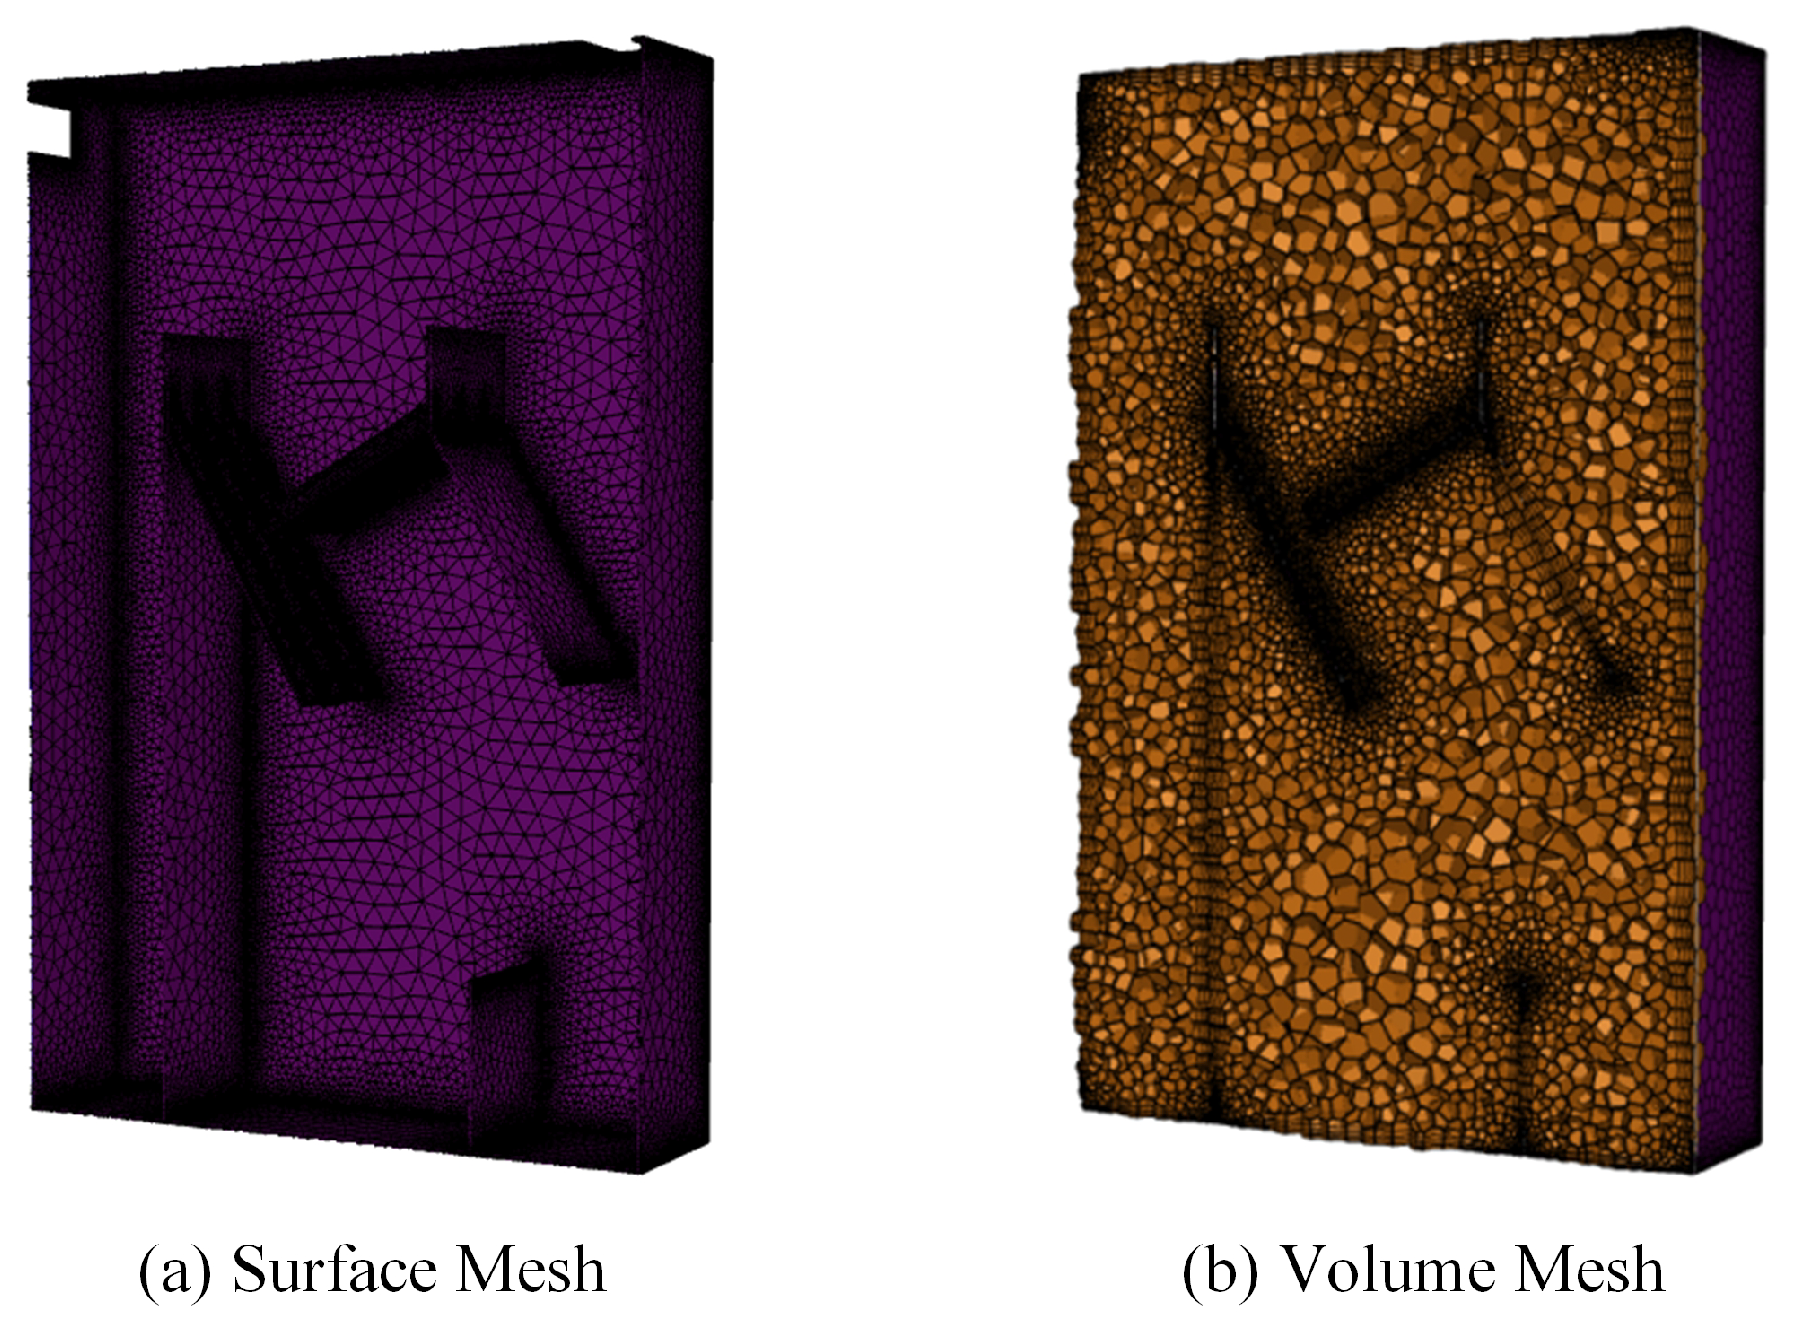
Figure 20.
Mesh generation for the screening module.
Figure 20.
Mesh generation for the screening module.
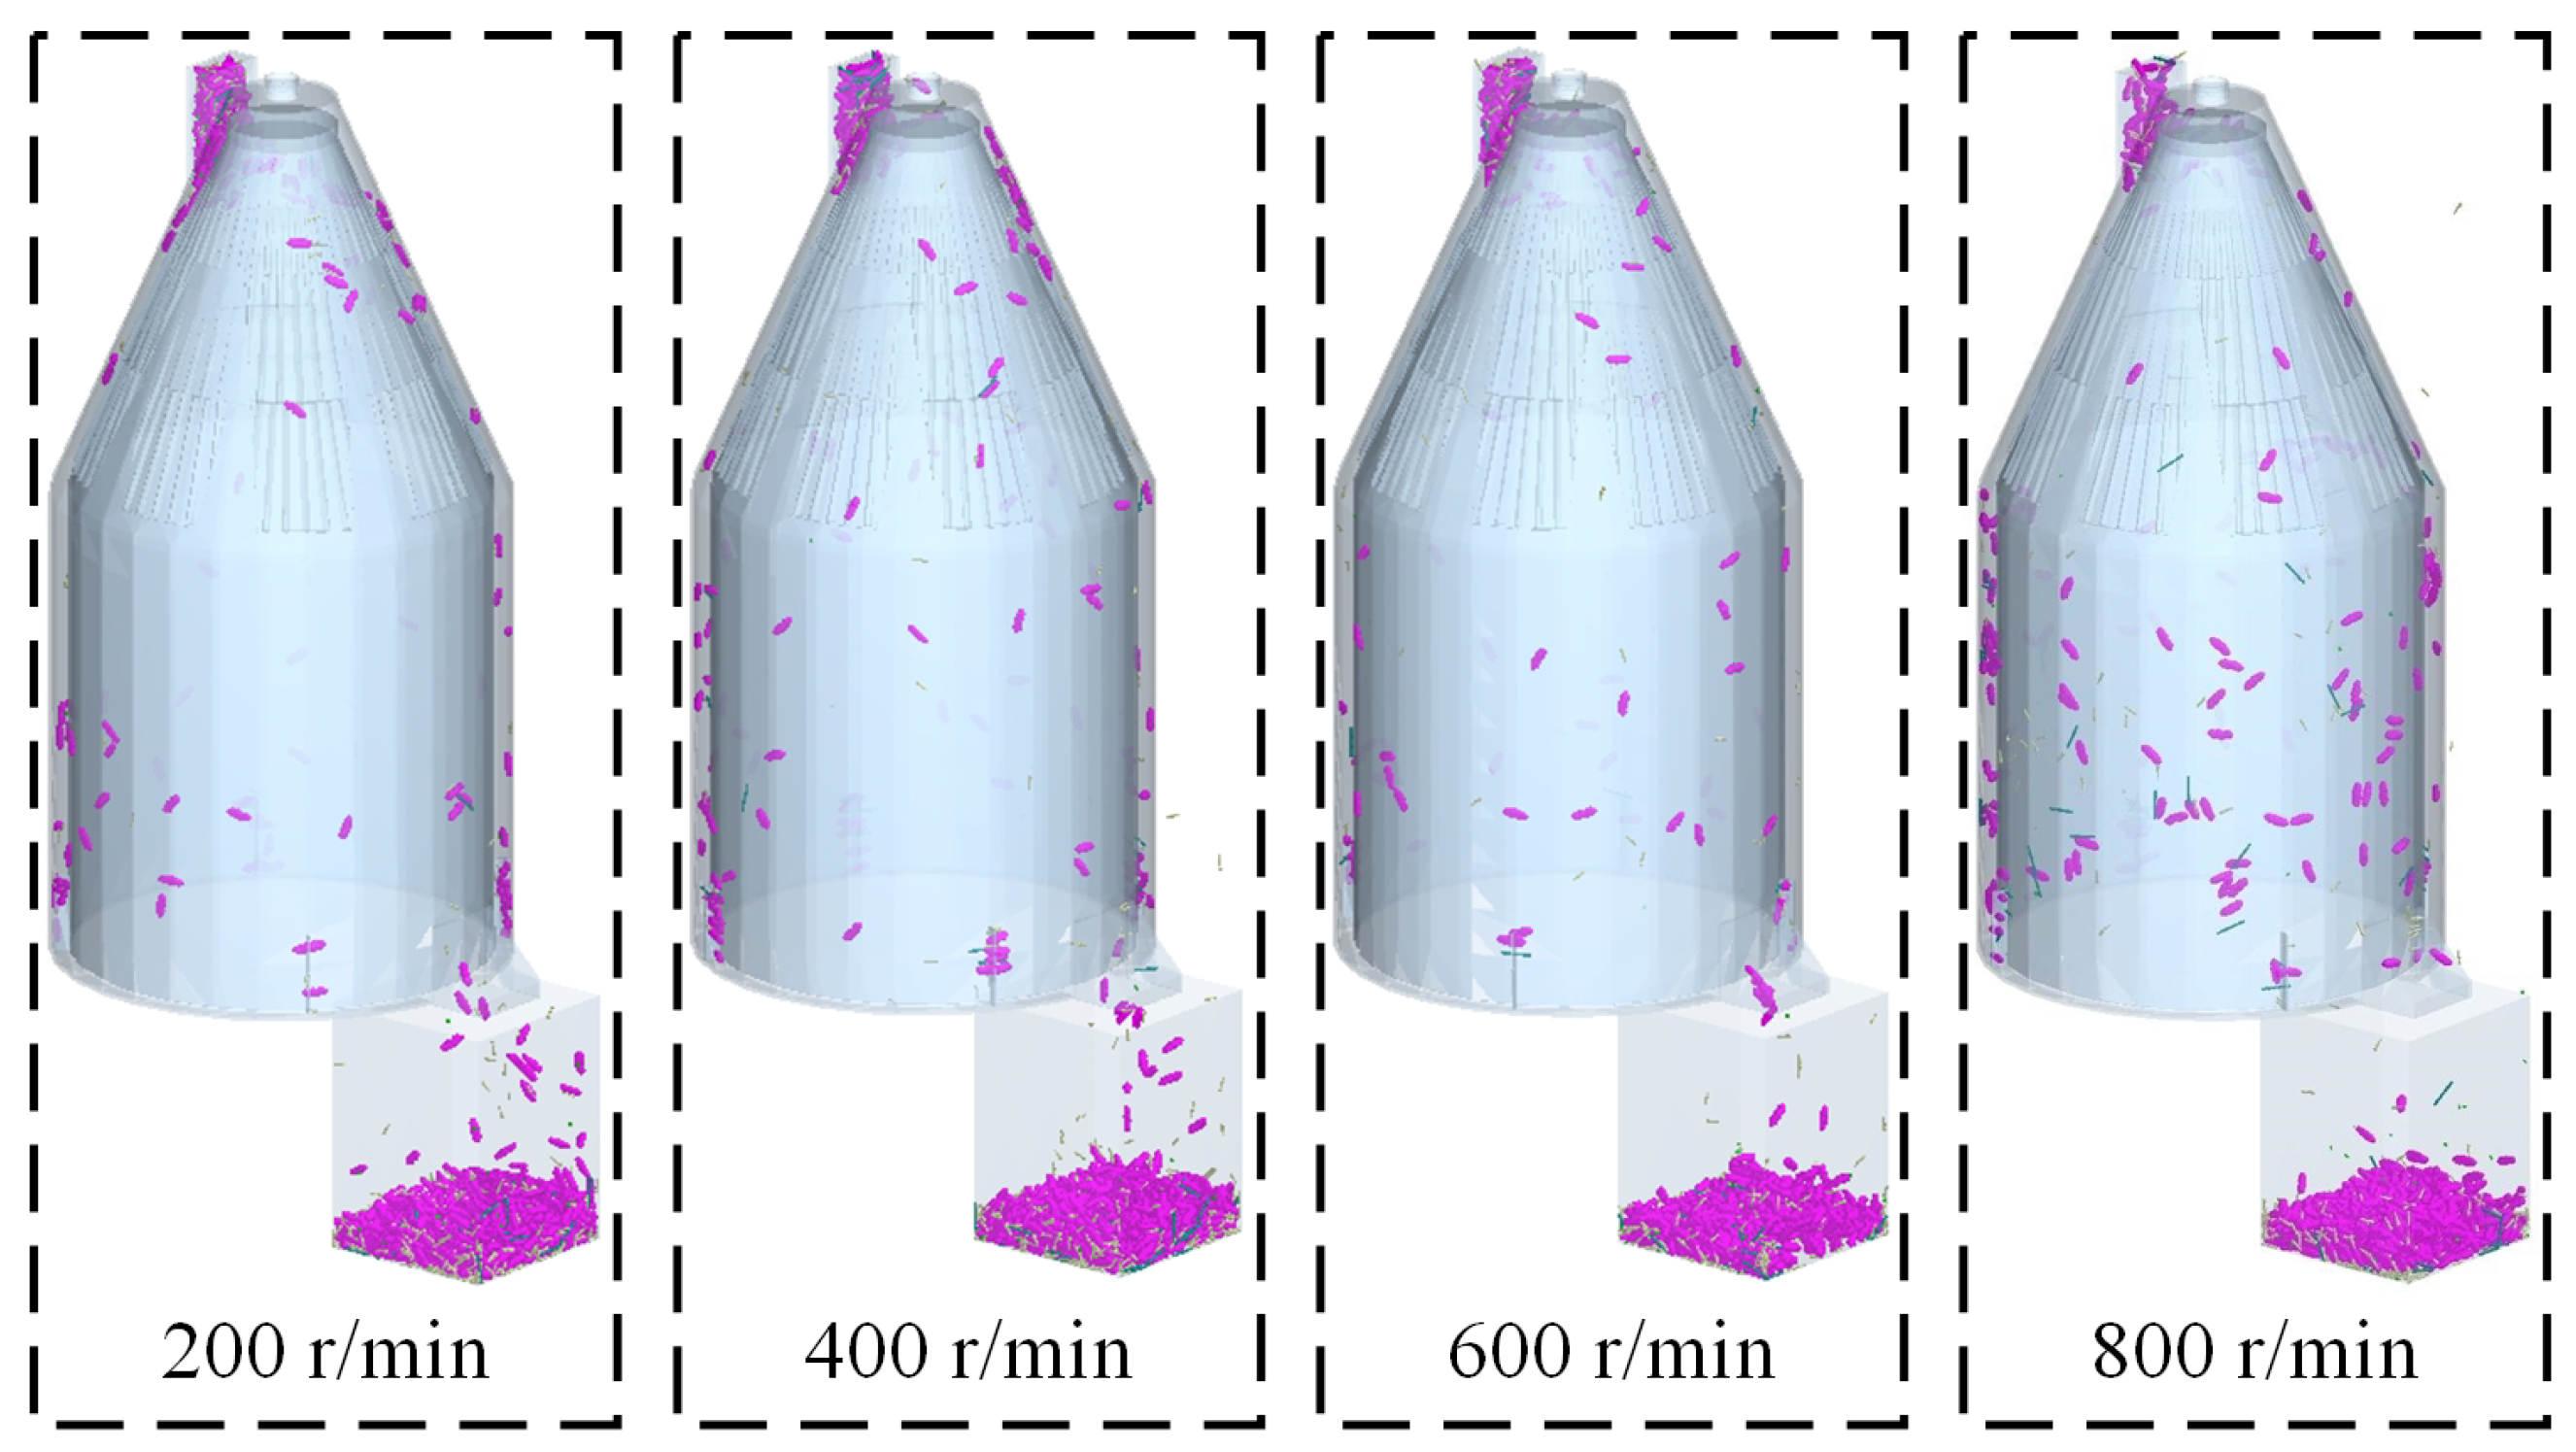
Figure 21.
Separation processes corresponding to different rotational speeds.
Figure 21.
Separation processes corresponding to different rotational speeds.
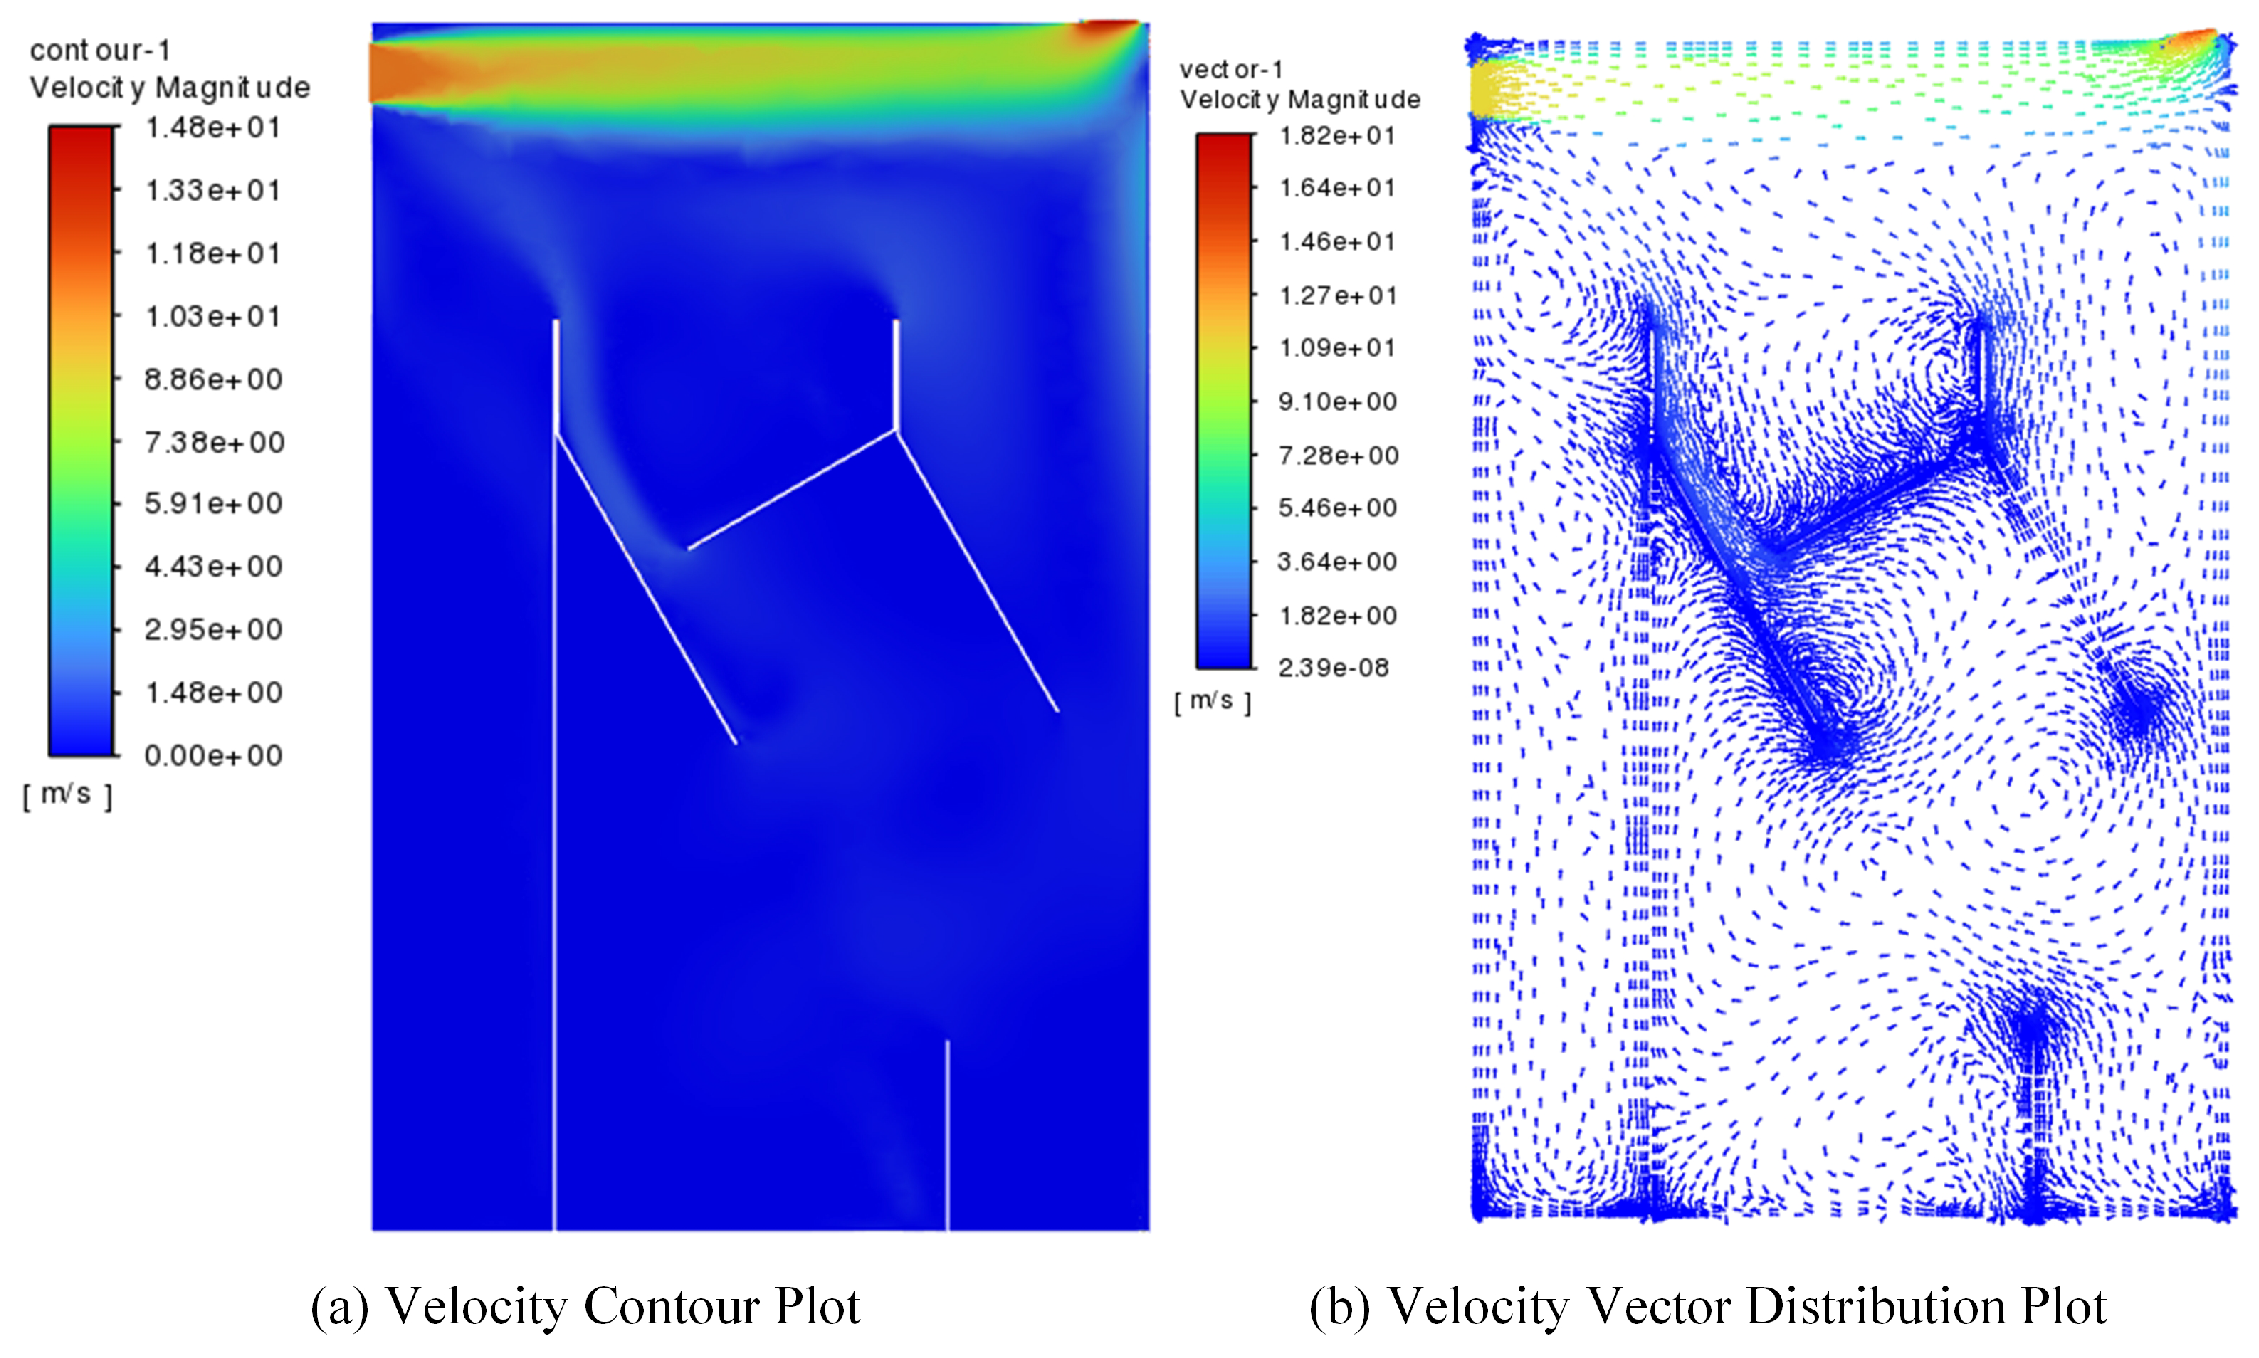
Figure 22.
Z-plane velocity contour plot.
Figure 22.
Z-plane velocity contour plot.
Figure 23.
Z-plane pressure contour plot.
Figure 23.
Z-plane pressure contour plot.
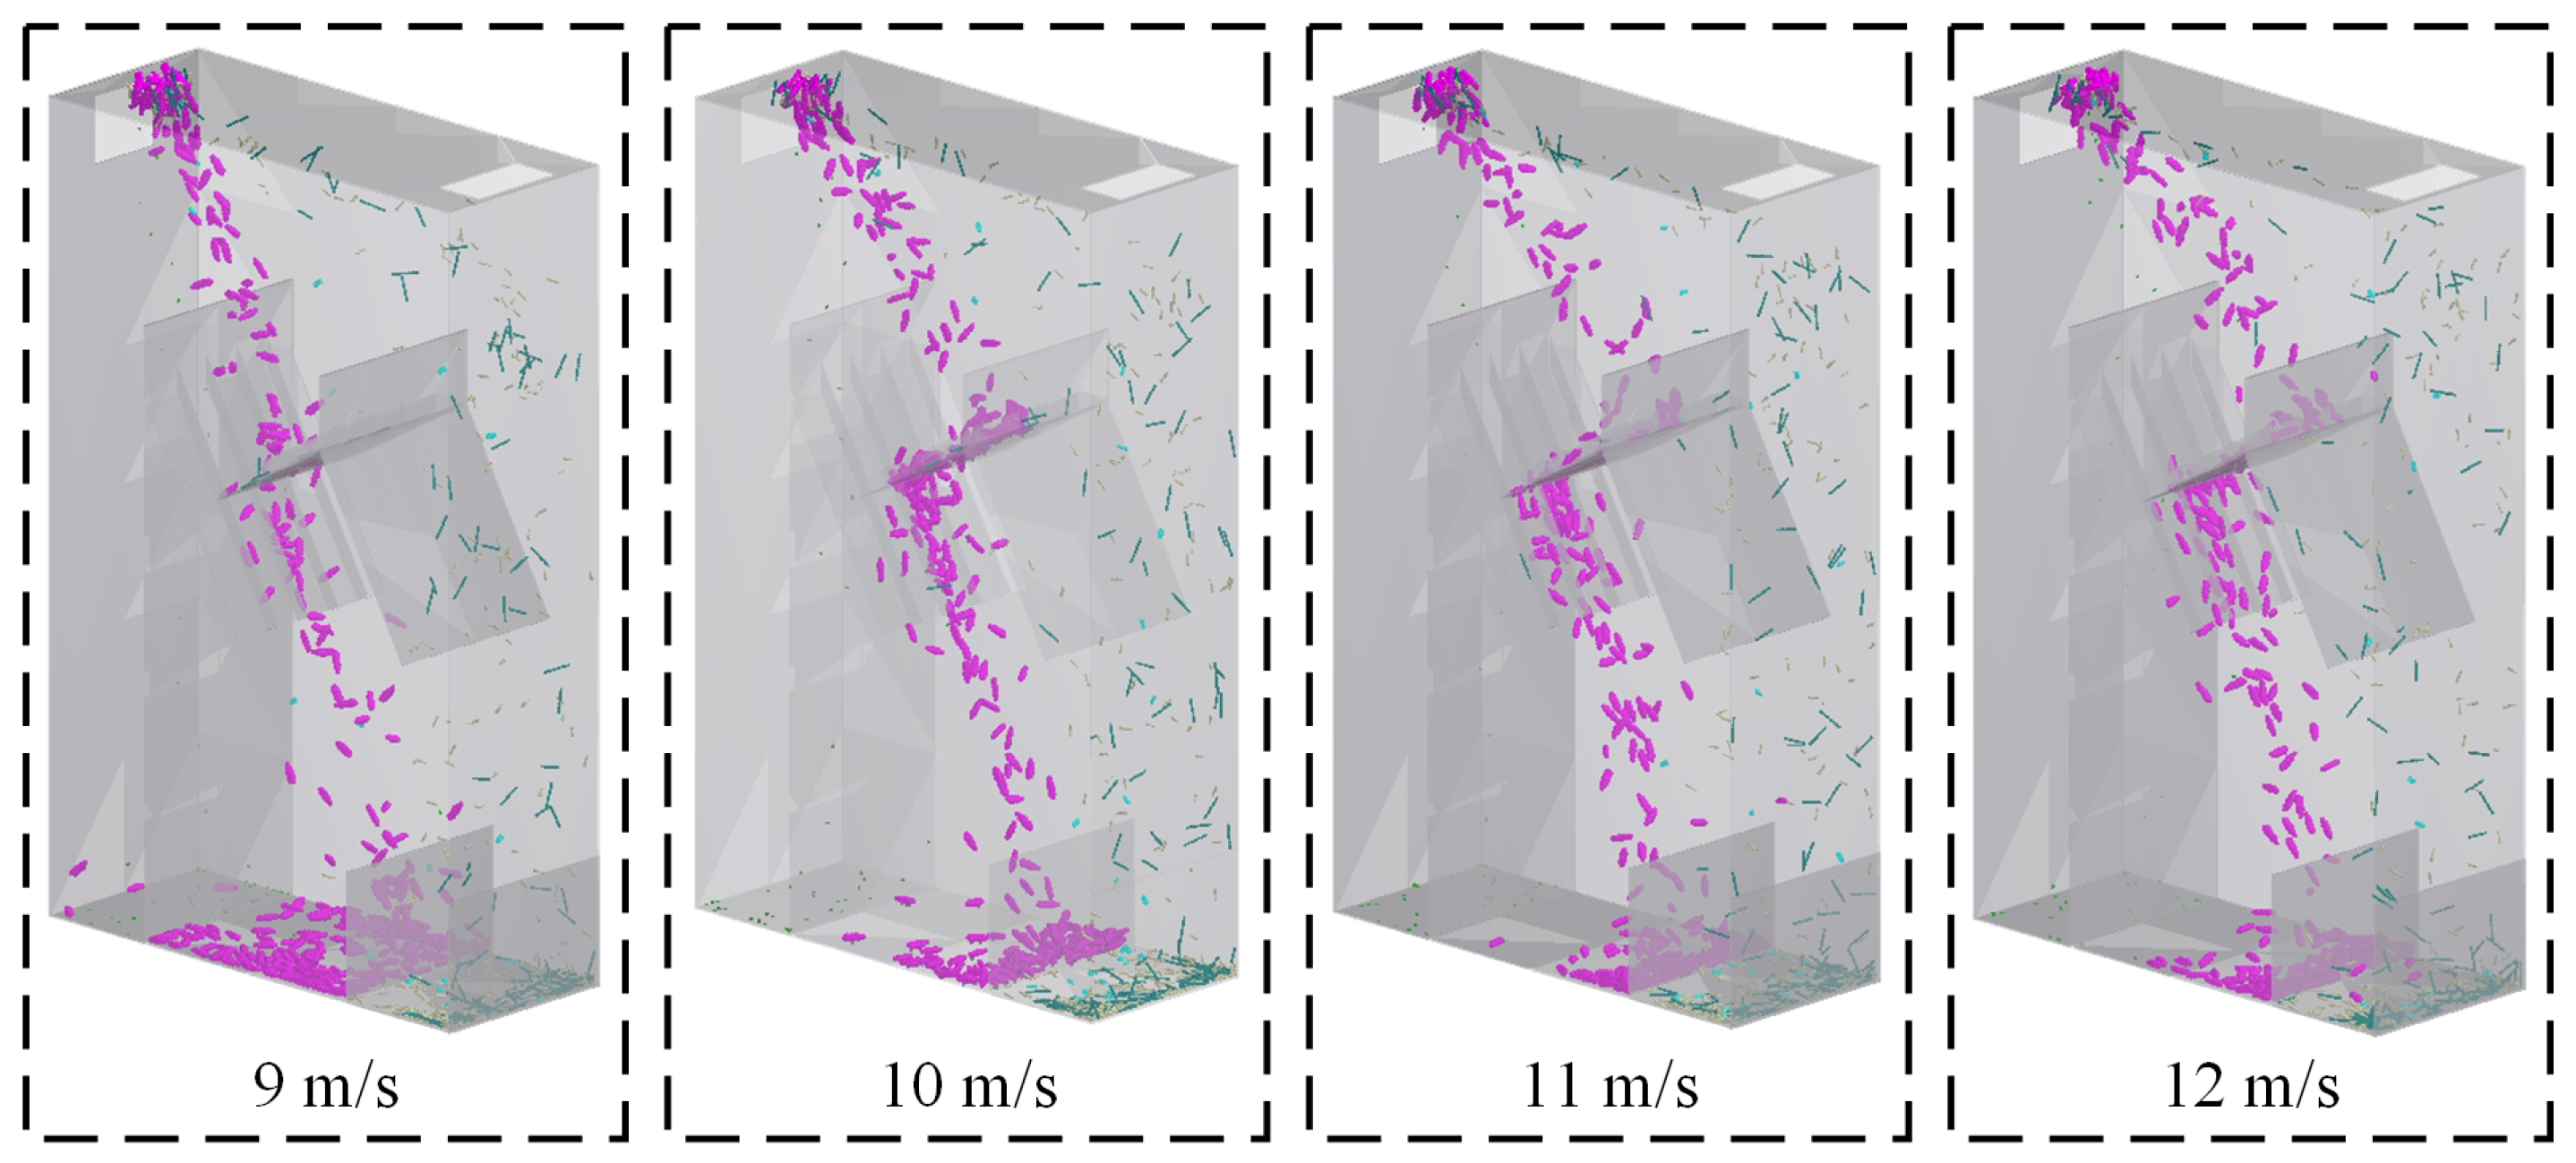
Figure 24.
Sieving processes corresponding to different airflow velocities.
Figure 24.
Sieving processes corresponding to different airflow velocities.
Figure 25.
Velocity variation of raisins and various foreign objects during screening process.
Figure 25.
Velocity variation of raisins and various foreign objects during screening process.
Figure 26.
Trajectory and velocity variation of raisins and various foreign objects during the screening process.
Figure 26.
Trajectory and velocity variation of raisins and various foreign objects during the screening process.
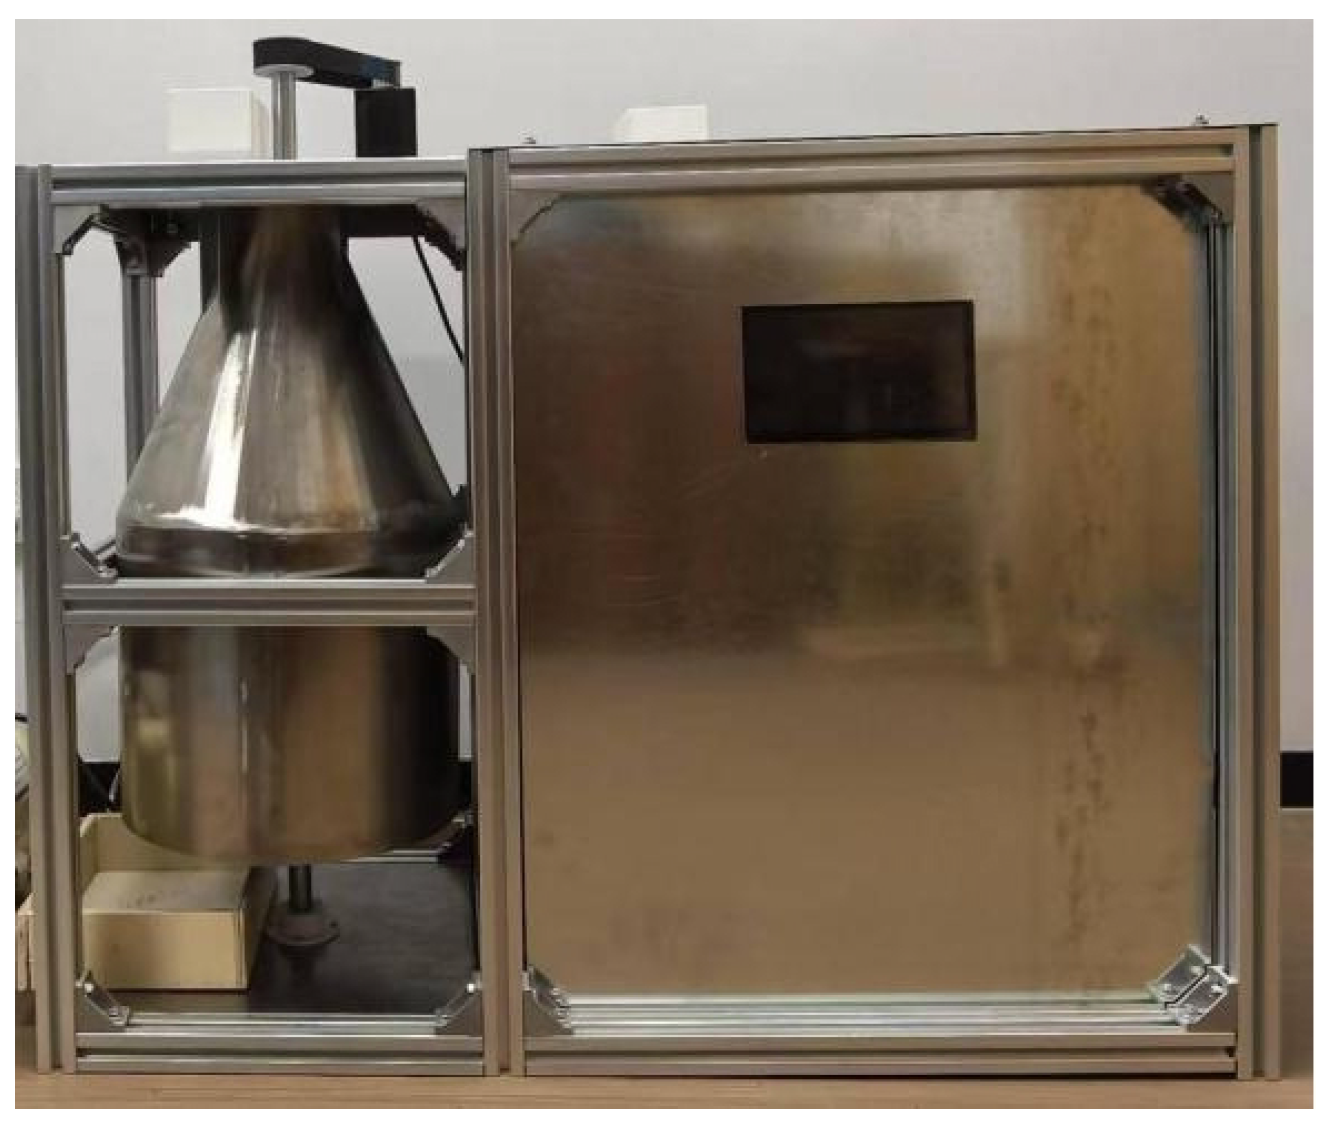
Figure 27.
Equipment for separating and removing adhered foreign objects from raisins.
Figure 27.
Equipment for separating and removing adhered foreign objects from raisins.
Figure 28.
Separation metrics under different motor rotational speeds.
Figure 28.
Separation metrics under different motor rotational speeds.
Figure 29.
Key sieving performance indicators under varying fan wind speed conditions.
Figure 29.
Key sieving performance indicators under varying fan wind speed conditions.
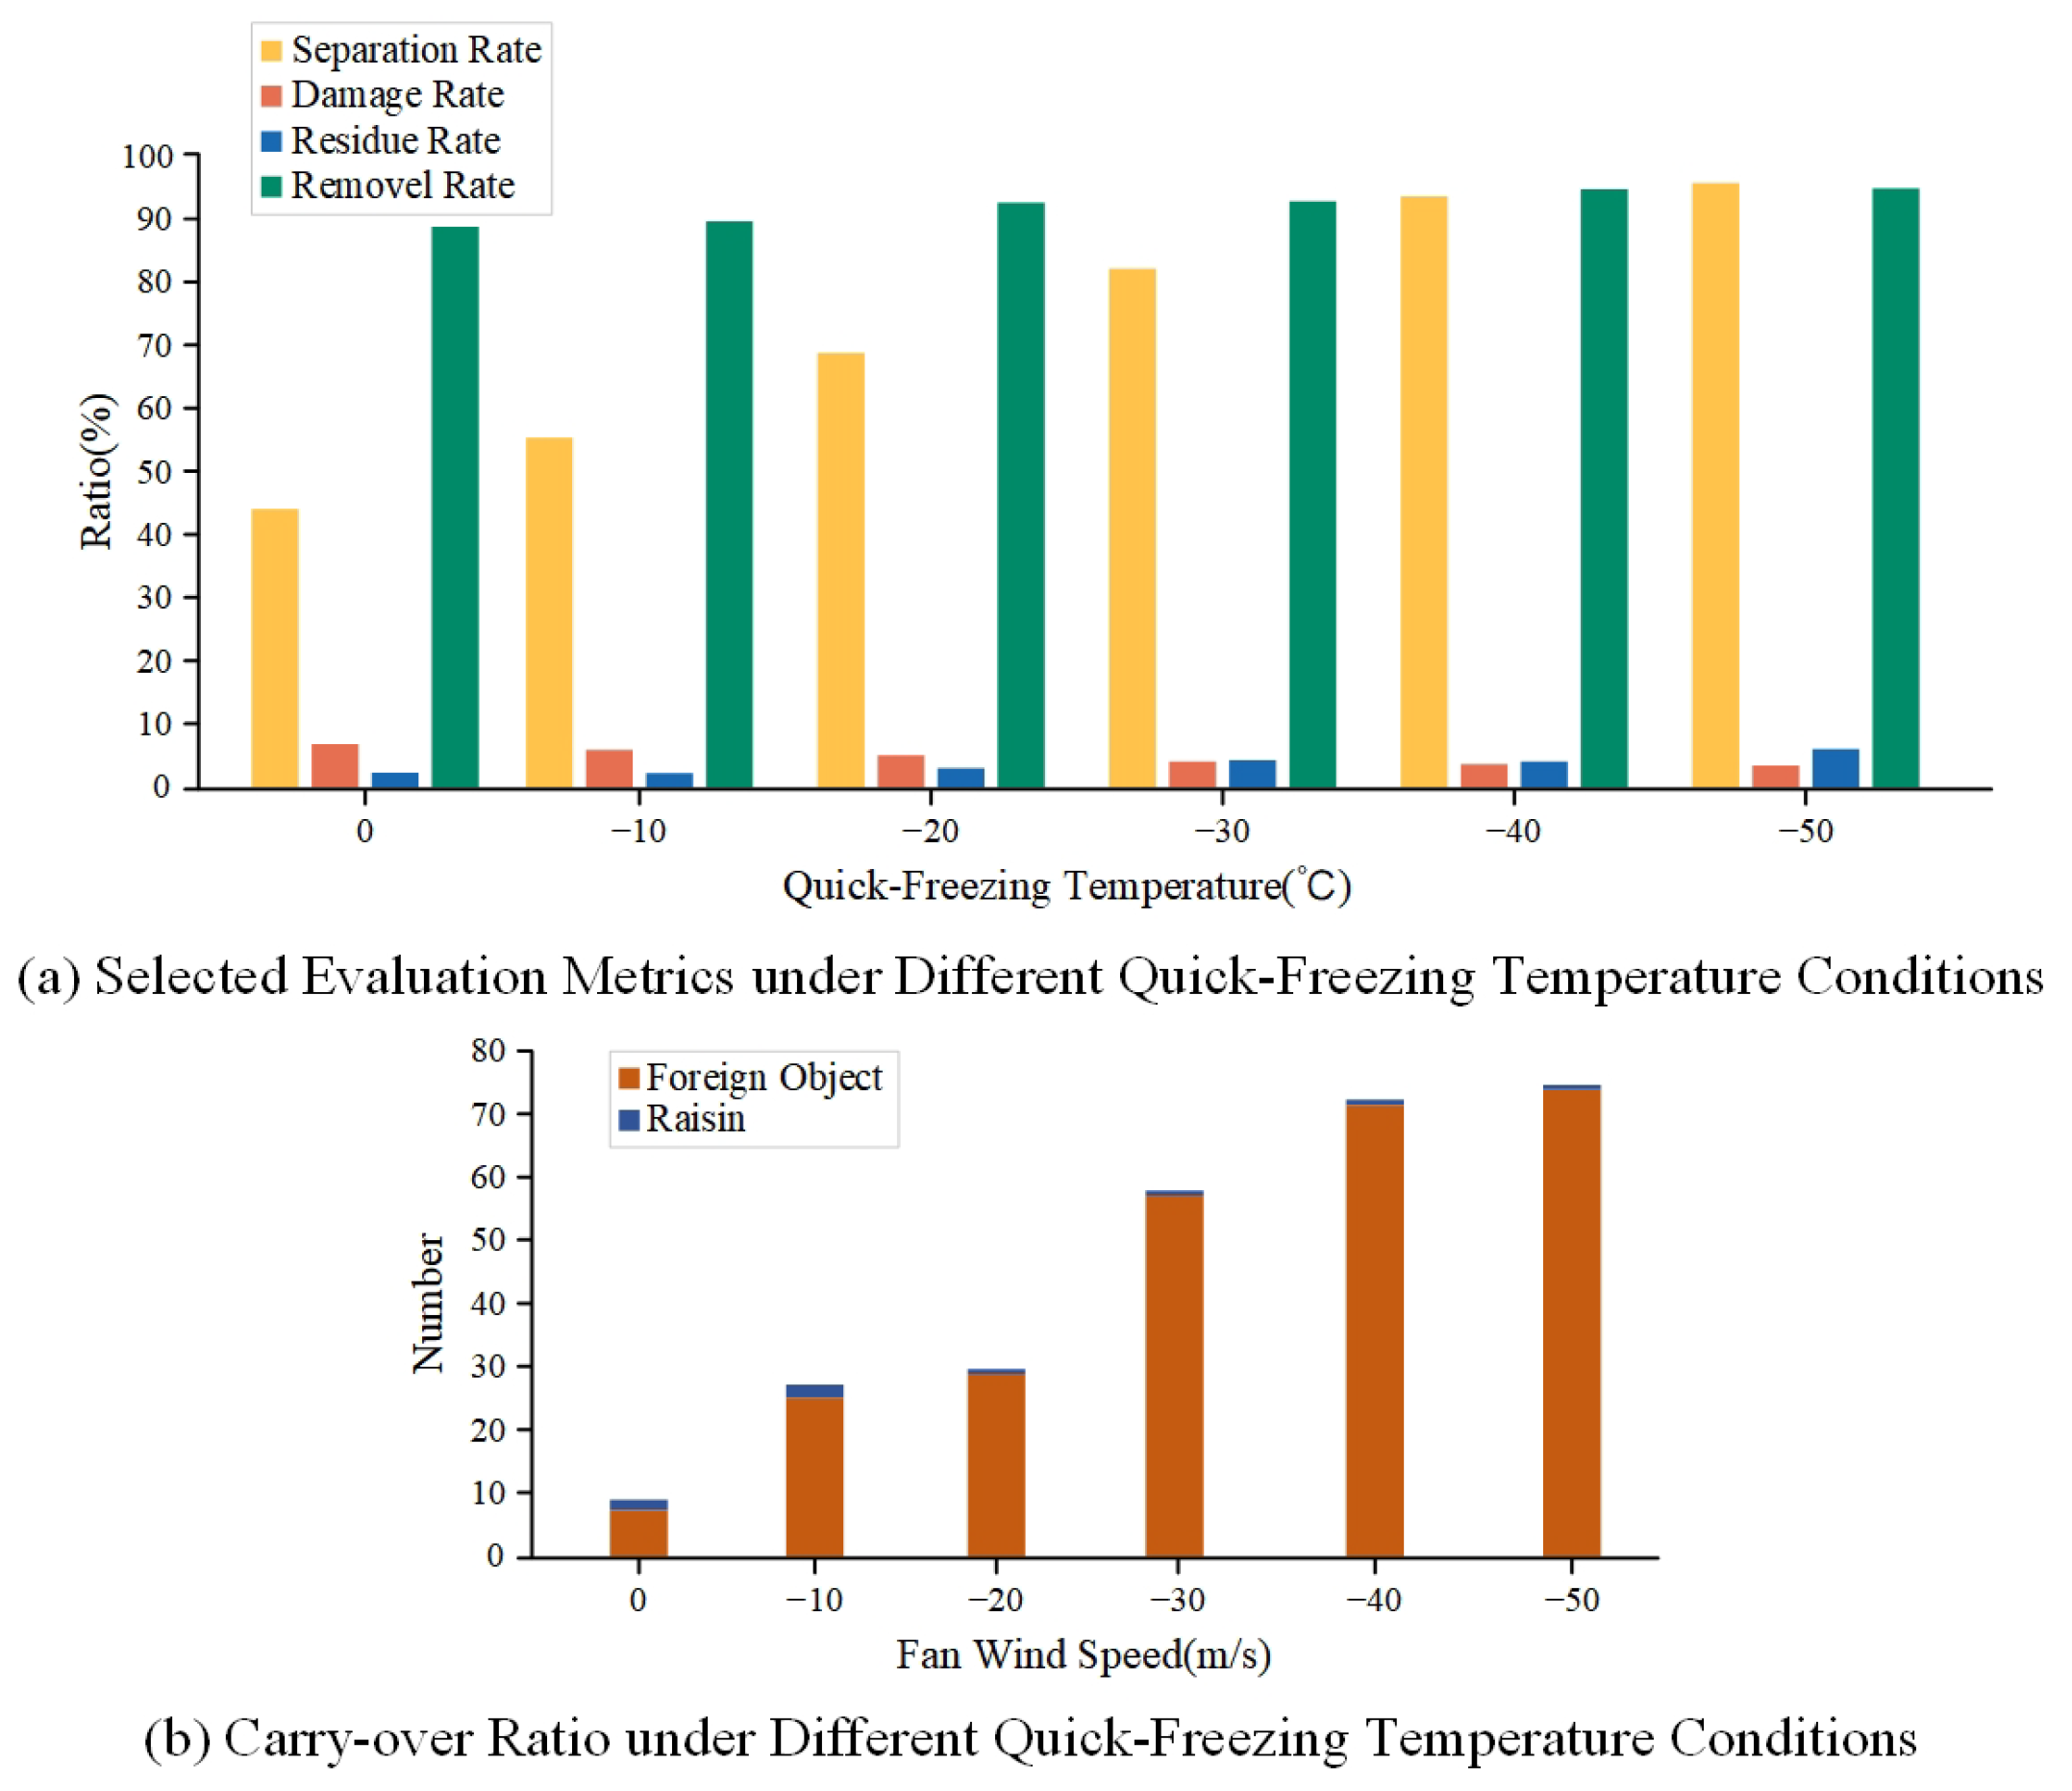
Figure 30.
Comprehensive Evaluation Metrics under Different Quick-Freezing Temperature Conditions.
Figure 30.
Comprehensive Evaluation Metrics under Different Quick-Freezing Temperature Conditions.
Figure 31.
Material Status After Separation Module Processing.
Figure 31.
Material Status After Separation Module Processing.
Figure 32.
Removal Effectiveness of the Raisin Foreign Object Sorting System.
Figure 32.
Removal Effectiveness of the Raisin Foreign Object Sorting System.
Table 1.
Size and mass parameters of raisins and associated foreign objects.
Table 1.
Size and mass parameters of raisins and associated foreign objects.
| Dimension Parameter | Raisin | Stem | Branch | Stone | Plastic |
|---|
| Length (mm) | 19.82 ± 1.85 | 8.61 ± 0.83 | 22.32 ± 6.73 | 3.87 ± 1.04 | 8.24 ± 1.24 |
| Breadth (mm) | 7.64 ± 1.24 | 1.27 ± 0.43 | 2.02 ± 1.24 | 3.87 ± 1.04 | 4.39 ± 0.64 |
| Height (mm) | 6.32 ± 1.02 | 1.27 ± 0.43 | 2.02 ± 1.24 | 3.21 ± 0.56 | 2.47 ± 0.34 |
| Weight (g) | 1.32 ± 0.21 | 0.11 ± 0.04 | 3.17 ± 0.33 | 3.27 ± 0.31 | 1.97 ± 0.31 |
Table 2.
Average hardness of raisins after rapid freezing (g).
Table 2.
Average hardness of raisins after rapid freezing (g).
| Quick-Freezing Temperature (°C) | 0-Day | 5-Day | 10-Day | 15-Day |
|---|
| 0 | 1360.34 | 1352.29 | 1323.46 | 1307.17 |
| −10 | 1742.53 | 1727.10 | 1709.89 | 1692.33 |
| −20 | 2125.62 | 2103.57 | 2074.23 | 2049.89 |
| −30 | 2483.92 | 2455.64 | 2422.12 | 2398.21 |
| −40 | 2697.77 | 2672.09 | 2646.67 | 2623.45 |
| −50 | 2727.14 | 2701.78 | 2679.90 | 2640.91 |
Table 3.
Average hardness of raisins after restoration to ambient temperature (g).
Table 3.
Average hardness of raisins after restoration to ambient temperature (g).
| Quick-Freezing Temperature (°C) | 0-Day | 5-Day | 10-Day | 15-Day |
|---|
| 0 | 1079.53 | 1073.17 | 1058.13 | 1041.18 |
| −10 | 1081.45 | 1077.33 | 1061.47 | 1046.09 |
| −20 | 1084.78 | 1082.89 | 1064.08 | 1049.45 |
| −30 | 1085.59 | 1080.21 | 1068.76 | 1055.72 |
| −40 | 1086.71 | 1083.91 | 1070.22 | 1057.33 |
| −50 | 1090.46 | 1083.91 | 1071.80 | 1063.61 |
Table 4.
Density of raisins and foreign objects.
Table 4.
Density of raisins and foreign objects.
| Materials | Raisin | Stem | Branch | Stone | Plastic |
|---|
| Density (kg/) | 900 | 89 | 89 | 2500 | 910 |
Table 5.
Physical property parameters of materials.
Table 5.
Physical property parameters of materials.
| Dimension Parameter | Raisin | Stem | Branch | Stone | Stone |
|---|
| Length (mm) | 19.82 ± 1.85 | 8.61 ± 0.83 | 22.32 ± 6.73 | 3.87 ± 1.04 | 8.24 ± 1.24 |
| Breadth (mm) | 7.64 ± 1.24 | 1.27 ± 0.43 | 2.02 ± 1.24 | 3.87 ± 1.04 | 4.39 ± 0.64 |
| Height (mm) | 6.32 ± 1.02 | 1.27 ± 0.43 | 2.02 ± 1.24 | 3.21 ± 0.56 | 2.47 ± 0.34 |
| Weight (g) | 1.32 ± 0.21 | 0.11 ± 0.04 | 3.17 ± 0.33 | 3.27 ± 0.31 | 1.97 ± 0.31 |
Table 6.
Friction coefficient between materials.
Table 6.
Friction coefficient between materials.
| Materials | Static Friction Coefficient | Dynamic Friction Coefficient |
|---|
| Raisin–Raisin | 0.50 | 0.04 |
| Raisin–Stem/Branch | 0.52 | 0.20 |
| Raisin–Stone | 0.50 | 0.02 |
| Raisin–Plastic | 0.50 | 0.04 |
| Raisin–Stainless steel | 0.45 | 0.12 |
| Stem/Branch–Stem/Branch | 0.58 | 0.25 |
| Stem/Branch–Stone | 0.45 | 0.08 |
| Stem/Branch–Plastic | 0.52 | 0.08 |
| Stem/Branch–Stainless steel | 0.47 | 0.10 |
| Stone–Stone | 0.43 | 0.05 |
| Stone–Plastic | 0.45 | 0.02 |
| Stone–Stainless steel | 0.45 | 0.11 |
| Plastic–Plastic | 0.52 | 0.15 |
| Plastic–Stainless steel | 0.45 | 0.12 |
Table 7.
Quantity of raisin particles and raisin particles with adhered foreign objects in the collection bin at different rotational speeds.
Table 7.
Quantity of raisin particles and raisin particles with adhered foreign objects in the collection bin at different rotational speeds.
| Rotational Speed (r/min) | Number of Raisin Particles Free from Adhered Foreign Objects | Number of Raisin Particles with Adhered Foreign Objects |
|---|
| 200 | 338 | 523 |
| 400 | 872 | 35 |
| 600 | 856 | 4 |
| 800 | 869 | 0 |
Table 8.
The number of raisin particles in each channel under different wind speeds.
Table 8.
The number of raisin particles in each channel under different wind speeds.
| Wind Speed (m/s) | Heavy Foreign Object Passage | Raisin Channel | Less Severe Foreign Object Passage |
|---|
| 9 | 8 | 247 | 0 |
| 10 | 3 | 242 | 0 |
| 11 | 0 | 245 | 0 |
| 12 | 0 | 246 | 7 |
Table 9.
Particle counts of various foreign matters in each channel under different wind speeds.
Table 9.
Particle counts of various foreign matters in each channel under different wind speeds.
| Wind Speed | Heavy Foreign Object Passage | Raisin Passage | Lighter Foreign Object Passage |
|---|
| (m/s) | Stem | Branch | Stone | Plastic | Stem | Branch | Stone | Plastic | Stem | Branch | Stone | Plastic |
|---|
| 9 | 0 | 0 | 45 | 0 | 5 | 14 | 0 | 18 | 230 | 98 | 0 | 10 |
| 10 | 0 | 0 | 41 | 0 | 3 | 8 | 2 | 5 | 232 | 109 | 0 | 21 |
| 11 | 0 | 0 | 45 | 0 | 2 | 2 | 4 | 1 | 235 | 109 | 0 | 20 |
| 12 | 0 | 0 | 34 | 0 | 4 | 0 | 16 | 0 | 227 | 110 | 0 | 16 |

