Article

Stress Development in Droplet Impact Analysis of Rain Erosion Damage on Wind Turbine Blades: A Review of Liquid-to-Solid Contact Conditions

by
Quentin Laplace Oddo
1,
Quaiyum M. Ansari
1,2,*,
Fernando Sánchez
3,
Leon Mishnaevsky, Jr.
4 and
Trevor M. Young
1,*
1
Bernal Institute, School of Engineering, University of Limerick, V94 T9PX Limerick, Ireland
2
Department of Aerospace and Mechanical Engineering, South East Technological University, Kilkenny Road, R93 V960 Carlow, Ireland
3
Institute of Design, Innovation and Technology (IDIT), Universidad Cardenal Herrera-CEU, CEU Universities, 46113 Moncada, Spain
4
Department of Wind Energy, Risø Campus, Technical University of Denmark, Frederiksborgvej 399, 4000 Roskilde, Denmark
*
Authors to whom correspondence should be addressed.
Appl. Sci. 2025, 15(15), 8682; https://doi.org/10.3390/app15158682
Submission received: 19 May 2025 / Revised: 15 July 2025 / Accepted: 25 July 2025 / Published: 6 August 2025

Abstract

The wind energy sector is experiencing substantial growth, with global wind turbine capacity increasing and projected to expand further in the coming years. However, rain erosion on the leading edges of turbine blades remains a significant challenge, affecting both aerodynamic efficiency and structural longevity. The associated degradation reduces annual energy production and leads to high maintenance costs due to frequent inspections and repairs. To address this issue, researchers have developed numerical models to predict blade erosion caused by water droplet impacts. This study presents a finite element analysis model in Abaqus to simulate the interaction between a single water droplet and wind turbine blade material. The novelty of this model lies in evaluating the influence of several parameters on von Mises and S33 peak stresses in the leading-edge protection, such as friction coefficient, type of contact, impact velocity, and droplet diameter. The findings provide insights into optimising LEP numerical models to simulate rain erosion as closely as possible to real-world scenarios.

1. Introduction

Rain erosion damage, resulting from repeated droplet impact on wind turbine blades, is a significant issue, particularly at offshore sites with larger blades and higher tip speeds. Erosion on wind turbine blade leading edge surfaces occurs throughout the entire lifespan of all blades under operational conditions. The repeated impact of liquid droplets and solid material particles creates a form of material wear. It may cause surface erosion or initially surface pits that progress to crack propagation in the leading edge protection (LEP) material or at critical composite interfaces [1], as shown in Figure 1. The damage can alter the surface of the blade, which modifies its aerodynamic profile and significantly reduces the annual energy production of the turbine. It creates an unbalanced behaviour increasing the drag and reducing the lift effect of the wind on the blade [2]. According to Mishnaevsky et al. [3], erosion damage has been shown to represent the highest loss in aerodynamic performance, which reduces the economic attractiveness of the technology.
Analysts from the U.S Department of Energy forecast a constant increase in the size and height of wind turbines [4]. Indeed, wind turbines use the kinetic energy from the wind to convert it into mechanical energy, producing consumable electricity. Since the wind tends to increase with altitude, the wind turbines are getting more-and-more enormous, especially in offshore farms [4,5]. Increasing the size of each turbine also helps reduce the number of turbines per farm, mitigating significantly the frequency of the maintenance operations and therefore decreasing the levelized cost of wind energy (LCEO) [6]. Sareen et al. [7] estimate a reduction in annual energy production (AEP) ranging from 5% for low erosion to 25% for high erosion. This loss would represent a financial loss of 75 million euros across the European offshore wind energy sector, to which 56 million euros is added as the annual cost of repair and inspections [6]. Note that inspections and maintenance services have a significantly higher cost offshore compared to onshore locations, where the inland process is more simple and rapid to execute, according to the study of Elgendi et al. [8], on wind turbines located in complex terrains. The study made by Gao et al. [9] highlights the importance of overcoming the issues cited earlier. This remarkable growth is largely motivated by the finite nature of fossil fuels and the recent surge in the adoption of sustainable ideologies across society. Certain countries, such as Norway, are approaching nearly 100% electricity generation from renewable sources, according to Pugh et al. [10]. Additionally, the governments of many countries invest heavily in the area, underscoring the importance of involving researchers in this massive development. The aim is to find crucial solutions to all problems cited in the paper, making the technology as economically viable as possible.
Since surface protection is an important factor in blade manufacturing and performance, it has been identified as an area where potential solutions can be explored. The wind turbine blade material and especially its leading-edge protection is one of the most researched topics in the wind industry. The more it resists erosion, the better the AEP. Nowadays, wind turbines are mainly manufactured using glass or carbon fibre composite layers with a polymer matrix. These composite materials offer good performance, optimising the weight and the structural integrity of the blade [11]. Composite materials are widely used in several industries, such as in aerospace, because of their high ratio between strength and stiffness to weight [12]. During the manufacturing process of a turbine blade, one or more layers of LEP are applied on the outer surface of the blade’s leading edge. This would protect, at least temporarily, the blade from the damaging effects of environmental particles, such as water, dust, sand, or hail pellets.
According to Keegan et al. [13], erosion in surface texture begins earlier in hyperelastic coatings than in viscoelastic coatings. Keegan et al. and many other researchers agree that flexible coating represents better protection against wear due to its better damping properties of impact. However, flexible coatings may present a higher risk of internal defects, favouring debonding [13,14]. Some innovative coatings are being developed and investigated according to Mishaevsky et al. [2], such as metallic and metallic-polymer coatings, viscoelastic polyurethane coatings and multilayer hybrid polyurethane protections. Some repairing technologies have also been developed, such as the low viscosity resin injections, or non-destructive inspection techniques if the damage is not visible [15]. Bech et al. [16] quantify the economic potential of the safe-erosion method, an operational technique for mitigating erosion by significantly reducing the rotational speed of wind turbines under extreme environmental conditions. Additionally, Bech et al. divide the coating into soft and hard layers, helping to reduce erosion. It has been discovered that the inclusion of a primer between the LEP and the filler has improved adhesion between the layers of the wind turbine blade [17]. Finally, innovative manufacturing techniques, such as vacuum-assisted resin transfer moulding or 3D woven composite manufacturing, are being thoroughly investigated to ensure better quality standards and fewer internal defects in the production process [18]. The consideration of stress history and the impact of stress waves are crucial criteria to understand how stress waves affect fatigue damage.
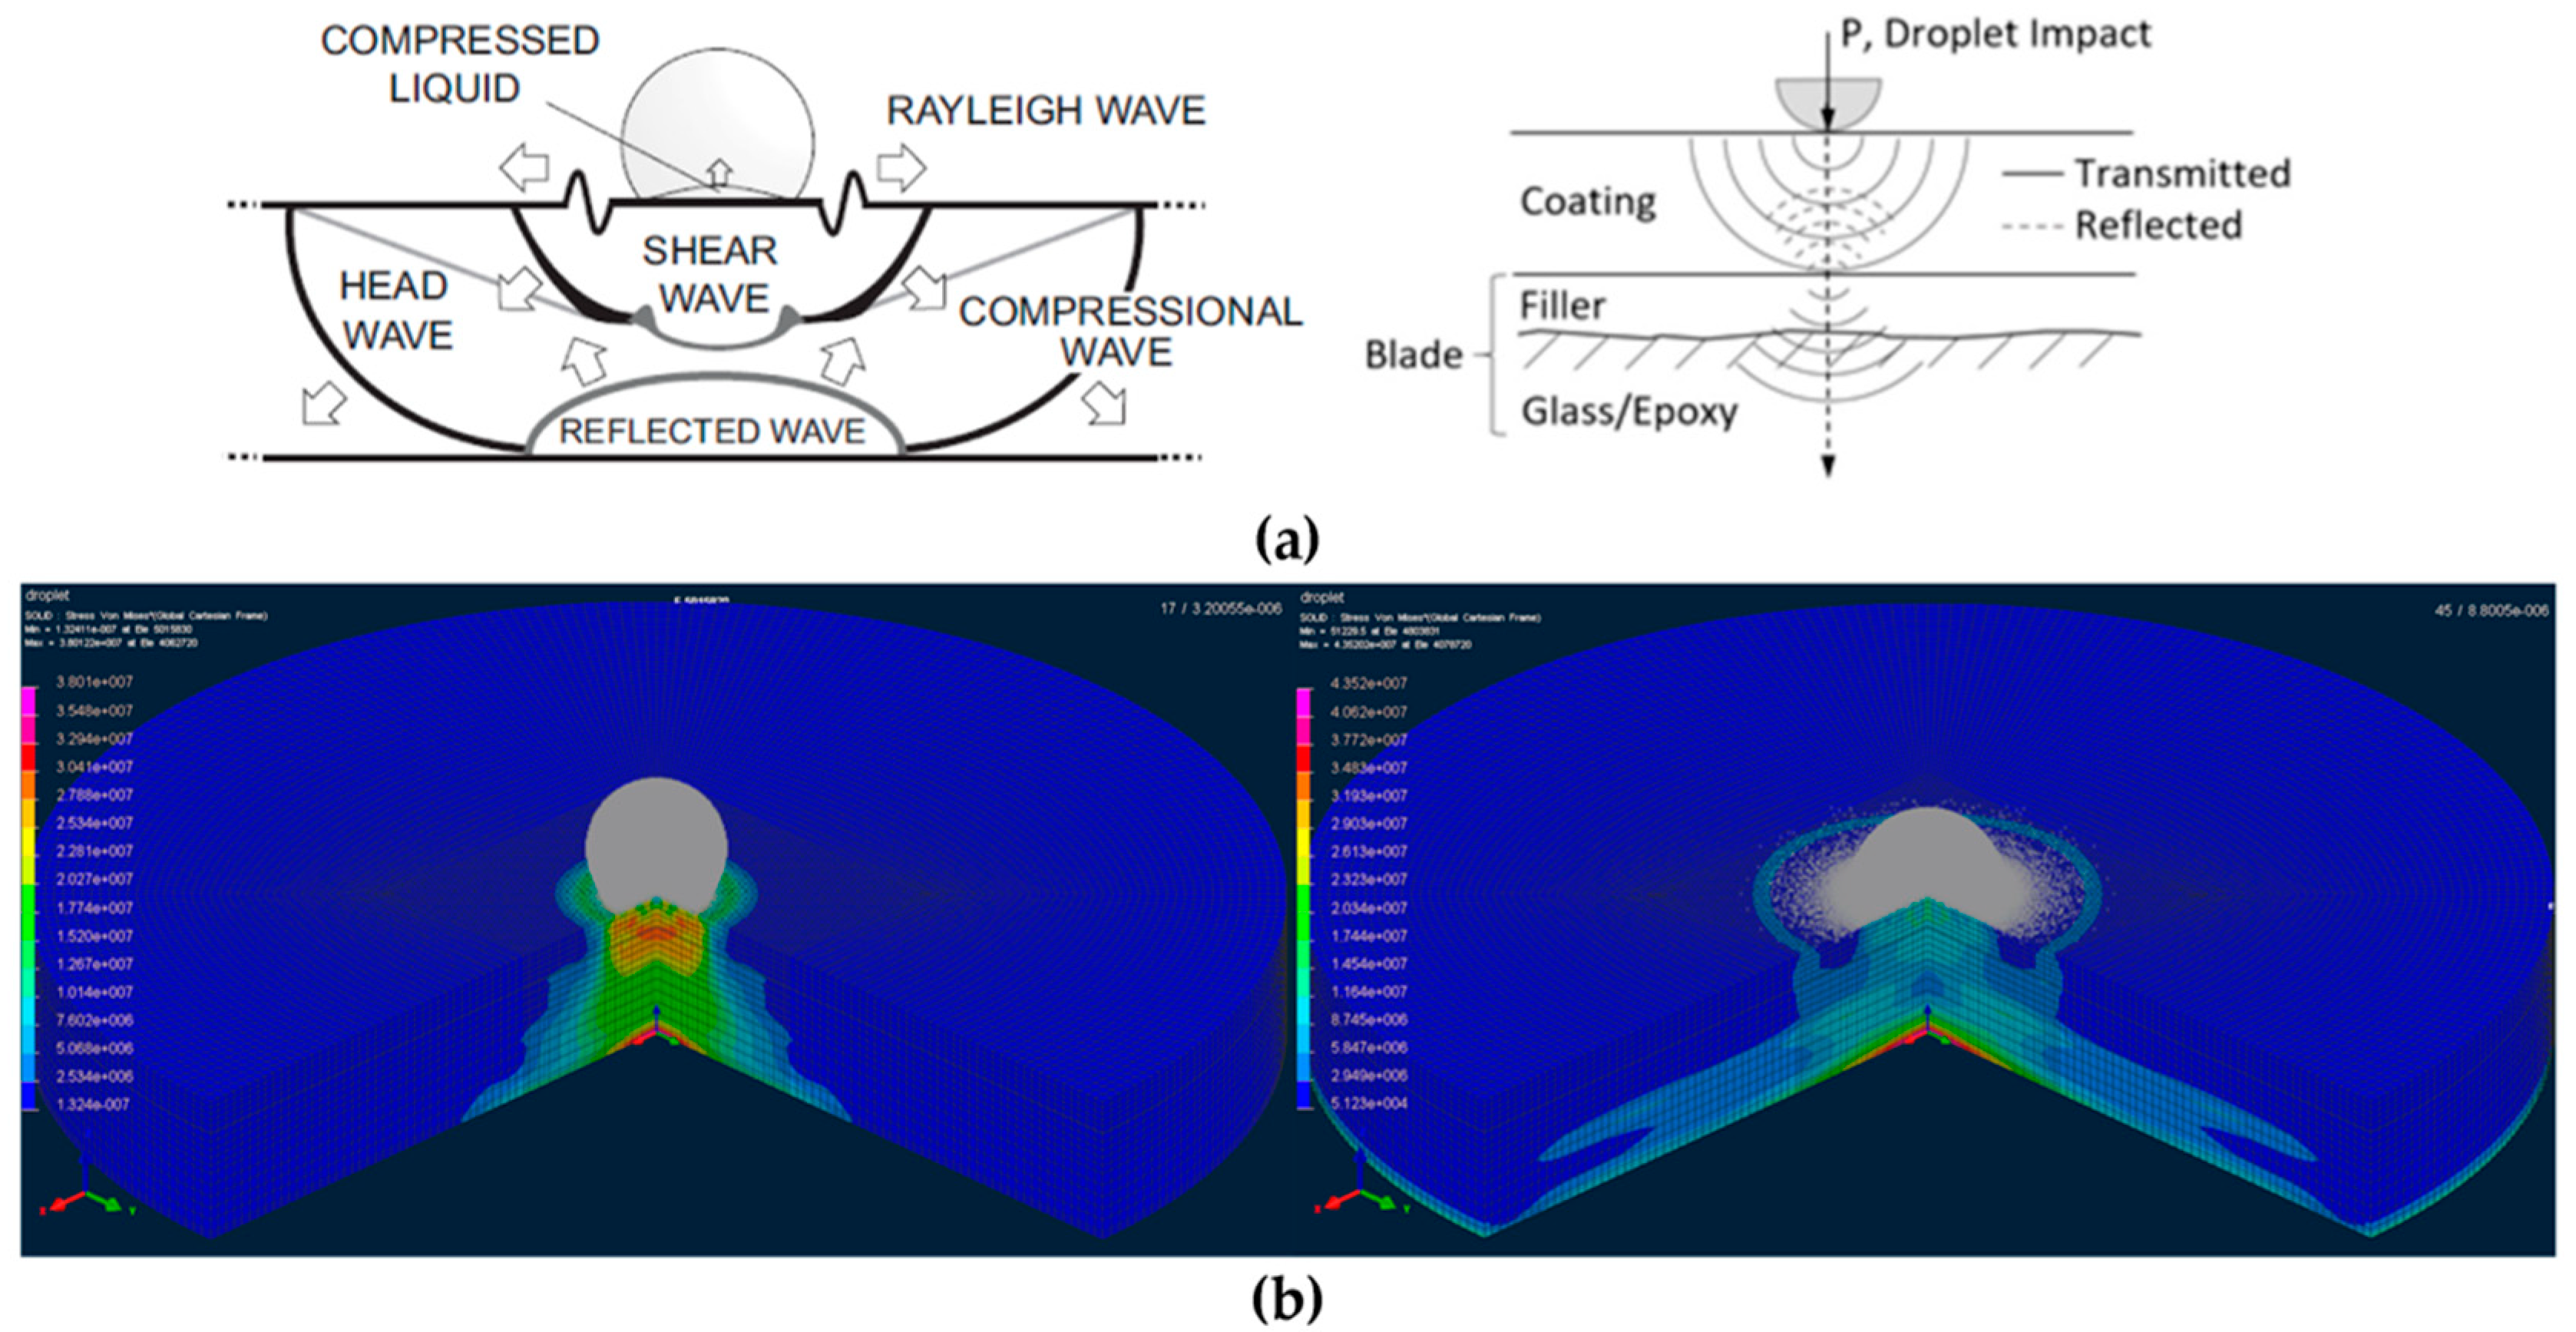
In order to analyse and evaluate the positive and negative aspects of a given protection system, we will consider in this work the propagation of the stresses caused by the impacts through the materials which compose the protection system. The stress history and the criteria to consider how the stress waves affect fatigue damage are based on the coating capability to reduce or enhance the surface and interface stress developments under impact. When a rain droplet impacts the blade’s surface, its kinetic energy changes suddenly as the droplet decelerates. The rapid deceleration and compression of the liquid droplet create a high-pressure shock zone at the impact location. The shock wave propagates within the liquid and into the leading edge protection coating, thus influencing the compressive stress development in the coating. The droplet impact generates high pressure, which is known as water hammer pressure. This leads to erosion in the leading edge blade surface. When a droplet hits the surface, compressed normal wave and transverse shear wave are developed, as shown in Figure 2, along with a third Rayleigh wave along the surface. Li et al. [19] explain that a compressive shock wave travels through the blade material each time a droplet hits its surface. Several researchers, including Papi et al. [20], have explored numerical models to predict peak stress evolution with time, even though studies from Langel et al. [21] indicate that creating high-fidelity models remains rare and very complex.
New modelling methods describing the computational liquid drop impact are tackled in many articles; they mainly compare the Lagrangian method, the Coupled Eulerian–Lagrangian method and the smoothed particle hydrodynamics (SPH). The Lagrangian Method is a standard finite element technique which uses standard Lagrangian meshing to describe the deformation of the bodies. However, this technique is limited to models where large deformation is unlikely [24]. SPH is a meshless method of impact modelling where numerous small particles are attached to a mass. According to Keegan et al. [24], this method seems to be adapted to a high-velocity impact such as hail or bird strikes, widely used in the wind or ballistic industries despite the discovery of issues related to a smoothing function and material interfaces [25]. Additionally, Keegan et al. [24] explain that the Lagrangian–Eulerian method uses the Lagrangian method to mesh the body while using the Eulerian method to mesh the projectile. The Eulerian mesh allows the projectile to continuously adopt the mesh while deforming, allowing it to remain uniform when undergoing large deformations. There exists a further version of the Lagrangian–Eulerian method called the Arbritary Lagrangian–Eulerian approach (ALE), where an arbitrary motion of the body optimises the shape of the meshing elements. Also, Macek and Silling [26] argue that the use of FEA implementation of peridynamics may help avoid many of the well-known difficulties in describing the interface between a penetrator and a target when using conventional finite elements. In particular, the use of truss elements to describe the target is expected to reduce or eliminate problems with mesh tangling and distortion.
In the current study, initial evaluations were undertaken with a representative (typical) 2.0 mm diameter droplet, assuming a frictionless surface. This work then investigated the effect of a friction coefficient varying from frictionless (zero friction coefficient) to a maximum possible friction coefficient of 0.5. In addition, this work also investigates the effect of contact and droplet size, which has not been investigated previously in detail.
Theoretical equations provide a solid framework for validating the numerical results. One of the most useful equations is the water hammer pressure, as described by several authors, including Keegan et al. [5]. The original waterhammer equation estimated rain droplet impact pressure, assuming a one-dimensional impact on a rigid body with constant speed of sound and density [27]. Later, the modified waterhammer equation improved estimates for wind-turbine blade erosion by considering both water and solid properties. However, droplet impacts are more complex, involving compressive, shear, and Rayleigh waves, as well as wave reflections—all influenced by the impact conditions and material properties [27]. Additionally, after the compressive wave passes the contact edge, water jetting (lateral outflow) occurs, causing decompression and reducing initial pressures by up to an order of magnitude [28]. Among early works, a simplified 1-D WH equation was the most widely used to approximate the peak pressure during impacts when only pure elastic material characterisation is assumed. It is used in this work to derive an appropriate analytical compressive stress history development.
This equation can be used to estimate the pressure peak caused by a liquid droplet impacting a flat surface. The modified water hammer pressure considers more parameters than the original version, incorporating various properties for liquid and solid components.
(a) Water hammer pressure:
P = ρ 0 c 0 V 0
With:
ρ 0 : Density of water ( k g / m 3 )
c 0 : Speed of sound in water (m/s)
V 0 : Velocity of the fluid (m/s)
(b) Modified water hammer pressure:
P = V ρ l c l ρ s c s ρ l c l + ρ s c s
With:
ρ l : Density of liquid ( k g / m 3 )
c l : Speed of sound in liquid (m/s)
ρ s : Density of solid ( k g / m 3 )
c s : Speed of sound in solid (m/s)
V: Velocity of the fluid (m/s)
Moreover, the water hammer pressure equations given by Equations (1) and (2) do not account for the droplet impact size, which will have a significant impact on the peak pressure, and there are no analytical equations available in the earlier work to the authors’ knowledge. Therefore, the objective of this work is to develop empirical equations that can account explicitly for the droplet size and liquid–solid surface contact effects to calculate the normal and von Mises stress due to varying rain droplet size.
Section 2, herein, discusses the numerical modelling techniques used, Section 3 investigates the effect of types of contact between the coating layers, and Section 4 outlines the results and discussion. Finally, conclusions are drawn at the end.

2. Numerical Modelling Techniques

Finite Element (FE) models are developed in Abaqus using explicit analysis to simulate the single rain droplet impact event. In this modelling, LEP, filler and glass fibre reinforced plastic (GFRP) substrate, and an aluminium shim, at the base, are considered. The rain droplet velocity is applied at multiple droplet nodes. The droplet and plate are modelled with tetrahedral element C3D4 and hexahedral elements C3D8R, respectively. The 3D mesh element is considered to capture the normal and shear stress near the impact zone. The water droplet impacts the plate perpendicularly, with a 90° angle, in the model where the pressure exerted is at its highest [29]. This is because when a droplet hits at a normal angle, it generates the highest peak pressure due to momentum transfer on the impacted surface. This leads to a sudden pressure rise due to water hammer pressure. The model is constrained on each side to avoid unrealistic lateral deformation. The greater the thickness of these layers, the more the substrate will be protected from each impact. The FE model represents a 27 mm diameter test coupon, which is standard for RET (rain erosion testing) at the University of Limerick [30]. While each layer of aluminium and filler measures 1 mm thick, each layer of GRFP+45, GRFP−45, and LEP has a thickness of 0.5 mm, as depicted in Figure 3. The LEP has been described as a surface layer made with rigid epoxy, allowing a pure elastic stress behaviour. The model is initialised with an impact velocity of 100 m/s, no gravity, a friction coefficient of 0.2, a tie type of contact between layers, and a droplet diameter of 2 mm. The mesh distortion is ruled by the ALE, and the surface is defined as flat with no previous damage.
The material properties used in this model are presented in the Table 1 and Table 2 and were inspired by the work of Keegan et al. and Verma et al. [13,28]. Using similar properties allows a decent comparison with other researchers in the same domain. The water droplet properties have been defined as follows: density ρ w = 1000   k g / m 3 , speed of sound C 0 = 1450   m / s . Regarding the different layers of the blade, all the properties are listed in the following tables.
A mesh convergence study (MCS) is a vital process in FEA models to ensure that simulation results are independent of mesh size and are precise, accurate, and reliable. For the plate, the mesh refinement process ranges from 0.02 mm to 0.00008 mm, with convergence observed at a mesh size of 0.0001 mm, which optimises the computational time while ensuring result accuracy. Similarly, mesh refinement is applied to the droplet, while the plate mesh size is fixed to the previously obtained value of 0.0001 mm. The CPRESS is generated since neither von Mises nor S33 stresses are applicable to liquid materials. CPRESS is a suitable alternative, measuring the compressive pressure normal to the contact surface. The droplet varying mesh size ranges from 0.00006 mm to 0.00002 mm and converges between 0.00004 mm and 0.00003 mm. A mesh size of 0.00003 mm is therefore the optimal choice to maximise the model’s accuracy and computational time.

3. Contacts

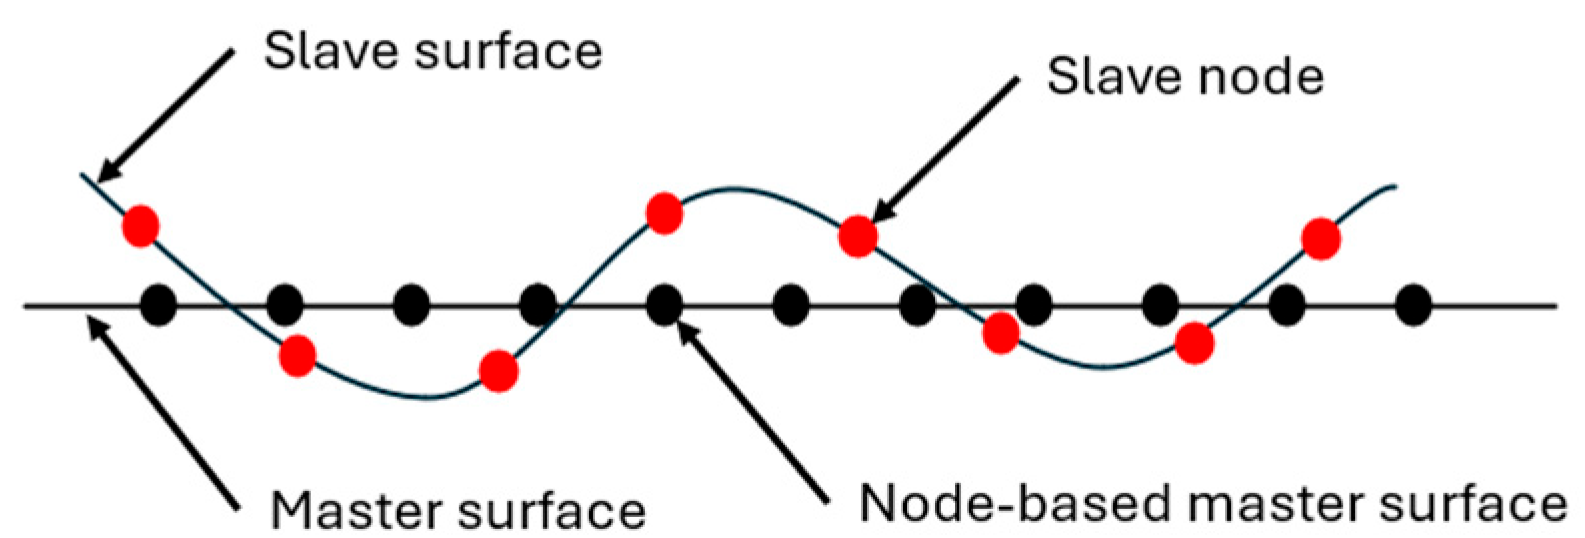
The type of contact describes how each layer is meshed to the other. There exist many ways to define the contact between all the layers; however, this paper focuses its study on the three following types: tie (penalty), bonded (rough), and mesh merged. A penalty method provides a simple way to bond surfaces together permanently with easy mesh transitioning. It is used by default for the surface-to-surface formulation, and it significantly reduces solver cost and CPU time for models with a massive fraction of nodes involved in contact. The rough friction model is typically used in conjunction with the no separation contact pressure–overclosure relationship for motions normal to the surfaces. This type of surface interaction is called “rough” friction, and all relative sliding motion between two contacting surfaces is prevented due to an infinite coefficient of friction. However, the merged technique is described as a shared mesh for both individual parts, as shown in Figure 4, avoiding collision or “close interaction” between the slave and master surfaces [31].
Figure 5 presents the von Mises and S33 stress under three different types of contact. The primary aim of this analysis is to understand the stress propagation behaviour between the bottom centre node of the LEP and the top centre node of the filler, and to assess how each part is numerically connected. The materials of the two parts in contact, LEP and filler, have been modified to have similar properties to assess the effect of changing the contact type independently of material properties. It ensures that the results are not affected by the different materials’ abilities to absorb the impact. Specifically, both LEP and filler are defined with the gelcoat properties mentioned in Table 2. As described in the Abaqus guide on constraints and connection [32], tie (penalty) and bonded (rough) share two individual local nodes between their two contact surfaces. In contrast, when the two bodies are mesh merged, they share a single local node at their touching surfaces.
Regarding the curve’s behaviour, in each case, the tied and bonded corresponding curves are acting similarly. However, a notable gap exists between the peak values of the bottom LEP and top filler, with a difference of approximately 10 MPa on the S33 graph. This discrepancy appears independent of the material properties and indicates that the transition between LEP and filler is not smooth or completely accurate when using tie or bonded contacts. In contrast, the merged contact curves lie between the four curves described by tied and bonded contact types, suggesting more accurate results. Numerically, the merged curve shows a S33 peak stress difference of 5 MPa with the bottom LEP node and 2 MPa with the top filler node. This shows a better transition between LEP and the filler, thanks to using the mesh merged interaction method and therefore, sharing single local nodes between the two surfaces.

4. Results and Discussion

4.1. Effect of Friction

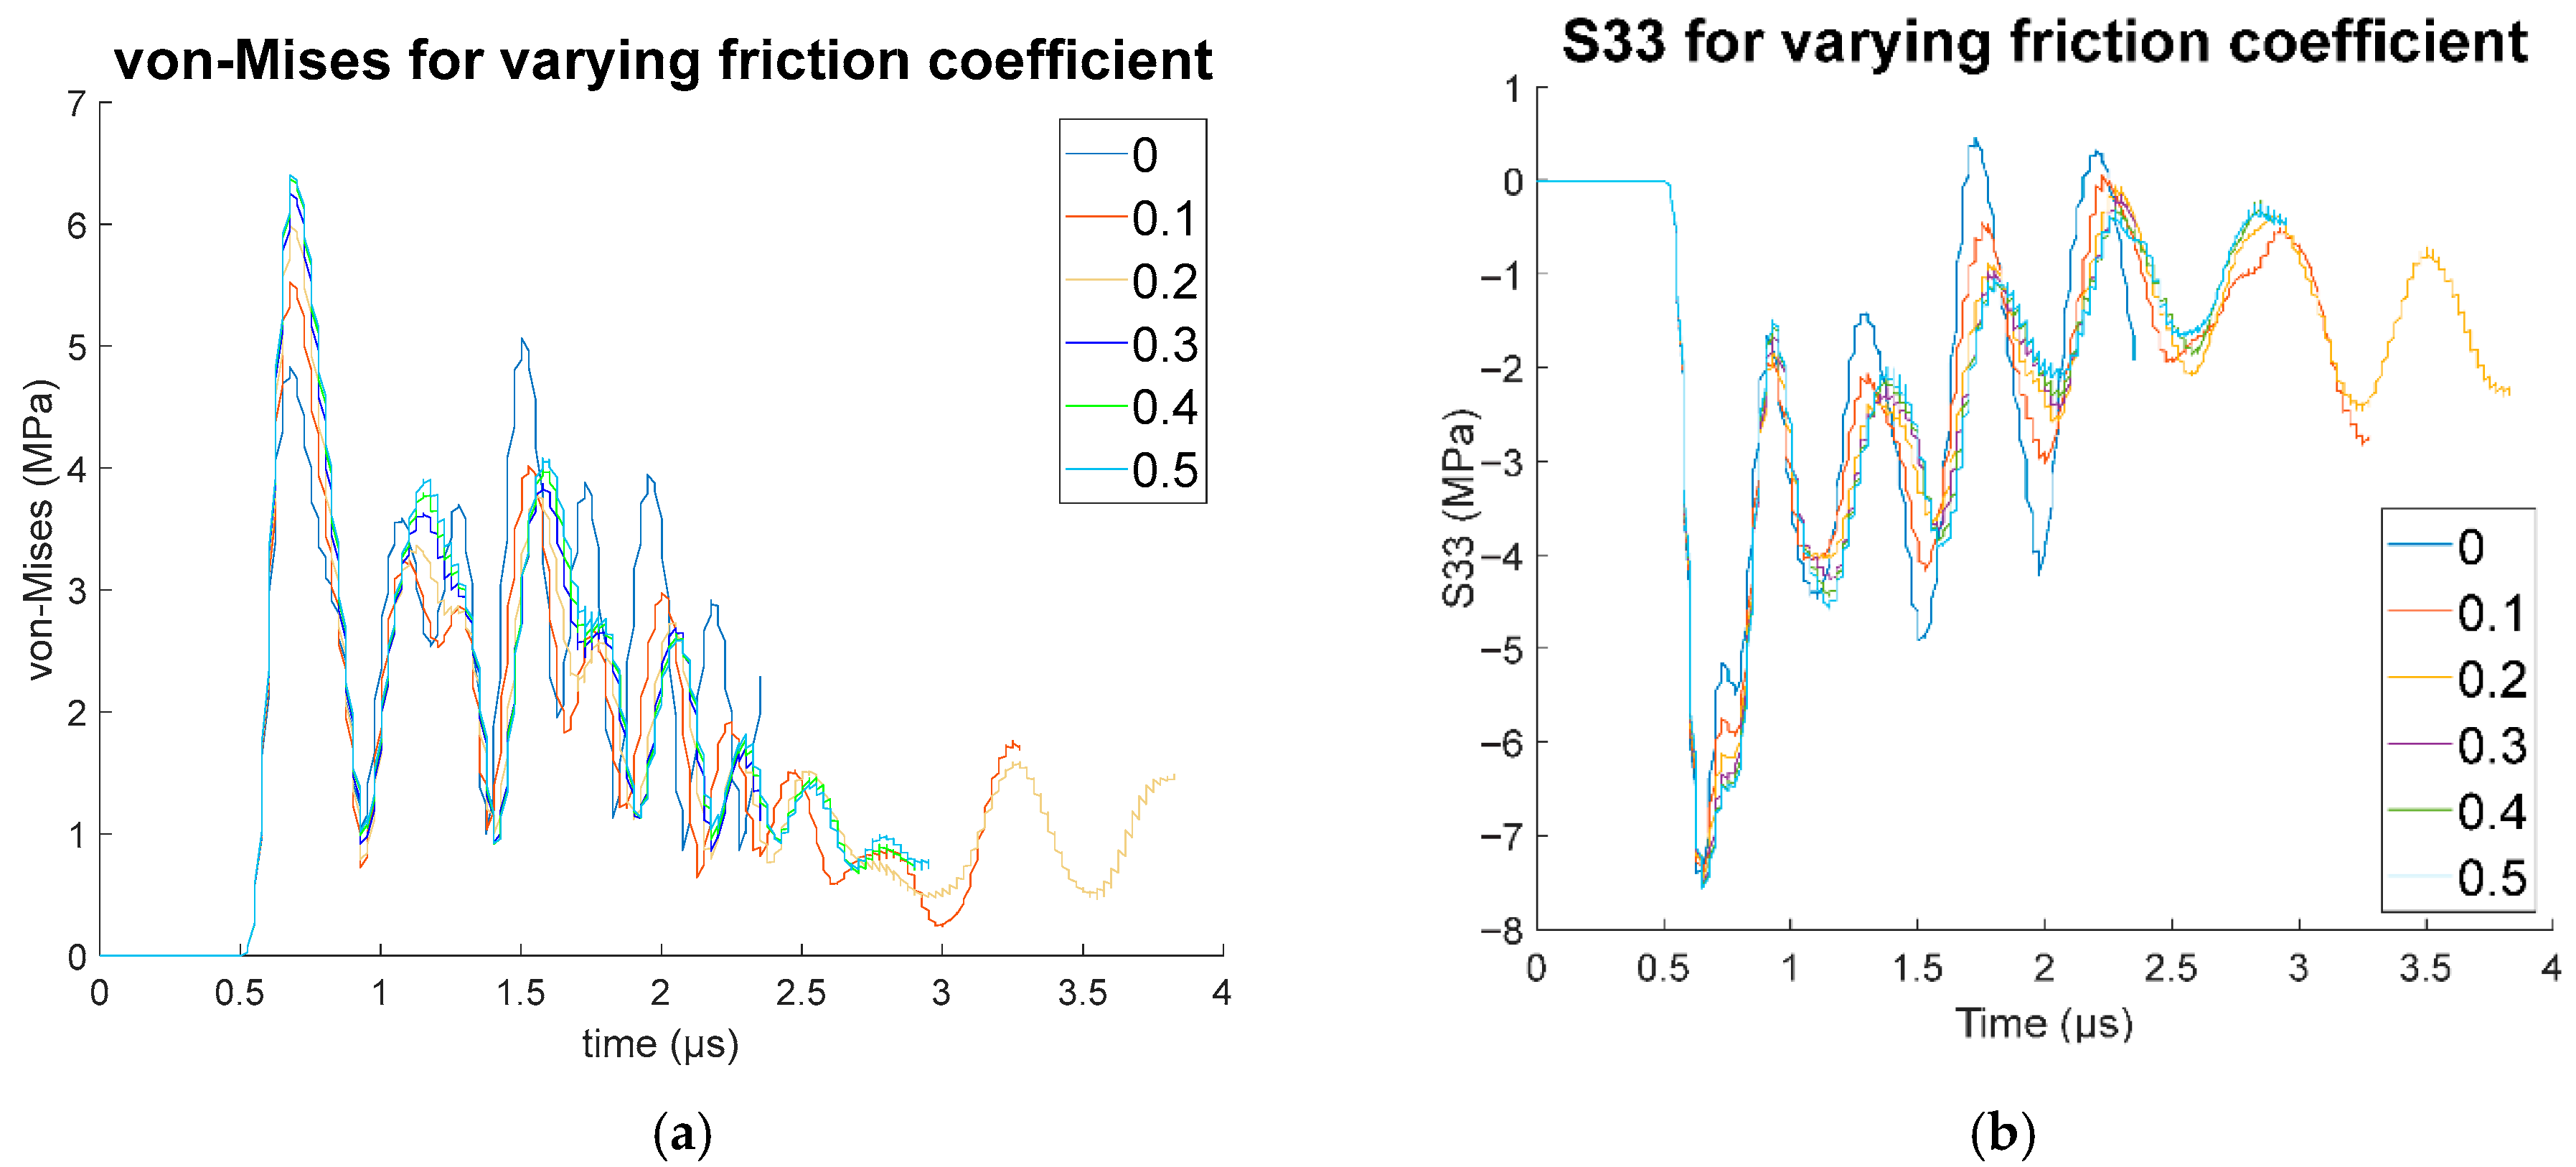
The objective is to investigate the influence of friction during the collision process between the droplet and the blade’s flat surface for varying coefficients. Figure 6 illustrates the von Mises and S33 stress graphs, representing the normal stress applied on the LEP top surface when the friction coefficient µ is implemented in the model, ranging from frictionless to 0.5. This graph is complemented by Table 3 showing the computational time of each simulation. According to McHale et al. [33], the static friction coefficient is larger than the dynamic friction coefficient in the sliding regime of a droplet impacting a solid surface. The current paper considers only the static coefficient, as it has a more significant impact compared to the kinetic, or in-motion, friction. The static coefficient μ s typically ranges from 0.114 to 0.428 for droplet collision [33].
The graph (b) in Figure 6 shows minimal changes due to the variation of the friction coefficient. Indeed, all curves exhibit the same overall trend, with higher friction coefficients leading to more convergent curves. However, the graph (a), presented in Figure 6, shows a variation of von Mises peak stress depending on the value of the friction coefficient. Indeed, the greater the friction coefficient, the greater the von Mises stress. The value seems to converge to 65 MPa as the friction coefficient increases. The computational time decreases until stabilising after a friction coefficient of 0.2. Frictionless conditions seem to be a less favourable solution as they tend to diverge more than the other curves, particularly in relation to stress propagation through the layers. The low impact of the friction coefficient in this contact scenario is predictable given the low viscosity of the water droplet, and consequently, the low resistance in contact with the solid surface. A friction coefficient of 0.2 will be retained for further simulations as it represents a decent compromise between accuracy and computational performance.

4.2. Effect of Impact Velocity

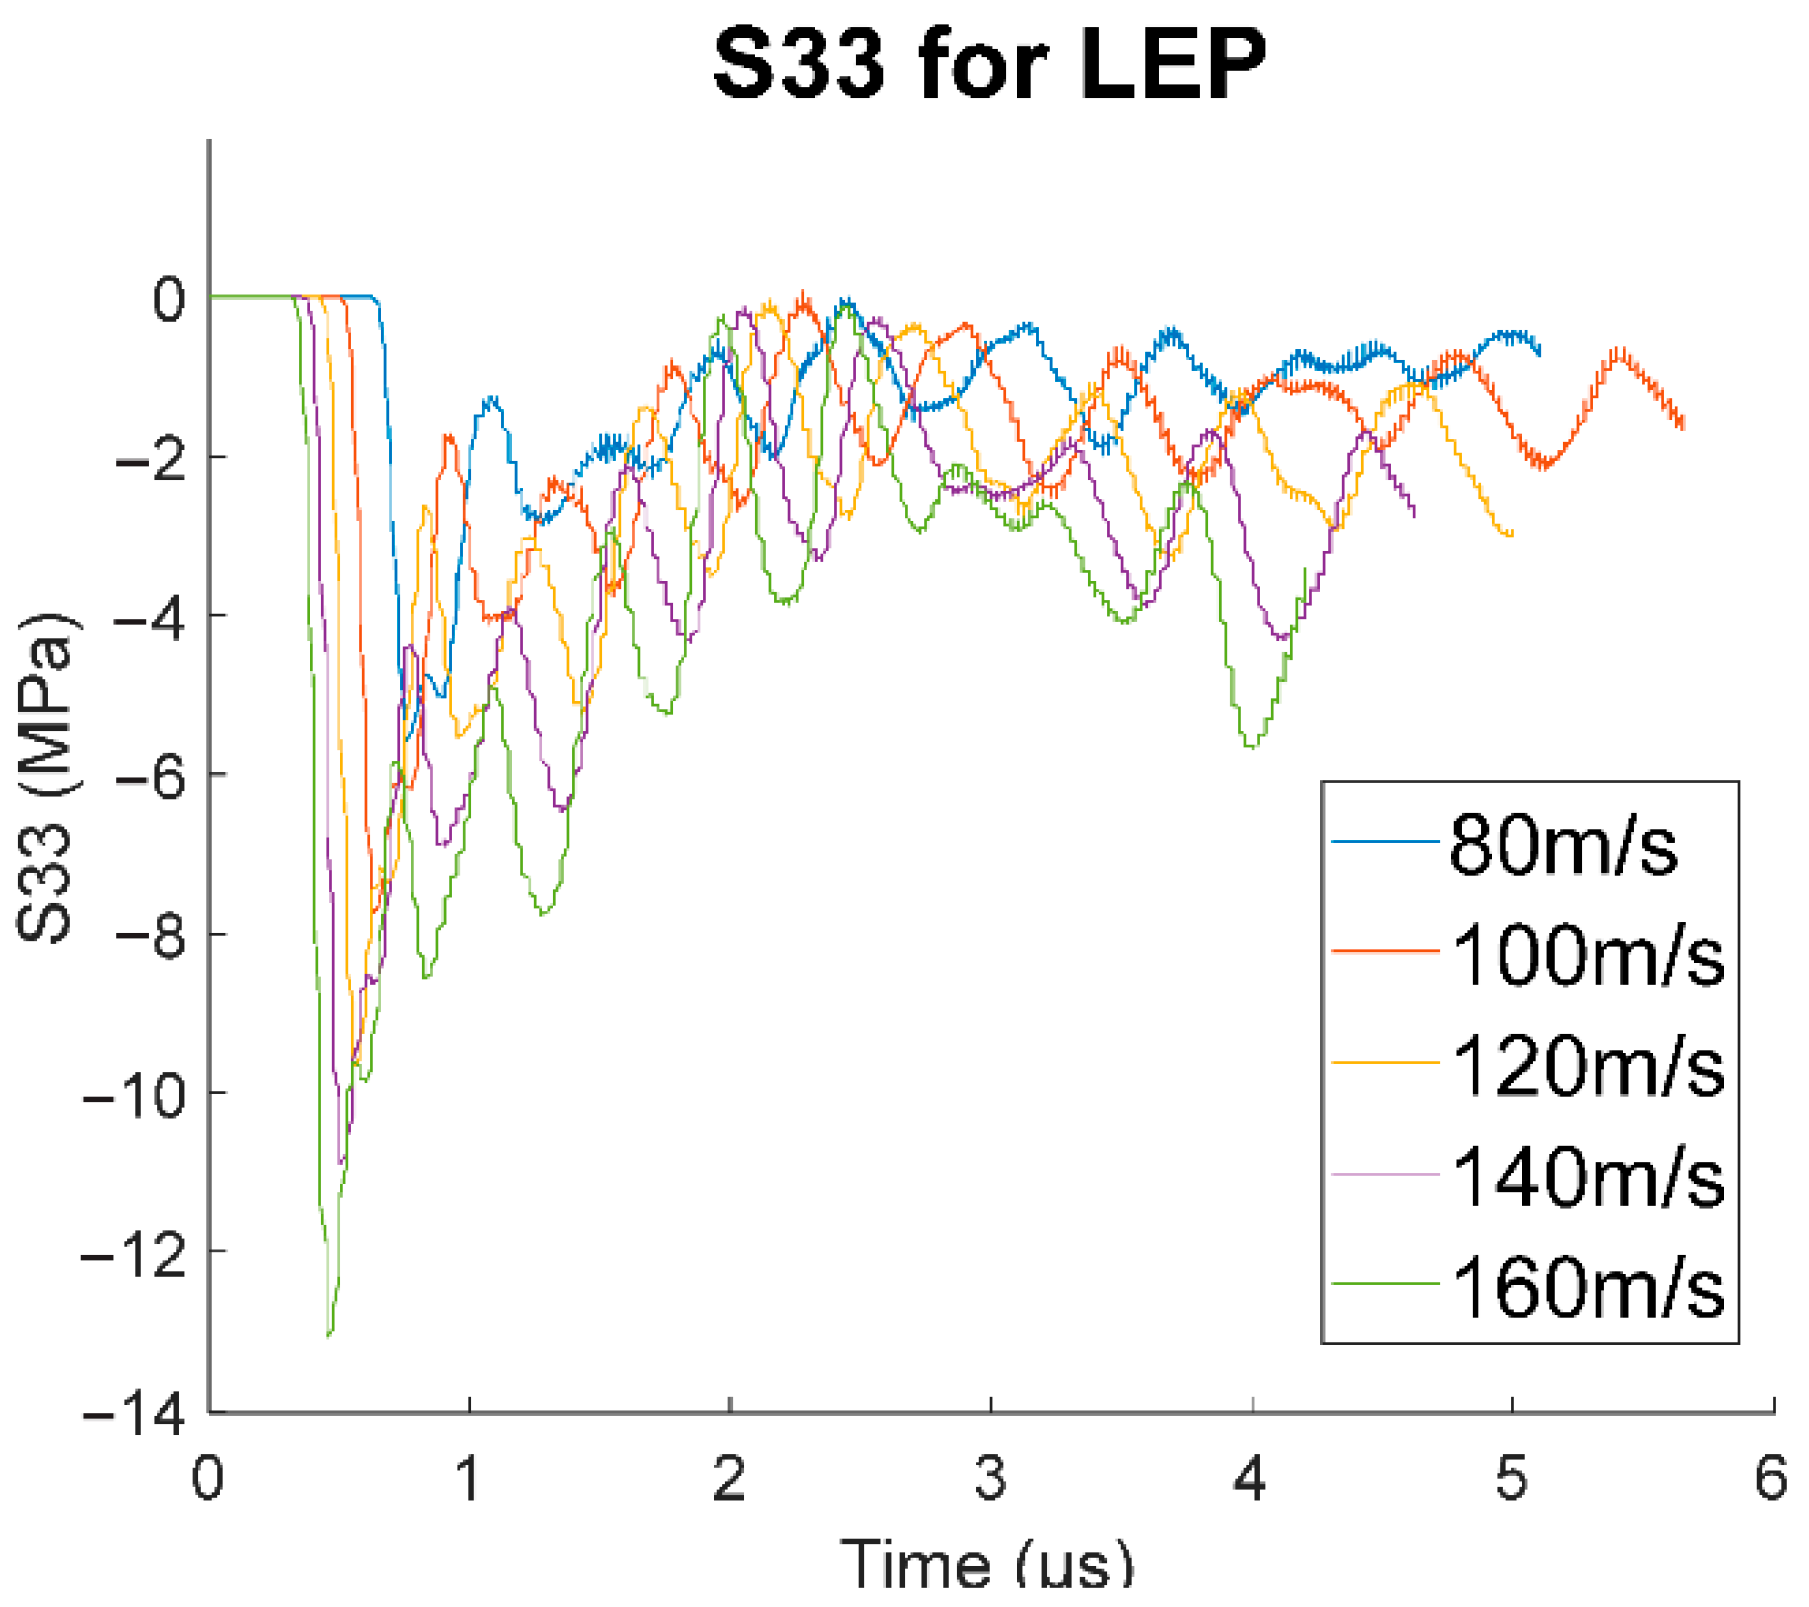
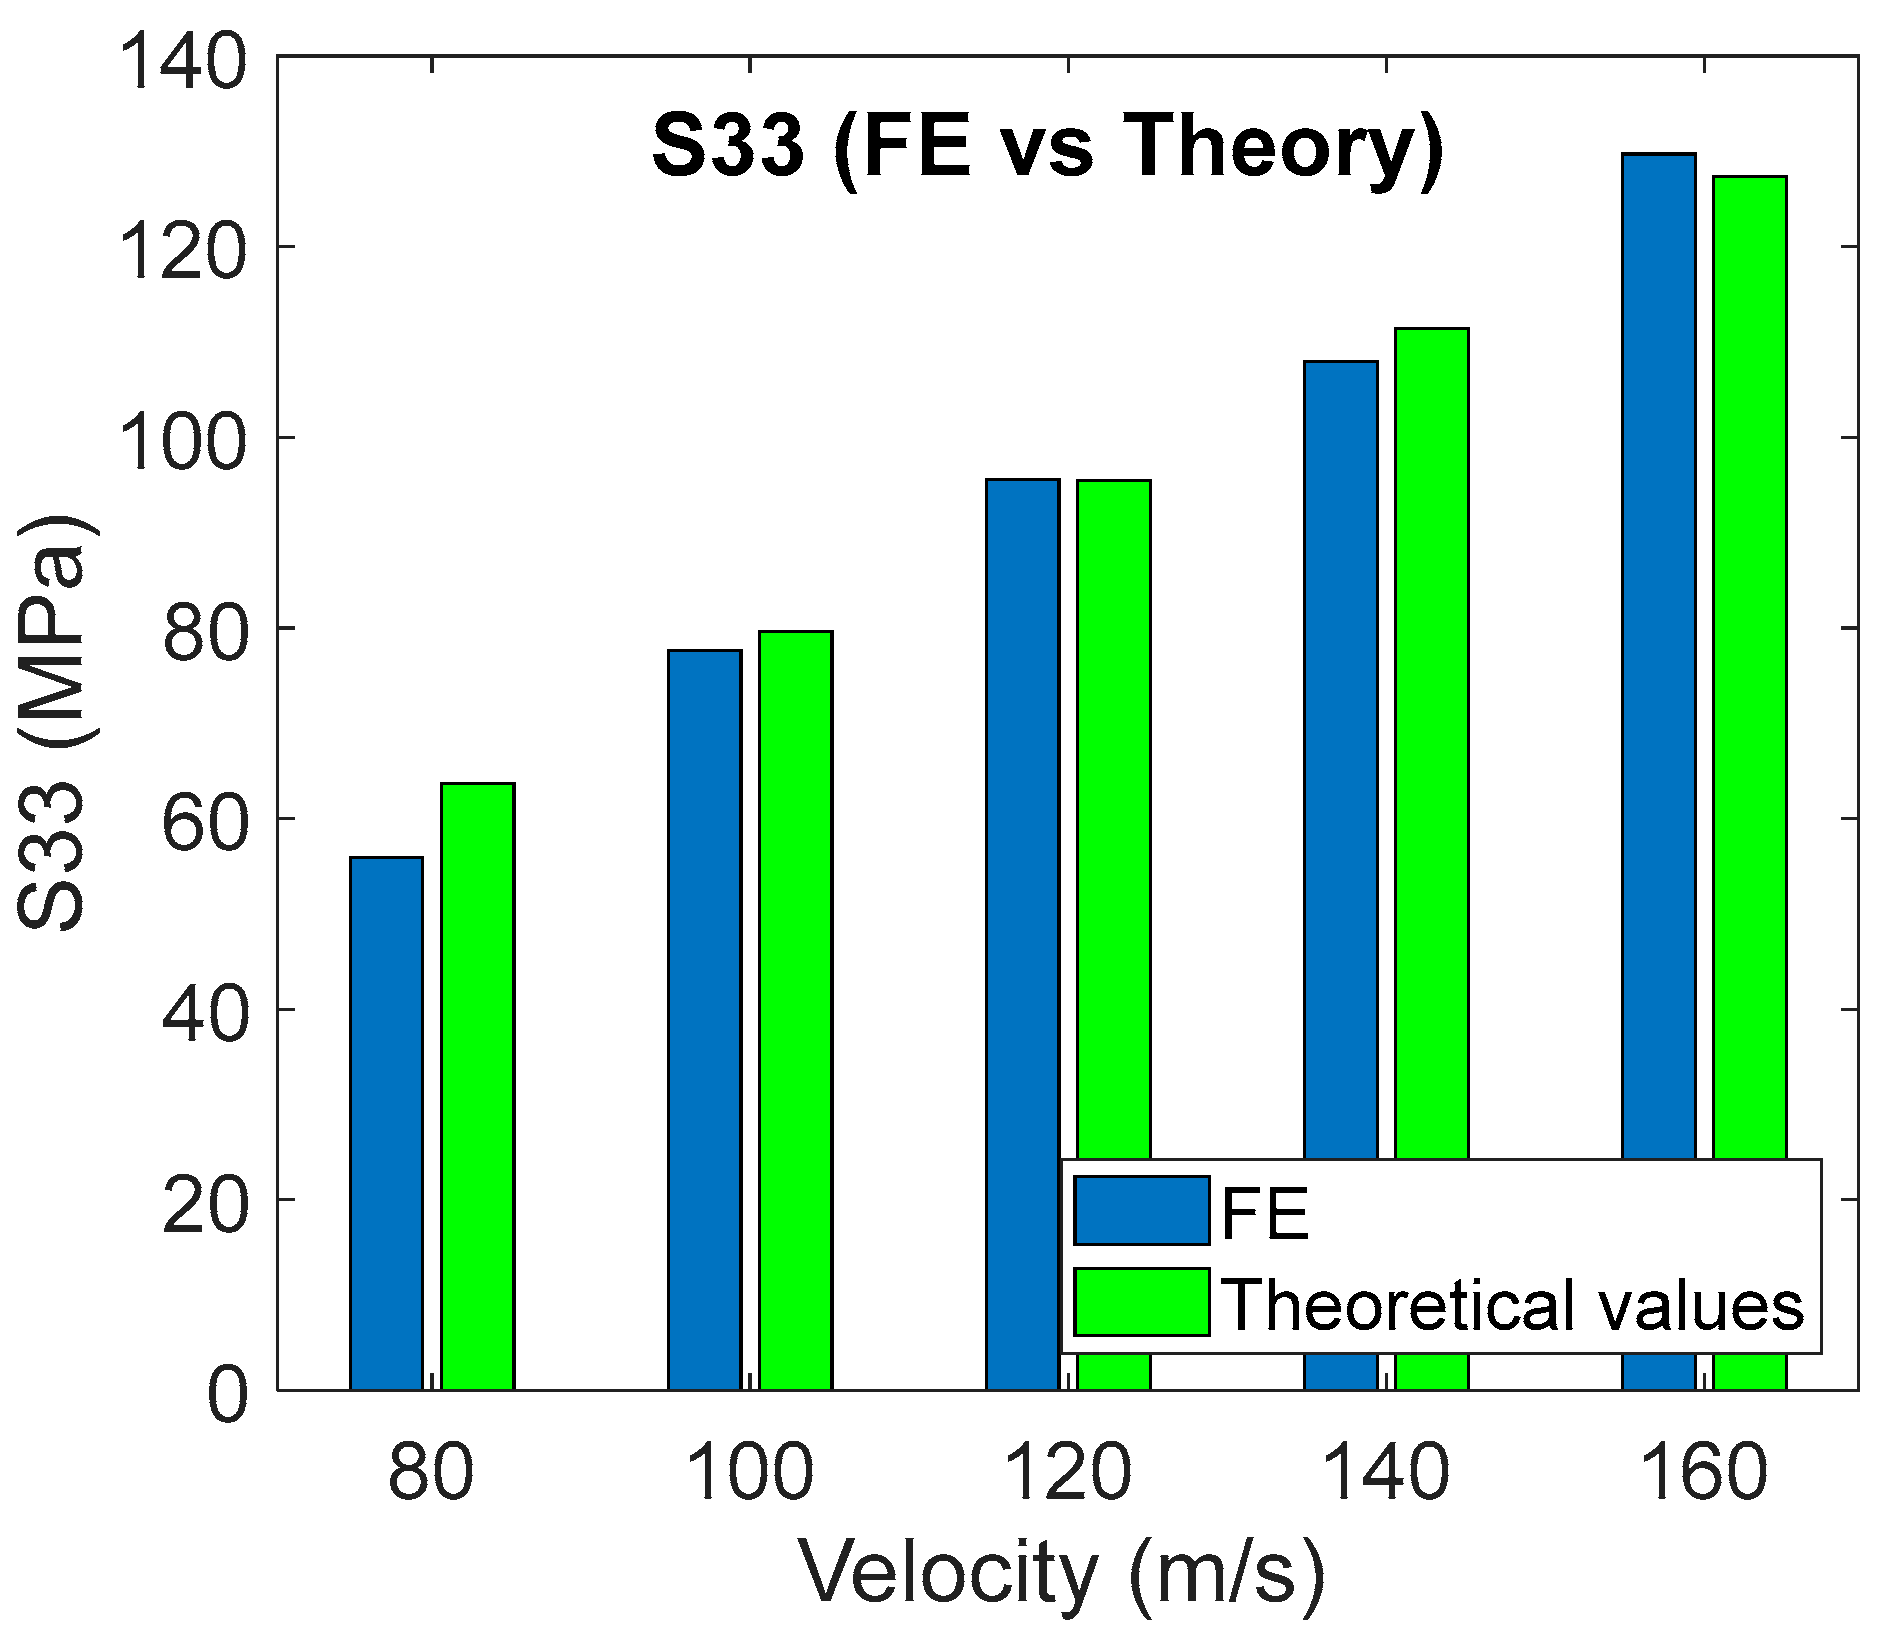
The contact velocity has a significant impact on the S33 stress exerted on the LEP surface, and this pressure seems to increase linearly while increasing the velocity. The greater the velocity, the higher the S33 stress. It can reach up to 130 MPa for an impact velocity of 160 m/s, as shown in Figure 7. This simulation validates the important impact of operational methods, such as the safe-erosion method, to reduce blade surface erosion. Indeed, significantly reducing the speed of the wind turbine during heavy rain events will reduce the stress exerted and internal wave propagation through the blades’ thickness.
The results presented in Figure 8 help validate the model for impact speeds between 80 m/s and 160 m/s. Indeed, the S33 peak pressure approximately matches the theoretical values obtained with the modified water hammer pressure, especially for impact speeds from 100 m/s to 160 m/s, where the difference is less than 5%. The greatest difference, around 10%, is observed at an impact velocity of 80 m/s. This difference may result from the application of a smoothing function, which reduces noise and fluctuations in the data, leading to a clearer analysis. FEM and theoretical calculations are complementary, with theory providing fundamental insights and validation, while FEM refines the analysis for complex geometries, enables local stress–strain evaluation, and facilitates model optimisation through iterative testing, ensuring a complete and accurate solution.

4.3. Effect of Droplet Diameter

The purpose of the following simulation is to explore the behaviour of von Mises and S33 stress propagation when varying the droplet diameter from 0.5 mm up to 5 mm. The measuring point is taken on the top surface of the LEP for different droplet sizes. Increasing the diameter enables the simulation of droplet impacts on wind turbine blades under various environmental conditions and extreme precipitation events. Keegan et al. [5] state that droplet size measures typically range between 0.5 mm and 5 mm in diameter and that 0.5 mm to 3 mm are the most common. Droplets greater than 3 mm can be seen during extreme weather conditions.
The von Mises stress curves over time are displayed in Figure 9, illustrating the propagation of von Mises stress through the model’s thickness. The first peak value corresponds to the initial impact of the droplet on the LEP, representing the maximum stress experienced by the blade during the contact process. Figure 9 shows the von Mises stress evolution as the droplet diameter increases from 0.5 mm to 4.5 mm. The von Mises stress rises with increasing droplet diameter until it reaches 2.5 mm, after which it begins to decrease with a further increase in diameter. A droplet size of 2.5 mm impacts the surface with the highest von Mises stress. Since von Mises stress is a combination of principal stresses and shear stresses, one of its components causes the stress to reduce.

4.4. Discussion on Simulation Results for Varying Droplet Diameter

The von Mises and S33 stress vary exponentially, allowing the development of empirical relations describing the evolution of these two crucial factors. The exponential fitting of von Mises and S33 stresses is assumed as,
  • von Mises stress exponential relation:
σ v s = a [ e b x e c x ]
where σ v s is the von Mises stress at the top surface of the LEP. After curve fitting, a = 66 MPa, b = −0.04, and c = −1.5.
  • S33 exponential relation:
σ 33 = a e b x + d
where σ 33 is the S33 stress at the top surface of the LEP. After curve fitting, a = −85 MPa, b = −0.6, and c = 100 MPa.
In both cases, a is the interception with the Y axis, and b and c are the exponents. D is the offset in the Y direction. x = ( d l d L ) is a non-dimensional variable where dl represents the current diameter and dL the normalisation reference diameter of 1 mm.
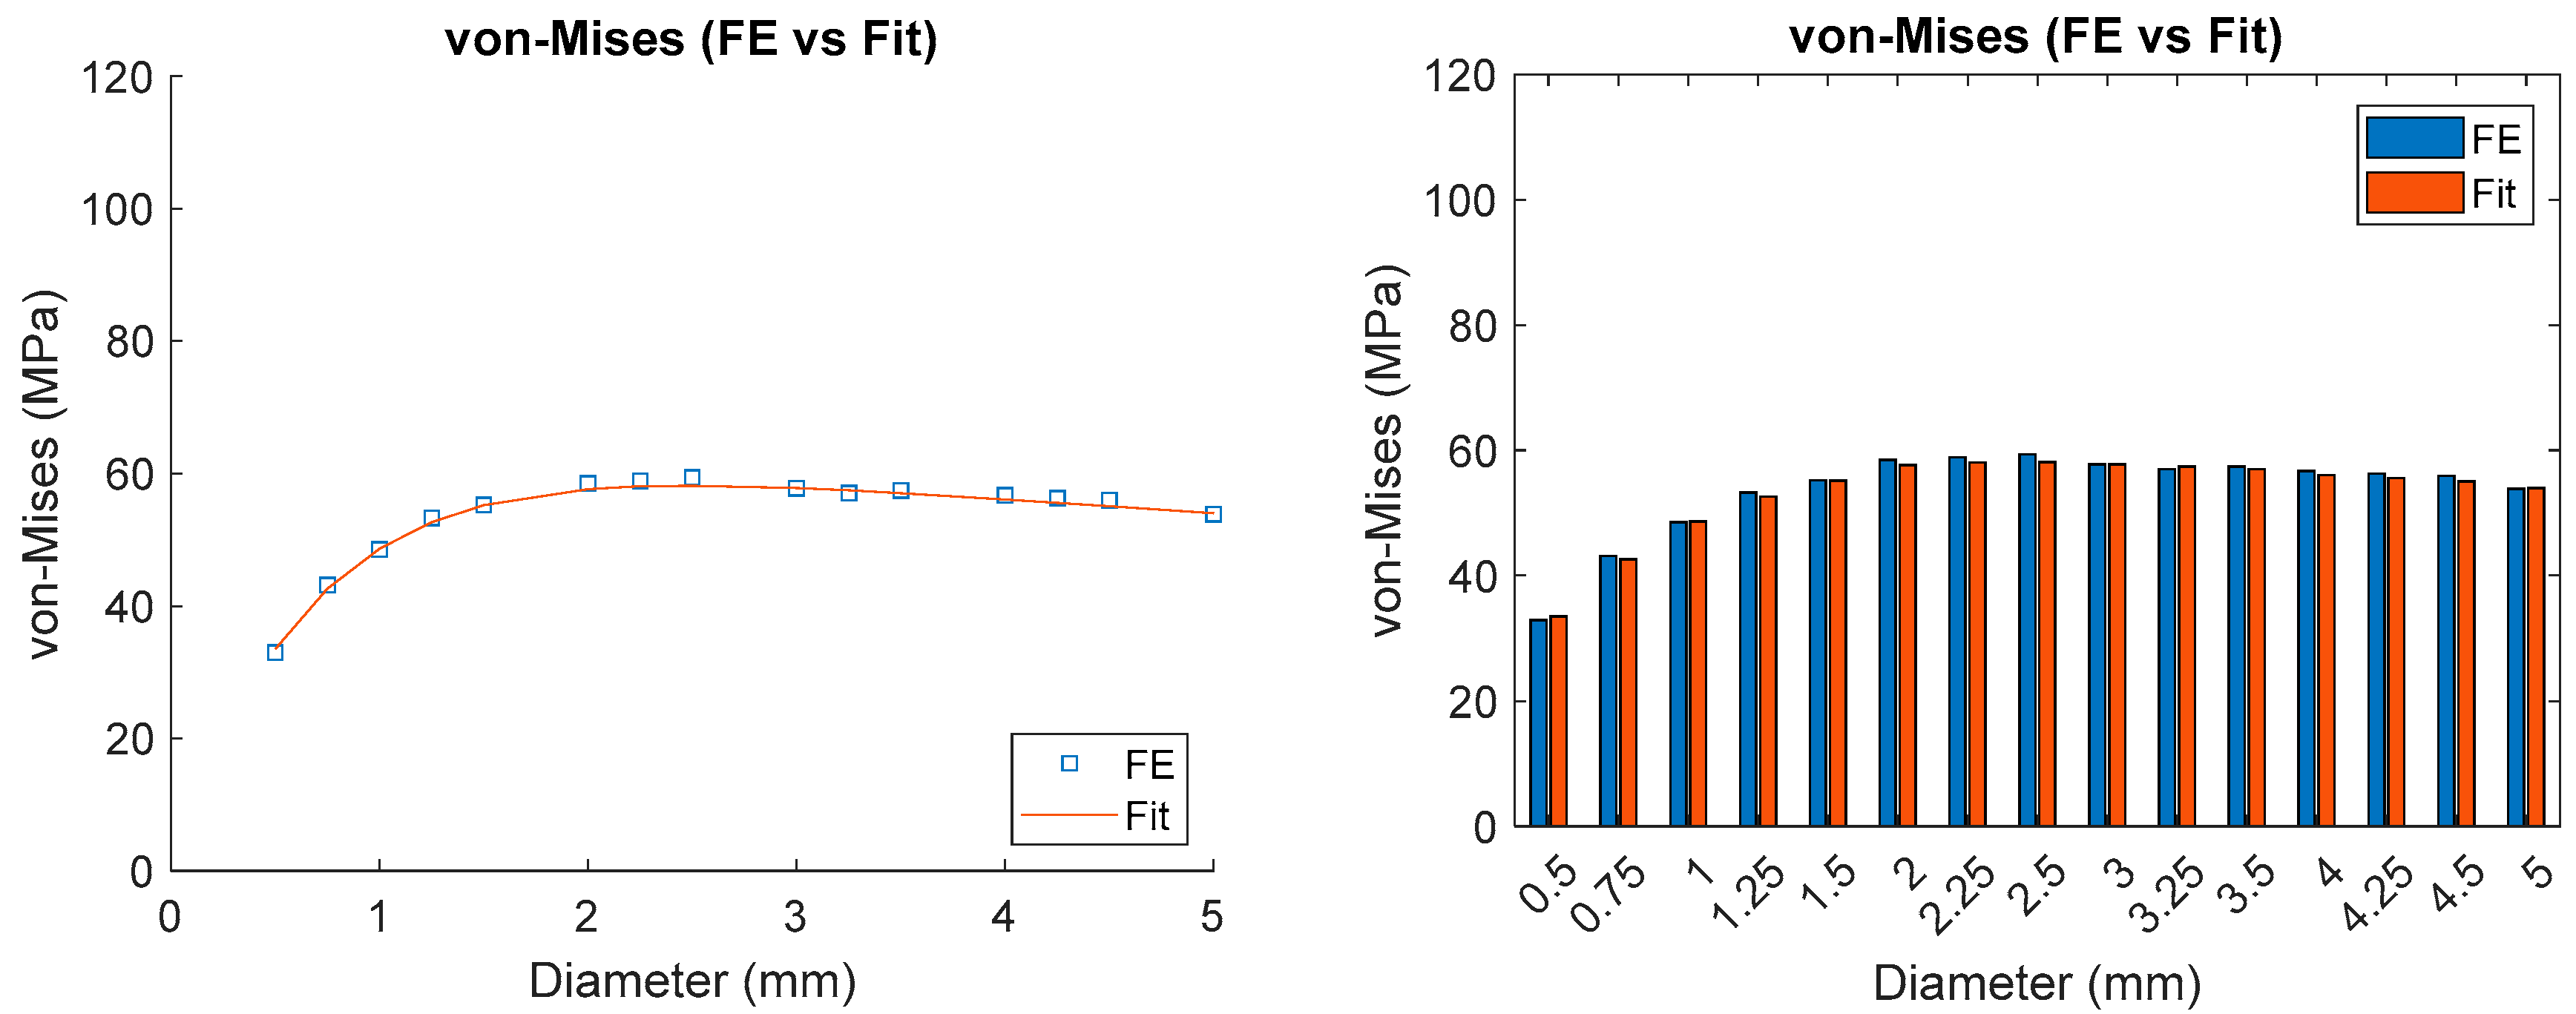
To verify the robustness of Equations (3) and (4), Figure 10 and Figure 11 compare the von Mises and normal S33 stresses of the numerical FE results with the MATLAB R2022b exponential fitting, for varying diameters from 0.5 mm to 5 mm. The comparison between empirical fitting equations and the numerical FE results is found to agree well with each other.
Figure 10 illustrates the evolution of S33 stress for droplet diameters ranging from 0.5 mm to 5 mm. The S33 maximum peak value reaches around 100 MPa for 5 mm diameter droplets. Unlike the von Mises stress, the larger the droplet, the more important the S33 stress. The increase in S33 with larger droplet diameters leads to higher normal stress acting on the surface, probably due to the higher kinetic energy and mass of bigger droplets. This will cause more perpendicular, direct, and localised damage.
Figure 11 illustrates the evolution of von Mises stress for droplet diameters ranging from 0.5 mm to 5 mm. The overall trend shows a von Mises maximum peak value of around 60 MPa for droplet diameters of 2.5 mm, decreasing to 50 MPa for 5 mm droplet diameters. The von Mises trend shows limitations as the droplet diameter exceeds 2.5 mm, where the curves start decreasing. The von Mises criterion measures the yielding potential of the material. The maximum von Mises stress at a 2.5 mm droplet diameter suggests that the stress state of the principal and shear stresses is at its maximum to cause failure and deformation. However, studying the behaviour of S33 over time in Figure 10 does not fully explain the trend seen in the von Mises stress. Beyond this specific droplet size, although the S33 stresses increase, other factors, such as the principal stresses S11, S22, S12, S23, and S13, may limit further increases in von Mises stress.
Specifically, it means that a 2 mm droplet will cause more damage in multiple directions, while a larger droplet, despite being less critical for yielding, causes more unidirectional stress. Similarly, the computational analysis conducted by Rad and Mishnaevsky [34] illustrates von Mises curves that decrease as the droplet’s mass fraction increases. However, other researchers like Beck et al. [35] have proven it unrealistic since the bigger the droplet, the more critical for material damage. Indeed, their experimental simulation compares the relationship between droplet diameter, ranging from 0.76 mm to 3.5 mm and the specific impacts. The non-dimensional specific impacts used in [36] may be considered equivalent to the number of load cycles sustained by a material element. In this case, the lower the specific impact, the less it would withstand the loads applied by the raindrop impact. Moreover, Zhang et al. [36] agree that a particle with a larger size and impact velocity tends to make much more significant damage in a multi-physics peridynamics study. It clearly shows that the numerical von Miss criterion is not a suitable and convenient criterion to study the damage of rain droplets for different diameters. Further analysis must be conducted to gauge the impact of each von Mises parameter (S11, S22, S33, S13, S23, S12) in the water drop impact with the wind turbine blade. Additionally, the effect of the friction coefficient variation on the von Mises stress presented in Figure 6 may be the reason for this unrealistic von Mises behaviour when increasing the droplet diameter. Further simulation must analyse the von Mises stress evolution when increasing the droplet diameter with a frictionless friction coefficient implemented in the model.

5. Conclusions

To conclude, understanding the impact of rain erosion on wind turbine leading edges is important nowadays for the wind industry. The FE model developed in this paper successfully simulates the impact of rain droplets, highlighting the critical role of various parameters. The friction coefficient (not considering a frictionless idealisation) does not have a significant impact on the S33 stress through the thickness of the blade, even though the friction coefficient alters the von Mises stress evolution and might be the reason for a decreasing von Mises behaviour during the droplet diameter analysis. However, the impact velocity significantly alters the von Mises and S33 stresses experienced on the LE, emphasising the importance of reducing the velocity during extreme environmental conditions. The accuracy of the contact type between layers may be improved by using a merged technique over the tie contact. Varying the droplet diameter leads to an increase in the S33 stress until it stabilises for diameters larger than 5 mm. While the S33 shows exponential growth, other factors such as S11, S22, S12, and S23 limit the von Mises stress increase beyond droplet diameters of 2.5 mm. The von Mises stress reaches its peak at 2.5 mm droplet diameters, then decreases linearly as the diameter increases further. The empirical fitting equations align with the numerical results with 97% accuracy, for diameters ranging from 0.5 mm to 5 mm. The von Mises and S33 stresses from FE analysis for small diameters and those above 5 mm correlate with results from the empirical equations. Future research can further analyse the relationship between von Mises stress and droplet size, which does not truly represent the real-life scenario.

Author Contributions

Q.L.O.: Conceptualization, Methodology, Formal Analysis, Investigation, Validation, Writing—Original Draft. Q.M.A.: Conceptualization, Methodology, Formal Analysis, Investigation, Validation, Writing and Reviewing. F.S.: Conceptualization, Methodology, Visualization, Investigation, Writing, Reviewing and Editing. L.M.J.: Conceptualization, Methodology, Validation, Writing, Reviewing and Editing. T.M.Y.: Conceptualization, Supervision, Funding Acquisition, Writing, Reviewing and Editing. All authors have read and agreed to the published version of the manuscript.

Funding

This research was funded by Sustainable Energy Authority of Ireland grant number 21/RDD/671.

Institutional Review Board Statement

Not applicable.

Informed Consent Statement

Not applicable.

Data Availability Statement

The original contributions presented in the study are included in the article, further inquiries can be directed to the corresponding author.

Acknowledgments

The authors would like to acknowledge the Sustainable Energy Authority of Ireland (SEAI) for funding the SPOTBlade (Strategies for erosion and fouling Protection of Offshore Turbine Blades) project under its Research Development and Demonstration (RD&D) program (Award No. 21/RDD/671). The authors would also like to thank the International Energy Agency (IEA) Wind TCP Task 46 (Erosion of Wind Turbine Blades) for creating an environment for research collaboration.

Conflicts of Interest

The authors declare no conflict of interest.

References

  1. Katsaprakakis, D.A.; Papadakis, N.; Ntintakis, I. A comprehensive analysis of wind turbine blade damage. Energies 2021, 14, 5974. [Google Scholar] [CrossRef]
  2. Mishnaevsky, L., Jr.; Tempelis, A.; Kuthe, N.; Mahajan, P. Recent developments in the protection of wind turbine blades against leading edge erosion: Materials solutions and predictive modelling. Renew. Energy 2023, 215, 118966. [Google Scholar] [CrossRef]
  3. Mishnaevsky, L., Jr.; Hasager, C.B.; Bak, C.; Tilg, A.M.; Bech, J.I.; Rad, S.D.; Fæster, S. Leading edge erosion of wind turbine blades: Understanding, prevention and protection. Renew. Energy 2021, 169, 953–969. [Google Scholar] [CrossRef]
  4. Wiser, R.; Bolinger, M.; Hoen, B.; Millstein, D.; Rand, J.; Barbose, G.; Darghouth, N.; Gorman, W.; Jeong, S.; O’Shaughnessy, E.; et al. Land-Based Wind Market Report: 2023 Edition; LBL Publications, U.S Department of Energy: Washington, DC, USA, 2023. [Google Scholar]
  5. Keegan, M.H.; Nash, D.H.; Stack, M.M. On erosion issues associated with the leading edge of wind turbine blades. J. Phys. D Appl. Phys. 2013, 46, 383001. [Google Scholar] [CrossRef]
  6. Wiser, R.; Jenni, K.; Seel, J.; Baker, E.; Hand, M.; Lantz, E.; Smith, A. Forecasting Wind Energy Costs and Cost Drivers: The Views of the World’s Leading Experts. 2016. Available online: https://escholarship.org/uc/item/0s43r9w4 (accessed on 15 July 2025).
  7. Sareen, A.; Sapre, C.A.; Selig, M.S. Effects of leading edge erosion on wind turbine blade performance. Wind. Energy 2014, 17, 1531–1542. [Google Scholar] [CrossRef]
  8. Elgendi, M.; AlMallahi, M.; Abdelkhalig, A.; Selim, Y. A review of wind turbines in complex terrain. Int. J. Thermofluids 2023, 17, 100289. [Google Scholar] [CrossRef]
  9. Gao, C.; Zhu, S.; An, N.; Na, H.; You, H.; Gao, C. Comprehensive comparison of multiple renewable power generation methods: A combination analysis of life cycle assessment and ecological footprint. Renew. Sustain. Energy Rev. 2021, 147, 111255. [Google Scholar] [CrossRef]
  10. Pugh, K.; Rasool, G.; Stack, M.M. Raindrop erosion of composite ma-terials: Some views on the effect of bending stress on erosion mechanisms. J. Bio-Tribo-Corros. 2019, 5, 1–12. [Google Scholar] [CrossRef]
  11. Slot, H.M.; Gelinck, E.R.M.; Rentrop, C.; Van Der Heide, E. Leading edge erosion of coated wind turbine blades: Review of coating life models. Renew. Energy 2015, 80, 837–848. [Google Scholar] [CrossRef]
  12. Bhong, M.; Khan, T.K.; Devade, K.; Krishna, B.V.; Sura, S.; Eftikhaar, H.K.; Thethi, H.P.; Gupta, N. Review of composite materials and applications. Mater. Today Proc. 2023. [Google Scholar] [CrossRef]
  13. Keegan, M.H. Wind Turbine Blade Leading Edge Erosion: An Investigation of Rain Droplet and Hailstone Impact Induced Damage Mechanisms. Ph.D. Thesis, University of Strathclyde, Glasgow, UK, 2014. [Google Scholar]
  14. Herring, R.; Dyer, K.; Martin, F.; Ward, C. The increasing importance of leading edge erosion and a review of existing protection solutions. Renew. Sustain. Energy Rev. 2019, 115, 109382. [Google Scholar] [CrossRef]
  15. Mishnaevsky, L., Jr. Repair of wind turbine blades: Review of methods and related computational mechanics prob-lems. Renew. Energy 2019, 140, 828–839. [Google Scholar] [CrossRef]
  16. Bech, J.I.; Hasager, C.B.; Bak, C. Extending the life of wind turbine blade leading edges by reducing the tip speed during extreme precipitation events. Wind. Energy Sci. 2018, 3, 729–748. [Google Scholar] [CrossRef]
  17. Ansari, Q.M.; Sánchez, F.; Doménech-Ballester, L.; Young, T.M. Evaluation of offshore wind turbine leading edge protection coating failure mode under rain erosion. Procedia Struct. Integr. 2024, 52, 122–132. [Google Scholar] [CrossRef]
  18. Brøndsted, P.; Lilholt, H.; Lystrup, A. Composite Materials for wind Turbine blades. Annu. Rev. Mater. Res. 2005, 35, 505–553. [Google Scholar] [CrossRef]
  19. Li, R.; Ninokata, H.; Mori, M. A numerical study of impact force caused by liquid droplet impingement onto a rigid wall. Prog. Nucl. Energy 2011, 53, 881–885. [Google Scholar] [CrossRef]
  20. Papi, F.; Balduzzi, F.; Ferrara, G.; Bianchini, A. Uncertainty quantification on the effects of rain-induced erosion on annual energy production and performance of a Multi-MW wind turbine. Renew. Energy 2021, 165, 701–715. [Google Scholar] [CrossRef]
  21. Langel, C.M.; Chow, R.C.; Van Dam, C.P.; Maniaci, D.C. RANS Based Methodology for Predicting the Influence of Leading Edge Erosion on Airfoil Performance (No. SAND-2017-11289); Sandia National Lab. (SNL-NM): Albuquerque, NM, USA, 2017. [Google Scholar]
  22. Gohardani, O. Impact of erosion testing aspects on current and future flight conditions. Prog. Aerosp. Sci. 2011, 47, 280–303. [Google Scholar] [CrossRef]
  23. Domenech, L.; Renau, J.; Šakalytė, A.; Sánchez, F. Top coating anti-erosion performance analysis in wind turbine blades depending on relative acoustic impedance. Part 1: Modelling approach. Coatings 2020, 10, 685. [Google Scholar] [CrossRef]
  24. Keegan, M.H.; Nash, D.; Stack, M. Modelling rain drop impact on offshore wind turbine blades. In Proceedings of the TURBO EXPO 2012 GT2012, Copenhagen, Denmark, 11–15 June 2012. [Google Scholar]
  25. Nassiri, A.; Chini, G.; Vivek, A.; Daehn, G.; Kinsey, B. Arbitrary Lagrangian–Eulerian finite element simulation and experimental investigation of wavy interfacial morphology during high velocity impact welding. Mater. Des. 2015, 88, 345–358. [Google Scholar] [CrossRef]
  26. Macek, R.W.; Silling, S.A. Peridynamics via finite element analysis. Finite Elem. Anal. Des. 2007, 43, 1169–1178. [Google Scholar] [CrossRef]
  27. Bartolomé, L.; Teuwen, J. Prospective challenges in the experimentation of the rain erosion on the leading edge of wind turbine blades. Wind. Energy 2019, 22, 140–151. [Google Scholar] [CrossRef]
  28. Verma, A.S.; Castro, S.G.; Jiang, Z.; Teuwen, J.J. Numerical investigation of rain droplet impact on offshore wind turbine blades under different rainfall conditions: A parametric study. Compos. Struct. 2020, 241, 112096. [Google Scholar] [CrossRef]
  29. Elhadi Ibrahim, M.; Medraj, M. Water droplet erosion of wind turbine blades: Mechanics, testing, modeling and future perspectives. Materials 2019, 13, 157. [Google Scholar] [CrossRef] [PubMed]
  30. O’Carroll, A. Correlation of Mechanical Properties to Rain Erosion Resistance of Polymeric Materials. 2018. Available online: https://researchrepository.ul.ie/articles/thesis/Correlation_of_mechanical_properties_to_rain_erosion_resistance_of_polymeric_materials/19809898?file=35261017 (accessed on 22 May 2025).
  31. Mesh Tie Constraints. Available online: https://abaqus-docs.mit.edu/2017/English/SIMACAECSTRefMap/simacst-c-tiedconstraint.htm (accessed on 21 February 2025).
  32. ABAQUS, Inc. ABAQUS/Explicit: Advanced Topics. 2005. Available online: http://ftp.demec.ufpr.br/disciplinas/TM738/l7-connections.pdf (accessed on 27 July 2025).
  33. McHale, G.; Gao, N.; Wells, G.G.; Barrio-Zhang, H.; Ledesma-Aguilar, R. Friction coefficients for droplets on solids: The Liquid–Solid Amontons’ Laws. Langmuir 2022, 38, 4425–4433. [Google Scholar] [CrossRef]
  34. Doagou-Rad, S.; Mishnaevsky, L. Rain erosion of wind turbine blades: Computational analysis of parameters con-trolling the surface degradation. Meccanica 2020, 55, 725–743. [Google Scholar] [CrossRef]
  35. Bech, J.I.; Johansen, N.F.J.; Madsen, M.B.; Hannesdóttir, Á.; Hasager, C.B. Experimental study on the effect of drop size in rain erosion test and on lifetime prediction of wind turbine blades. Renew. Energy 2022, 197, 776–789. [Google Scholar] [CrossRef]
  36. Zhang, Y.; Pan, G.; Zhang, Y.; Haeri, S. A multi-physics peridynamics-DEM-IB-CLBM framework for the prediction of erosive impact of solid particles in viscous fluids. Comput. Methods Appl. Mech. Eng. 2019, 352, 675–690. [Google Scholar] [CrossRef]
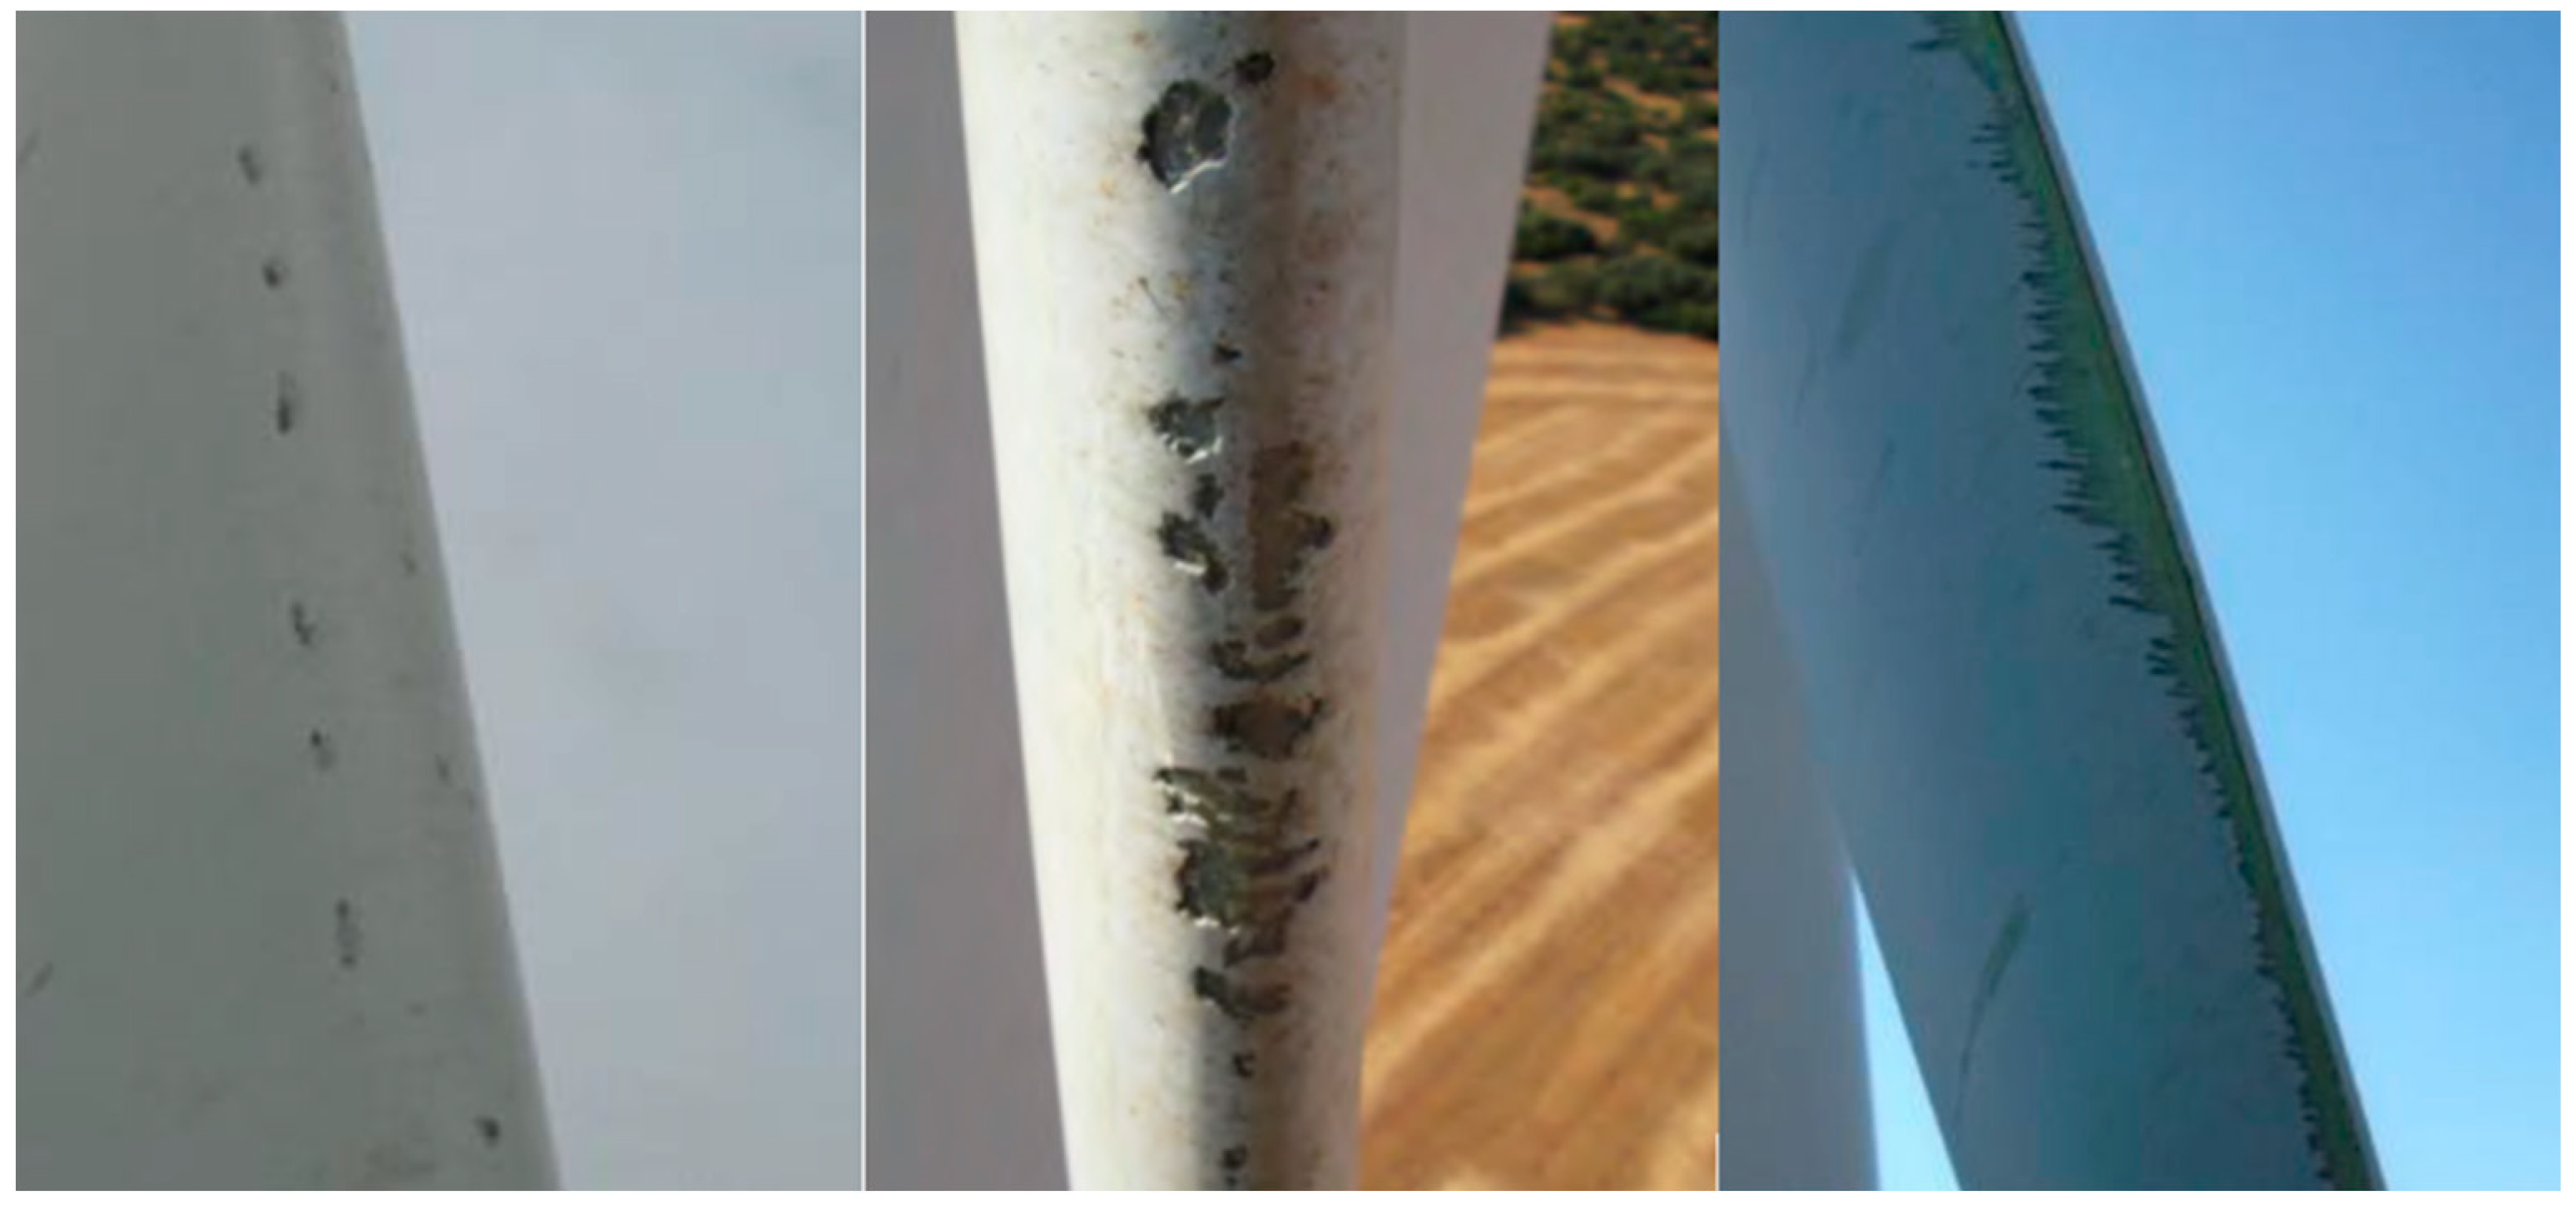
Figure 1. Surface pits that may progress to crack propagation in the leading edge protection (LEP) material or through the composite substrate, affecting its integrity and aerodynamic performance.
Applsci 15 08682 g001
Figure 2. (a) Stress wave behaviour under impingement on the multilayer material and (b) corresponding numerical simulation [22,23].
Applsci 15 08682 g002
Figure 3. Schematic of the material composition of the FEA Abaqus model.
Applsci 15 08682 g003
Figure 4. Slave and master surfaces schematics for mesh friction formulation and mesh types of contacts.
Applsci 15 08682 g004
Figure 5. von Mises and S33 stress analysis for tie, bonded, and merged contact interactions between Filler and LEP assigned with same materials.
Applsci 15 08682 g005
Figure 6. (a) von Mises and (b) S33 Stress for different friction coefficients (from frictionless up to µ = 0.5).
Applsci 15 08682 g006
Figure 7. S33 Stress for different impact velocities (from 80 m/s to 160 m/s).
Applsci 15 08682 g007
Figure 8. S33 Peak Stress for different impact velocities (Theoretical values vs. Numerical values).
Applsci 15 08682 g008
Figure 9. von Mises stress for different droplet diameters, 0.5 mm–4.5 mm.
Applsci 15 08682 g009
Figure 10. S33 for varying droplet diameters, 0.5 mm–5 mm. (MATLAB Fit vs. Numerical FE values).
Applsci 15 08682 g010
Figure 11. von Mises stress for varying droplet diameters, 0.5 mm–5 mm. (MATLAB Fit vs. Numerical FE values).
Applsci 15 08682 g011
Table 1. Isotropic materials layers’ properties [13,28].
LayersProperties
Density ρ (kg/m3)Young’s Modulus E (GPa)Poisson’s Ratio ν
LEP (Gelcoat Epon E862 Epoxy)11502.50.4
Filler1452.880.3
Aluminium (Al)2820700.3
Table 2. Anisotropic materials layers’ properties GFRP [28].
Properties GFRP
Density ρ (kg/m3)1864
Young’s modulus E11 (GPa)44.87
Young’s modulus E22 (GPa)12.13
Young’s modulus E33 (GPa)12.13
Poisson’s ratio ν120.3
Poisson’s ratio ν130.3
Poisson’s ratio ν230.5
Shear modulus G12 (GPa)3.38
Shear modulus G13 (GPa)3.38
Shear modulus G23 (GPa)3.38
Table 3. Computational time for different friction coefficients (from frictionless up to µ = 0.5).
Friction CoefficientWALL Time (s)
0509
0.1452
0.2437
0.3411
0.4412
0.5416
Disclaimer/Publisher’s Note: The statements, opinions and data contained in all publications are solely those of the individual author(s) and contributor(s) and not of MDPI and/or the editor(s). MDPI and/or the editor(s) disclaim responsibility for any injury to people or property resulting from any ideas, methods, instructions or products referred to in the content.