Article

Intelligent Fault Warning Method for Wind Turbine Gear Transmission System Driven by Digital Twin and Multi-Source Data Fusion

School of Mechanical Engineering, Xinjiang University, Urumqi 830046, China
*
Author to whom correspondence should be addressed.
Appl. Sci. 2025, 15(15), 8655; https://doi.org/10.3390/app15158655 (registering DOI)
Submission received: 23 June 2025 / Revised: 2 August 2025 / Accepted: 3 August 2025 / Published: 5 August 2025

Abstract

To meet the demands for real-time and accurate fault warning of wind turbine gear transmission systems, this study proposes an innovative intelligent warning method based on the integration of digital twin and multi-source data fusion. A digital twin system architecture is developed, comprising a high-precision geometric model and a dynamic mechanism model, enabling real-time interaction and data fusion between the physical transmission system and its virtual model. At the algorithmic level, a CNN-LSTM-Attention fault prediction model is proposed, which innovatively integrates the spatial feature extraction capabilities of a convolutional neural network (CNN), the temporal modeling advantages of long short-term memory (LSTM), and the key information-focusing characteristics of an attention mechanism. Experimental validation shows that this model outperforms traditional methods in prediction accuracy. Specifically, it achieves average improvements of 0.3945, 0.546 and 0.061 in Root Mean Square Error (RMSE), Mean Absolute Percentage Error (MAPE), and R-squared (R2) metrics, respectively. Building on the above findings, a monitoring and early warning platform for the wind turbine transmission system was developed, integrating digital twin visualization with intelligent prediction functions. This platform enables a fully intelligent process from data acquisition and status evaluation to fault warning, providing an innovative solution for the predictive maintenance of wind turbines.

1. Introduction

As global energy demand continues to rise and environmental awareness grows, wind energy, as a renewable and clean energy source, is rapidly developing and being widely adopted worldwide. According to the latest data from the 73rd edition of the Statistical Review of World Energy (2024), global electricity generation increased by 2.5% in 2023, reaching a new record of 29,925 terawatt-hours. The growth rate of electricity generation was 25% higher than that of global primary energy consumption, indicating the increasing level of electrification within the world’s energy system. Against the backdrop of global energy transition, pressing environmental issues and the unsustainable nature of traditional energy sources are accelerating the rapid development of renewable energy technologies. As one of the most promising clean energy sources, wind energy is becoming increasingly vital in the global energy system due to its environmental friendliness and renewability. This shift not only reflects the great importance that the international community attaches to ecological protection but also embodies the strategic need to address climate change and achieve low-carbon development. Currently, wind power generation technology has become a fundamental pillar in reshaping the energy structure and achieving sustainable development goals.
According to statistical data from the Global Wind Energy Council (GWEC) 2024 annual report, the global cumulative installed wind power capacity exhibited a steady upward trend over the past decade (2013–2023), as shown in Figure 1a. In 2023, the newly added global installed capacity was approximately 117 GW, an increase of 48.1% compared to 2022, raising the total global installed capacity to over 1017 GW. According to the latest statistics, as of the end of 2023, China’s cumulative installed wind power capacity exceeded 440 GW, representing 43.7% of the total global installed capacity (as shown in Figure 1b).
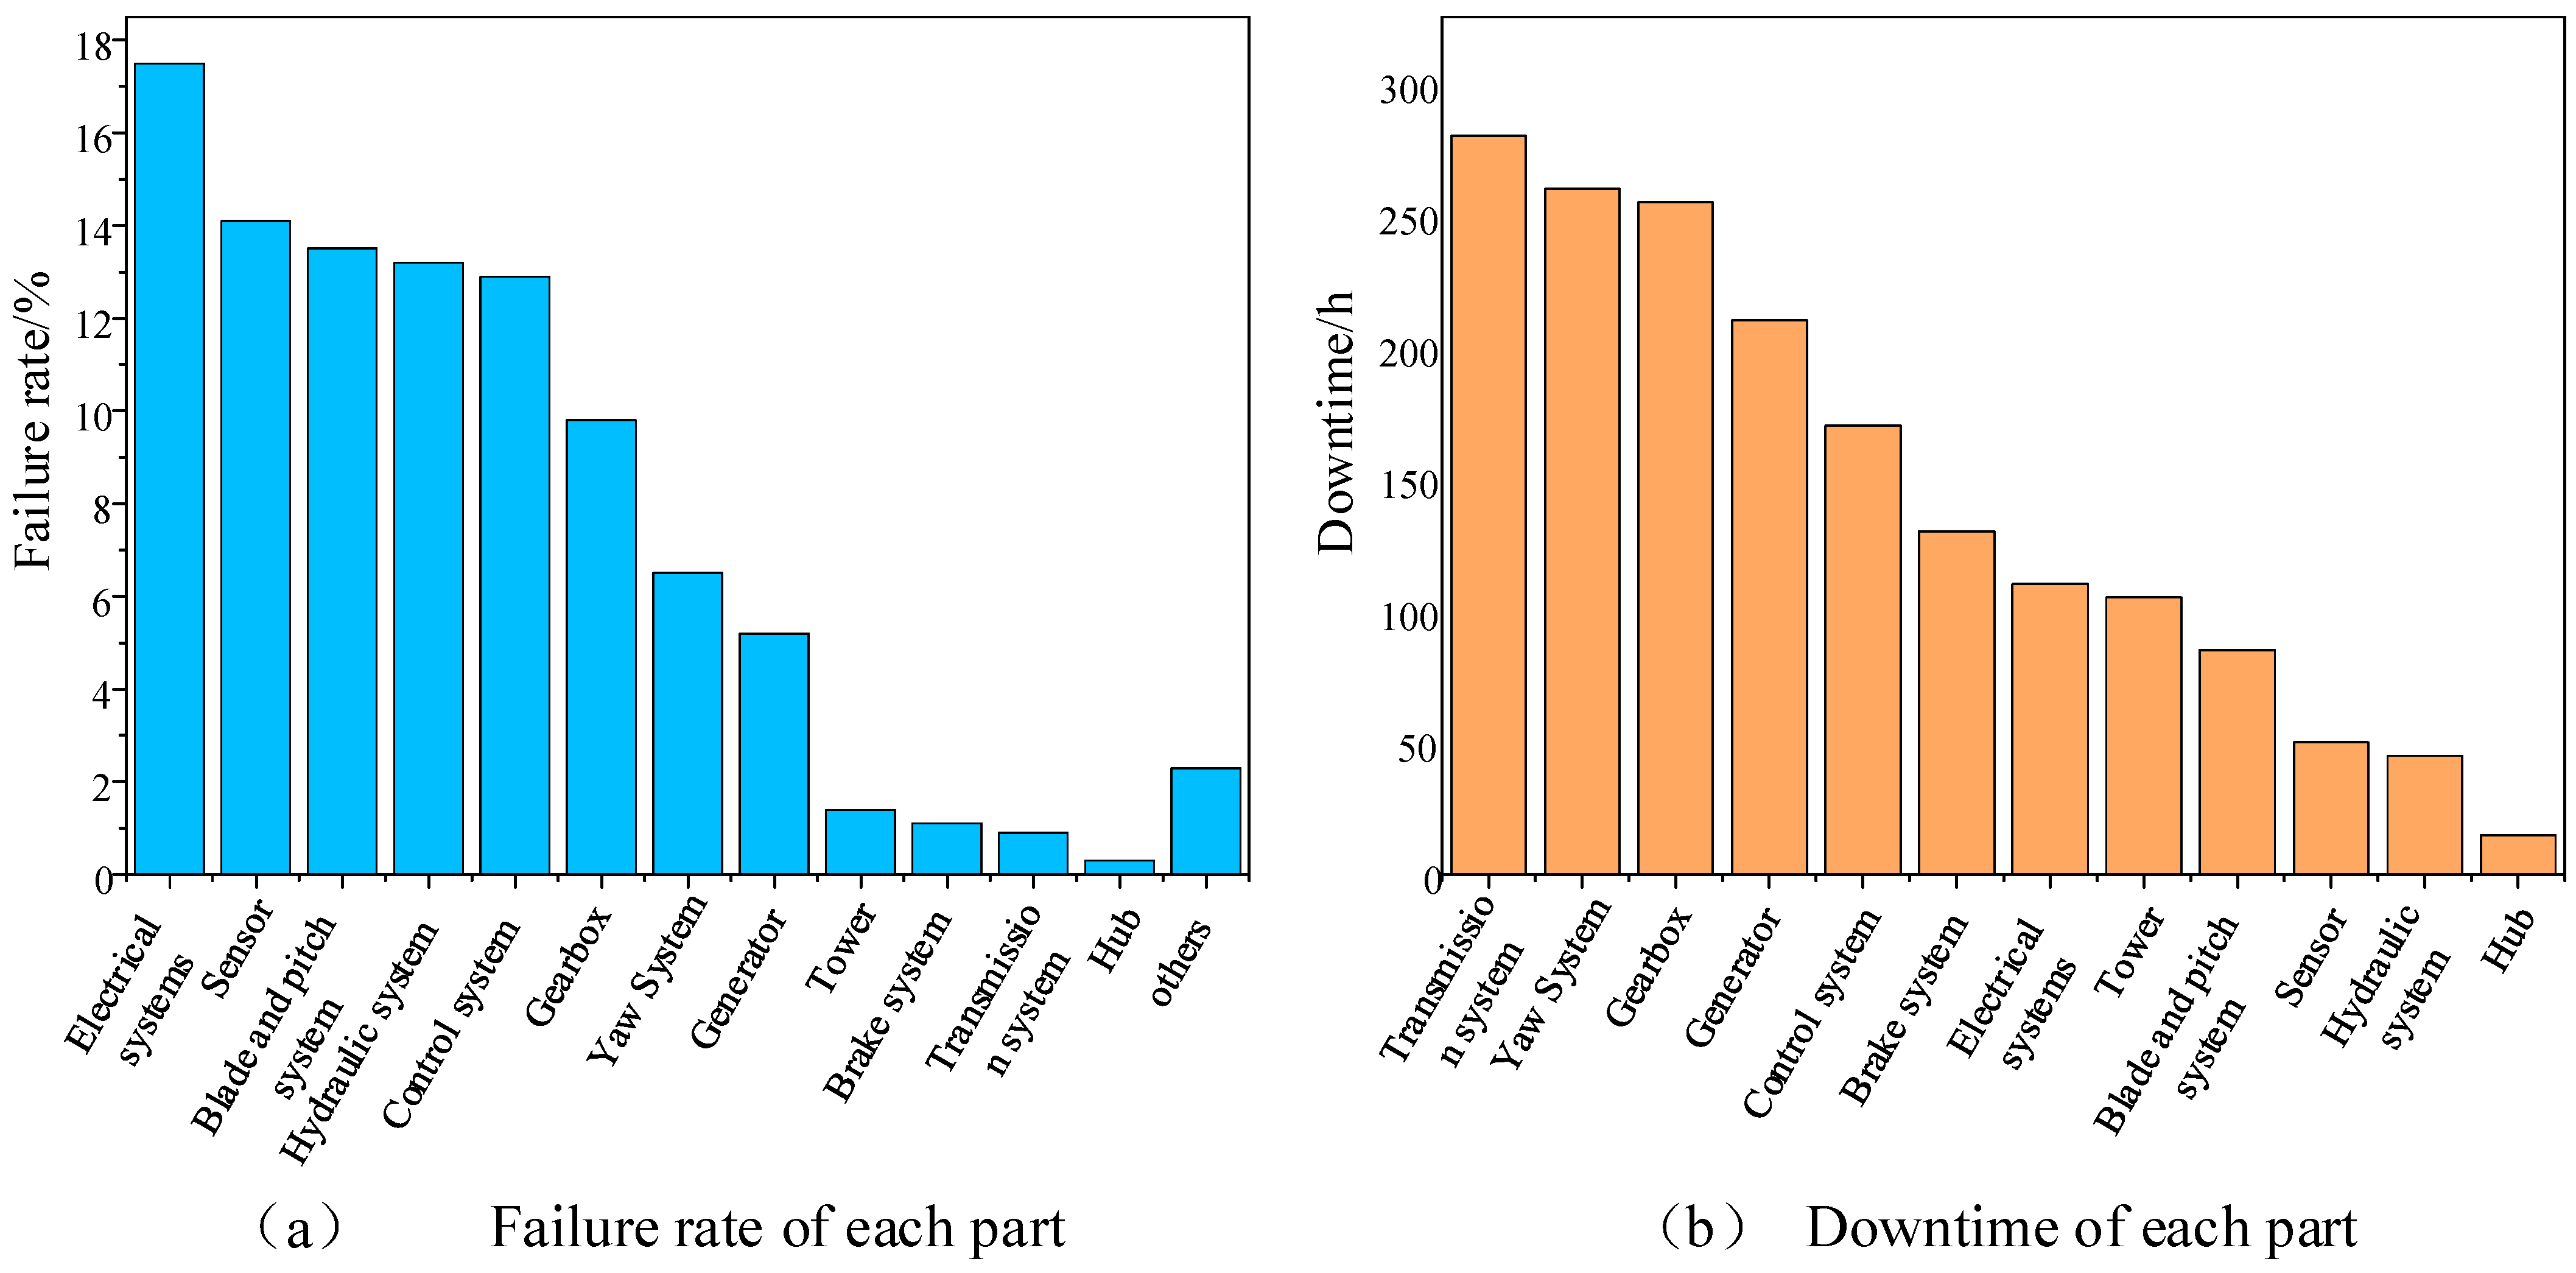
With the rapid growth of the global wind power industry, the challenges hindering the development of the industry are becoming increasingly prominent, leading to increased demands for the operational stability of wind turbines. As the core component for energy conversion in a wind turbine, the gear transmission system plays a crucial role in efficiently transforming the rotor’s mechanical energy into electrical energy. Therefore, its reliability directly affects the operational efficiency of the entire power generation system. The gear transmission system, as an essential component of the wind turbine, is responsible for efficiently converting the rotor’s mechanical energy into electrical energy. It not only needs to endure substantial dynamic loads from the rotor but also withstand complex alternating loads and extreme environmental conditions encountered during high-speed operation and frequent startups and shutdowns [1]. According to the fault statistics in Figure 2, the electrical system is most prone to faults; however, these faults typically lead to shorter downtime and are easier to repair. Although the gearbox and transmission system experience failures less frequently than the electrical system, such failures lead to longer downtime and higher economic losses [2]. Therefore, reducing maintenance costs of gear transmissions, minimizing downtime, and enhancing the operational reliability of the units have become crucial to strengthening the competitiveness of the wind power industry.
In the field of operation and maintenance (O&M) for gear transmission systems, traditional methods that rely on periodic inspections and empirical judgments have obvious limitations, including problems such as low detection efficiency and insufficient result reliability. In recent years, with breakthroughs in big data analytics and intelligent algorithm technologies, data-driven fault prediction methods have gained widespread attention in the health management of wind power equipment, demonstrating significant technical advantages. This approach entails collecting multi-source operational data (such as temperature, speed, and vibration) from the wind turbine gearbox [3,4] and combining it with advanced signal processing methods and deep learning models to achieve incipient fault diagnosis in the gear transmission system. Practical experience has shown that this data-driven predictive maintenance strategy not only effectively guarantees the reliable operation of the power generation system but also optimizes O&M costs. It holds significant engineering application value and offers theoretical guidance for promoting the digital transformation of the wind power industry.

2. Related Works

Numerous scholars and research institutions have extensively researched and explored the prediction and maintenance of abnormal conditions in wind turbine gear transmission systems. By analyzing vibration data, SCADA data, and other information from wind turbines, researchers employ techniques such as probability and statistics [5,6,7], machine learning [8,9,10], deep learning [11,12,13], and signal analysis processing [14,15,16] to analyze operational data and thereby achieve fault prediction in the gear transmission system. The Supervisory Control and Data Acquisition (SCADA) system, a standard configuration in modern large-scale wind turbines, collects massive amounts of operational data that comprehensively capture the operating status of key components. Consequently, fault prediction methods for wind turbine gear transmission systems based on SCADA data have garnered widespread attention from researchers. Vidal et al. [17] proposed a fault detection strategy based on high-frequency SCADA data and multi-linear principal component analysis for feature dimensionality reduction. This approach implements multi-class fault detection using support vector machines in nonlinear, high-noise environments, thereby verifying the feasibility of efficient monitoring based on the existing SCADA system. Tutivén et al. [18] proposed an incipient fault diagnosis strategy based on SCADA data, utilizing support vector machines for anomaly detection trained exclusively on normal operation data. Experiments proved that this method effectively reduces the operation and maintenance costs of wind turbines. Rashid et al. [19] used SCADA data and machine learning techniques to predict gearbox temperature and employed an ensemble regression method to forecast severe gearbox failures, thus preventing catastrophic events. Murgia et al. [20] proposed a weakly supervised convolutional neural network-driven thresholding method that successfully predicted faults in a wind turbine transmission system. Encalada et al. [21] proposed a method using a gated recurrent unit neural network to detect the main bearing faults in wind turbines in advance by analyzing SCADA data. Castellani et al. [22] proposed a SCADA fault prediction method that combines principal component analysis with support vector regression. This approach successfully detected anomalies prior to the occurrence of faults by analyzing residual changes, offering a viable technical path for early fault warning. Rama et al. [23] proposed a wind turbine fault prediction and condition monitoring method utilizing recurrent neural networks and long short-term memory networks. Experimental validation showed that this method outperforms existing machine learning algorithms in terms of prediction accuracy and practicality. Encalada et al. [24] proposed an unsupervised prediction method based on SCADA data, which successfully realized fault warning by means of healthy data and adaptive operating condition compensation. Chokr et al. [25] proposed an anomaly detection method based on a bidirectional long short-term memory network that effectively detects wind turbine faults using a sliding window strategy. This method successfully detected a fault of the same wind turbine by analyzing the normal data of a single wind turbine. Tao et al. [26] proposed a prediction model based on a bidirectional recurrent neural network and sliding window residual analysis. By extracting features from SCADA data, they effectively realized fault prediction for wind turbines.
In recent years, the application of digital twin technology to industrial equipment has seen rapid development. Numerous scholars have achieved real-time monitoring and visualization of large-scale equipment by constructing digital twin models [27,28,29,30]. At the same time, digital twin technology has also begun to be adopted in the field of wind power equipment. Qin Shengqiong et al. [31] first explored the development trends and application prospects of digital twin in the innovative design of complex wind turbine systems in 2021. Wang Xin et al. [32] utilized digital twin technology to develop a digital twin model of the power grid based on a five-dimensional DT model and outlined the challenges of implementing this technology in the power grid from six perspectives. Fang Fang et al. [33] proposed the concept of real-time cyber-physical mapping and developed a digital twin system for wind turbines that fully leverages existing SCADA data to monitor operational status of wind turbines. To address the problem of lagging O&M management for wind turbines, Su Changpeng [34] proposed a digital twin system model based on system engineering theory, constructed a prototype digital twin system for wind turbine O&M by using a simulation model, a digital-end model, and an O&M management model, and verified its feasibility. Zhao Xuanhui [35] designed and developed a cloud-based digital twin software (Version:1.0) system for wind farms, consisting of three components: host computer software Version:1.0, a data service platform, and application modules, enabling 3D model visualization and data monitoring for wind turbines. Farid K. Moghadam [36] constructed a digital twin model for the transmission system of an offshore wind turbine using a torque dynamics model, online measurements, and fatigue damage assessment. He proposed a condition monitoring method that utilized the torque dynamics model; however, its accuracy was limited because wind turbines operate in a coupled field. Xiang Zhao et al. [37] used reduced-order modeling techniques for components to develop a digital twin model of a wind turbine with varying parameters. This model can provide real-time predictions of structural responses and health conditions resulting from wind and wave loads. Olatunji [38] pointed out that digital twin technology can predict faults of individual components of a wind turbine, making monitoring and maintenance more efficient, but its functionality is too limited. Montaser Mahmoud et al. [39] developed a digital twin system for a wind turbine, which is composed of physical, digital, connection, and service systems. It significantly enhanced operational and maintenance efficiency, resulting in a longer service lifespan, shorter downtime, and higher safety performance. Shu Liu et al. [40] created a digital twin model to accurately predict wind power in real time, and also proposed an ultra-short-term wind power prediction method based on digital twin technology, obtaining predicted values using a BP neural network. Furthermore, digital twin technology applications in the wind turbine field also include structural response [41], lifetime prediction [42], and reliability analysis [43].
In summary, the analysis and mining of multi-source data provide effective means for the real-time monitoring, fault prediction, and operation and maintenance of wind turbines. However, current prediction models still exhibit significant shortcomings in multi-source data fusion and learning from high-dimensional complex data. These deficiencies are primarily reflected in the limited ability to perform integrated learning on complex multi-source data and the challenge of fully capturing the high-order nonlinear relationships among diverse data sources. Furthermore, traditional attention mechanisms lack the flexibility to assign importance to multi-source data under dynamic operating conditions, and exhibit limited robustness to small-sample fault data and noise disturbances, resulting in poor generalization performance of the models in practical applications. Therefore, there is an urgent need to optimize these models by employing more advanced fusion strategies and adaptive learning mechanisms to enhance their predictive capabilities. Meanwhile, although existing research has attempted to integrate digital twin technology with wind turbine operational monitoring, the current digital twin models are not well integrated with mechanistic models and intelligent prediction models, which constrains the level of operational monitoring and fault prediction for wind turbines. Therefore, this paper takes a typical wind turbine gear transmission system as the research object to systematically study an intelligent fault warning method based on digital twin and multi-source data fusion. It designs the overall architecture of the digital twin for the wind turbine gear transmission system and focuses on the construction methods for the geometric model and mechanism model of the digital twin system. A CNN-LSTM-Attention-based digital twin fault prediction model is proposed by combining a convolutional neural network (CNN), a long short-term memory (LSTM) network, and an attention mechanism based on the Transformer architecture. This model utilizes the CNN to extract high-dimensional local features from complex multi-source operational data and leverages LSTM to capture the fault evolution patterns across time steps, enabling long-term temporal dependency modeling. Finally, through the learning of attention components, the model achieves more rational and adaptive weight allocation, focusing on key feature information to generate higher-precision prediction outputs. This study aims to achieve more accurate fault prediction and real-time, efficient monitoring and maintenance.

3. Materials and Methods

3.1. Basic Structure and Working Principle of the Wind Turbine Gear Transmission System

Modern wind turbine units can be classified into three main categories based on their different transmission methods: direct-drive, semi-direct-drive, and gear-driven. The gear-driven type, due to its technological maturity and cost-effectiveness, holds a dominant position in regions with abundant wind resources. As shown in Figure 3, the basic composition of such a unit includes core components like the support tower, engine compartment assembly, rotor system, speed-up gearbox, and generator set.
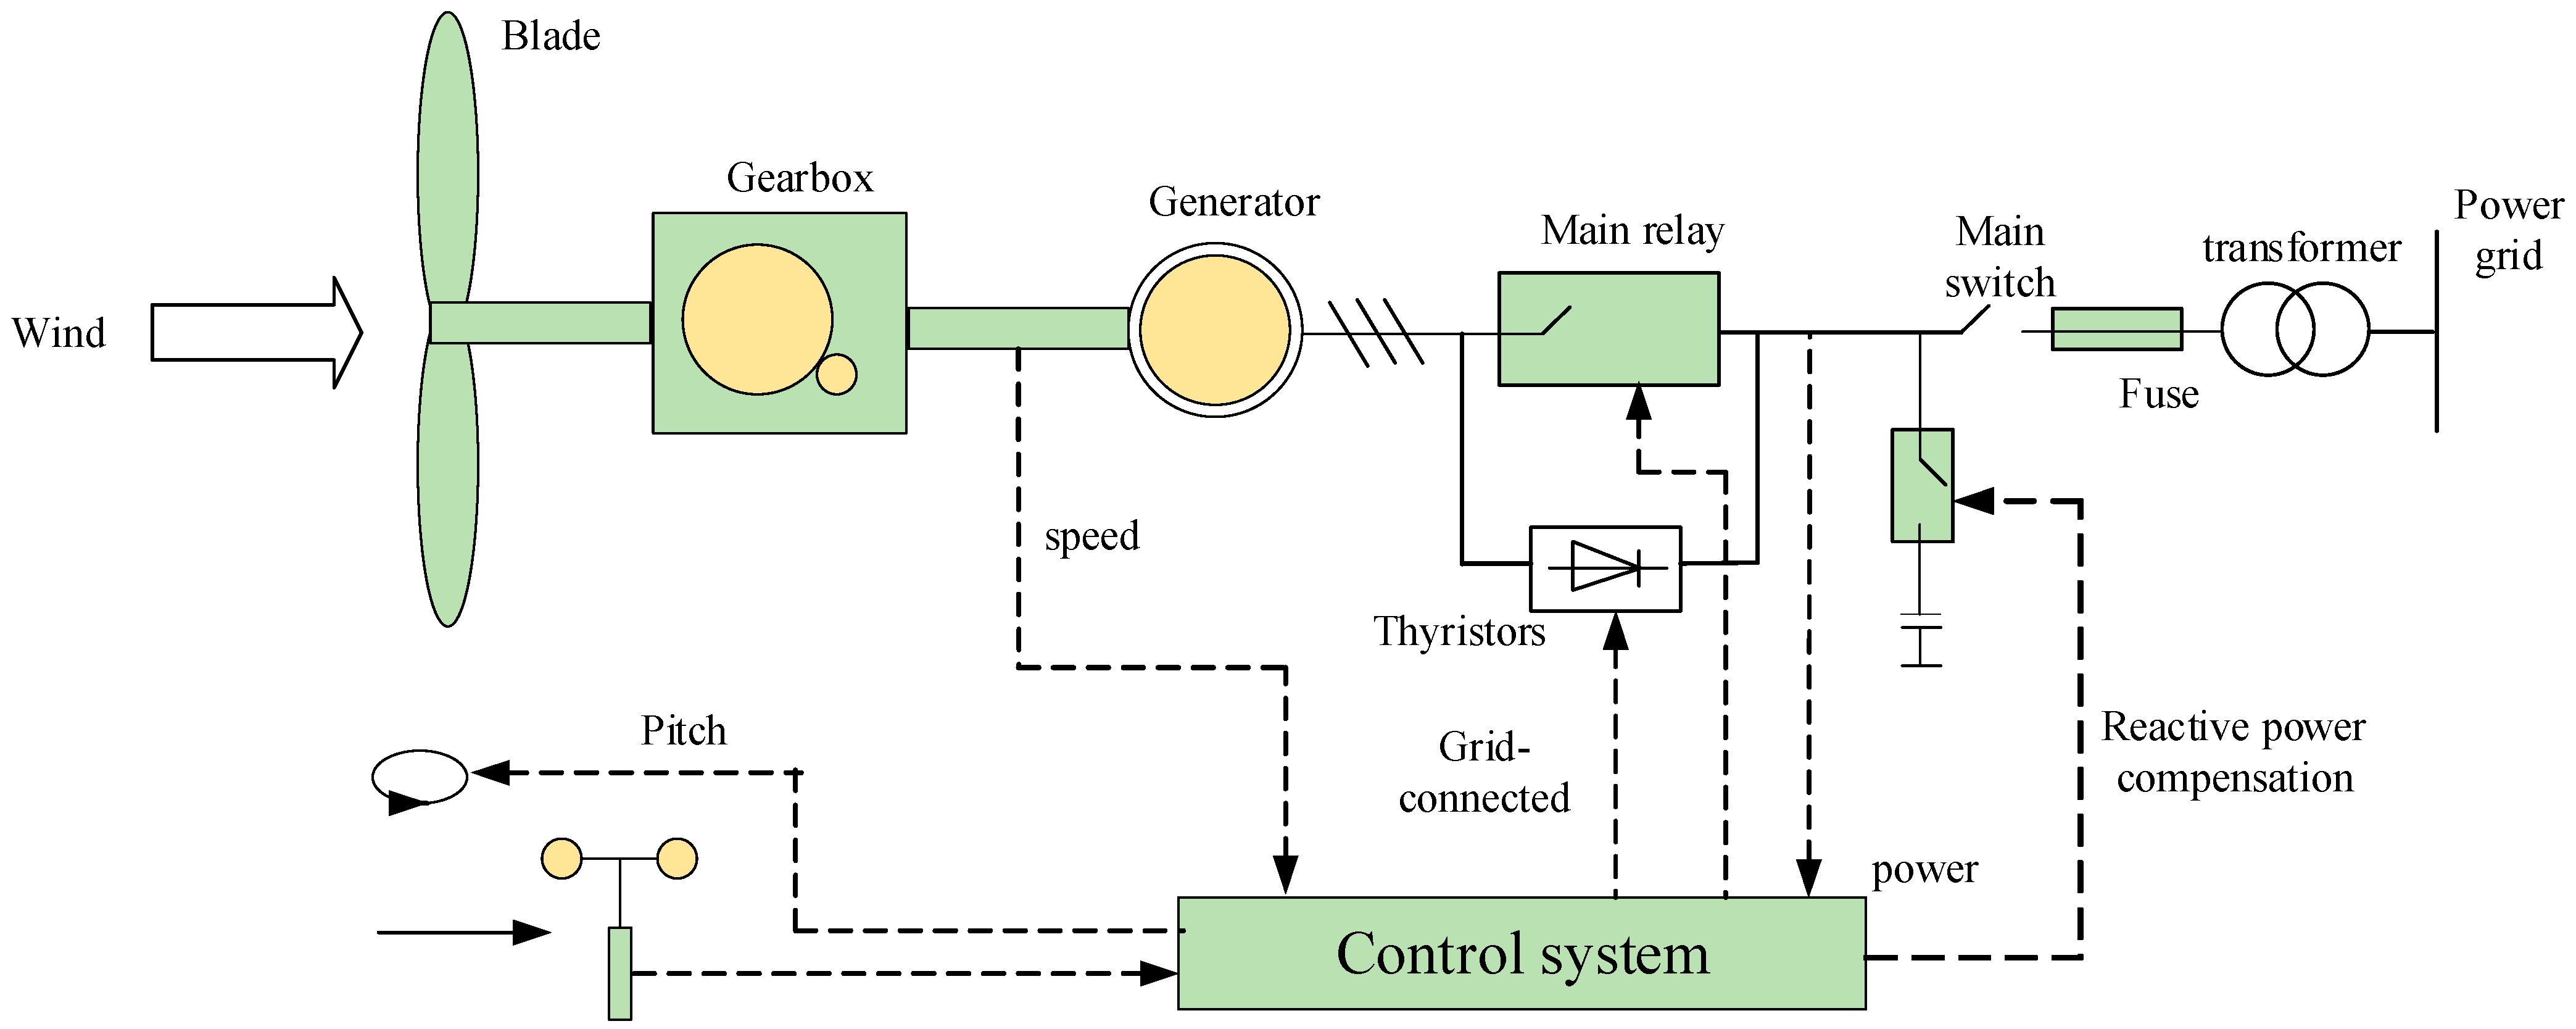
The mechanical energy generated by high-speed rotation is transmitted to the generator, which then converts it into electrical energy. This electrical energy is subsequently delivered to the power grid through a converter. The relationship between turbine blades and the gear transmission system is primarily reflected in the energy conversion process. As the turbine operates, the blades capture wind energy through their rotation and convert it into mechanical energy, which then drives the gear transmission system. Figure 4 illustrates the working principle of the wind turbine.
The gearbox of this wind turbine employs a gear transmission system that integrates a single-stage planetary gear set with a two-stage parallel helical gear set. As shown in Figure 5, one end of the main rotor shaft is connected to the rotor, and the other end is connected to the planet carrier. The gear wheel on the low-speed shaft is connected to the sun shaft via a spline, forming a rigid coupling. The gear wheel on the low-speed shaft meshes with the pinion on the intermediate-speed shaft, which then drives the gear wheel on the intermediate-speed shaft via a spline. Subsequently, the gear wheel on the intermediate-speed shaft meshes with the pinion on the high-speed shaft, completing the stepwise power transmission and speed increment process.

3.2. Overall Architecture Design of the Digital Twin for the Wind Turbine Gear Transmission System

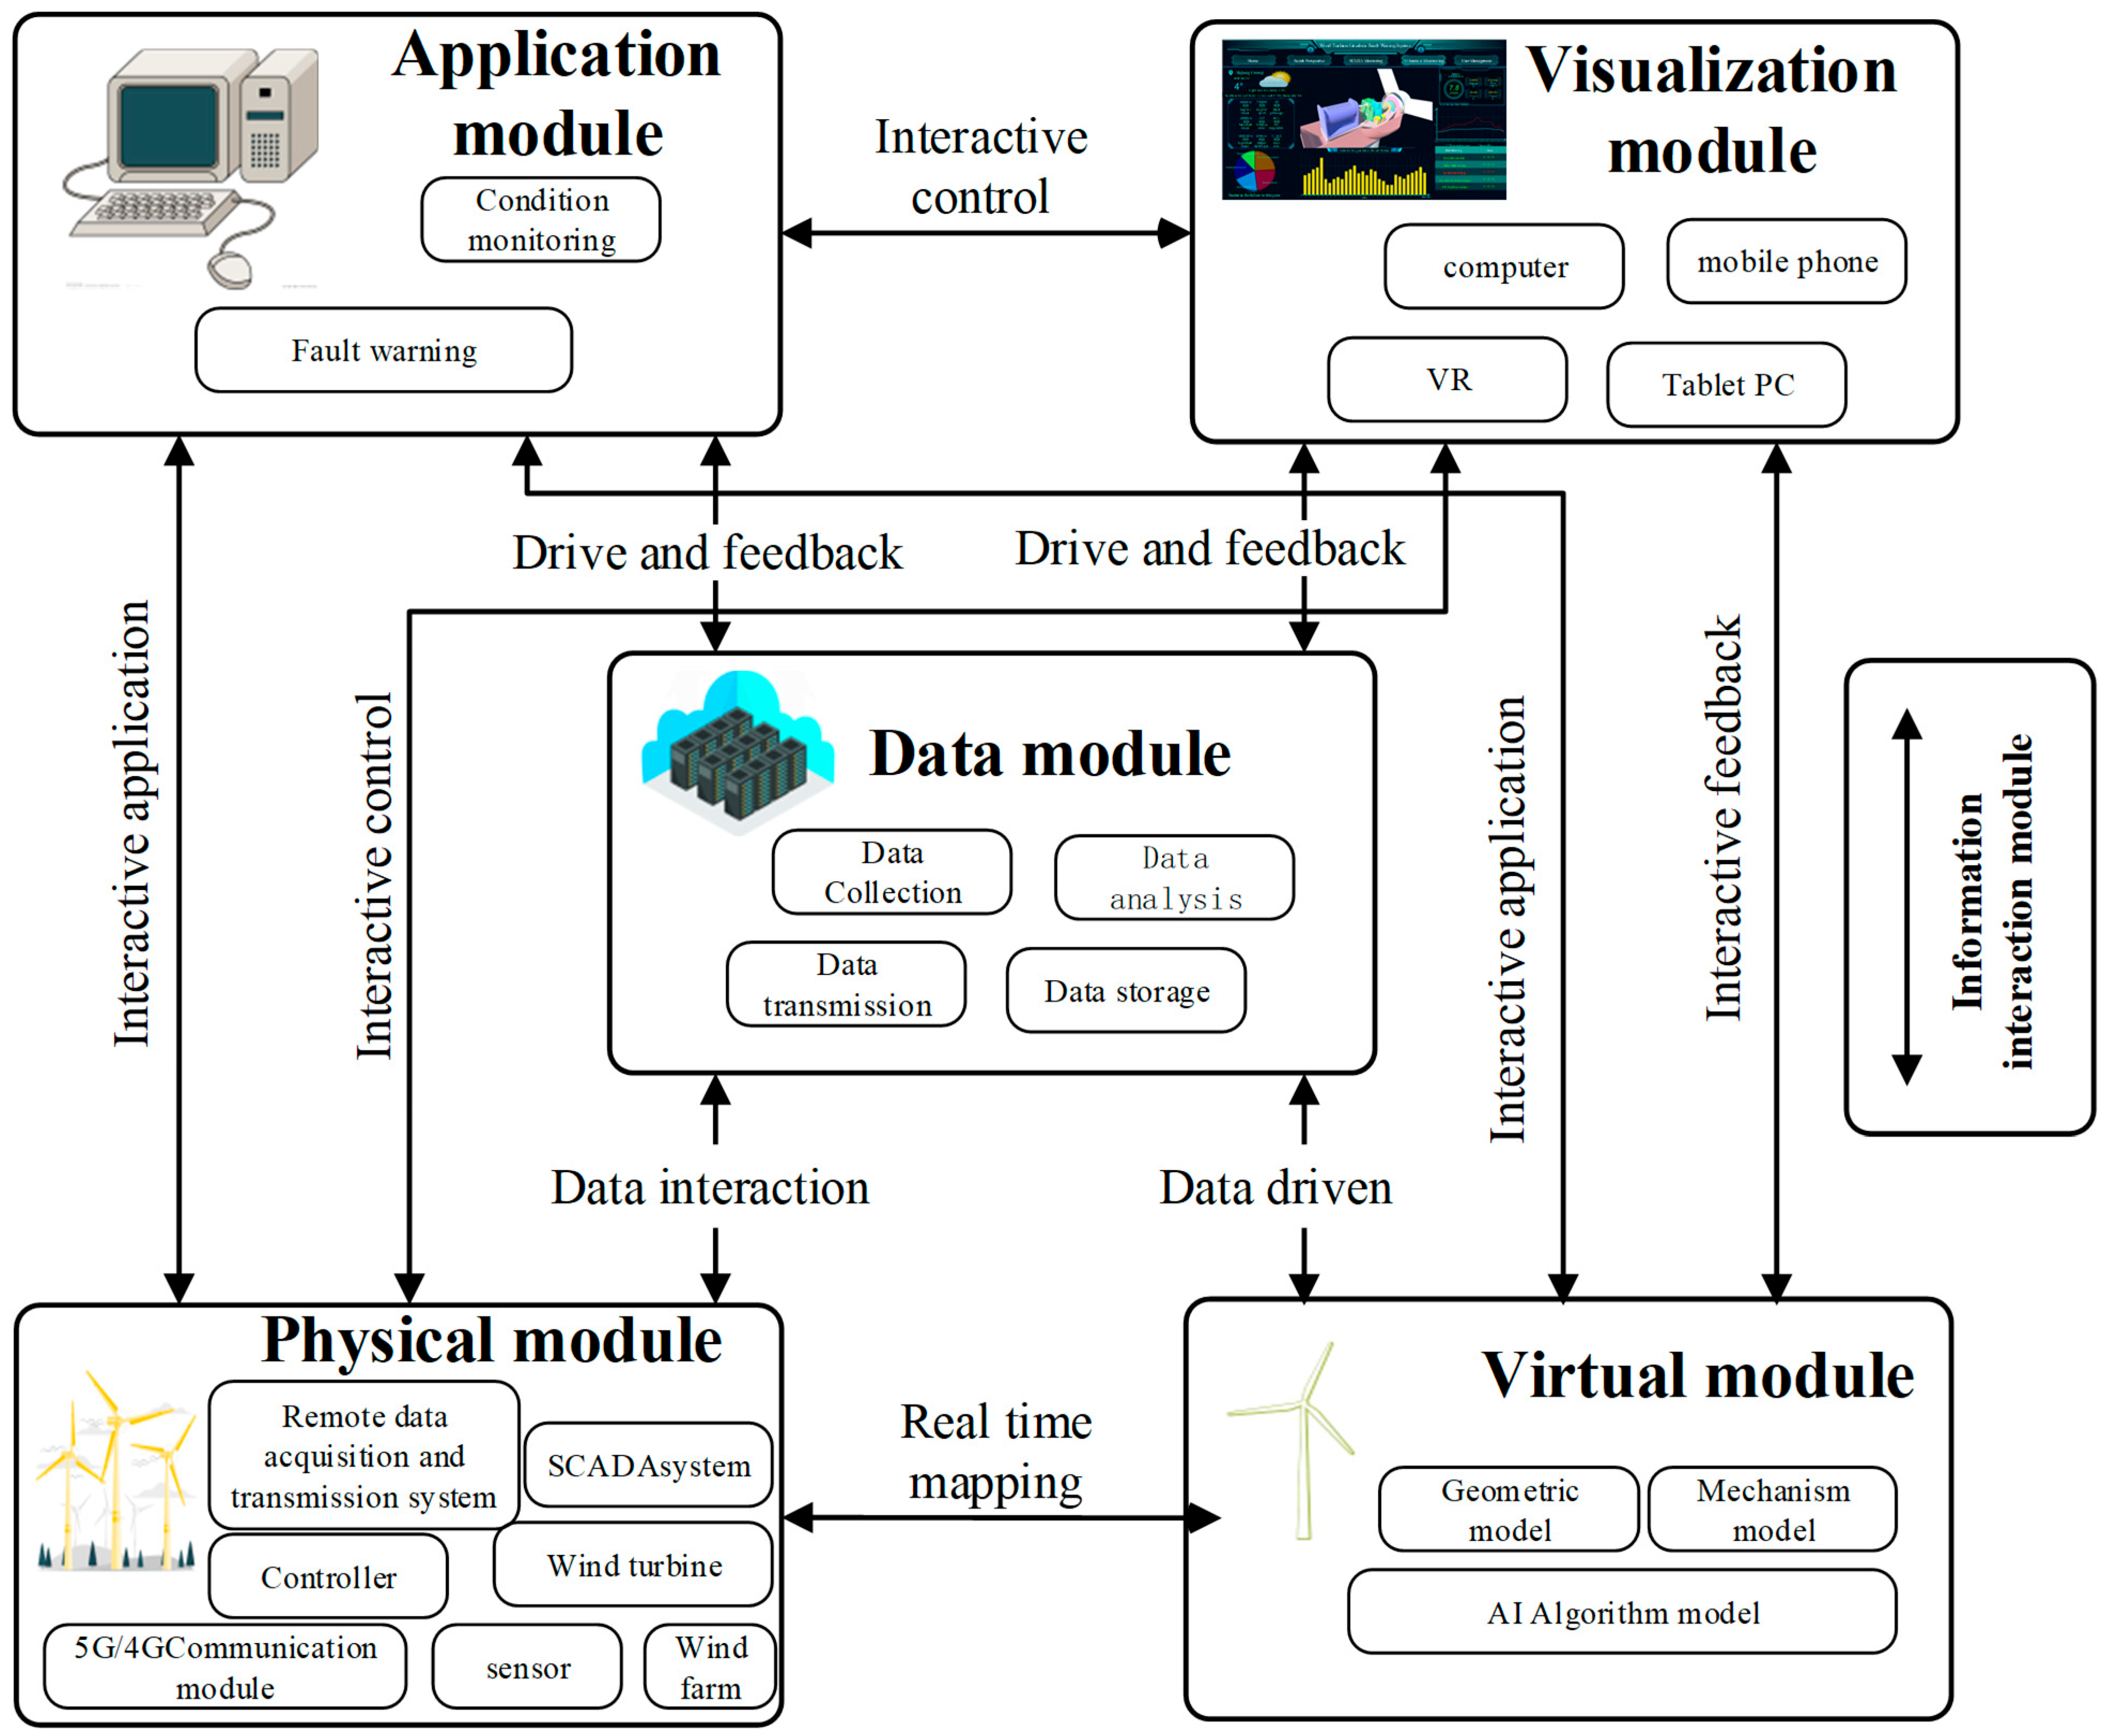
The overall design of the digital twin for the wind turbine gear transmission system is shown in Figure 6. The system primarily comprises six modules: the physical module, virtual module, data module, application module, information interaction module, and visualization module.
(1) The physical module comprises the wind farm environment, the physical wind turbine, and all the devices equipped on it, mainly including the wind turbine entity, sensors, controllers, a remote data acquisition and transmission system, the SCADA system, and wireless communication modules. Coordination among these components ensures the proper operation and real-time condition monitoring of the wind turbine. Sensors primarily collect dynamic operational data from the wind turbine; the controller, upon detecting an anomaly, receives control commands to intervene in the turbine’s operating status; the wireless communication module primarily handles wireless data transmission. The physical module serves as the foundation for the mathematical models. All other modules are built around the physical module and ensure its normal and sound operation.
(2) The virtual module is a high-fidelity mathematical representation of the physical module, consisting of three types of models: a geometric model, a mechanistic model, and an AI algorithm model. The geometric model’s information is obtained from the physical wind turbine and its associated devices, enabling visualization within a virtual environment. The mechanistic model describes the underlying mechanism changes during operation. The AI algorithm model is a mathematical model used to solve high-dimensional, nonlinear, complex problems. As the twin of the physical module, the virtual module must accurately map the actual status of the physical module.
(3) The data module is primarily responsible for managing the data generated by the physical module during actual operation, handling tasks such as data acquisition, processing, interaction, and storage. It manages both inherent static data and dynamic data from operations. Static data refers to inherent information that generally does not change significantly over time, whereas dynamic data is generated by the physical entity during operation and can be stored as historical data for fault warning, diagnosis, and status assessment. Unlike static data, dynamic data changes over time. When combined with specific models, different types of dynamic data can be utilized for targeted diagnosis and warning for the system. Historical data can be used to evaluate the operational condition of the equipment.
(4) The application module is responsible for executing specific functions. All algorithms and mathematical models used in the twin system are encapsulated in this module. It uses dynamic and historical data from the data module to drive the mathematical models, enabling visual monitoring of the wind turbine’s real-time motion state, power output, wind speed, etc. Additionally, it can perform fault diagnosis, prediction, maintenance, and lifetime prediction for the wind turbine, ensuring reliable operation throughout its entire lifecycle to maximize economic benefits.
(5) The visualization module serves as the interface through which users interact with the entire system; it is the visual representation of all functions in the application module. Users can access the designed digital twin system via tablets, computers, mobile phones, or VR clients to monitor its overall operational status in real time.
(6) The information interaction module functions as the intermediary that links the various modules within the digital twin system. It facilitates bidirectional data transmission through specified transport protocols and monitoring transmission ports. During transmission, the data’s real-time performance, accuracy, security, and stability must be ensured to maintain stable system operation, thereby eliminating information silos and realizing information fusion.

3.3. Construction of the Digital Twin Geometric Model for the Wind Turbine Gear Transmission System

To visually represent the structure and motion state of the wind turbine gear transmission system within the digital twin system, the geometric model must accurately reflect the mechanical structure of the physical entity. Additionally, this geometric model serves as the foundation for subsequent mechanistic analysis and motion state monitoring. In this subsection, the geometric model is developed without taking physical properties into account, focusing only on geometric dimensions and part entity features. Figure 7 shows the construction workflow for the geometric model of the wind turbine gear transmission system.
The construction of the geometric model is divided into part modeling, component modeling, and assembly modeling. Following the above workflow enables the reusability of the geometric models of parts, thereby improving modeling efficiency. In the process of constructing the wind turbine’s geometric model, the first step is to model the basic parts, then assemble the parts into components, and finally, assemble the components into the wind turbine as a whole to form the geometric model of the virtual turbine.
Part modeling primarily involves creating models of the basic parts for each functional component of the wind turbine. In this paper, NX 12.0 is used to create the basic parts, and standard parts such as bearings and bolts are imported from a standard parts library. For non-standard parts, the process begins with establishing datum features (datum planes, axes, and coordinate systems), basic solid features (e.g., extrude, sweep, and loft), and engineering features (e.g., holes and chamfers). These features are then refined using operations such as arraying, duplicating, and other modifications. Finally, attributes are added to construct the part’s geometric model.
Component modeling involves establishing the positional and motion relationships between parts through assembly relationships and incorporating kinematic pairs, thereby constructing the component’s geometric model. Figure 8 shows the geometric model of the wind turbine gearbox component.
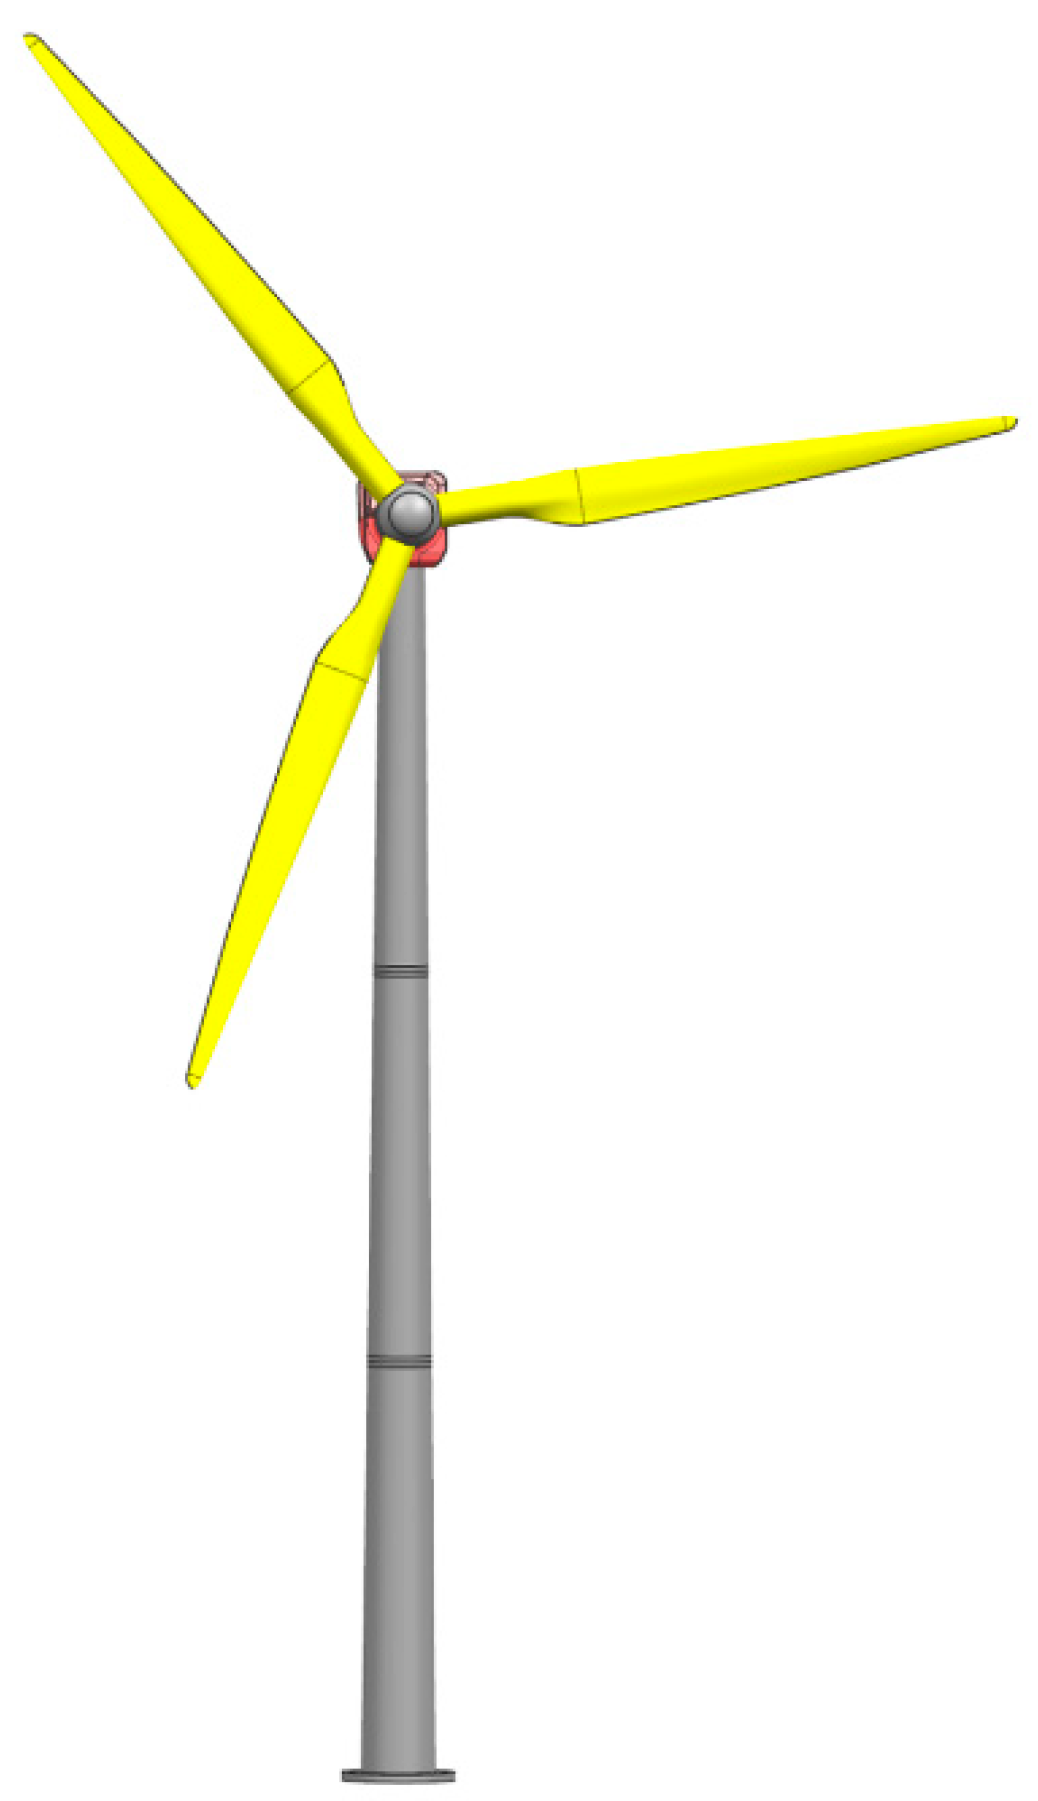
Assembly modeling involves integrating the various functional components based on their actual assembly relationships to create the complete geometric model of the wind turbine. Figure 9 shows the geometric model of the wind turbine.

3.4. Construction of the Digital Twin Mechanism Model for the Wind Turbine Gear Transmission System

The wind turbine transmission system primarily consists of the impeller, low-speed shaft, planetary gearbox, parallel-shaft gearbox, high-speed shaft, generator rotor, etc. As shown in Figure 10, Figure (a) shows the 3D diagram of the transmission system, and Figure (b) shows the dynamic model of the transmission system.let the rotational speeds of the hub be ω b , the planet carrier be ω c , the planet gear be ω p , the sun gear be ω s , the speed of Gear 1 be ω g 1 , the speed of Gears 2 and 3 be ω g 2 g 3 , the speed of Gear 4 be ω g 4 , and the generator speed be ω g , with all speeds in r/min. The number of teeth for the sun gear, planet gear, ring gear, Gear 1, Gear 2, Gear 3, and Gear 4 are Z S , Z R , Z p , Z g 1 , Z g 2 , Z g 3 , and Z g 4 , respectively.
Let ω = ω b , ω c , ω s , ω g 1 , ω g 2 g 3 , ω g 4 , ω g , and let η be the rotational speed relationship matrix between the components, then we have
η = 1 0 0 0 0 0 0 1 0 0 0 0 0 0 0 0 1 + Z R Z S 0 0 0 0 0 0 1 0 0 0 0 0 0 0 0 Z g 2 Z g 1 0 0 0 0 0 0 0 Z g 3 Z g 4 0 0 0 0 0 0 0 1
ω T = 1 0 0 0 0 0 0 1 0 0 0 0 0 0 0 0 1 + Z R Z S 0 0 0 0 0 0 1 0 0 0 0 0 0 0 0 Z g 2 Z g 1 0 0 0 0 0 0 0 Z g 3 Z g 4 0 0 0 0 0 0 0 1 ω b ω c ω s ω g 1 ω g 2 g 3 ω g 4 ω g = ω b ω b ω c 1 + Z R Z S ω s ω g 1 Z g 2 Z g 1 ω g 2 g 3 Z g 3 Z g 4 ω g = ω b ω b ω b 1 + Z R Z S ω b 1 + Z R Z S ω b 1 + Z R Z S Z g 2 Z g 1 ω b 1 + Z R Z S Z g 2 Z g 1 Z g 3 Z g 4 ω b 1 + Z R Z S Z g 2 Z g 1 Z g 3 Z g 4

3.5. Design of the CNN-LSTM-Attention-Based Digital Twin Fault Prediction Model

3.5.1. CNN-LSTM-Attention Model Architecture Design

The model framework proposed in this study is illustrated in Figure 11, with an overall structure containing three core components. First, a convolutional neural network is used to construct a feature extraction module, which primarily processes normalized time-series feature data that has been preprocessed and subjected to Pearson correlation analysis. It then extracts potential deep features from the SCADA data through convolutional operations. Subsequently, a temporal modeling module is designed based on a long short-term memory network. The features extracted by the convolutional layers are fed into the LSTM units, and an attention mechanism is incorporated to dynamically assign weights to the temporal features, thereby enhancing the model’s capability for modeling time dependencies. Finally, a residual analysis module is constructed to generate the time-series prediction results through the output layer, and to conduct statistical analysis on the residual sequence of the prediction errors.

3.5.2. Fault Prediction Flow Based on the CNN-LSTM-Attention Model

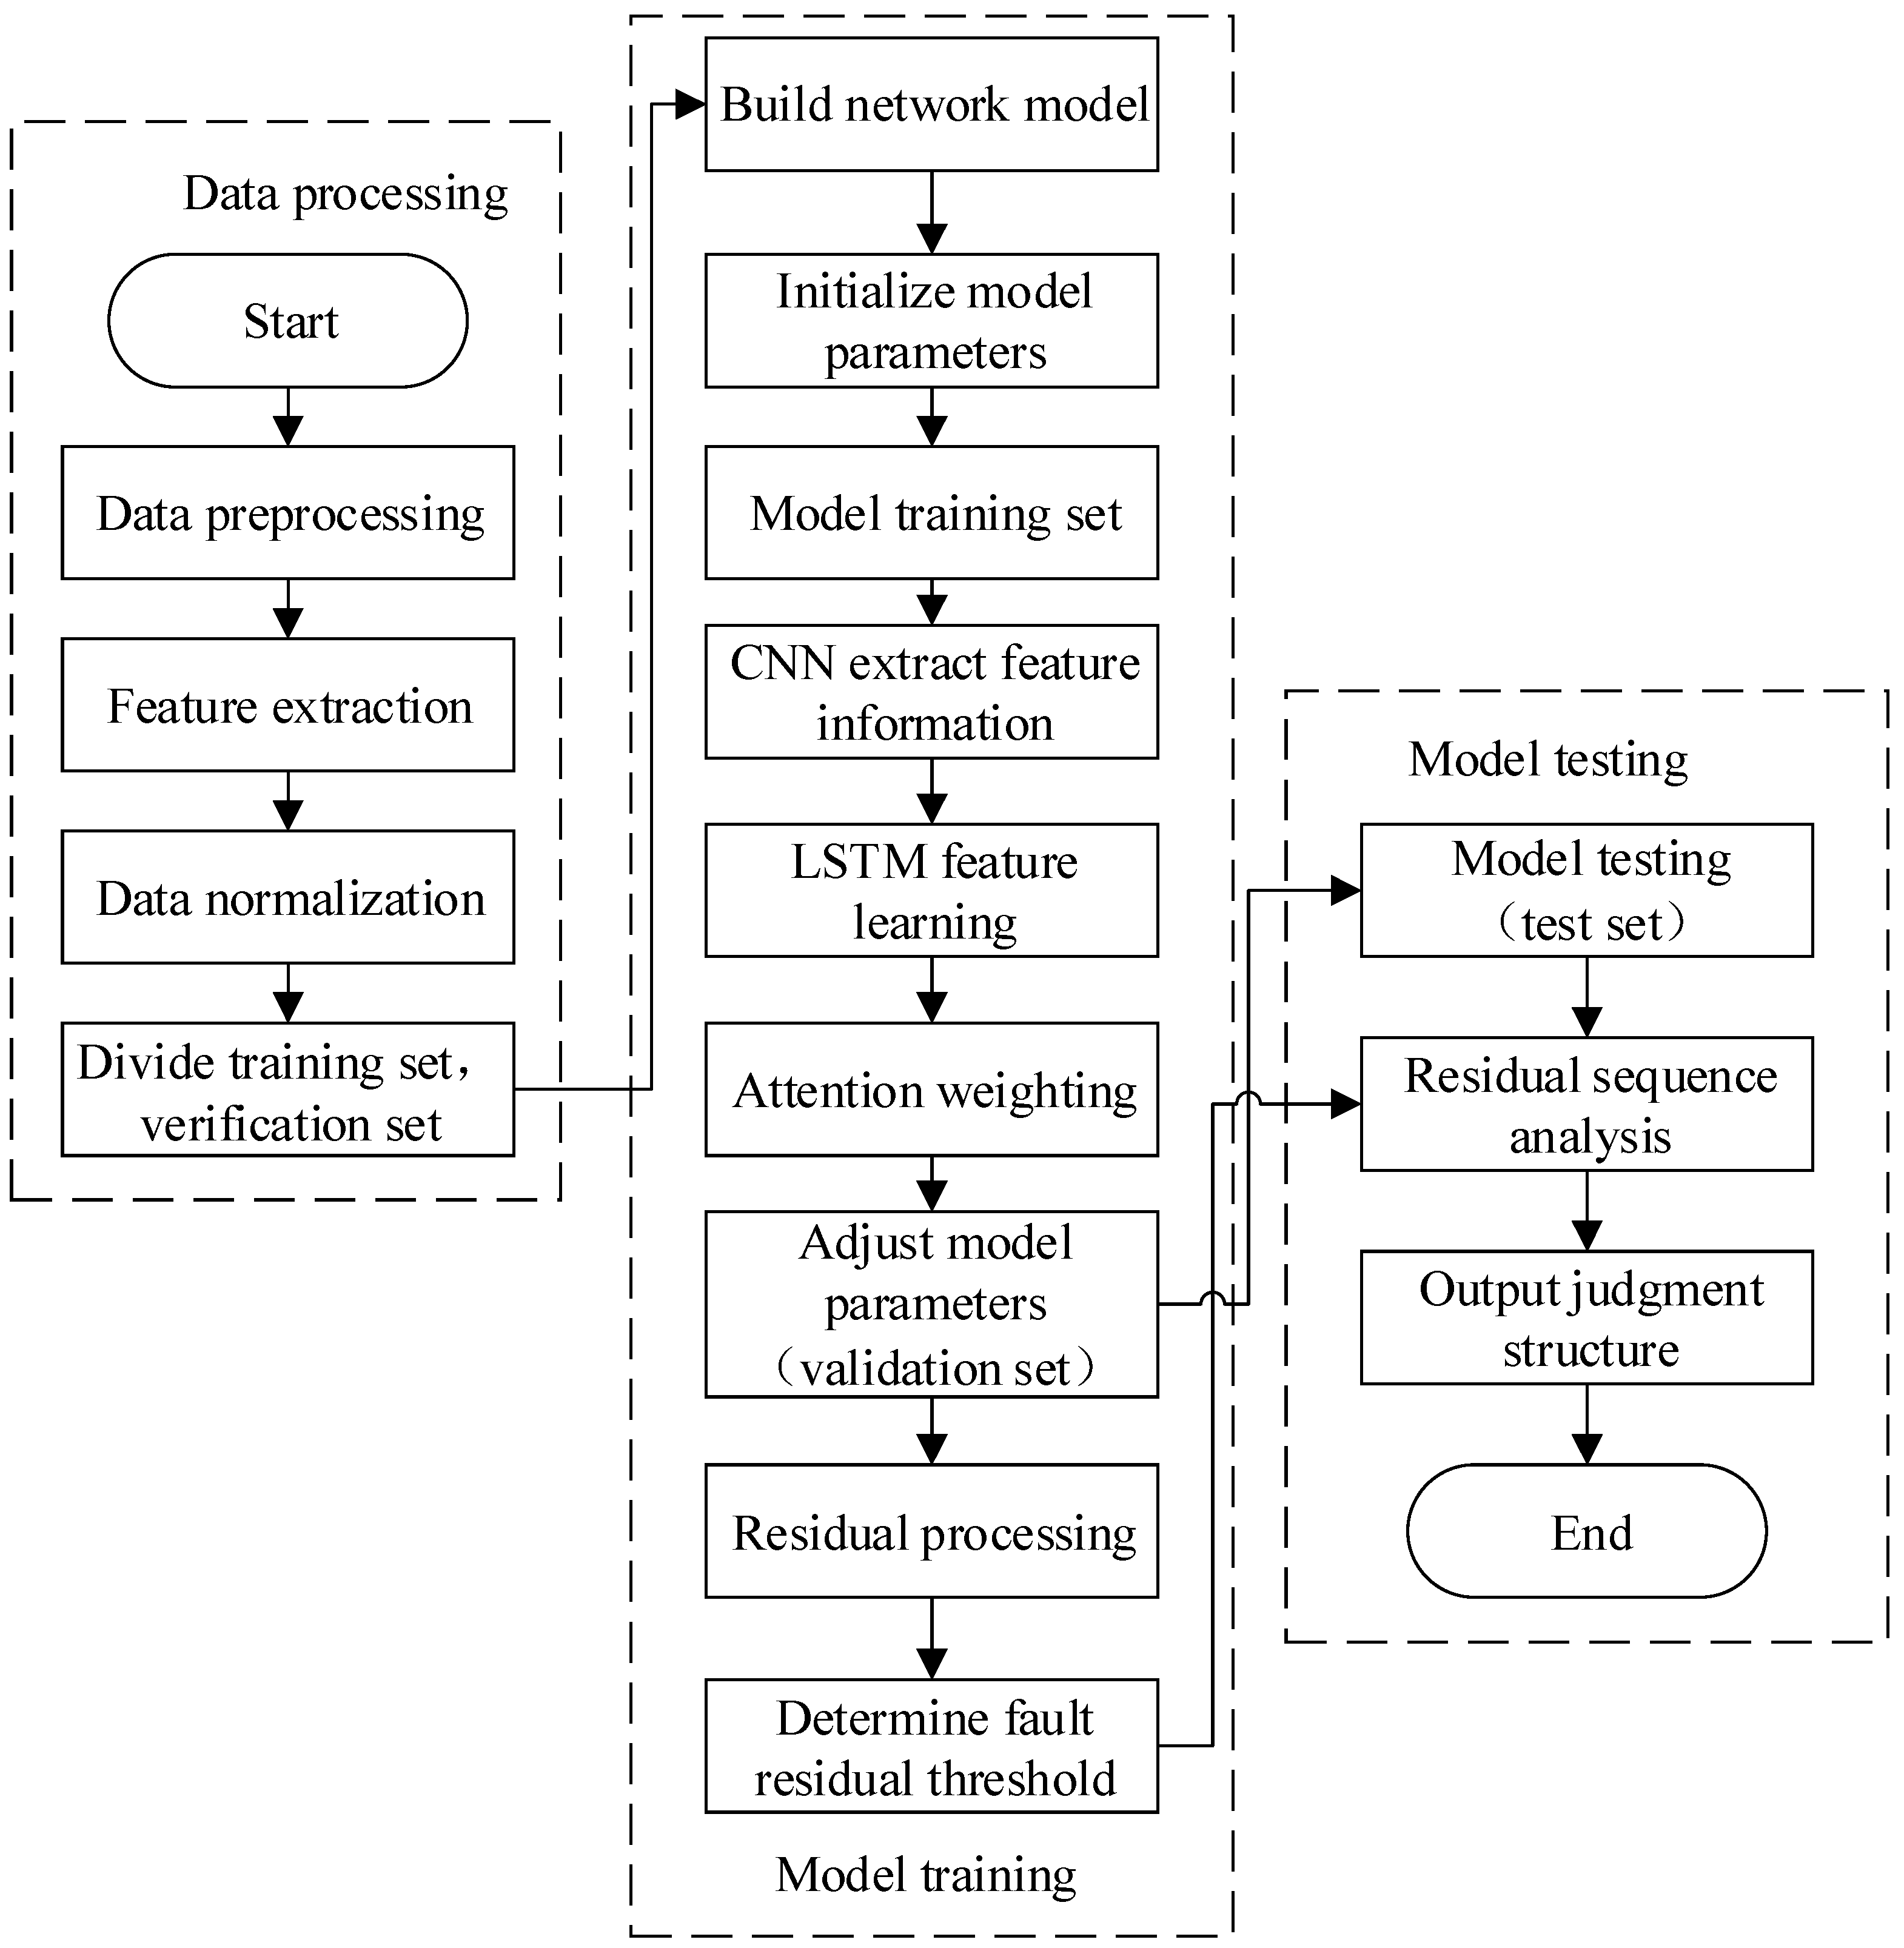
This chapter proposes a fault warning method for wind turbine gearboxes based on a CNN-LSTM-Attention network model. The entire process is divided into three stages, as shown in Figure 12.
(1) Data Processing: First, the SCADA dataset undergoes outlier detection and missing value imputation to ensure data reliability and validity. Features with high correlation are selected using the Pearson correlation coefficient. These selected feature variables are then normalized to eliminate the impact of differing scales, ensuring the model treats each feature fairly. After preprocessing, the dataset is divided into training, validation, and test sets. Both the training and validation sets consist of SCADA monitoring data from normally operating turbines and are used for model training and validation. The test set comprises SCADA data from a faulty turbine.
(2) Model Training: The CNN-LSTM-Attention network model is first constructed, and its associated hyperparameters are initialized. The training dataset is then used to train the model. During the training process, the model’s performance is evaluated on the basis of the output from the validation set, and model parameters are adjusted accordingly. Concurrently, residual data is processed, and the 3 σ criterion is applied to determine the threshold for fault determination.
(3) Model Testing: The effectiveness of the prediction model is validated by testing it with the preprocessed test dataset.

4. Results

4.1. Data Collection and Preprocessing

During the operation of the wind turbine, the SCADA system continuously collects environmental data and operational status parameters of the wind turbine. The types of data collected exceed 100, categorized into discrete data and continuous data. Discrete data comprises operational mode, fault codes, and self-start counts, while continuous data includes wind direction, wind speed, temperature, and active power of the generator. This data is usually stored in a structured format on the wind farm’s server for further use. The data composition is shown in Table 1.
This paper selects two identical wind turbine models, each with a rated capacity of 2 MW, from a wind farm in Xinjiang as the research subjects. The data originates from the turbines’ SCADA systems with a sampling interval of 10 min. The main parameters of this type of wind turbine are shown in Table 2.
The fault log cases for the two units are shown in Table 3. A total of 43,000 operational data points, recorded from turbine #03 between 1 January 2024 and 31 October 2024, are used as the training sample. Turbine #07 is selected as the fault validation case; this unit triggered a protective shutdown at 8:51 AM on 19 October 2024, due to an abnormal rise in its oil sump temperature.
During wind turbine operation, factors such as extreme weather, blade damage or soiling, and data processing errors can cause the SCADA system to generate a significant amount of anomalous data that does not accurately reflect the turbine’s operational status and performance. To improve the accuracy of model training, it is essential to preprocess the SCADA data to ensure its accuracy and reliability before use. This study refined the original data by eliminating outliers and null values, retaining only valid values to ensure the accuracy and reliability of the data.
In order to obtain high-quality SCADA data, this study conducted processing from multiple aspects, such as data integrity verification, outlier verification, sensor drift detection, and cross-sensor consistency. The main process is as follows:
(1) Data integrity verification
Data collection may be incomplete due to sensor failures or communication disruptions. In this study, the regular matching method was used to quickly identify null values (Null) in the original data. These null values were then either directly removed or filled using the linear interpolation method to complete the corresponding values, thereby ensuring the integrity of the data.
(2) Handling of outliers
During data collection and transmission, extreme weather conditions, complex electromagnetic environments, etc., can produce isolated data points that deviate significantly from the power curve, parameter thresholds, etc. These isolated points do not conform to the normal data distribution pattern and fluctuate randomly near the normal values. Such outliers do not represent abnormal conditions of the equipment operation and seriously interfere with the accurate judgment of the equipment operation status. To handle these outliers, this study uses the ideal wind speed power curve and parameter thresholds as benchmarks to identify and remove these anomalies, thereby ensuring data consistency. Taking the wind speed power curve of the wind turbine as an example, the ideal wind speed–power curve is an important indicator in the field of wind power and a key tool for evaluating wind turbine performance, as shown in Figure 13. The cut-in wind speed (Vim) represents the minimum wind speed threshold for the turbine startup. Vnrtd refers to the wind speed condition corresponding to the rated rotational speed, while Vrtd is the rated wind speed. The cut-out wind speed (Vout) represents the maximum wind speed for safe operation, and the rated power (Prtd) is the turbine’s maximum designed power output. As the ambient wind speed gradually increases to the cut-in threshold, the wind turbine initiates the power generation procedure, with its output increasing proportionally to the wind speed. Once the rated power is reached, the system’s output power remains constant. If the wind speed continues to rise to the cut-out threshold, the control system activates a protection mechanism to stop wind energy capture. However, in actual operation, due to factors such as environmental conditions and turbine status, the measured wind speed-power curve generally deviates from the theoretical curve.
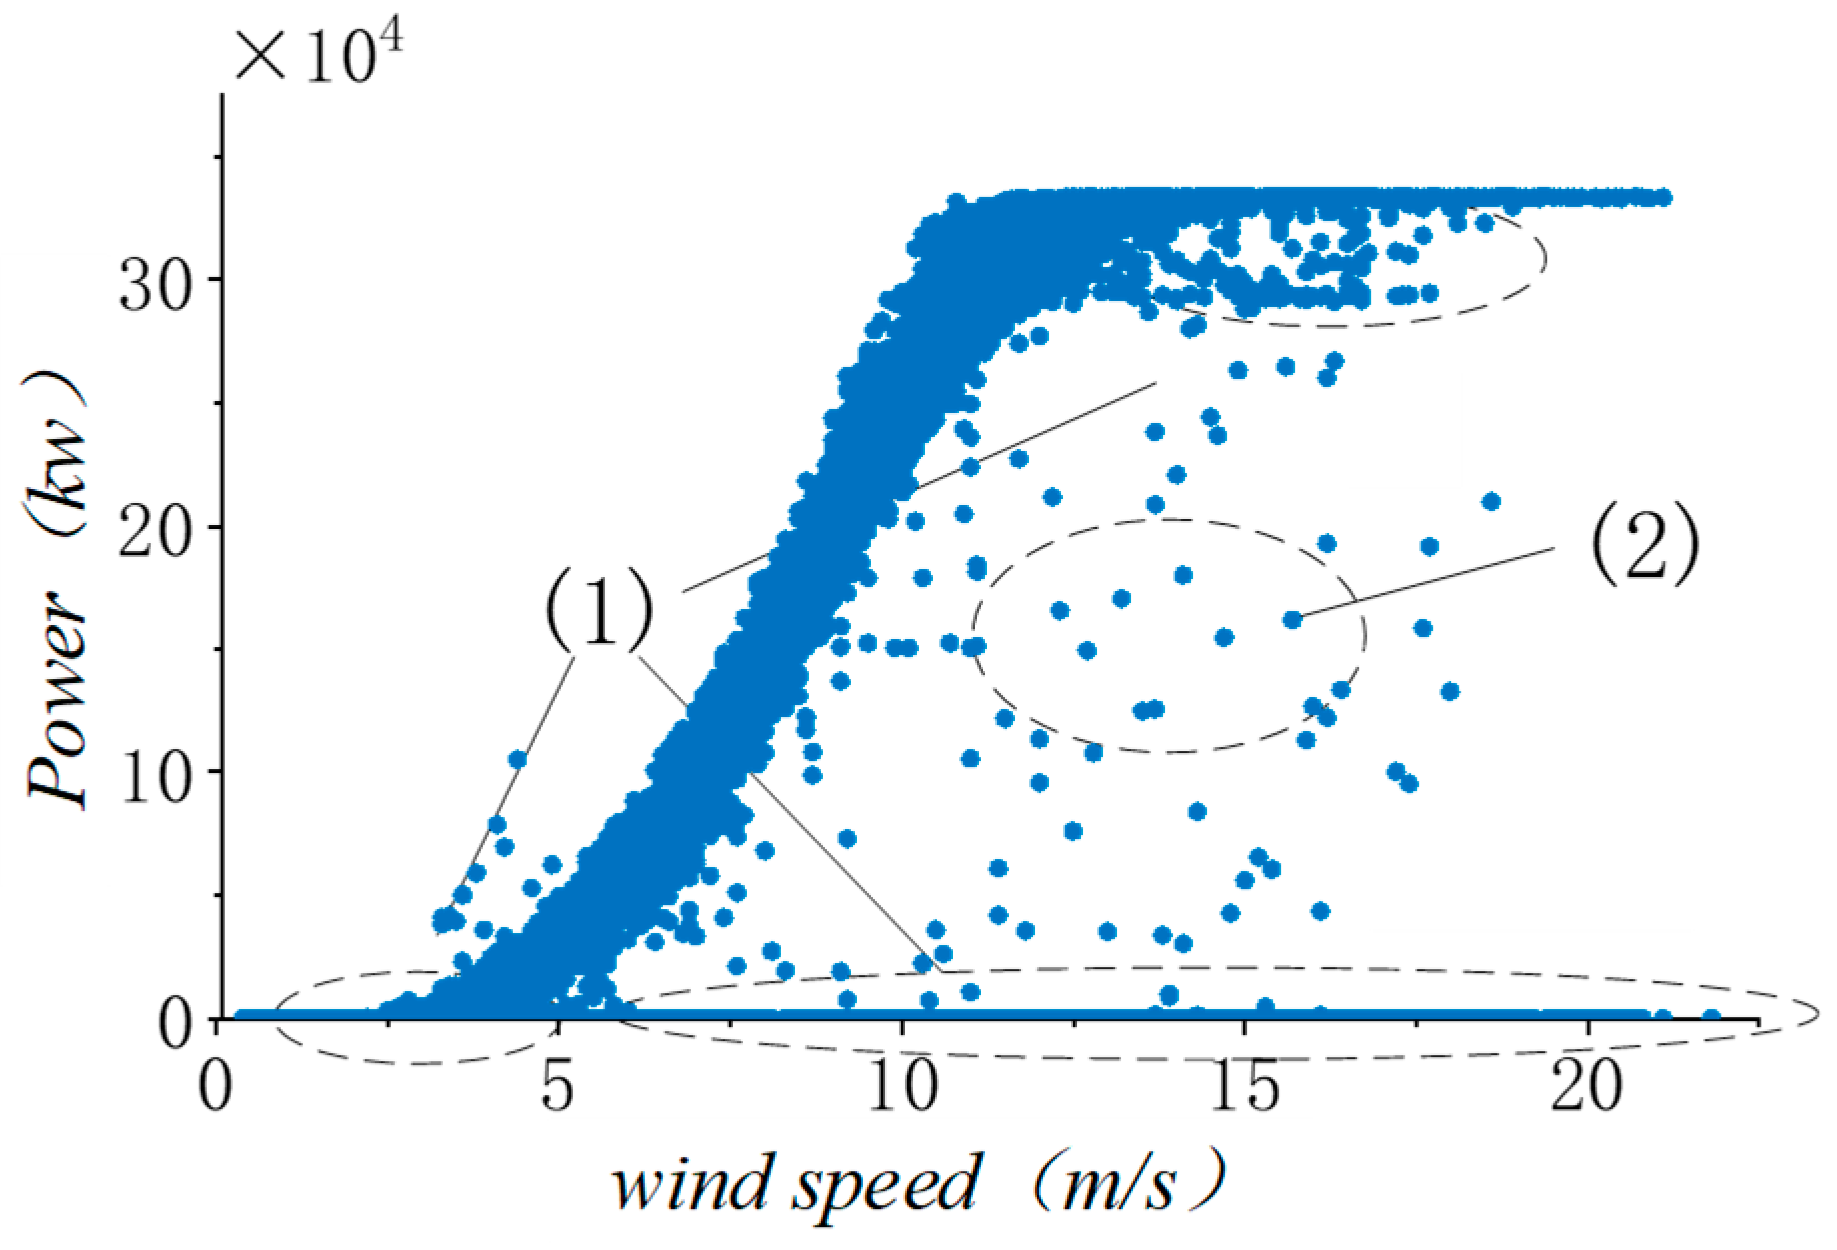
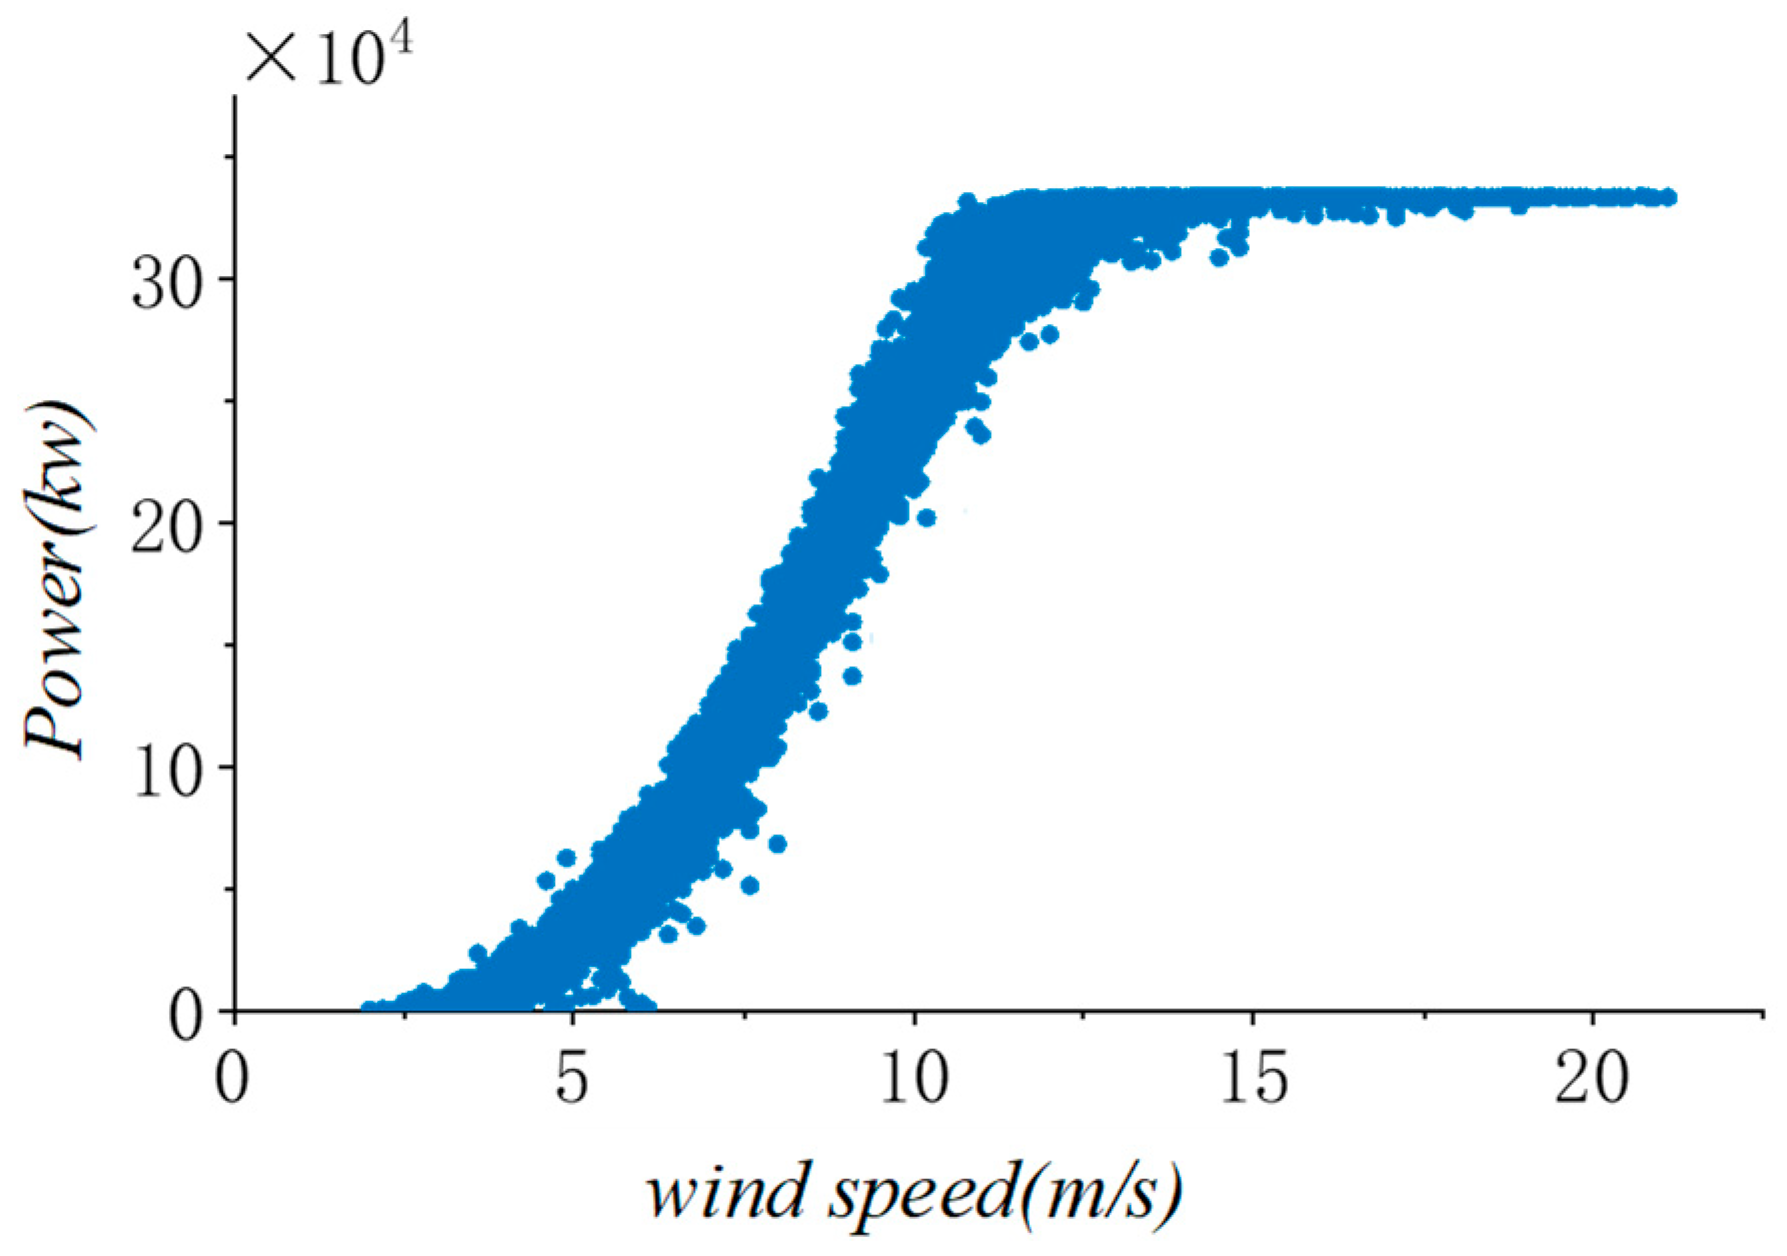
Figure 14 shows the distribution of anomalies in the wind speed–power curve. A comparative analysis reveals significant deviations between the actual wind speed–power curve and the ideal model, with some data points abnormally distributed in a manner that contradicts with the aerodynamic characteristics and operational mechanisms of the wind turbine. These anomalies can originate from external factors like sensor noise and extreme weather disturbances, or internal factors such as pitch system failure, mechanical faults in the drivetrain, or shutdowns. To enhance the reliability of the gearbox fault warning model, two typical types of anomalous data need to be cleaned: The first type consists of clustered high-density outliers (clustered type), as shown in Figure 14(1), which are often caused by turbine shutdowns or sensor faults that cause inaccurate data recording, specifically when the wind speed is adequate, but the power output remains below the rated level. In such cases, the common approach is to delete these data points. The other type is randomly scattered isolated points (dispersed type), as shown in Figure 14(2),which are data values with abnormal distributions that differ significantly from other data points and exhibit unconventional trends. When such data constitutes a very small proportion, data quality can typically be improved by removing samples of variables that fall outside the normal range of variation. The wind speed–power curve after preprocessing is shown in Figure 15.
(3) Sensor drift detection and cross-sensor data consistency verification
During the data acquisition process, sensor measurement data may exhibit a slow drift phenomenon due to various factors. This drift mainly originates from three aspects: first, changes in the physical characteristics of the sensor itself, including component aging, mechanical structure relaxation, and material creep, which are internal factors; second, environmental interference, such as temperature fluctuations and electromagnetic interference, which represent external influences; third, chemical corrosion, including oil contamination penetration, salt fog erosion, and other chemical reactions leading to performance degradation. These factors work together to cause the sensor output signal to gradually deviate from the true value, forming typical progressive and nonlinear drift characteristics. To address this issue, this study proposes a drift detection and compensation method based on the cumulative sum control chart (CUSUM). This method requires the establishment of a reliable reference benchmark: by collecting 5000 historical data samples from equipment operating in a healthy state, key statistical parameters, namely the mean and standard deviation, are calculated. By continuously monitoring the cumulative deviation of the data, significant sensor drift is identified when the cumulative sum statistics exceed the preset threshold for three consecutive sampling periods. Once sensor drift is detected, the exponentially weighted moving average (EWMA) filtering algorithm is used to dynamically correct the reference value, resetting the reference benchmark to effectively eliminate the drift interference in the data.
The consistency issue of cross-sensor data primarily involves verifying the temporal consistency of the physical quantities of the collected data, ensuring that associated parameters comply with established physical laws, and confirming that constraint conditions are satisfied. To solve these problems, this study uses the comparison of sample timestamps to ensure that the data collection timestamps of different sensors are strictly synchronized, with the timestamp deviation controlled within 100 ms. Further, by verifying the threshold range of the collected samples and the association rules between different parameters, the rationality of the sample values is ensured. Through the above methods, cross-sensor data consistency verification is achieved.

4.2. Feature Parameter Selection

During the wind turbine operation, the SCADA system continuously collects and stores various operational status data, including operational data, fault alarms, maintenance records, and shutdowns. The operational data is typically multi-dimensional, complex, and nonlinear time-series data, encompassing numerous parameters such as ambient temperature, wind speed, gearbox oil temperature, and generator speed. When training a prediction model, an excessively high dimension of input variables can lead to a decrease in the model’s generalization ability. To address this issue, this paper analyzes the wind turbine’s operational characteristics, and selects 18 key feature parameters closely related to the gearbox condition from the SCADA monitoring parameters. The specific parameters are listed in Table 4.
The gearbox is a critical component of the wind turbine, and its proper operation heavily relies on the normal circulation of lubricating oil. The oil sump temperature can reflect the internal mechanical performance and lubrication condition of the gearbox. Excessively high or low oil temperatures may indicate insufficient oil fluidity, which in turn affects the lubrication effectiveness, causing excessive wear or seizure and thus increasing the risk of failure. Therefore, this chapter selects the gearbox oil sump temperature as the monitoring point.
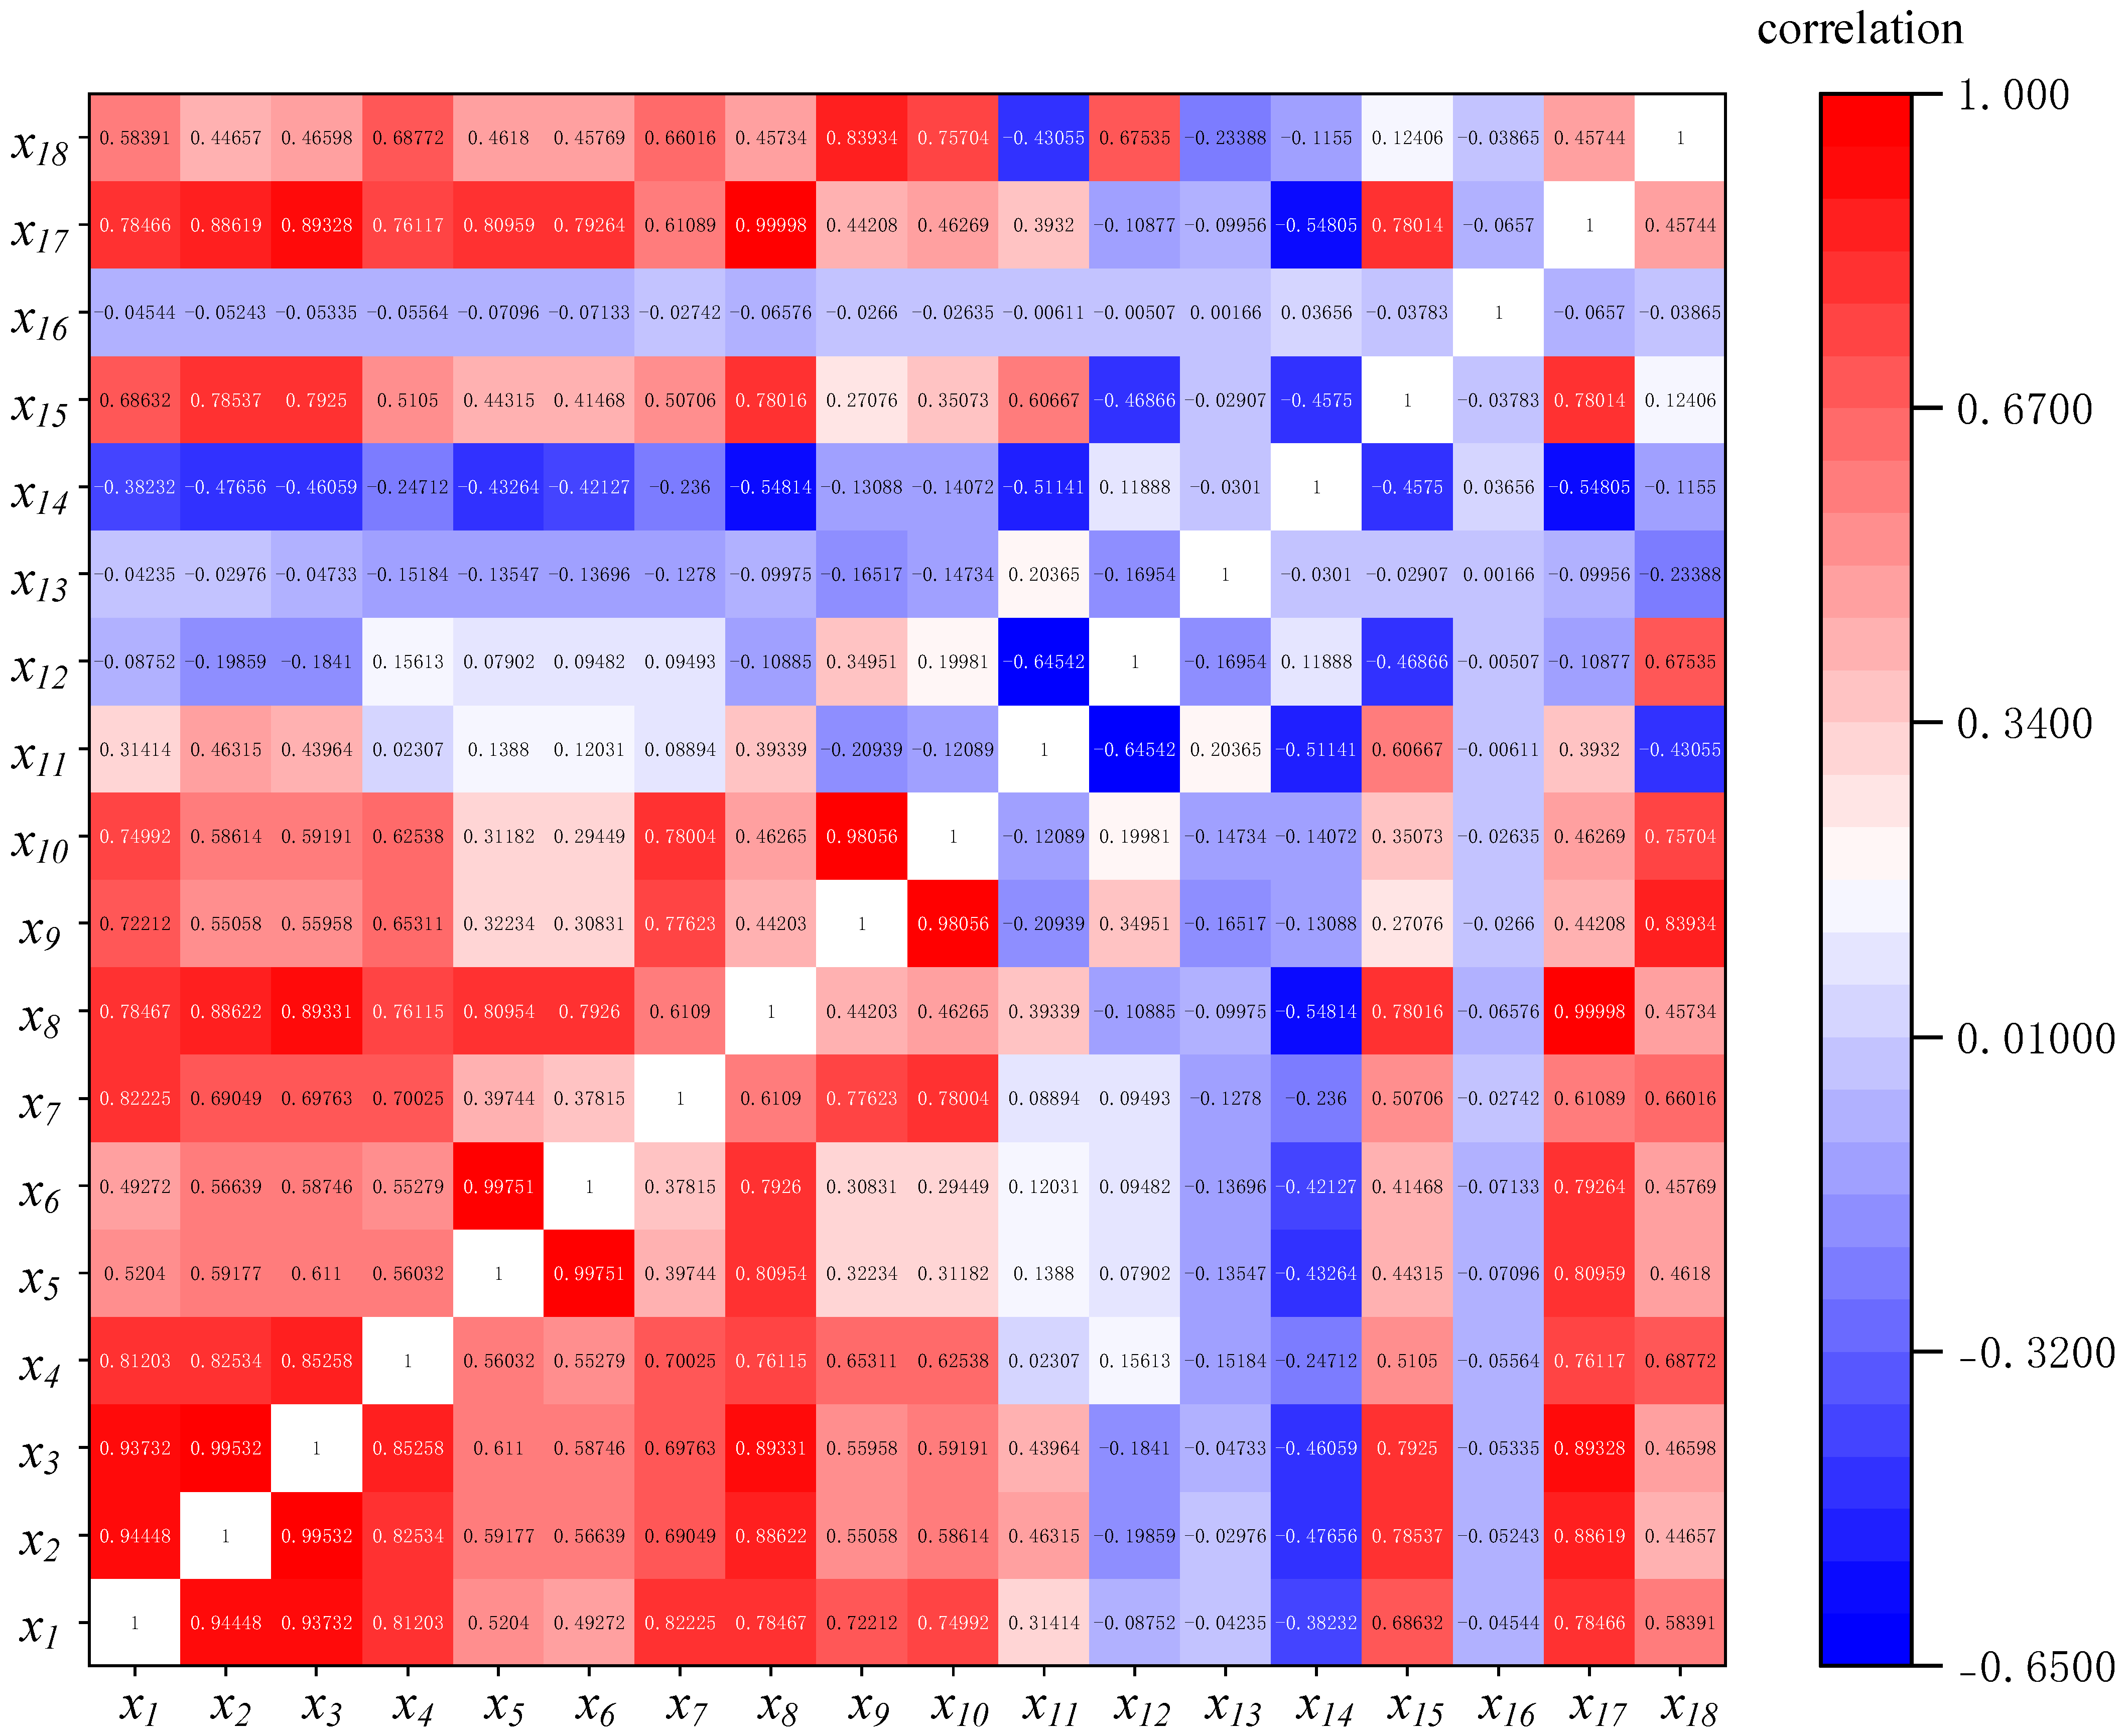
Although all parameters listed in Table 4 may influence the gearbox oil sump temperature, the 18-dimensional input features still pose an issue of dimensional redundancy. To improve model training efficiency, the Pearson correlation coefficient method is used for feature selection. By quantifying the degree of correlation between each parameter and the oil sump temperature, the most relevant features are selected as model inputs. Figure 16 shows a heatmap of the strength of correlation between features.
In the feature selection process, parameters with an absolute Pearson correlation coefficient greater than 0.6 are selected as inputs for the model to ensure that the model can learn from more representative and informative features. This approach effectively reduces the interference of data noise, enhancing the model’s generalization performance, and lowering the risk of overfitting.
To effectively accelerate the convergence speed of the neural network, optimize the training process, and improve training stability, the input data is preprocessed by normalization. The Min-Max standardization method is used to eliminate the influence of different dimensions, and its calculation formula is as follows.
X i = x i x m i n x m a x x m i n
where x is the original data sample, X i is the normalized sample, x m a x is the maximum value of the data, and x m i n is the minimum value.

4.3. Model Evaluation

4.3.1. Construction of Evaluation Metrics System

To evaluate the performance of the prediction model, a multi-dimensional evaluation metric system is employed for a comprehensive evaluation. Specifically, the Root Mean Square Error (RMSE) is used to measure the degree of deviation between predicted and actual values, the Mean Absolute Percentage Error (MAPE) to reflect the relative accuracy of the prediction results, and the coefficient of determination (r2) to assess the model’s ability to explain data variability. Among these three metrics, smaller values for RMSE and MAPE indicate smaller prediction errors. The r2 value ranges from [0, 1], with higher values signifying better prediction accuracy and a better fit. Their calculation formulas are as follows.
R M S E = Σ i = 1 N ( y i y ^ i ) 2 N
M A P E = 1 N i = 1 N | y i y ^ i | y i
r 2 = i = 1 N ( y ^ i y ¯ ) 2 i = 1 N ( y i y ^ i ) 2
where N represents the number of samples, y i represents the actual value, and y ^ i represents the predicted value.

4.3.2. Analysis of Evaluation Results

To validate the accuracy of the prediction model, RNN, LSTM, CNN-LSTM, and LSTM-Attention network prediction models were developed using the same SCADA data, and these models were compared with the CNN-LSTM-Attention network prediction model. After training, each model was used to predict the validation set. The prediction results of the different models are shown in Figure 17. According to a comparative analysis of the prediction performance, it is evident that the hybrid CNN-LSTM-Attention neural network exhibits the best performance in predicting the gearbox oil sump temperature. This model not only accurately tracks the actual temperature trend more but also significantly outperforms the other comparative models in terms of fitting precision.
Based on Figure 17 and the three evaluation metrics for the different models in Table 5, it can be concluded that the RMSE and MAPE values from the CNN-LSTM-Attention model proposed in this paper are, on average, 0.3945 and 0.546 lower, respectively, and the r2 value is 0.061 higher on average compared to those from the other four models. This demonstrates that the CNN-LSTM-Attention prediction model has higher prediction accuracy and a better fit than the other four prediction models, underscoring the effectiveness and superiority of the model proposed in this paper.

4.4. Model Update Strategy

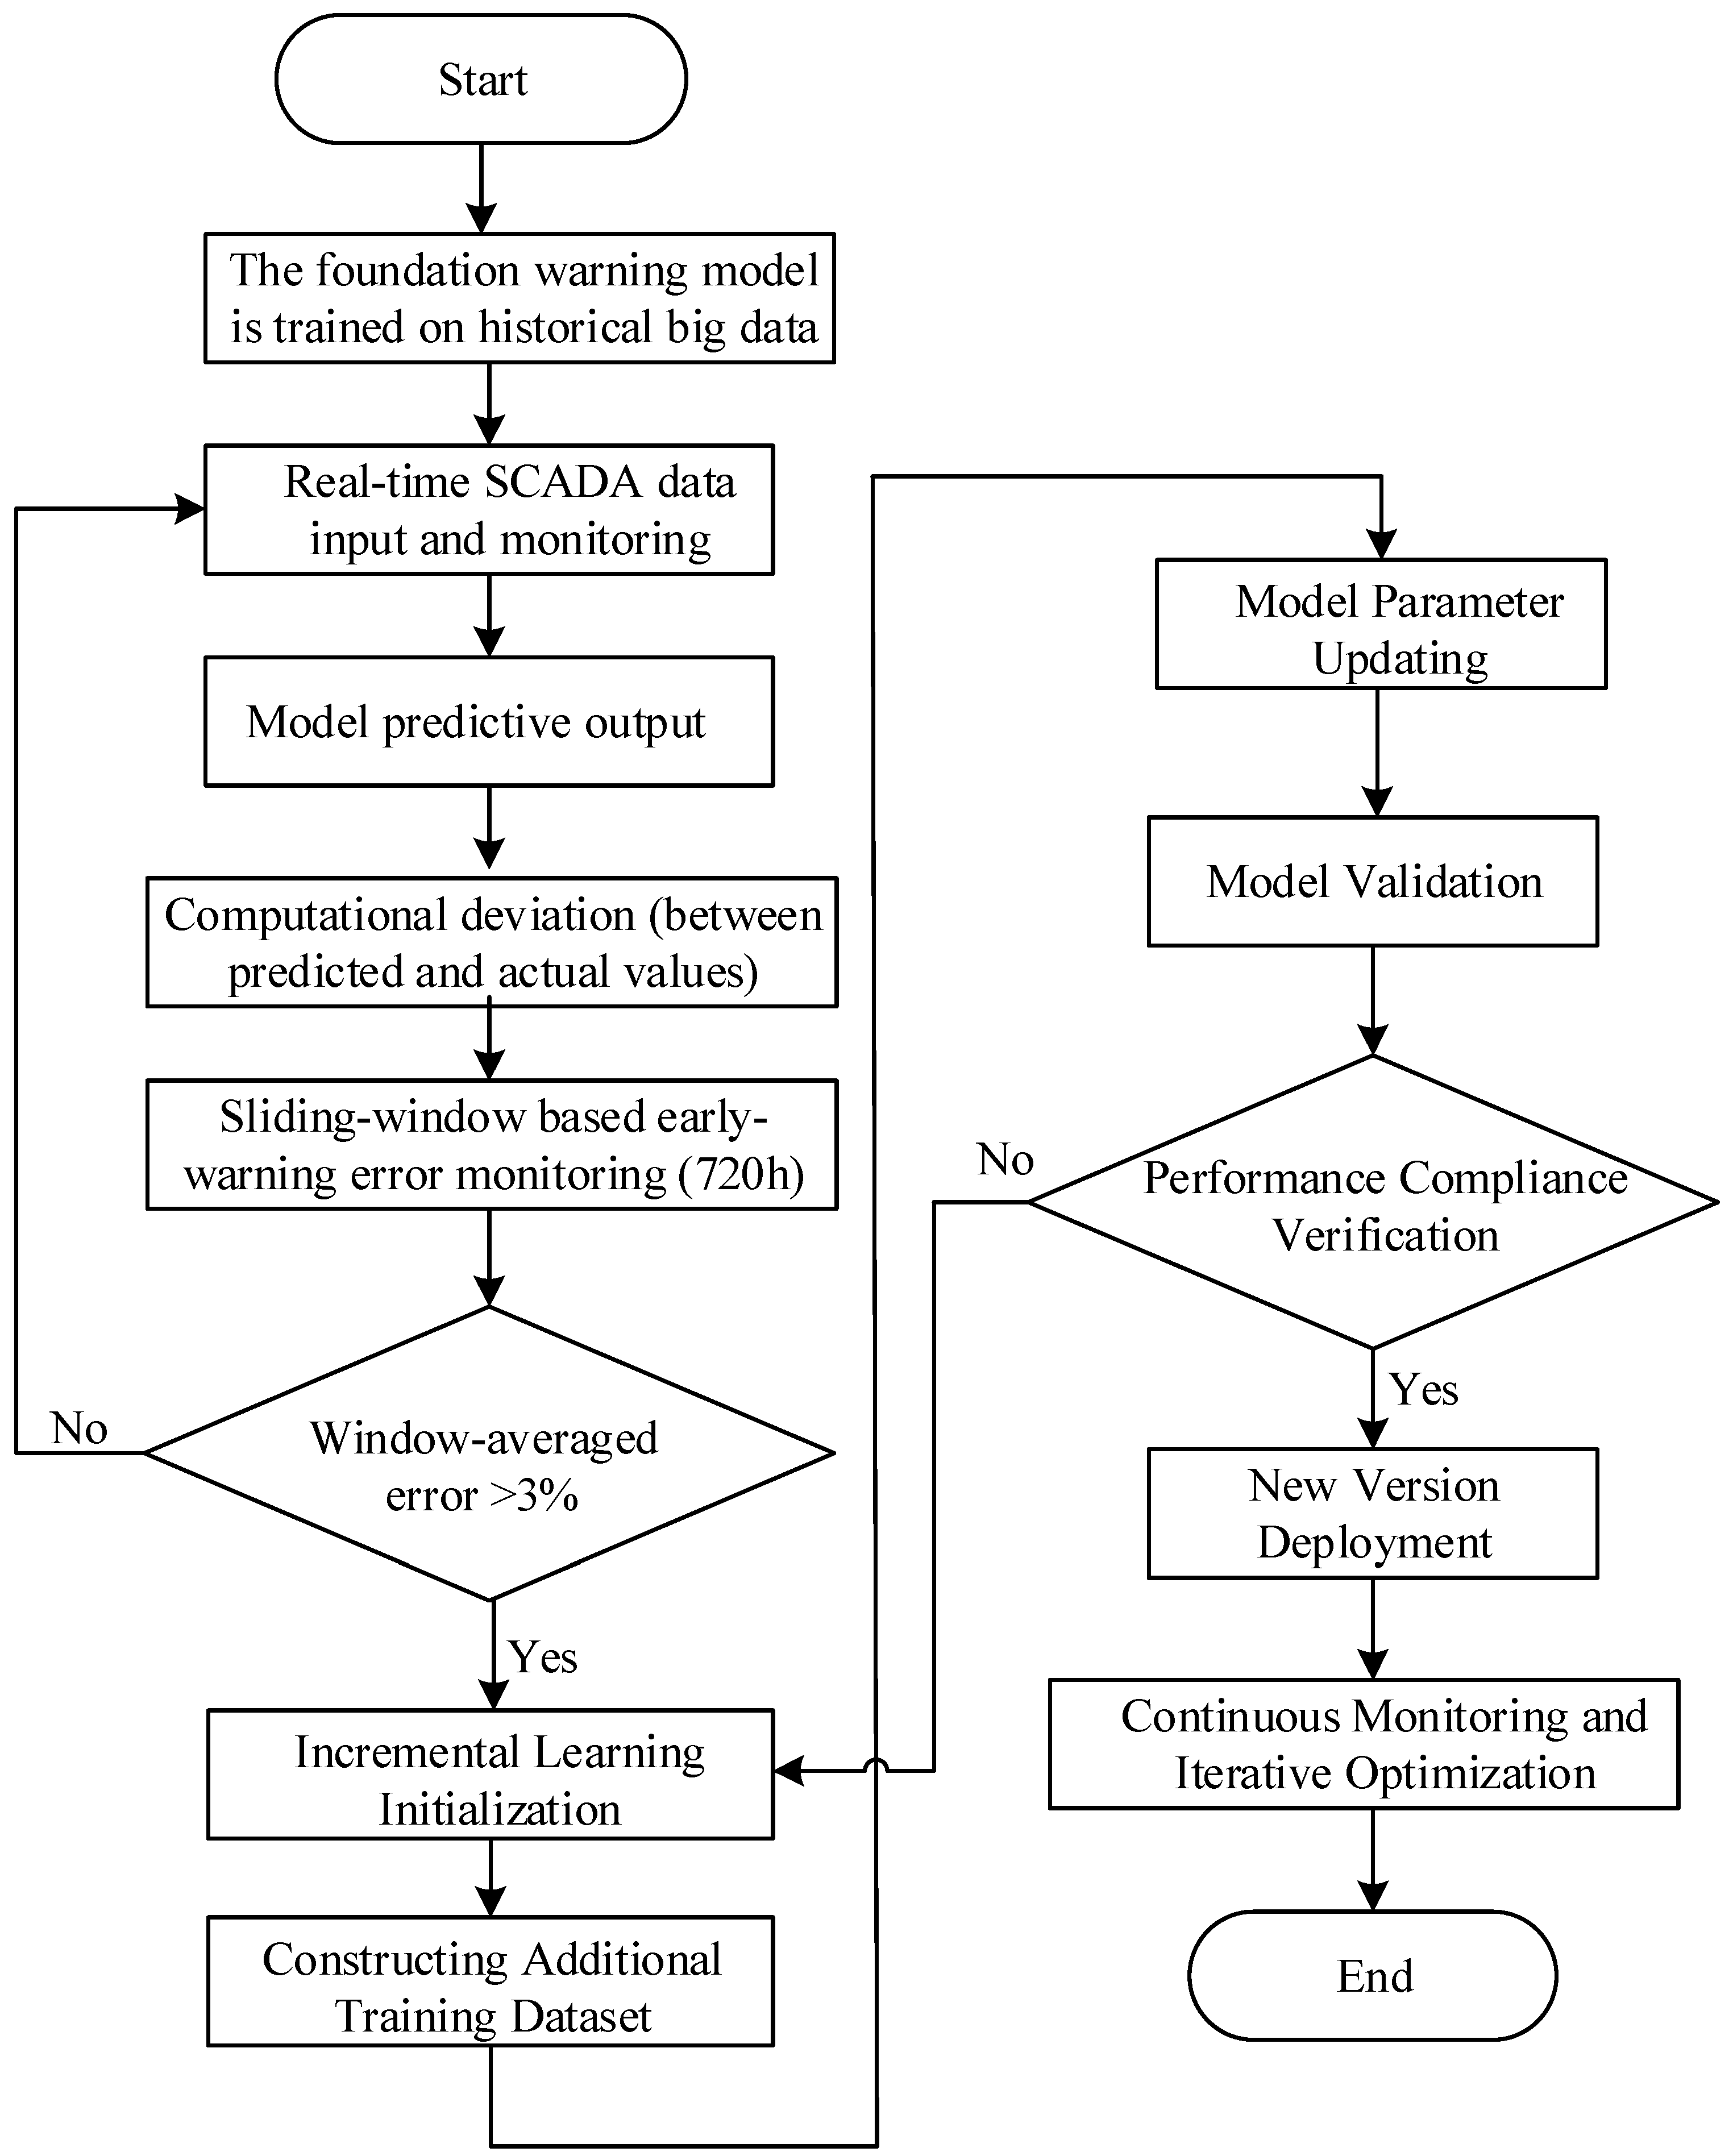
Throughout the entire operation period of the wind turbine generator, factors such as mechanical component aging, material performance degradation, and cumulative effects of environmental factors can cause gradual changes in system characteristics. These changes present a significant challenge to the long-term accuracy of the digital twin-based early warning model. To ensure that the virtual model continuously maintains an accurate mapping of the physical system throughout its service life, this study adopts a lightweight model update strategy based on incremental learning to continuously optimize the early warning model in the digital twin system.
The core of this strategy lies in establishing a dynamic model performance monitoring and update mechanism. The system continuously tracks the deviation between the model’s predicted output and the actual monitoring data. When the system detects that the average relative error within the sliding time window (default setting is 720 h, approximately 1 month) surpasses the predefined threshold of 3%, it automatically initiates the incremental learning process. This update process uses the typical operating conditions of the latest sliding time window as the new training set and updates the model’s weight parameters based on the restricted gradient descent algorithm. This update method has significant advantages. On one hand, the regularization term maintains the stability of the original important parameters, ensuring that historical operating patterns are retained. On the other hand, the weight of the new data is dynamically allocated using a time decay function, with recent operating data having a higher learning weight. Additionally, a parameter update amplitude limit (single update not exceeding the original value by 10%) is set to avoid overfitting risks. This process is shown in Figure 18.

4.5. Implementation of Intelligent Monitoring and Fault Prediction for the Gear Transmission System of Wind Turbine

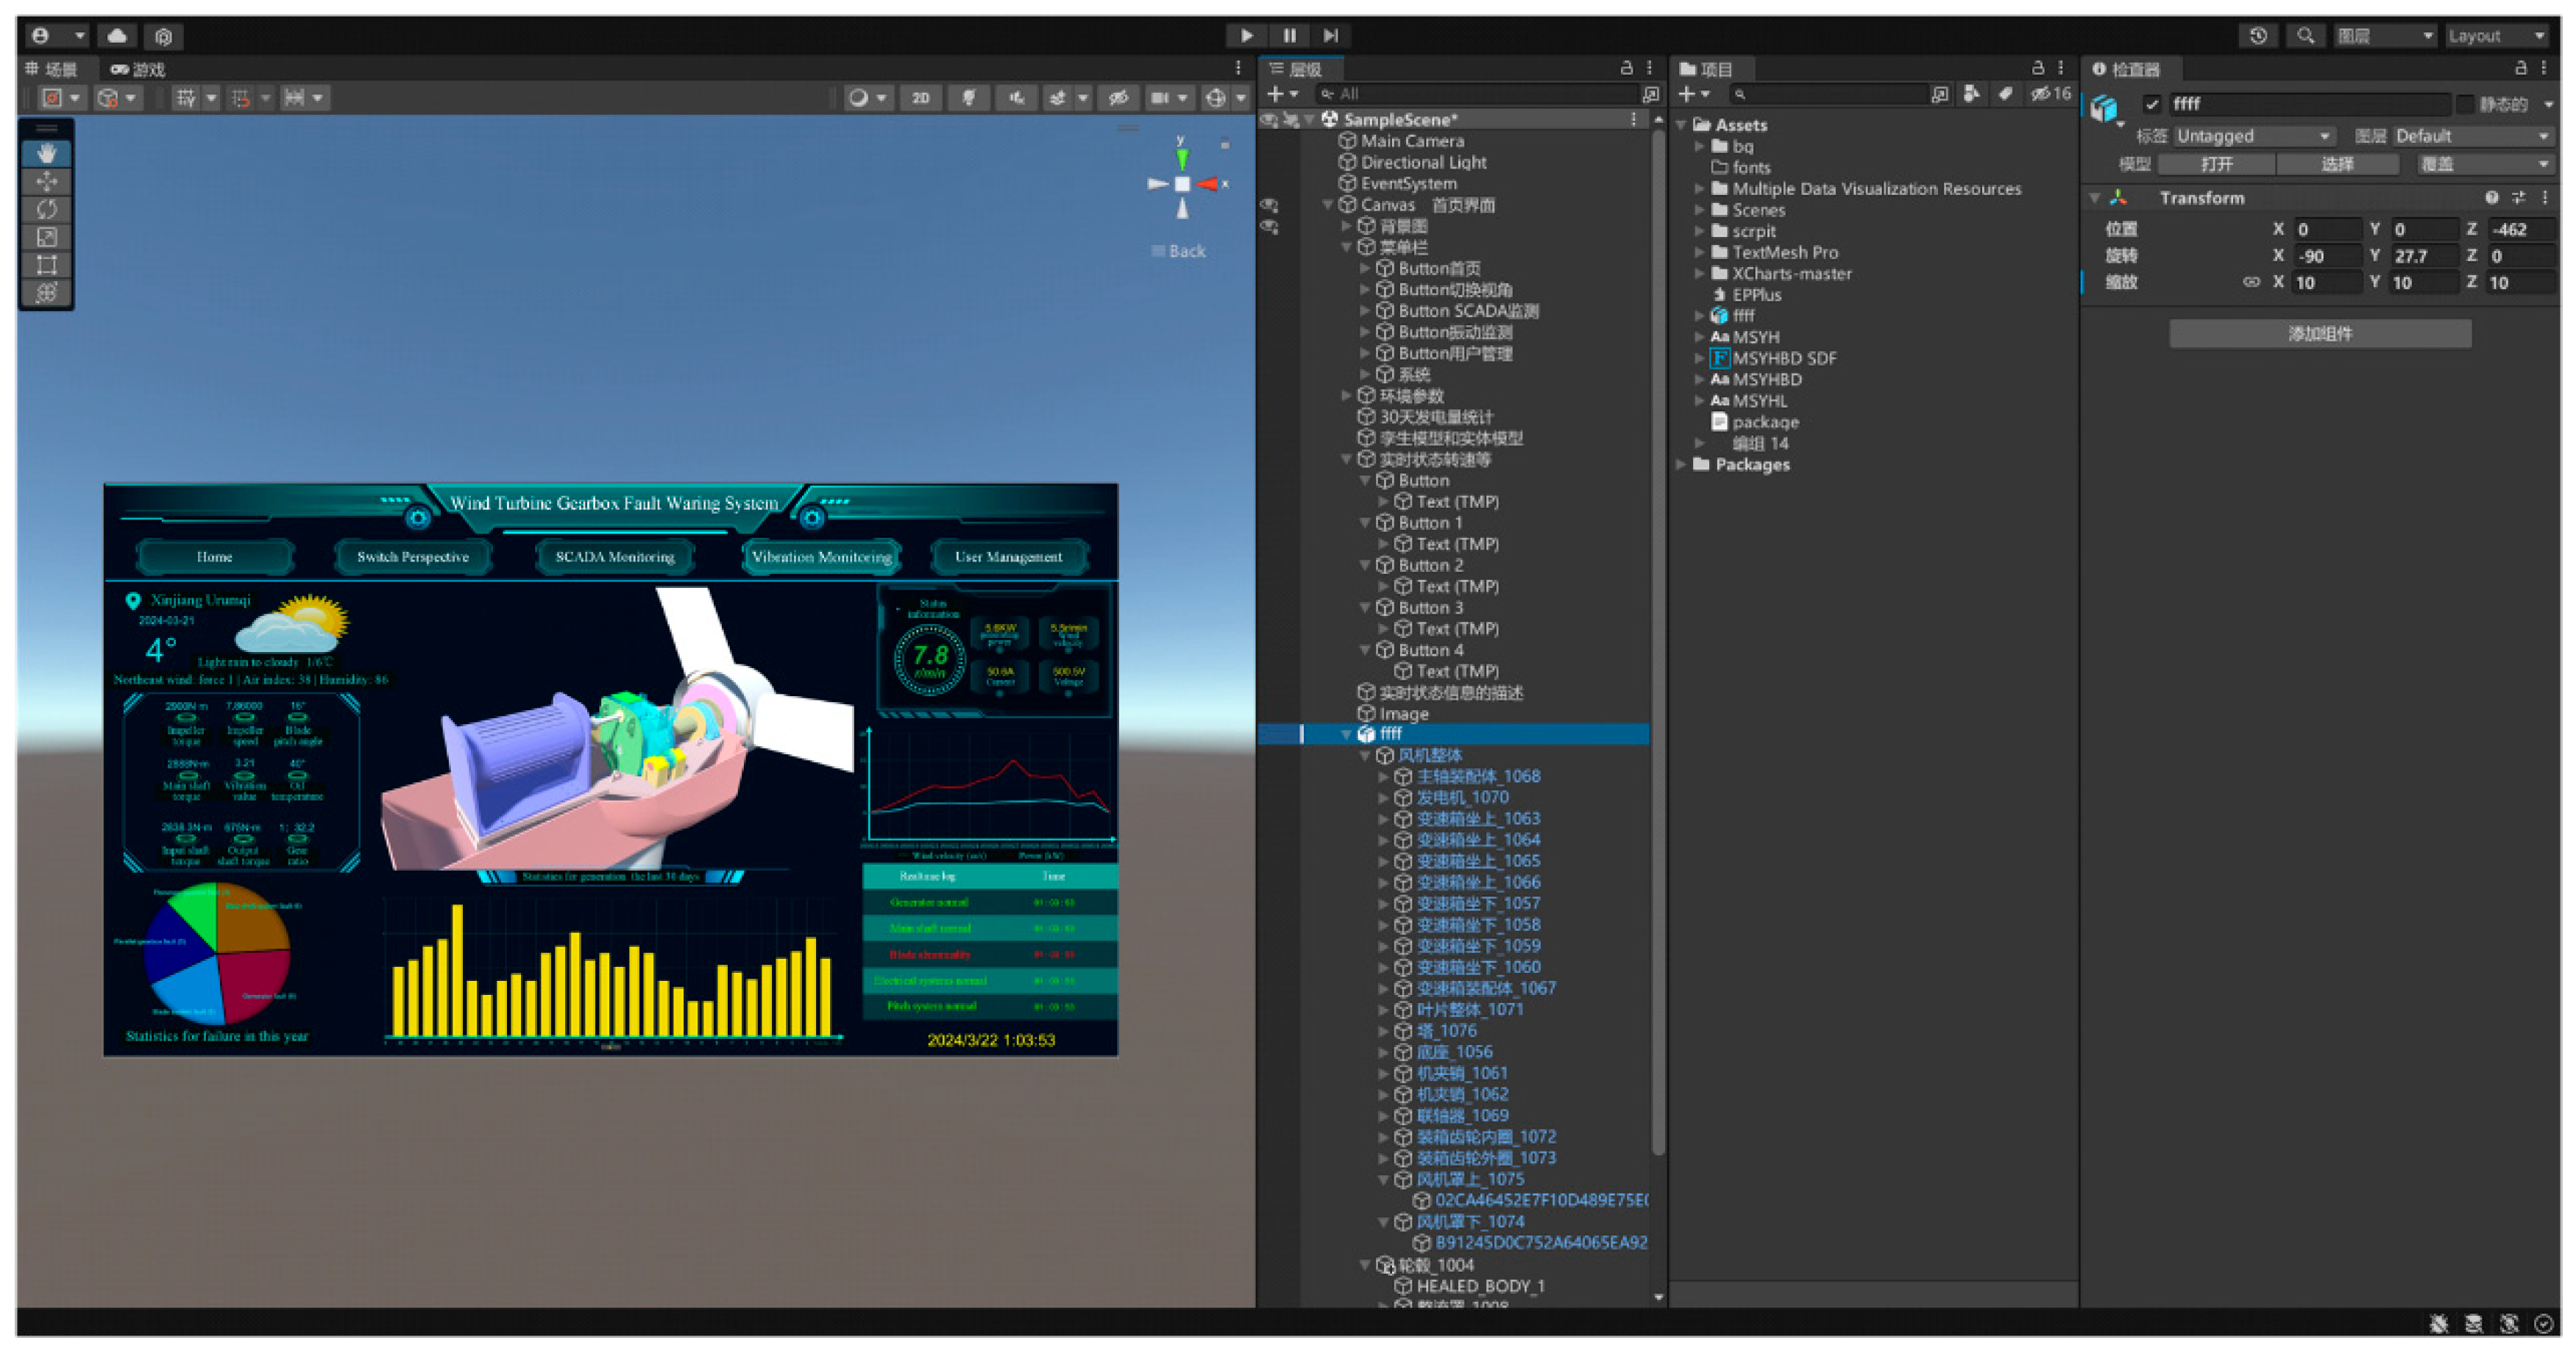
To validate the effectiveness and applicability of the proposed method, a digital twin system for intelligent monitoring and fault prediction of the wind turbine gear transmission system was developed using Unity3D (Unity 2021.2.7f1c1) as the core development framework. The system primarily includes 3D visualization of operational status data and intelligent early warning for abnormal states. By leveraging Unity3D’s powerful graphics processing capabilities, various types of equipment operational data are presented in the form of dashboards, charts, curves, and 3D models to help users intuitively understand the system status. Abnormal states can be identified through an established threshold determination system. When the collected data exceeds the preset safety threshold, the system automatically activates a multi-level alarm procedure to alert operators of potential equipment anomalies. As shown in Figure 19, a visualization scene is constructed using the Unity3D engine. In this scene, the 3D geometric model of the wind turbine is seamlessly integrated with interactive controls (including function buttons and information pop-ups), ambient lighting, and other visual elements to create a highly realistic virtual O&M environment, thereby enhancing the visualization of the wind turbine’s status monitoring.
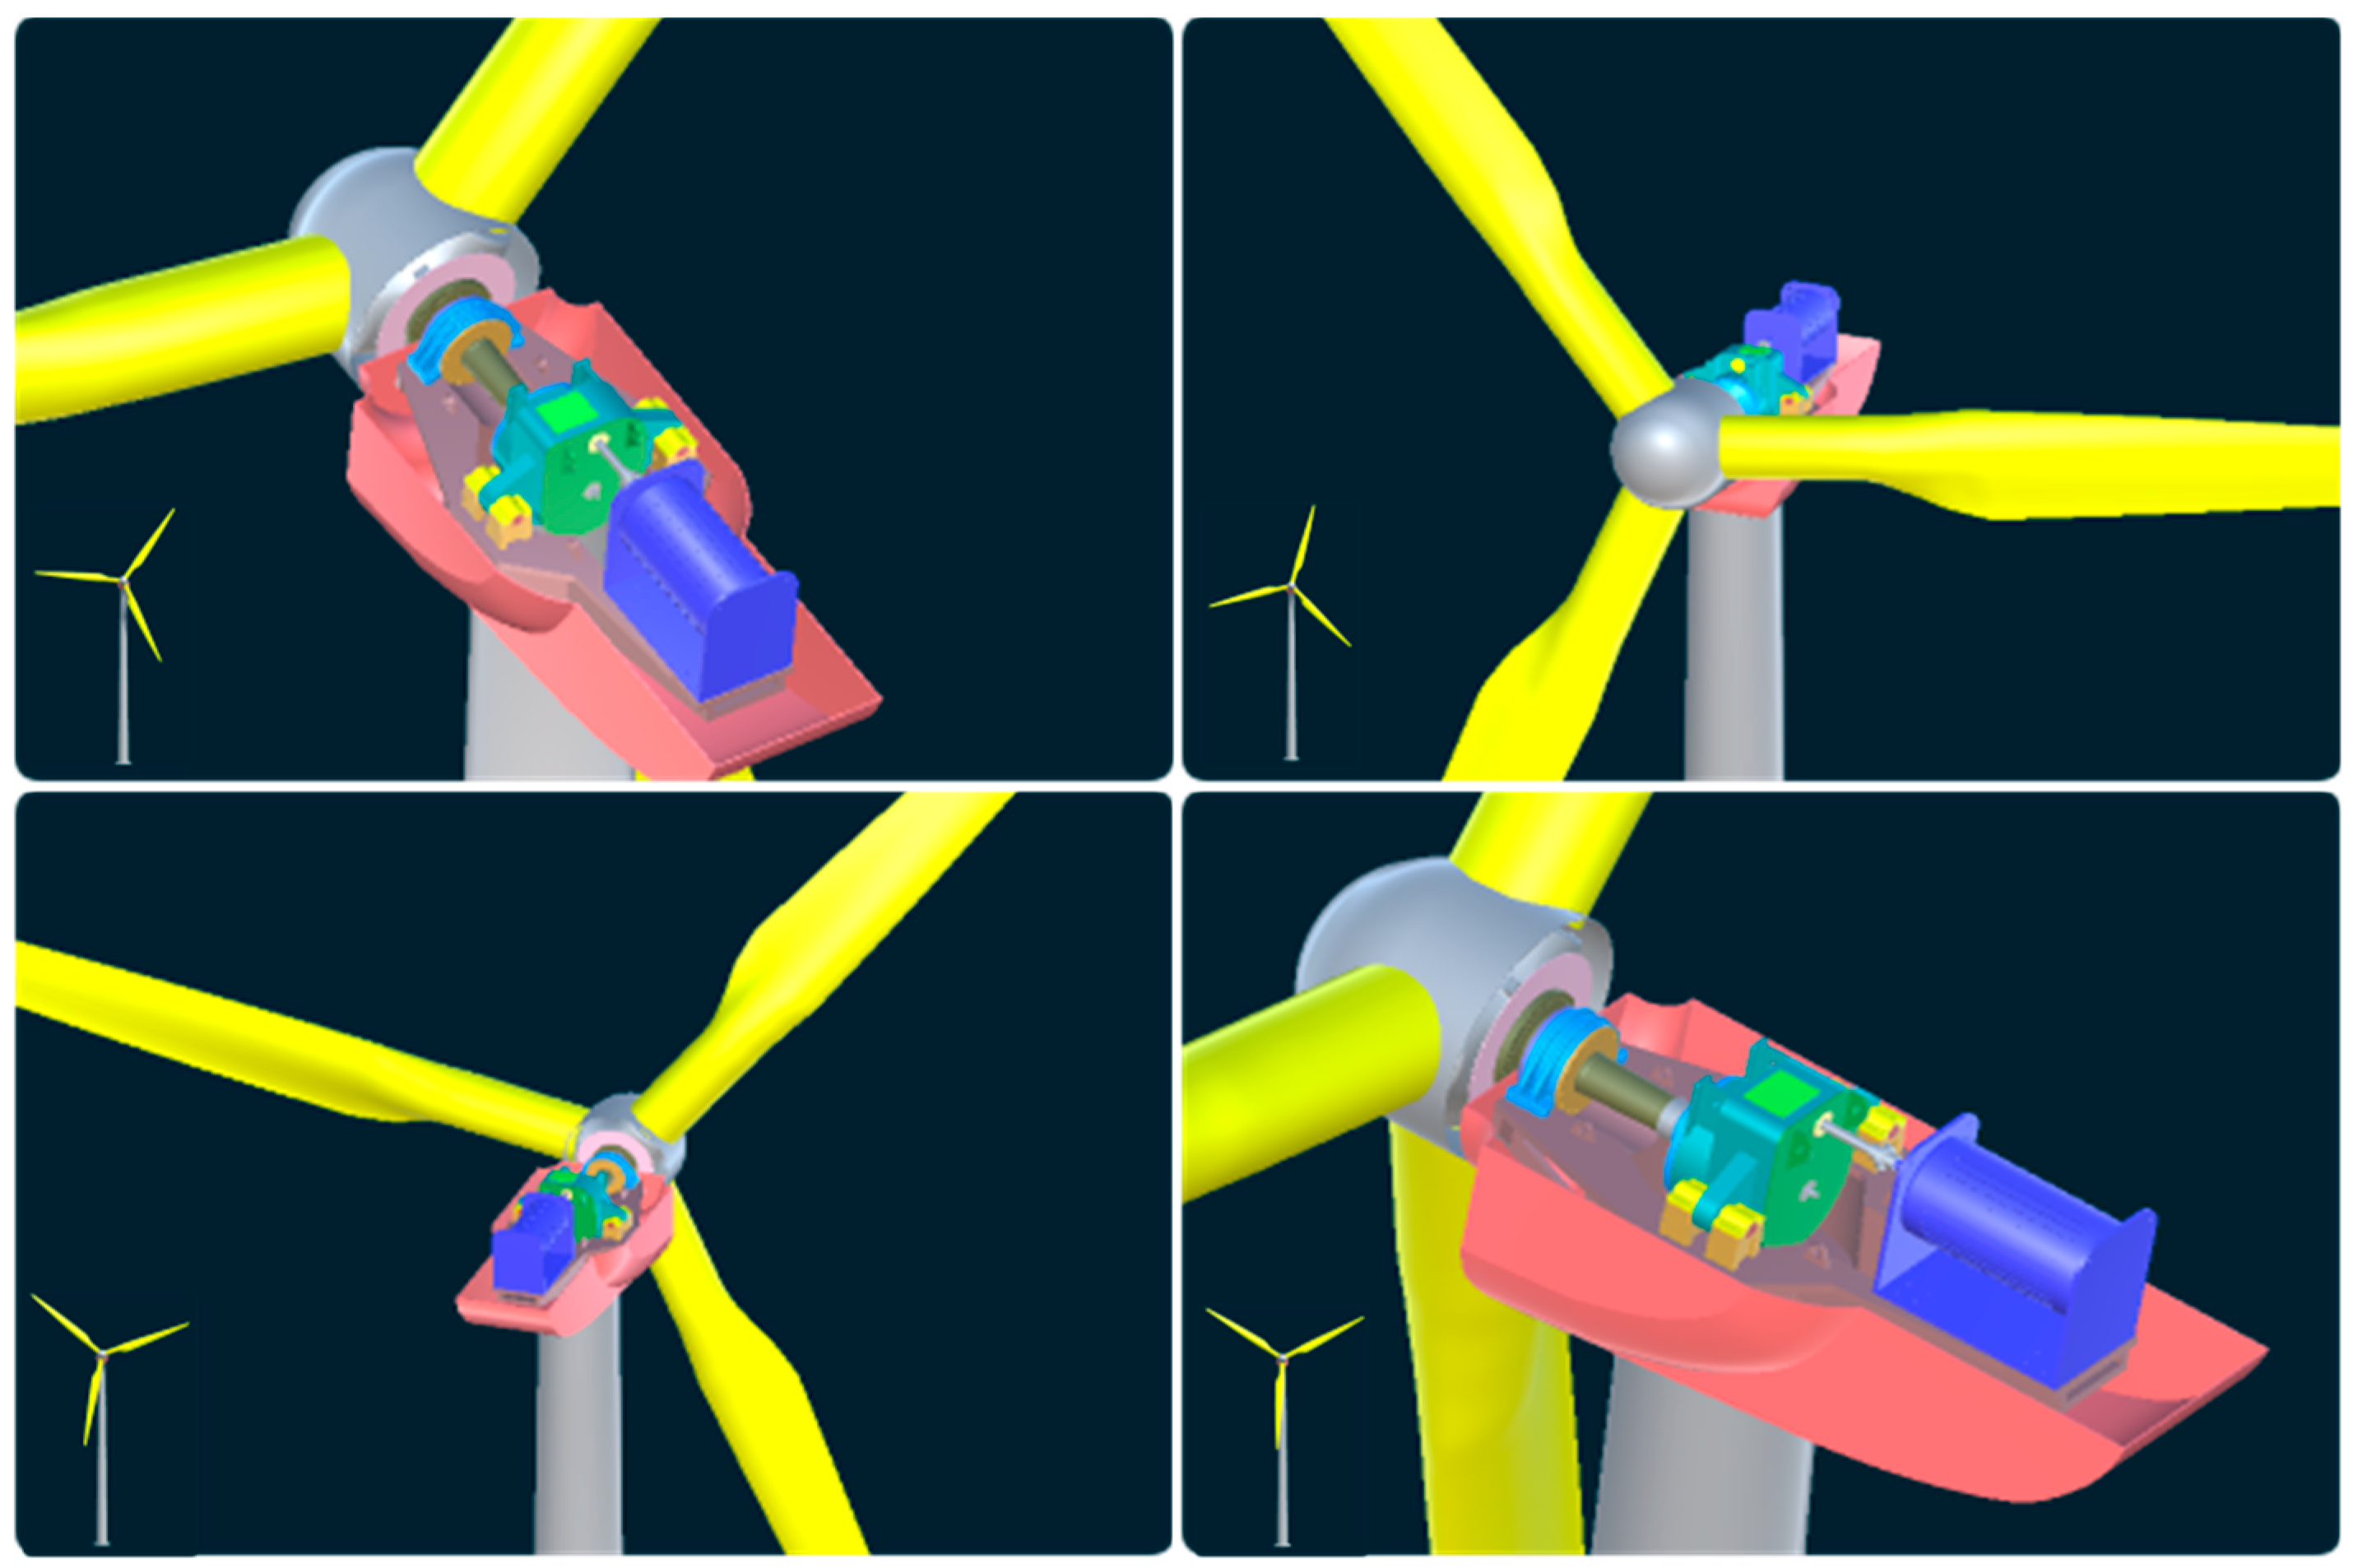
The data visualization module, as the core of the fault warning system for the wind turbine gearbox, reads data collected and stored locally by sensors to enable visual presentation of the data. Figure 20 shows the status of the geometric models of the entire wind turbine and its transmission system from different perspectives in Unity3D.
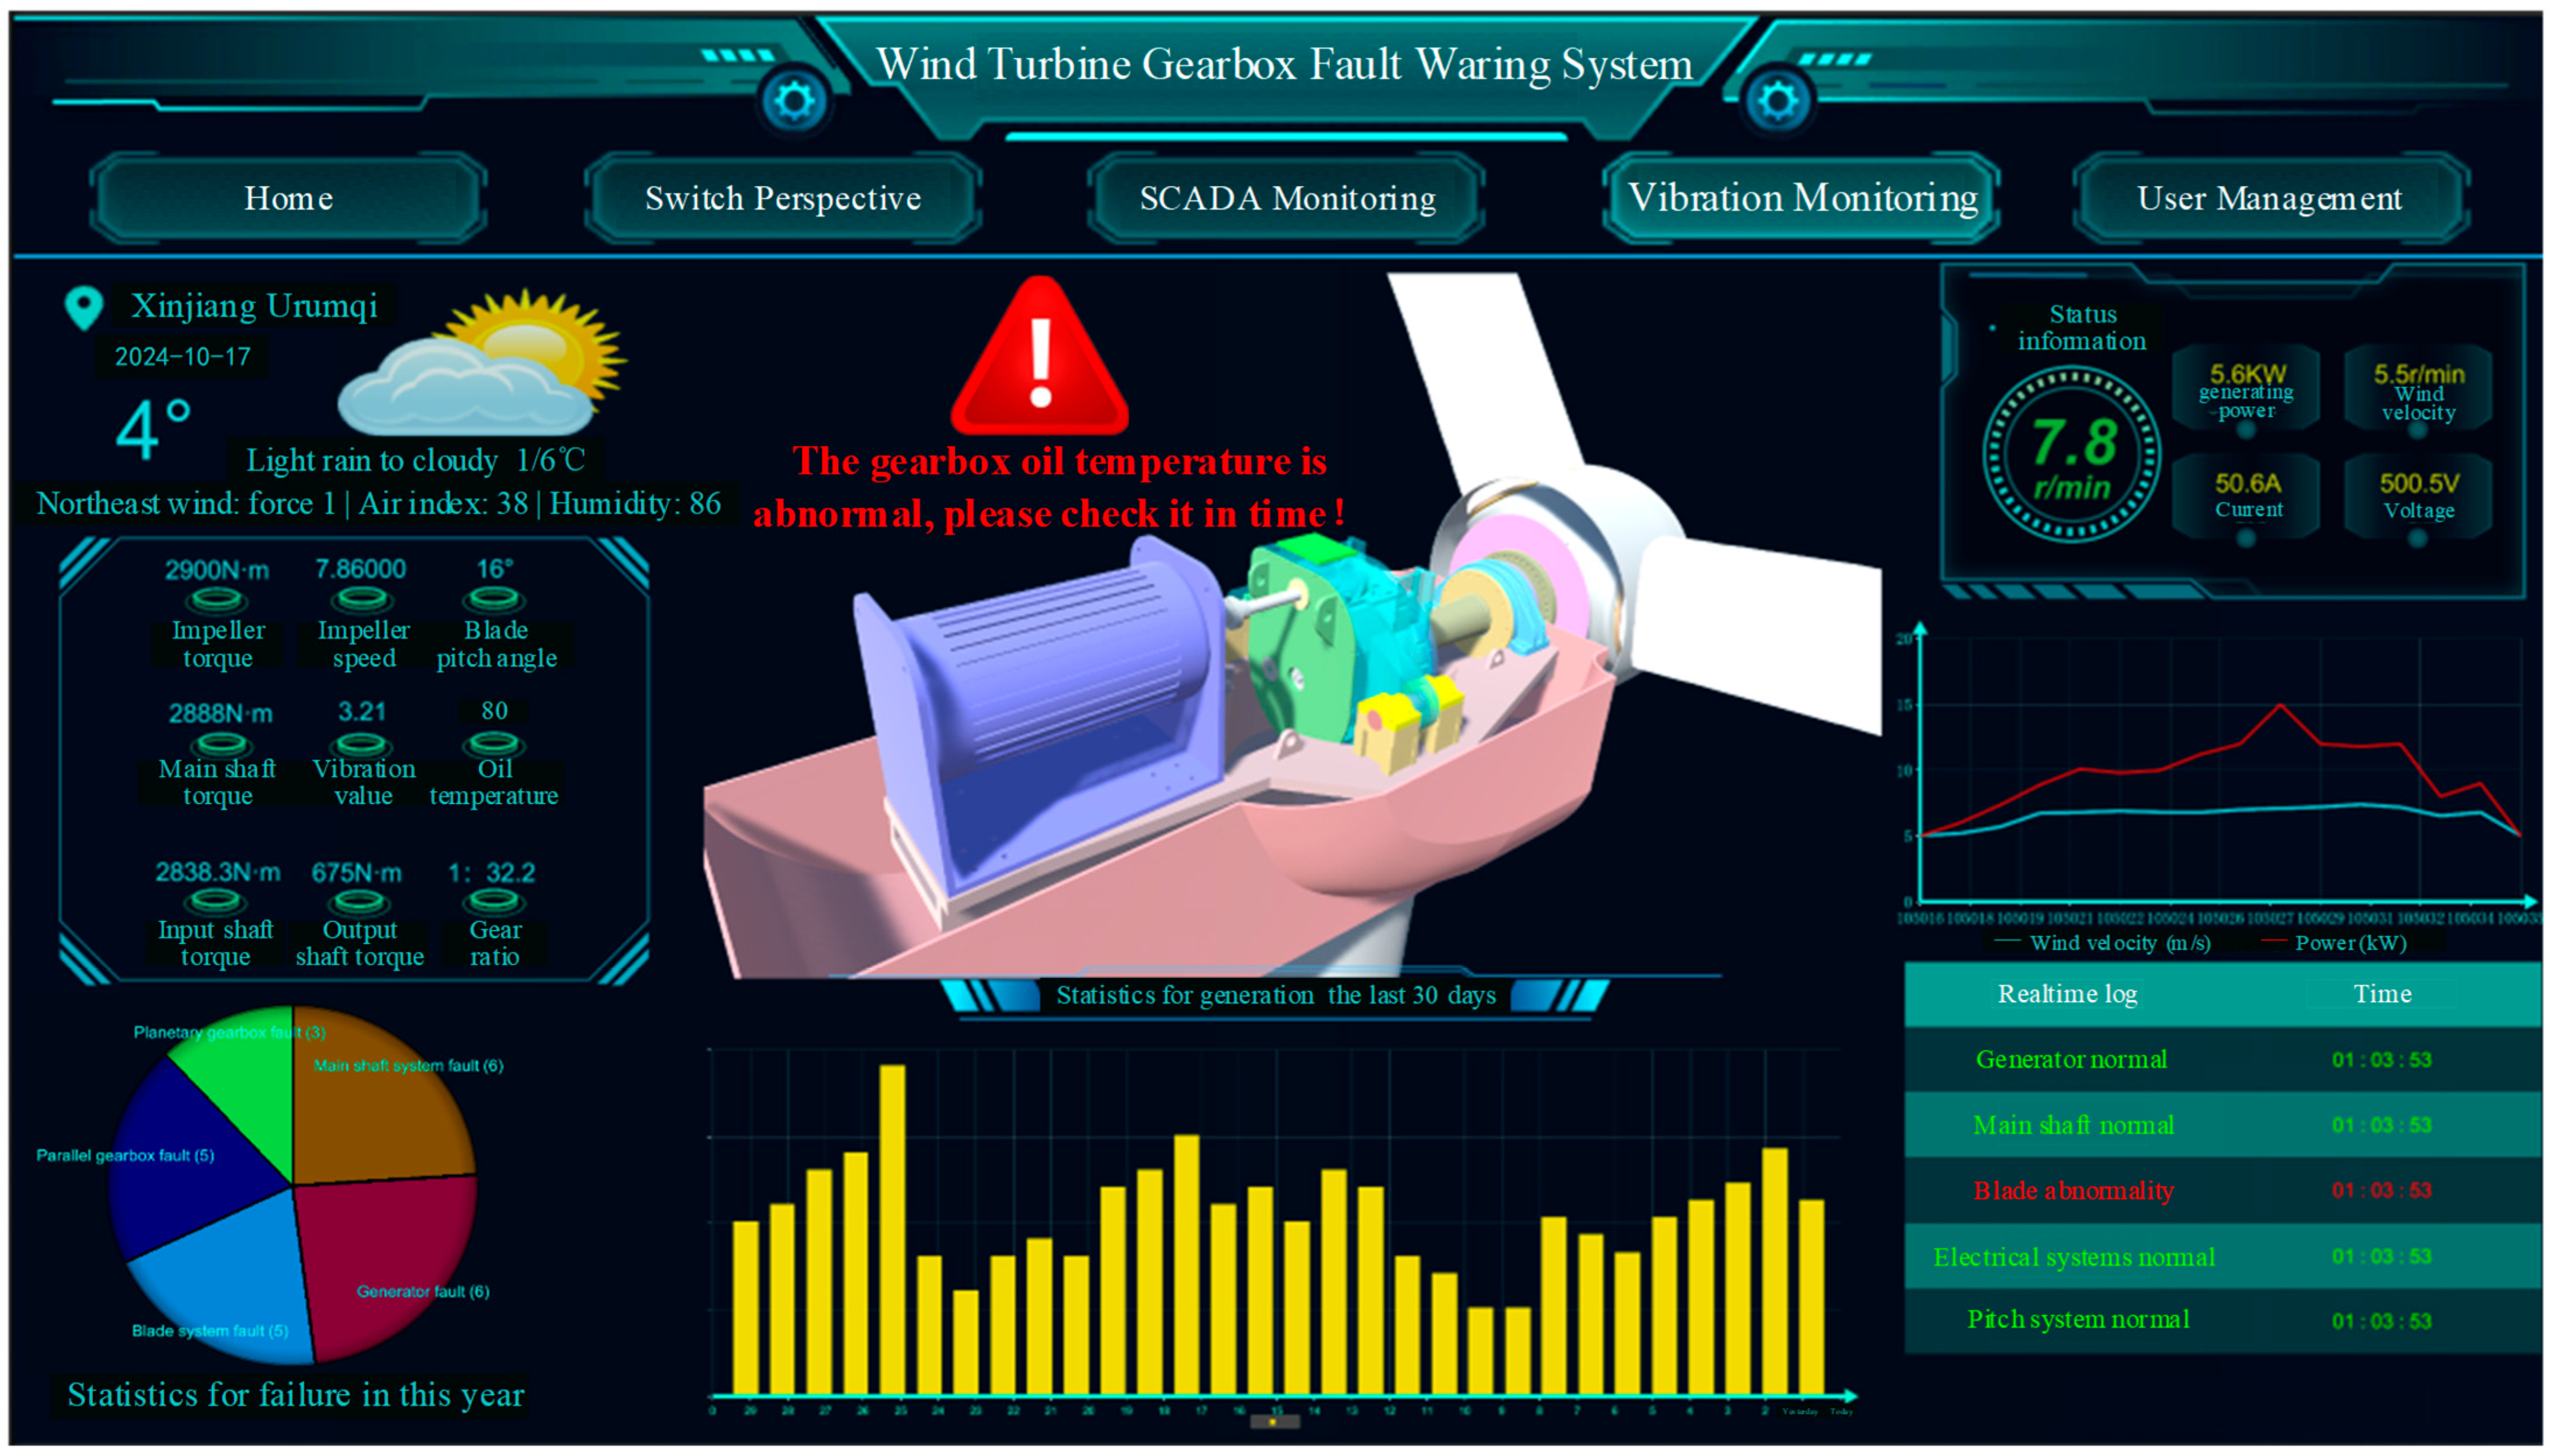
An operation data visualization monitoring interface has been developed on the Unity3D platform (as shown in Figure 21). The system adopts a multi-layered UI architecture, integrating basic components like RawImage and DropDown within a Canvas container, and combines them with C# scripts to achieve dynamic updates of transmission system parameters. It utilizes the Graph_Maker plugin to construct multi-dimensional data charts, including a pie chart for fault distribution, a bar chart for power generation changes, and a wind speed–power curve. The dynamic curves are updated using methods from the WMG_Series class. The Newtonsoft.Json parsing engine and the UnityWebRequest network module are integrated to obtain and display local weather data via an API.
As the core equipment of the wind energy conversion system, the wind turbine converts kinetic energy from the air into electrical energy. To ensure the stable and efficient operation of the unit, it is essential to monitor its operating parameters. By monitoring parameters such as generator speed, current, voltage, and power, which reflect the unit’s operating conditions, its operation status can be accurately evaluated. As shown in Figure 22, the real-time monitoring data of these parameters serve as a critical foundation for evaluating operational status.
Statistical analysis of wind turbine operational data is a vital tool for assessing its performance and stability. By collecting statistics on fault occurrences and daily power generation, the operational status of the turbine can be effectively understood. Figure 23 presents the number of faults and the trend of daily power generation for a wind turbine over a one-month cycle of operation. This data can be used to identify the fault frequency and fluctuations in power generation capacity over a certain period. Frequent faults or significant fluctuations in power generation may indicate potential technical problems or operational anomalies. The equipment’s service life can be prolonged, and the power generation efficiency can be improved by timely fault detection and taking necessary maintenance and optimization measures.
As shown in Figure 24, in order to facilitate the observation and analysis of the changing trend of historical SCADA data, the Graph Maker visualization tool in the Unity3D engine was used to generate dynamic graphical displays of the historical monitoring data. Users can click to switch between viewing time-series curves of different parameters, including key operational indicators such as wind speed and power. To further monitor the internal status of the gearbox, the collected SCADA data is fed into the trained CNN-LSTM-Attention network model to calculate predicted values. The residuals between the predicted and actual values are then calculated. The processed results are sent back to the Unity3D platform. Subsequently, the Graph Marker component in Unity3D was used to plot the actual, predicted, and residual curves of the oil sump temperature, visually presenting the historical evolution of the gearbox’s operational status. This enabled the implementation of a data-driven fault prediction function for the wind turbine gearbox.
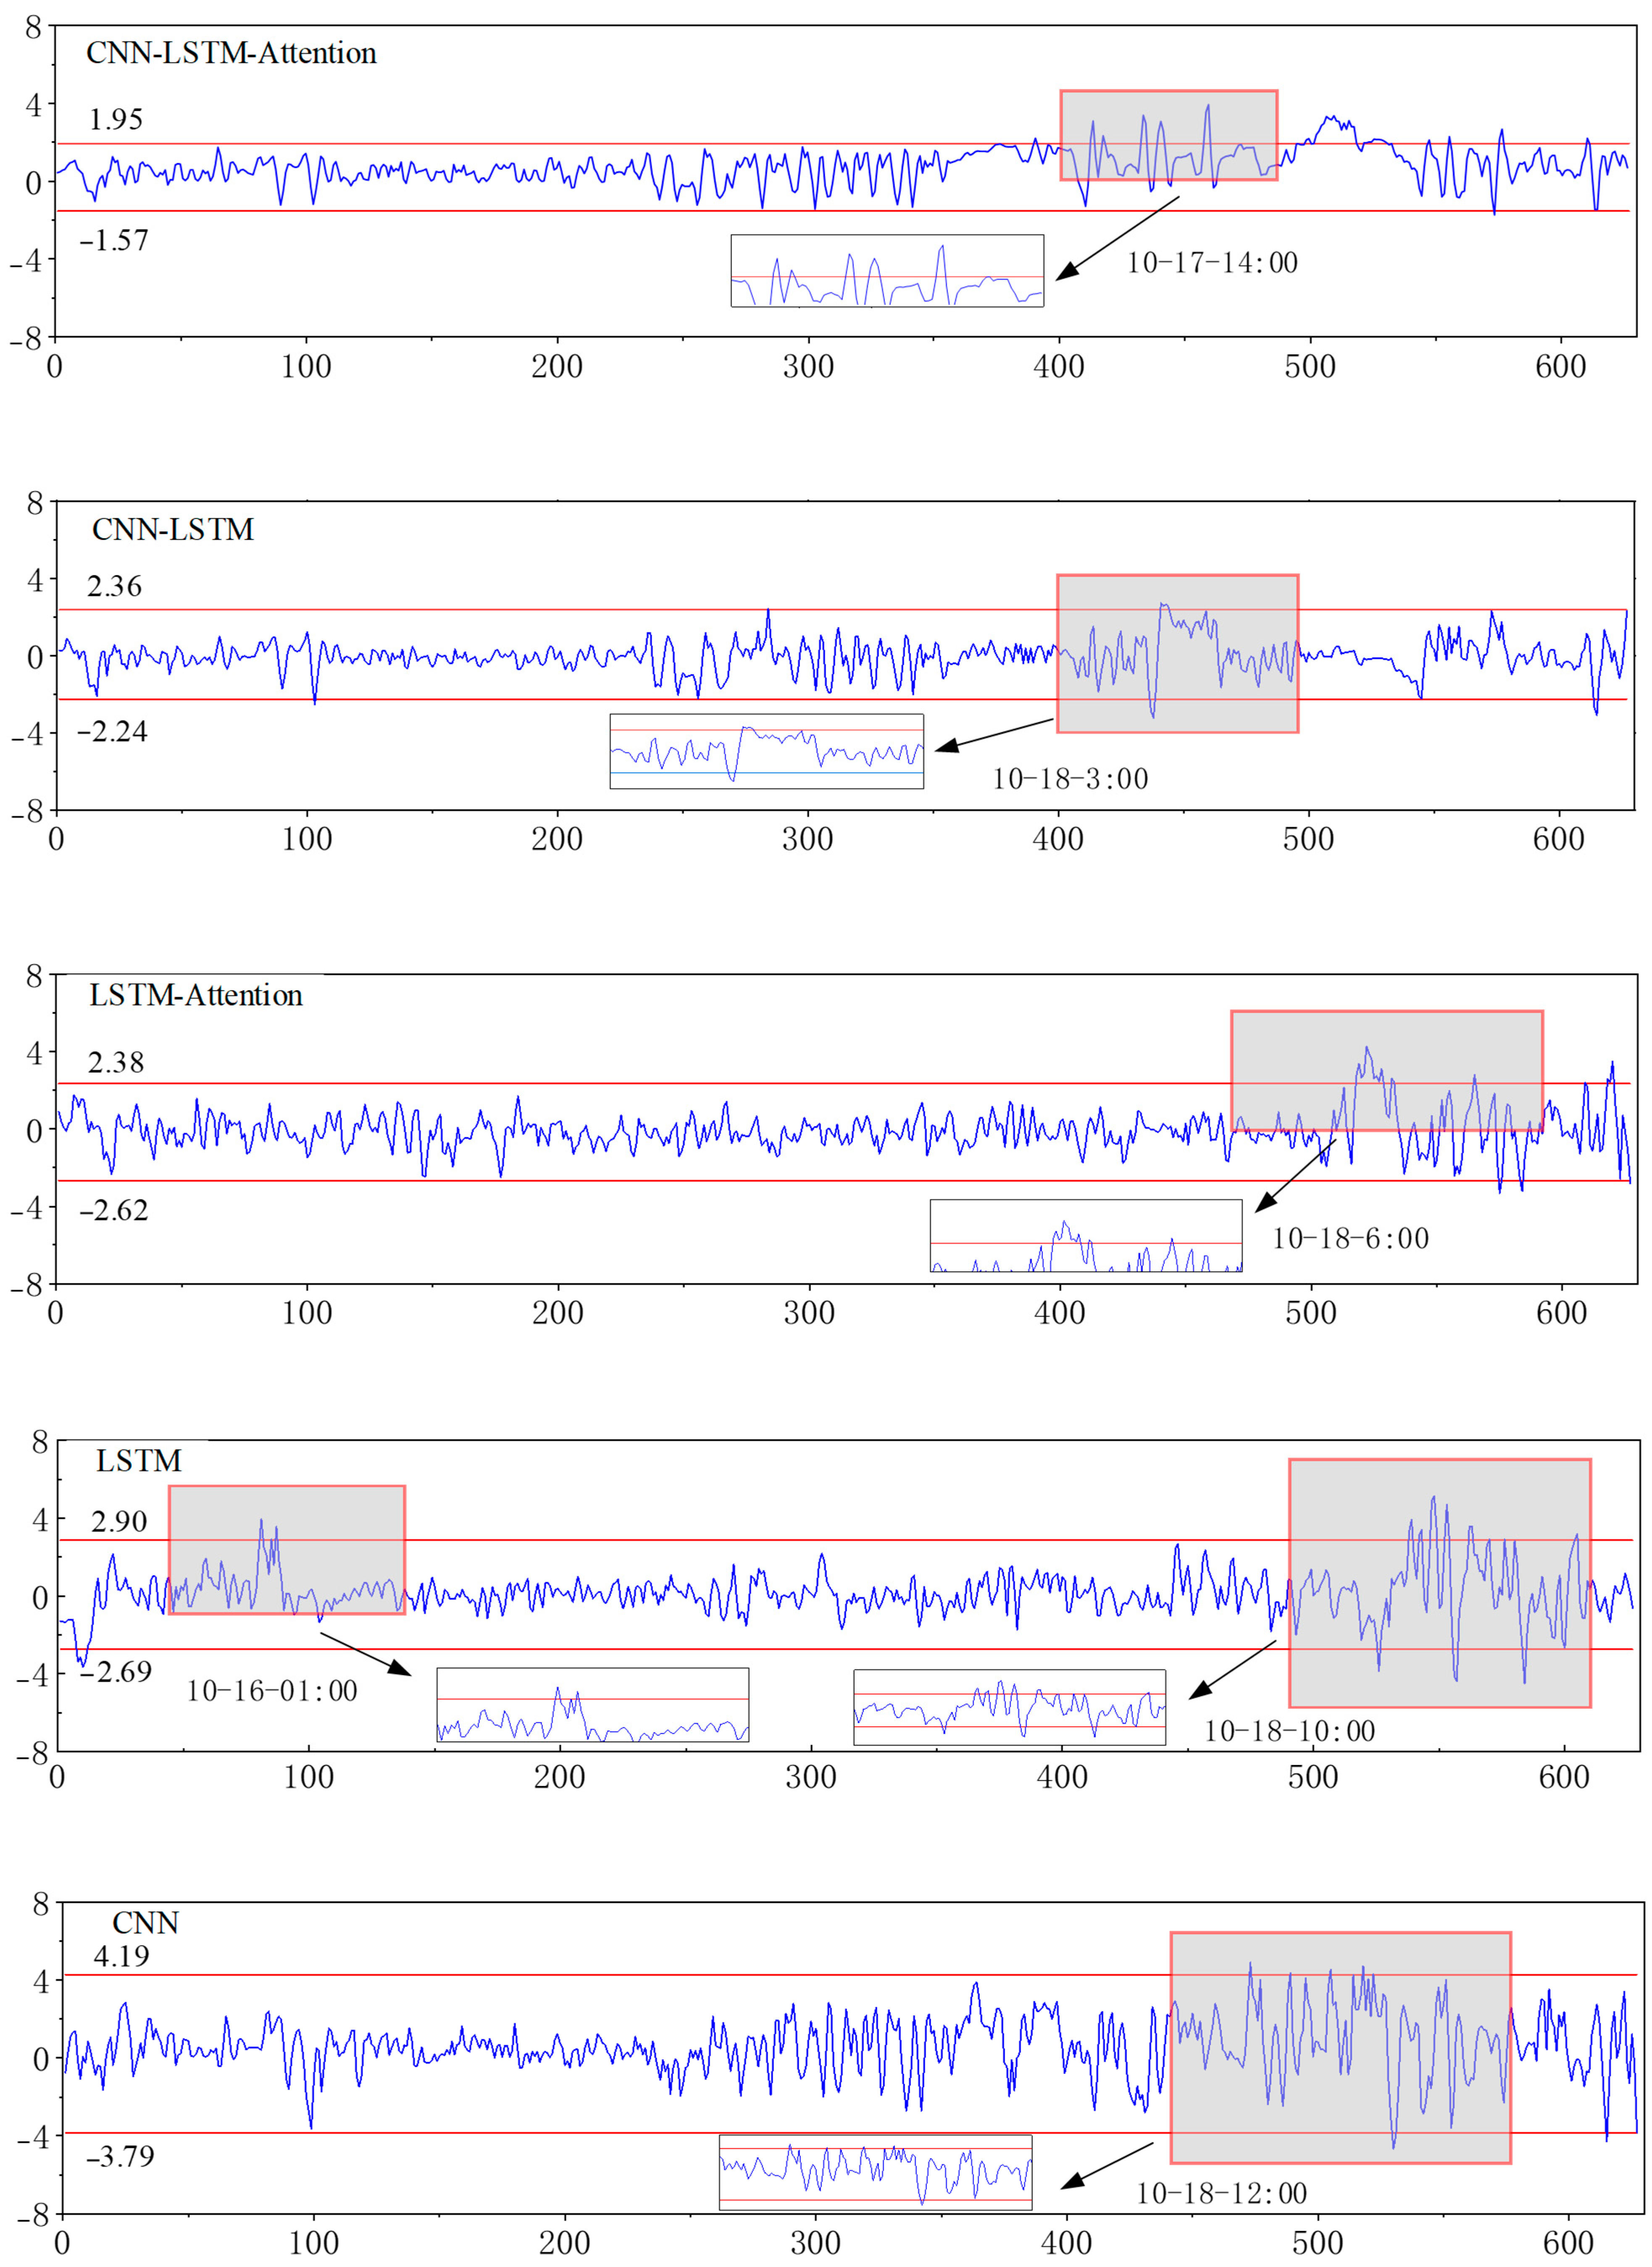
The trained CNN-LSTM-Attention network model learns the historical normal operation data to predict the oil sump temperature during gearbox operation and calculates the temperature residuals. When the system detects that a vibration signal or a residual exceeds a set threshold, it automatically triggers an alarm mechanism, thereby establishing a data-driven turbine gearbox fault warning system on the Unity3D visualization platform. The core mechanism of this system is to predict the residuals by monitoring the temperature of the gearbox oil sump. When a monitored feature value exceeds a preset safety threshold, an alarm is automatically triggered, and the GameObject.SetActive() method is called to activate an interactive warning interface, prompting O&M personnel to respond promptly. The CNN-LSTM-Attention model is able to initially identify a gearbox fault and give an alarm at 2:00 PM on the 17th, with residuals frequently exceeding the threshold thereafter. This indicates that the wind turbine’s gearbox is already in an abnormal state. Reviewing the O&M log, an alarm for excessive gearbox oil sump temperature (warning threshold: 75 °C) was found during an inspection at 8:51 AM on the 19th. The CNN-LSTM model did not detect the oil temperature residual exceeding the threshold until 3:00 AM on the 18th, while the LSTM-Attention model did not issue an alarm until 6:00 AM on the 18th. The LSTM model sent an alarm at 10:00 AM on the 18th, while the CNN model did not trigger an alarm until 12:00 PM on the 18th. This demonstrates that the CNN-LSTM-Attention model can identify the abnormal fluctuation trend of gear oil temperature 42 h in advance, the CNN-LSTM model can do it 29 h in advance, the LSTM-Attention model can do it 26 h in advance, the LSTM model can do it 22 h in advance, and the CNN model can do it 20 h in advance. The CNN-LSTM-Attention model proposed in this paper has a prediction time that is 13 h earlier than the most advanced model among other methods, including the CNN-LSTM model. Therefore, the model proposed in this study is the most advanced. The validation analysis of the fault case of turbine #07 demonstrates that the proposed early-warning model for wind turbine gearbox oil sump temperature is effective and possesses fault pre-warning capabilities. It can provide effective technical support for wind farm O&M, and its analysis results can serve as an important reference for formulating subsequent equipment maintenance strategies, helping to enhance the scientific basis and timeliness of O&M decisions. This is illustrated in Figure 25 and Figure 26.

5. Conclusions

This study develops an intelligent monitoring and early-fault-warning system for a wind turbine gear transmission system based on digital twin technology, multi-source operational data, and deep learning models. Through the collaborative optimization of multi-source data fusion and deep learning algorithms, the system’s ability to perceive conditions and predict faults is significantly enhanced. The research findings indicate that the introduction of digital twin technology not only enables real-time interaction between the physical system and its virtual model but, more importantly, creates a multi-dimensional real-time monitoring and analysis framework. This led to a qualitative improvement in the visualization and predictability of the system’s operational status. The proposed hybrid CNN-LSTM-Attention prediction model, by virtue of its mechanisms for joint spatio-temporal feature extraction and attention weight allocation, maintained high prediction stability even amid noise interference. The proposed model reduces RMSE and MAPE values by an average of 0.3945 and 0.546, respectively, while increasing the r2 value by an average of 0.061 compared to the other models, indicating that the proposed CNN-LSTM-Attention model achieves higher prediction accuracy and a better fit.
Although the method proposed in this study has yielded significant results in monitoring wind turbine gear transmission systems, enabling more precise and efficient fault early warning, there are still several areas that need improvement. Since the training data is primarily sourced from a specific turbine model, the model’s cross-model generalization capability is limited. Concurrently, the real-time dynamic updating mechanism of the digital twin model has not been fully automated, necessitating manual intervention in parameter optimization and model iteration. Therefore, future research will focus on developing cross-model adaptive algorithms based on transfer learning, constructing an intelligent framework for autonomous model updates, and enhancing the system’s robustness in complex environments so as to promote the broader application of this technology in practical engineering.

Author Contributions

Conceptualization, T.X. and X.Z.; methodology, T.X.; software, X.Z.; validation, X.Z.; formal analysis, X.Z.; investigation, T.X.; resources, W.S.; data curation, T.X.; writing—original draft preparation, T.X.; writing—review and editing, T.X.; visualization, X.Z.; supervision, W.S.; project administration, W.S.; funding acquisition, W.S. All authors have read and agreed to the published version of the manuscript.

Funding

Special Project for Local Science and Technology Development Guided by the Central Government (ZYYD2025JD07).

Institutional Review Board Statement

Not applicable.

Data Availability Statement

The data presented in this study are available upon request from the corresponding author.

Conflicts of Interest

The authors declare no conflicts of interest.

References

  1. Hu, X.; Li, C.; Ye, K. Analysis on Vibration Signal Decomposition Methods of Wind Turbine Gearbox. J. Chin. Soc. Power Eng. 2021, 41, 323–329. [Google Scholar]
  2. Zhao, X.; Chen, C.; Liu, J.; Gu, Q. Nonlinear Dynamic Response Analysis of High Level of Wind Turbine Gearbox Transmission System Considering Eccentricity. Acta Energiae Solaris Sin. 2020, 41, 98–108. [Google Scholar]
  3. Lu, Z.; Zhou, J.; Cui, Q.; Wen, J.; Fei, X. Research on Reliability of Gear Transmission System of Wind Turbine Based on Dynamics. Acta Energiae Solaris Sin. 2023, 44, 397–404. [Google Scholar]
  4. Zhang, F.; Chen, M.; Zhu, Y.; Zhang, K.; Li, Q. A Review of Fault Diagnosis, Status Prediction, and Evaluation Technology for Wind Turbines. Energies 2023, 16, 1125. [Google Scholar] [CrossRef]
  5. Wang, J.; Hu, J.; Ma, K. Wind speed probability distribution estimation and wind energy assessment. Renew. Sustain. Energy Rev. 2016, 60, 881–899. [Google Scholar] [CrossRef]
  6. Han, Q.; Ma, S.; Wang, T.; Chu, F. Kernel density estimation model for wind speed probability distribution with applicability to wind energy assessment in China. Renew. Sustain. Energy Rev. 2019, 115, 109387. [Google Scholar] [CrossRef]
  7. Katinas, V.; Gecevicius, G.; Marciukaitis, M. An investigation of wind power density distribution at location with low and high wind speeds using statistical model. Appl. Energy 2018, 218, 442–451. [Google Scholar] [CrossRef]
  8. Stetco, A.; Dinmohammadi, F.; Zhao, X.; Robu, V.; Flynn, D.; Barnes, M.; Keane, J.; Nenadic, G. Machine learning methods for wind turbine condition monitoring: A review. Renew. Energy 2019, 133, 620–635. [Google Scholar] [CrossRef]
  9. Singh, U.; Rizwan, M.; Alaraj, M.; Alsaidan, I. A machine learning-based gradient boosting regression approach for wind power production forecasting: A step towards smart grid environments. Energies 2021, 14, 5196. [Google Scholar] [CrossRef]
  10. Hur, S. Short-term wind speed prediction using Extended Kalman filter and machine learning. Energy Rep. 2021, 7, 1046–1054. [Google Scholar] [CrossRef]
  11. Helbing, G.; Ritter, M. Deep Learning for fault detection in wind turbines. Renew. Sustain. Energy Rev. 2018, 98, 189–198. [Google Scholar] [CrossRef]
  12. Manero, J.; Béjar, J.; Cortés, U. “Dust in the wind… ”, deep learning application to wind energy time series forecasting. Energies 2019, 12, 2385. [Google Scholar] [CrossRef]
  13. Hong, Y.Y.; Satriani, T.R.A. Day-ahead spatiotemporal wind speed forecasting using robust design-based deep learning neural network. Energy 2020, 209, 118441. [Google Scholar] [CrossRef]
  14. Ding, Y.; Chen, Z.; Zhang, H.; Wang, X.; Guo, Y. A short-term wind power prediction model based on CEEMD and WOA-KELM. Renew. Energy 2022, 189, 188–198. [Google Scholar] [CrossRef]
  15. Zhang, W.; Lin, Z.; Liu, X. Short-term offshore wind power forecasting-A hybrid model based on Discrete Wavelet Transform (DWT), Seasonal Autoregressive Integrated Moving Average (SARIMA), and deep-learning-based Long Short-Term Memory (LSTM). Renew. Energy 2022, 185, 611–628. [Google Scholar] [CrossRef]
  16. Maheswari, R.U.; Umamaheswari, R. Trends in non-stationary signal processing techniques applied to vibration analysis of wind turbine drive train–A contemporary survey. Mech. Syst. Signal Process. 2017, 85, 296–311. [Google Scholar] [CrossRef]
  17. Vidal, Y.; Pozo, F.; Tutivén, C. Wind turbine multi-fault detection and classification based on SCADA data. Energies 2018, 11, 3018. [Google Scholar] [CrossRef]
  18. Tutivén, C.; Vidal, Y.; Insuasty, A.; Campoverde-Vilela, L.; Achicanoy, W. Early fault diagnosis strategy for WT main bearings based on SCADA data and one-class SVM. Energies 2022, 15, 4381. [Google Scholar] [CrossRef]
  19. Rashid, H.; Khalaji, E.; Rasheed, J.; Batunlu, C. Fault prediction of wind turbine gearbox based on SCADA data and machine learning. In Proceedings of the 2020 10th International Conference on Advanced Computer Information Technologies (ACIT), Deggendorf, Germany, 16–18 September 2020; IEEE: New York, NY, USA, 2020; pp. 391–395. [Google Scholar]
  20. Murgia, A.; Verbeke, R.; Tsiporkova, E.; Terzi, L.; Astolfi, D. Discussion on the suitability of SCADA-based condition monitoring for wind turbine fault diagnosis through temperature data analysis. Energies 2023, 16, 620. [Google Scholar] [CrossRef]
  21. Encalada-Dávila, Á.; Moyón, L.; Tutivén, C.; Puruncajas, B.; Vidal, Y. Early fault detection in the main bearing of wind turbines based on gated recurrent unit (GRU) neural networks and SCADA data. IEEE/ASME Trans. Mechatron. 2022, 27, 5583–5593. [Google Scholar] [CrossRef]
  22. Castellani, F.; Astolfi, D.; Natili, F. SCADA data analysis methods for diagnosis of electrical faults to wind turbine generators. Appl. Sci. 2021, 11, 3307. [Google Scholar] [CrossRef]
  23. Rama, V.S.B.; Hur, S.H.; Yang, J.M. Short-term fault prediction of wind turbines based on integrated RNN-LSTM. IEEE Access 2024, 12, 22465–22478. [Google Scholar] [CrossRef]
  24. Encalada-Dávila, Á.; Puruncajas, B.; Tutiven, C.; Vidal, Y. Wind turbine main bearing fault prognosis based solely on scada data. Sensors 2021, 21, 2228. [Google Scholar] [CrossRef] [PubMed]
  25. Chokr, B.; Chatti, N.; Charki, A.; Lemenand, T.; Hammoud, M. Bi-LSTM Autoencoder SCADA based Unsupervised Anomaly Detection in Real Wind Farm Data. In Proceedings of the 2024 IEEE International Conference on Prognostics and Health Management (ICPHM), Spokane, WA, USA, 17–19 June 2024; IEEE: New York, NY, USA, 2024; pp. 174–183. [Google Scholar]
  26. Liao, T.; Qian, S.; Meng, Z.; Xie, G.F. Early fault warning of wind turbine based on BRNN and large sliding window. J. Intell. Fuzzy Syst. 2020, 38, 3389–3401. [Google Scholar]
  27. Qi, T.F.; Fang, H.R.; Chen, Y.F.; He, L.T. Research on digital twin monitoring system for large complex surface machining. J. Intell. Manuf. 2022, 35, 977–990. [Google Scholar] [CrossRef]
  28. Fan, Y.; Yang, J.; Chen, J.; Hu, P.; Wang, X.; Xu, J.; Zhou, B. A digital-twin visualized architecture for Flexible Manufacturing System. J. Manuf. Syst. 2021, 60, 176–201. [Google Scholar] [CrossRef]
  29. Wang, K.J.; Lee, Y.H.; Angelica, S. Digital twin design for real-time monitoring—A case study of die cutting machine. Int. J. Prod. Res. 2021, 59, 6471–6485. [Google Scholar] [CrossRef]
  30. Zhou, Y.; Fu, Z.; Zhang, J.; Li, W.; Gao, C. A digital twin-based operation status monitoring system for port cranes. Sensors 2022, 22, 3216. [Google Scholar] [CrossRef]
  31. Qin, S.; Cheng, L.; He, Z.; Chen, S. Review of research and application on the wind power-generation system. J. Mach. Des. 2021, 38, 1–8. [Google Scholar]
  32. Wang, X.; Wang, L.; Yu, Y.; Ao, Z.; Sun, L. Survey on Characteristics, Architecture and Applications of Digital Twin Power Grid. J. Electron. Inf. Technol. 2022, 44, 3721–3733. [Google Scholar]
  33. Fang, F.; Yao, G.; Hu, Y.; Wu, X.; Liu, J. Digital twin system of a wind turbine. Sci. Sin. (Technol.) 2022, 52, 1582–1594. [Google Scholar] [CrossRef]
  34. Su, D. Study on Key Technologies of Wind Turbine Operation and Maintenance Digital Twin System. Master’s Thesis, Chang’an University, Xi’an, China, 2023. [Google Scholar]
  35. Zhao, X. Design and Development of a Wind Farms Digital Twin Software System Based on High-Precision Wind Turbine Models and Real-Time Simulators. Master’s Thesis, Shandong University, Jinan, China, 2023. [Google Scholar]
  36. Moghadam, F.K.; Nejad, A.R. Nejad. Online condition monitoring of floating wind turbines drivetrain by means of digital twin. Mech. Syst. Signal Process. 2022, 162, 108087. [Google Scholar] [CrossRef]
  37. Zhao, X.; Dao, M.H.; Le, Q.T. Digital twining of an offshore wind turbine on a monopile using reduced-order modelling approach. Renew. Energy 2023, 206, 531–551. [Google Scholar] [CrossRef]
  38. Olatunji, O.; Adedeji, P.A.; Madushele, N.; Jen, T.C. Overview of digital twin technology in wind turbine fault diagnosis and condition monitoring. In Proceedings of the 2021 IEEE 12th International Conference on Mechanical and Intelligent Manufacturing Technologies (ICMIMT), Cape Town, South Africa, 13–15 May 2021; IEEE: New York, NY, USA, 2021; pp. 201–207. [Google Scholar]
  39. Mahmoud, M.; Semeraro, C.; Abdelkareem, M.A.; Olabi, A.G. Designing and prototyping the architecture of a digital twin for wind turbine. Int. J. Thermofluids 2024, 22, 100622. [Google Scholar] [CrossRef]
  40. Liu, S.; Ren, S.; Jiang, H. Predictive maintenance of wind turbines based on digital twin technology. Energy Rep. 2023, 9, 1344–1352. [Google Scholar] [CrossRef]
  41. Wang, B.; Sun, W.; Wang, H.; Xu, T.; Zou, Y. Research on rapid calculation method of wind turbine blade strain for digital twin. Renew. Energy 2024, 221, 119783. [Google Scholar] [CrossRef]
  42. Zhao, W.; Zhang, C.; Wang, J.; Peyrano, O.G.; Gu, F.; Wang, S.; Lv, D. Research on main bearing life prediction of direct-drive wind turbine based on digital twin technology. Meas. Sci. Technol. 2022, 34, 13–25. [Google Scholar] [CrossRef]
  43. Wang, M.; Wang, C.; Hnydiuk-Stefan, A.; Feng, S.; Atilla, I.; Li, Z. Recent progress on reliability analysis of offshore wind turbine support structures considering digital twin solutions. Ocean Eng. 2021, 232, 109168. [Google Scholar] [CrossRef]
Figure 1. Total installed capacity.
Applsci 15 08655 g001
Figure 2. Fault occurrence rate and downtime.
Applsci 15 08655 g002
Figure 3. Basic structure of a wind turbine.
Applsci 15 08655 g003
Figure 4. Working principle of a wind turbine.
Applsci 15 08655 g004
Figure 5. Three-dimensional view of the gearbox.
Applsci 15 08655 g005
Figure 6. Overall design of the digital twin for the wind turbine gear transmission system.
Applsci 15 08655 g006
Figure 7. Workflow for constructing the geometric model of a wind turbine.
Applsci 15 08655 g007
Figure 8. Gearbox of the wind turbine.
Applsci 15 08655 g008
Figure 9. Complete geometric model of the wind turbine.
Applsci 15 08655 g009
Figure 10. Three-dimensional view and dynamic model of the transmission system. (a) shows the 3D diagram of the transmission system, and (b) shows the dynamic model of the transmission system.
Applsci 15 08655 g010
Figure 11. Framework of the CNN-LSTM-Attention-based fault warning model for gear transmission system.
Applsci 15 08655 g011
Figure 12. Flowchart of the fault warning process.
Applsci 15 08655 g012
Figure 13. Ideal wind speed–power curve.
Applsci 15 08655 g013
Figure 14. Distribution of wind speed–power curve anomalies.
Applsci 15 08655 g014
Figure 15. Wind speed–power curve after preprocessing.
Applsci 15 08655 g015
Figure 16. Correlation coefficient matrix.
Applsci 15 08655 g016
Figure 17. Comparison of actual values, CNN-LSTM-Attention, and other models.
Applsci 15 08655 g017
Figure 18. Model update strategy flowchart.
Applsci 15 08655 g018
Figure 19. Unity3D engine scene construction.
Applsci 15 08655 g019
Figure 20. Wind turbine status interface.
Applsci 15 08655 g020
Figure 21. Main system interface.
Applsci 15 08655 g021
Figure 22. Operating parameters of wind turbine.
Applsci 15 08655 g022
Figure 23. Information statistics interface.
Applsci 15 08655 g023
Figure 24. SCADA data monitoring interface.
Applsci 15 08655 g024
Figure 25. Residual plot of the different algorithm models.
Applsci 15 08655 g025
Figure 26. Fault alarm module.
Applsci 15 08655 g026
Table 1. Composition of SCADA data.
Data TypeData Name
MeteorologyAmbient temperature, Average wind speed, Instantaneous wind speed, Instantaneous wind direction, Average wind direction, Instantaneous wind direction of the wind vane, etc.
EnvironmentHumidity in the tower, Tower base control cabinet temperature, Ambient temperature, Engine room temperature, Cabin humidity, and Cabin control cabinet temperature
SpindleSpindle front bearing temperature, Spindle rear bearing temperature
YawYaw speed, Yaw azimuth, Yaw pressure, Engine room direction, Shaft brake hydraulics, Counterclockwise yaw running time, Clockwise yaw running time, etc.
Wind turbinesOperating time, Manual downtime, Uptime, Power generation time, Storm downtime, Daily power consumption, Total power generation, Daily power generation, Self-fault downtime, Service time, Working mode, Service time and Fault code, etc.
GeneratorGenerator reactive power, Generator winding temperature, Generator cooling water temperature, Generator front bearing temperature, Generator rear bearing temperature, Generator torque, Generator speed, Generator active power, Generator slip ring room temperature, Generator slip ring room humidity, etc.
Grid parametersGrid frequency, Grid power factor, Grid reactive power, Voltage, Current, Grid active power, etc.
GearboxGearbox high-speed shaft front end temperature, Gear high-speed shaft rear end temperature, Gearbox oil pool temperature, Gearbox inlet oil temperature, Gearbox inlet pressure, Gearbox oil pump outlet pressure, and Gearbox cooling water temperature
Frequency converterConverter voltage, Temperature inside the converter, Converter line current, Converter cooling water temperature, Active power, Average active power, Reactive power, Average reactive power, etc.
Wind wheelWind wheel speed, Wind wheel speed 1, Wind wheel speed 2, Wind wheel speed difference, and Wind wheel position
Table 2. The main parameters of wind turbines.
Parameter TypeValueParameter TypeValue
Rated power2 MWRated wind speed15 m/s
Rated voltage690 VCut-in wind speed4 m/s
Frequency50 HzCut-out wind speed25 m/s
Wind wheel diameter80 mGearbox ratio1:100.6
Sweeping area5027 m2Blade length39 m
Hub height67 mPitch range−5–90°
Table 3. Description of the turbine unit.
Unit IDSampling TimeFault TimeFault ReasonReason
031 January 2024–31 December 2024NoneNoneNone
071 January 2024–31 December 202419 October 2024/8:51Unplanned DowntimeExcessive Gearbox Oil Temperature
Table 4. Parameters selected from SCADA data.
Parameter NameUnitParameter NameUnit
Gearbox oil sump temperature x1°CMain bearing (rear) temp. x10°C
Gearbox HSS (front) temp. x2°CAvg. wind speed within 60 s x11m/s
Gearbox HSS (rear) temp. x3°CAmbient temperature x12°C
Gearbox oil inlet temp. x4°CEngine compartment temperature x13°C
Gearbox oil inlet pressure x5barEngine compartment humidity x14g/m3
Gearbox oil pump outlet pressure x6barGenerator’s active power x15KW
Gearbox cooling water temp. x7°CGenerator’s reactive power x16KW
Rotor speed x8r/minGenerator speed x17r/min
Main bearing (front) temp. x9°CEngine compartment control cabinet temp. x18°C
Table 5. The performance of different models on evaluation metrics.
ModelRMSEMAPEr2
CNN-LSTM-Attention0.6190.9370.987
CNN-LSTM0.7561.1530.964
LSTM-Attention0.9321.3240.951
LSTM0.9841.3370.919
CNN1.3822.1180.8699
Disclaimer/Publisher’s Note: The statements, opinions and data contained in all publications are solely those of the individual author(s) and contributor(s) and not of MDPI and/or the editor(s). MDPI and/or the editor(s) disclaim responsibility for any injury to people or property resulting from any ideas, methods, instructions or products referred to in the content.