Article

Utilizing Forest Trees for Mitigation of Low-Frequency Ground Vibration Induced by Railway Operation

by
Zeyu Zhang
1,
Xiaohui Zhang
1,
Zhiyao Tian
1,2,* and
Chao He
1
1
Shanghai Key Laboratory of Rail Infrastructure Durability and System Safety, Tongji University, Shanghai 201804, China
2
Department of Architecture and Civil Engineering, City University of Hong Kong, Hong Kong 999077, China
*
Author to whom correspondence should be addressed.
Appl. Sci. 2025, 15(15), 8618; https://doi.org/10.3390/app15158618
Submission received: 13 June 2025 / Revised: 23 July 2025 / Accepted: 28 July 2025 / Published: 4 August 2025

Abstract

Forest trees have emerged as a promising passive solution for mitigating low-frequency ground vibrations generated by railway operations, offering ecological and cost-effective advantages. This study proposes a three-dimensional semi-analytical method developed for evaluating the dynamic responses of the coupled track–ground–tree system. The thin-layer method is employed to derive an explicit Green’s function corresponding to a har-monic point load acting on a layered half-space, which is subsequently applied to couple the foundation with the track system. The forest trees are modeled as surface oscillators coupled on the ground surface to evaluate the characteristics of multiple scattered wavefields. The vibration attenuation capacity of forest trees in mitigating railway-induced ground vibrations is systematically investigated using the proposed method. In the direction perpendicular to the track on the ground surface, a graded array of forest trees with varying heights is capable of forming a broad mitigation frequency band below 80 Hz. Due to the interaction of wave fields excited by harmonic point loads at multiple locations, the attenuation performance of the tree system varies significantly across different positions on the surface. The influence of variability in tree height, radius, and density on system performance is subsequently examined using a Monte Carlo simulation. Despite the inherent randomness in tree characteristics, the forest still demonstrates notable attenuation effectiveness at frequencies below 80 Hz. Among the considered parameters, variations in tree height exert the most pronounced effect on the uncertainty of attenuation performance, followed sequentially by variations in density and radius.

1. Introduction

During the past few decades, the railway traffic in populated areas has increased with the advancement of rail transit network, accompanied by a rise in environmental issues [1]. In particular, with increasing passenger train speeds, uneven track settlements, and growing freight train loads, railway operations have become a significant source of ground vibration, causing greater disturbance to residents, buildings, and sensitive equipment near railway lines [2,3,4,5,6]. Therefore, it is essential to develop effective isolation measures between railway lines and their surroundings to alleviate the influence of environmental vibrations and improve the quality of life for residents. Ground-borne vibrations can be controlled at different levels at the source (train–track–soil interaction) [7,8,9], on the transmission path [10,11,12,13], or at the receiver [14,15]. Compared to other measures, the mitigation measures in the transmission path are adopted for efficiency and to lower cost [16].
There are different methods that can be applied to control the transmission of vibrations between the source and the receiver, including open or in-filled soft material trenches [17,18], wave impeding blocks placed under or next to the railway track in order to modify the wave propagation in the soil [19,20], and heavy masses composed of stone baskets or concrete blocks on the ground surface next to the track [21,22]. Moreover, drawing inspiration from the concept of photonic crystals in electromagnetics [23,24], a periodic structure has been successfully applied to control vibration propagation for the characteristic of blocking the propagation of waves in a certain frequency range (Bragg scattering bandgaps (BGs)). At present, there have been some studies on periodic vibration mitigation measures, including periodic holes [25], piles [26,27,28], and solid inclusions [29,30,31]. The ground-borne vibrations induced by trains fall within the frequency range of 1–80 Hz [32], and these countermeasures exhibit low efficiency and a high cost due to the requirement of large structural dimensions to match the long wavelengths of low-frequency vibrations.
Mechanical metamaterials capable of inducing local resonance effects can manipulate wave propagation at scales smaller than the wavelength, thereby offering an effective means of attenuating low-frequency vibrations. These materials offer a novel approach to mitigating railway-induced ground vibrations at lower frequencies. As a result, various locally resonant metamaterials on the order of meters in size have been designed either for embedding within the soil [33,34,35,36] or atop the terrain [37,38,39,40], aiming to mitigate elastic wave propagation and reduce vibration transmission through the ground.
It has been demonstrated that forest trees function as natural metamaterials capable of mitigate wave propagation [41]. Forest trees can act as resonant elements whose longitudinal modes interact with Rayleigh-type surface waves, thereby diminishing ground vibrations [42]. Additional research shows that adjusting tree heights to form a continuous distribution of resonance frequencies enables the vegetation to behave like a graded wave-modulating structure, effectively broadening the attenuation bandwidth [43,44]. Moreover, the role of tree canopy and branching in influencing attenuation performance was further analyzed through numerical simulations via the finite element method (FEM) [45,46]. A systematic investigation has been conducted on the attenuation performance of forest trees situated on stratified soils [44]. Both analytical methods [47,48] and the FEM [49] have also been employed to investigate the wave dispersion characteristics and associated stop bands of periodic trees.
The aforementioned investigations regarding forest trees functioning as natural metamaterials for seismic or elastic wave attenuation have provided a novel approach to rail-transit-induced vibration reduction. Compared with the traditional mitigation measures of railway-induced ground vibrations [17,18,19,20,21,22], forest trees are more effective at lower frequencies and offer advantages in terms of cost efficiency and environmental sustainability. In addition, existing studies generally adopt simplified two-dimensional models to investigate the attenuation of surface elastic waves by trees and the uncertainty in the attenuation efficiency of a tree row [44,45], which overlook the discrete distribution of forest trees along the longitudinal direction. The influence of the longitudinal discreteness of forest trees on the performance of wave attenuation requires further investigation.
The present work seeks to conduct an in-depth analysis of the attenuation behavior exhibited by forest trees arranged in a two-dimensional grid for mitigating railway-induced ground vibrations. The methodological innovation presented lies in these aspects. A three-dimensional semi-analytical method is used to calculate the responses of the coupled track–ground–tree grid system in the frequency domain. Trees are represented solely by their vertical trunks coupled to the ground surface. Complex factors such as branches, roots, and foliage are not included at this stage. The thin-layer method (TLM) is utilized in this study to derive the exact Green’s function for harmonic point excitation applied to a stratified elastic half-space [50,51,52]. With the TLM, ground motions can be calculated directly in the frequency–spatial domain, avoiding the numerical inversion of Fourier transforms demanded by conventional methods [50,51]. The variability in the vibration mitigation performance of forest trees—stemming from differences in their height, geometry, and spatial distribution—is evaluated through stochastic analysis. This work offers practical guidance for applying nearby vegetations as a viable solution to alleviate vibrations generated by rail transit activities.
Subsequently, Section 2 outlines the modeling approach developed to assess the dynamic behavior of a multi-layered foundation with an arbitrary arrangement of trees. Section 3 investigates the vibration reduction capability of tree grids in mitigating railway-induced ground vibrations and further examines the performance uncertainty arising from the variability of tree parameters. Section 4 concludes with a summary of the principal findings.

2. Semi-Analytical Solution for the Coupled Track–Ground–Tree Grid System

This section presents a semi-analytical approach for computing the dynamic response of the coupled track–ground–tree system subjected to train-induced vibrations, with the aim of analyzing the attenuation performance of tree grids against railway-induced ground vibrations. A three-dimensional model is applied, as shown in Figure 1. Firstly, the fundamental solutions for the layered ground are derived using the thin-layer method (TLM).
These solutions are then employed to establish the coupling between the railway track and the ground by enforcing displacement compatibility and stress continuity at their interface. Forest trees are represented as an array of vertically oscillating rods interacting with the underlying soil. By integrating the train model, tree array, and track–ground system, the ground vibrations generated by a moving train are evaluated, with the vibration attenuation effect of the trees explicitly considered.

2.1. Fundamental Solutions to the Dynamic Response of a Stratified Half-Space

A stratified ground system composed of Q + 1 layers, where the lowermost layer is idealized as a homogeneous elastic half-space, is assumed to be isotropic and linearly elastic, as shown in Figure 1. The dynamic response of this layered medium under harmonic point loading is evaluated using the thin-layer method (TLM) [52]. The wave propagation behavior in the homogeneous elastic domain is governed by the following frequency-domain equations [53]:
( λ + 2 μ ) u μ × ( × u ) + ρ b = ρ u ¨
where u = [ux, uy, uz]T denotes the responses in three directions, b = [bx, by, bz]T denotes the force vector applied, λ and μ denote the Lamé constants, and ρ is the density of the elastic mass.
The derivation of the solution in the frequency–wavenumber domain necessitates the use of two types of Fourier transforms [54]:
f ^ ( ω ) = f ( t ) e i ω t d t , f ( t ) = 1 2 π f ^ ( ω ) e i ω t d ω f ˜ ¯ ( k x , k y ) = f ( x , y ) e i ( k x x + k y y ) d x d y , f ( x , y ) = 1 4 π 2 f ˜ ¯ ( k x , k y ) e i ( k x x + k y y ) d k x d k y
where the superscript symbols “^”, “-”, and “~” represent the Fourier transformations performed over time t and spatial coordinates x and y, respectively.
Following the procedure outlined by Kausel [55] and based on the integration of Equations (1) and (2) together with the discretization of the ground system into multiple thin layers, as shown in Figure 2, the governing equation in the frequency–double wavenumber domain is derived as follows:
P ˜ ¯ ^ = k x 2 A x x + k x k y A x y + k y 2 A y y + i ( k x B x + k y B y ) + ( G ω 2 M ) U ˜ ¯ ^
A notable strength of the TLM is its ability to analytically perform at least a single inverse Fourier transform during the derivation process of the fundamental solution in the spatial domain. Such a process is carried out using the modal superposition method [53], in which the response is expressed as a combination of basic functions. Accordingly, the coefficient matrices in Equation (3) are initially assembled following the conventional finite element (FE) procedure to establish the system of equations. The degrees of freedom (DOFs) are then reorganized by grouping the horizontal (x), horizontal (y), and vertical (z) components together. Finally, the equation for eigenmodes is expressed as follows:
[ k 2 A + k B + ( G ω 2 M ) ] ψ ˜ ¯ ^ = 0
where k represents the characteristic value and ψ ˜ ¯ ^ represents an undetermined eigenmode. The specific structures of the matrices in Equation (4) are detailed as follows:
A = A 1 O O O A 2 O O O A 3 T , B = B 1 O O O B 2 O O O B 3 T , G = G 1 O O O G 2 O O O G 3 T , M = M 1 O O O M 2 O O O M 3 T
By applying Equation (5), Equation (4) can be decoupled into two distinct eigenvalue problems: one describing the modes, ψ ˜ ¯ ^ x and ψ ˜ ¯ ^ z , associated with normalized waves of the Rayleigh mode propagating in the x-z plane and the other describing the mode, ψ ˜ ¯ ^ y , associated with normalized waves in Love mode along the y coordinate:
k R 2 A 1 O B 1 T A 3 + G 1 ω M 1 B 1 O G 3 ω M 3 ψ ˜ ¯ ^ x k R ψ ˜ ¯ ^ z = 0 k L 2 A 2 + G 2 ω M 2 ψ ˜ ¯ ^ y = 0
Herein the modes governed by Equation (6) are required to meet the orthogonal conditions [51].
The TLM is restricted to simulating wave propagation within a finite-depth domain. To address wave absorption in the underlying half-space, the perfectly matched layer (PML) technique is introduced. In the TLM formulation, the thickness h of each layer forming the PML is replaced by an adjusted thickness h ¯ l [56]. For the l-th thin layer in the PML region, the modified thickness h ¯ l is given by
h ¯ l = z ¯ l z ¯ l 1 = H PML 1 N PML i ζ l N PML m + 1 + l 1 N PML m + 1
where HPML denotes the overall thickness of the PML. The corresponding PML constants m and ζ can be referenced from the literature [56].
Once the eigen values and associated modes specified in Equation (6) are identified, the basic solution set is constructed using a modal combination approach. The expression that describes the vertical component of displacement, expressed in the joint domain of frequency and dual wavenumbers, is detailed in Equation (8):
G ^ ¯ ˜ z z m n k x , k y , ω = j R mod e s 1 k x 2 + k y 2 k j 2 φ z j m φ z j n
The Green’s function G ^ ¯ ˜ z z m n k x , k y , ω characterizes the out-of-plane response at the m-th layer induced by a harmonic point load applied at the n-th layer and is expressed in the joint frequency–wavenumber domain. For the case of m = n = 0, both the excitation and measurement locations are situated at the ground surface. The term φ z j n denotes the n-th entry of the vertical mode shape vector ψ ˜ ¯ ^ z .

2.2. Coupling the Trees onto the Ground Surface

As the primary objective is to investigate the attenuation of vertical components of surface waves, each tree is modeled as an elastic, homogeneous rod vibrating axially along its length. The longitudinal vibration behavior of the j-th tree is described by the following governing equation:
E t j 2 u ^ t j z , ω z 2 + ρ t j ω 2 u ^ t j z , ω = 0
where u ^ t j z , ω denotes the axial motion of the j-th one and E t j and ρ t j correspond to its elasticity and density.
The solution to Equation (9) is as followed:
u ^ t j z , ω = C 1 j e i ξ j z + C 2 j e i ξ j z
The parameters C1j and C2j denote unknown constants, while ξ j = ω ρ t j / E t j defines the axial wave number for the j-indexed tree.
It is assumed that the top end of each tree (z = −ht) is traction-free, whereas the base (z = 0) is subjected to an external force (Ftj) induced by seismic excitation.
These unknowns, C1j and C2j, are then evaluated by enforcing the boundary conditions, yielding the analytical expression for the axial displacement of the circular cross-section rod:
u ^ t j z , ω = F ^ t j i ξ j E t j A t j 1 e i 2 ξ j h t j e i 2 ξ j h t j e i ξ j z + e i ξ j z
Equation (12) further establishes the connection between the longitudinal motion and the associated force at the soil–tree interface (where z = 0), leading to
u ^ t j z = 0 , ω = 1 + e i 2 ξ j h t j i ξ j E t j A t j 1 e i 2 ξ j h t j F ^ t j = H ^ t j F ^ t j , F ^ t j = H ^ t j 1 u ^ t j
Tree responses triggered by the external excitation F ^ e x generates supplementary soil vibrations. Therefore, the total soil response can be decomposed into the free field (no trees) response induced by the loading and the scattered response resulting from the soil–tree dynamic interaction, which yields
u ^ x , y , ω = u ^ f x , y , ω + u ^ s x , y , ω = G ^ z z 00 x , y , ω F ^ e x j = 1 J G ^ z z 00 x x j , y y j , ω F ^ t j
where G ^ z z 00 x , y , ω corresponds to the vertical displacement of the ground surface resulting from a unit force acting at the surface within the space–frequency domain, which is obtained by performing the inverse Fourier transform of the wavenumber kx applied to Equation (8), yielding
G ^ z z 00 x , y , ω = j R mod e s 1 4 i H 0 2 k j x 2 + y 2 φ z j 0 φ z j 0
where H 0 2 represents the zero-order Hankel function of the second kind.
Since the displacements of soil and trees are consistent at each soil–tree contact point, a series of linear equations can be obtained by combining Equations (12) and (13):
u ^ t 1 z = 0 , ω = u ^ ( x 1 , y 1 , ω ) = G ^ z z 00 ( x 1 , y 1 , ω ) F ^ e x j = 1 J G ^ z z 00 ( x 1 x j , y 1 y j , ω ) H ^ t j u ^ t j ( z = 0 , ω ) u ^ t 2 z = 0 , ω = u ^ ( x 2 , y 2 , ω ) = G ^ z z 00 ( x 2 , y 2 , ω ) F ^ e x j = 1 J G ^ z z 00 ( x 2 x j , y 2 y j , ω ) H ^ t j u ^ t j ( z = 0 , ω ) u ^ t J z = 0 , ω = u ^ ( x J , y J , ω ) = G ^ z z 00 ( x J , y J , ω ) F ^ e x j = 1 J G ^ z z 00 ( x J x j , y J y j , ω ) H ^ t j u ^ t j ( z = 0 , ω )
Once the contact displacements u ^ t j are determined by Equation (15), the contact force F ^ t j and the responses of stratified soil with trunks coupled to the ground surface are obtained through Equations (12) and (13).
To verify the reliability of the proposed coupling approach, a comparison was made with the experimental data and numerical results reported by Colombi et al. [41] regarding the ground surface vibration attenuation effect of pines. As shown in Appendix A, good agreement is observed.

2.3. Coupling of the Track to the Tree Grid–Ground System

In this study, the rail and sleepers are idealized as infinitely long Euler–Bernoulli beams, while the rail pads and ballast are represented as continuously distributed elastic springs, as depicted in Figure 3.
Within the frequency–wavenumber domain, the motion equations of the track system subjected to a harmonic load P ^ ( ω ) e i ω t δ ( x ) (positioned at x = 0) are expressed in the following matrix equation:
E I k x 4 ω 2 m R + k P k P 0 k P k P + k B ω 2 ( m S + m B / 3 ) ( k B + ω 2 m B / 6 ) 0 ( k B + ω 2 m B / 6 ) k B ω 2 m B / 3 u ˜ ^ r u ˜ ^ s b u ˜ ^ s w = 2 π P ˜ ^ ( k x , ω ) 0 F ˜ ^ s w ( k x , ω )
where ω signify the angular frequency of the load, respectively, while EI denote the bending stiffness of the rail per unit length. m R , m S , m B denote the mass of the rail, sleepers, and ballasts per unit length. k P , k B denote the spring stiffness of the rail pads and ballasts per unit length. u ˜ ^ r , u ˜ ^ s b represent the vertical displacements of the rail and sleeper. The vertical displacement u ˜ ^ s w and the corresponding interaction force F ˜ ^ s w escribe the dynamic response at the interface between the substructure and the track; specifically, it is located along the central axis of the railway.
At this interface, the load is assumed to act perpendicularly and be evenly distributed along the longitudinal direction x, spanning the interval y = −a to y = a. The transverse y-axis is defined as perpendicular to the track direction, as depicted in Figure 3. The interaction between the rail and the supporting ground is governed by enforcing displacement compatibility and ensuring force balance at the shared interface, as described below:
u g ( x , y = 0 , z = 0 , t ) = u s w ( x , t )
p z ( x , y , z = 0 , t ) = F s w ( x , t ) / 2 a , x 2 a 0 , x > 2 a
where ug represents the response of the soil and pz corresponds to the normal stress.
Applying the Fourier transform described in Equation (2) and substituting it into Equations (17) and (18) leads to
u ˜ ^ s w ( k x , ω ) = 1 2 π + u ˜ ¯ ^ g ( k x , k y , ω ) d k y p ˜ ¯ ^ z ( k x , k y , ω ) = e i k y a e i k y a 2 i k y a F ˜ ^ s w ( k x , ω )
The vertical displacement of the ground, as derived from Equation (8), is given by
u ˜ ¯ ^ g ( k x , k y , ω ) = j R mod e s p ˜ ¯ ^ z 1 k x 2 + k y 2 k j 2 φ z j 0 φ z j 0
Combining Equation (21) with Equation (16) leads to
u ˜ ^ s w ( k x , ω ) = H ˜ ^ t g ( k x , ω ) F ˜ ^ s w ( k x , ω ) H ˜ ^ t g ( k x , ω ) = j R mod e s e i a k j 2 k x 2 2 a ( k j 2 k x 2 ) φ z j 0 φ z j 0
Substitute Equation (21) into Equation (16) to obtain
u ˜ ^ r ( k x , ω ) u ˜ ^ s b ( k x , ω ) u ˜ ^ s w ( k x , ω ) = E I k x 4 ω 2 m R + k P k P 0 k P k P + k B ω 2 ( m S + m B / 3 ) ( k B + ω 2 m B / 6 ) 0 ( k B + ω 2 m B / 6 ) k B ω 2 m B / 3 + 1 / H ˜ ^ t g ( k x , ω ) 1 2 π P ˜ ^ ( k x , ω ) 0 0
u ˜ ^ s w ( k x , ω ) can be obtained by Equation (22), and then the contact force F ˜ ^ s w can be obtained by Equation (21). Similarly, the total soil response consists of the free field displacement (with the trees), which is induced by the dynamic source F ˜ ^ s w , and the displacement resulting from the soil–tree dynamic coupling, where:
u ^ x , y , ω = u ^ f x , y , ω + u ^ s x , y , ω = G ^ z z 00 x , y , ω F ^ s w j = 1 J G ^ z z 00 x x j , y y j , ω F ^ t j
Similar to Section 2.2, the displacement field of the coupled track–ground–tree system u ^ x , y , ω can be calculated by Equations (23) and (12).

3. Numerical Studies

This section conducts a systematic investigation into the attenuation effectiveness of forest trees in mitigating ground vibrations induced by railway traffic. Existing research has primarily addressed the attenuation effect of forest trees on wavefields induced by a single harmonic point load [44,45]. However, the train is composed of multiple carriages, each of which contains multiple bogies and multiple wheelsets, thus producing a series of wheel–rail contact forces. The wave field generated by the superposition of multiple point sources will be different due to the number of wheel–rail contact forces, which could influence the vibration attenuation effectiveness of forest trees. Therefore, this section extends the investigation to examine the attenuation efficiency of forest trees under multiple point source excitations.
Figure 4 shows the train loads distribution of two carriages. Each carriage consists of two bogies and four wheelsets; therefore, two carriages generate eight harmonic point loads, which are denoted as P1, P2, …, P8. The length of a single carriage is l c = 24.5   m , and the distances between wheelsets are w a = 2.5 m ,   w b = 14.875 m .
As illustrated in Figure 4, the train model consists of two carriages with a total of eight wheelsets generating harmonic vertical loads. The longitudinal span of these loads is 44.375 m, which exceeds the 40 m width of the surface tree array along the x-axis. This ensures that the entire array is subjected to the moving train load, and thus the vibration attenuation characteristics within the region of interest can be accurately assessed based on this loading scheme.
In this section, a typical ballasted track is used, and the corresponding parameters can be found in Table 1. The material properties of the soil and forest trees can be found in Table 2. In conjunction with Figure 1, the geometric constants of the forest are summarized in Table 3.
To quantify the vibration-suppressing capability of forest-based metamaterials, the amplitude reduction spectrum (ARS) is adopted as an evaluation metric. It is defined by the following expression:
ARS = 20 log 10 u without u with
where |uwith| and |uwithout| represent the magnitudes of ground vibration measured at a specific location, with and without the presence of the forest, respectively. And the observation points in this study include A (x = 0 m, y = 60 m, z = 0 m), B (x = 0 m, y = 70 m, z = 0 m), C (x = 0 m, y = 80 m, z = 0 m), D (x = 10 m, y = 60 m, z = 0 m), and E (x = 20 m, y = 60 m, z = 0 m), as shown in Figure 5.

3.1. Attenuation Performance of Forest Trees for Different Number of Loads

The ARS at the different observation points (A, B, and C) distributed on the ground surface along the direction perpendicular to the track (y-direction) for two carriages eight harmonic point loads, is illustrated in Figure 6a. The tree grid obtains a significant attenuation efficiency near f = 16 Hz in the low-frequency range (f < 20 Hz), and observation point A, which is closer to the tree grid, exhibits higher ARS values. As observation points B and C are located farther from the tree grid, the attenuation effect is weakened. At higher frequencies (f > 20 Hz), the differences in attenuation performance among observation points A, B, and C become negligible. Figure 6b presents the ARS values at the observation points (A, D, and E) distributed on the ground surface along the direction parallel to the track (x-direction). Observation points A and D are located within the effective attenuation range of the tree grid and exhibit higher ARS values. In contrast, observation point E is located near the edge of this range, where the attenuation efficiency is poor in the low-frequency band. Notably, the displacement at point E is even amplified at f = 14 Hz.
Figure 7 presents the vertical displacement fields with (a) and without (b) the tree grid on the ground surface for two carriages (eight harmonic point loads) at f = 17 Hz. It can be observed that the surface wave scattering generated by the interaction load acting on the tree-soil interfaces is superimposed, resulting in a complex wave field. By comparing Figure 7a,b, it is evident that the surface waves propagating through the center of the tree grid along the y-direction are significantly attenuated. In contrast, those passing through the sides of the tree grid exhibit minimal attenuation, and even slight displacement amplification is observed.
In contrast to the single-point excitation case, the surface waves generated by multiple loads interact with each other to form a more complex spatial displacement field, leading to more intricate attenuation behavior of the tree grid. Therefore, this section further investigates the attenuation performance under different numbers of vehicle loads. Figure 8 shows the ARS values of observation points A and C for different load numbers (corresponding to one, two, and four carriages, respectively) in the frequency range of 1–80 Hz. It can be observed that point A shows little difference in attenuation efficiency under different numbers of loads, whereas point C exhibits significant variation, especially in the frequency range of 5–30 Hz. This is because, in the low-frequency range, the wavelength is long, and the superposition of multiple point sources generates more low-frequency surface waves, which can propagate around the tree grid and reach a farther observation point (point C).
In summary, the tree grid demonstrates considerable attenuation performance under different train loads. As the number of loads (wheel–rail contact forces) increases, the mitigation efficiency is weakened to varying degrees across the entire frequency range (1–80 Hz). Furthermore, the mitigation efficiency at different observation points is also influenced by the number of loads. With an increasing number of carriages, more surface waves—particularly low-frequency components—can propagate around the tree grid to farther observation points, resulting in a reduction in the attenuation performance of the trees.

3.2. Attenuation Performance of Different Tree Distribution Areas

As shown in Section 3.1, the attenuation efficiency varies with the relative position between the observation point and the tree grid. In this section, the influence of the tree distribution area on the mitigation performance under different train loads is further investigated. The distribution area of trees is modified by varying the number of lateral trees Ny and the longitudinal trees Nx, and other geometric parameters of the tree grid are kept unchanged, as shown in Table 3. The train load is composed of eight harmonic point loads (two carriages), and the parameters of soil, the track, and the tree grid are shown in Table 1 and Table 2. Figure 9 illustrates the ARS values at observation points A and C for different numbers of lateral and longitudinal trees including Nx = 5, 10, and 20 with Ny = 20 and Nx = 20 with Ny = 10, 20, and 30 in the 1–80 Hz range. As shown in Figure 9a,b, increasing the lateral extent of the tree grid leads to more effective vibration mitigation at both observation points A and C. It can also be observed from Figure 9a,b that a wider longitudinal tree distribution area results in more significant vibration mitigation, and this effect is more pronounced than that of the lateral distribution—especially at point C. In addition, significant displacement amplification is observed near f = 16 Hz when Nx = 10. This occurs because the longitudinal distribution of the train loads (45 m) exceeds the length of the tree grid (20 m), and the more distant observation point C further amplifies this effect.

3.3. Attenuation Performance of Forest Trees Forming a Metawedge

Existing studies have shown that forest trees arranged at different heights have different vibration mitigation zones of frequency [44,45]. This study extends the investigation to examine the performance of tree grids arranged in a metawedge pattern in mitigating ground vibrations induced by railway traffic.
As illustrated in Figure 10, a grid consisting of Nx = 20 and Ny = 30 trees is considered, where the tree height gradually decreases from 20 m to 0.75 m along the x-direction to form a forward metawedge structure (Figure 10a), where the height increases along the positive y-direction, and a reverse metawedge (Figure 10b), where the height decreases along the positive y-direction. Three height increments of ∆ht = 0.25 m, 0.5 m, and 1.2 m are, respectively, applied within the height ranges of [0.75, 3], [3, 8], and [8, 20]. Other geometric parameters of the tree grid remain unchanged, as listed in Table 3. The train load consists of eight harmonic point loads (corresponding to two carriages), and the parameters of soil, the track, and the tree grid are listed in Table 1 and Table 2.
Figure 11 presents the vertical displacement fields at z = 0 m (ground surface) for three cases under two carriages (eight harmonic point loads) at f = 22 Hz: (a) a forward metawedge, (b) a reverse metawedge, and (c) the case without trees. It can be seen that both the forward and reverse metawedges produce a significant ground vibration isolation effect, which is substantially more effective than that of the ordinary tree grid with uniform height, as studied in Section 3.1. Figure 12 shows the ARS values at observation points A (a) and C (b) for the forward metawedge, reverse metawedge, and uniform height configurations in the frequency range of 1–80 Hz. It can be observed that both metawedge configurations provide notable attenuation efficiency within 8–80 Hz. Compared with the uniform height tree grid, the mitigation performance in the frequency range of 10–40 Hz is significantly improved, and the mitigation zone is widened. The difference in mitigation performance between the forward and reverse metawedge configurations is relatively small. Figure 13 presents the vertical displacement fields at x = 0 m for (a) a forward metawedge and (b) a reverse metawedge under the excitation of two carriages (eight harmonic point loads) at f = 22 Hz. The metawedge captures incident Rayleigh waves and converts them into bulk shear waves, consequently diminishing vibrations in the region behind the tree array and resulting in broadband attenuation efficacy, consistent with the findings by Colombi et al. [41].

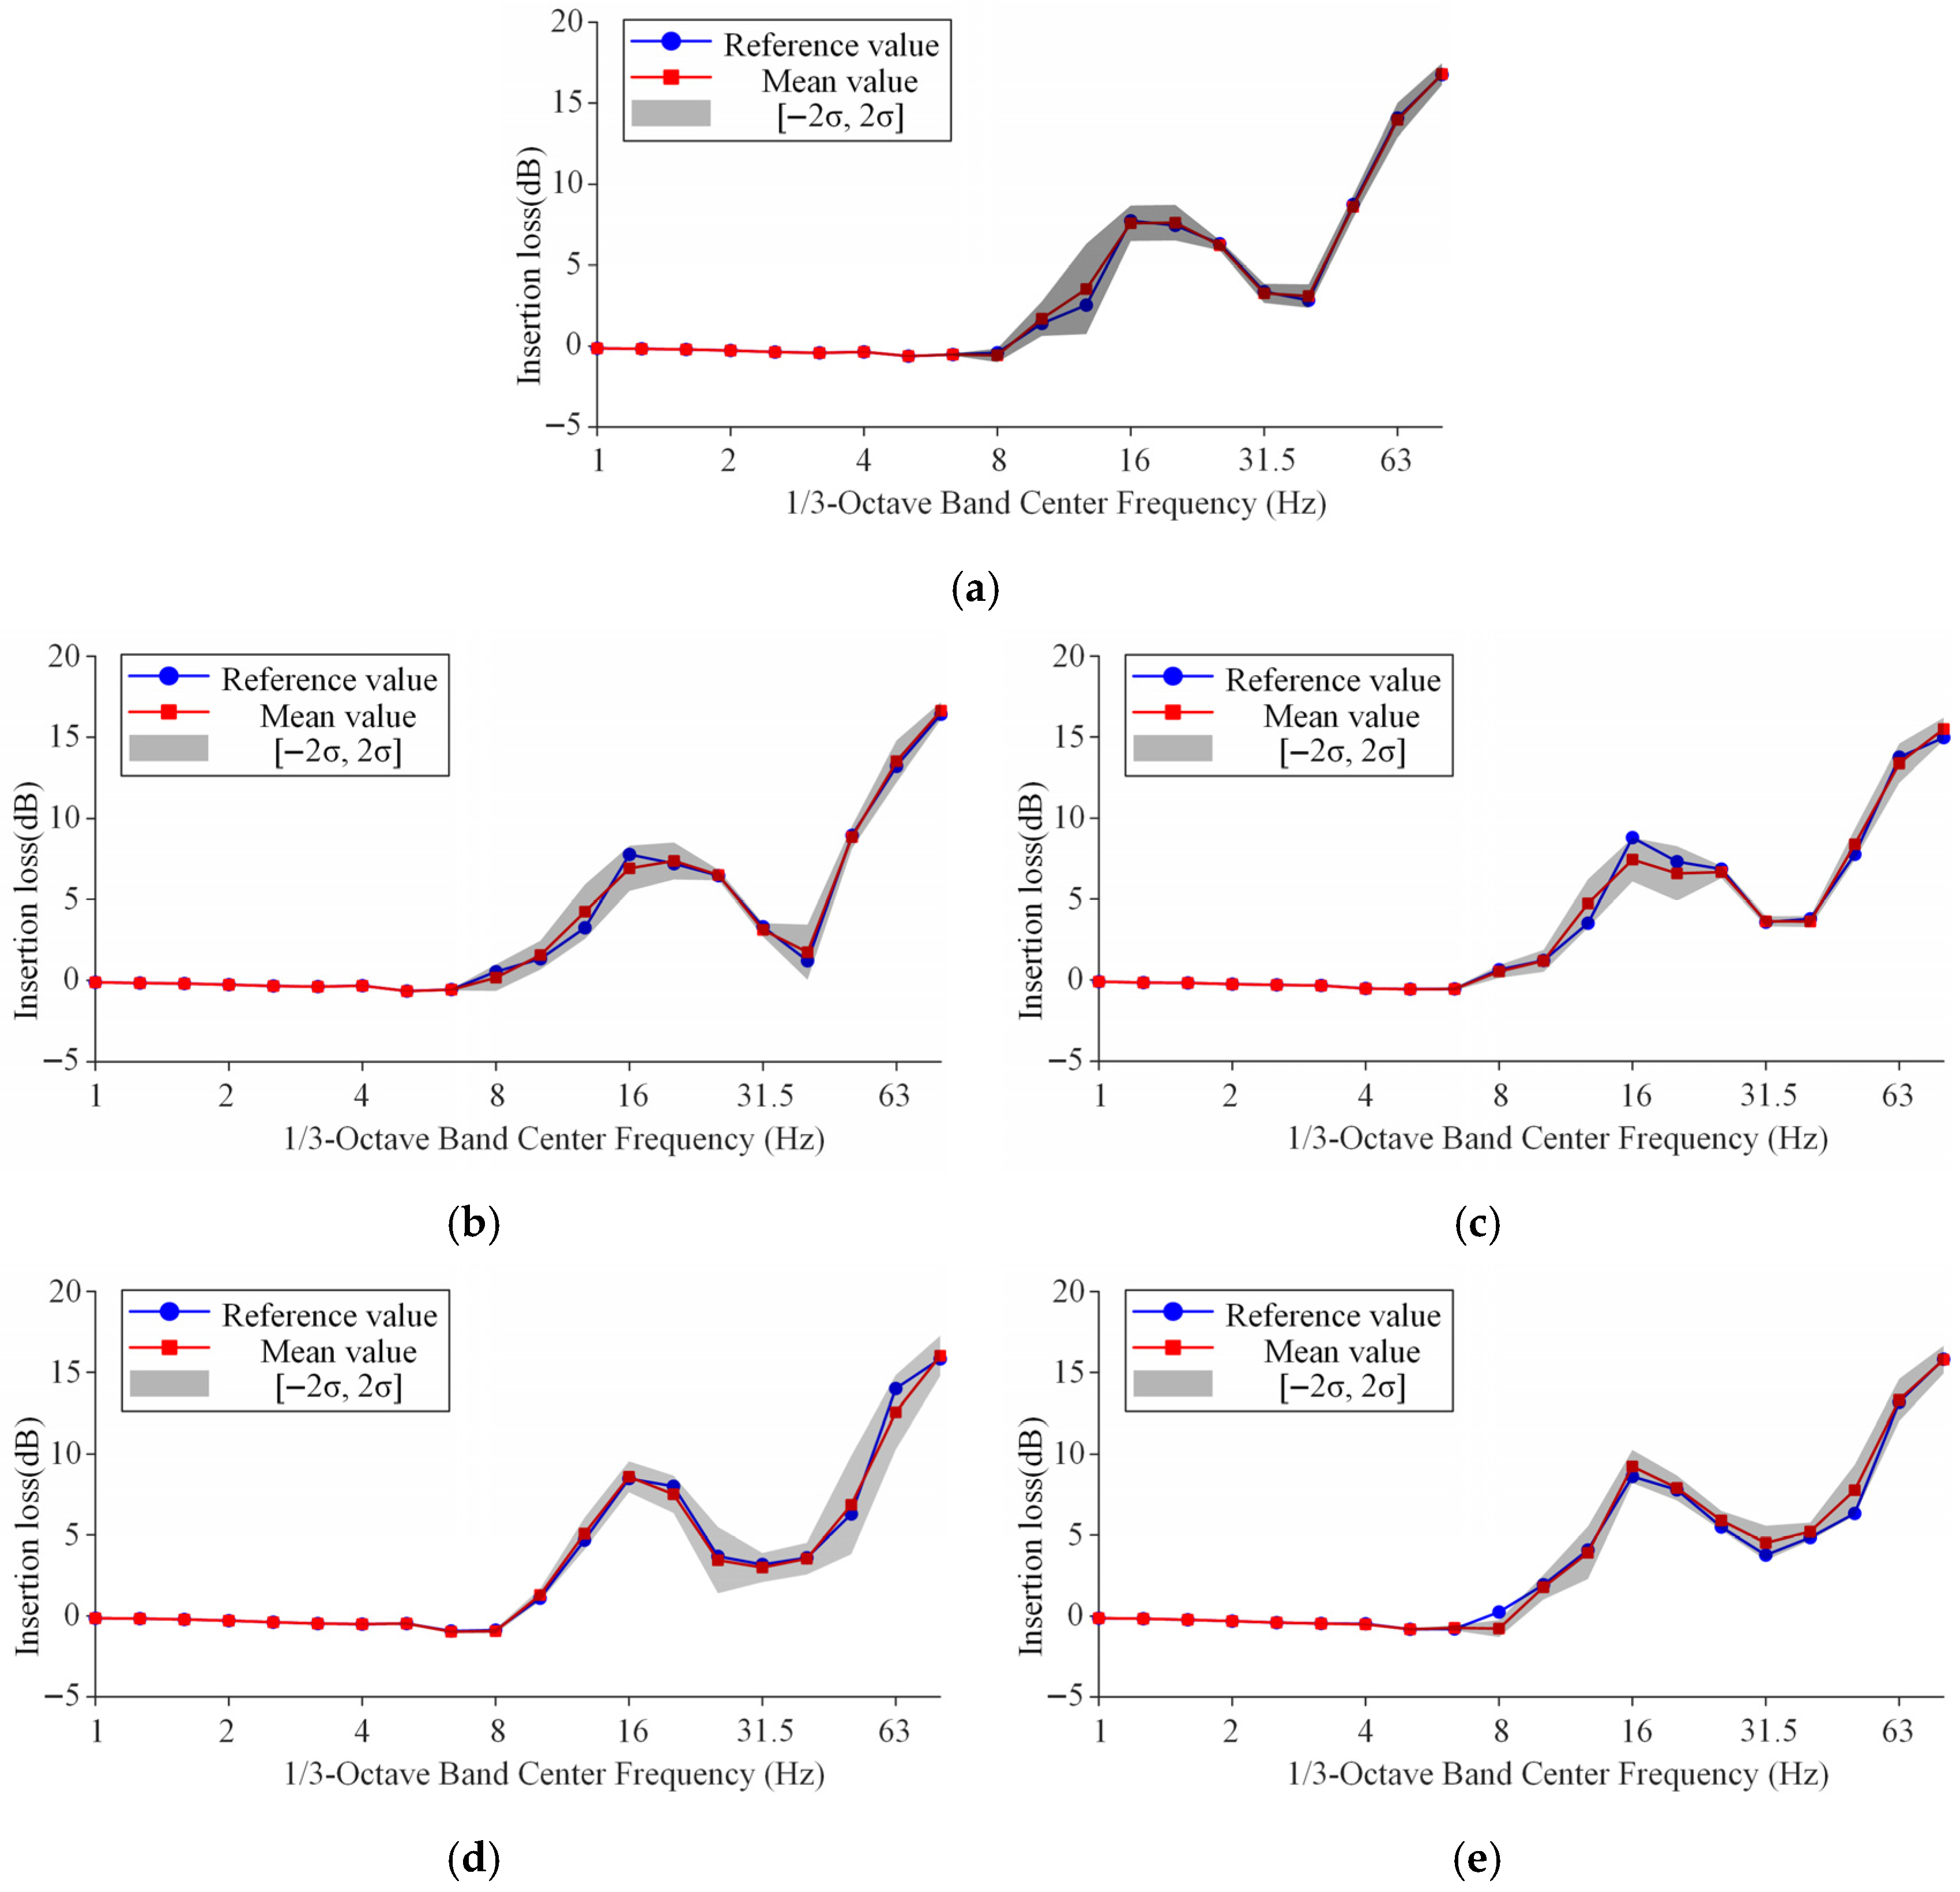
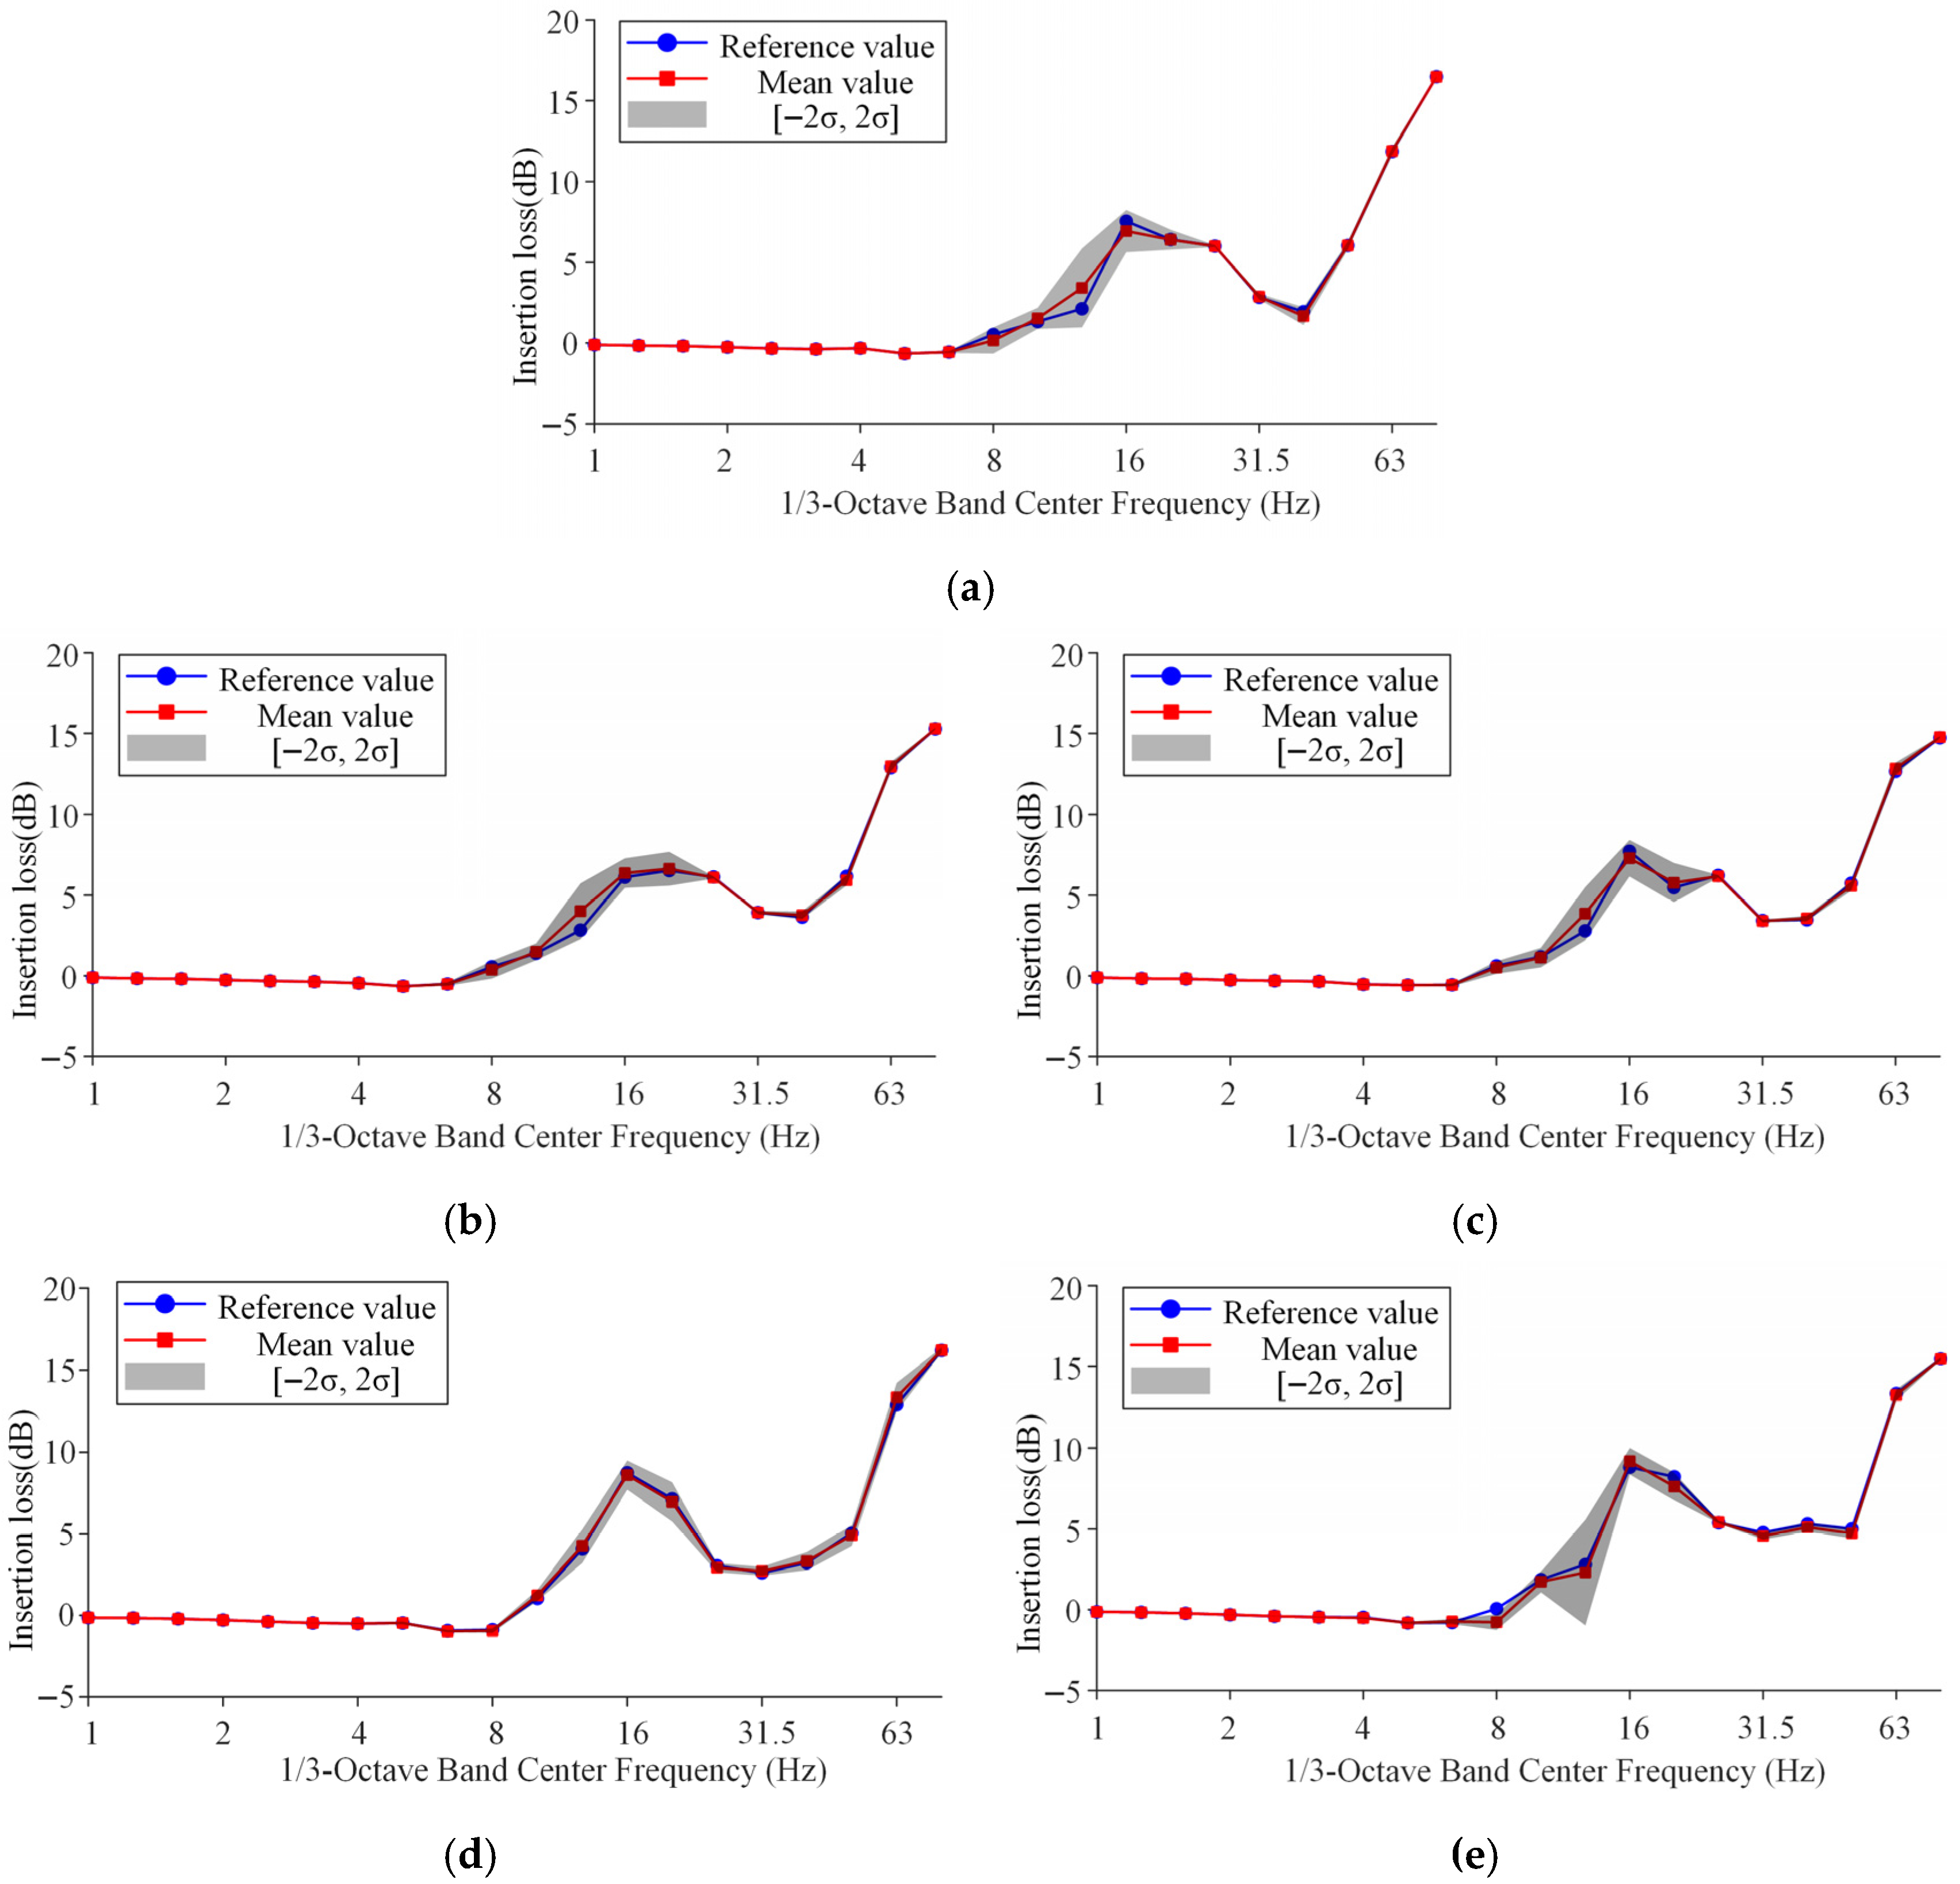
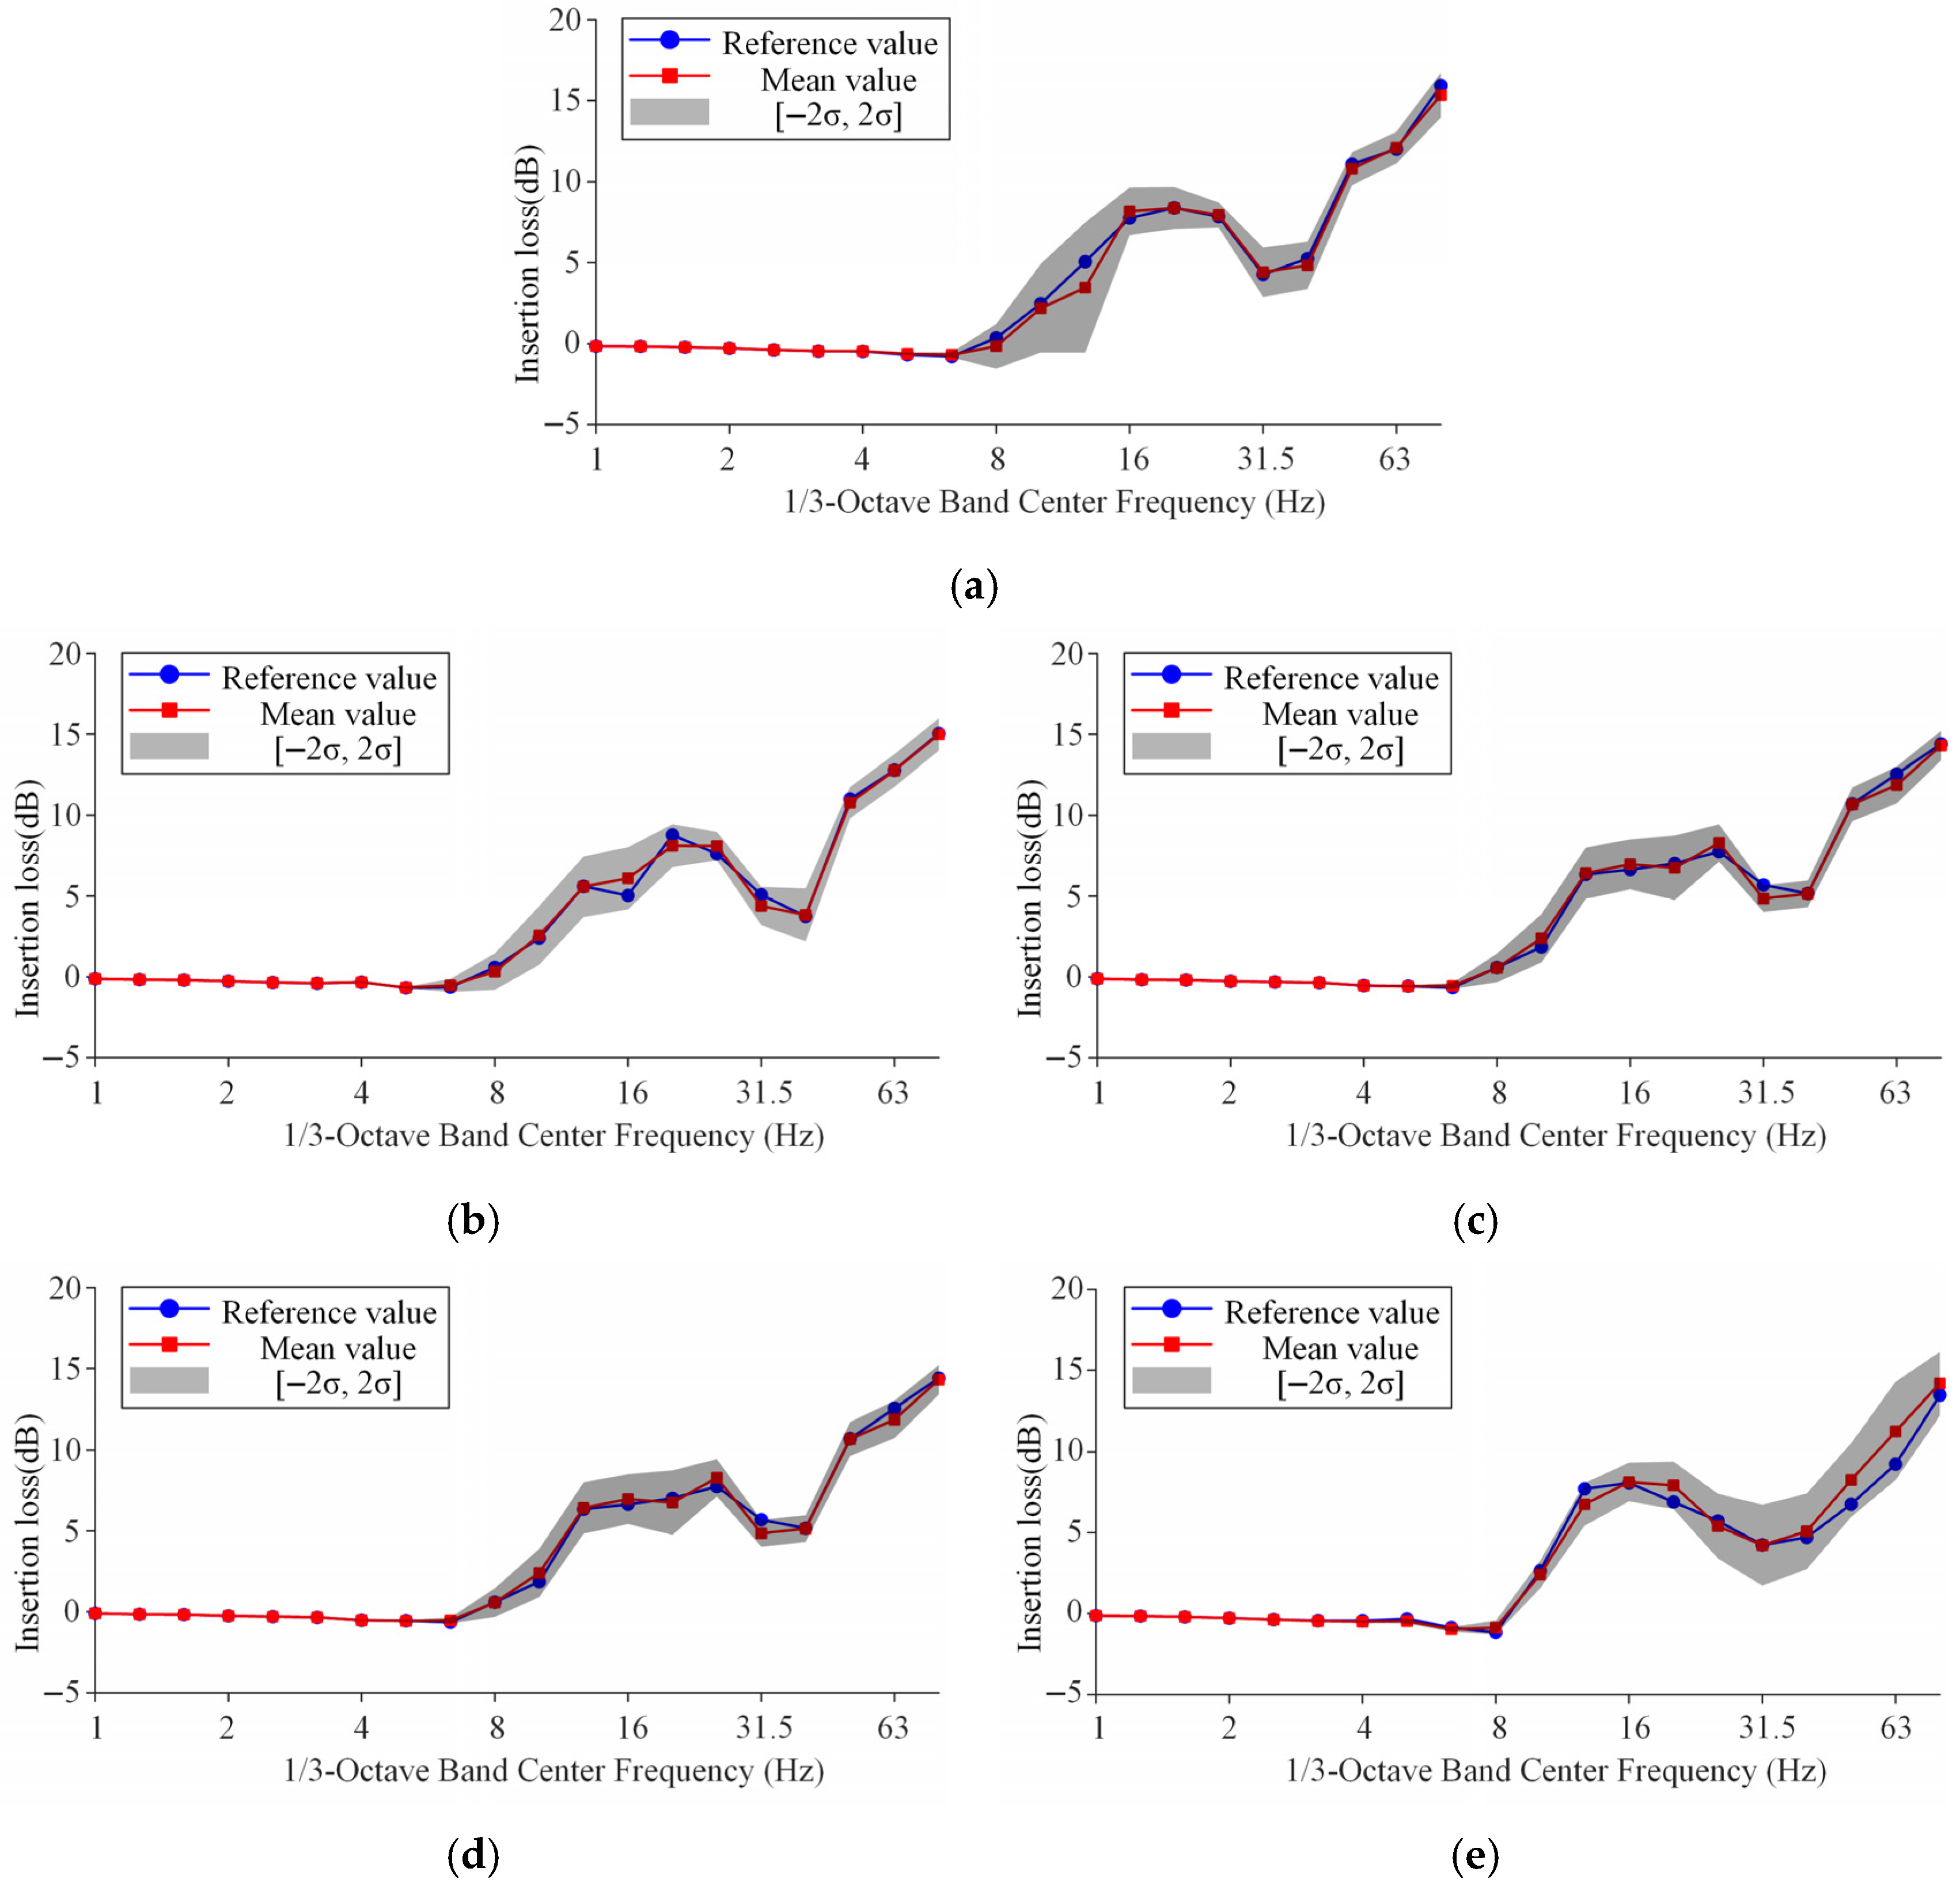
3.4. Impact of Stochastic Tree Parameters on Attenuation Performance

In contrast to mechanical metamaterials, the spatial distribution of trees in practice exhibits inherent randomness rather than strict determinism. Therefore, it is necessary to account for the variability in tree properties when evaluating mitigation efficiency. Muhammad et al. [45] examined the attenuation performance of forest trees exhibiting disordered spatial arrangements, whereas He et al. [44] studied tree rows with random geometric parameters. Considering the discrete distribution characteristics of real forest trees in the longitudinal direction, this study further investigates the performance uncertainty of ground vibrations attenuation due to the variability in tree parameters for a two-dimensional tree grid. Specifically, the effects of stochastic fluctuations on tree height, radius, and density are investigated. Assuming that the parameters are uniformly distributed, each sample xn (which could represent height, radius, or density) is determined by
x n = 1 + ε n α x ¯
In this context, x ¯ represents the mean value corresponding to a specific parameter of the tree, as documented in Table 2 and Table 3. The term ε n indicates a stochastic variable that follows a uniform distribution within the range [−1, 1], while α, which characterizes the extent of variation, is set to 0.4 in this study. A Monte Carlo simulation with 100 samples is conducted for each of the tree parameters—height, radius, and density—to evaluate the variations in attenuation efficiency. The train load consists of eight harmonic point loads (two carriages), and the other parameters for soil, the track, and forest trees are provided in Table 1, Table 2 and Table 3.
The mean value and confidence interval spanning [−2σ, 2σ], where σ denotes the standard deviation, of the ARS evaluated at observation locations A–E (i.e., A (a), B (b), C (c), D (d), and E (e)) are illustrated in Figure 14. These results correspond to the scenario where the tree array is implemented over a uniform elastic half-space, with trunk length htj varying within a range characterized by α = 0.4. For comparison, results obtained under non-stochastic (fixed) parameter conditions are also included. The statistical ARS outcomes obtained from 100 realizations considering height variability in trees display a tendency that aligns well with the deterministic case. These findings indicate that the designed tree grid maintains substantial attenuation performance within the frequency ranges of 8–32 Hz and 63–80 Hz, even when considering the randomness in tree height. In addition, changes in tree height will lead to evident fluctuations in attenuation efficiency. For point A, the randomness of tree height leads to a large fluctuation in attenuation efficiency in the low-frequency range (8–16 Hz), reaching up to 1.7 dB, while the fluctuation in the high-frequency range (30–60 Hz) is less than 0.5 dB, indicating good stability. Points D and E, which are also close to the tree grid, exhibit a similar pattern. In contrast, the fluctuation amplitudes at observation points B and C, which are comparatively farther from the tree grid, are larger in the low-frequency range and smaller in the high-frequency range. This is because low-frequency surface waves with longer wavelengths can propagate around the tree grid to farther observation points, reducing the influence of the forest trees on them.
Figure 15 shows the ARS at different observation points when the density ρ tj of each tree has a range of variation α = 0.4. Despite the presence of high uncertainty, the designed tree grid can still achieve evident mitigation effects with 8–32 Hz and 63–80 Hz. The fluctuation in attenuation efficiency induced by tree density is more pronounced in the low-frequency range than in the high-frequency range for observation points A, D, and E, which are comparatively close to the forest trees, and this trend is reversed at higher frequencies. Moreover, the uncertainty in attenuation performance due to random variations in tree density is marginally lower than that associated with random variations in tree height.
Figure 16 shows the ARS for different observation points by the tree grid over a homogeneous half-space, considering a variation range of α = 0.4 for trunk radii r tj . The results demonstrate that the impact of uncertainty in trunk cross-sectional dimensions on attenuation performance is significantly smaller than that of tree height and density. Taking point A as an example, the randomness in tree radius causes a maximum ARS fluctuation of 1.2 dB in the low-frequency range, while in the high-frequency range, the fluctuation remains within 0.1 dB, indicating good stability in attenuation performance.
Figure 17 shows the ARS for different observation points by the tree grid over a homogeneous half-space, where simultaneous variations in the tree height htj, radius r tj , and density ρ tj of each tree simultaneously exhibit a variation range characterized by α = 0.4. The results reveal that the attenuation performance of the tree grid shows greater uncertainty compared to scenarios where randomness is introduced in a single parameter. For point A, the fluctuation amplitude reaches up to 2 dB in the low-frequency range and 1 dB in the high-frequency range.
In summary, despite the randomness of tree parameters, the tree grid can still maintain effective attenuation performance. Variation in tree height causes more significant fluctuations in attenuation efficiency compared to variations in radius and density. The attenuation performance of the tree grid demonstrates greater uncertainty when the variations in height, radius, and density are simultaneously taken into account. In addition, due to the propagation of low-frequency surface waves around the tree grid toward farther observation points, the performance uncertainty at these points tends to reduce in the low-frequency region while amplifying in the high-frequency domain.

4. Conclusions

This research presents a comprehensive analysis of utilizing forest trees as natural mechanical metamaterials for reducing railway-induced ground vibrations. A three-dimensional semi-analytical model was developed to compute the dynamic responses of the coupled track–ground–tree system. It should be emphasized that the tree trunk model is simplified and does not account for the mechanical contribution of roots and branches, which can significantly influence the vibration behavior of trees (future work should progressively incorporate these complexities).
A systematic evaluation was conducted on the performance of tree grids in mitigating railway-induced ground vibrations. In addition, the performance uncertainty resulting from the random variations in tree properties was assessed using Monte Carlo simulations. The conclusions are as follows:
(1)
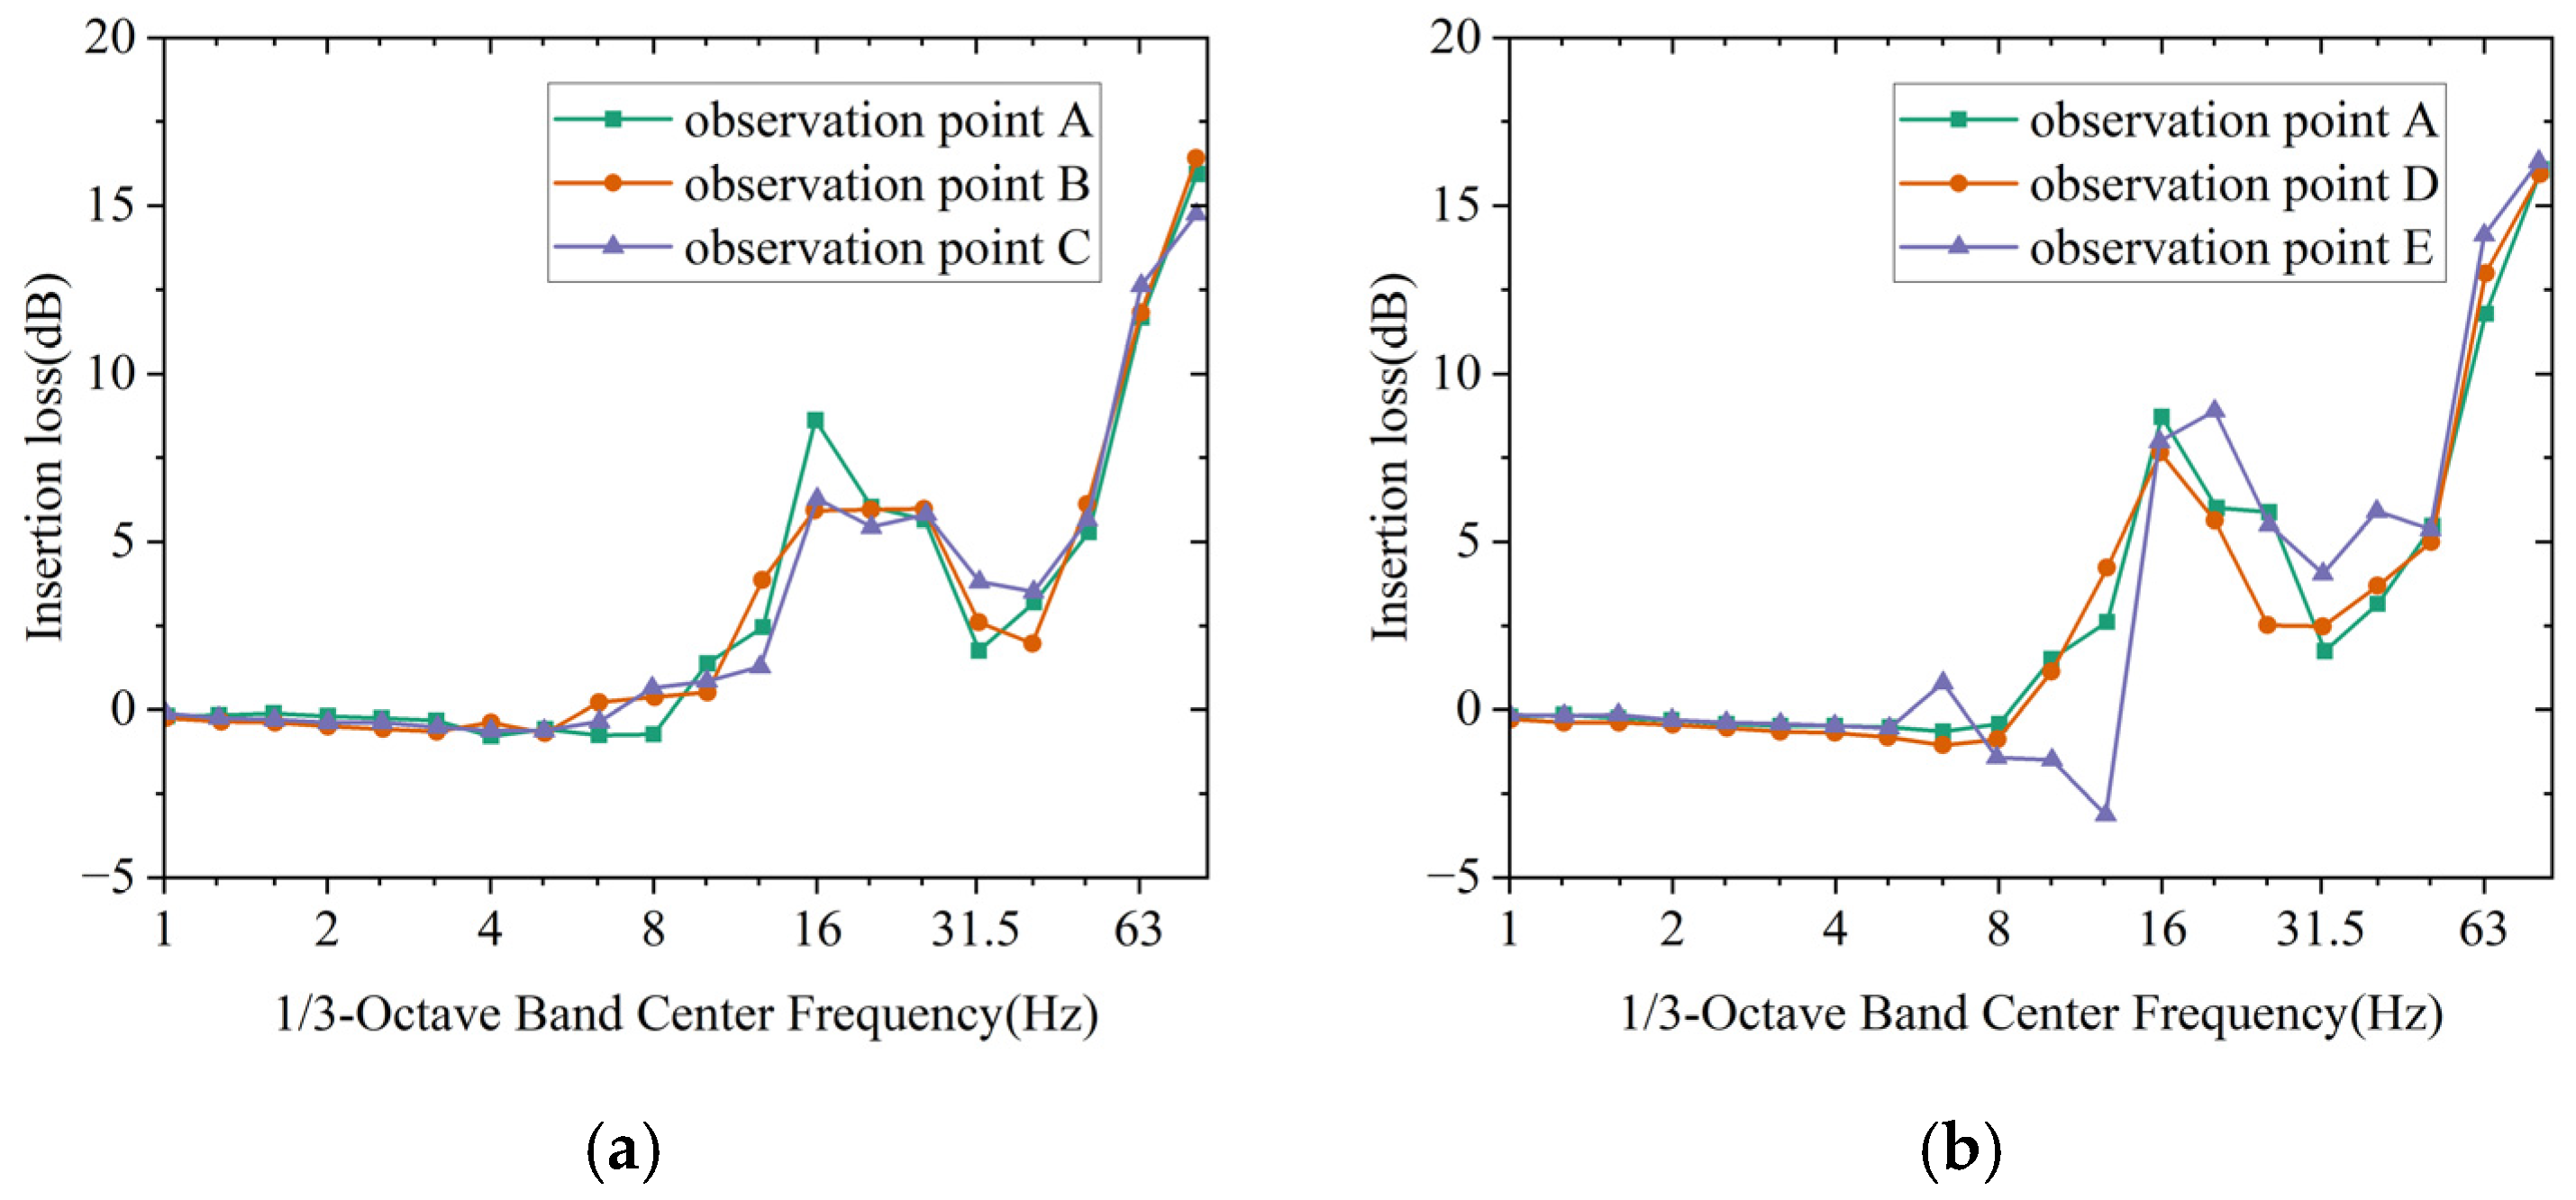
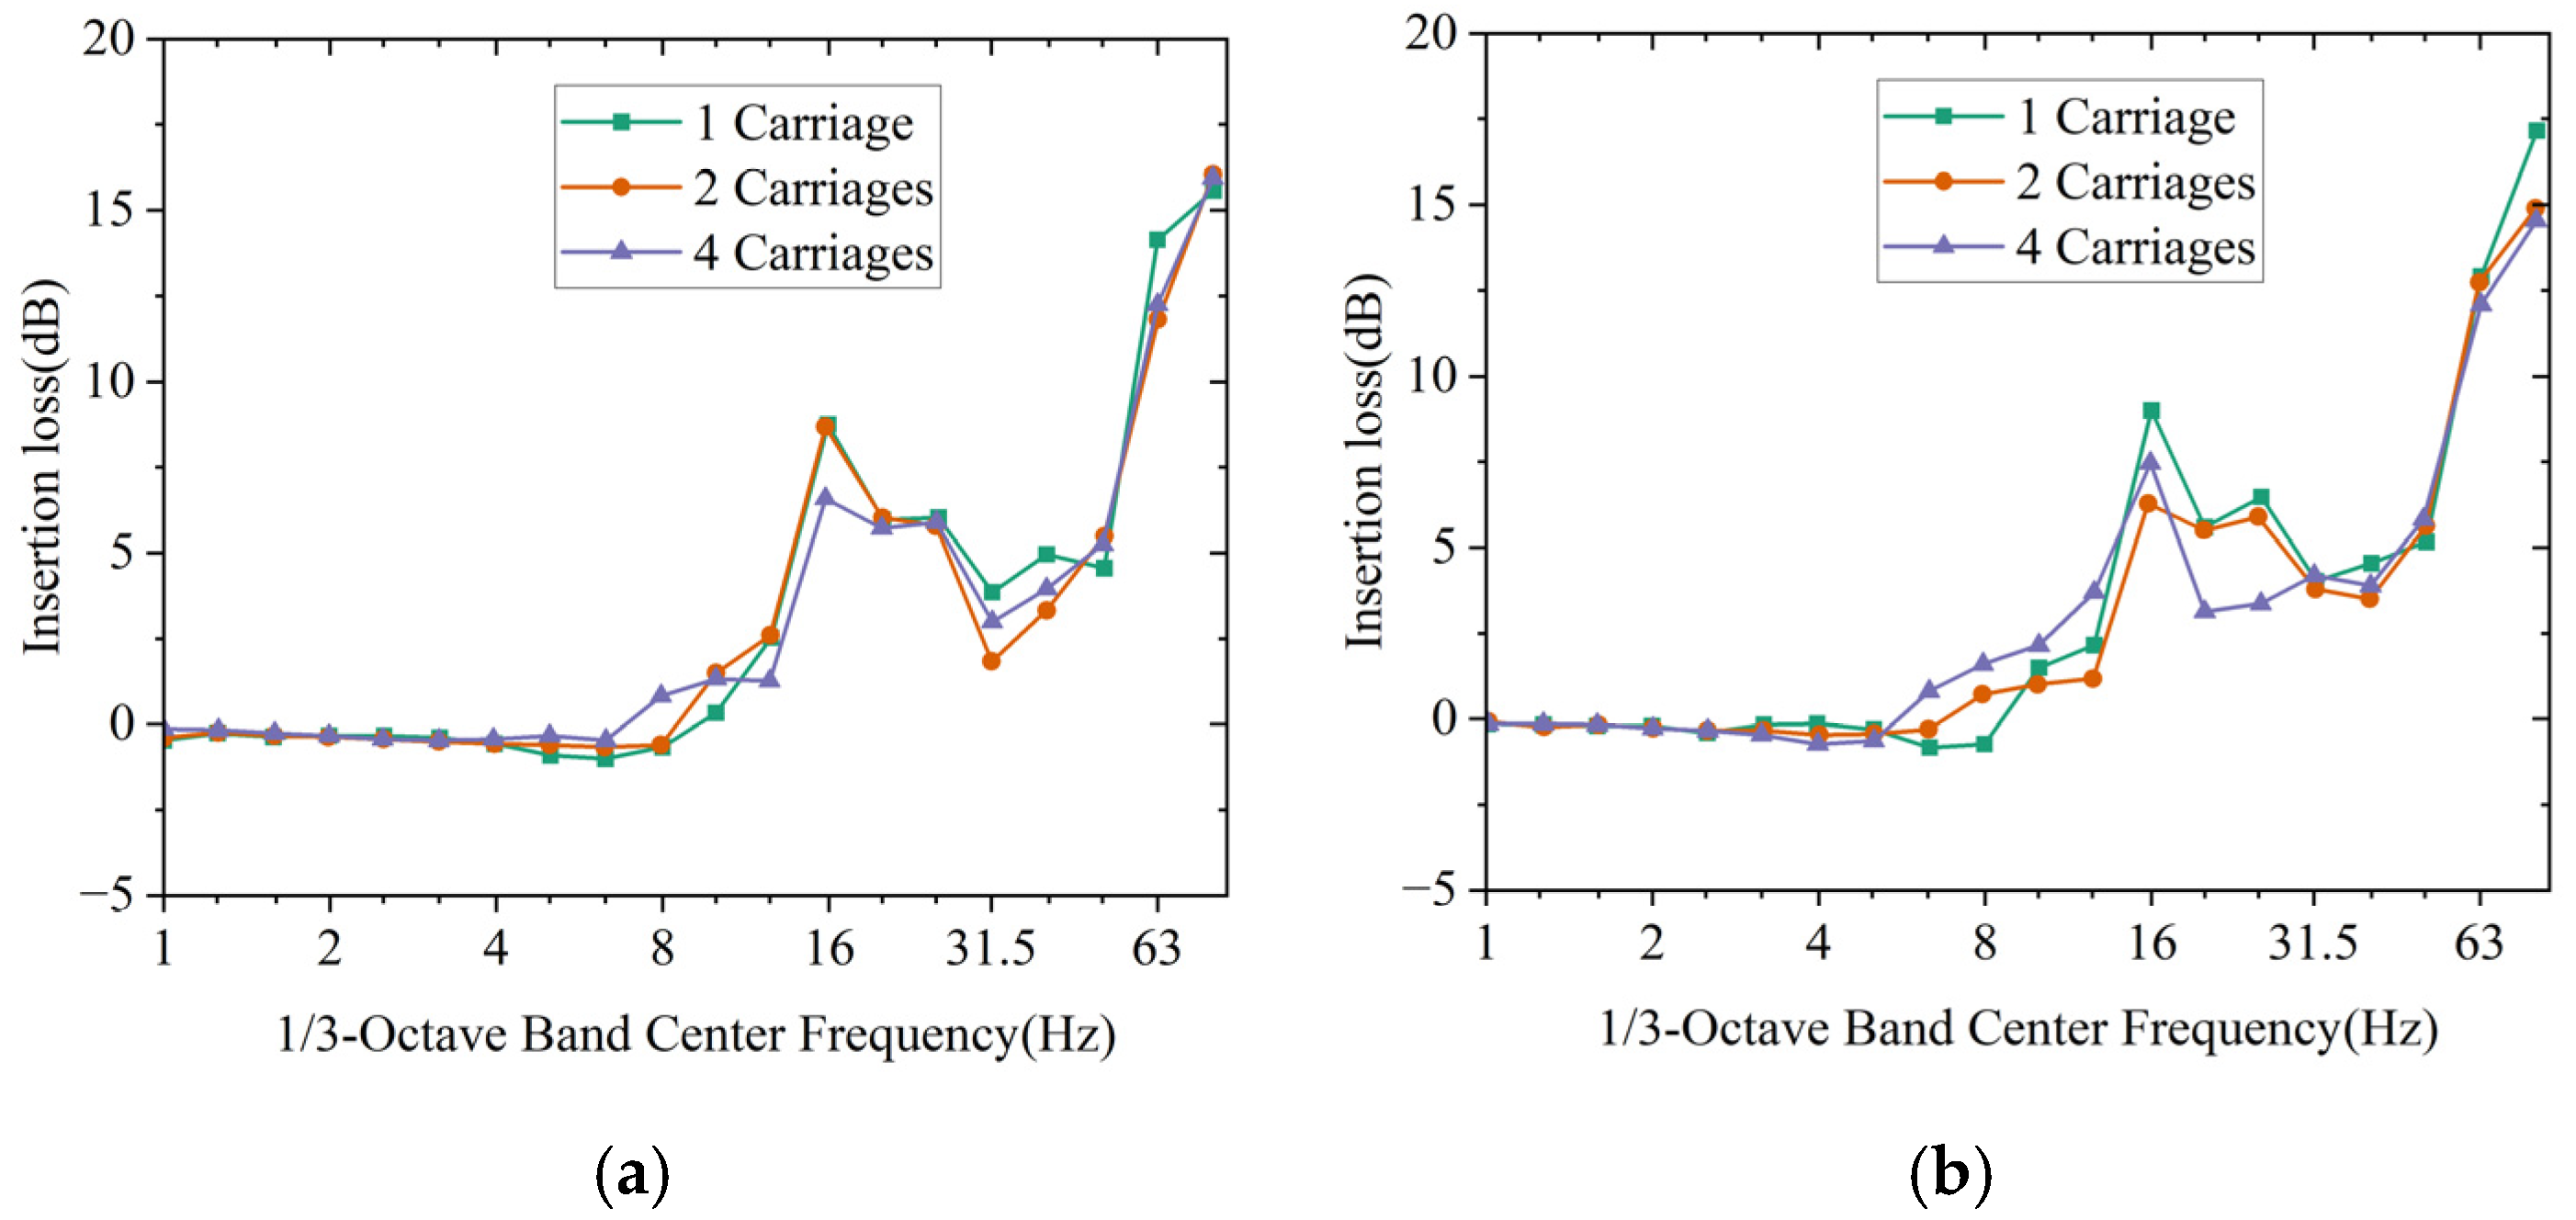
Tree grids produce considerable attenuation performance for train loads. Due to the interaction of wave fields excited by multiple harmonic point loads at different locations, the attenuation efficiency varies significantly within 5–50 Hz across surface positions, with observation points farther from the tree grid exhibiting lower attenuation efficiency. Moreover, the attenuation performance tends to weaken by 1–3 dB with an increasing number of carriages.
(2)
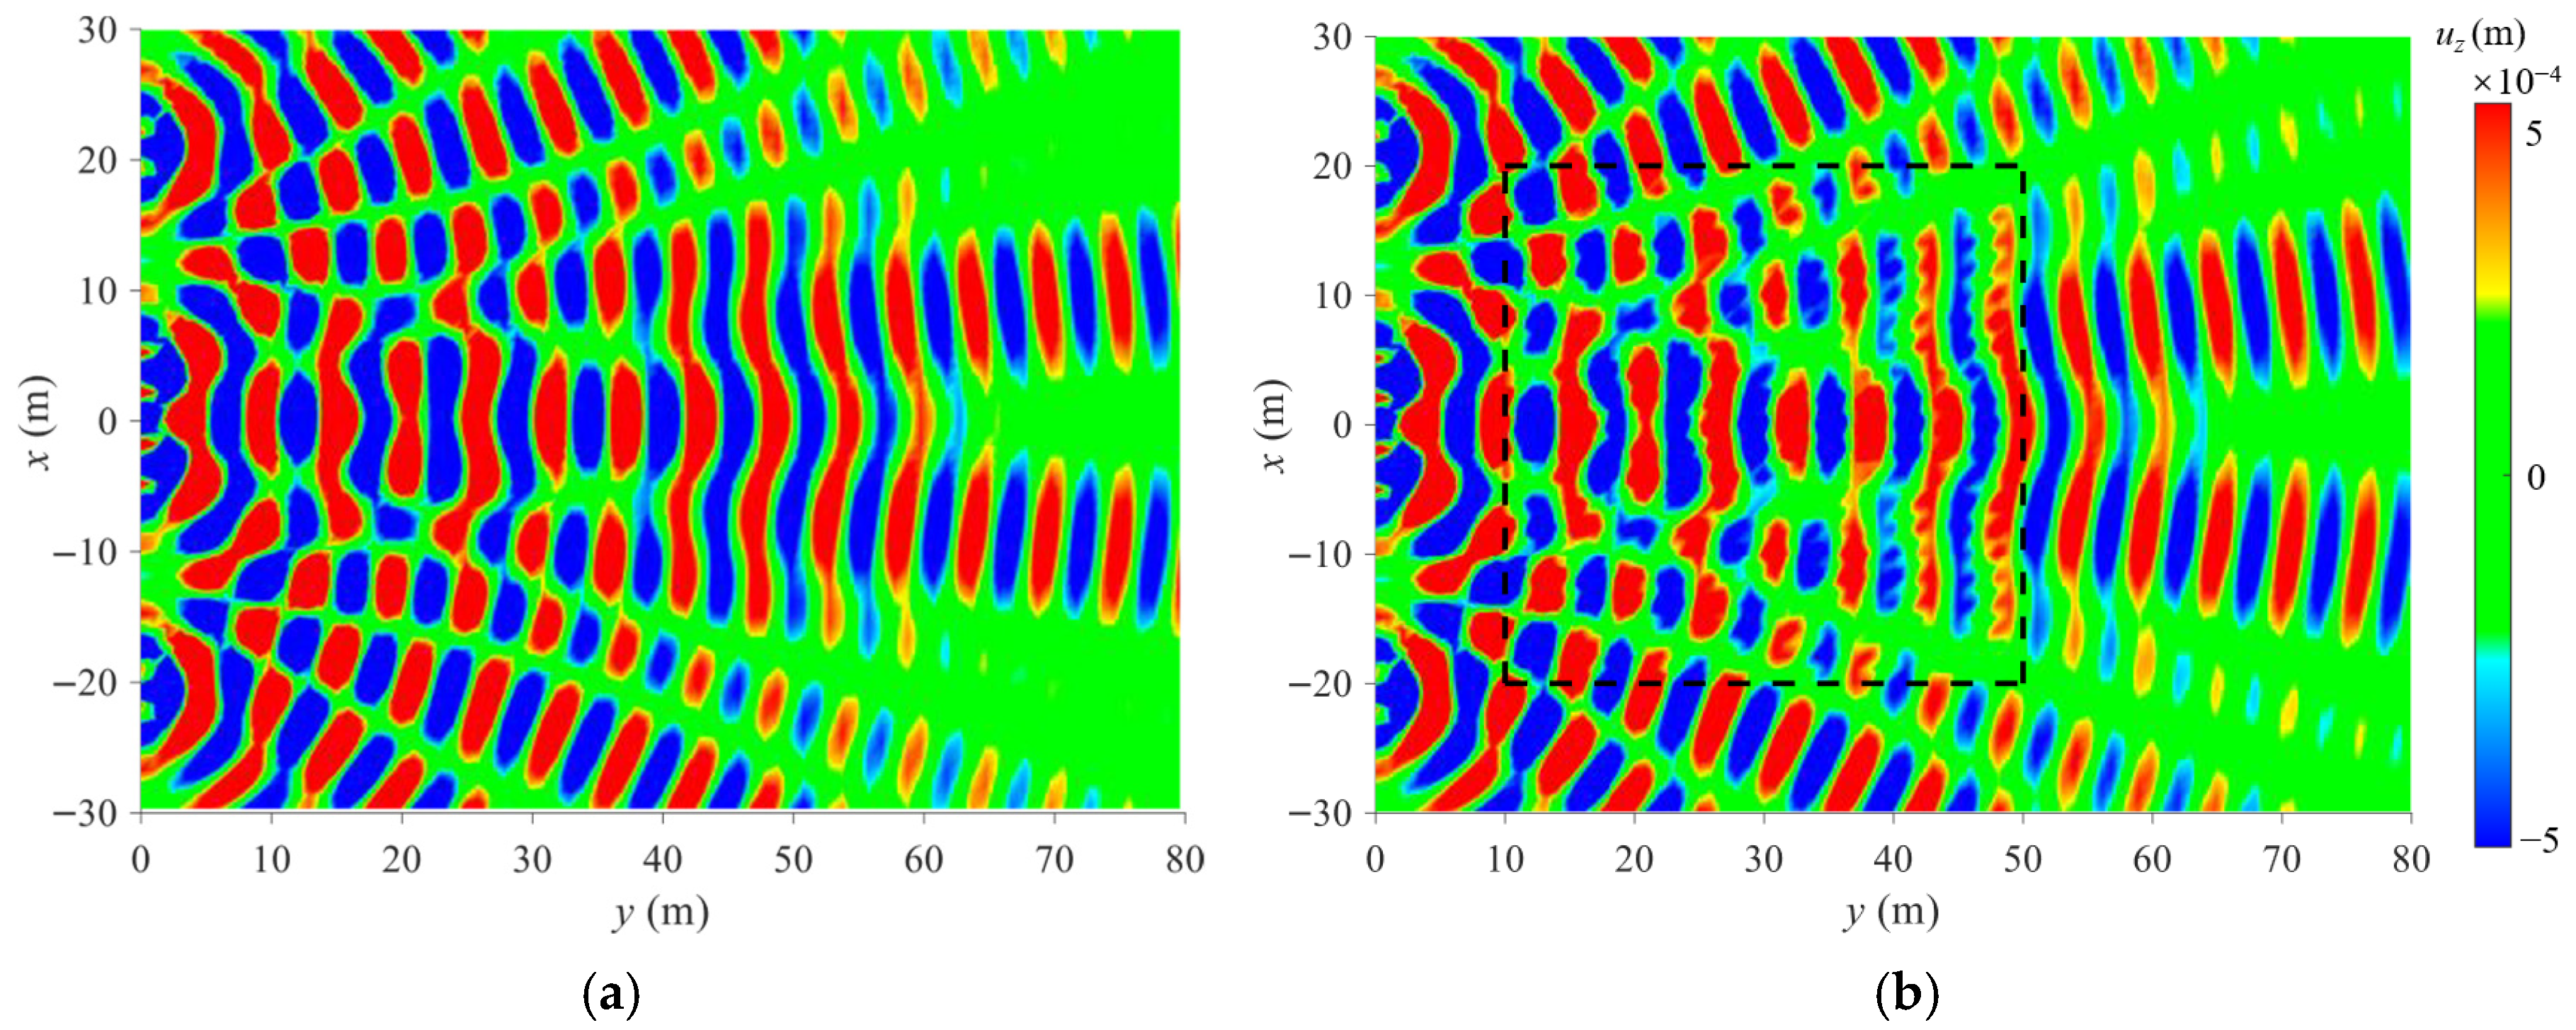
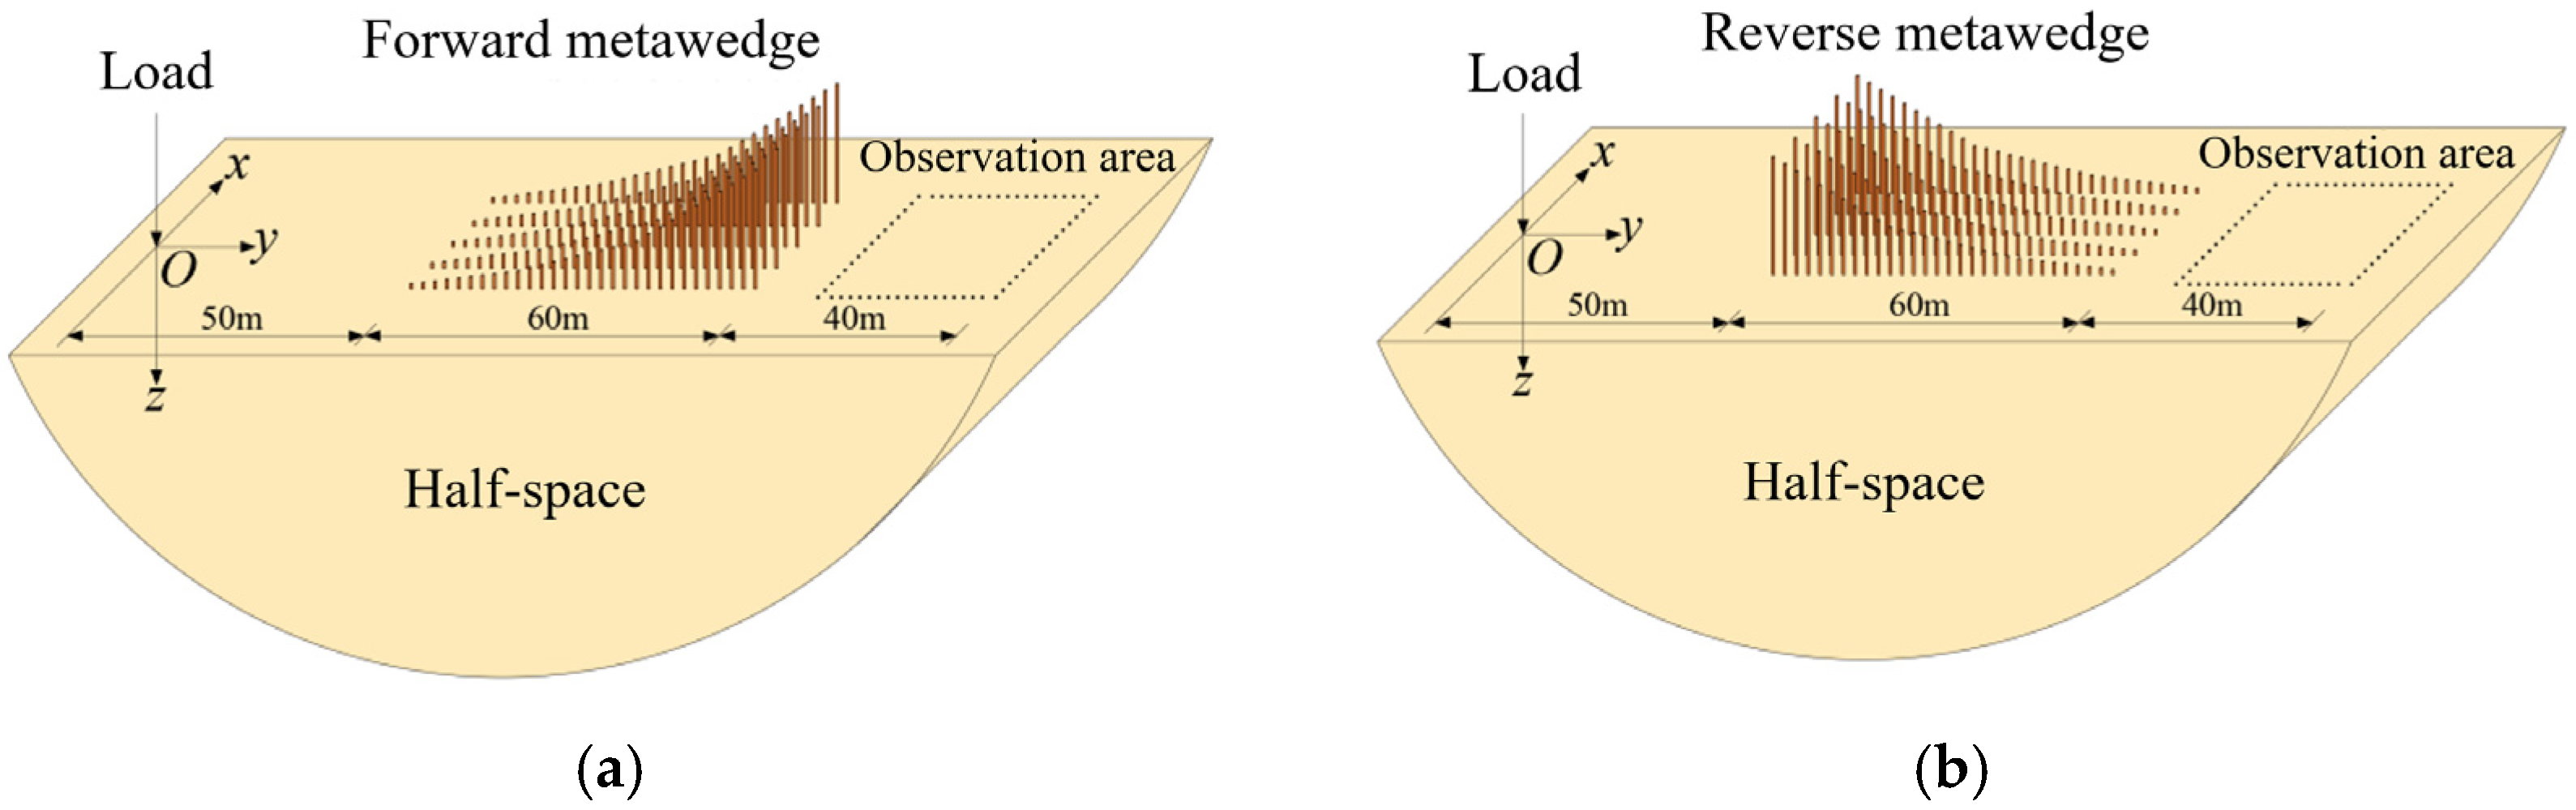
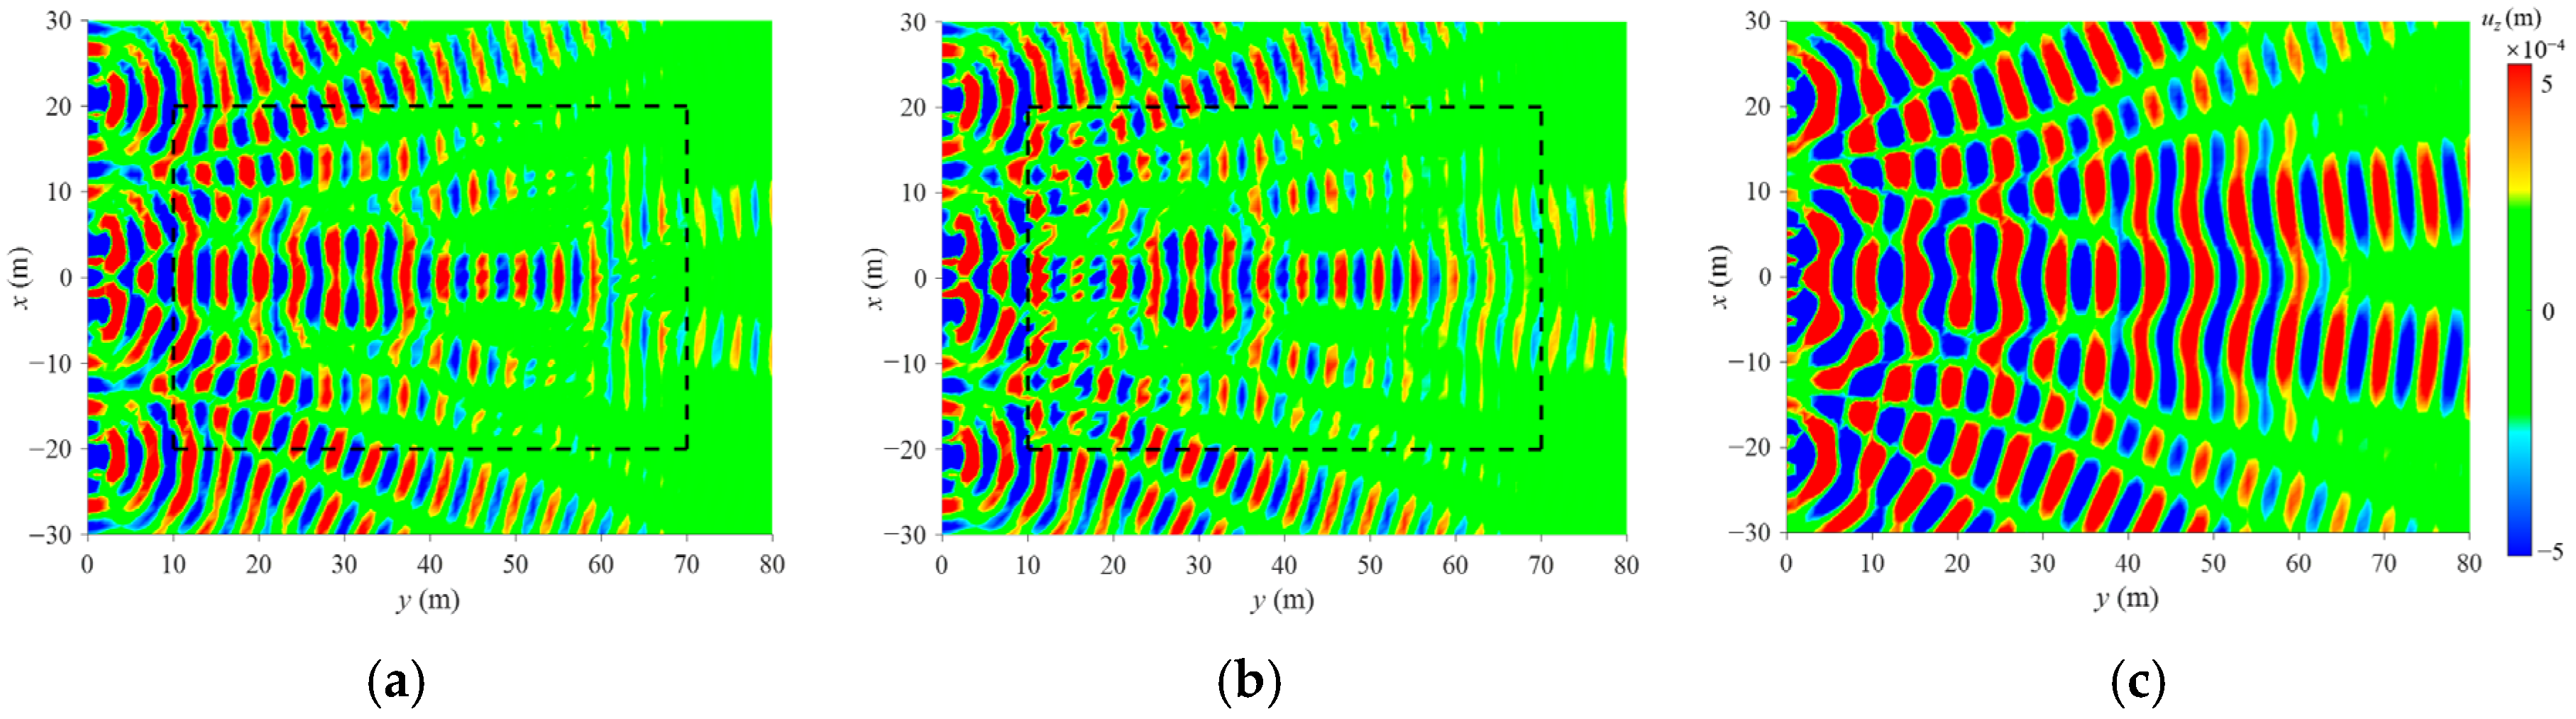
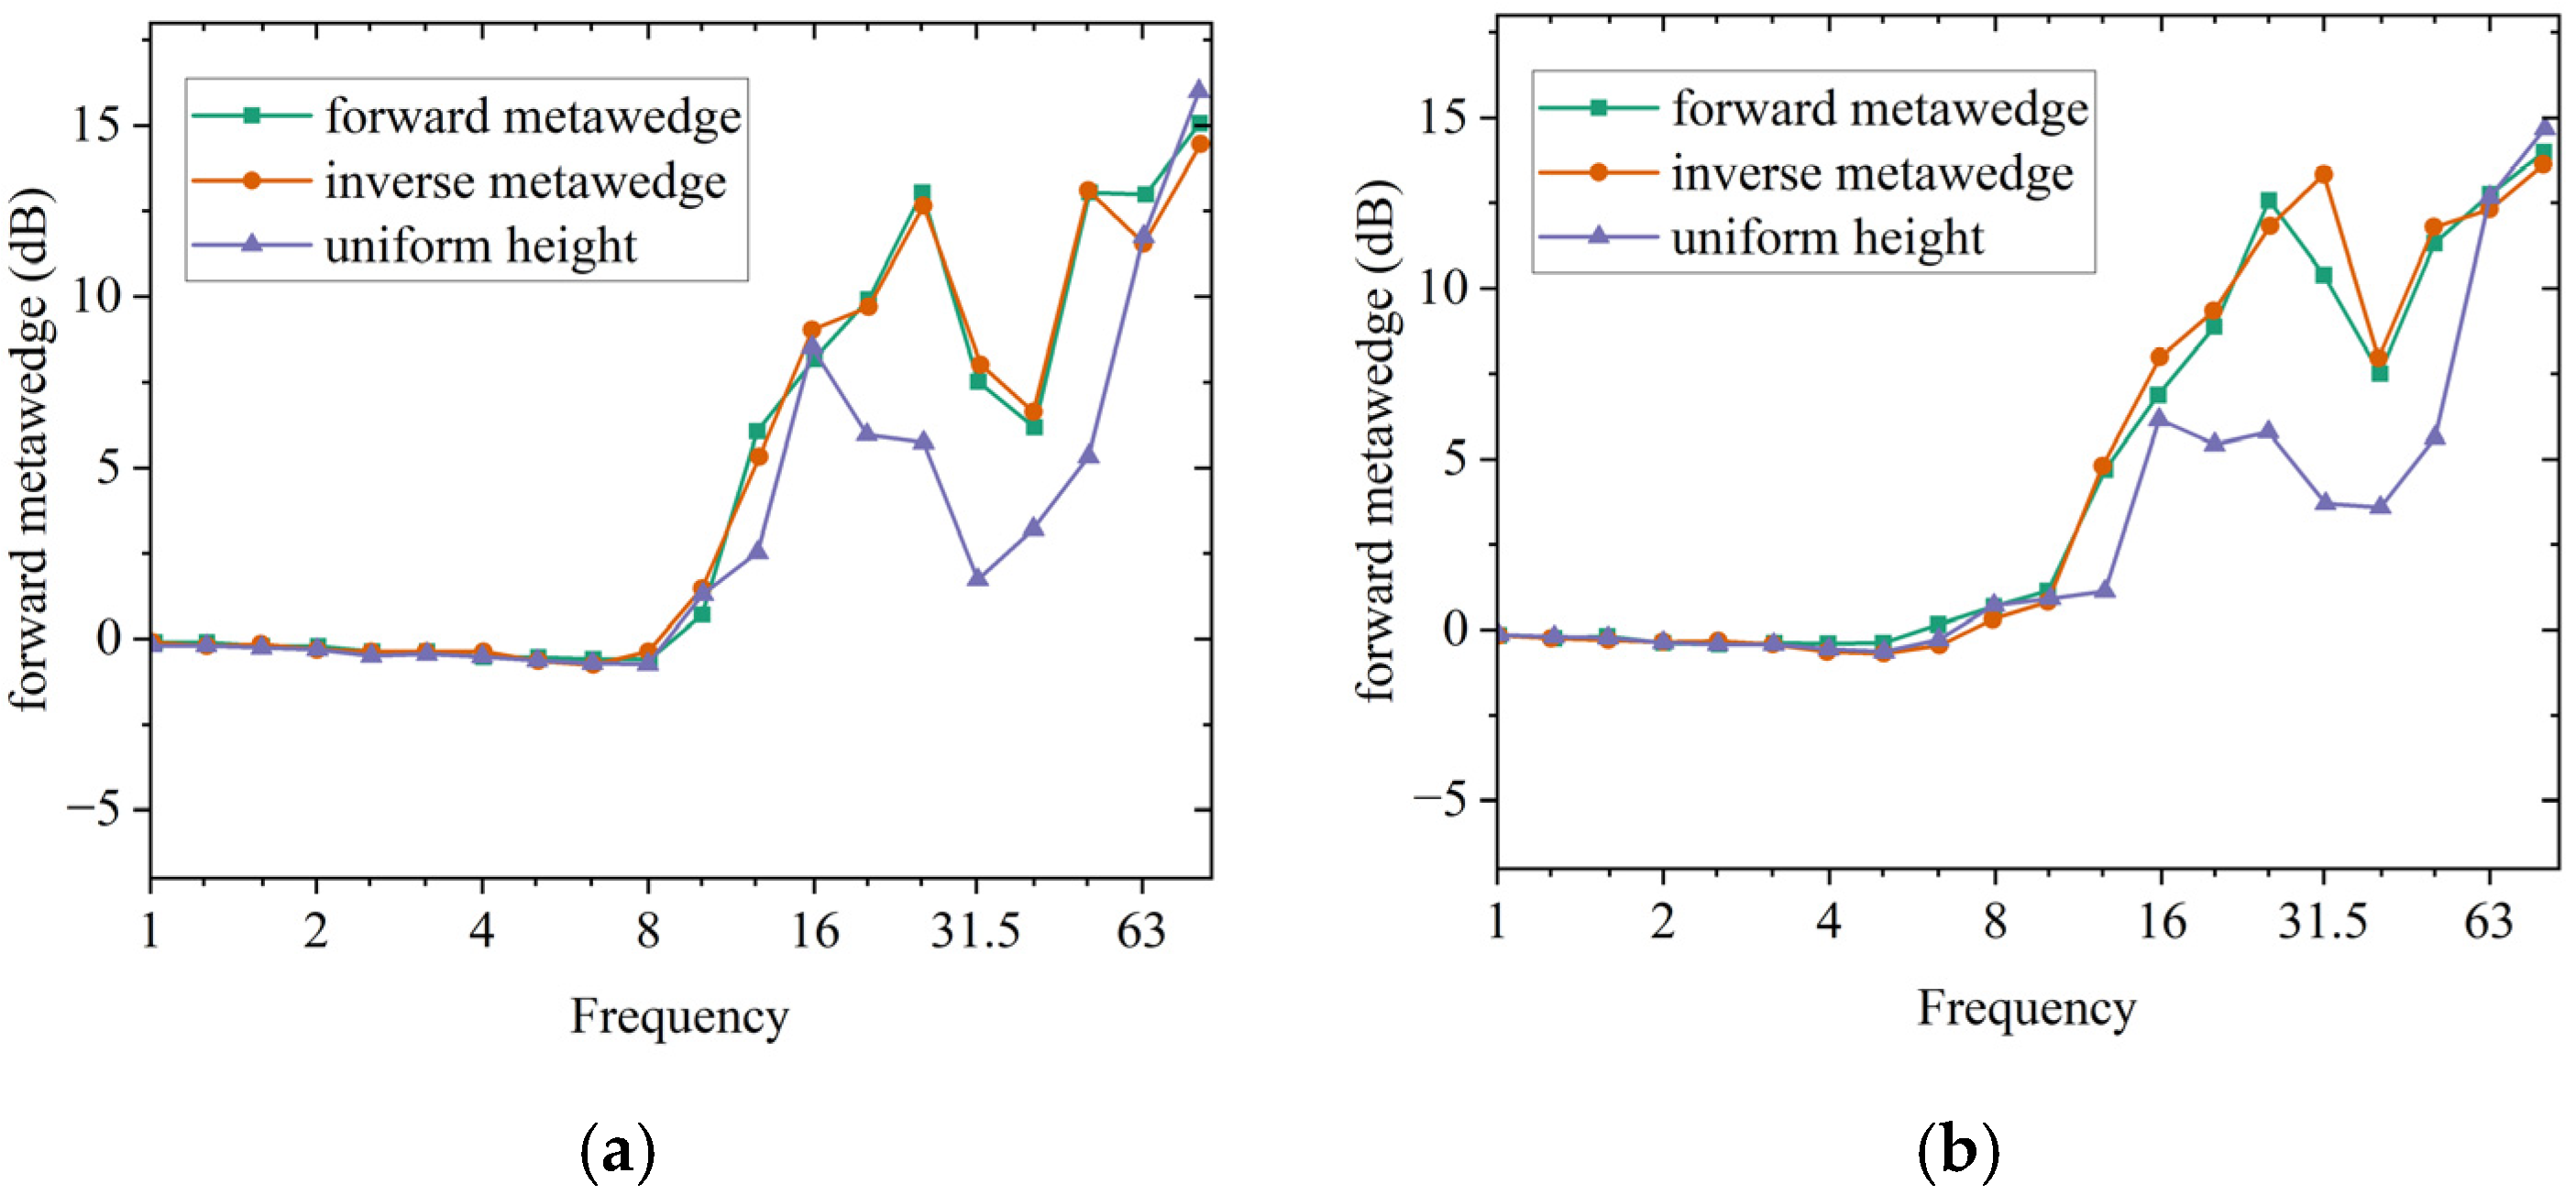
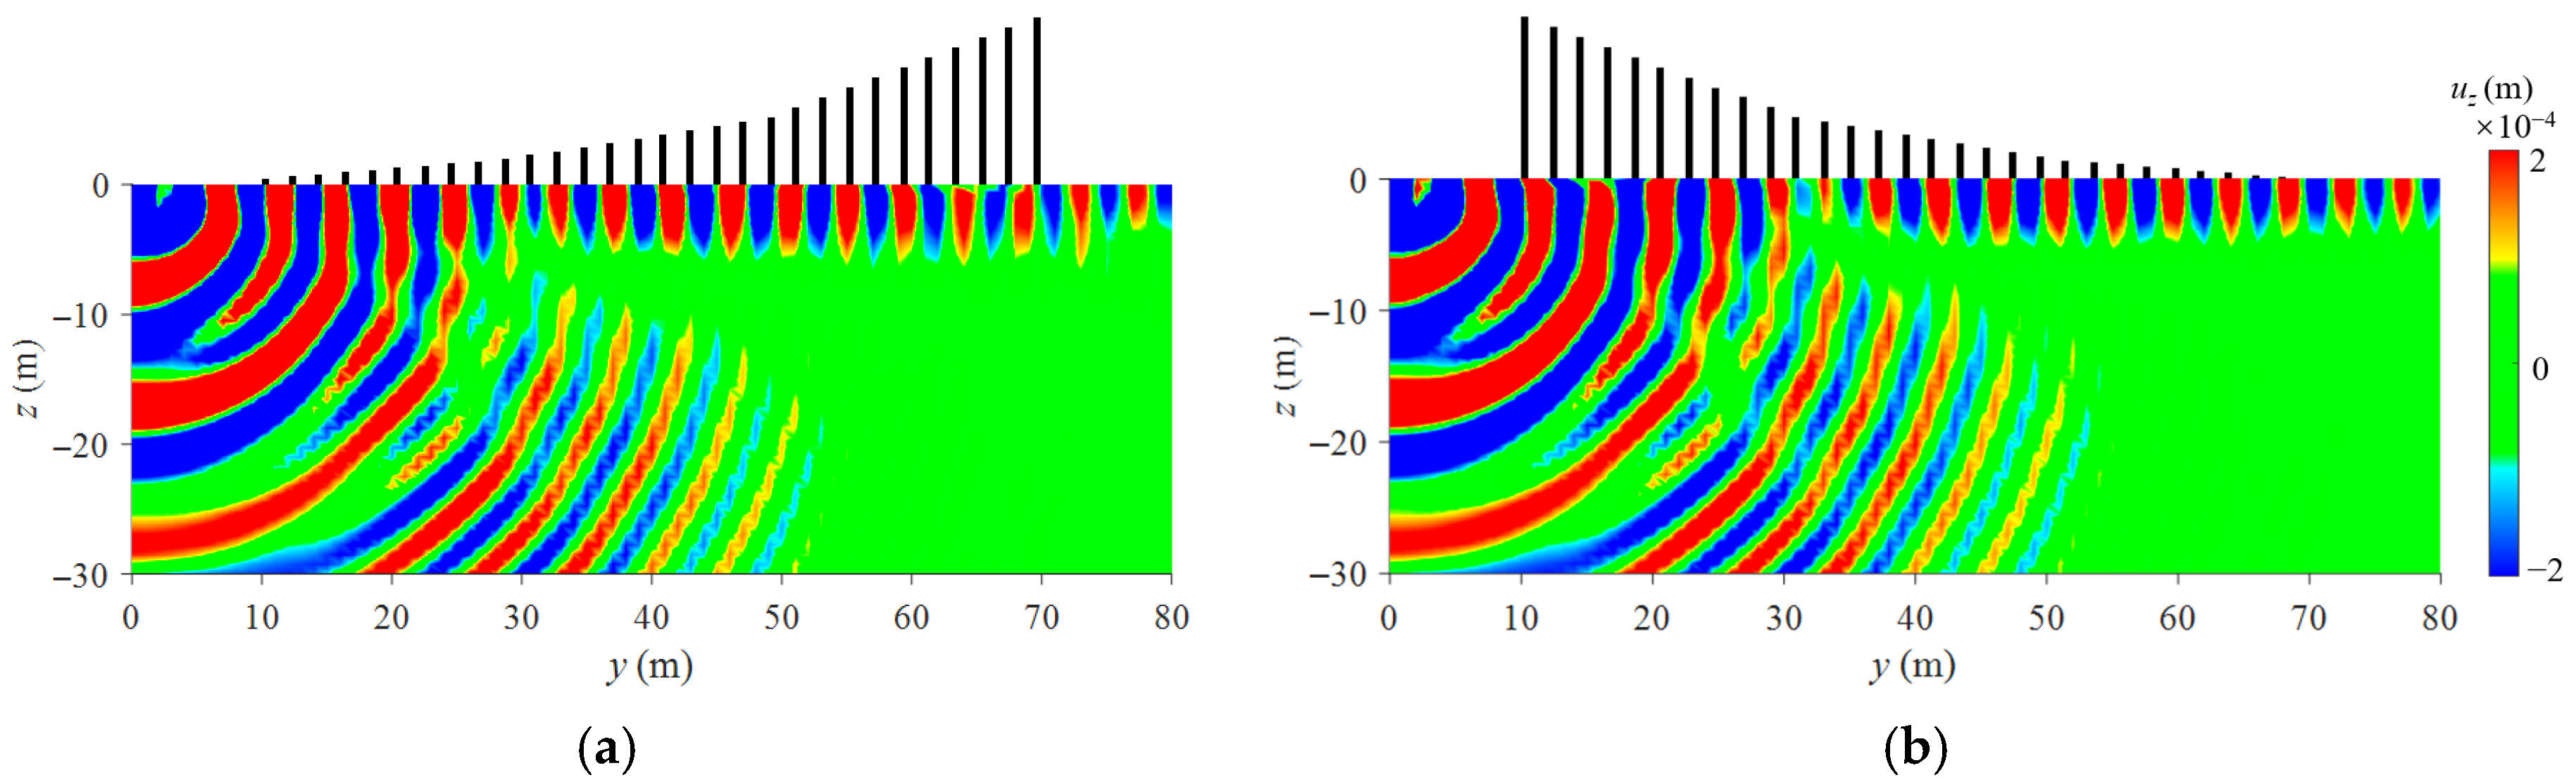
A wider tree distribution area, especially along the direction of the track, leads to more effective vibration mitigation, and the differences in ARS can reach 12 dB at farther points. Compared with the ordinary tree grid, trees arranged with a height gradient in the direction perpendicular to the track can capture Rayleigh waves induced by train loads and convert them into bulk shear waves, thereby achieving more significant attenuation performance within 10–63 Hz.
(3)
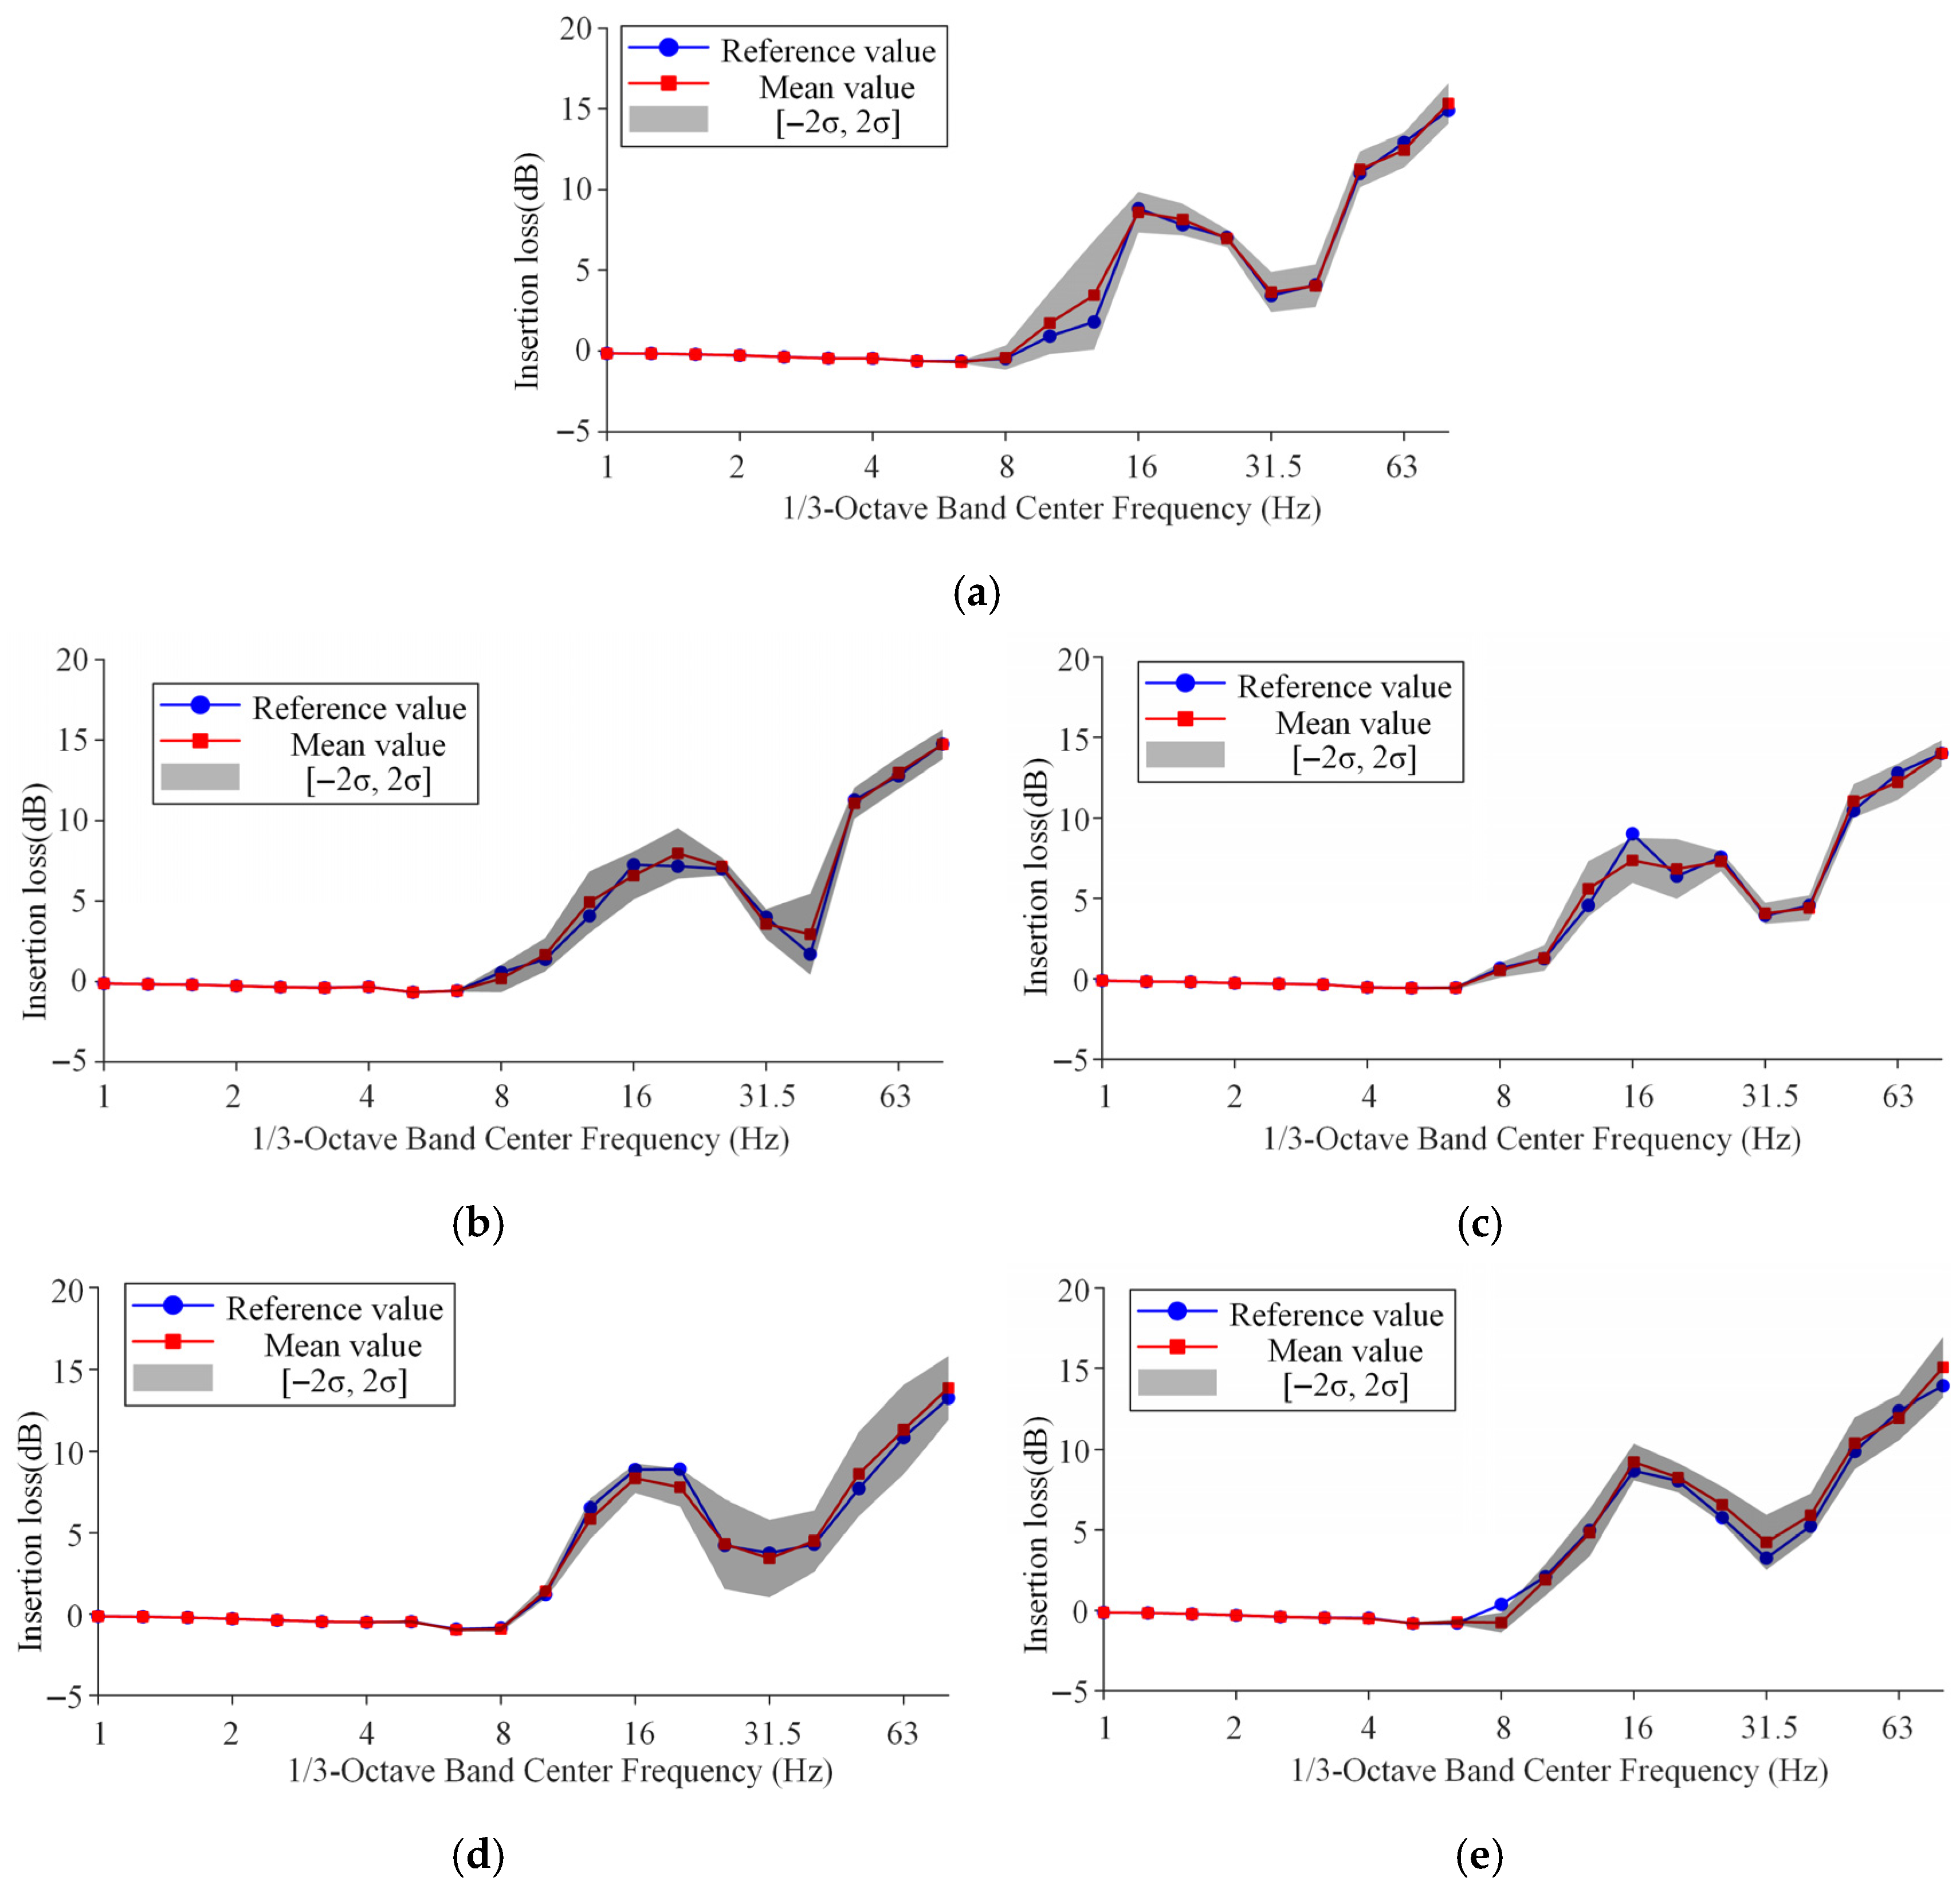
Under random variations in tree parameters (height, radius, and density) with a ±40% fluctuation range, height induces the largest uncertainty, with ARS fluctuations up to 1.7 dB at close points in the 8–16 Hz range; radius has minimal effect, with variations under 1.2 dB at most; when all parameters vary simultaneously, the uncertainty can reach 2 dB (low-frequency) and 1 dB (high-frequency), but the grid still maintains attenuation performance within 8–32 Hz and 63–80 Hz. In addition, due to the propagation of low-frequency surface waves around the tree grid toward distant observation points, the uncertainty in attenuation performance at those points tends to reduce within the low-frequency range while amplifying across the high-frequency range.

Author Contributions

Z.Z.: conceptualization, formal analysis, investigation, methodology, software, visualization, and writing—original draft; X.Z.: methodology, software, investigation, formal analysis, and writing—review and editing; Z.T.: data curation, formal analysis, methodology, and writing—review and editing; C.H.: data curation, formal analysis, funding acquisition, methodology, and supervision. All authors have read and agreed to the published version of the manuscript.

Funding

This research was funded by the Key Research Project of Shanghai Municipal Commission of Housing and Urban Rural Development grant number 2024-Z02-001-8.

Data Availability Statement

The raw data supporting the conclusions of this article will be made available by the authors on request.

Conflicts of Interest

The authors declare no conflict of interest.

Appendix A

To assess the reliability of the proposed coupled model, we carried out a comparative analysis with the study conducted by Colombi et al. [41], who investigated the vibration attenuation performance of a pine forest using both in situ measurements and finite element method (FEM) simulations. In their FEM model, only the tree trunks were modeled, with material and geometric parameters listed in Table A1. The trees were arranged with a spacing of 2.5 m.
Table A1. Parameters of the soil and the pines.
Parametervalue
Shear wave speed of the soil, Cs900 m/s
Longitudinal wave speed of the soil, CP500 m/s
Density of the soil, ρS1200 kg/m3
Young’s modulus of the tree, Et1.70 × 109 N/m2
Poisson’s ratio of the tree, vt0.281
Density of the tree, ρt450 kg/m3
Using the same configuration, we applied our semi-analytical model to analyze a uniform tree grid with Nx = Ny = 9, where all trees had identical properties. The excitation source was located 30 m away from the array, consistent with the site test setup.
The attenuation ratio Ar is defined as the ratio of the ground surface response at a fixed observation point located behind the tree array, comparing the cases with and without trees. The comparison of ground surface responses is presented in Figure A1, showing good agreement of attenuation frequencies between our model’s predictions and Colombi’s experimental and numerical results.
Figure A1. Validation of the semi-analytical model against experimental data and FEM results [41]. The gray solid line represents the experimental data; the red dashed line denotes the FEM results from the same study, and the blue solid line corresponds to the predictions from the proposed semi-analytical model. The light gray shaded regions indicate the two identified bandgaps.
Applsci 15 08618 g0a1

References

  1. Popović, Z.; Lazarević, L.; Vukićević, M.; Vilotijević, M.; Mirković, N. The Modal Shift to Sustainable Railway Transport in Serbia. MATEC Web Conf. 2017, 106, 05001. [Google Scholar] [CrossRef]
  2. Zou, C.; Li, X.; He, C.; Zhou, S. An Efficient Method for Estimating Building Dynamic Response Due to Train Operations in Tunnel Considering Transmission Path from Source to Receiver. Comput. Struct. 2024, 305, 107555. [Google Scholar] [CrossRef]
  3. Qiu, Y.; Zheng, B.; Jiang, B.; Jiang, S.; Zou, C. Effect of Non-Structural Components on Over-Track Building Vibrations Induced by Train Operations on Concrete Floor. Int. J. Str. Stab. Dyn. 2025, 2650180. [Google Scholar] [CrossRef]
  4. Tao, Z.; Zhang, D.; Tu, D.; He, L.; Zou, C. Prediction of Train-Induced Ground-Borne Vibration Transmission Considering Parametric Uncertainties. Probabilistic Eng. Mech. 2025, 79, 103731. [Google Scholar] [CrossRef]
  5. He, C.; Jia, Y.; Zhou, S.; Chen, X. An Efficient Semi-Analytical Method for Dynamic Responses of a Tunnel in Stratified Soils with Irregular Interfaces. J. Sound Vib. 2025, 614, 119191. [Google Scholar] [CrossRef]
  6. Zhou, S.; Tian, Z.; Yao, Q.; Dai, L. Rethinking Tunnel-Soil Relative Stiffness: Insights from Interactions between Tunnels and Strata Subjected to Ground Surcharge. Int. J. Rail Transp. 2025, 1–16. [Google Scholar] [CrossRef]
  7. Johansson, A.; Nielsen, J.C.O.; Bolmsvik, R.; Karlström, A.; Lundén, R. Under Sleeper Pads—Influence on Dynamic Train–Track Interaction. Wear 2008, 265, 1479–1487. [Google Scholar] [CrossRef]
  8. Guigou-Carter, C.; Villot, M.; Guillerme, B.; Petit, C. Analytical and Experimental Study of Sleeper SAT S 312 in Slab Track Sateba System. J. Sound Vib. 2006, 293, 878–887. [Google Scholar] [CrossRef]
  9. Alves Costa, P.; Calçada, R.; Silva Cardoso, A. Ballast Mats for the Reduction of Railway Traffic Vibrations. Numerical Study. Soil Dyn. Earthq. Eng. 2012, 42, 137–150. [Google Scholar] [CrossRef]
  10. Woods, R.D. Screening of Surface Wave in Soils. J. Soil Mech. Found. Div. 1968, 94, 951–979. [Google Scholar] [CrossRef]
  11. François, S.; Schevenels, M.; Thyssen, B.; Borgions, J.; Degrande, G. Design and Efficiency of a Composite Vibration Isolating Screen in Soil. Soil Dyn. Earthq. Eng. 2012, 39, 113–127. [Google Scholar] [CrossRef]
  12. Takemiya, H.; Fujiwara, A. Wave Propagation/Impediment in a Stratum and Wave Impeding Block (WIB) Measured for SSI Response Reduction. Soil Dyn. Earthq. Eng. 1994, 13, 49–61. [Google Scholar] [CrossRef]
  13. Krylov, V.V. Scattering of Rayleigh Waves by Heavy Masses as Method of Protection against Traffic-Induced Ground Vibrations. In Environmental Vibrations: Prediction, Monitoring, Mitigation and Evaluation; CRC Press: Boca Raton, FL, USA, 2005. [Google Scholar]
  14. Talbot, J.P. Base-Isolated Buildings: Towards Performance-Based Design. Proc. Inst. Civ. Eng. Struct. Build. 2016, 169, 574–582. [Google Scholar] [CrossRef]
  15. Nielsen, J.C.O.; Mirza, A.; Cervello, S.; Huber, P.; Müller, R.; Nelain, B.; Ruest, P. Reducing Train-Induced Ground-Borne Vibration by Vehicle Design and Maintenance. Int. J. Rail Transp. 2015, 3, 17–39. [Google Scholar] [CrossRef]
  16. Hemsworth, B. Reducing Groundborne Vibrations: State-of-the-Art Study. J. Sound Vib. 2000, 231, 703–709. [Google Scholar] [CrossRef]
  17. Thompson, D.J.; Jiang, J.; Toward, M.G.R.; Hussein, M.F.M.; Ntotsios, E.; Dijckmans, A.; Coulier, P.; Lombaert, G.; Degrande, G. Reducing Railway-Induced Ground-Borne Vibration by Using Open Trenches and Soft-Filled Barriers. Soil Dyn. Earthq. Eng. 2016, 88, 45–59. [Google Scholar] [CrossRef]
  18. Wenbo, Y.; Yingchao, S.; Dexiong, L.; Tao, Z.; Qixiang, Y.; Yong, F.; Chuan, H. An Experimental Study of the Isolation Performance of Trenches on Ground-Borne Vibration from Underground Tunnels. Earthq. Eng. Eng. Vib. 2020, 19, 779–790. [Google Scholar] [CrossRef]
  19. Peplow, A.T.; Jones, C.J.C.; Petyt, M. Surface Vibration Propagation over a Layered Elastic Half-Space with an Inclusion. Appl. Acoust. 1999, 56, 283–296. [Google Scholar] [CrossRef]
  20. Andersen, L.; Nielsen, S.R.K. Reduction of Ground Vibration by Means of Barriers or Soil Improvement along a Railway Track. Soil Dyn. Earthq. Eng. 2005, 25, 701–716. [Google Scholar] [CrossRef]
  21. Jones, C.J.C. Use of Numerical Models to Determine the Effectiveness of Anti-Vibration Systems for Railways. Proc. Inst. Civ. Eng. Transp. 1994, 105, 43–51. [Google Scholar] [CrossRef]
  22. Dijckmans, A.; Coulier, P.; Jiang, J.; Toward, M.G.R.; Thompson, D.J.; Degrande, G.; Lombaert, G. Mitigation of Railway Induced Ground Vibration by Heavy Masses next to the Track. Soil Dyn. Earthq. Eng. 2015, 75, 158–170. [Google Scholar] [CrossRef]
  23. Romero García, V. On the Control of Propagating Acoustic Waves in Sonic Crystals: Analytical, Numerical and Optimization Techniques; Universitat Politècnica de València: Valencia, Spain, 2010. [Google Scholar] [CrossRef]
  24. Noguchi, Y.; Yamada, T. Topology Optimization of Acoustic Metasurfaces by Using a Two-Scale Homogenization Method. Appl. Math. Model. 2021, 98, 465–497. [Google Scholar] [CrossRef]
  25. Brûlé, S.; Javelaud, E.H.; Enoch, S.; Guenneau, S. Experiments on Seismic Metamaterials: Molding Surface Waves. Phys. Rev. Lett. 2014, 112, 133901. [Google Scholar] [CrossRef] [PubMed]
  26. Pu, X.; Shi, Z. Surface-Wave Attenuation by Periodic Pile Barriers in Layered Soils. Constr. Build. Mater. 2018, 180, 177–187. [Google Scholar] [CrossRef]
  27. Li, T.; Su, Q.; Kaewunruen, S. Seismic Metamaterial Barriers for Ground Vibration Mitigation in Railways Considering the Train-Track-Soil Dynamic Interactions. Constr. Build. Mater. 2020, 260, 119936. [Google Scholar] [CrossRef]
  28. Ma, M.; Jiang, B.; Liu, W.; Liu, K. Control of Metro Train-Induced Vibrations in a Laboratory Using Periodic Piles. Sustainability 2020, 12, 5871. [Google Scholar] [CrossRef]
  29. Huang, J.; Liu, W.; Shi, Z. Surface-Wave Attenuation Zone of Layered Periodic Structures and Feasible Application in Ground Vibration Reduction. Constr. Build. Mater. 2017, 141, 1–11. [Google Scholar] [CrossRef]
  30. Castanheira-Pinto, A.; Alves-Costa, P.; Godinho, L.; Amado-Mendes, P. On the Application of Continuous Buried Periodic Inclusions on the Filtering of Traffic Vibrations: A Numerical Study. Soil Dyn. Earthq. Eng. 2018, 113, 391–405. [Google Scholar] [CrossRef]
  31. He, C.; Zhou, S.; Guo, P. Mitigation of Railway-Induced Vibrations by Using Periodic Wave Impeding Barriers. Appl. Math. Model. 2022, 105, 496–513. [Google Scholar] [CrossRef]
  32. Sheng, X. A Review on Modelling Ground Vibrations Generated by Underground Trains. Int. J. Rail Transp. 2019, 7, 241–261. [Google Scholar] [CrossRef]
  33. Achaoui, Y.; Ungureanu, B.; Enoch, S.; Brûlé, S.; Guenneau, S. Seismic Waves Damping with Arrays of Inertial Resonators. Extrem. Mech. Lett. 2016, 8, 30–37. [Google Scholar] [CrossRef]
  34. Palermo, A.; Vitali, M.; Marzani, A. Metabarriers with Multi-Mass Locally Resonating Units for Broad Band Rayleigh Waves Attenuation. Soil Dyn. Earthq. Eng. 2018, 113, 265–277. [Google Scholar] [CrossRef]
  35. Basone, F.; Wenzel, M.; Bursi, O.S.; Fossetti, M. Finite Locally Resonant Metafoundations for the Seismic Protection of Fuel Storage Tanks. Earthq. Eng. Struct. Dyn. 2019, 48, 232–252. [Google Scholar] [CrossRef]
  36. Wang, X.; Wan, S.; Nian, Y.; Zhou, P.; Zhu, Y. Periodic In-Filled Pipes Embedded in Semi-Infinite Space as Seismic Metamaterials for Filtering Ultra-Low-Frequency Surface Waves. Constr. Build. Mater. 2021, 313, 125498. [Google Scholar] [CrossRef]
  37. Williams, E.G.; Roux, P.; Rupin, M.; Kuperman, W.A. Theory of Multiresonant Metamaterials for A_0 Lamb Waves. Phys. Rev. B 2015, 91, 104307. [Google Scholar] [CrossRef]
  38. Chaplain, G.J.; De Ponti, J.M.; Aguzzi, G.; Colombi, A.; Craster, R.V. Topological Rainbow Trapping for Elastic Energy Harvesting in Graded Su-Schrieffer-Heeger Systems. Phys. Rev. Appl. 2020, 14, 054035. [Google Scholar] [CrossRef]
  39. Pu, X.; Palermo, A.; Marzani, A. Lamb’s Problem for a Half-Space Coupled to a Generic Distribution of Oscillators at the Surface. Int. J. Eng. Sci. 2021, 168, 103547. [Google Scholar] [CrossRef]
  40. Zeng, C.; Zhao, C.; Zeighami, F. Seismic Surface Wave Attenuation by Resonant Metasurfaces on Stratified Soil. Earthq. Eng. Struct. Dyn. 2022, 51, 1201–1223. [Google Scholar] [CrossRef]
  41. Colombi, A.; Roux, P.; Guenneau, S.; Gueguen, P.; Craster, R.V. Forests as a Natural Seismic Metamaterial: Rayleigh Wave Bandgaps Induced by Local Resonances. Sci. Rep. 2016, 6, 19238. [Google Scholar] [CrossRef]
  42. Roux, P.; Bindi, D.; Boxberger, T.; Colombi, A.; Cotton, F.; Douste-Bacque, I.; Garambois, S.; Gueguen, P.; Hillers, G.; Hollis, D.; et al. Toward Seismic Metamaterials: The METAFORET Project. Seismol. Res. Lett. 2018, 89, 582–593. [Google Scholar] [CrossRef]
  43. Colombi, A.; Colquitt, D.; Roux, P.; Guenneau, S.; Craster, R.V. A Seismic Metamaterial: The Resonant Metawedge. Sci. Rep. 2016, 6, 27717. [Google Scholar] [CrossRef] [PubMed]
  44. He, C.; Zhou, S.; Li, X.; Di, H.; Zhang, X. Forest Trees as a Natural Metamaterial for Surface Wave Attenuation in Stratified Soils. Constr. Build. Mater. 2023, 363, 129769. [Google Scholar] [CrossRef]
  45. Muhammad; Wu, T.; Lim, C.W. Forest Trees as Naturally Available Seismic Metamaterials: Low Frequency Rayleigh Wave with Extremely Wide Bandgaps. Int. J. Str. Stab. Dyn. 2020, 20, 2043014. [Google Scholar] [CrossRef]
  46. Muhammad; Lim, C.W. Natural Seismic Metamaterials: The Role of Tree Branches in the Birth of Rayleigh Wave Bandgap for Ground Born Vibration Attenuation. Trees 2021, 35, 1299–1315. [Google Scholar] [CrossRef]
  47. Colquitt, D.J.; Colombi, A.; Craster, R.V.; Roux, P.; Guenneau, S.R.L. Seismic Metasurfaces: Sub-Wavelength Resonators and Rayleigh Wave Interaction. J. Mech. Phys. Solids 2017, 99, 379–393. [Google Scholar] [CrossRef]
  48. Marigo, J.-J.; Pham, K.; Maurel, A.; Guenneau, S. Effective Model for Elastic Waves in a Substrate Supporting an Array of Plates/Beams with Flexural and Longitudinal Resonances. J. Elast. 2021, 146, 143–177. [Google Scholar] [CrossRef]
  49. Liu, Y.; Huang, J.; Li, Y.; Shi, Z. Trees as Large-Scale Natural Metamaterials for Low-Frequency Vibration Reduction. Constr. Build. Mater. 2019, 199, 737–745. [Google Scholar] [CrossRef]
  50. Lysmer, J.; Waas, G. Shear Waves in Plane Infinite Structures. J. Eng. Mech. Div. 1972, 98, 85–105. [Google Scholar] [CrossRef]
  51. Waas, G. Linear Two-Dimensional Analysis of Soil Dynamics Problems in Semi-Infinite Layered Media. Ph.D. Thesis, University of California, Berkeley, CA, USA, 1972. [Google Scholar]
  52. Park, J. Wave Motion in Finite and Infinite Media Using the Thin-Layer Method. Ph.D. Thesis, Massachusetts Institute of Technology, Cambridge, MA, USA, 2002. Available online: https://dspace.mit.edu/handle/1721.1/43616 (accessed on 12 June 2025).
  53. Graff, K.F. Wave Motion in Elastic Solids; Courier Corporation: North Chelmsford, MA, USA, 2012. [Google Scholar]
  54. Sneddon, I.N. Fourier Transforms; Courier Corporation: North Chelmsford, MA, USA, 1995. [Google Scholar]
  55. Kausel, E. Thin-Layer Method: Formulation in the Time Domain. Int. J. Numer. Methods Eng. 1994, 37, 927–941. [Google Scholar] [CrossRef]
  56. Barbosa, J.M.D.O.; Park, J.; Kausel, E. Perfectly Matched Layers in the Thin Layer Method. Comput. Methods Appl. Mech. Eng. 2012, 217–220, 262–274. [Google Scholar] [CrossRef]
Figure 1. Schematic diagram of a tree grid coupled to a stratified half-space with track structures.
Applsci 15 08618 g001
Figure 2. Schematic diagram of discretization of the half-space into thin layers.
Applsci 15 08618 g002
Figure 3. Illustration of the ballast track system and the reference coordinate framework used in the model.
Applsci 15 08618 g003
Figure 4. Schematic diagram of the train load distribution.
Applsci 15 08618 g004
Figure 5. Layout of the observation points (top-down view).
Applsci 15 08618 g005
Figure 6. ARS values of the vertical displacement at observation points distributed along the direction perpendicular (a) or parallel (b) to the track for two carriages.
Applsci 15 08618 g006
Figure 7. The vertical displacement fields without (a) and with (b) the tree grid of the ground surface for two carriages at f = 17 Hz. The dashed lines outline the area of the tree grid.
Applsci 15 08618 g007
Figure 8. ARS values at observation points A (a) and C (b) for different number of carriages in the frequency range of 1–80 Hz.
Applsci 15 08618 g008
Figure 9. ARS values at observation points A and C for different tree counts in the lateral and longitudinal directions. (a) Point A for Nx = 5, 10, and 20 and Ny = 20; (b) Point C for Nx = 5, 10, and 20 and Ny = 20; (c) Point A for Nx = 20 and Ny = 10, 20, and 30; (d) Point C for Nx = 20 and Ny = 10, 20, and 30.
Applsci 15 08618 g009
Figure 10. (a) The forward metawedge and (b) the reverse metawedge with 30 columns of trees whose heights increase as the y coordinates of the tree grow.
Applsci 15 08618 g010
Figure 11. The vertical displacement fields for (a) a forward metawedge, (b) a reverse metawedge, and (c) the case without trees for two carriages at f = 22 Hz. The dashed lines outline the area of the tree grid.
Applsci 15 08618 g011
Figure 12. The ARS values at observation points A (a) and C (b) for the forward and reverse metawedges and the uniform height of trees in the frequency range of 1–80 Hz.
Applsci 15 08618 g012
Figure 13. The vertical displacement fields of x = 0 m for (a) a forward metawedge and (b) a reverse metawedge for two carriages at f = 22 Hz.
Applsci 15 08618 g013
Figure 14. Average ARS value and [−2σ, 2σ] range at observation points A (a), B (b), C (c), D (d), and E (e) with simultaneous variation α = 0.4 in tree height htj.
Applsci 15 08618 g014
Figure 15. Average ARS value and [−2σ, 2σ] range at observation points A (a), B (b), C (c), D (d), and E (e) with variation α = 0.4 in tree density ρ tj .
Applsci 15 08618 g015
Figure 16. Average ARS value and [−2σ, 2σ] range at observation points A (a), B (b), C (c), D (d), and E (e) with variation α = 0.4 in tree radius r tj .
Applsci 15 08618 g016
Figure 17. Average ARS value and [−2σ, 2σ] range at observation points A (a), B (b), C (c), D (d), and E (e) with simultaneous variation α = 0.4 in tree height htj, radius r tj , and density ρ tj .
Applsci 15 08618 g017
Table 1. Parameters for the ballast track.
ParameterValue
Mass of the rail beam per unit length of the track, mR120 kg/m
Mass of sleepers per unit length of the track, mS490 kg/m
Mass of ballast per unit length of the track, mB1200 kg/m
Bending stiffness of the rail beam, EI1.26 × 107 N/m2
Rail pad stiffness, kP3.5 × 108 N/m2
Ballast stiffness per unit length of the track, kB3.50 × 108 N/m2
Width of the ballast, 2a2.70 m
Rail pad loss factor, ηR0.15
Table 2. Material parameters of the soil and the tree grid.
ParameterValue
Shear wave speed of the soil, Cs100 m/s
Longitudinal wave speed of the soil, CP200 m/s
Density of the soil, ρS1800 kg/m3
Young’s modulus of the tree, Et1.67 × 109 N/m2
Poisson’s ratio of the tree, vt0.3
Density of the tree, ρt700 kg/m3
Table 3. Geometric parameters of the soil.
ParameterValue
Lateral spacing of the tree grid (y-axis direction), ajy2 m
Longitudinal spacing of the tree grid (x-axis direction), ajx2 m
Distance from the track, Dt10 m
Number of lateral trees, Ny20
Number of longitudinal trees, Nx20
Radius of the tree, r0.25 m
Height of the tree, h14 m
Disclaimer/Publisher’s Note: The statements, opinions and data contained in all publications are solely those of the individual author(s) and contributor(s) and not of MDPI and/or the editor(s). MDPI and/or the editor(s) disclaim responsibility for any injury to people or property resulting from any ideas, methods, instructions or products referred to in the content.

