Article

Natural Frequency of Monopile Supported Offshore Wind Turbine Structures Under Long-Term Cyclic Loading

1
College of Civil Engineering and Architecture, Wenzhou University, Wenzhou 325035, China
2
Key Laboratory of Engineering and Technology for Soft Soil Foundation and Tideland Reclamation of Zhejiang Province, Wenzhou 325035, China
3
Key Laboratory of Urban Security and Disaster Engineering, Beijing University of Technology, Beijing 100124, China
4
Zhejiang Engineering Research Center of Disaster Prevention and Mitigation for Coastal Soft Soil Foundation, Wenzhou 325035, China
*
Author to whom correspondence should be addressed.
Appl. Sci. 2025, 15(15), 8143; https://doi.org/10.3390/app15158143
Submission received: 8 June 2025 / Revised: 12 July 2025 / Accepted: 14 July 2025 / Published: 22 July 2025

Abstract

Offshore wind turbine structures (OWTs) commonly use monopile foundations for support, and long-term exposure to wind–wave cyclic loads may induce changes in foundation stiffness. Variations in foundation stiffness can significantly alter the inherent vibration characteristics of OWTs, potentially leading to amplified vibrations or resonant conditions. In this study, a numerical model considering soil–pile interaction was developed on the FLAC3D platform to analyze the natural frequency of OWTs under long-term cyclic loading. The study first validated the numerical model’s effectiveness through comparison with measured data; a degradation stiffness model (DSM) was then embedded to assess how prolonged cyclic loading affects the degradation of foundation stiffness. A series of parametric studies were conducted in medium-dense and dense sand layers to investigate natural frequency alterations induced by prolonged cyclic loading. Finally, a simplified method for evaluating long-term natural frequency changes was established, and a 3.6 MW offshore wind turbine case was used to reveal the evolution characteristics of its natural frequency under long-term cyclic loads. The data reveal that the natural frequency of the structure undergoes a downward tendency as cyclic loading and frequency increase. To ensure long-term safe operation, the designed natural frequency should preferably shift toward 3P (where P is the blade rotation frequency).

1. Introduction

Driven by the continuous depletion of hydrocarbon resources, the international energy market is shifting toward eco-friendly and renewable energy solutions. Offshore wind energy is a clean and sustainable source. It has obtained extensive attention from all over the world because of the high availability. The global installation of offshore wind turbines is 32.5 GW in total by the end of 2020. However, by 2030 the global installation capacity will reach up to 234 GW.
A marked sensitivity to dynamic loading is characteristic of offshore wind turbine structures. Consequently, to prevent resonance with dynamic loads, special heed ought to be paid to the natural frequency of the wind turbine generator structure during the design process. For this reason, conventional design guidelines stipulate that the natural frequency of the supported structure should fall within the “soft–stiff” range [1,2], namely between 1P and 3P. Here, 1P is induced by mass imbalance issues, while 3P corresponds to the frequency of the shadowing effect. Due to the narrow scope of the soft–stiff range, the design natural frequency of wind turbine structures must meet stringent requirements, as illustrated in Figure 1. In the offshore wind farms, waves and wind are the predominant loading. The cyclic loading will have a remarkable effect on the foundation stiffness. The natural frequency of OWT will be induced to change by the variation of foundation stiffness. If the natural frequency is changed to be closed to 1P or 3P, the structure will resonate with the wave or wind, and even collapse.
The calculation of the natural frequency of offshore wind turbine structures has long been a focal point in research circles, with the aim of refining existing evaluation methodologies. Zaaijer [3] introduced a simplified analytical method to analyze the dynamic characteristics of offshore wind turbine monopiles and the influence of foundation stiffness on natural frequency. Byrne [4] developed a simplified calculation method considering soil–pile interaction, modeling it with a rotational soil spring and lumping the inertial effects of the top structure and blades into a rigid mass point. Bhattacharya et al. [5] accurately simulated soil–pile interaction using horizontal and rocking stiffness springs, equivalenting the tower to an Euler–Bernoulli beam, and validated the method’s effectiveness through model tests and numerical calculations. Arany et al. [6] used three coupled soil springs to improve calculation accuracy. While these methods are simple and easy to operate, determining foundation stiffness springs remains complex. Therefore, Andersen et al. [7] and Darvishi et al. [8] calculated natural frequencies based on p-y curve and Winkel spring models. Employing coupled springs to model the foundation, Yu et al. [9] developed a Rayleigh–Ritz solution for deriving high-order natural frequencies and mode shapes of monopile offshore wind turbines. Nevertheless, these methods fail to consider the nonlinear changes in soil stiffness induced by cyclic loading.
However, the offshore wind turbine structures are in the special loading conditions. The supported structure would be often pushed by cyclic loading such as wind and waves during its operation period [10]. In addition, it will encounter the threat of extreme loadings such as storms and earthquakes, that will lead to the variation of soil parameters and characteristics. Shi et al. [11] examined how nonlinearity in soil–pile interaction affects the natural frequency of offshore wind turbine units and pointed out that the nonlinear strain of soil around pile will have a remarkable effect on the natural frequency. Additionally, Bakhti et al. [12] found that natural frequency correlates closely with soil–pile interaction state. To account for the effect of long-term cyclic loading on soil, Achmus et al. [13] and Chong et al. [14,15] revealed the influence of this load on the soil parameters around the pile by establishing a numerical model of a single pile. Cuéllar et al. [16,17] and Li et al. [18] carried out the monopile model tests to investigate soil deformation around the monopile under cyclic loading. They found that the soil around the pile caused subsidence during the early number of cyclic, after which the convective motions of soil particles would occur. Therefore, during the operation of offshore wind turbines, cyclic lateral loading causes the variation of soil important parameters such as modulus, density, and so on. Hence, in OWT design, notably, soil parameter fluctuations lead to natural frequency variations in OWT, a key deviation factor [19]. Lombardi et al. [20] and Bhattacharya et al. [21] explored how changes in soil parameters affect the natural frequency of wind turbine structural systems, drawing on model tests of cyclic loading on offshore wind turbines; they indicated that the maximum deviation of natural frequency reached 30% by cyclic loading. Furthermore, findings reveal that the soil around the monopile imposes a notable impact on the natural frequency of the wind turbine structure, but the number of cyclic loadings is far less than 108. Carswell et al. [22] used the p-y curve model to simulate nonlinear soil–pile interaction, with a focus on the effects of varying clay stiffness on the natural frequency of OWT structures. They noted that when the stiffness of clay diminishes, the overall natural frequency of the OWT system tends to move closer to the 1P harmonic. Arany et al. [23] highlighted that natural frequency deviation constitutes the primary factor inducing structural resonance in offshore wind turbines. However, systematic analysis of how cyclic loading affects OWT natural frequency is lacking.
In conclusion, quick natural frequency calculation for OWT is achievable via certain methods. When considering the effect of soil–pile interaction, the natural frequency of OWT is less than not considering the effect of soil–pile interaction, so when the foundation stiffness is changed, the natural frequency will be also changed, and the maximum deviation reaches 30%. Assessment of how sustained cyclic loads alter OWT natural frequency remains unaddressed in existing methods.
For OWT structural design, quantifying how persistent cyclic loading alters natural frequency is a critical focus of this research, but little research has been conducted in this area. FLAC3D-based integration of a soil degradation stiffness model enables investigation into amplitude/cycle-dependent vibration characteristics of the monopile offshore wind energy conversion system. Convergence of numerical data with established simplified methods yields a novel framework for evaluating long-term cyclic load impacts on structural dynamics. Finally, under the condition of long-term cyclic loading, the characteristic vibration value of 3.6 MW offshore wind energy conversion systems is evaluated using the proposed method.

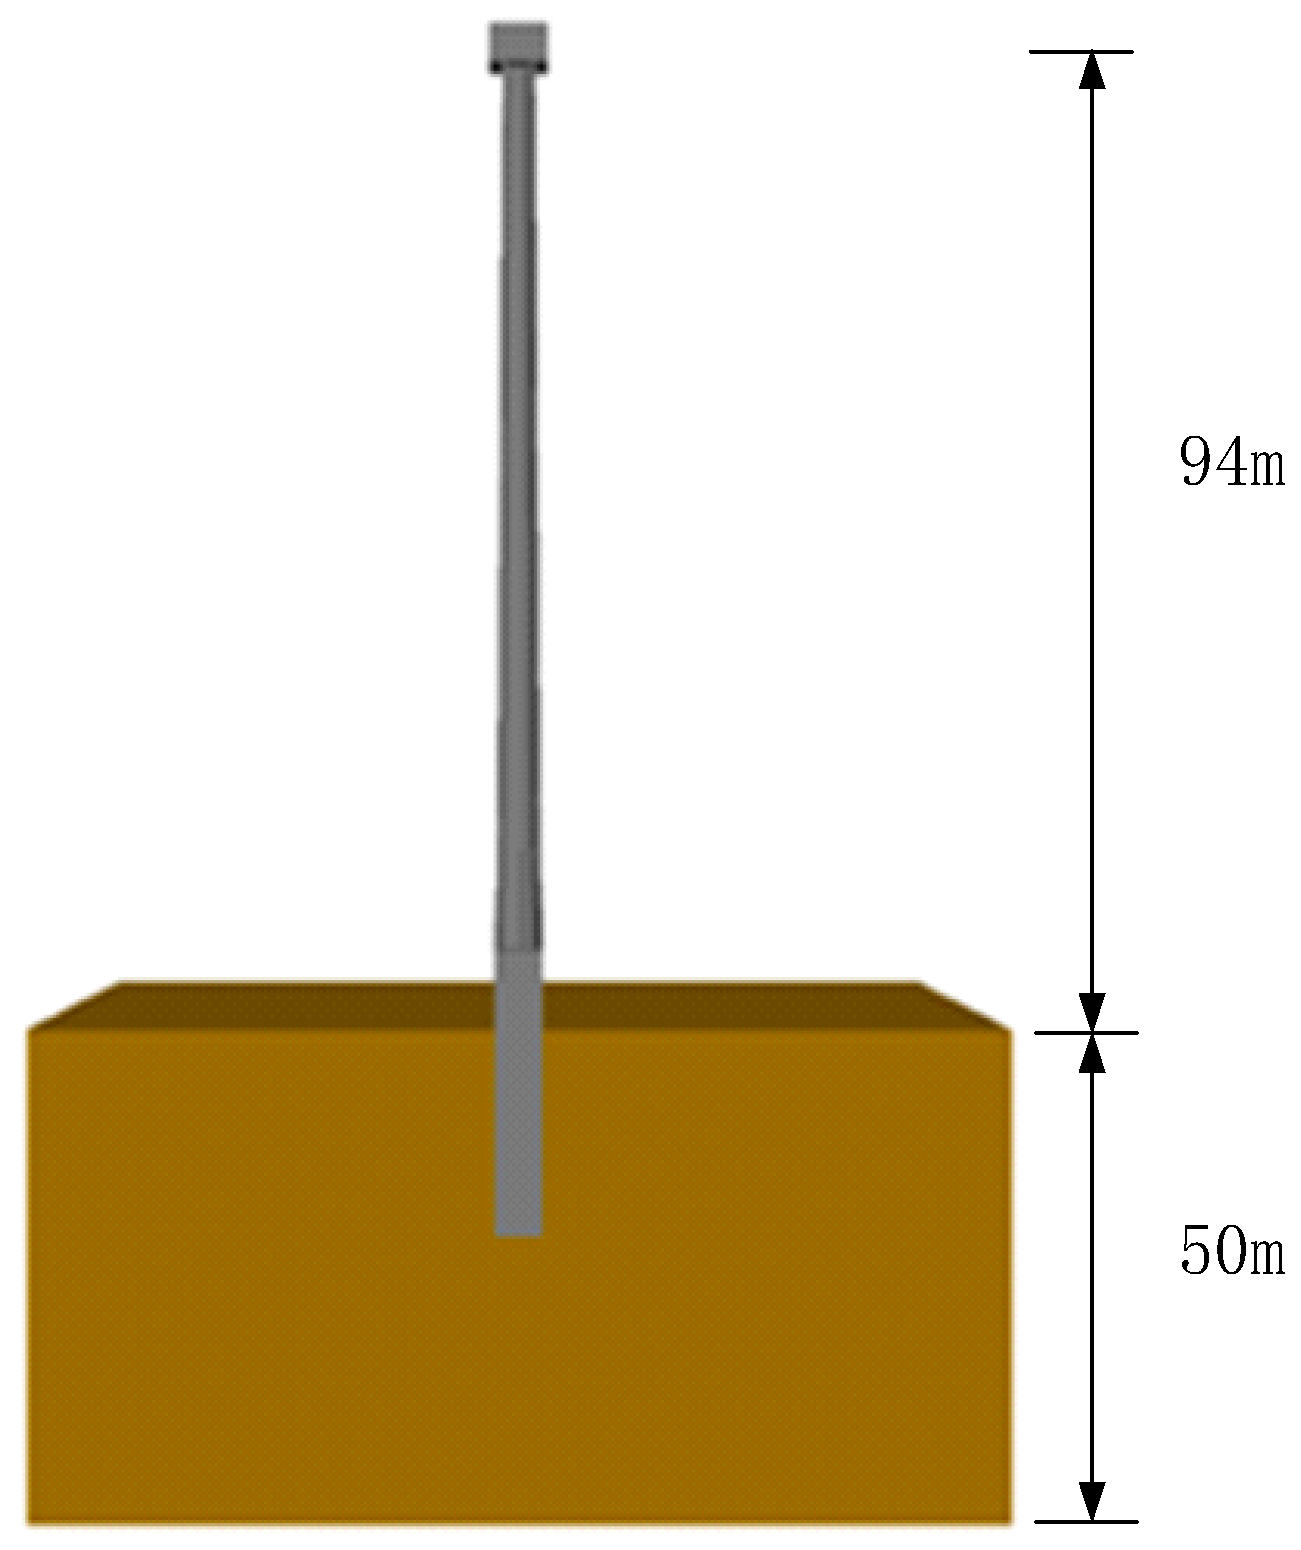
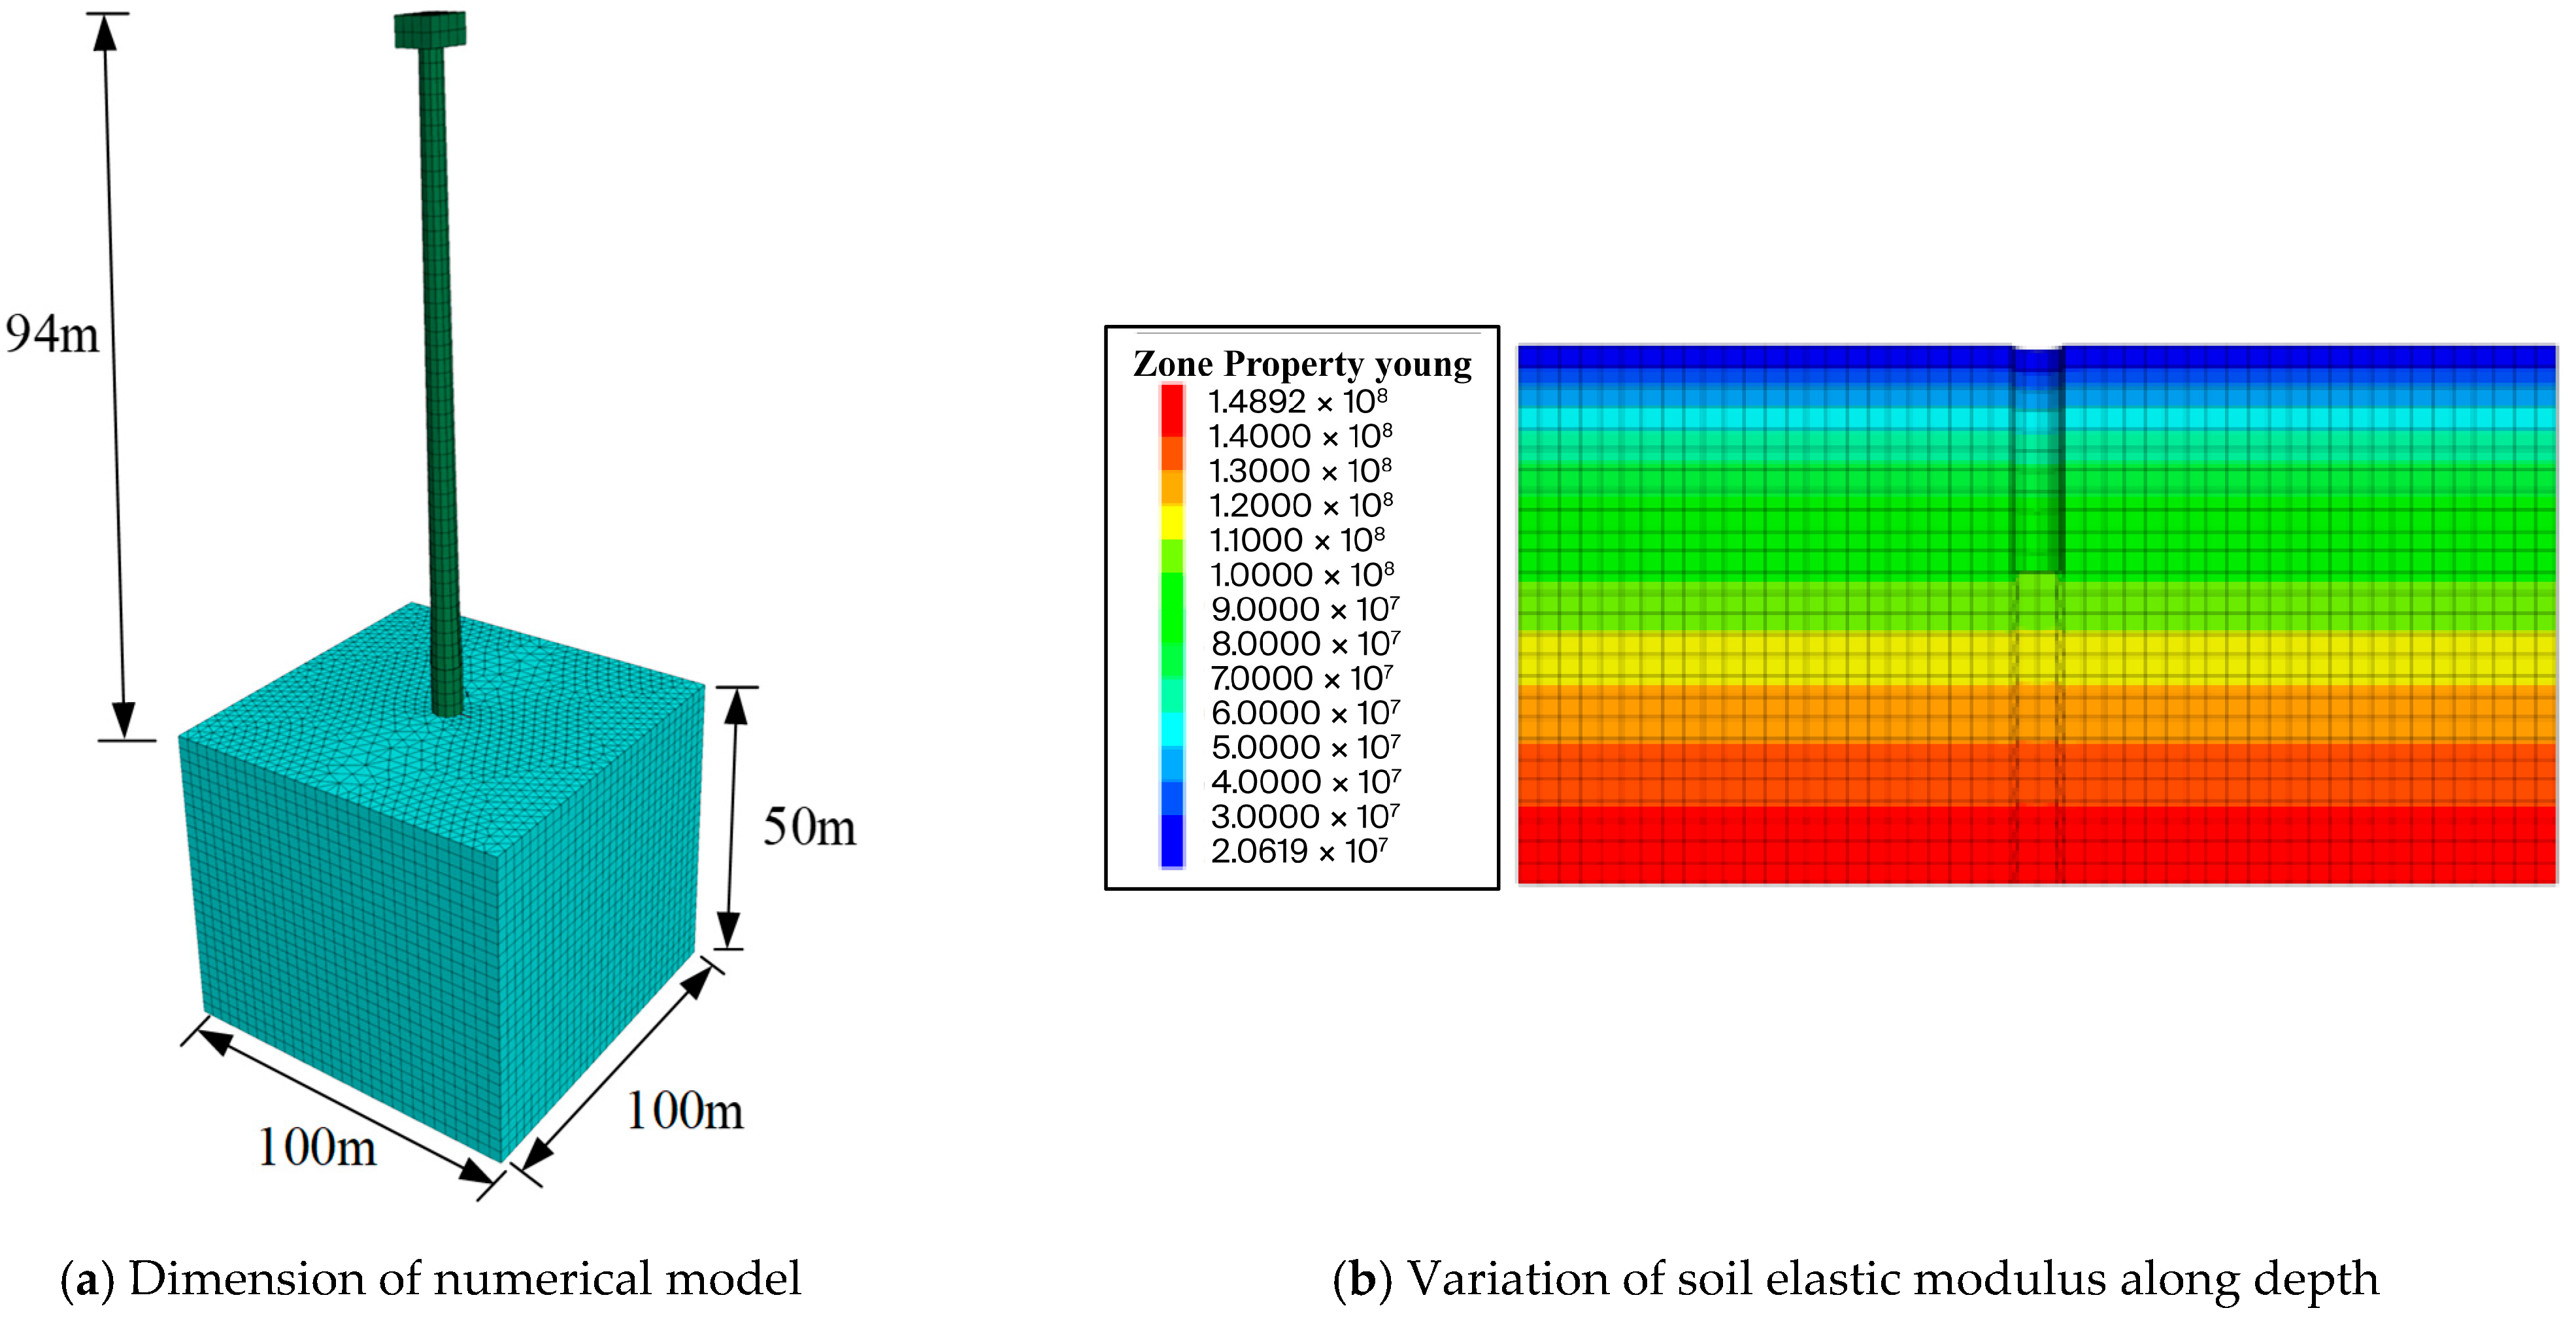
2. Numerical Modelling

In this study, the validity and parameters of the numerical model were validated in FLAC3D by calibrating the numerical outputs against field measurements. Then the soil degradation stiffness model was employed to reflect the effect of long-term cyclic loading in the numerical model.

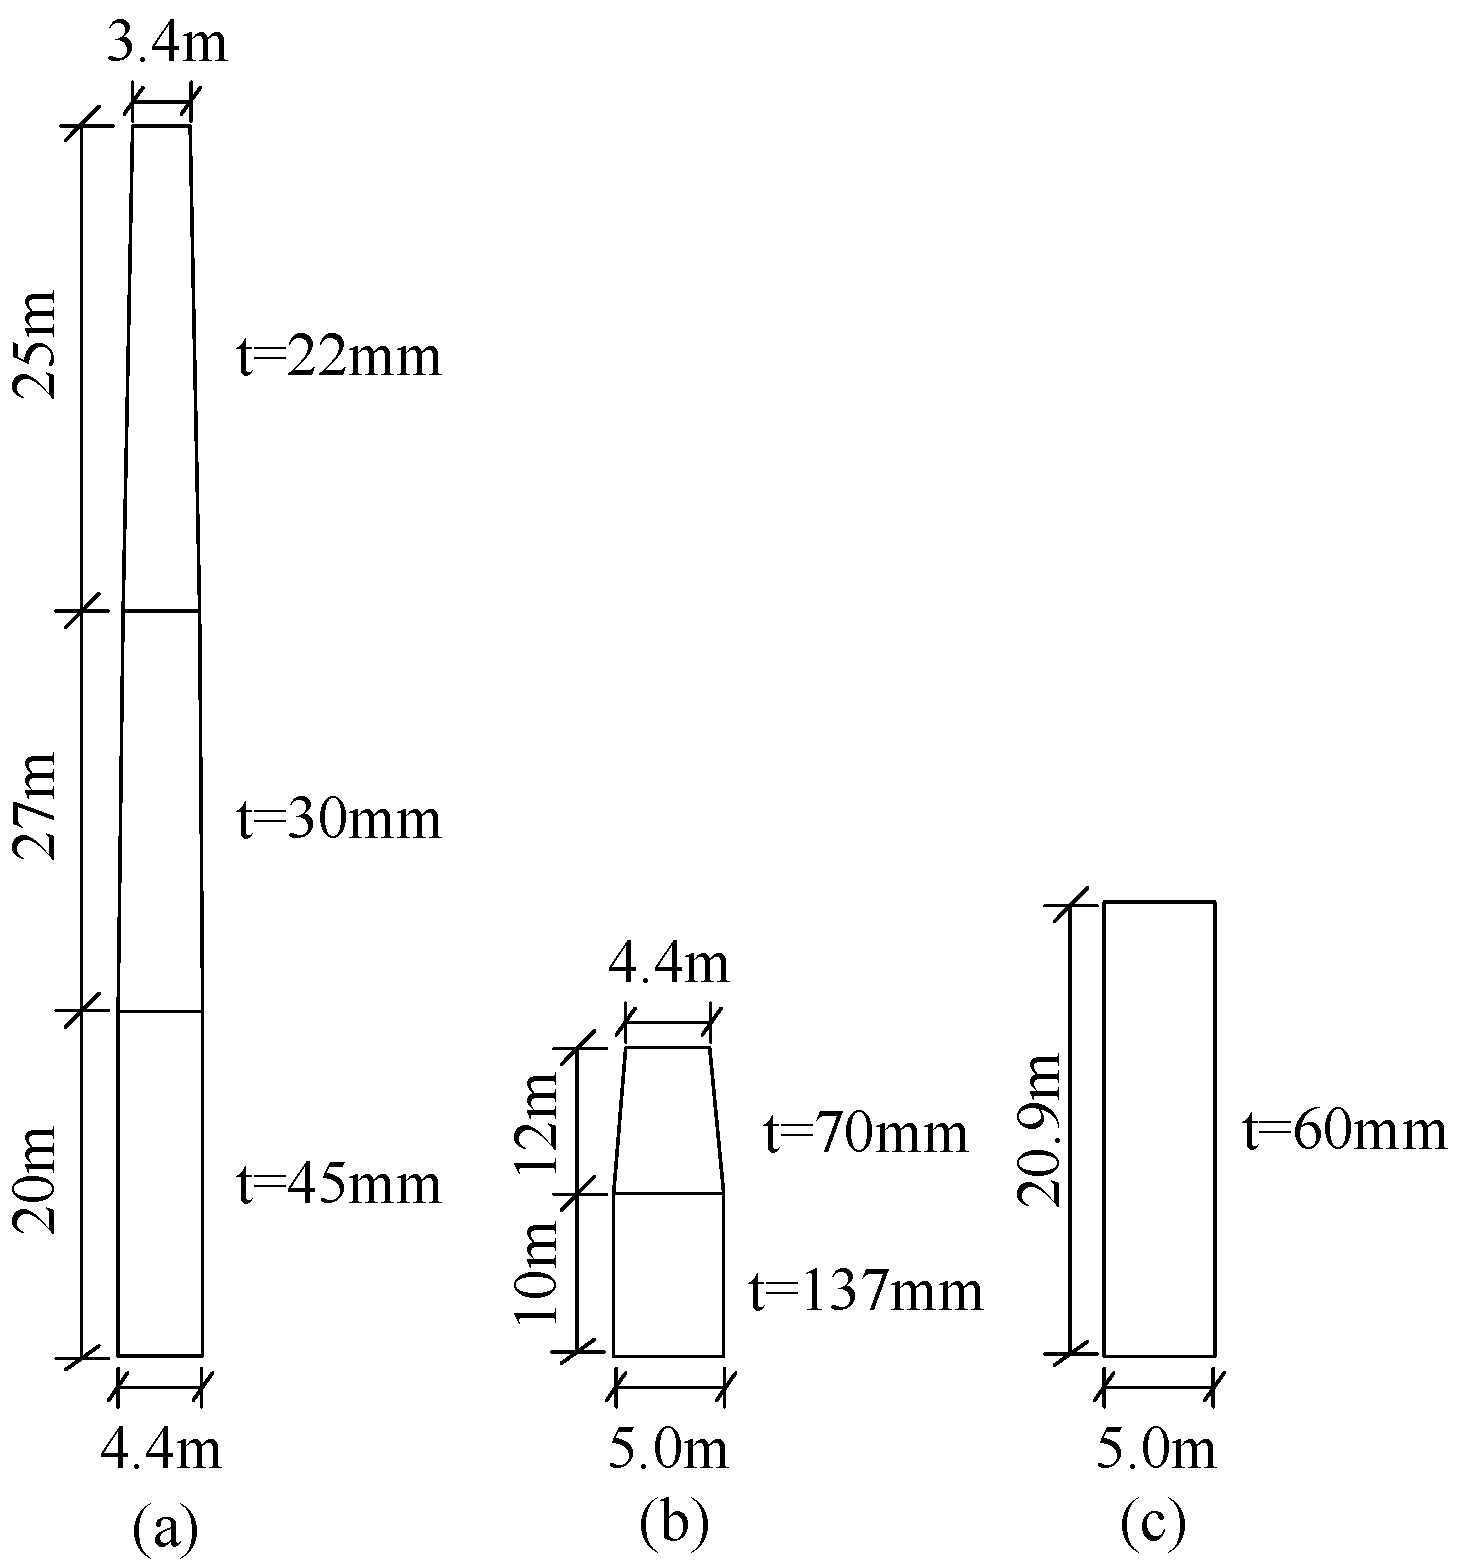
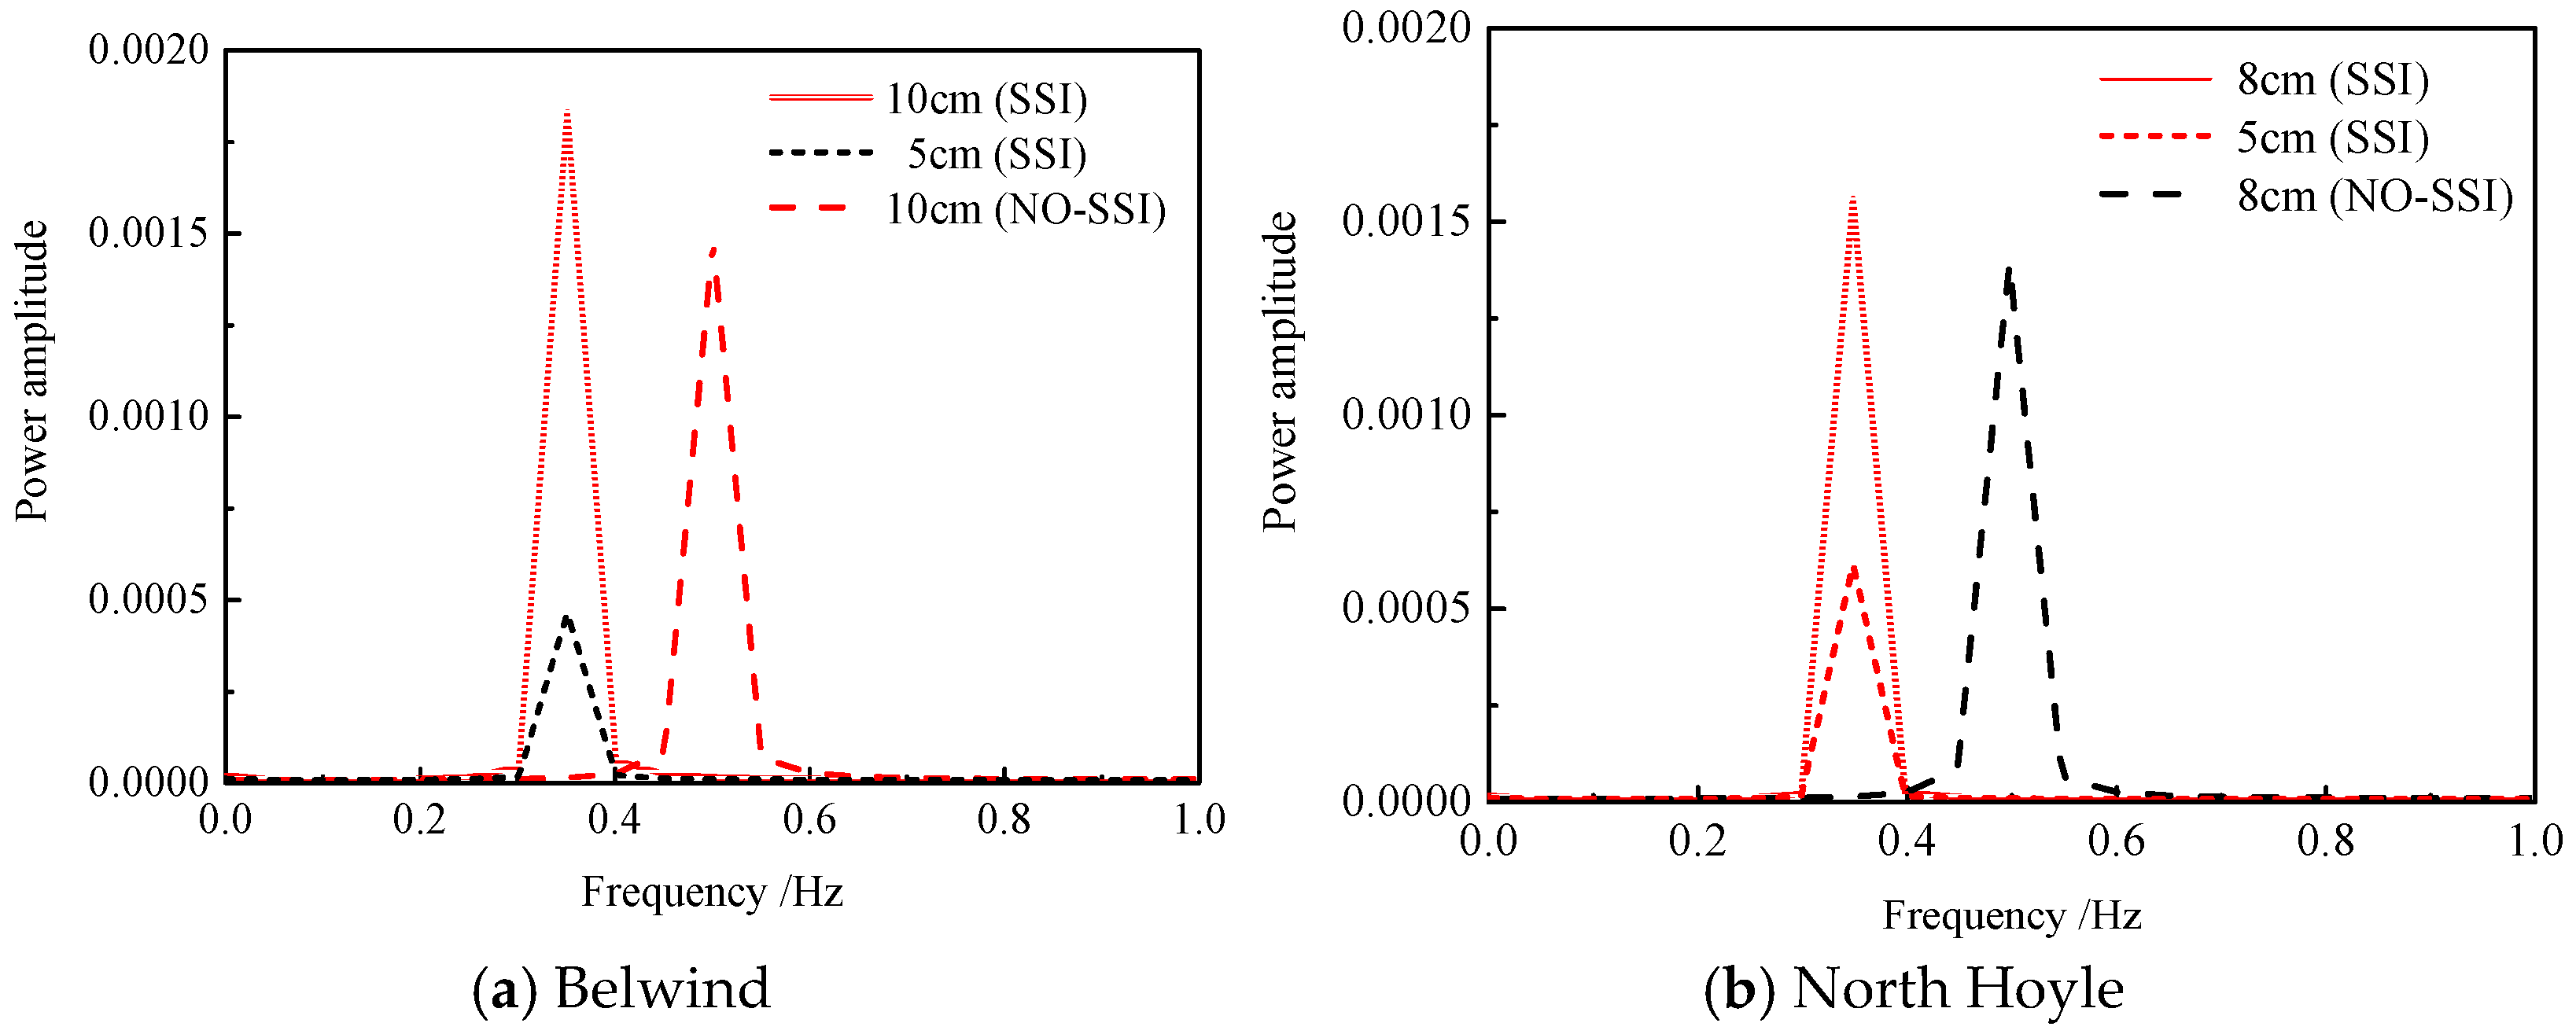
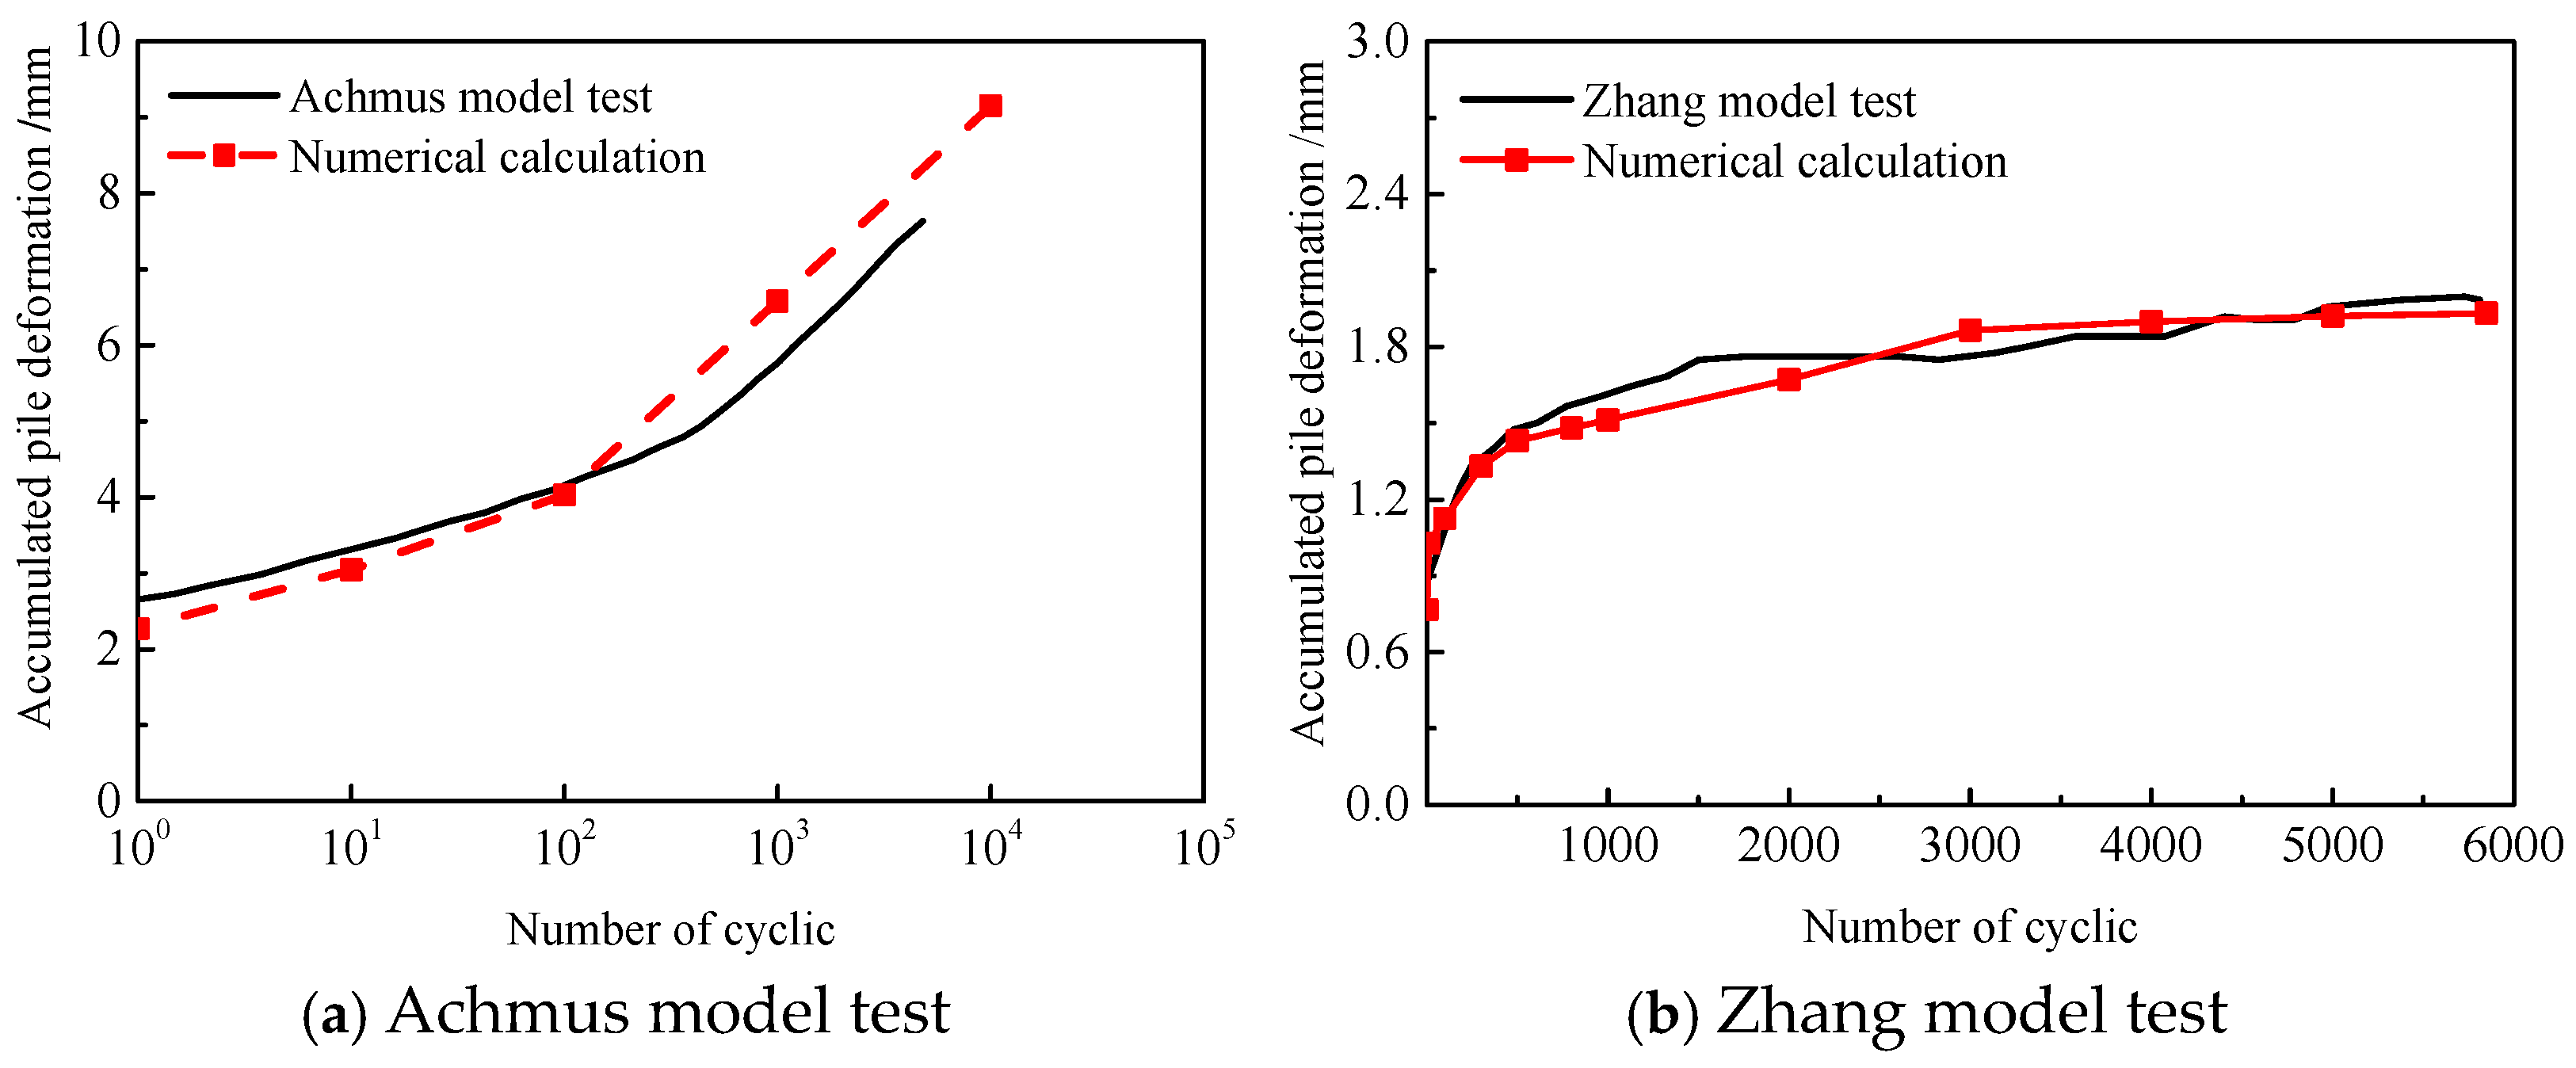
2.1. Validation of the Basic Model

FLAC3D was employed to build the numerical model. In this model, soil is treated as an elastoplastic material using the Mohr–Coulomb failure criterion. Soil–pile interaction is simulated using interface elements, whose friction and cohesion are 60% of the soil parameters [13]. This study is focused on the effect of soil–pile interaction and soil nonlinear on the natural frequency, so pile and structure are assumed to be linear and elastic. The damping of structure is only considered 1.5% [24], but aerodynamic damping or other damping are not considered in this model. Janbu [25] derived how soil relative density impacts its elastic modulus using soil unit volume tests across different stress states. Duncan et al. [26] proposed an equation to reflect soil elastic modulus in the different stress state by reviewing these experimental results. Equation (1) was used to obtain the elastic modulus at different depths in the numerical model. The boundary condition is a fixed boundary.
E 0 = k σ a t σ 3 σ a t λ
σ 3 = K 0 γ z
where E0 is the initial elastic modulus of the soil (kPa). Coefficients k, λ, and n are defined by sandy soil relative density functions, while σ3 denotes soil minimum principal stress (kPa), and σat represents atmospheric pressure with a value of 105 kPa. z is the soil depth (m). K0 denotes the coefficient of lateral earth pressure at rest.
Monopile is the common foundation in the offshore wind farm, so the primary objective here was to analyze the natural frequency of monopile-supported offshore wind turbines. Specifically, this study calculated the natural frequency of a Vestas 3 MW turbine at the Belwind wind farm. Hub height is 94 m, and the transition section is 22 m. Density of the tower structure is 8500 kg·m−3. The dimension of the monopile foundation is 5 m in diameter, 60 mm in wall thickness, and 20.9 m in embedment depth. The density of the monopile is 7800 kg·m−3, and the elastic modulus is 210 GPa. Figure 2 shows all the specific parameter details. The specific parameters of this wind turbine were presented in Refs. [27,28]. Site soil condition is mainly sand. Soil depth 0–15 m is sand, and the angle of internal friction is 40°. Soil depth 15–17 m is clay, and the ultimate resistance is 175 kPa. Soil depth 17–26 m is sand, and the angle of internal friction is also 40°.
Based on the above parameters of structure and soil, which is as shown in Figure 3. The dimension of soil site is 100 m × 100 m × 50 m. The overall natural frequency of offshore wind turbine structures was computed using the numerical model established above. A sensitivity analysis of mesh size is conducted to obtain the well mesh. The numerical model is shown in Figure 4a. Wedge grid is used to create soil, and the number of mesh is 44,172. A brick grid serves as the basis for creating the wind turbine structure, and the sum of mesh is 1056. The detail model is shown in Figure 4.
The free vibration method was employed to derive the natural frequency. First, lateral displacements of 10 cm and 5 cm were imposed at the tower’s top, respectively. Subsequently, the tower top was released so as to capture the dynamic response displacement of the structure at the tower’s top, with the natural frequency calculated as the tower base being fixed, as shown in Figure 5. Following FFT processing of Figure 5a, the derived tower-top response power spectrum (Figure 6a) reveals a structural natural frequency of 0.353 Hz. This outcome arises because the soil surrounding the monopile remains elastic, exhibiting no plastic deformation. The foundation stiffness is the same, so the calculated natural vibration period is the same. In addition, the natural frequency of the tower-bottom fixing is 0.502 Hz.
Another computation was carried out to further verify the effectiveness of the numerical model established above. Using this model, the natural frequencies of offshore wind turbines at the North Hoyle Wind Farm were determined. The parameters of the pile are as follows: The pile diameter is 4 m and the buried depth is 33 m, and the wall thickness is 50 mm. The blades and turbine are modeled as a 100-ton concentrated mass. The tower features a total height of 67 m, with a top diameter of 2.3 m, a bottom diameter of 4 m, and a wall thickness of 35 mm. The transition section has an overall height of 7 m, a diameter of 4 m, and a wall thickness of 50 mm [29]. The elastic modulus and density of the tower, pile, and transition section match those used in the previous calculation. In addition, the soil site condition is also mainly dense sand, so the soil parameters are still referring to Table 1.
The same method was used to calculate the natural frequency. Displacement loads of 8 cm and 5 cm were imposed at the tower’s top, respectively. The loads were then removed, allowing the structure to vibrate freely. A time–history of dynamic response is generated, corresponding to Figure 5b, while the power spectrum is presented in Figure 6b. As shown above, the natural frequency is 0.349 Hz, while that linked to tower-top fixing stands at 0.494 Hz.
The comparison between the numerical results and the measured data from the study by Shirzadeh et al. [28] is presented in Table 1. This measurement is conducted at the Belwind wind farm. Ten sensors in total were used to collect measurements at four levels across nine locations. Data acquisition proceeds continuously, with data transmitted to the onshore server every 10 min. The long-term measured results are used to evaluate the results of calculated method. It can be noted from Table 1. When the tower-bottom is fixed, the errors between measured data and calculated results are great. Nevertheless, upon taking soil–pile interaction into account, the discrepancies in both cases are found to be around 2.0%, indicating a notable improvement in accuracy. Research indicates that soil–pile interaction should be taken into account when calculating natural frequencies. At the same time, it is verified that the established numerical model is very effective in this study, so the numerical calculated method is used to obtain the natural frequency in the following study.

2.2. Soil Degradation Stiffness Model

Cyclic loads such as wind and waves bring about variations in the deformation behavior of soil adjacent to the pile. Little et al. [29] and Long et al. [30] performed cyclic loading pile tests to investigate cyclic deformation characteristic of soil around the pile and proposed an exponential function to describe how the modulus of soil reaction for the soil surrounding the pile relates to the number of cyclic loading cycles, but the relevant parameters are complicated to obtain. Huurman [31] conducted soil cyclic triaxial tests to study variation of soil degradation secant stiffness under long-term cyclic loading. An exponential function of secant degradation modulus was obtained with the number of cyclic, as follows.
E s N E s 1 = N a X b
X = σ 1 , c y c σ 1 , s f
Here, EsN denotes the soil secant modulus following the Nth cycle (kPa), while Es1 represents the soil secant modulus after the first cycle, N is the number of cyclic, a and b are the parameters of exponential degradation function (dense sand: a = 0.20 and b = 5.76, medium-dense sand: a = 0.16 and b = 0.38) [32,33], X represents the ratio of cyclic stresses, σ1,cyc stands for the maximum principal stress under cyclic stress conditions (kPa), and σ1,sf characterizes the maximum principal stress when static failure occurs (kPa).
In order to apply Equations (3) and (4) to analyze the soil cyclic characteristic, Achmus et al [13] proposed a characteristic cyclic stress ratio Xc, which is defined as Equation (5).
X c = X 1 X 0 1 X 0
The rate of soil secant modulus is determined by the relative density of soil and the characteristic cyclic stress ratio. Achmus et al. [13] found that for sandy soil, an increase in its relative density leads to a decrease in the secant modulus rate, while an increase in the cyclic stress ratio results in an increase in the secant modulus rate. It is noted that the soil secant modulus degrades significantly in the state of high characteristic cyclic stress ratio. Offshore wind turbine structures have an extremely low natural frequency, which is close to the dynamic loading frequency, but the safety redundancy region of its natural frequency is small in the design, so the degradation of the soil secant modulus should be taken into account in the design of the offshore wind turbine. The flow diagram of this process is shown in Figure 7.
FLAC3D is a general geotechnical analysis software of finite difference principle and is equipped with the friendly pre-processing and post-processing interfaces. There are no special requirements for the performance of the computer. The calculation is convenient and can effectively consider the problem of large deformations. It has been widely applied in the analysis of rock and soil deformation. FLAC3D 3.0 is employed to conduct this study.
By applying Fish programming functions in FLAC3D 3.0, the numerical model incorporates the calculation method for soil degradation to analyze the effects of long-term cyclic loading.
The degradation stiffness numerical model’s performance was validated by comparing its calculated results with the pile cyclic test data from Kuo et al. [34] and Zhang et al. [35]. These comparisons are presented in Figure 8. Clearly, the model can accurately capture the pile’s accumulated deformation and the soil’s cyclic characteristics under cyclic loading.

3. Effect of Cyclic Loading

The numerical model established above was utilized to perform a set of numerical calculations. The numerical results were analyzed to examine how cyclic amplitude and cycle count affect the natural frequency of offshore wind turbine structures. Subsequently, an empirical formula was put forward to describe how long-term cyclic loading impacts the natural frequency.

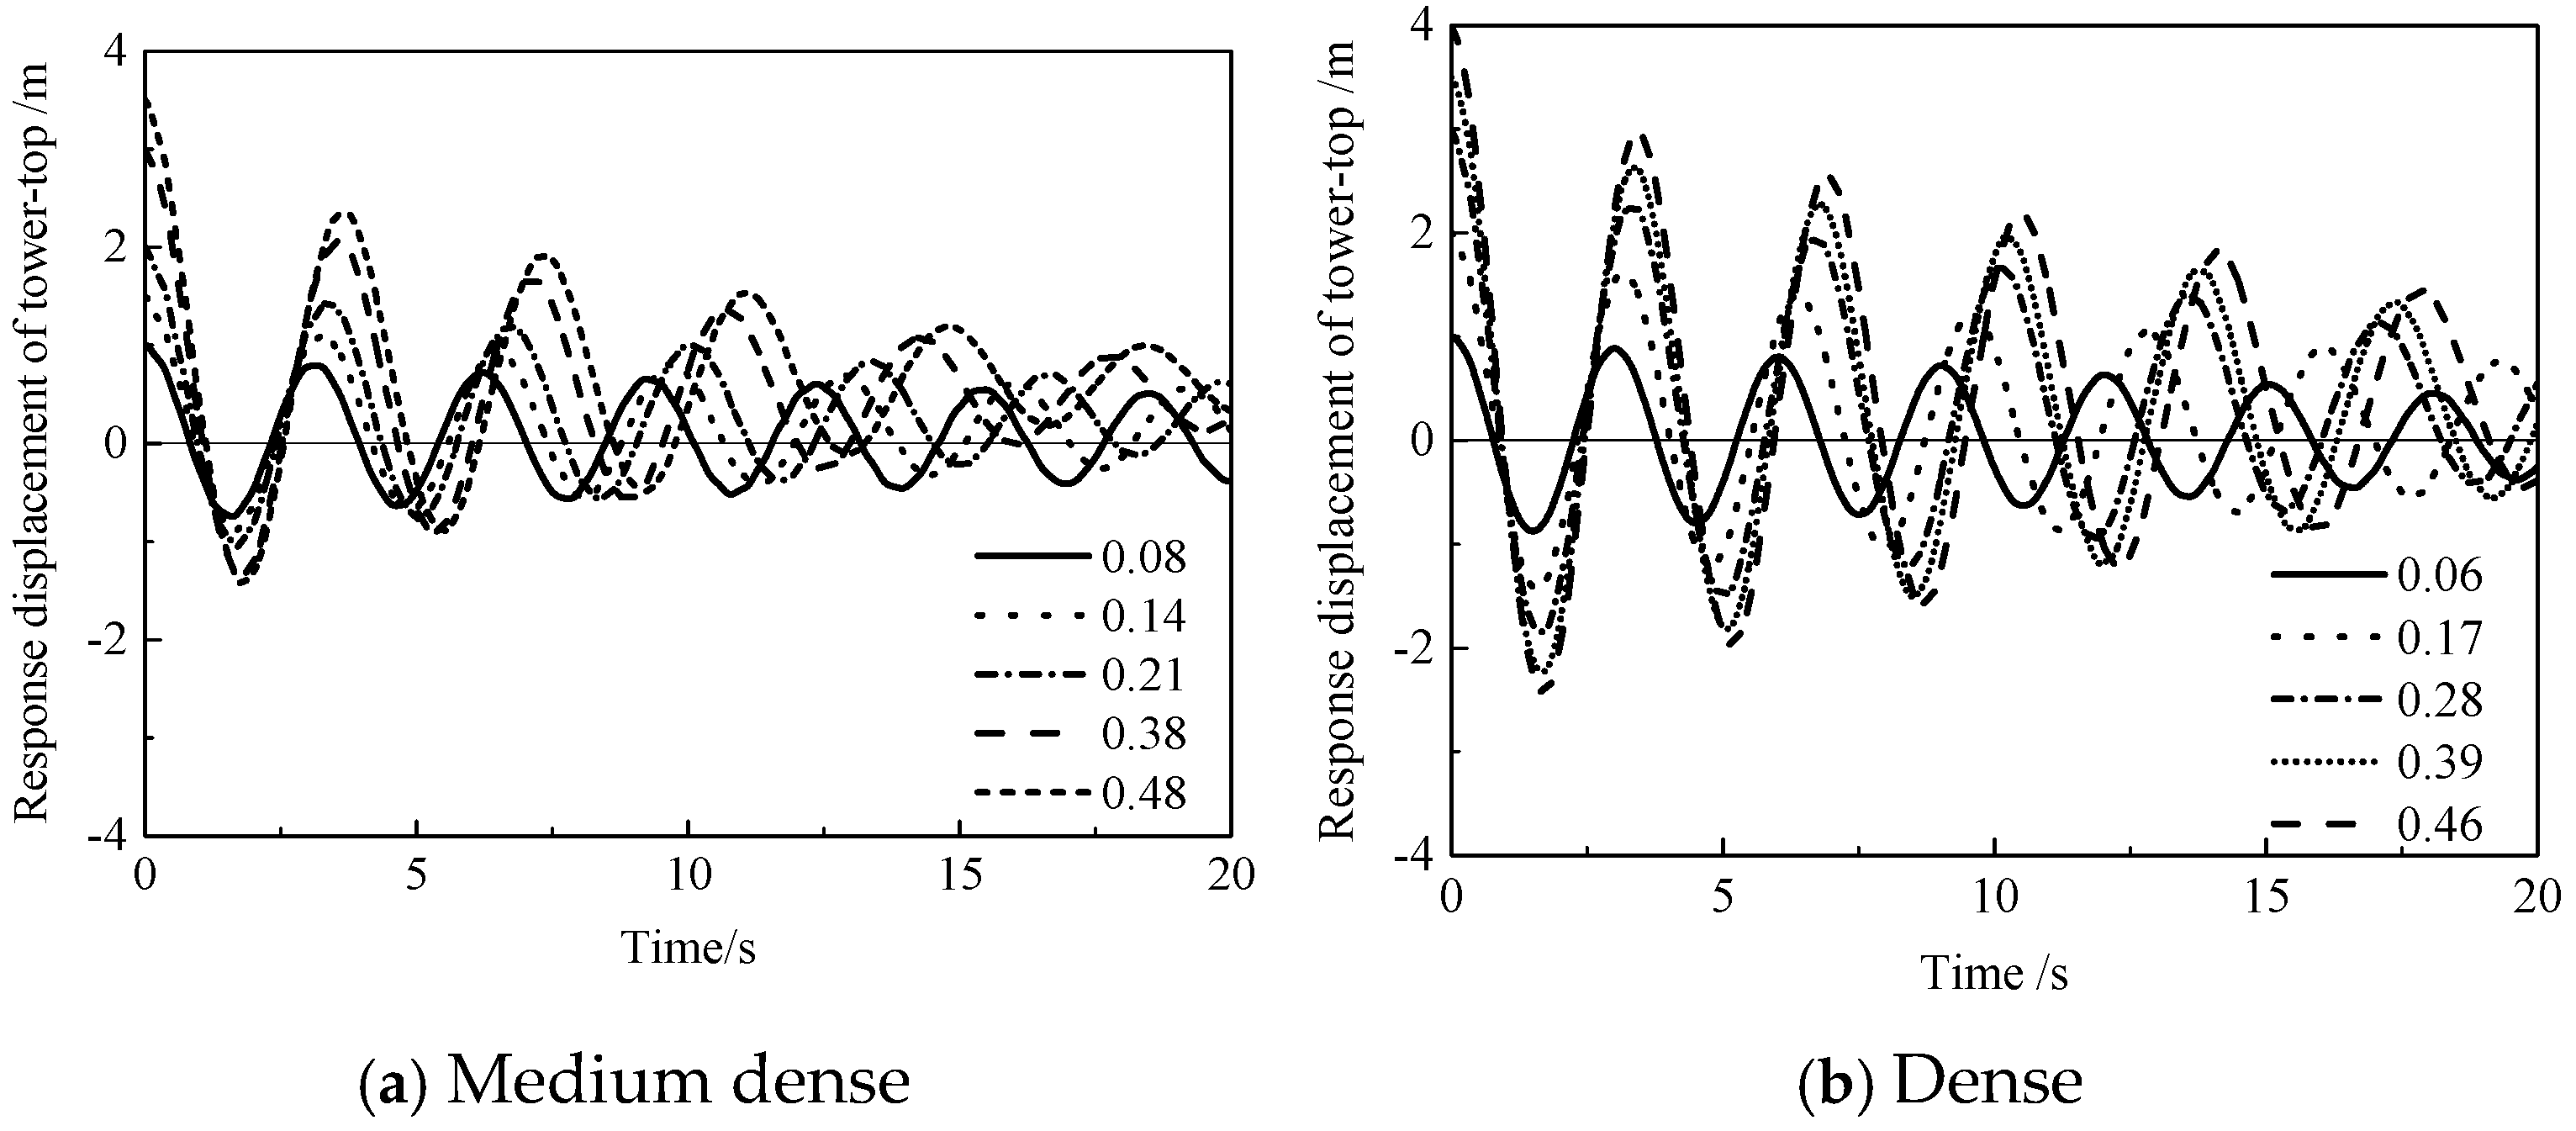
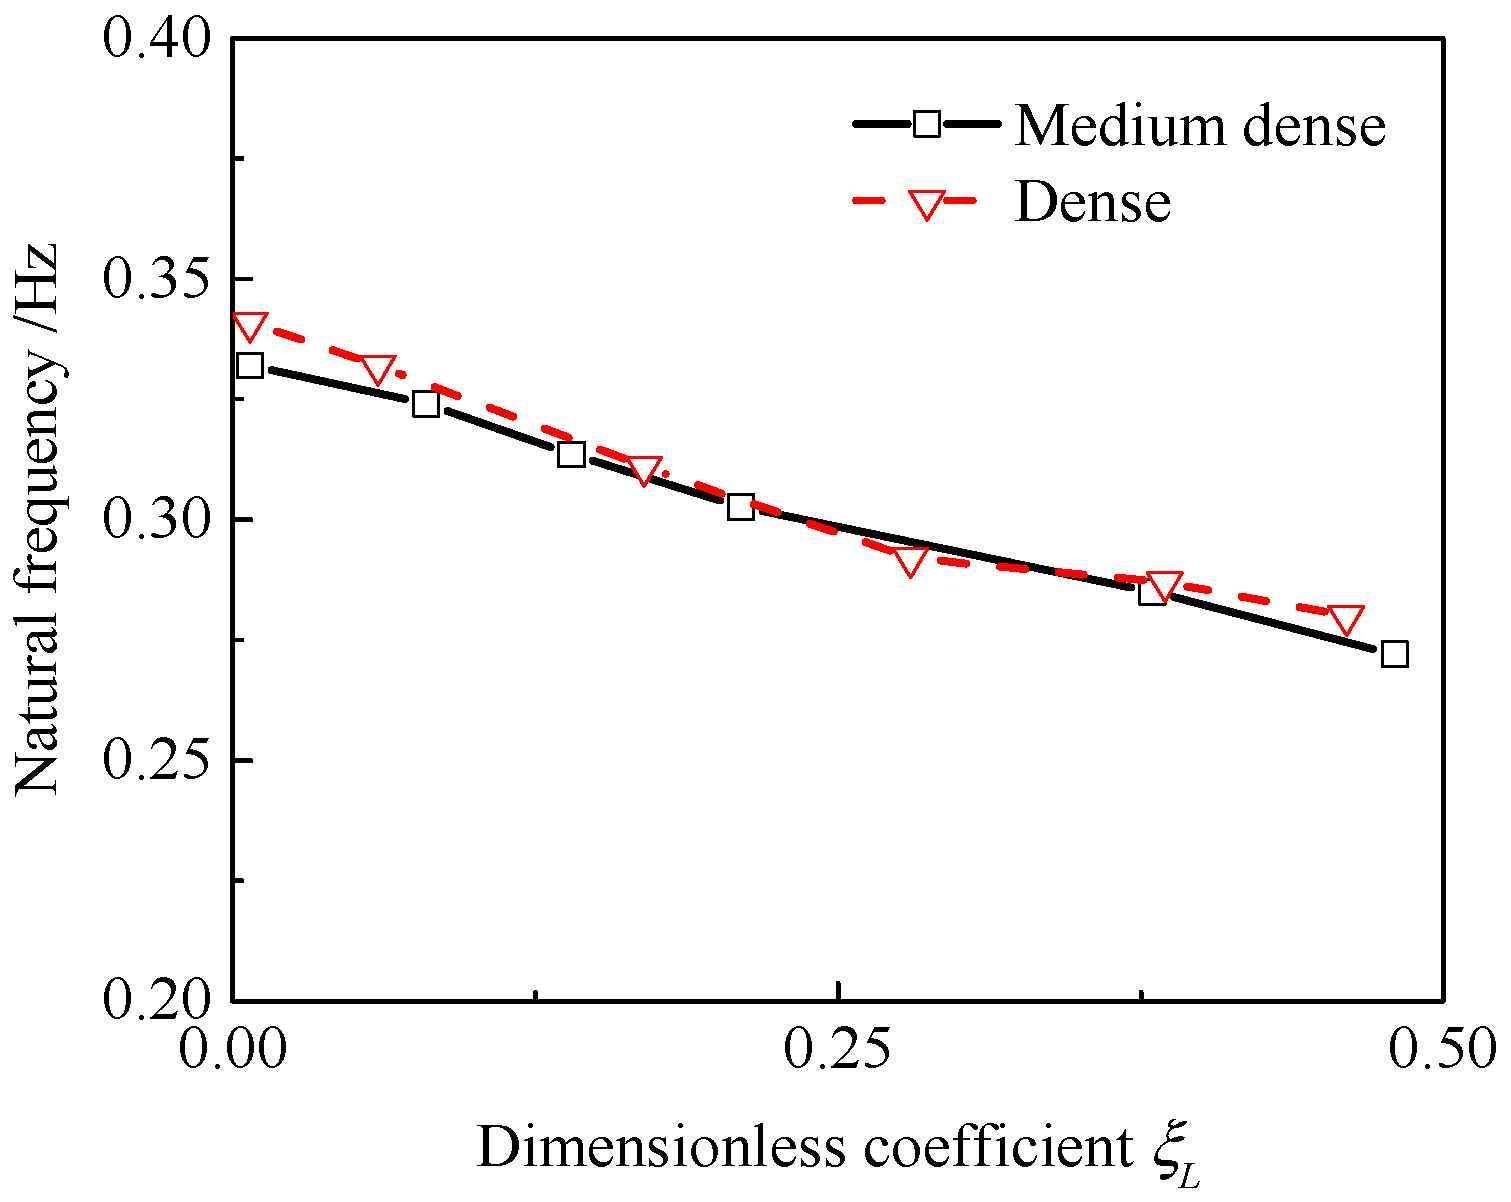
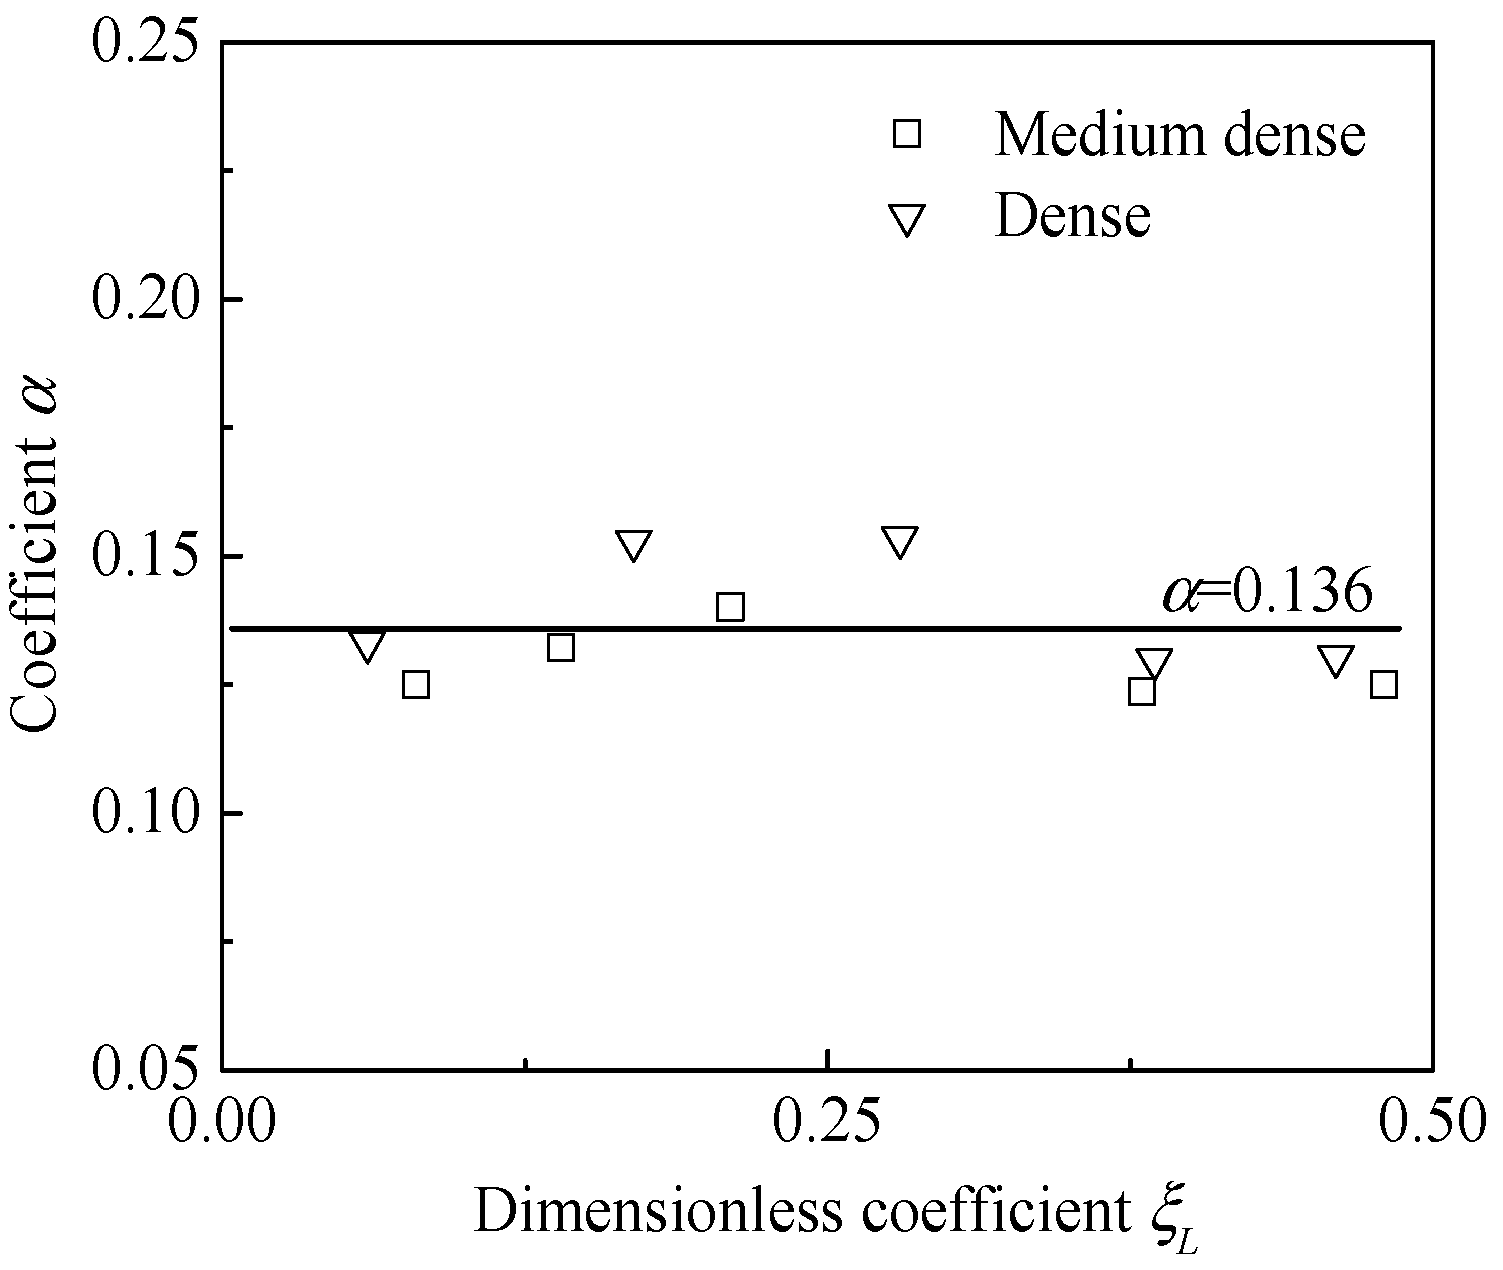
3.1. Amplitude of Cyclic Loading

To clearly demonstrate the impact of cyclic loading amplitude on the natural frequency, the dimensionless coefficient ξL was defined using Equation (6) to represent various cyclic loading amplitudes. As referenced in the work of Luo et al. [36] and Ahmed et al. [37], this equation defines the ultimate bearing capacity Su as the lateral load corresponding to a lateral displacement of 0.1D (where D denotes the pile diameter) at the pile’s mud surface. The accumulated deformation of the monopile is included in fatigue limit state or service limit state, so the maximum dimensionless coefficient ξL is about 0.47 [38,39].
ξ L = S c y c S u
where ξL is the dimensionless coefficient of the cyclic loading, Scyc represents the cyclic horizontal displacement amplitude at the pile’s mudline (m), and Su denotes the ultimate horizontal displacement capacity at the mudline (0.1D, D is the pile diameter).
In both medium sand and dense sand environments, how cyclic loading amplitude affects the natural frequencies of offshore wind turbine structures was examined. When the soil site was the medium-dense sand, the lateral displacement loadings of 1 m, 1.5 m, 2 m, 3 m, and 3.5 m were applied on the top of the wind turbine structures, respectively. Similarly, in the dense sand site, the lateral displacement loadings of 1 m, 2 m, 3 m, 3.5 m, 4 m were, respectively, applied to the wind turbine structures’ top. Then the structural displacement response results are shown in Figure 9. It can be seen that the structural displacement response period increases as the dimensionless coefficient of the cyclic loading increases. This means that as the dimensionless coefficient of cyclic loading increases, the natural frequency of offshore wind turbine structures decreases. The reasons lie in the fact that an increasing amplitude intensifies the pronounced nonlinearity of the surrounding soil and heightens cyclic stress characteristics. This indicates that the surrounding soil’s secant modulus degrades, ultimately shortening the structure’s response period. This trend is found in the soil cyclic tests conducted by Nikitas et al. [39].
Using the tower-top response displacement described earlier, the offshore wind turbine’s natural frequency was derived. Figure 9 illustrates how different cyclic loading amplitudes affect natural frequency. It can be seen that in medium-dense sand and dense sand, the structure’s natural frequency decreases linearly as the cyclic loading’s dimensionless coefficient increases. In other words, natural frequency declines as cyclic loading amplitude grows. The fitting function is obtained from Figure 10, as shown in Equation (7). When it is the service limit state, the dimensionless coefficient of cyclic loading is about 0.47 [40]. At this time the natural frequency is reduced by about 18%. ξL = 0.3 is the fatigue limit state [40]; at this point the natural frequency is reduced by about 13%.
f ξ L = f 0 α ξ L
where f0 is the natural frequency when the soil around pile is in an elastic state, fξL denotes the natural frequency when the dimensionless cyclic loading coefficient is ξL, and α quantifies how cyclic loading amplitude influences natural frequency.
To determine the coefficient α in Equation (7), we explored how cyclic loading’s dimensionless coefficient affects α, with the findings shown in Figure 11. It was indicated that coefficient α does not change with changing the dimensionless coefficient of cyclic loading. In other word the coefficient α is a constant value, which is 0.136 in this study.

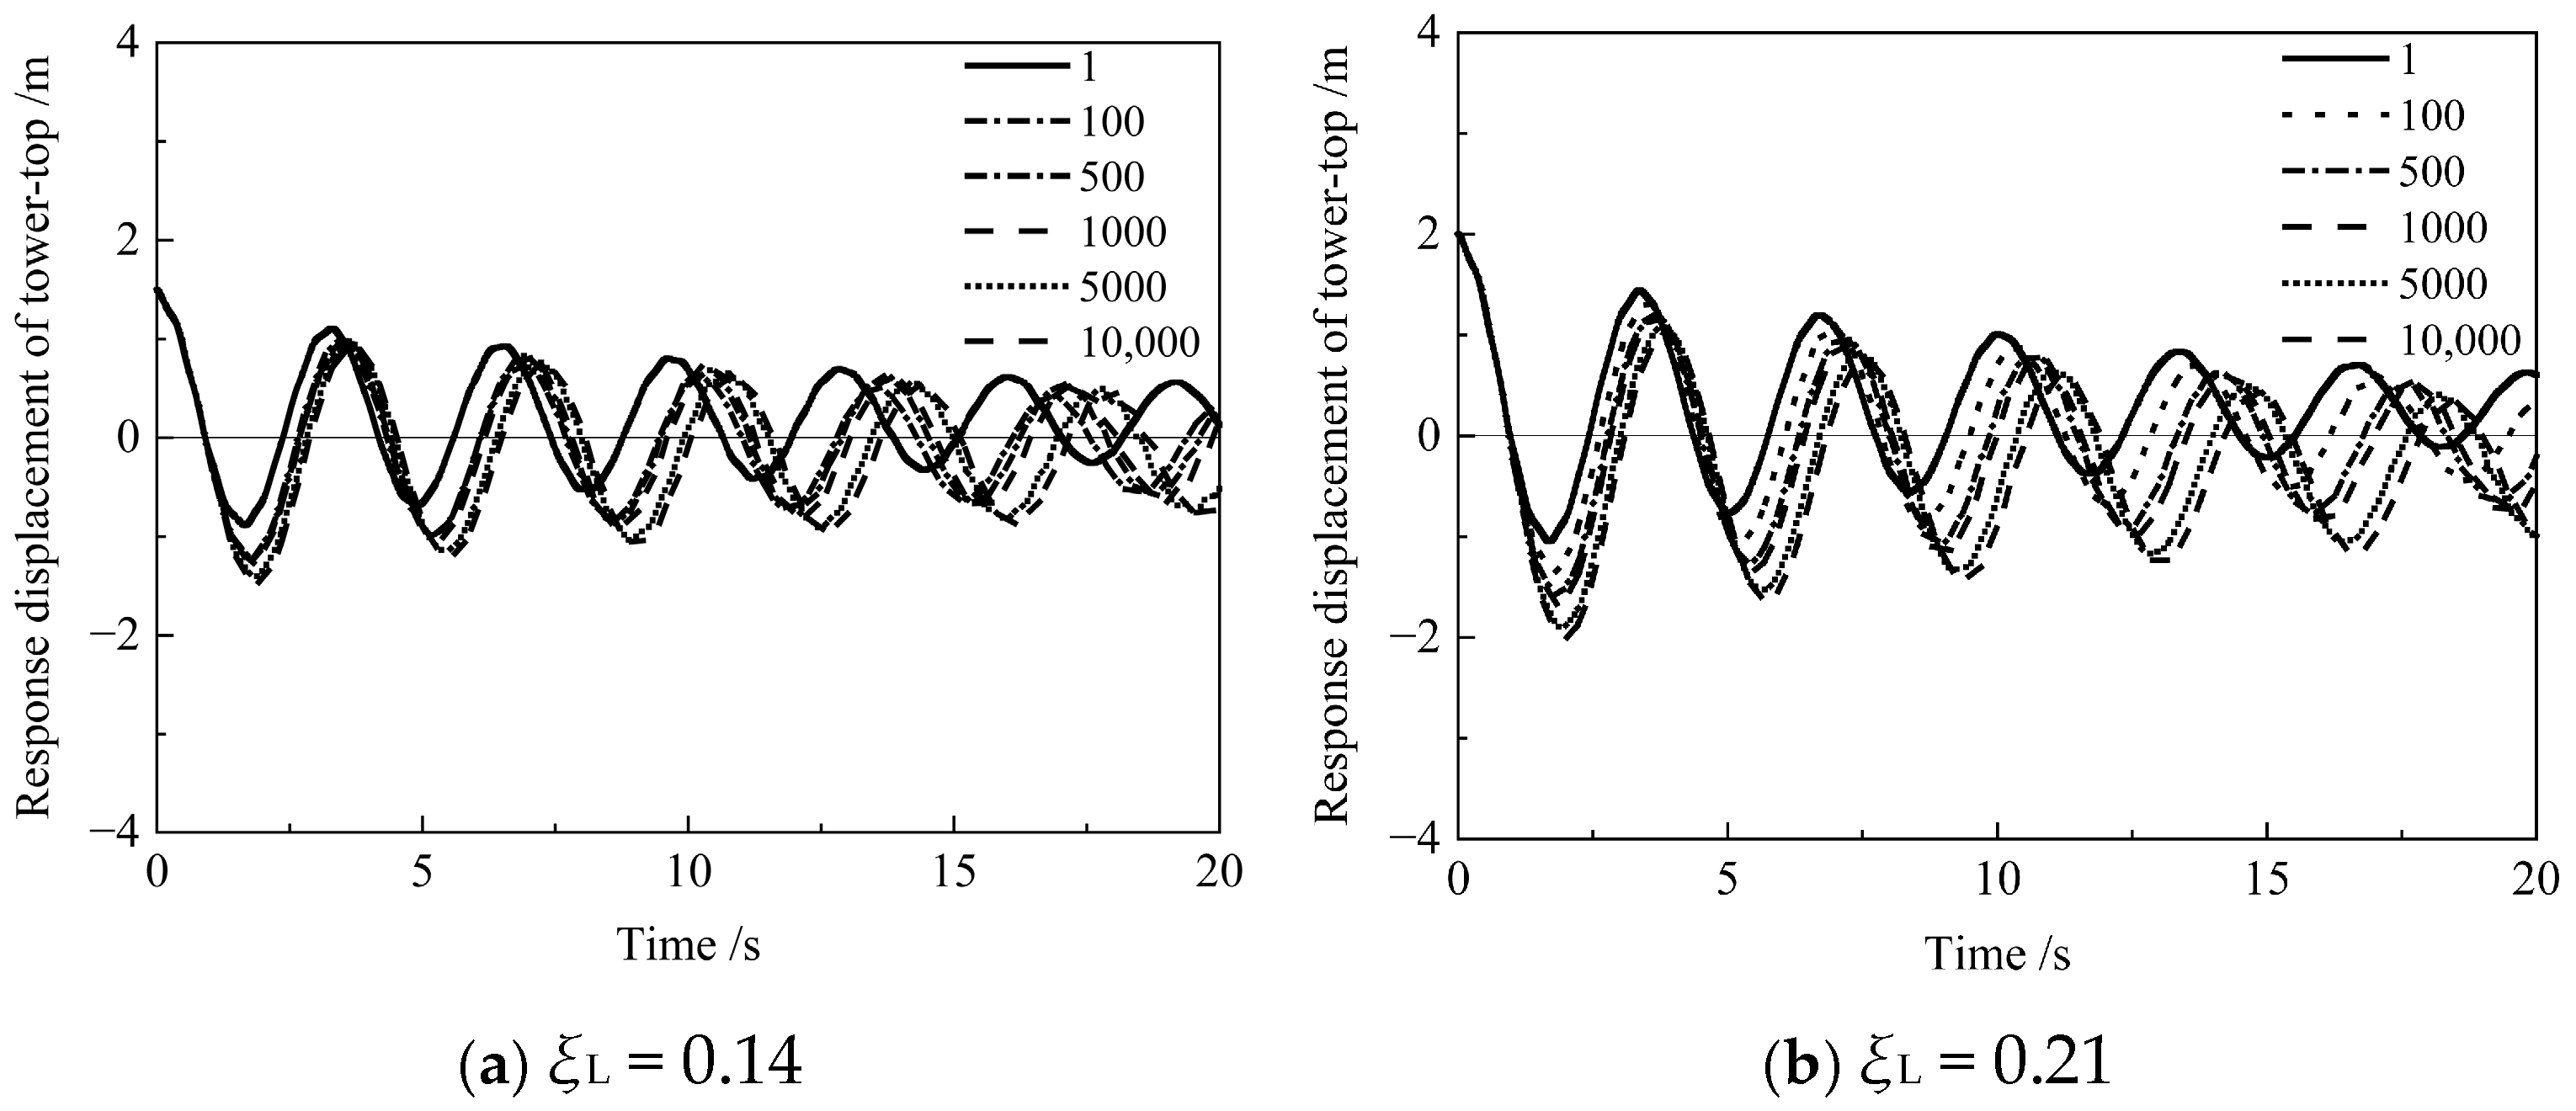
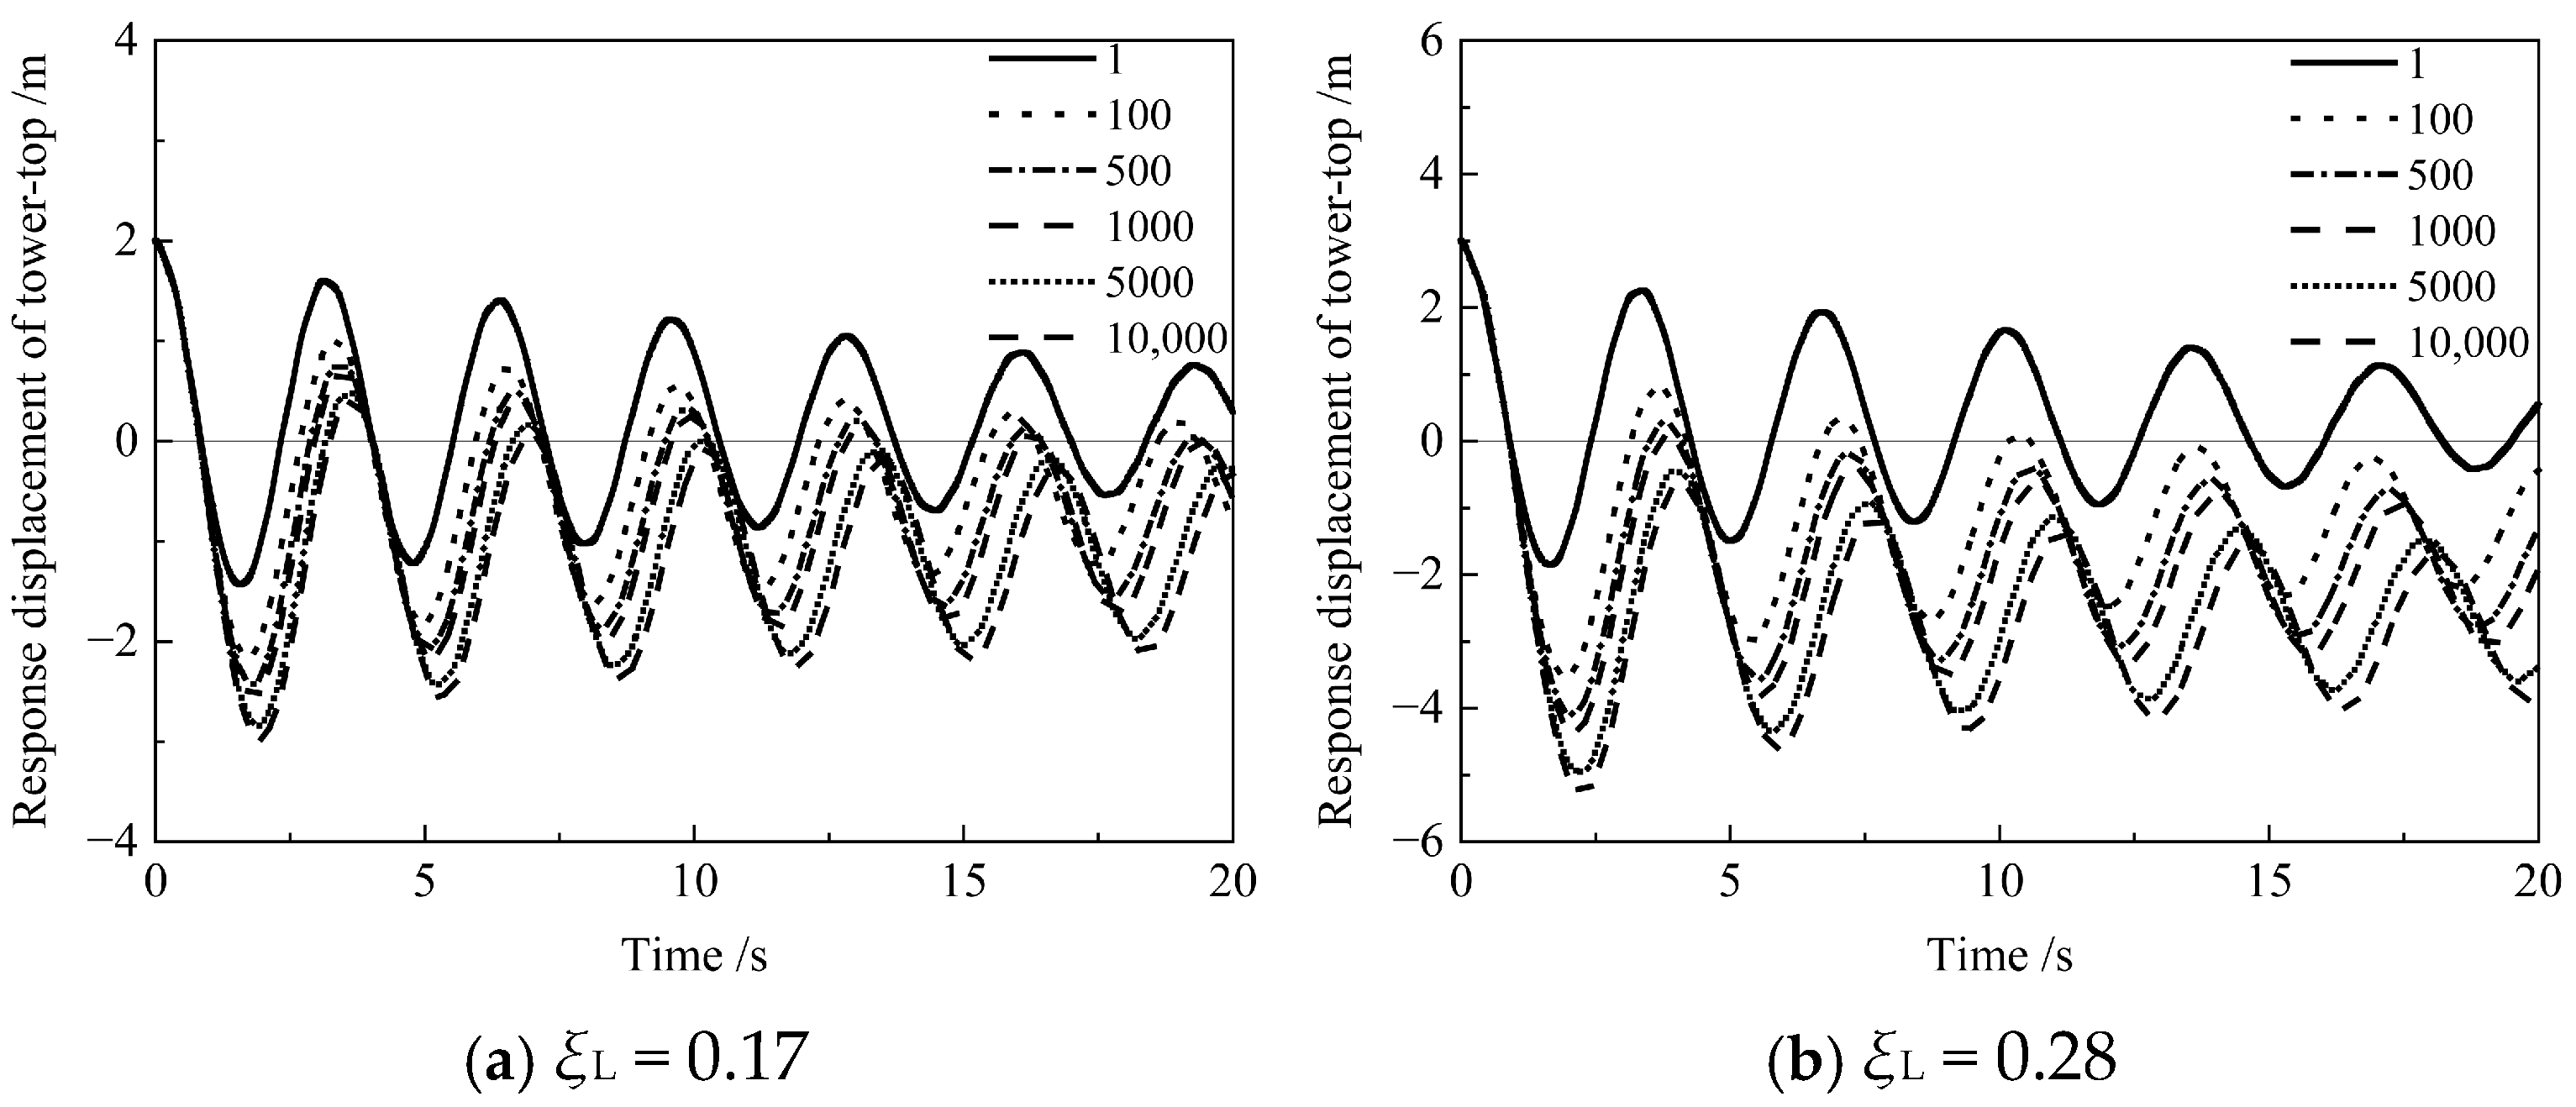
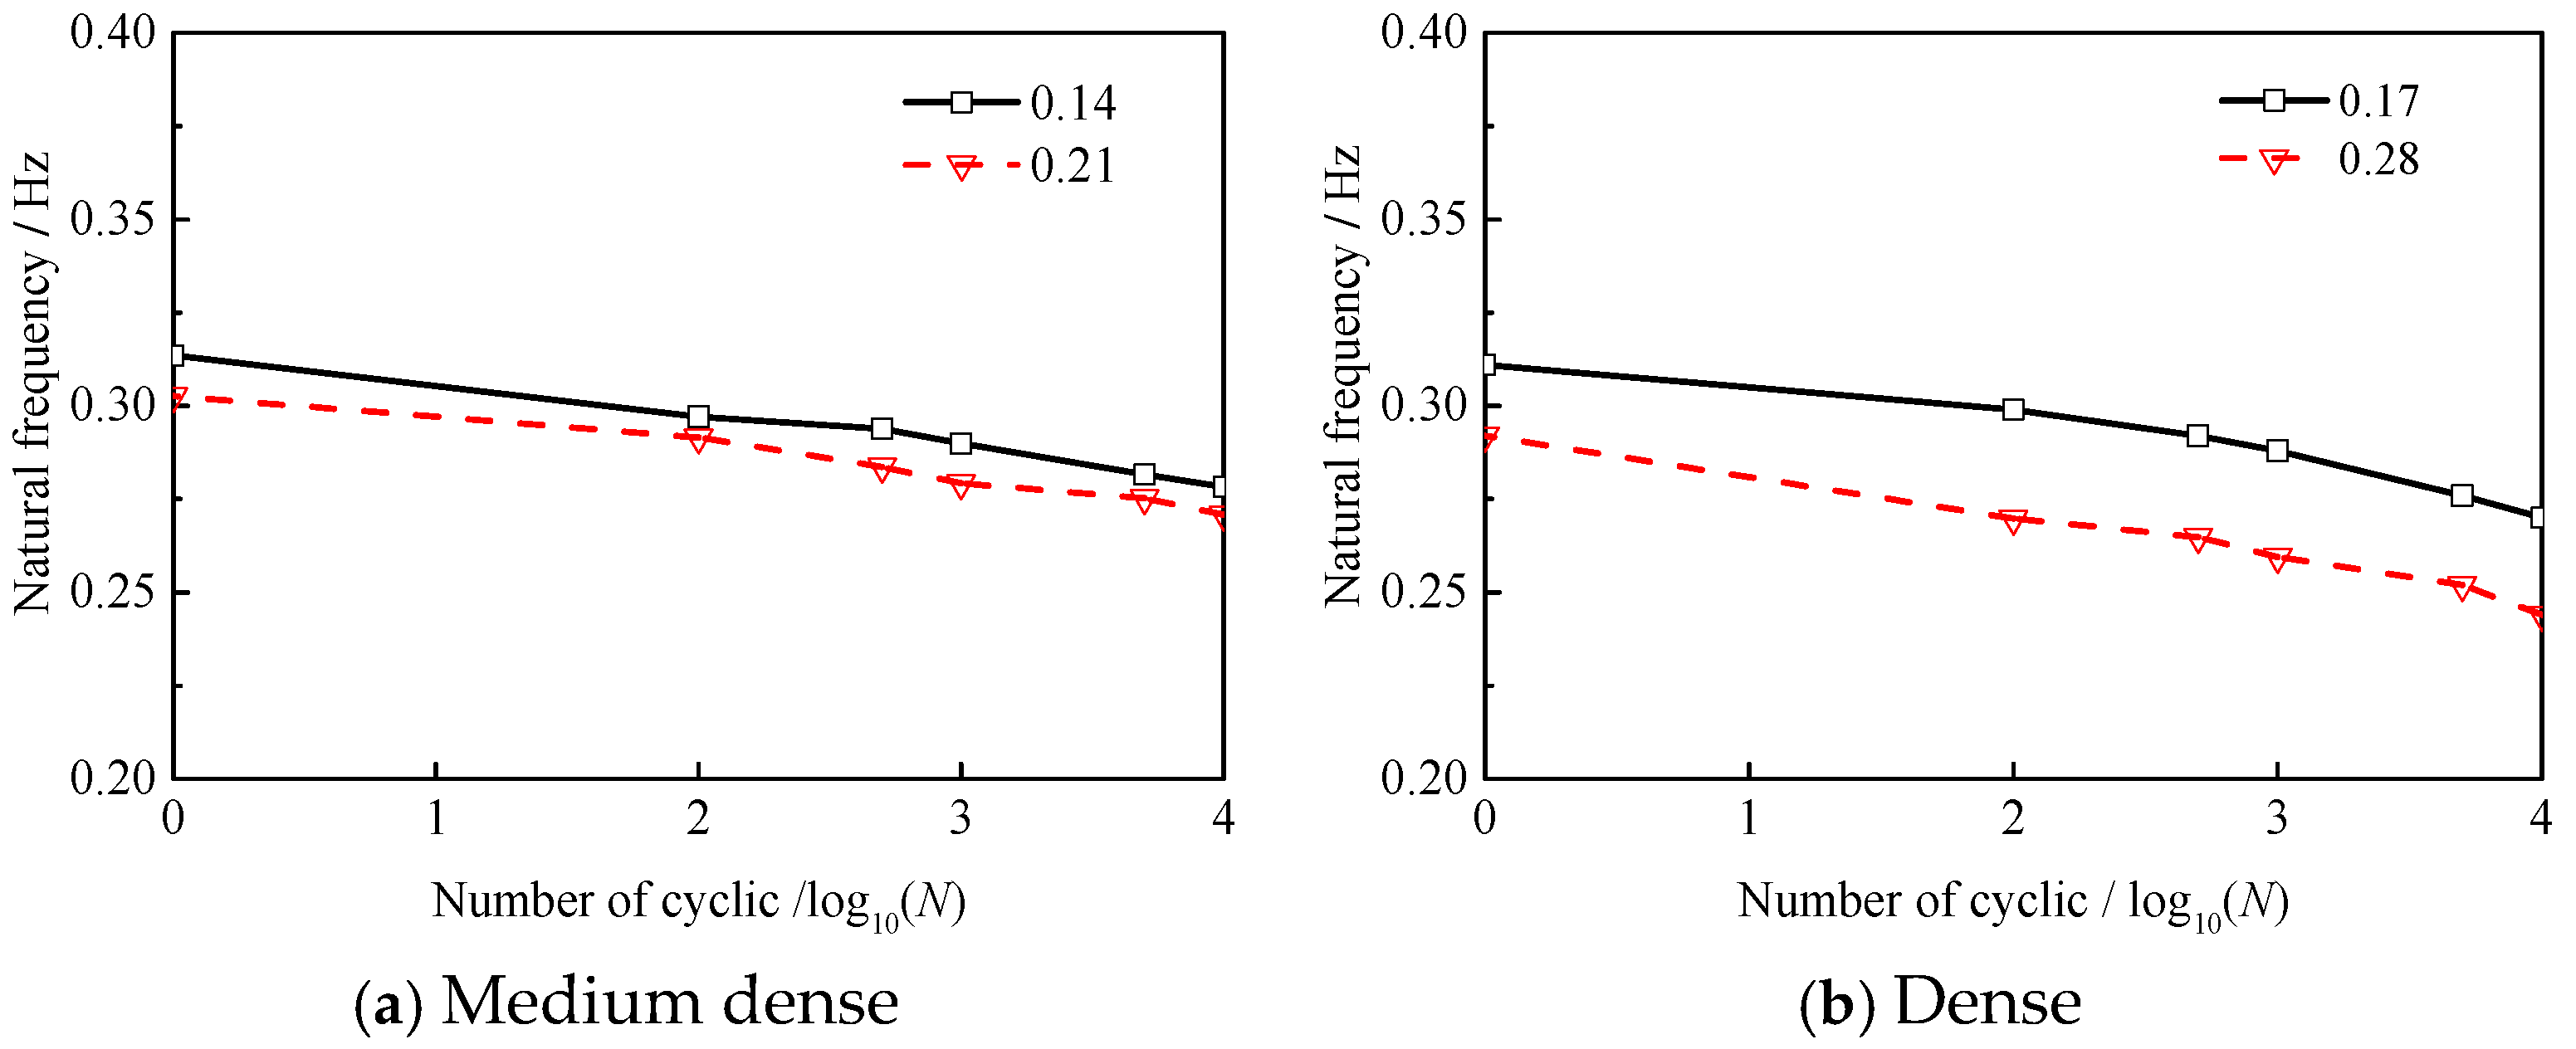
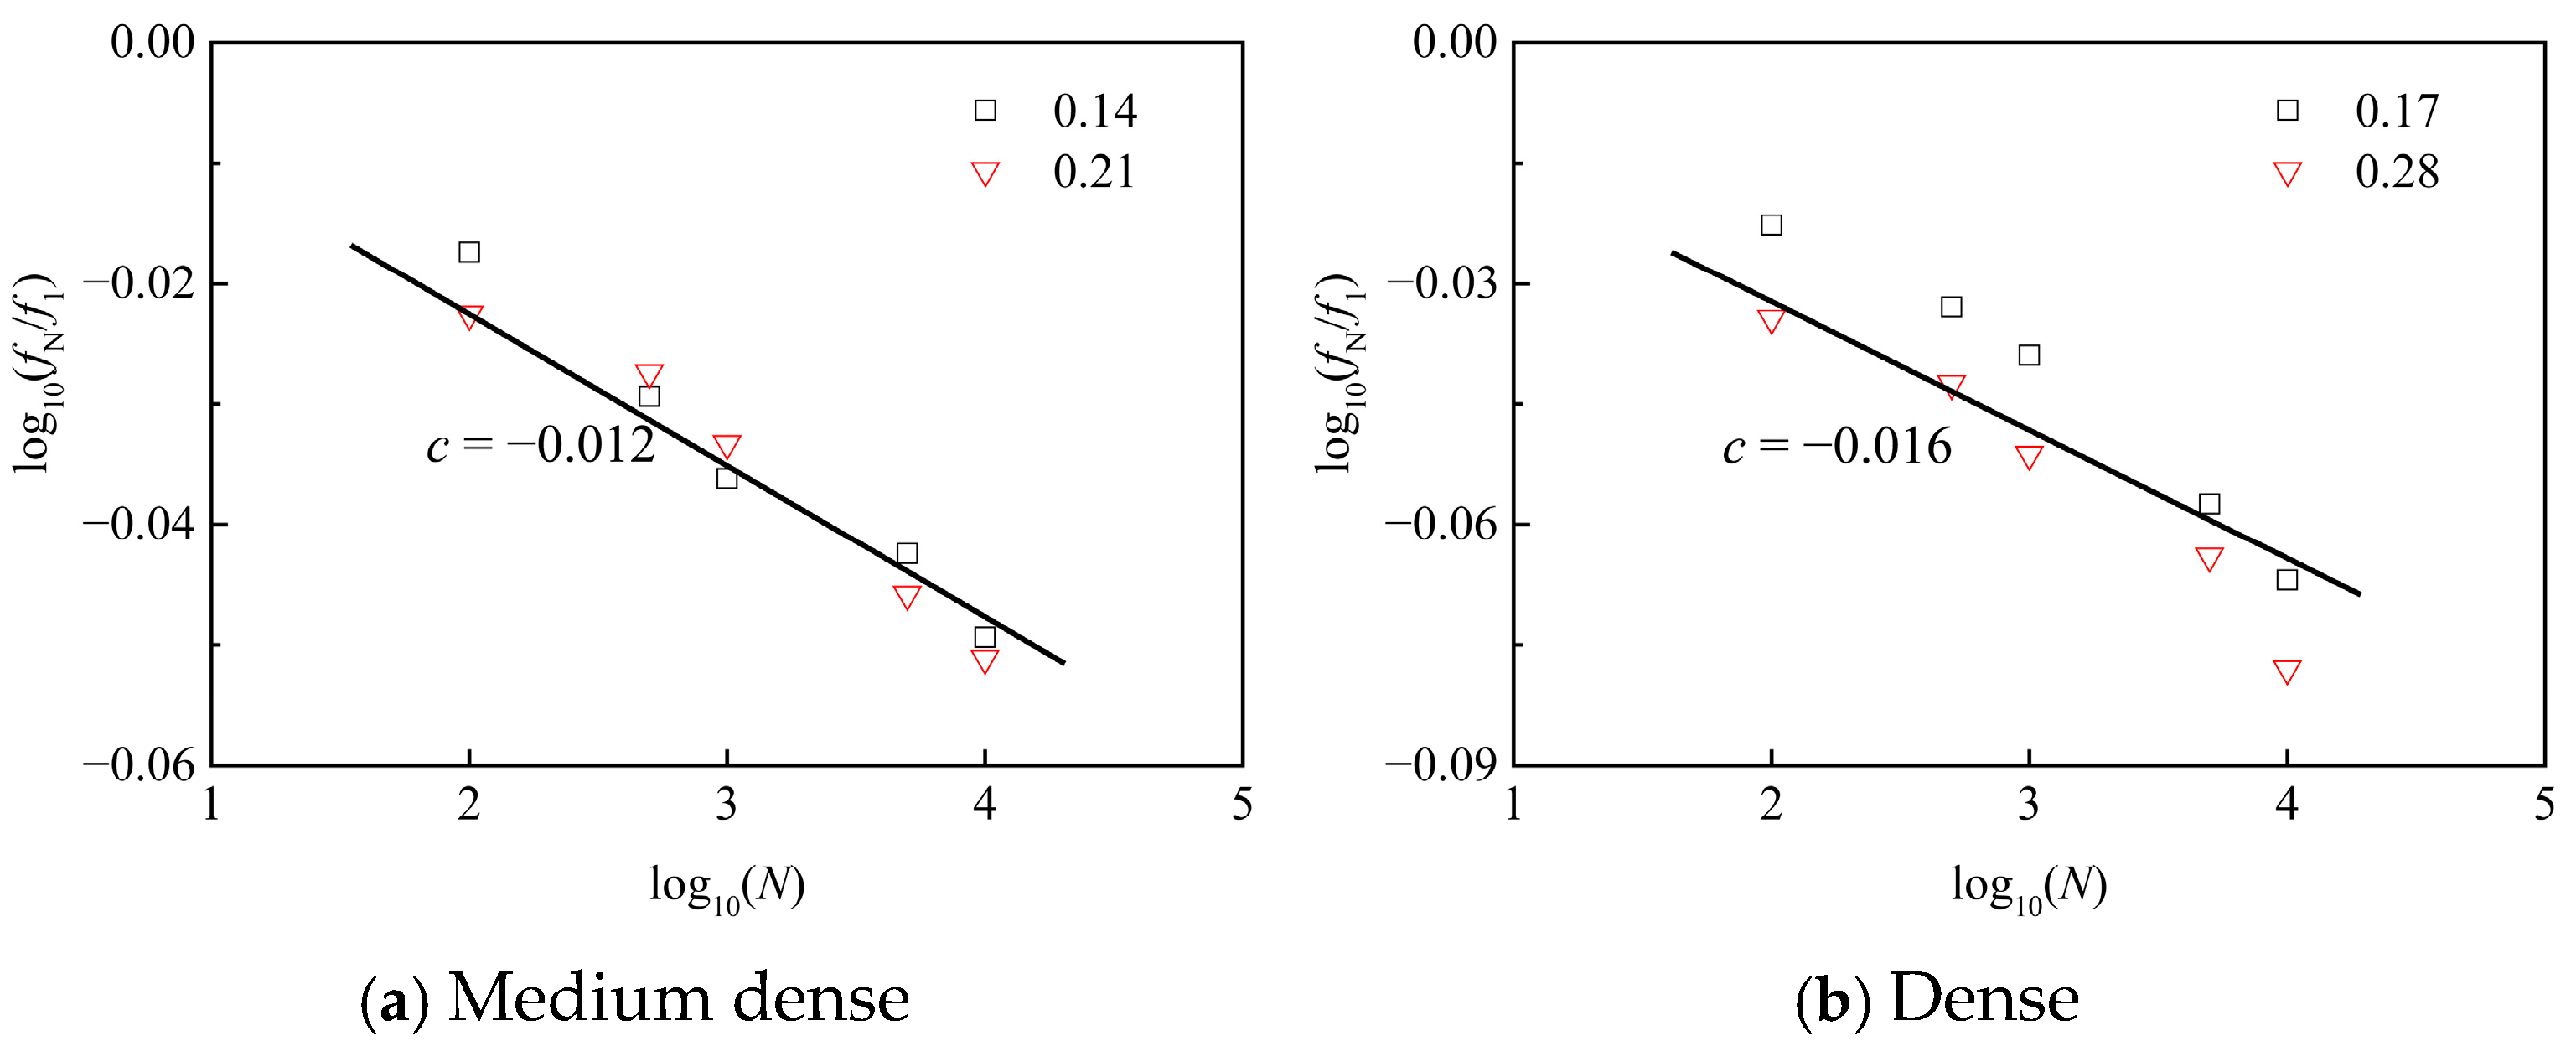
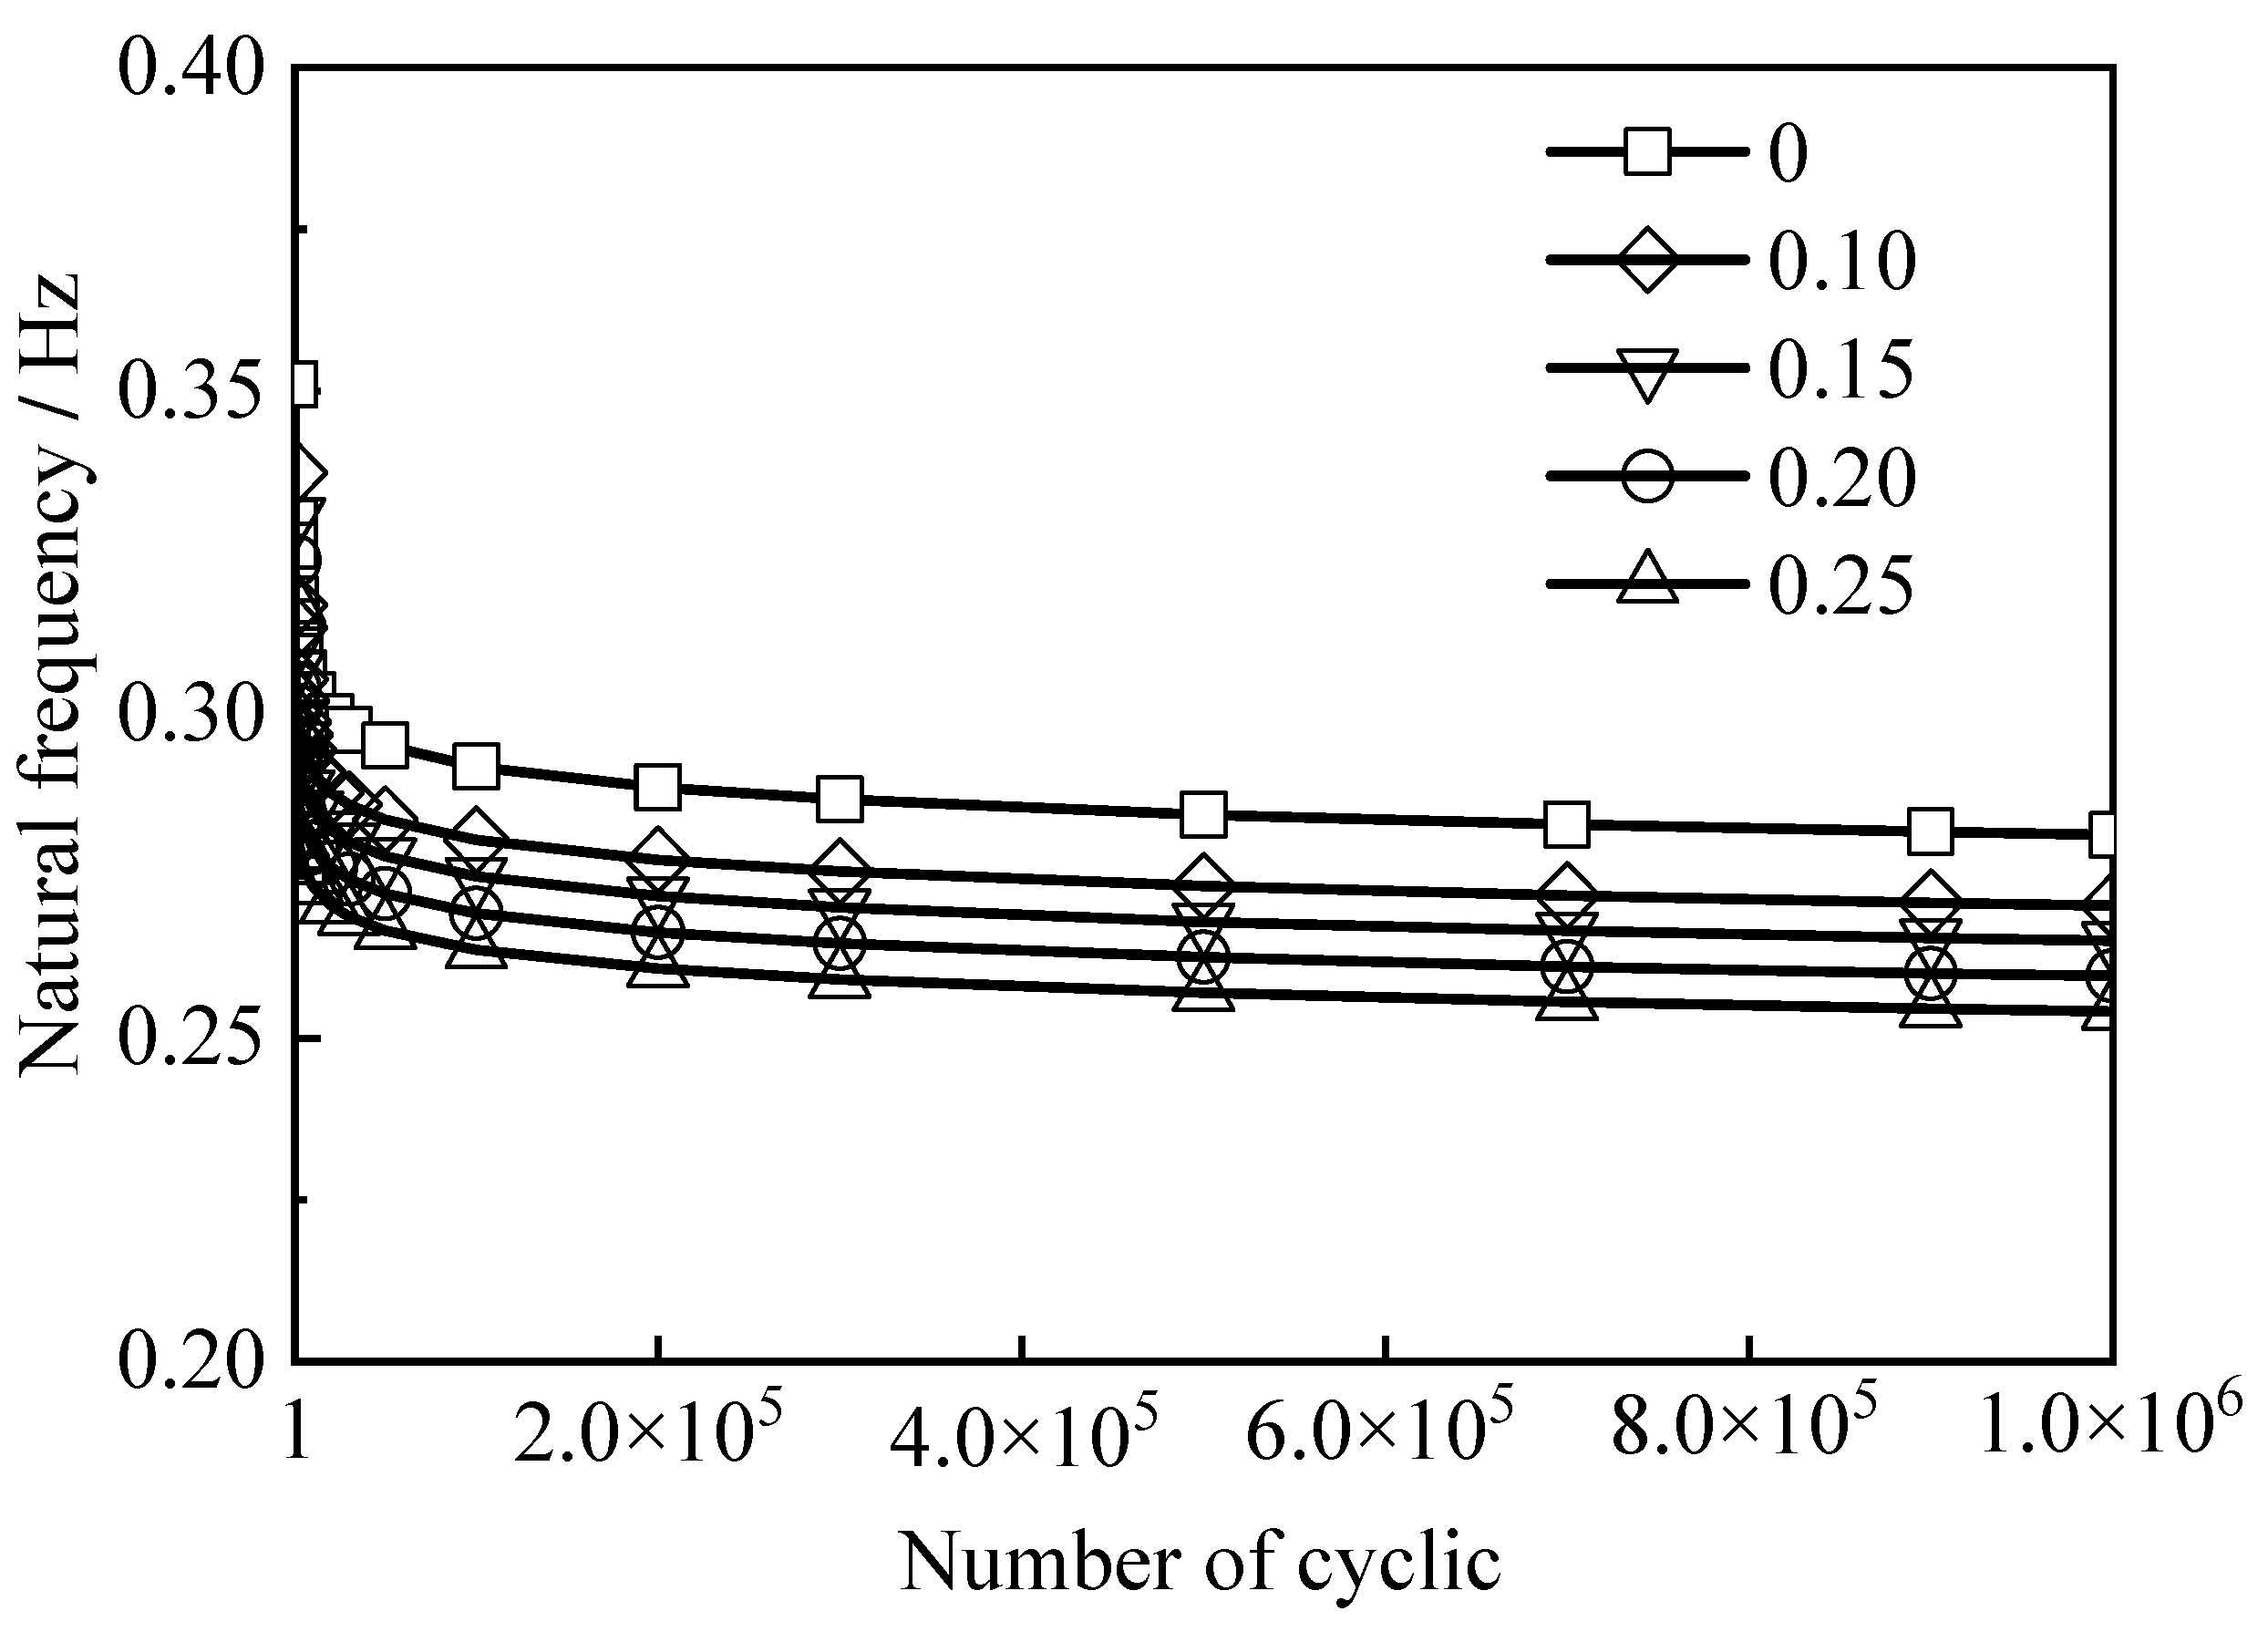
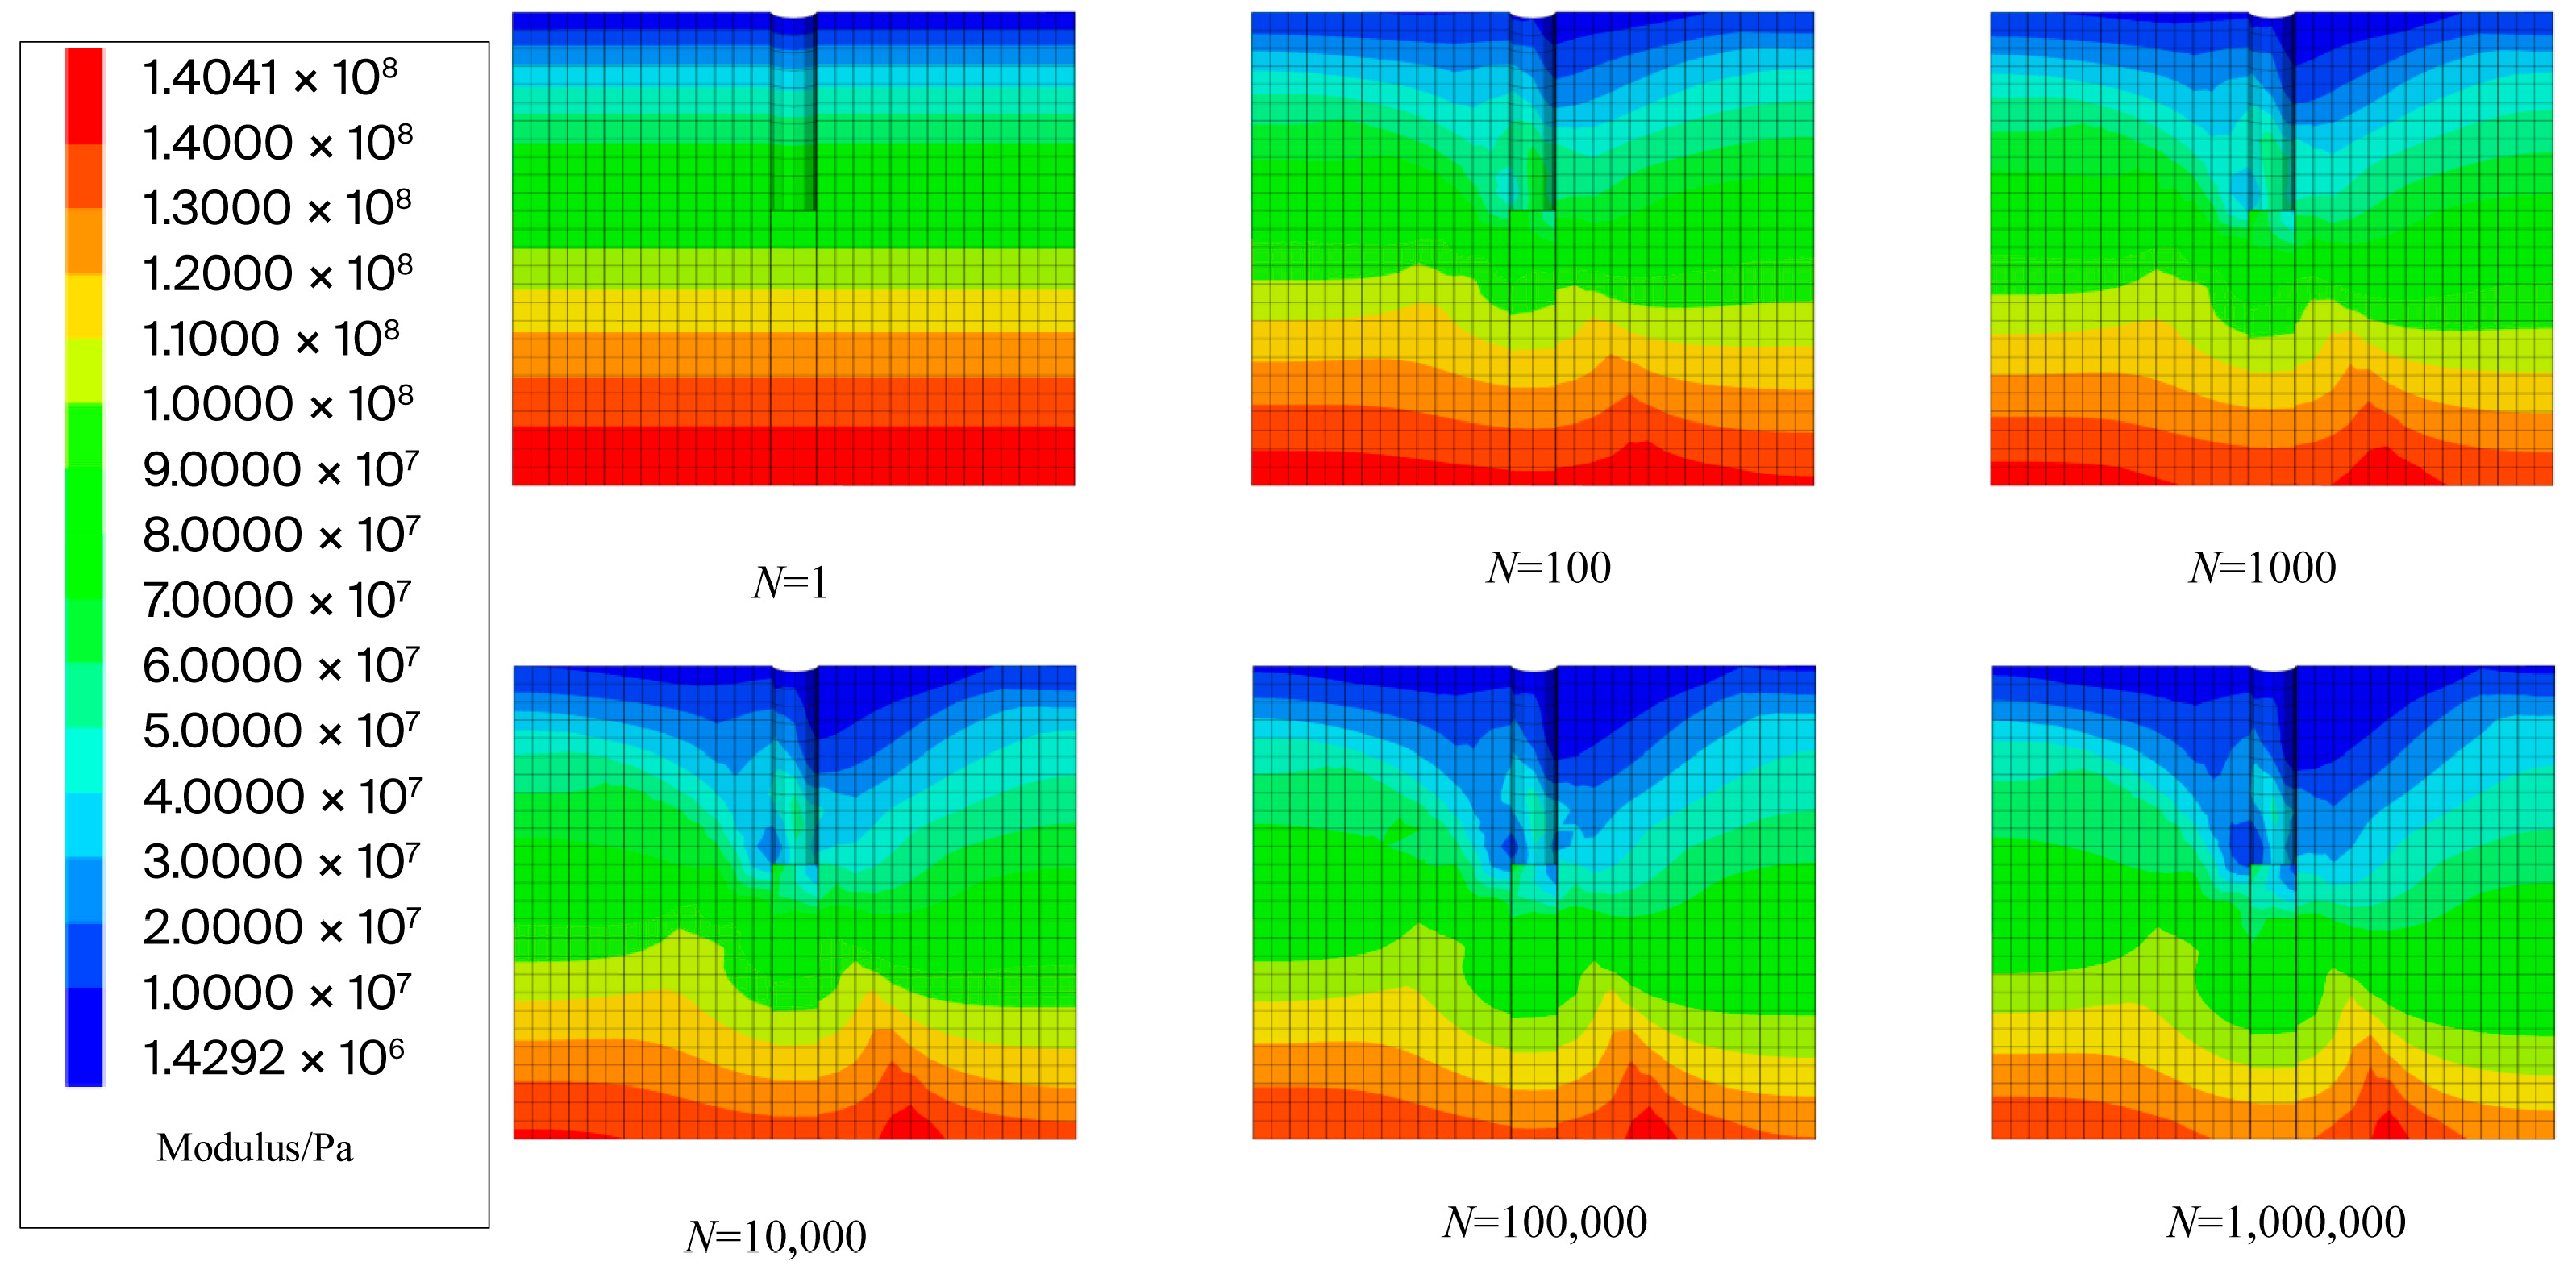
3.2. Number of Cyclic Loading

In this section, we studied how the number of cyclic loadings influences natural frequency. In medium-dense sand, cyclic loadings with dimensionless coefficients of 0.14 and 0.21 were applied to the tops of offshore wind turbine structures, respectively. Additionally, in dense sand, cyclic loadings with dimensionless coefficients of 0.17 and 0.28 were used to explore how the number of cyclic loadings affects these structures’ natural frequency. The wind turbine’s response results under varying numbers of cyclic loadings are presented in Figure 12 and Figure 13. As observed in these figures, the response period of offshore wind turbine structures lengthens as the number of cyclic loadings increases. That is to say, as the number of cyclic loadings increases, the natural frequency of the structural system becomes lower than before. This is because the soil’s secant stiffness decreases as the number of cyclic loadings rises. This result is found in the soil cyclic tests of Barari et al. [40], so when increasing the number of cyclic loading, the natural frequency decreases.
From Figure 14, the natural frequencies of offshore wind turbines under different cyclic loading cycles are obtained. As depicted in the figure, in both medium-dense and dense sand conditions, the natural frequencies of the wind turbine structures exhibit a gradual decline as the number of cyclic loadings increases. Significantly, in the early stages of cyclic loading (N < 100), offshore wind turbine structures in medium-dense sand undergo a notable 4% reduction in natural frequency. Figure 14 analysis further shows that natural frequency changes linearly with the logarithm of cyclic loading cycles. Leveraging this insight, Equation (8) was developed to model how natural frequency evolves with the number of cyclic loadings.
f N = f 1 N c
log 10 f N f 1 = c log 10 N
where f1 denotes the natural frequency of the monopile-supported offshore wind turbine in the first cycle, fN represents its natural frequency in the Nth cyclic, and c stands for the influence coefficient of cyclic loading cycles on natural frequency.
Ward [41] and Amar et al. [42] observed that foundation stiffness primarily dictates the natural frequency of offshore wind turbine structures. That is, there is a certain positive correlation between the natural frequency of offshore wind turbine and the foundation. Equation (3) shows that there is an exponential relation between the secant modulus of soil and the number of cyclic loadings, that is similar to Equation (8). It is illustrated that Equation (8) is rational to express the relation between the natural frequency and number of cyclic loadings.
According to Equation (9), the above numerical calculation results are processed to obtain the coefficient c. The fitting curve of the influence coefficient c in medium dense sand and dense sand is shown in Figure 13. The slope of the fitting curve is the influence coefficient c, so it is obtained in this study from Figure 15 that coefficient c is −0.012 in medium dense sand and coefficient c is −0.016 in dense sand.
By combining Equations (7) and (8), how long-term cyclic loading affects natural frequency can be expressed by Equation (10), as follows.
f N = f 0 α ξ L N c

4. Simplified Calculation Method

4.1. Development of the Simplified Method

An important consideration in the design of offshore wind turbine structures is their natural frequency. In order to conveniently calculate the natural frequency, some simplified calculation methods were proposed to calculate the natural frequency of offshore wind turbine structures [43,44]. Vught [45] created a single degree of freedom system in which the wind turbine and blade is considered as a top mass to quickly obtain the natural frequency of offshore wind turbine structures. The equation is as follows.
f 1 = 1 2 π 3 m t + 33 140 m T L T 3 E I
where LT is the tower height (m), mt is the wind turbine and blade (kg), EI represents the tower structure’s flexural rigidity (N·m2), and mT denotes the tower structure’s mass (kg).
Since the above method does not consider how foundation stiffness affects the natural frequency of offshore wind turbine structures, the computed outcomes lack accuracy. Therefore, based on Equation (11), Arany et al. [6,46] found a natural frequency expression considering soil–pile interaction. Soil–pile interaction is modeled using soil springs. The lateral, rocking, and cross-coupling spring stiffness values are denoted as KL, KR, and KLR, respectively. The refined calculation method is as follows.
f η = C R C L f F B
where fFB is the fixed base natural frequency which is calculated by Equation (11). CR and CL are the influence factors of the foundation stiffness and provided by the monopile. They depend on the geometrical properties of the tower and monopile, with their expressions provided as follows.
C R η L , η R , η L R = 1 1 1 + α η R η L R 2 η L
C R η L , η R , η L R = 1 1 1 + b η R η L R 2 η R
η L = K L L T 3 E I η η R = K R L T 3 E I η η L R = K L L T 3 E I η
where a and b are the empirical coefficients 0.6 and 0.5, respectively. The application of Equations (13) and (14) is conditioned by
η R > 1.2 η L R 2 η L , η L > 1.2 η L R 2 η R
In this study, the above method is used to calculate the natural frequency f1, which is applied to Equation (10). A simplified method is thus formulated to gauge the natural frequency of monopile-supported offshore wind turbine structures when subjected to long-term cyclic loading.
f N = C R C L f F B α ξ L N C

4.2. Evaluation of the Long-Term Natural Frequency

A case study was undertaken to evaluate the long-term evolution of natural frequency under sustained cyclic loading. A monopile supported offshore 3.6 MW wind turbine structures in the Walney 1 wind farm was used to conduct the case study, which can provide some reference for engineering design. These required parameters in the calculation are shown as follows in Table 2.
Based on the parameters mentioned above, the natural frequency of the fixed-base structural system is 0.422 Hz. Equations (13)–(16) are used to obtain the foundation stiffness coefficients CR and CL, which are 0.837 and 0.997, respectively. Therefore, when pile–soil interaction is taken into account, the natural frequency of the wind turbine structures is 0.351 Hz.
The seabed where this 3.6 MW wind turbine support structure system is located is in the dense sand [46], so using Equation (10) to evaluate the long-term natural frequency of the 3.6 MW wind turbine structures, the influence coefficient c is −0.016 in Equation (10). Meanwhile, an assessment is also made of how cyclic loading amplitudes of varying magnitudes affect natural frequency, so the influence coefficient α is −0.136, and the dimensionless ratio ξL is 0.15–0.3. The calculated processes are as shown in Equations (18) and (19). The calculated results are shown in Figure 16.
f N = f η N 0.016
f N = f η 0.136 ξ L N 0.016
Figure 16 shows that the natural frequency of wind turbine structures decreases as the number of cycles increases. The natural frequency exhibits a similar trend across different cyclic loading amplitudes. In the early stage of cyclic loading (N < 105), the natural frequency drops significantly by approximately 20%. Thereafter, it remains nearly unchanged with further increases in cycle count. In this case study, the natural frequency stabilized at a constant value after about half a month. To explain this trend, soil stiffness variations under different cycle numbers were analyzed (Figure 17). Results show that soil stiffness variation ranges increase with cyclic loading but cease to expand after 105 cycles, which signifies that foundation stiffness has stabilized, and consequently, the natural frequency has also stabilized.
Because of the soft–stiff region being very small, it is observed that the natural frequency of the wind turbine structures will tend toward 1P and even draw close to it. Therefore, in order to ensure the long-term normal operation of the wind turbine, the natural vibration frequency of the wind turbine should be biased towards 3P in the design soft–stiff region. That is, the design natural frequency should be in a slightly higher frequency area to avoid the resonance risk during the long-term operation of the wind turbine. As the number of cyclic loading increases, the natural frequency would be moving towards the medium point in the design soft–stiff region.

5. Conclusions

Using FLAC3D finite-difference software, the numerical model incorporates the soil degradation stiffness model (DSM) to account for long-term cyclic loading effects. Subsequently, a parametric analysis is performed to assess how cyclic loading amplitude and cycle number impact the natural frequency of offshore wind turbine structures. A simplified approach that considers the influence of cyclic loading is then introduced. Finally, a case study is conducted to evaluate the evolution of natural frequency over the course of long-term cyclic loading. This study’s results yield the following conclusions.
(1)
The natural frequency of monopile-supported offshore wind turbines decreases linearly as cyclic loading amplitude rises. In early cyclic loading stages, this frequency drops sharply with more cycles. Later, it barely changes with additional cycles, stabilizing at a constant value.
(2)
The long-term cyclic loading would make the natural frequency of the wind turbine structures reduction effect. In an effort to ensure the sustained and secure operation of the offshore wind turbine over the long run, the natural frequency specified in the design of the structural system should lean towards 3P.
(3)
This simplified method is developed by the numerical results. Furthermore, this method allows for the rapid acquisition of the offshore wind turbine’s natural frequency, but soil layer is a homogeneous sandy soil, and pore-pressure is simplified, so the universality application of the simplified method needs to be further verified for complex soil layer. However, in the absence of monitoring data of the natural frequency, the proposed simplified method can provide some initial assessment in terms of frequency calculation.

Author Contributions

Conceptualization, Y.S. and R.C.; methodology, Y.S. and R.C.; software, H.Y., J.Z. and B.S.; validation, Y.S. and J.X.; formal analysis, H.Y.; investigation, B.S. and R.C.; resources, J.Z.; data curation, Y.S.; writing—original draft preparation, Y.S.; writing—review and editing, J.X.; visualization, Y.S.; supervision, Y.S.; writing—review and editing, Y.S. All authors have read and agreed to the published version of the manuscript.

Funding

This research was funded by the Zhejiang Provincial Natural Science Foundation of China (Grant No. LQ24E080013) and the National Natural Science Foundation Youth Fund of China (Grant No.52408387)and the Zhejiang Province Leading Earth Goose Program (Grant No. 2023C03122) and the Wenzhou Basic Public Welfare Research Program (Grant No. S2023001).

Institutional Review Board Statement

Not applicable.

Informed Consent Statement

Not applicable.

Data Availability Statement

The original contributions presented in this study are included in the article. Further inquiries can be directed to the corresponding author.

Acknowledgments

This article’s findings owe to the supervisor’s meticulous guidance, precious assistance of Yongqing LAI, and care from the research group’s teachers. Their joint efforts enabled the authors to obtain lake test data.

Conflicts of Interest

The author has no conflicts of interest.

Abbreviations

The following abbreviations are used in this manuscript:
E 0 Initial elastic modulus of the soil
k Coefficients determined by the function of relative density of sand
σ a t Atmosphere Pressure
σ 3 Minimum principal stress of the soil
λ Coefficients defined via the sand’s relative density function
K 0 Coefficient of soil pressure at rest
z Soil depth
γ Natural bulk density of soil
E s N Soil secant modulus after Nth cycle
E s 1 Soil secant modulus under after first cyclic
N Number of cyclic
a Proportional parameters of exponential degradation function
b Parameters of exponential degradation function
X Cyclic stress ratio
σ 1 , c y c Maximum principal stress in the cyclic stress state
σ 1 , s f Maximum principal stress in the static failure state
X c Characteristic cyclic stress ratio
X 1 Cyclic stress ratio of soil under loading conditions
X 0 Cyclic stress ratio of soil under initial stress state
ξ L Dimensionless coefficient of the cyclic loading
S c y c Cyclic horizontal displacement amplitude of the pile at the mud surface
S u Ultimate horizontal displacement of the pile at the mud surface
f ξ L Natural frequency under the dimensionless coefficient
ξ L Cyclic loading
f 0 Natural frequency when soil surrounding the pile is elastic
f 1 First-cycle vibrational characteristics in monopile-supported offshore wind turbines
f N Natural frequency in the Nth cyclic
α Cyclic loading amplitude’s influence coefficient on natural frequency
c Influence coefficient of cyclic loading cycles on natural frequency
m t Wind turbine and blade
m T Mass of the tower structure
L T Tower height
E I Flexural rigidity of the tower structure
f η Frequency of wind turbine structures considering the stiffness degradation effect of soil
C R Influence factors of the rotation foundation stiffness
C L Influence factors of the lateral foundation stiffness
f F B Natural frequency
η L Influence coefficient of the horizontal stiffness
η R Influence coefficient of the rotational stiffness
η L R Influence coefficient of the coupled stiffness
K L Horizontal stiffness
K R Rotational stiffness
I η Modulus of Inertia

References

  1. Det Norske Veritas. DNV-OS-J101, Design of Offshore Wind Turbine Structures; DNV Press: Oslo, Norway, 2014. [Google Scholar]
  2. Liu, H.; Kaynia, A.M. Characteristics of cyclic undrained model SANISAND-MSu and their effects on response of monopiles for offshore wind structures. Geotechnique 2023, 73, 16. [Google Scholar] [CrossRef]
  3. Zaaijer, M.B. Foundation modelling to assess dynamic behaviour of offshore wind turbines. Appl. Ocean Res. 2006, 28, 45–57. [Google Scholar] [CrossRef]
  4. Byrne, B. Foundation Design for Offshore Wind Turbines; Géotechnique Lecture; University of Oxford: London, UK, 2011. [Google Scholar]
  5. Bhattacharya, S.; Adhikari, S. Experimental validation of soil–structure interaction of offshore wind turbines. Soil Dyn. Earthq. Eng. 2011, 31, 805–816. [Google Scholar] [CrossRef]
  6. Arany, L.; Bhattacharya, S.; Macdonald, J.H.; Hogan, S.J. Closed form solution of Eigen frequency of monopile supported offshore wind turbines in deeper waters incorporating stiffness of substructure and SSI. Soil Dyn. Earthq. Eng. 2016, 83, 18–32. [Google Scholar] [CrossRef]
  7. Andersen, L.; Vahdatirad, M.; Sichani, M.; Sørensen, J. Natural frequencies of wind turbines on monopile foundations in clayey soils—A probabilistic approach. Comput. Geotech. 2012, 43, 1–11. [Google Scholar] [CrossRef]
  8. Darvishi-Alamouti, S.; Bahaari, M.; Moradi, M. Natural frequency of offshore wind turbines on rigid and flexible monopiles in cohesionless soils with linear stiffness distribution. Appl. Ocean Research. 2017, 68, 91–102. [Google Scholar] [CrossRef]
  9. Yu, Z.L.; Amdahl, J. A Rayleigh-Ritz solution for high order natural frequencies and eigenmodes of monopile supported offshore wind turbines considering tapered towers and soil pile interactions. Mar. Structur. 2023, 92, 103485. [Google Scholar] [CrossRef]
  10. Schaumann, P.; Lochte-Holtgreven, S.; Steppeler, S. Special fatigue aspects in support structures of offshore wind turbines. Mater. Sci. Eng. Technol. 2011, 42, 1075–1081. [Google Scholar] [CrossRef]
  11. Shi, S.; Zhai, E.; Xu, C.; Iqbal, K.; Sun, Y.; Wang, S. Influence of Pile-Soil Interaction on Dynamic Properties and Response of Offshore Wind Turbine with Monopile Foundation in Sand Site. Appl. Ocean. Res. 2022, 126, 103279. [Google Scholar] [CrossRef]
  12. Bakhti, R.; Benahmed, B.; Laib, A. Finite Element Investigation of Offshore Wind Turbines Natural Frequency with Monopile Foundations System. J. Vib. Eng. Technol. 2023, 12, 2437–2449. [Google Scholar] [CrossRef]
  13. Achmus, M.; Kuo, Y.S.; Abdel-Rahman, K. Behavior of monopile foundations under cyclic lateral load. Comput. Geotech. 2009, 36, 725–735. [Google Scholar] [CrossRef]
  14. Chong, S. Numerical simulation of offshore foundations subjected to repetitive loads. Ocean Eng. 2017, 142, 470–477. [Google Scholar] [CrossRef]
  15. Chong, S.; Pasten, C. Numerical study on long-term monopile foundation response. Mar. Georesour. Geotechnol. 2018, 36, 190–196. [Google Scholar] [CrossRef]
  16. Cuéllar, P.; Mira, P.; Pastor, M.; Merodo, J.A.F.; Baeßler, M.; Rücker, W. A numerical model for the transient analysis of offshore foundations under cyclic loading. Comput. Geotech. 2014, 59, 75–86. [Google Scholar] [CrossRef]
  17. Cuéllar, P. Pile Foundations for Offshore Wind Turbines: Numerical and Experimental Investigations on the Behaviour Under Short-Term and Long-Term Cyclic Loading. Ph.D. Thesis, Technischen Universitt Berlin, Berlin, Germany, 2011. [Google Scholar]
  18. Li, J.; Guan, D.; Chiew, Y.-M.; Zhang, J.; Zhao, J. Temporal evolution of soil deformations around monopile foundations subjected to cyclic lateral loading. Ocean Eng. 2020, 217, 107893. [Google Scholar] [CrossRef]
  19. Zaaijer, M.B. Design Methods for Offshore Wind Turbines at Exposed Sites. Master’s Thesis, Delft University of Technology, Delft, The Netherlands, 2002. [Google Scholar]
  20. Lombardi, D.; Bhattacharya, S.; Wood, D.M. Dynamic soil-structure interaction of monopile supported wind turbines in cohesive soil. Soil Dyn. Earthq. Eng. 2013, 49, 165–180. [Google Scholar] [CrossRef]
  21. Bhattacharya, S.; Cox, J.A.; Lombardi, D.; Wood, D.M. Dynamics of offshore wind turbines supported on two foundations. ICE Proc. Geotech. Eng. 2013, 166, 159–169. [Google Scholar] [CrossRef]
  22. Carswell, W.; Arwade, S.; DeGroot, D.; Myers, A. Natural frequency degradation and permanent accumulated rotation for offshore wind turbine monopiles in clay. Renew Energy 2016, 97, 319–330. [Google Scholar] [CrossRef]
  23. Arany, L.; Bhattacharya, S.; Macdonald, J.; Hogan, S.J. Design of monopiles for offshore wind turbines in 10 steps. Soil Dyn. Earthq. Eng. 2017, 92, 126–152. [Google Scholar] [CrossRef]
  24. Wang, W.; Li, X.; Zhao, H.; Wang, B.; Li, Y. Vibration control of a pentapod offshore wind turbine under combined seismic wind and wave loads using multiple tuned mass damper. Appl. Ocean Res. 2020, 103, 102254. [Google Scholar] [CrossRef]
  25. Janbu, N. Soil compressibility as determined by oedometer and triaxial tests. In Proceedings of the 3rd European Conference on Soil Mechanics and Foundation Engineering, Wiesbaden, Germany, 15–18 October 1963. [Google Scholar]
  26. Duncan, J.; Chang, C. Nonlinear analysis of stress and strain in soils. J. Soil Mech. Found. Div. ASCE 1970, 96, 1629–1653. [Google Scholar] [CrossRef]
  27. Ma, H.; Yang, J.; Chen, L. Numerical analysis of the long-term performance of offshore wind turbines supported by monopiles. Ocean Eng. 2017, 136, 94–105. [Google Scholar] [CrossRef]
  28. Shirzadeh, R.; Weijtjens, W.; Guillaume, P.; Devriendt, C. The dynamics of an offshore wind turbine in parked conditions: A comparison between simulations and measurements. Wind Energy 2015, 18, 1685–1702. [Google Scholar] [CrossRef]
  29. Little, R.L.; Briaud, J.L. Full Scale Cyclic Lateral Load Tests on Six Single Piles in Sand; Department of Civil Engineering Texas A & M University: College Station, TX, USA, 1988. [Google Scholar]
  30. Long, J.H.; Vanneste, G. Effects of Cyclic Lateral Loads on Piles in Sand. J. Geotech. Eng. 1994, 120, 225–244. [Google Scholar] [CrossRef]
  31. Huurman, M. Development of traffic induced permanent strain in concrete block pavements. Heron 1996, 41, 29–52. [Google Scholar]
  32. Depina, I.; Hue Le, T.M.; Eiksund, G.; Benz, T. Behavior of cyclically loaded monopile foundations for offshore wind turbines in heterogeneous sands. Comput. Geotech. 2015, 65, 266–277. [Google Scholar] [CrossRef]
  33. Kuo, Y.S.; Achmus, M.; Abdel-Rahman, K. Minimum embedded length of cyclic horizontally loaded monopiles. J. Geotech. Geoenviron. Eng. 2011, 138, 357–363. [Google Scholar] [CrossRef]
  34. Kuo, Y.S.; Martin, A.; Khalid, A.R. Estimation of lateral deformation of monopile foundations by use of cyclic triaxial tests. Chin. J. Geotech. Eng. 2009, 31, 1729–1734. [Google Scholar] [CrossRef]
  35. Zhang, J.M.; Zhang, C.R.; Zhang, K. Model tests on large-diameter single pile under cyclic lateral loads in sand. Rock Soil Mech. 2021, 42, 783–789. [Google Scholar] [CrossRef]
  36. Luo, R.; Yang, M.; Li, W. Numerical study of diameter effect on accumulated deformation of laterally loaded monopiles in sand. Eur. J. Environ. Civ. Eng. 2018, 24, 2440–2452. [Google Scholar] [CrossRef]
  37. Ahmed, S.S.; Hawlader, B. Numerical Analysis of Large-Diameter Monopiles in Dense Sand Supporting Offshore Wind Turbines. Int. J. Geomech. 2016, 16, 04016018. [Google Scholar] [CrossRef]
  38. Zhu, B.; Byrne, B.W.; Houlsby, G.T. Long-term lateral cyclic response of suction caisson foundations in sand. J. Geotech. Geoenviron. Eng. ASCE 2013, 139, 73–83. [Google Scholar] [CrossRef]
  39. Nikitas, G.; Arany, L.; Aingaran, S.; Vimalan, J.; Bhattacharya, S. Predicting long term performance of offshore wind turbines using cyclic simple shear apparatus. Soil Dyn. Earthq. Eng. 2017, 92, 678–683. [Google Scholar] [CrossRef]
  40. Barari, A.; Bagheri, M.; Rouainia, M.; Ibsen, L. Deformation mechanisms for offshore monopile foundations accounting for cyclic mobility effects. Soil Dyn. Earthq. Eng. 2017, 97, 439–453. [Google Scholar] [CrossRef]
  41. Ward, I.P. Natural frequency analysis of offshore wind turbine monopiles. ICE Eng. Comput. Mech. 2016, 169, 196–208. [Google Scholar] [CrossRef]
  42. Amar Bouzid, D.; Bhattacharya, S.; Otsmane, L. Assessment of natural frequency of installed offshore wind turbines using nonlinear finite element model considering soil-monopile interaction. J. Rock Mech. Geotech. Eng. 2018, 10, 333–346. [Google Scholar] [CrossRef]
  43. Prendergast, L.J.; Gavin, K.; Doherty, P. An investigation into the effect of scour on the natural frequency of an offshore wind turbine. Ocean Eng. 2015, 101, 1–11. [Google Scholar] [CrossRef]
  44. Yi, J.H.; Kim, S.B.; Yoon, G.L.; Andersen, L.V. Natural frequency of bottom-fixed offshore wind turbines considering pile-soil-interaction with material uncertainties and scouring depth. Wind Struct. 2015, 21, 625–639. [Google Scholar] [CrossRef]
  45. Vught, J.H. Considerations on the Dynamics of Support Structures for an Offshore Wind Energy Converter. Ph.D. Thesis, Delft University of Technology, Delft, The Netherlands, 2000. [Google Scholar]
  46. Arany, L.; Bhattacharya, S.; Adhikari, S.; Hogan, S.; Macdonald, J. An analytical model to predict the natural frequency of offshore wind turbines on three-spring flexible foundations using two different beam models. Soil Dyn. Earthq. Eng. 2015, 74, 40–45. [Google Scholar] [CrossRef]
Figure 1. Typical wind–wave spectra and 1P/3P frequency bands of three-blade wind turbines.
Applsci 15 08143 g001
Figure 2. Geometry of wind turbine structures ((a)tower; (b)transition piece; (c) monopile).
Applsci 15 08143 g002
Figure 3. Schematic diagram of numerical model for monopile supported offshore wind turbine.
Applsci 15 08143 g003
Figure 4. Dimension and nonlinear variation of elastic modulus of numerical model.
Applsci 15 08143 g004
Figure 5. Time–history curve of lateral response displacement for tower-top.
Applsci 15 08143 g005
Figure 6. Power spectrum of the tower-top response.
Applsci 15 08143 g006
Figure 7. Flow diagram for modulus degradation numerical model.
Applsci 15 08143 g007
Figure 8. Comparison of numerical calculation and results for tests.
Applsci 15 08143 g008
Figure 9. Response displacement of tower-top under the different amplitude of cyclic loading.
Applsci 15 08143 g009
Figure 10. The influence of the cyclic loading’s dimensionless coefficient on natural frequency.
Applsci 15 08143 g010
Figure 11. The relation between coefficient α and dimensionless coefficient ξL.
Applsci 15 08143 g011
Figure 12. Response displacement of tower-top under different number of cyclic in dense sand.
Applsci 15 08143 g012
Figure 13. Response displacement of tower-top under different number of cyclic in medium dense sand.
Applsci 15 08143 g013
Figure 14. Effect of number of cyclic loadings on natural frequency.
Applsci 15 08143 g014
Figure 15. Effect of number of cyclic loadings on coefficient c.
Applsci 15 08143 g015
Figure 16. Long-term development of the natural frequency for offshore 3.6 MW wind turbine structures.
Applsci 15 08143 g016
Figure 17. Variation of soil stiffness on the different number of cyclic loading (ξL = 0.25).
Applsci 15 08143 g017
Table 1. Comparison of natural frequency for numerical results and measured data.
Wind Power Plant NameMeasured Frequency/HzCalculated Frequency/HzError
NO-SSISSINO-SSISSI
Belwind0.3610.5020.35339%2.2%
North Hoyle0.3500.4940.34941%0.3%
Table 2. Parameters for soil layer [46].
OWT Dimension and Foundation StiffnessSymbol/UnitValue
Top massmt/ton234.5
Tower massmT/ton260
Tower heightLT/m67.3
Tower bottom diameterDb/m5
Tower top diameterDt/m3
Tower wall thicknesstT/mm41
Young’s modulus of tower materialE/GPa210
Monopile diameterDp/m6
Monopile wall thicknesstp/mm80
Lateral stiffnessKL/GN·m−11.53
Rock stiffnessKR/ GN m·rad−1205.72
Coupling stiffnessKLR/GN−13.88
Disclaimer/Publisher’s Note: The statements, opinions and data contained in all publications are solely those of the individual author(s) and contributor(s) and not of MDPI and/or the editor(s). MDPI and/or the editor(s) disclaim responsibility for any injury to people or property resulting from any ideas, methods, instructions or products referred to in the content.

