
Laminar Burning Velocity in Aviation Fuels: Conventional Kerosene, SAFs, and Key Hydrocarbon Components


Abstract

1. Introduction
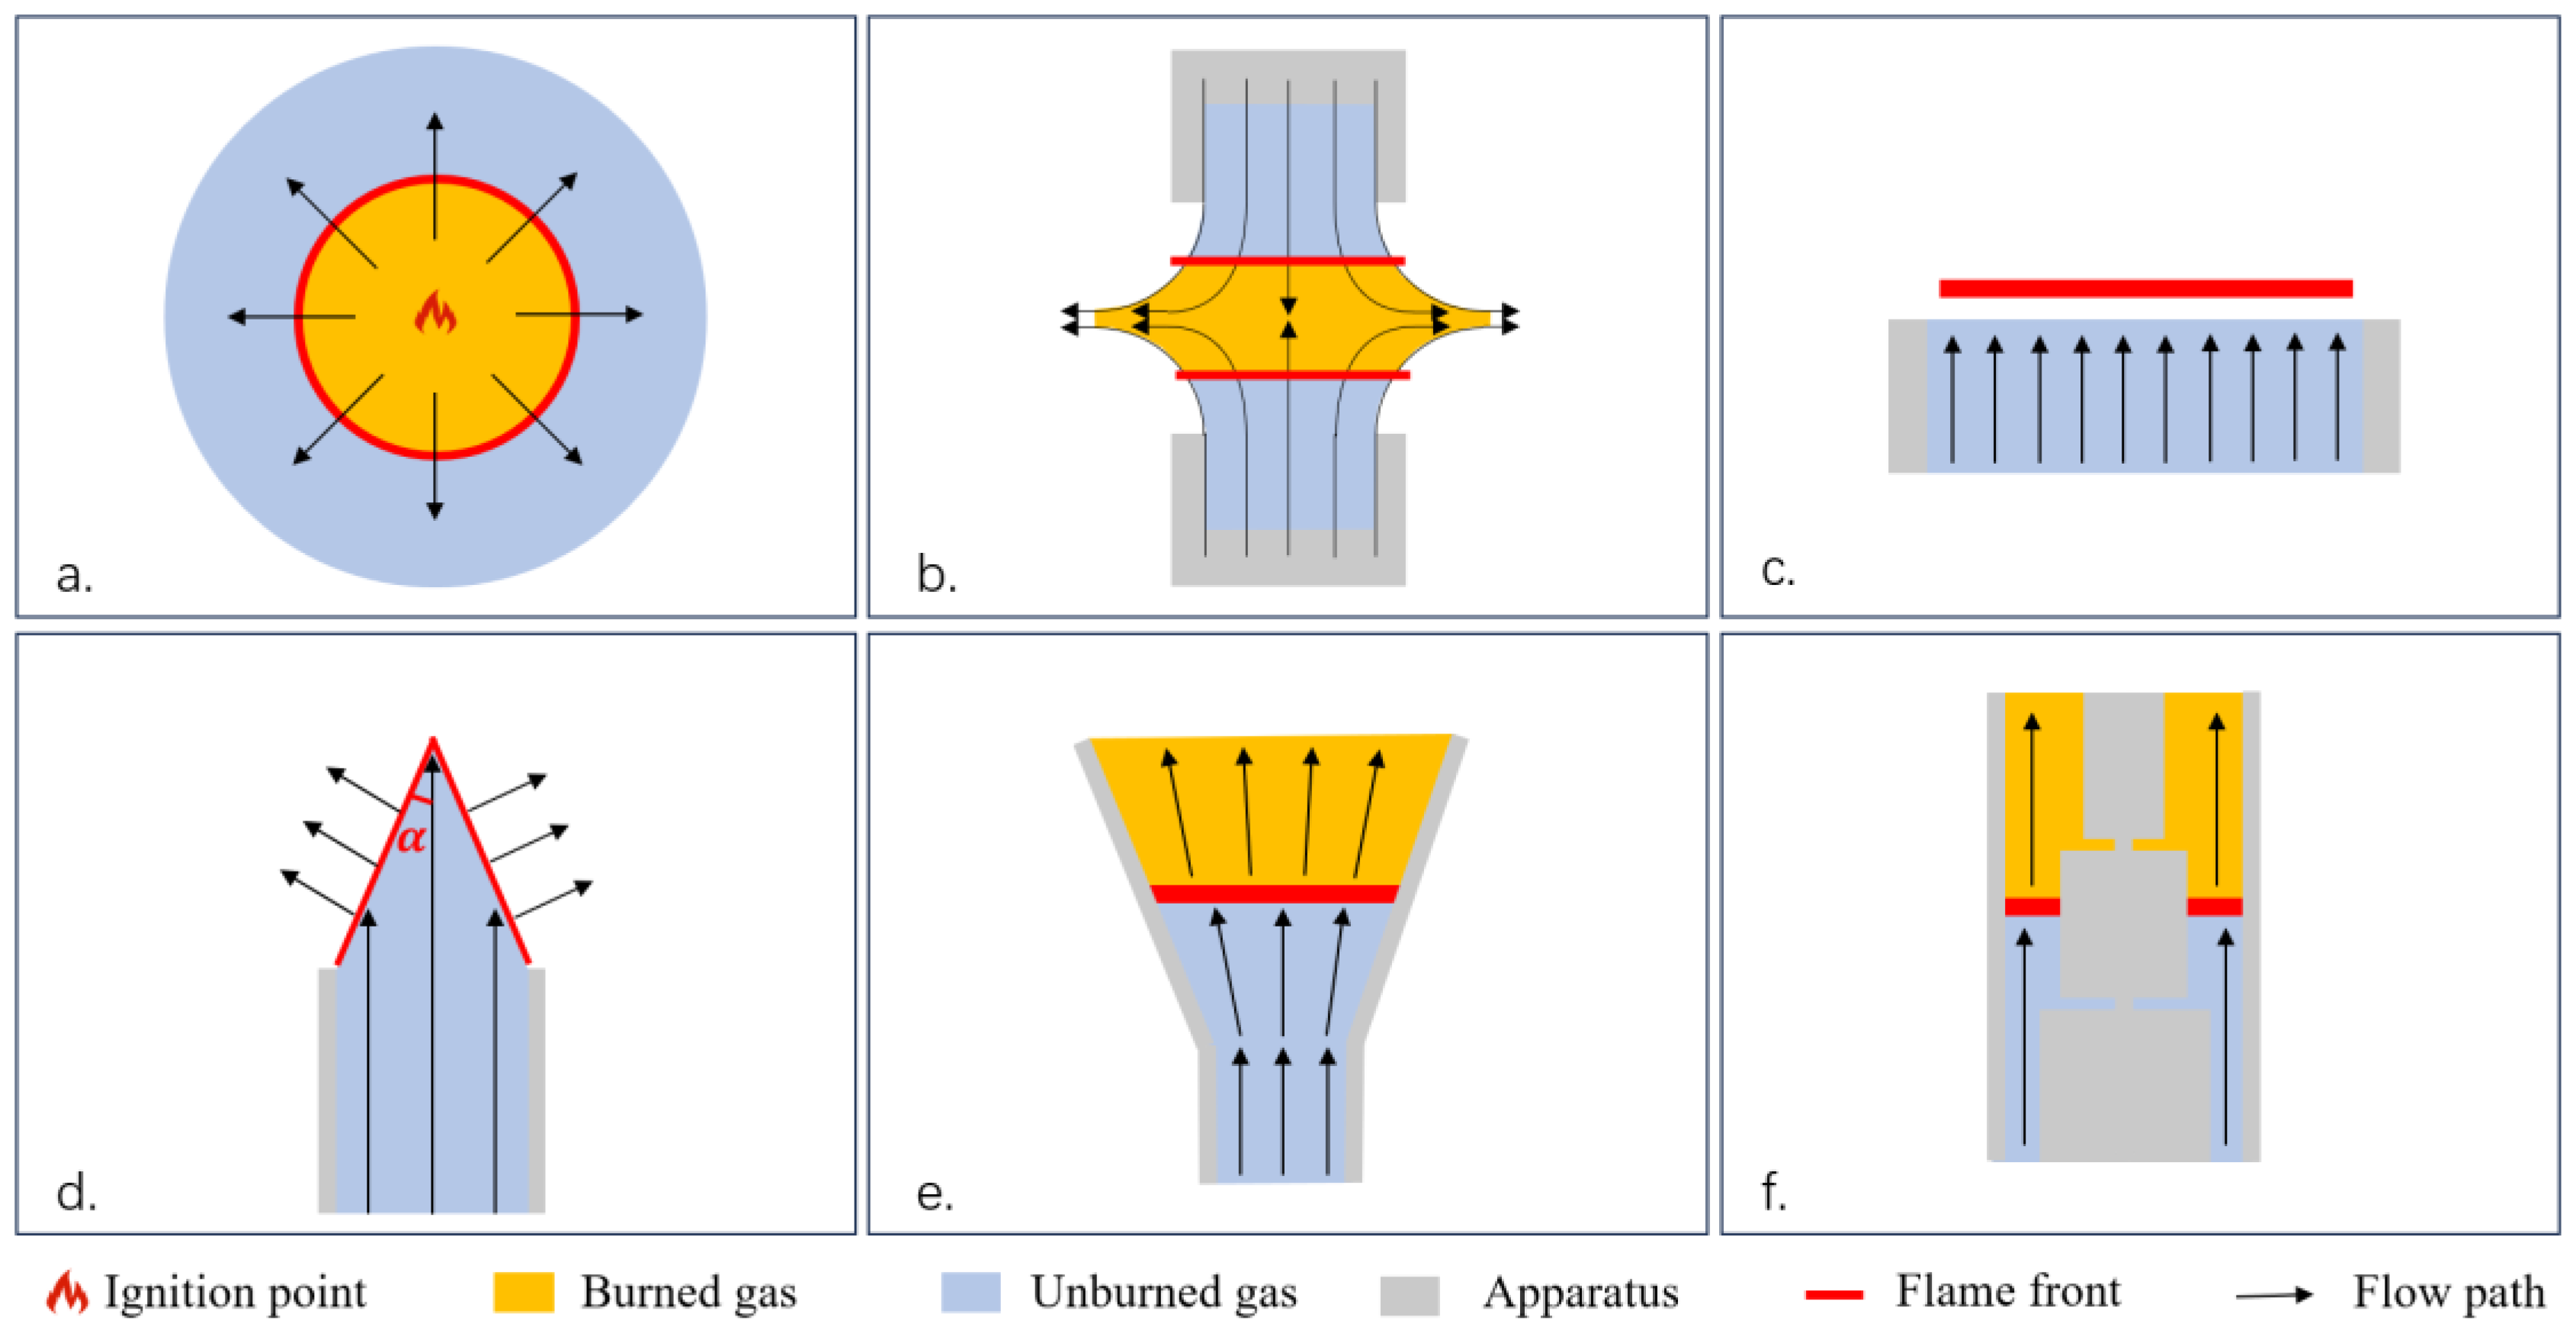
2. LBV Test Methods
3. LBV of Conventional Aviation Fuel
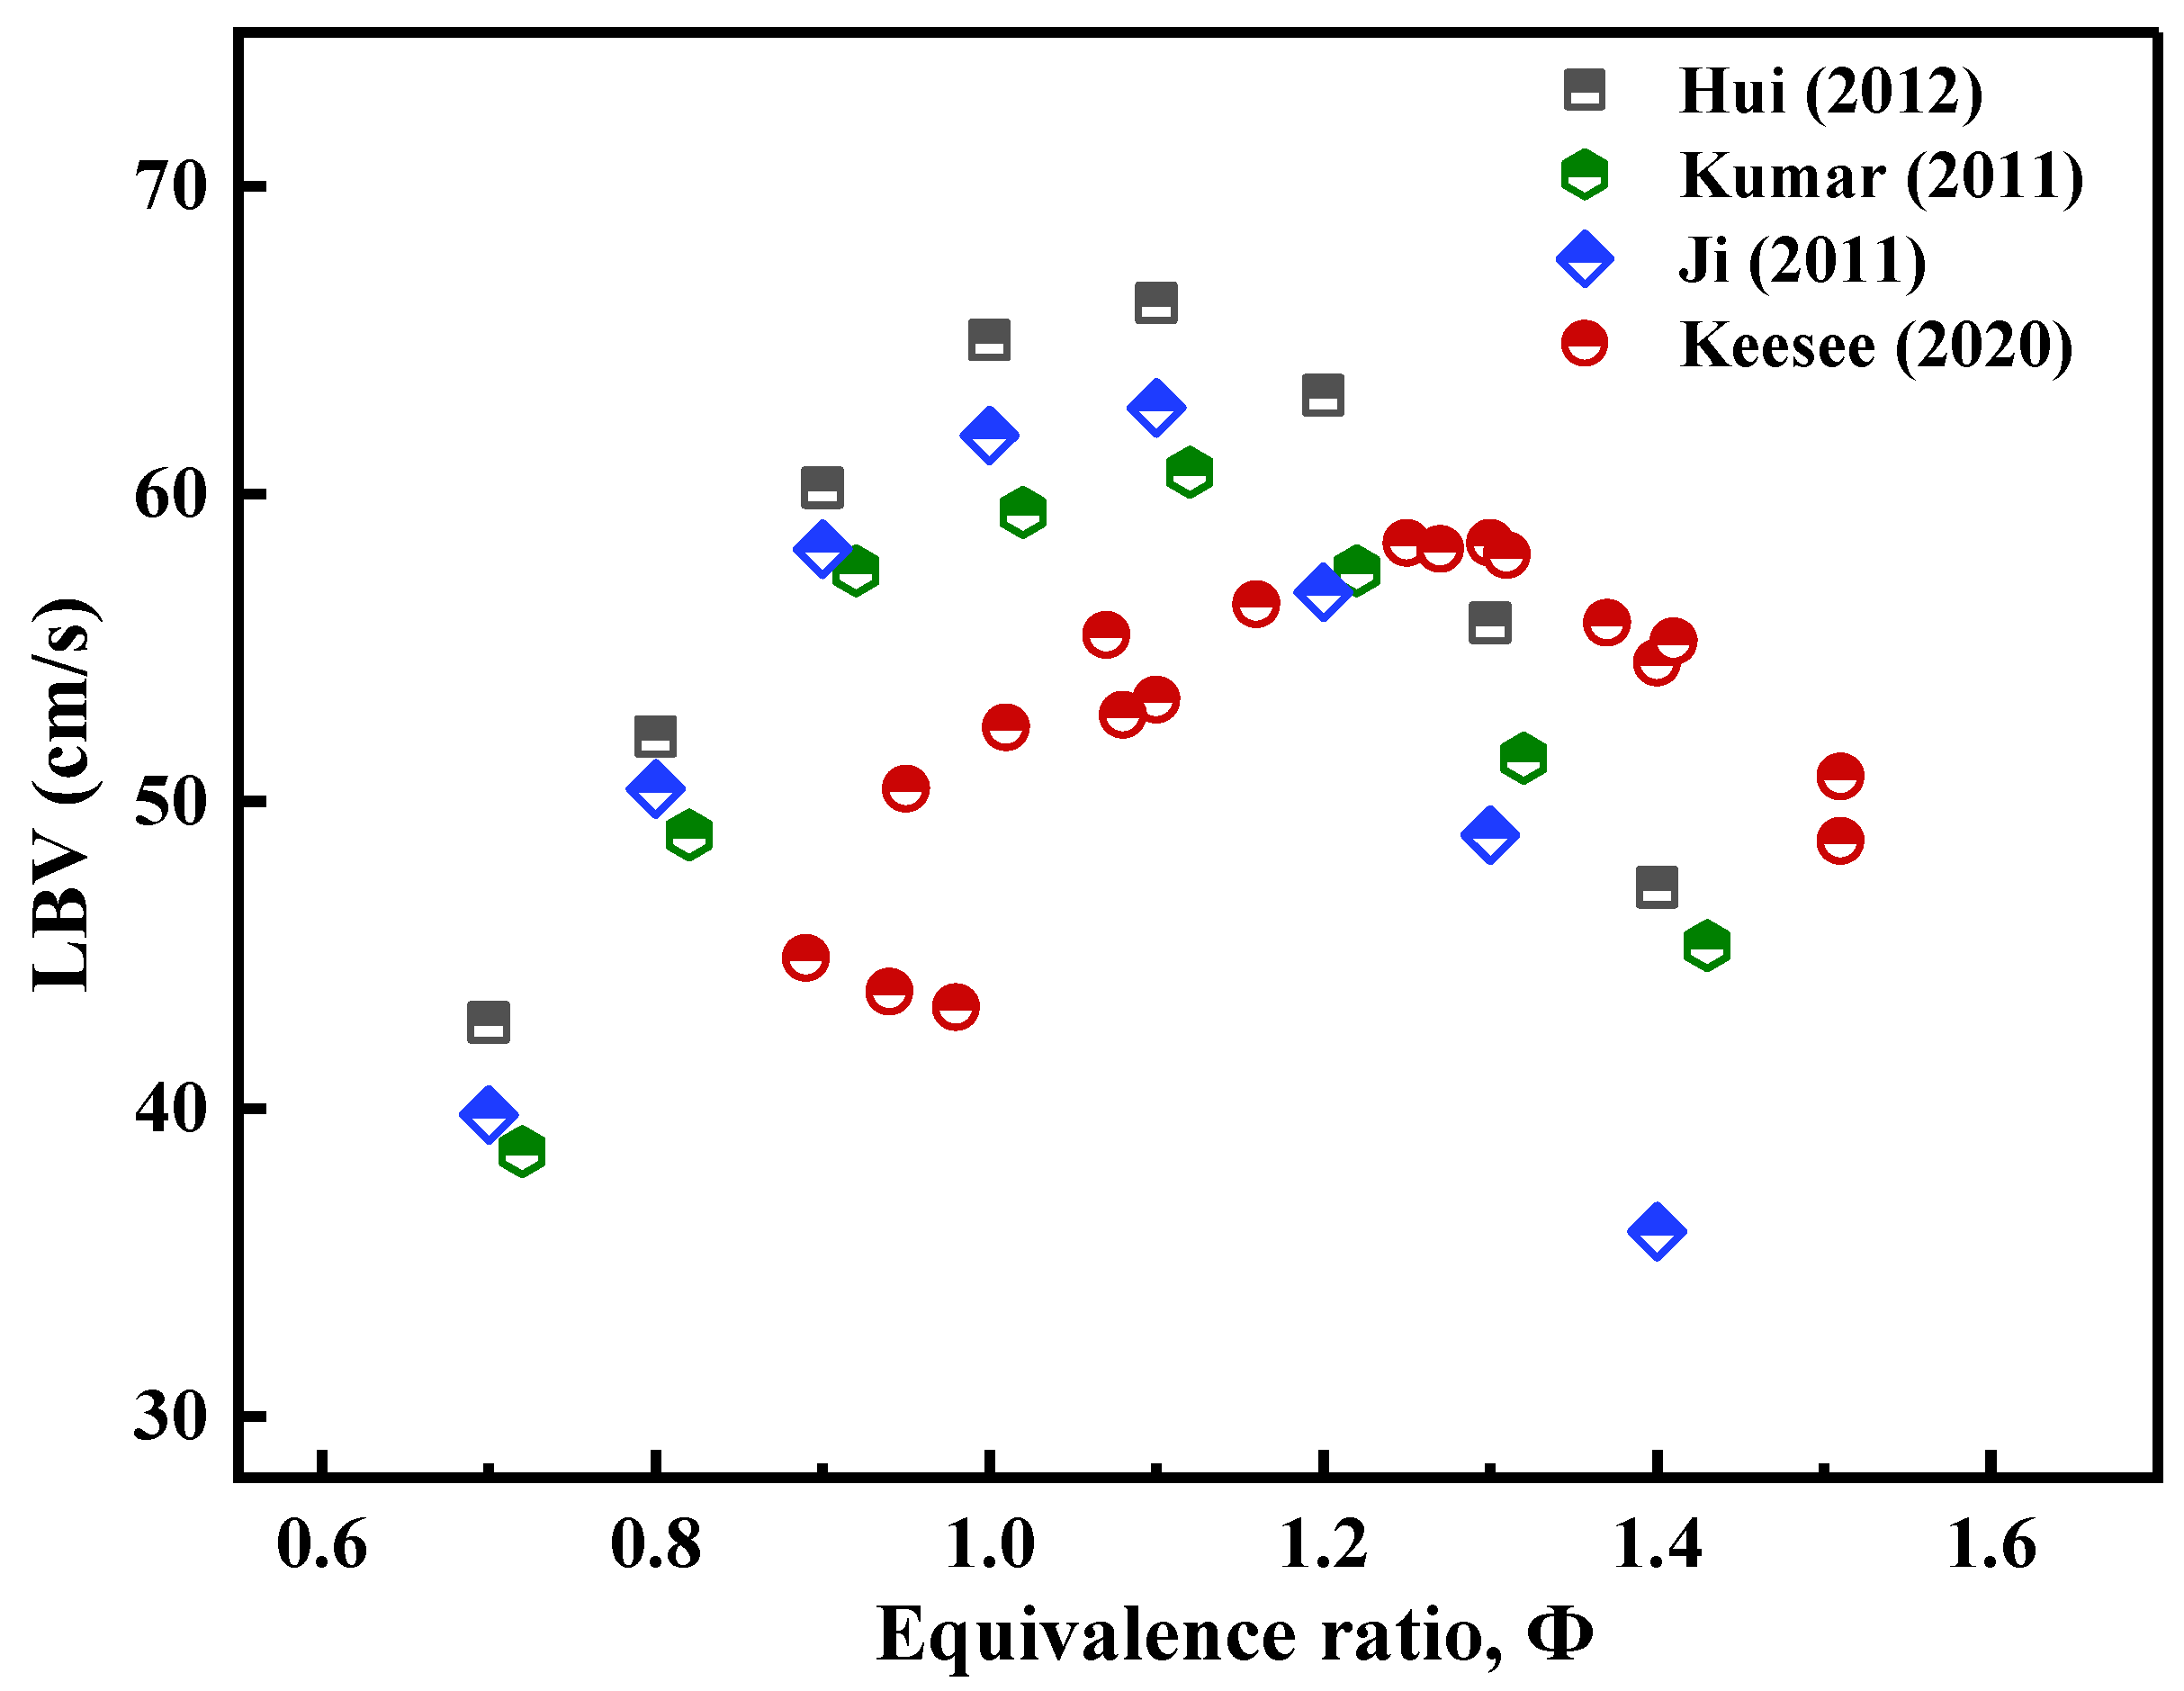
3.1. LBV of Jet A and Its Surrogate Fuel
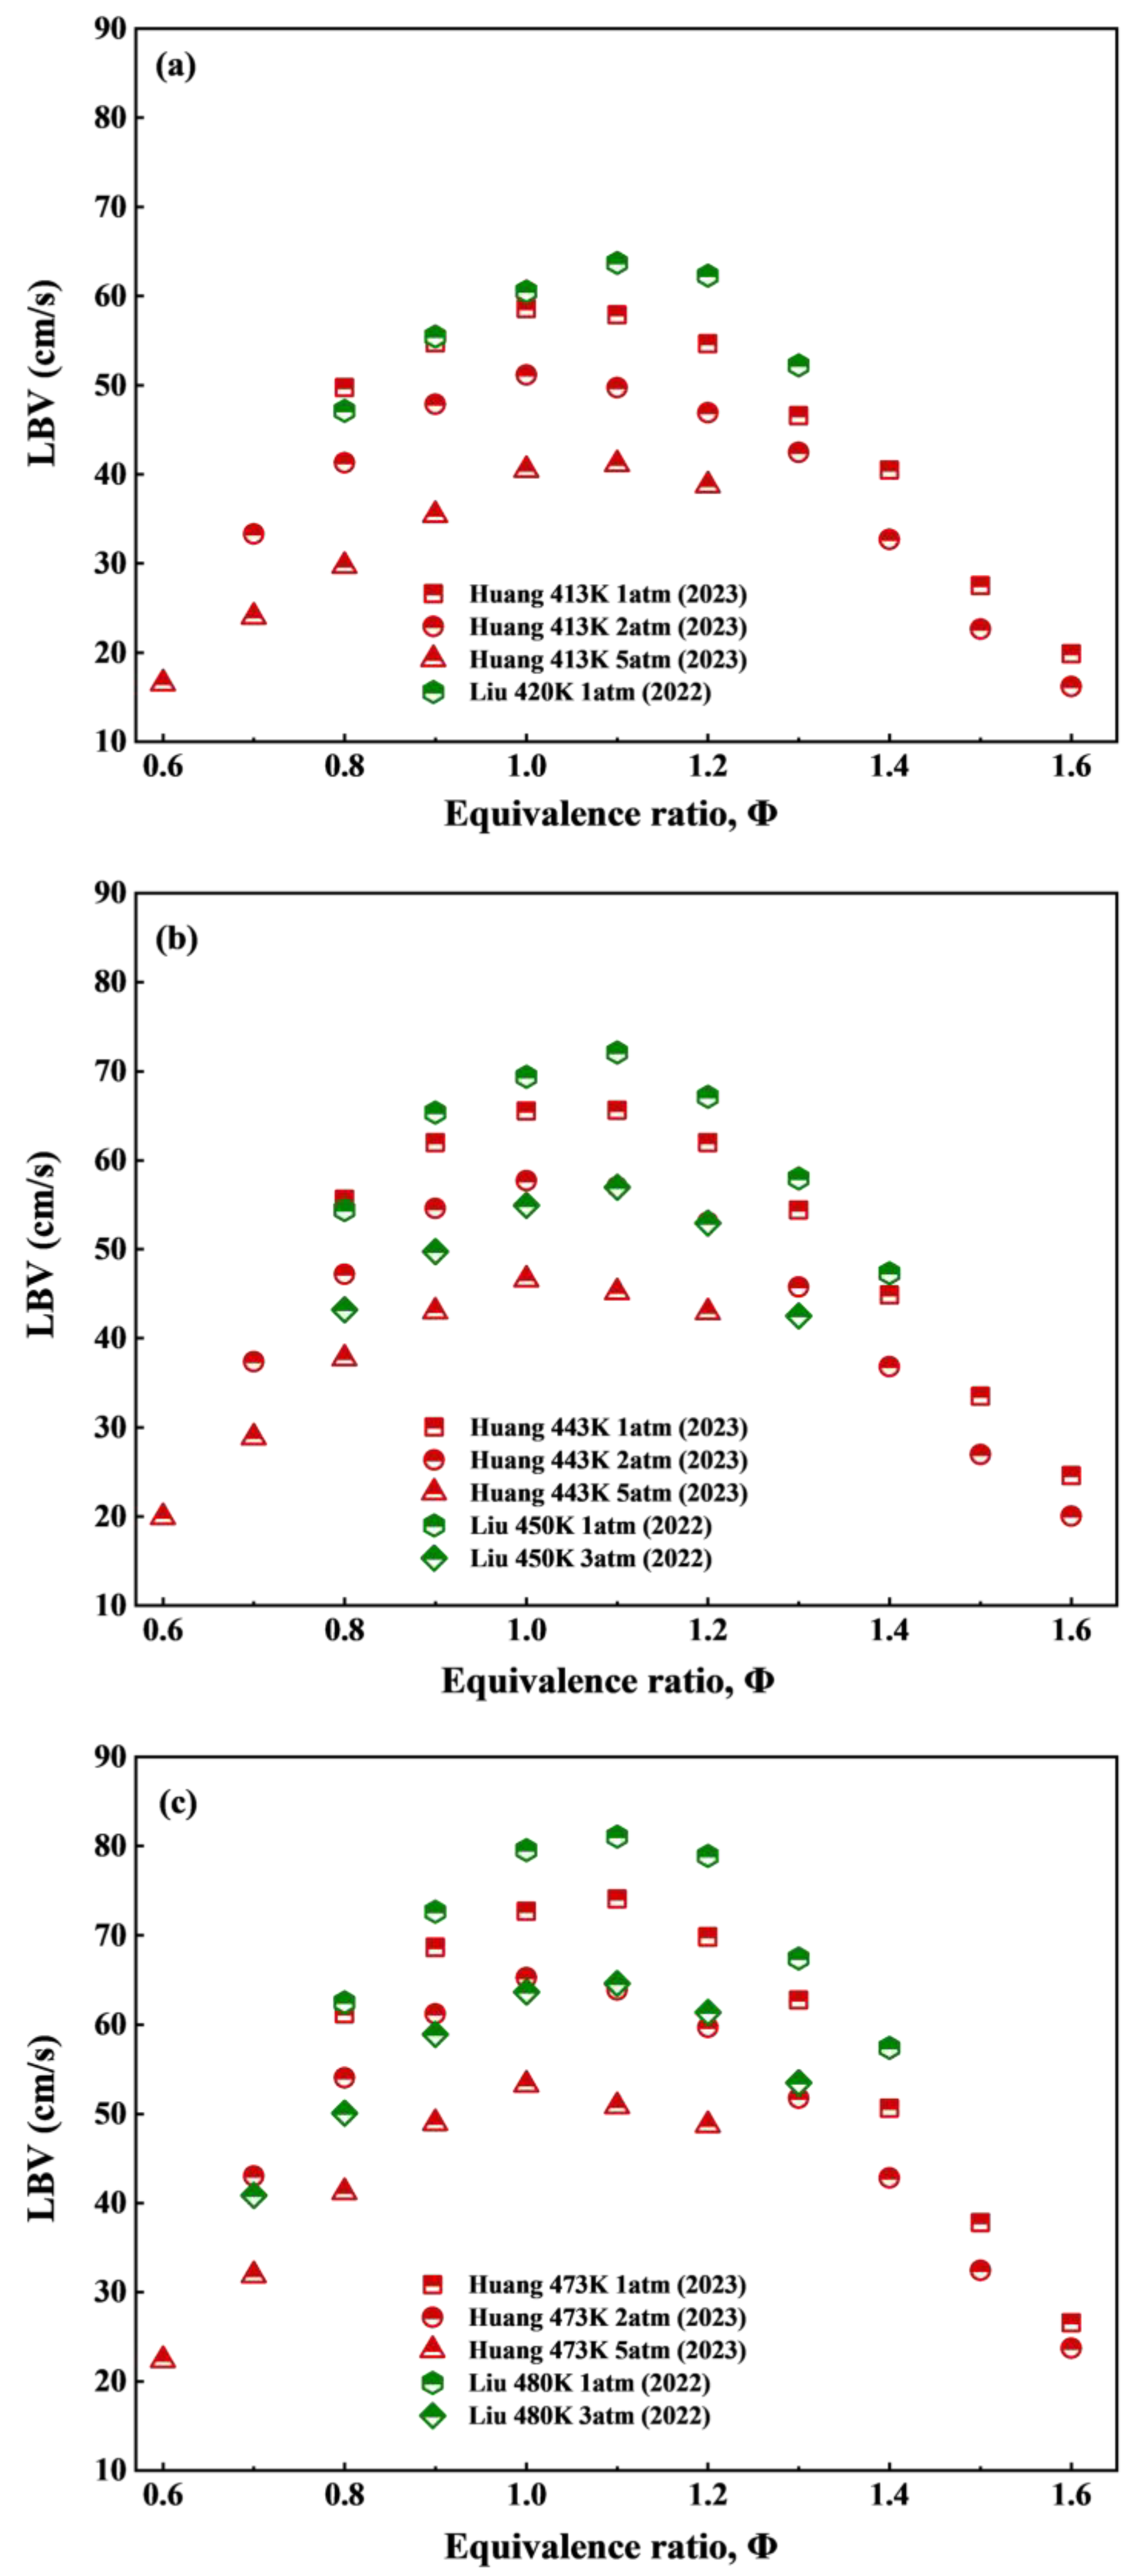
3.2. LBV of RP-3 and Its Surrogate Fuel
3.3. LBV of JP-8
3.4. The Effect of Additives on Aviation Fuel LBV
4. LBV of SAFs
4.1. LBV of Synthetic Fuels
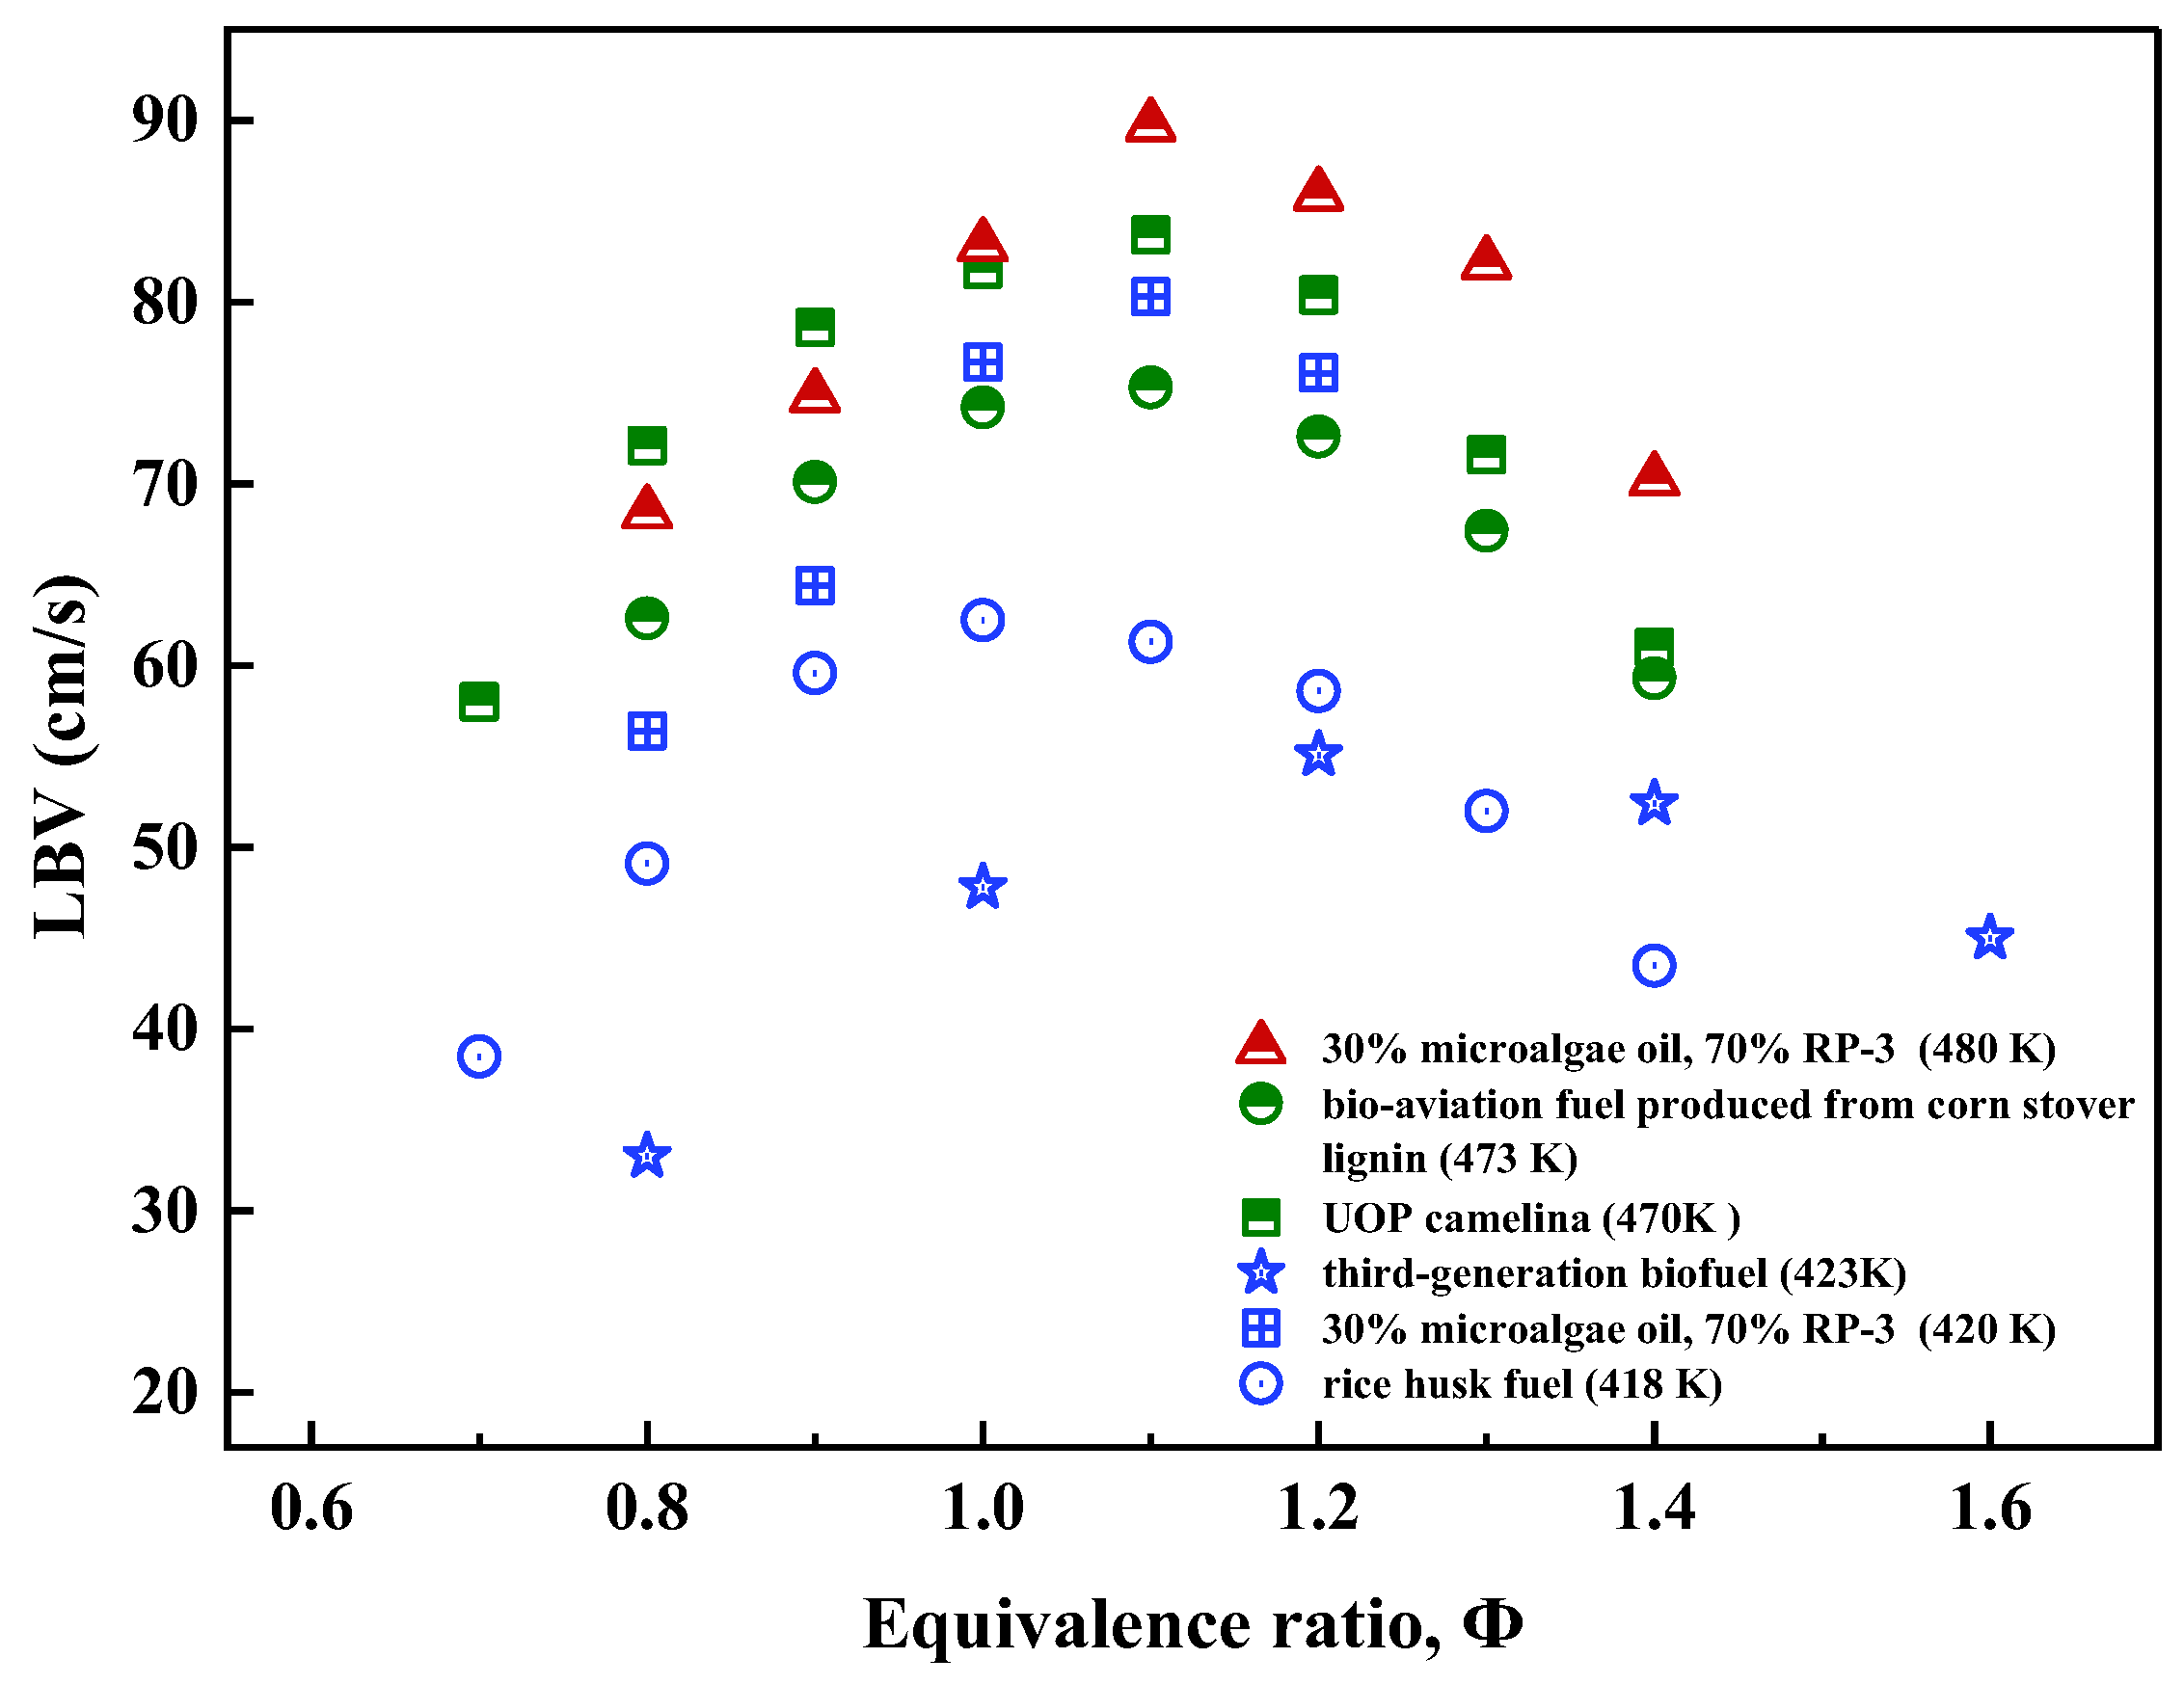
4.2. LBV of Bio-Jet Fuel
5. LBV of Key Hydrocarbon Components in Aviation Fuel
5.1. LBV of N-Alkanes in Aviation Fuel
5.2. LBV of Iso-Alkanes in Aviation Fuel
5.3. LBV of Cycloalkanes in Aviation Fuel
5.4. LBV of Aromatic Hydrocarbons in Aviation Fuel
6. Combustion Mechanism Model and Simulation Accuracies
7. Conclusions
Author Contributions
Funding
Institutional Review Board Statement
Informed Consent Statement
Data Availability Statement
Conflicts of Interest
Abbreviations and Nomenclature
| SAFs | Sustainable aviation fuels |
| LBV | Laminar burning velocity |
| PAHs | Polycyclic aromatic hydrocarbons |
| UHC | Unburned hydrocarbon |
| IATA | International Air Transport Association |
| FT-SPK | Fischer–Tropsch hydroprocessed synthesized paraffinic kerosine |
| HEFA-SPK | Synthesized paraffinic kerosene hydroprocessed esters and fatty acids |
| SIP | Synthesized iso-paraffins |
| ATJ-SPK | Alcohol-to-jet synthetic paraffinic kerosene |
| HC-HEFAs | Hydroprocessed hydrocarbons, esters, and fatty acids |
| ADT | Annular diverging tube |
| ASDT | Annular stepwise diverging tube |
| JSR | Jet stirred reactor |
| LBV_max | Maximum LBV values |
| LNG | Liquefied natural gas |
| GHGs | Greenhouse gas |
| GTL | Gas-to-liquid |
| CTL | Coal-to-liquid |
| DKM | Detailed kinetics model |
| HDO | Hydrodeoxygenation |
| PME | Palm methyl esters |
| Tad | Adiabatic flame temperature |
| SL | Laminar burning velocity |
| ug | Velocity of the unburned gas |
| α | Half-cone angle of the conical flame |
| Volumetric flow rate | |
| Af | Average flame area |
| Φ/ | Equivalence ratio |
| T0/Ti | Initial temperature of unburned mixture |
| P0/Pi | Initial pressure of unburned mixture |
| Tcr | Critical temperature |
| Pcr | Critical pressure |
| T | Temperature |
| P | Pressure |
| ADI | Adiabatic model |
| SNB | Statistical narrow-band model |
References
- Liu, J.; Zhang, D.; Hou, L.; Yang, J.; Xu, G. Laminar Burning Speed of Aviation Kerosene at Low Pressures. Energies 2022, 15, 2191. [Google Scholar] [CrossRef]
- Gong, X.; Wang, X.; Zhou, H.; Ren, Z. Laminar Flame Speed and Autoignition Characteristics of Surrogate Jet Fuel Blended with Hydrogen. Proc. Combust. Inst. 2023, 39, 1773–1781. [Google Scholar] [CrossRef]
- Yates, A.; Burger, V.; Viljoen, C. A Method for Determining The Laminar Flame Speed of Jet Fuels Using Combustion Bomb Pressure. Am. Soc. Mech. Eng. 2012, 44687, 41–51. [Google Scholar]
- Xu, H.; LaPointe, L.A. Calculation of Laminar Flame Speed and Autoignition Delay at High Temperature and Pressures. In Volume 1: Large Bore Engines; Advanced, Combustion; Emissions Control, Systems; Instrumentation, Controls, and Hybrids; American Society of Mechanical Engineers: Washington, DC, USA, 2013. [Google Scholar]
- Kumar, K.; Sung, C.-J.; Hui, X. Laminar Flame Speeds and Extinction Limits of Conventional and Alternative Jet Fuels. Fuel 2011, 90, 1004–1011. [Google Scholar] [CrossRef]
- Wu, Y.; Modica, V.; Yu, X.; Grisch, F. Experimental Investigation of Laminar Flame Speed Measurement for Kerosene Fuels: Jet A-1, Surrogate Fuel, and Its Pure Components. Energy Fuels 2018, 32, 2332–2343. [Google Scholar] [CrossRef]
- Cheng, L.; Spencer, A. Residence Time Measurement of an Isothermal Combustor Flow Field. Exp. Fluids 2012, 52, 647–661. [Google Scholar] [CrossRef]
- Egolfopoulos, F.N.; Law, C.K. Chain Mechanisms in the Overall Reaction Orders in Laminar Flame Propagation. Combust. Flame 1990, 80, 7–16. [Google Scholar] [CrossRef]
- Liu, Z.; Wang, Z.; Yang, X. Emission Characteristics of Cellulosic Jet Biofuel Blend under Laminar and Turbulent Combustion. Biotechnol. Biofuels Bioprod. 2023, 16, 196. [Google Scholar] [CrossRef] [PubMed]
- Song, Z.; Li, Z.; Liu, Z. Comparison of Emission Properties of Sustainable Aviation Fuels and Conventional Aviation Fuels: A Review. Appl. Sci. 2024, 14, 5484. [Google Scholar] [CrossRef]
- Yang, X.; Guo, F.; Xue, S.; Wang, X. Carbon Distribution of Algae-Based Alternative Aviation Fuel Obtained by Different Pathways. Renew. Sustain. Energy Rev. 2016, 54, 1129–1147. [Google Scholar] [CrossRef]
- Munzar, J.D.; Akih-Kumgeh, B.; Denman, B.M.; Zia, A.; Bergthorson, J.M. An Experimental and Reduced Modeling Study of the Laminar Flame Speed of Jet Fuel Surrogate Components. Fuel 2013, 113, 586–597. [Google Scholar] [CrossRef]
- Hui, X.; Sung, C.J. Laminar Flame Speeds of Transportation-Relevant Hydrocarbons and Jet Fuels at Elevated Temperatures and Pressures. Fuel 2013, 109, 191–200. [Google Scholar] [CrossRef]
- Li, B.; Zhang, H.; Egolfopoulos, F.N. Laminar Flame Propagation of Atmospheric Iso-Cetane/Air and Decalin/Air Mixtures. Combust. Flame 2014, 161, 154–161. [Google Scholar] [CrossRef]
- Sacchi, R.; Becattini, V.; Gabrielli, P.; Cox, B.; Dirnaichner, A.; Bauer, C.; Mazzotti, M. How to Make Climate-Neutral Aviation Fly. Nat. Commun. 2023, 14, 3989. [Google Scholar] [CrossRef] [PubMed]
- Liu, Y.; Gu, W.; Wang, J.; Rao, D.; Chen, X.; Ma, H.; Zeng, W. Study on the Laminar Burning Velocity of Ethanol/RP-3 Aviation Kerosene Premixed Flame. Combust. Flame 2022, 238, 111921. [Google Scholar] [CrossRef]
- ASTM D7566; Standard Specification for Aviation Turbine Fuel Containing Synthesized Hydrocarbons. ASTM: West Conshohocken, PA, USA, 2023.
- Li, B.; Liu, N.; Zhao, R.; Zhang, H.; Egolfopoulos, F.N. Flame Propagation of Mixtures of Air with High Molecular Weight Neat Hydrocarbons and Practical Jet and Diesel Fuels. Proc. Combust. Inst. 2013, 34, 727–733. [Google Scholar] [CrossRef]
- Kick, T.; Kathrotia, T.; Braun-Unkhoff, M.; Riedel, U. An Experimental and Modeling Study of Laminar Flame Speeds of Alternative Aviation Fuels. In Turbo Expo: Power for Land, Sea, and Air; ASME: New York, NY, USA, 2011. [Google Scholar]
- Emmanouilidou, E.; Mitkidou, S.; Agapiou, A.; Kokkinos, N.C. Solid Waste Biomass as a Potential Feedstock for Producing Sustainable Aviation Fuel: A Systematic Review. Renew. Energy 2023, 206, 897–907. [Google Scholar] [CrossRef]
- Flora, G.; Kosir, S.; Behnke, L.; Stachler, R.; Heyne, J.; Zabarnick, S.; Gupta, M. Properties Calculator and Optimization for Drop-in Alternative Jet Fuel Blends. In Proceedings of the AIAA Scitech 2019 Forum, San Diego, CA, USA, 7–11 January 2019; American Institute of Aeronautics and Astronautics Inc., AIAA: Reston, VA, USA, 2019. [Google Scholar]
- Konnov, A.A.; Mohammad, A.; Kishore, V.R.; Kim, N.I.; Prathap, C.; Kumar, S. A Comprehensive Review of Measurements and Data Analysis of Laminar Burning Velocities for Various Fuel+air Mixtures. Prog. Energy Combust. Sci. 2018, 68, 197–267. [Google Scholar] [CrossRef]
- Tippa, M.; Subbiah, S.; Prathap, C. Impact of Chamber Volume on the Measurement of Laminar Burning Velocity Using Constant Volume Spherical Flame Method. Fuel 2019, 256, 115936. [Google Scholar] [CrossRef]
- Rajesh, N.; Prathap, C. Investigation on the Laminar Burning Velocity and Flame Stability of Premixed N-Dodecane-Air Mixtures at Elevated Pressures and Temperatures. Fuel 2022, 318, 123347. [Google Scholar] [CrossRef]
- Konnov, A.A.; Chen, J.; Lubrano Lavadera, M. Measurements of the Laminar Burning Velocities of Small Alkyl Esters Using the Heat Flux Method: A Comparative Study. Combust. Flame 2023, 255, 112922. [Google Scholar] [CrossRef]
- Tippa, M.; Akash, M.; Subbiah, S.; Prathap, C. A Comprehensive Study on Laminar Burning Velocity and Flame Stability of Oxy-Producer Gas Mixtures. Part-2: Laminar Burning Velocity and Markstein Length Analysis. Fuel 2021, 292, 119982. [Google Scholar] [CrossRef]
- Jung, Y.; Lee, M.J.; Kim, N. Il Direct Prediction of Laminar Burning Velocity and Quenching Distance of Hydrogen-Air Flames Using an Annular Stepwise Diverging Tube (ASDT). Combust. Flame 2016, 164, 397–399. [Google Scholar] [CrossRef]
- Varghese, R.J.; Kolekar, H.; Kishore, V.R.; Kumar, S. Measurement of Laminar Burning Velocities of Methane-Air Mixtures Simultaneously at Elevated Pressures and Elevated Temperatures. Fuel 2019, 257, 116120. [Google Scholar] [CrossRef]
- Wu, C.K.; Law, C.K. On the Determination of Laminar Flame Speeds from Stretched Flames. Symp. (Int.) Combust. 1985, 20, 1941–1949. [Google Scholar] [CrossRef]
- Denman, B.M.; Munzar, J.D.; Bergthorson, J.M. GT2012-69917 An Experimental and Numerical Study of The Laminar Flame Speed of Jet Fuel Surrogate Blends. In Turbo Expo: Power for Land, Sea, and Air; ASME: New York, NY, USA, 2012. [Google Scholar]
- Liu, Y.X.; Richter, S.; Naumann, C.; Braun-Unkhoff, M.; Tian, Z.Y. Combustion Study of a Surrogate Jet Fuel. Combust. Flame 2019, 202, 252–261. [Google Scholar] [CrossRef]
- Idirsov, D.V.; Matveev, S.S.; Matveev, S.G.; Popov, A.D.; Belousov, A.N. Laminar Burning Velocity of the Surrogate of Aircraft Kerosene and Its Components. In Proceedings of the 2021 International Scientific and Technical Engine Conference, EC 2021, Samara, Russia, 23–25 June 2021; Institute of Electrical and Electronics Engineers Inc.: New York, NY, USA, 2021. [Google Scholar]
- Hui, X.; Kumar, K.; Sung, C.-J.; Edwards, T.; Gardner, D. Experimental Studies on the Combustion Characteristics of Alternative Jet Fuels. Fuel 2012, 98, 176–182. [Google Scholar] [CrossRef]
- Hwang, B.J.; Kang, S.; Lee, H.J.; Min, S. Measurement of Laminar Burning Velocity of High Performance Alternative Aviation Fuels. Fuel 2020, 261, 116466. [Google Scholar] [CrossRef]
- Kick, T.h.; Herbst, J.; Kathrotia, T.; Marquetand, J.; Braun-Unkhoff, M.; Naumann, C.; Riedel, U. An Experimental and Modeling Study of Burning Velocities of Possible Future Synthetic Jet Fuels. Energy 2012, 43, 111–123. [Google Scholar] [CrossRef]
- Chong, C.T.; Hochgreb, S. Measurements of Laminar Flame Speeds of Liquid Fuels: Jet-A1, Diesel, Palm Methyl Esters and Blends Using Particle Imaging Velocimetry (PIV). Proc. Combust. Inst. 2011, 33, 979–986. [Google Scholar] [CrossRef]
- Richter, S.; Kathrotia, T.; Naumann, C.; Kick, T.; Slavinskaya, N.; Braun-Unkhoff, M.; Riedel, U. Experimental and Modeling Study of Farnesane. Fuel 2018, 215, 22–29. [Google Scholar] [CrossRef]
- Metghalchi, M.; Keck, J.C. Burning Velocities of Mixtures of Air with Methanol, Isooctane, and Indolene at High Pressure and Temperature. Combust. Flame 1982, 48, 191–210. [Google Scholar] [CrossRef]
- Konnov, A.A.; Meuwissen, R.J.; de Goey, L.P.H. The Temperature Dependence of the Laminar Burning Velocity of Ethanol Flames. Proc. Combust. Inst. 2011, 33, 1011–1019. [Google Scholar] [CrossRef]
- Wu, Y.; Modica, V.; Rossow, B.; Grisch, F. Effects of Pressure and Preheating Temperature on the Laminar Flame Speed of Methane/Air and Acetone/Air Mixtures. Fuel 2016, 185, 577–588. [Google Scholar] [CrossRef]
- Liu, Y.; Liu, Y.; Chen, D.; Fang, W.; Li, J.; Yan, Y. A Simplified Mechanistic Model of Three-Component Surrogate Fuels for RP-3 Aviation Kerosene. Energy Fuels 2018, 32, 9949–9960. [Google Scholar] [CrossRef]
- Liu, J.; Hu, E.; Yin, G.; Huang, Z.; Zeng, W. An Experimental and Kinetic Modeling Study on the Low-Temperature Oxidation, Ignition Delay Time, and Laminar Flame Speed of a Surrogate Fuel for RP-3 Kerosene. Combust. Flame 2022, 237, 111821. [Google Scholar] [CrossRef]
- Huang, L.; Huang, S.; Mao, Y.; Wang, B.; Zhu, Q.; Jiang, R. An Experimental Study on the Laminar Burning Velocities of RP-3 Kerosene and Its Surrogate Fuel at Elevated Pressures and Temperatures. Fuel 2023, 331, 125844. [Google Scholar] [CrossRef]
- Far, K.E.; Parsinejad, F.; Metghalchi, H. Flame Structure and Laminar Burning Speeds of JP-8/Air Premixed Mixtures at High Temperatures and Pressures. Fuel 2010, 89, 1041–1049. [Google Scholar] [CrossRef]
- Mazas, A.N.; Fiorina, B.; Lacoste, D.A.; Schuller, T. Effects of Water Vapor Addition on the Laminar Burning Velocity of Oxygen-Enriched Methane Flames. Combust. Flame 2011, 158, 2428–2440. [Google Scholar] [CrossRef]
- Yoshida, A.; Okawa, T.; Ebina, W.; Naito, H. Experimental and Numerical Investigation of Flame Speed Retardation by Water Mist. Combust. Flame 2015, 162, 1772–1777. [Google Scholar] [CrossRef]
- Das, A.K.; Kumar, K.; Sung, C.-J. Laminar Flame Speeds of Moist Syngas Mixtures. Combust. Flame 2011, 158, 345–353. [Google Scholar] [CrossRef]
- Zheng, S.; Liu, H.; Li, Q.; Zhu, J.; Sun, M.; Zhou, B.; Sui, R.; Lu, Q. Effects of Radiation Reabsorption on the Laminar Flame Speed and NO Emission during Aviation Kerosene Combustion at Elevated Pressures. Fuel 2022, 324, 124545. [Google Scholar] [CrossRef]
- Wei, H.; Gao, D.; Zhou, L.; Petrakides, S.; Chen, R.; Feng, D.; Pan, J. Experimental Study on Laminar Flame Characteristics of Methane-PRF95 Dual Fuel under Lean Burn Conditions. Fuel 2016, 185, 254–262. [Google Scholar] [CrossRef]
- Liu, Y.; Wang, J.; Gu, W.; Ma, H.; Zeng, W. Effects of CH4 Mixing on the Laminar Burning Velocity and Markstein Length of RP-3/Air Premixed Flame. Fuel 2021, 289, 119761. [Google Scholar] [CrossRef]
- Liu, Y.; Luo, R.; Sun, Z.; Zeng, W.; Chen, B.; Chung, S.S. Experimental Study on the Markstein Length and Laminar Burning Velocity of CH4/RP-3 Mixture. J. Mech. Sci. Technol. 2017, 31, 5527–5537. [Google Scholar] [CrossRef]
- He, X.; Jiang, Z.; Sang, Z.; Liu, Z.; Feng, G.; Yang, Q.; Jiang, H. Laminar Combustion Characteristics of Jet-A Surrogate Fuel/Ethanol. Trans. Beijing Inst. Technol. 2023, 43, 712–718. [Google Scholar] [CrossRef]
- Keesee, C.L.; Guo, B.; Petersen, E.L. Laminar Flame Speed Experiments of Alternative Liquid Fuels. J. Eng. Gas Turbine Power 2020, 142, 011013. [Google Scholar] [CrossRef]
- Ji, C.; Wang, Y.L.; Egolfopoulos, F.N. Flame Studies of Conventional and Alternative Jet Fuels. J. Propuls. Power 2011, 27, 856–863. [Google Scholar] [CrossRef]
- Mzé-Ahmed, A.; Hadj-Ali, K.; Diévart, P.; Dagaut, P. Kinetics of Oxidation of a Synthetic Jet Fuel in a Jet-Stirred Reactor: Experimental and Modeling Study. Energy Fuels 2010, 24, 4904–4911. [Google Scholar] [CrossRef]
- Togbé, C.; Dagaut, P.; Mzé-Ahmed, A.; Diévart, P.; Halter, F.; Foucher, F. Experimental and Detailed Kinetic Modeling Study of 1-Hexanol Oxidation in a Pressurized Jet-Stirred Reactor and a Combustion Bomb. Energy Fuels 2010, 24, 5859–5875. [Google Scholar] [CrossRef]
- Wang, Z.; Alswat, M.; Yu, G.; Allehaibi, M.O.; Metghalchi, H. Flame Structure and Laminar Burning Speed of Gas to Liquid Fuel Air Mixtures at Moderate Pressures and High Temperatures. Fuel 2017, 209, 529–537. [Google Scholar] [CrossRef]
- Wang, Z.; Bai, Z.; Yelishala, S.C.; Yu, G.; Metghalchi, H. Effects of Diluent on Laminar Burning Speed and Flame Structure of Gas to Liquid Fuel Air Mixtures at High Temperatures and Moderate Pressures. Fuel 2018, 231, 204–214. [Google Scholar] [CrossRef]
- Ibrahim, A.S.; Ahmed, S.F. Measurements of Laminar Flame Speeds of Alternative Gaseous Fuel Mixtures. J. Energy Resour. Technol. Trans. 2015, 137, 032209. [Google Scholar] [CrossRef]
- Yu, G.; Askari, O.; Hadi, F.; Wang, Z.; Metghalchi, H.; Kannaiyan, K.; Sadr, R. Theoretical Prediction of Laminar Burning Speed and Ignition Delay Time of Gas-to-Liquid Fuel. J. Energy Resour. Technol. Trans. 2017, 139, 022202. [Google Scholar] [CrossRef]
- Dong, S.; Song, Z.; Meng, Z.; Liu, Z. Biofuel–Electric Hybrid Aircraft Application—A Way to Reduce Carbon Emissions in Aviation. Aerospace 2024, 11, 575. [Google Scholar] [CrossRef]
- Liu, Y.; Gu, W.; Wang, J.; Ma, H.; Dong, N.; Zeng, W. Laminar Burning Velocity of Microalgae Oil/RP-3 Premixed Flame at Elevated Initial Temperature and Pressure. Fuel 2022, 309, 122081. [Google Scholar] [CrossRef]
- Xu, C.; Liu, K.; Song, Y.; Cui, D.; Li, X.; Wang, Q.; Oppong, F. Laminar Burning Characteristics of Bio-Aviation Fuel Candidate Derived from Lignocellulosic Biomass. Fuel 2023, 334, 126719. [Google Scholar] [CrossRef]
- Abi Nurazaq, W.; Wang, W.C.; Lin, J.K. The Properties of Sustainable Aviation Fuel II: Laminar Flame Speed. Energy 2024, 294, 130946. [Google Scholar] [CrossRef]
- Xu, C.; Zhong, A.; Li, X.; Wang, C.; Sahu, A.; Xu, H.; Lattimore, T.; Zhou, K.; Huang, Y. Laminar Burning Characteristics of Upgraded Biomass Pyrolysis Fuel Derived from Rice Husk at Elevated Pressures and Temperatures. Fuel 2017, 210, 249–261. [Google Scholar] [CrossRef]
- Wu, Y.; Rossow, B.; Modica, V.; Yu, X.; Wu, L.; Grisch, F. Laminar Flame Speed of Lignocellulosic Biomass-Derived Oxygenates and Blends of Gasoline/Oxygenates. Fuel 2017, 202, 572–582. [Google Scholar] [CrossRef]
- Davis, S.G.; Law, C.K. Determination of and Fuel Structure Effects on Laminar Flame Speeds of C1 to C8 Hydrocarbons. Combust. Sci. Technol. 1998, 140, 427–449. [Google Scholar] [CrossRef]
- Kumar, R.; Velamati, R.K.; Kumar, S. Combustion of N-Decane+air Mixtures To Investigate Laminar Burning Velocity Measurements At Elevated Temperatures. Combust. Sci. Technol. 2022, 196, 1490–1508. [Google Scholar] [CrossRef]
- Xu, C.; Wang, Q.; Li, X.; Liu, K.; Liu, W.; Oppong, F.; Sun, Z.-Y. Effect of Hydrogen Addition on the Laminar Burning Velocity of N-Decane/Air Mixtures: Experimental and Numerical Study. Int. J. Hydrogen Energy 2022, 47, 19263–19274. [Google Scholar] [CrossRef]
- Moghaddas, A.; Eisazadeh-Far, K.; Metghalchi, H. Laminar Burning Speed Measurement of Premixed N-Decane/Air Mixtures Using Spherically Expanding Flames at High Temperatures and Pressures. Combust. Flame 2012, 159, 1437–1443. [Google Scholar] [CrossRef]
- Zhao, Z.; Li, J.; Kazakov, A.; Dryer, F.L.; Zeppieri, S.P. Burning Velocities and A High-Temperature Skeletal Kinetic Model for n-Decane. Combust. Sci. Technol. 2004, 177, 89–106. [Google Scholar] [CrossRef]
- Kumar, K.; Sung, C.-J. Laminar Flame Speeds and Extinction Limits of Preheated N-Decane/O2/N2 and n-Dodecane/O2/N2 Mixtures. Combust. Flame 2007, 151, 209–224. [Google Scholar] [CrossRef]
- Ranzi, E.; Frassoldati, A.; Stagni, A.; Pelucchi, M.; Cuoci, A.; Faravelli, T. Reduced Kinetic Schemes of Complex Reaction Systems: Fossil and Biomass-Derived Transportation Fuels. Int. J. Chem. Kinet. 2014, 46, 512–542. [Google Scholar] [CrossRef]
- Ji, C.; Dames, E.; Wang, Y.L.; Wang, H.; Egolfopoulos, F.N. Propagation and Extinction of Premixed C5–C12 n-Alkane Flames. Combust. Flame 2010, 157, 277–287. [Google Scholar] [CrossRef]
- Zeng, M.; Yuan, W.; Li, W.; Zhang, Y.; Cao, C.; Li, T.; Zou, J. Comprehensive Experimental and Kinetic Modeling Study of N-Tetradecane Combustion. Energy Fuels 2017, 31, 12712–12720. [Google Scholar] [CrossRef]
- Le Dortz, R.; Strozzi, C.; Sotton, J.; Bellenoue, M. Evaluation of the Surrogates Capacity to Reproduce the Laminar Burning Velocities and the Sensitivity to Stretching of a Commercial Kerosene under Constant Volume Combustion Conditions. Fuel 2021, 287, 119426. [Google Scholar] [CrossRef]
- Cheng, Y.; Tang, C.; Huang, Z. Kinetic analysis of H2 addition effect on the laminar flame parameters of the C1–C4 n-alkane-air mixtures: From one step overall assumption to detailed reaction mechanism. Int. J. Hydrogen Energy 2015, 40, 703–718. [Google Scholar] [CrossRef]
- Xie, S.; Li, X.; Li, T.; Huo, J.; Wang, J.; Wang, C.; Wang, X. Experimental and Numerical Study on the Laminar Burning Velocities of N-Decane/Toluene/Air Mixtures at Elevated Temperatures. Fuel 2022, 322, 124176. [Google Scholar] [CrossRef]
- Comandini, A.; Dubois, T.; Chaumeix, N. Laminar Flame Speeds of n -Decane, n -Butylbenzene, and n -Propylcyclohexane Mixtures. Proc. Combust. Inst. 2015, 35, 671–678. [Google Scholar] [CrossRef]
- Kim, H.H.; Won, S.H.; Santner, J.; Chen, Z.; Ju, Y. Measurements of the Critical Initiation Radius and Unsteady Propagation of N-Decane/Air Premixed Flames. Proc. Combust. Inst. 2013, 34, 929–936. [Google Scholar] [CrossRef]
- Singh, D.; Nishiie, T.; Qiao, L. Experimental and Kinetic Modeling Study of the Combustion of N-Decane, Jet-A, and S-8 in Laminar Premixed Flames. Combust. Sci. Technol. 2011, 183, 1002–1026. [Google Scholar] [CrossRef]
- Sun, Y.; Qian, Y.; Sun, Z.; Gong, Z.; Gu, X. Experimental and Simulation Study on the Combustion Characteristics of Ammonia/n-Dodecane Mixtures. Fuel 2024, 358, 130143. [Google Scholar] [CrossRef]
- Sher, E.; Ozdor, N. Laminar Burning Velocities of N-Butane/Air Mixtures Enriched with Hydrogen. Combust. Flame 1992, 89, 214–220. [Google Scholar] [CrossRef]
- Sadeq, A.M. Combustion Advancements: From Molecules to Future Challenges, 1st ed.; 2023; ISBN 979-8-9907836-1-4. Available online: https://www.academia.edu/124741478/Combustion_Advancements_from_Molecules_to_Future_Challenges (accessed on 16 July 2025).
- Dirrenberger, P.; Le Gall, H.; Bounaceur, R.; Glaude, P.-A.; Battin-Leclerc, F. Measurements of Laminar Burning Velocities above Atmospheric Pressure Using the Heat Flux Method—Application to the Case of n-Pentane. Energy Fuels 2015, 29, 398–404. [Google Scholar] [CrossRef]
- Li, X.; Hu, E.; Lu, X.; Huang, S.; Huang, Z. Experimental and Kinetic Study on Laminar Flame Speeds of Hexene Isomers and N-Hexane. Fuel 2019, 243, 533–540. [Google Scholar] [CrossRef]
- Dirrenberger, P.; Glaude, P.A.; Bounaceur, R.; Le Gall, H.; da Cruz, A.P.; Konnov, A.A.; Battin-Leclerc, F. Laminar Burning Velocity of Gasolines with Addition of Ethanol. Fuel 2014, 115, 162–169. [Google Scholar] [CrossRef]
- Yin, G.; Hu, E.; Li, X.; Lv, X.; Huang, Z. Laminar Flame Instability of N-Hexane, n-Octane, and n-Decane in Spherical Expanding Flames. J. Therm. Sci. 2024, 33, 1189–1199. [Google Scholar] [CrossRef]
- Mun, H.-C.; Zhong, B.-J. Experimental Study and Kinetic Modeling for the Laminar Flame Speed of Methyl Octanoate and n-Nonane. Combust. Sci. Technol. 2024, 196, 1575–1597. [Google Scholar] [CrossRef]
- Zhou, C.W.; Li, Y.; O’Connor, E.; Somers, K.P.; Thion, S.; Keesee, C.; Mathieu, O.; Petersen, E.L.; DeVerter, T.A.; Oehlschlaeger, M.A.; et al. A Comprehensive Experimental and Modeling Study of Isobutene Oxidation. Combust. Flame 2016, 167, 353–379. [Google Scholar] [CrossRef]
- Li, W.; Wang, G.; Li, Y.; Li, T.; Zhang, Y.; Cao, C.; Zou, J.; Law, C.K. Experimental and Kinetic Modeling Investigation on Pyrolysis and Combustion of N-Butane and i-Butane at Various Pressures. Combust. Flame 2018, 191, 126–141. [Google Scholar] [CrossRef]
- Marshall, S.P.; Stone, R.; Hegheş, C.; Davies, T.J.; Cracknell, R.F. High Pressure Laminar Burning Velocity Measurements and Modelling of Methane and N-Butane. Combust. Theory Model. 2010, 14, 519–540. [Google Scholar] [CrossRef]
- Kumar, K.; Sung, C.J. Flame Propagation and Extinction Characteristics of Neat Surrogate Fuel Components. Energy Fuels 2010, 24, 3840–3849. [Google Scholar] [CrossRef]
- Ji, C.; Sarathy, S.M.; Veloo, P.S.; Westbrook, C.K.; Egolfopoulos, F.N. Effects of Fuel Branching on the Propagation of Octane Isomers Flames. Combust. Flame 2012, 159, 1426–1436. [Google Scholar] [CrossRef]
- Saraee, H.S.; Hughes, K.J.; Shi, S.; Ingham, D.B.; Pourkashanian, M. Skeletal and Compact Validated Mechanisms for Iso-Dodecane Using a Decoupling Methodology. Energy Fuels 2023, 37, 2307–2318. [Google Scholar] [CrossRef]
- Kumar, R.; Kishore Velamati, R.; Kumar, S. Combustion of Methylcyclohexane at Elevated Temperatures to Investigate Burning Velocity for Surrogate Fuel Development. J. Hazard. Mater. 2021, 406, 124627. [Google Scholar] [CrossRef] [PubMed]
- Lubrano Lavadera, M.; Pelucchi, M.; Konnov, A.A. The Influence of Ammonia on the Laminar Burning Velocities of Methylcyclohexane and Toluene: An Experimental and Kinetic Modeling Study. Combust. Flame 2022, 237, 111839. [Google Scholar] [CrossRef]
- Zhao, H.; Wang, J.; Cai, X.; Tian, Z.; Li, Q.; Huang, Z. A Comparison Study of Cyclopentane and Cyclohexane Laminar Flame Speeds at Elevated Pressures and Temperatures. Fuel 2018, 234, 238–246. [Google Scholar] [CrossRef]
- Ji, C.; Dames, E.; Sirjean, B.; Wang, H.; Egolfopoulos, F.N. An Experimental and Modeling Study of the Propagation of Cyclohexane and Mono-Alkylated Cyclohexane Flames. Proc. Combust. Inst. 2011, 33, 971–978. [Google Scholar] [CrossRef]
- Wu, F.; Kelley, A.P.; Law, C.K. Laminar Flame Speeds of Cyclohexane and Mono-Alkylated Cyclohexanes at Elevated Pressures. Combust. Flame 2012, 159, 1417–1425. [Google Scholar] [CrossRef]
- Liu, H.; Lin, W.; Li, Q.; Zhao, H.; Huang, Z. Laminar Flame Speeds of Cyclic Hydrocarbon Fuels: Effect of Unsaturation. Fuel 2023, 333, 126235. [Google Scholar] [CrossRef]
- Ranzi, E.; Frassoldati, A.; Grana, R.; Cuoci, A.; Faravelli, T.; Kelley, A.P.; Law, C.K. Hierarchical and Comparative Kinetic Modeling of Laminar Flame Speeds of Hydrocarbon and Oxygenated Fuels. Prog. Energy Combust. Sci. 2012, 38, 468–501. [Google Scholar] [CrossRef]
- Johnston, R.J.; Farrell, J.T. Laminar Burning Velocities and Markstein Lengths of Aromatics at Elevated Temperature and Pressure. Proc. Combust. Inst. 2005, 30, 217–224. [Google Scholar] [CrossRef]
- Ji, C.; Dames, E.; Wang, H.; Egolfopoulos, F.N. Propagation and Extinction of Benzene and Alkylated Benzene Flames. Combust. Flame 2012, 159, 1070–1081. [Google Scholar] [CrossRef]
- Wang, G.; Li, Y.; Yuan, W.; Zhou, Z.; Wang, Y.; Wang, Z. Investigation on Laminar Burning Velocities of Benzene, Toluene and Ethylbenzene up to 20 atm. Combust. Flame 2017, 184, 312–323. [Google Scholar] [CrossRef]
- Zhang, Y.; Mei, B.; Zhang, X.; Ma, S.; Li, Y. Exploring Fuel Isomeric Effects on Laminar Flame Propagation of Butylbenzenes at Various Pressures. Proc. Combust. Inst. 2021, 38, 2419–2429. [Google Scholar] [CrossRef]
- Zhang, Y.; Mei, B.; Cao, C.; Zhang, X.; Yuan, W.; Yang, J.; Li, Y. Experimental and Kinetic Modeling Investigation on Sec-Butylbenzene Combustion: Flow Reactor Pyrolysis and Laminar Flame Propagation at Various Pressures. Combust. Flame 2020, 211, 18–31. [Google Scholar] [CrossRef]
- Zhang, Y.; Cao, C.; Mei, B.; Zou, J.; Zhao, L.; Yang, J.; Li, Y. Investigation on N-Pentylbenzene Combustion at Various Pressures: Insight into Effects of Side-Chain Length on Alkylbenzene Combustion. Combust. Flame 2022, 238, 111976. [Google Scholar] [CrossRef]


| Method | Earliest Year | Characteristic | Advantage | Disadvantage |
|---|---|---|---|---|
| Spherical flame method | 1934 | Plotting p-t curves or r-t curves | Controllable initial temperature and pressure conditions | Significantly affected by flame stretch |
| Stagnation flame method | 1985 | Fixes the effect of flame stretch on LBV | No downstream conductive heat losses | Extrapolation required; complex for liquid fuel measurement |
| Heat flux method | 1994 | Direct measurement of adiabatic flame speed | Direct measurement method; apt for liquid fuel measurement | Failure under both high pressure (>10 atm) and high temperature Effective when LBV < 80 cm/s |
| Bunsen burner method (tracer particles) | 1959 | Introduces tracer particles | Traditional method with the simplest structure | Inaccurate due to boundary layer near burner rim, difficulties in flame anchoring |
| Annular stepwise diverging tube | 2011 | Introduces tracer particles | Capable of the measurement of high-LBV fuels | Further investigation in both experiments and simulations needed |
| Externally heated diverging channel method | 2011 | Introduces tracer particles | Direct measurement of burning velocities under a large range of temperature | Investigation of the condition of higher pressures and high-LBV fuels needed |
| Surrogate Fuel/Jet A | Experimental Conditions | LBV Measurement Methods | Ref. | ||
|---|---|---|---|---|---|
| T (K) | P (atm) | Φ | |||
| n-Decane, methylcyclohexane, toluene (82.1/7.9/10.0 and 59.6/-/40.4 mol%) | 400 | 1 | 0.7–1.4 | Jet wall stagnation flame configuration | [30] |
| n-Dodecane, n-propylbenzene, 1,3,5-trimethylcyclohexane (66.2/15.8/18.0 mol%) | 473 | 1 | 0.6–3.0 | Laminar burner | [31] |
| n-Decane, n-propyl-benzene, propyl-cyclohexane (76.7/13.2/10.1 wt%) | 400–473 | 1–10 | 0.7–1.3 | High-pressure Bunsen burner | [6] |
| n-Decane, methylcyclohexane, benzene, butylcyclohexane (40/20/20/20 vol%) | 400 | 1 | 0.7–1.4 | Heat flux method | [32] |
| Jet A | 400, 473 | 1 | 0.7–1.4 | Counterflow burner | [33] |
| Jet A | 400, 450, 470 | 1 | 0.7–1.4 | Counterflow burner | [5] |
| Jet A | 473, 550 | 1 | 0.7–1.1 | Bunsen burner | [34] |
| Jet A | 473 | 1 | 0.9–1.4 | Bunsen burner | [35] |
| Jet A | 470 | 1 | 0.75–1.5 | Jet wall stagnation flame configuration | [36] |
| Jet A | 473 | 1, 3, 6 | 0.6–2.0 | Bunsen burner | [37] |
| Composition of Surrogate Fuel | H/C Ratio | Mol Weight (g·mol−1) | Density (kg/m3) | Boiling Point (K) | Ref. |
|---|---|---|---|---|---|
| Jet A | 1.91 | 153.0 | 815.9 | 423–533 | [6,30] |
| n-Decane, methylcyclohexane, toluene (82.1/7.9/10.0 mol%) | 2.11 | 133.8 | 735.8 | 374–447 | [30] |
| n-Decane, toluene (59.6/40.4 mol%) | 1.77 | 122.0 | 762.4 | 384–447 | [30] |
| n-Dodecane, n-propylbenzene, 1,3,5-trimethylcyclohexane (66.2/15.8/18.0 mol%) | 2.03 | 148.0 | 764.8 | 412–489 | [31] |
| n-Decane, n-propyl-benzene, propyl-cyclohexane (76.7/13.2/10.1 wt%) | 2.06 | 136.9 | 747.0 | 432–447 | [6] |
| n-Decane, methylcyclohexane, benzene, butylcyclohexane (40/20/20/20 vol%) | 1.83 | 111.6 | 782.8 | 353–454 | [32] |
| Carbon Number | Experimental Conditions | LBV Measurement Methods | Ref. | |
|---|---|---|---|---|
| P (atm) | T (K) | |||
| 1–8 | - | - | - | [22,77] |
| 10 | 1 | 338, 360, 400, 470, 500, 610, 650 | Externally heated diverging channel method | [69] |
| 10 | 1, 2 | 470 | Spherical flame method | [69] |
| 10 | 1 | 403 | Stagnation flame method | [74] |
| 10 | 1 | 400, 425 | Spherical flame method | [76] |
| 10 | 1 | 360, 400, 470 | Stagnation flame method | [72] |
| 10 | 1 | 400 | Externally heated diverging channel | [78] |
| 10 | 1 | 398 | Stagnation flame method | [13] |
| 10 | 1 | 398 | Spherical flame method | [79] |
| 10 | 1 | 398 | Spherical flame method | [80] |
| 10 | 1 | 398 | Spherical flame method | [81] |
| 12 | 1, 2, 3, 4 | 400, 425, 450 | Spherical flame method | [24] |
| 12 | 1 | 400 | Spherical flame method | [82] |
| 12 | 1 | 403 | Stagnation flame method | [74] |
| 12 | 1 | 400, 470 | Stagnation flame method | [72] |
| 12 | 1 | 400, 425 | Spherical flame method | [76] |
| 12 | 1 | 400 | Spherical flame method | [82] |
| 14 | 1 | 423, 443 | Stagnation flame method | [18] |
| 14 | 1 | 423, 443 | - | [75] |
| 16 | 1 | 443 | Stagnation flame method | [18] |
| Iso-Alkanes | Experimental Conditions | LBV Measurement Methods | Year | Ref. | |
|---|---|---|---|---|---|
| P (atm) | T (K) | ||||
| Isobutane | 1, 2, 5, 10 | 298 | Spherical flame method | 2018 | [91] |
| Isobutane | 1 | 298–398 | Flat flame burner, spherical flame method | 2016 | [90] |
| 2,2,4-Trimethylpentane | 1 | 298, 400, 470 | Stagnation flame method | 2010 | [93] |
| 2,2,4-Trimethylpentane | 1 | 298, 358, 398 | Heat flux | 2013 | [87] |
| 2,2,4-Trimethylpentane | 1 | 353 | Stagnation flame method | 2012 | [94] |
| 2-Methylheptane | 1 | 353 | Stagnation flame method | 2012 | [94] |
| 3-Methylheptane | 1 | 353 | Stagnation flame method | 2012 | [94] |
| 2,5-Dimethylhexane | 1 | 353 | Stagnation flame method | 2012 | [94] |
| 2,2,4,6,6-Pentamethyl-heptan | 1, 3 | 473 | Bunsen burner | 2023 | [95] |
| Cycloalkane | Experimental Conditions | LBV MeasurementMethods | Year | Ref. | |
|---|---|---|---|---|---|
| T (K) | P (atm) | ||||
| Cyclopentane | 353, 403, 453 | 1, 2, 5 | Spherical flame method | 2018 | [98] |
| Cyclohexane | 353, 403, 453 | 1, 2, 5 | Spherical flame method | 2018 | [98] |
| Cyclohexane | 403 | 1, 5 | Spherical flame method | 2023 | [101] |
| Cyclohexane | 353 | 1 | Stagnation flame method | 2011 | [99] |
| Methylcyclohexane | 353 | 1 | Stagnation flame method | 2011 | [99] |
| Ethylcyclohexane | 353 | 1 | Stagnation flame method | 2011 | [99] |
| n-Propylcyclohexane | 353 | 1 | Stagnation flame method | 2011 | [99] |
| n-Butylcyclohexane | 353 | 1 | Stagnation flame method | 2011 | [99] |
| n-Hexane | 353 | 1, 2, 5, 10, 20 | Spherical flame method | 2012 | [100] |
| Cyclohexane | 353 | 1, 2, 5, 10, 20 | Spherical flame method | 2012 | [100] |
| Methylcyclohexane | 353 | 1, 2, 5, 10, 20 | Spherical flame method | 2012 | [100] |
| Ethylcyclohexane | 353 | 1, 2, 5, 10, 20 | Spherical flame method | 2012 | [100] |
| Methylcyclohexane | 300~610 | 1 | Externally heated diverging channel method | 2021 | [96] |
| Methylcyclohexane | 338 | 1 | Heat flux method | 2022 | [97] |
| Aromatics | Experimental Conditions | LBV MeasurementMethods | Year | Ref. | |
|---|---|---|---|---|---|
| T (K) | P | ||||
| Benzene | 450 | 304 kPa | Spherical flame method | 2005 | [103] |
| Toluene | 450 | 304 kPa | Spherical flame method | 2005 | [103] |
| Ethylbenzene | 450 | 304 kPa | Spherical flame method | 2005 | [103] |
| m-Xylene | 450 | 304 kPa | Spherical flame method | 2005 | [103] |
| n-Propylbenzene | 450 | 304 kPa | Spherical flame method | 2005 | [103] |
| Toluene | 298, 400, 470 | 1 atm | Stagnation flame method | 2010 | [93] |
| Benzene | 353 | 1 atm | Stagnation flame method | 2012 | [104] |
| Toluene | 353 | 1 atm | Stagnation flame method | 2012 | [104] |
| o-Xylene | 353 | 1 atm | Stagnation flame method | 2012 | [104] |
| m-Xylene | 353 | 1 atm | Stagnation flame method | 2012 | [104] |
| p-Xylene | 353 | 1 atm | Stagnation flame method | 2012 | [104] |
| 1,3,5-Trimethylbenzene | 353 | 1 atm | Stagnation flame method | 2012 | [104] |
| 1,2,4-Trimethylbenzene | 353 | 1 atm | Stagnation flame method | 2012 | [104] |
| n-Propylbenzene | 353 | 1 atm | Stagnation flame method | 2012 | [104] |
| Toluene | 298, 358, 398 | 1 atm | Heat flux | 2014 | [87] |
| Benzene | 358, 423 | 1, 2, 5, 10, 20 atm | Spherical flame method | 2017 | [105] |
| Toluene | 358, 423 | 1, 2, 5, 10, 20 atm | Spherical flame method | 2017 | [105] |
| Ethylbenzene | 358, 423 | 1, 2, 5, 10, 20 atm | Spherical flame method | 2017 | [105] |
| sec-Butylbenzene | 423 | 1, 2, 5, 10 atm | Spherical flame method | 2020 | [107] |
| Pentylbenzene | 473 | 1, 2, 5, 10 atm | Spherical flame method | 2021 | [108] |
| Isobutylbenzene | 423 | 1, 2, 5, 10 atm | Spherical flame method | 2021 | [106] |
| n-Butylbenzene | 423 | 1, 2, 5, 10 atm | Spherical flame method | 2021 | [106] |
| tert-Butylbenzene | 423 | 1, 2, 5, 10 atm | Spherical flame method | 2021 | [106] |
| Toluene | 338 | 1 atm | Heat flux method | 2022 | [97] |
| Benzene | 403 | 1, 5 atm | Spherical flame method | 2023 | [101] |
| Fuel | Combustion Mechanism Models | Simulation Conditions | Simulation Accuracies | Ref. | |
|---|---|---|---|---|---|
| T (K) | P (atm) | ||||
| Jet A and its surrogate fuel | JetSurF 2.0 | 400 | 1 | Accurately predicts the measured velocity profiles. | [30] |
| Jet A and its surrogate fuel | Chemical kinetics mechanism involving 401 species and 2838 reactions | 473 | 1 | Φ = 0.6–1.5, with deviations underpredicted by about 10%. | [31] |
| RP-3 and its surrogate fuel | Chemical kinetics mechanism involving 181 species and 872 reactions | 400, 420, 450, 480 | 1, 3 | Less than 5% deviation. | [42] |
| GTL fuel–20% hexanol–air mixtures | Chemical kinetics mechanism involving 3479 reactions and 490 species | 423, 473 | 1 | Φ < 1.2, experiments are underpredicted; Φ > 1.2, predictions are slightly higher. | [19] |
| Syntroleum S-8 and its surrogate fuel | Ranzi’s chemical kinetics mechanisms | 550 | 1 | Simulated results are about 5–10% higher than the measured value. | [57] |
| Syntroleum S-8 and its surrogate fuel | Ranzi’s chemical kinetics mechanisms | 400, 473 | 1 | The chemical mechanism showed better agreement with experimental data. | [60] |
| n-Decane | PoliMi mechanisms | up to 610 | 1 | Measurements agree well with PoliMi model predictions across all mixtures. | [68] |
| n-Dodecane | JetSurF 2.0/PoliMi mechanisms | 425 | 1, 4 | At 1 bar, the LBV deviations of the JetSurF 2.0 and PoliMi mechanisms were within 5% and 8%, respectively. At 4 bar, the JetSurF 2.0 mechanism maintained deviations within 10%, whereas the PoliMi mechanism exhibited deviations exceeding 15% for Φ > 1.2. | [24] |
| n-Pentylbenzene | Chemical kinetics mechanism involving 313 species and 1975 reactions | 473 | 1, 2, 5, 10 | The model reliably predicts experimental data across all tested pressures and equivalence ratios. | [108] |
Disclaimer/Publisher’s Note: The statements, opinions and data contained in all publications are solely those of the individual author(s) and contributor(s) and not of MDPI and/or the editor(s). MDPI and/or the editor(s) disclaim responsibility for any injury to people or property resulting from any ideas, methods, instructions or products referred to in the content. |
© 2025 by the authors. Licensee MDPI, Basel, Switzerland. This article is an open access article distributed under the terms and conditions of the Creative Commons Attribution (CC BY) license (https://creativecommons.org/licenses/by/4.0/).
Share and Cite
Song, Z.; Yan, X.; Liu, Z.; Yang, X. Laminar Burning Velocity in Aviation Fuels: Conventional Kerosene, SAFs, and Key Hydrocarbon Components. Appl. Sci. 2025, 15, 8098. https://doi.org/10.3390/app15148098
Song Z, Yan X, Liu Z, Yang X. Laminar Burning Velocity in Aviation Fuels: Conventional Kerosene, SAFs, and Key Hydrocarbon Components. Applied Sciences. 2025; 15(14):8098. https://doi.org/10.3390/app15148098
Chicago/Turabian StyleSong, Zehua, Xinsai Yan, Ziyu Liu, and Xiaoyi Yang. 2025. "Laminar Burning Velocity in Aviation Fuels: Conventional Kerosene, SAFs, and Key Hydrocarbon Components" Applied Sciences 15, no. 14: 8098. https://doi.org/10.3390/app15148098
APA StyleSong, Z., Yan, X., Liu, Z., & Yang, X. (2025). Laminar Burning Velocity in Aviation Fuels: Conventional Kerosene, SAFs, and Key Hydrocarbon Components. Applied Sciences, 15(14), 8098. https://doi.org/10.3390/app15148098