Abstract
Understanding the time-lagged response of land subsidence to groundwater level fluctuations and subsurface strain variations is crucial for uncovering its underlying mechanisms and enhancing disaster early warning capabilities. This study focuses on Dangshan County, Anhui Province, China, and systematically analyzes the spatio-temporal evolution of land subsidence from 2018 to 2024. A total of 207 Sentinel-1 SAR images were first processed using the Small Baseline Subset Interferometric Synthetic Aperture Radar (SBAS-InSAR) technique to generate high-resolution surface deformation time series. Subsequently, the seasonal-trend decomposition using the LOESS (STL) model was applied to extract annual cyclic deformation components from the InSAR-derived time series. To quantitatively assess the delayed response of land subsidence to groundwater level changes and subsurface strain evolution, time-lagged cross-correlation (TLCC) analysis was performed between surface deformation and both groundwater level data and distributed fiber-optic strain measurements within the 5–50 m depth interval. The strain data was collected using a borehole-based automated distributed fiber-optic sensing system. The results indicate that land subsidence is primarily concentrated in the urban core, with annual cyclic amplitudes ranging from 10 to 18 mm and peak values reaching 22 mm. The timing of surface rebound shows spatial variability, typically occurring in mid-February in residential areas and mid-May in agricultural zones. The analysis reveals that surface deformation lags behind groundwater fluctuations by approximately 2 to 3 months, depending on local hydrogeological conditions, while subsurface strain changes generally lead surface subsidence by about 3 months. These findings demonstrate the strong predictive potential of distributed fiber-optic sensing in capturing precursory deformation signals and underscore the importance of integrating InSAR, hydrological, and geotechnical data for advancing the understanding of subsidence mechanisms and improving monitoring and mitigation efforts.
1. Introduction
Land subsidence is a geological phenomenon characterized by the gradual lowering of the Earth’s surface, primarily resulting from the compaction of unconsolidated strata under natural and anthropogenic pressures [1]. Often referred to as a “chronic disease” hindering sustainable urban development [2], land subsidence has become an increasingly critical issue in China. Recent national-scale assessments indicate that over 30 major and medium-sized cities experienced substantial land subsidence between 2015 and 2022, affecting nearly 30% of the urban population [3]. The associated impacts, such as infrastructure damage, building deformation, and increased flood risk, pose serious threats to socioeconomic stability and public safety [4].
Among the many contributing factors, long-term overexploitation of groundwater is widely recognized as the dominant driver of land subsidence [5]. Excessive withdrawal of groundwater reduces pore water pressure within aquifer systems [6], resulting in soil compaction and surface deformation [7]. Understanding the dynamic response of ground deformation to groundwater level fluctuations is essential for revealing the mechanisms underlying subsidence processes.
Various geodetic and statistical methods have been employed to study land subsidence. Satellite-based interferometric synthetic aperture radar (InSAR) techniques [8], particularly the Small Baseline Subset InSAR (SBAS-InSAR), have proven highly effective in monitoring spatiotemporal ground deformation with high accuracy over large areas [9]. However, the time series of subsidence signals are often non-stationary, influenced by multiple geophysical factors, and embedded with noise [9]. Classical statistical tools such as the Pearson correlation coefficient or the Fourier transform have limitations in such contexts due to sensitivity to outliers and poor adaptability to non-stationary data [9,10,11]. To address these challenges, the time-lagged cross-correlation (TLCC) method has been proposed to quantify delayed relationships between variables [12,13], and the seasonal-trend decomposition using the LOESS (STL) algorithm has been employed to extract meaningful trends and seasonal components from complex geophysical time series [14]. Despite recent advancements, there remains a lack of detailed understanding regarding the seasonal lag response of land subsidence to groundwater fluctuations, particularly in agricultural regions with intensive irrigation practices. Moreover, few studies have integrated STL decomposition with TLCC analysis to interpret subsidence dynamics in a physically meaningful way.
To address these gaps, this study aims to achieve the following: investigate the spatiotemporal evolution of land subsidence in Dangshan County, Anhui Province, from 2018 to 2024, using SBAS-InSAR techniques on 207 Sentinel-1A SAR images; decompose the surface deformation time series using STL to identify seasonal characteristics; quantify the time-lagged response between surface deformation and groundwater level variations using TLCC analysis; and compare seasonal behaviors between residential and agricultural areas and explore the underlying causes of observed differences. Dangshan County was selected due to its well-documented history of significant groundwater extraction and associated land subsidence. By integrating remote sensing, statistical decomposition, and correlation analysis, this study provides new insights into the seasonal mechanisms driving land subsidence in groundwater-stressed regions.
2. Study Area
The study area is situated in northern Anhui Province and falls under the administrative jurisdiction of Suzhou City (Figure 1). The terrain is generally flat, dominated by expansive plains with occasional low hills in the southwestern region [15]. Dangshan County encompasses 13 towns and three designated functional zones, namely the Economic and Technological Development Zone, the High-Speed Railway New District, and the Xuelou Wood Processing Industrial Park, covering a total area of approximately 1200 km2 [16]. The region experiences a temperate monsoon climate, characterized by four distinct seasons and pronounced seasonal variations in precipitation [15]. Rainfall is largely concentrated in the summer, with the rainy season typically occurring from July to September [15]. Groundwater resources are mainly hosted in unconsolidated pore aquifers [16]. While groundwater extraction primarily targets the middle and deep aquifers, some wells draw from both shallow and deep layers [17]. Shallow phreatic water is commonly exploited through scattered domestic wells [16].

Figure 1.
Study area scope.
3. Datasets and Methodology
3.1. Datasets
3.1.1. Sentinel-1
This study utilized 207 ascending-pass Sentinel-1A scenes acquired between January 2018 and December 2024, including both vertical–vertical (VV) and vertical–horizontal (VH) polarization modes. The minimum temporal baseline between adjacent scenes was 60 days [18]. All datasets were obtained in interferometric wide swath (IW) mode as single-look complex (SLC) products (Table 1).

Table 1.
Parameters of Sentinel-1 satellite.
3.1.2. SRTM DEM
The Shuttle Radar Topography Mission (SRTM) dataset, jointly developed by the National Aeronautics and Space Administration (NASA) and the National Geospatial-Intelligence Agency (NGA), provides freely accessible global elevation data [19]. Covering approximately 80% of the Earth’s land surface, the SRTM dataset offers a spatial resolution of 30 m and a vertical accuracy of ±16 m [20]. In this study, the SRTM Digital Elevation Model (DEM) was employed to eliminate topographic phase components induced by terrain variations during interferometric processing [21].
3.1.3. Other Data
Groundwater level data were obtained from two long-term observation wells in Dangshan County, designated JC01 and JC02, both monitoring shallow unconfined aquifers within the depth range of 5.0–50.0 m. Subsurface strain data were collected using a distributed fiber-optic sensing system installed in a borehole near the InSAR observation area, covering the same depth range of 5.0–50.0 m with high spatial resolution. In this study, the strain data was used to identify subsurface responses that precede the onset of surface subsidence.
3.2. Methodology
3.2.1. Principle of SBAS-InSAR
To monitor ground surface deformation using the SBAS-InSAR technique, a total of N + 1 SAR images covering the study area are initially co-registered. Based on predefined spatial and temporal baseline thresholds, M interferometric pairs are subsequently generated [20], described as follows:
For the i-th interferometric pair (i ∈ 1, 2, ..., M), let the acquisition times of the master and slave images be ta and tb, respectively, where tb > ta [22]. After removing non-deformation phase components, the residual interferometric phase can be expressed as
The deformation phases of the M interferometric pairs can be organized into the following matrix form [21]:
Each interferogram provides one observation equation. By combining Equations (2) and (3), a system of M observation equations with N unknown deformation parameters can be formulated as [23]
Here, A is an M × N coefficient matrix. If the rank of A (r (A)) is greater than N, the system can be solved using the least squares method [23]:
In practice, however, r (A) is often less than N, making the inverse of ATA unavailable [23]. To address this, singular value decomposition (SVD) is applied to decompose A as
In this decomposition, U is an M × M orthogonal matrix composed of the eigenvectors of AAT; S is an M-order diagonal matrix; and V is an N × M orthogonal matrix formed from the eigenvectors of ATA.
In Equations (7) and (8), UT denotes the transpose of U, and A+ and S+ represent the Moore–Penrose pseudoinverses of matrices A and S, respectively. Once the time-series deformation φ is obtained, the corresponding deformation rate can be calculated by dividing the deformation by the time interval between observations.
3.2.2. Data Processing Workflow
The overall procedure for obtaining ground deformation information primarily comprises two stages: data preprocessing and SBAS-InSAR processing. In this study, Sentinel-1 SAR data were processed using the SARscape module in the ENVI 5.3 platform [3]. SARscape, developed by the Swiss company sarmap (Caslano, Switzerland), is a professional radar image processing software that has been widely used for various satellite-borne radar datasets, including ERS-1/2, RADARSAT-1/2, ENVISAT ASAR, ALOS PALSAR, and Sentinel-1 [24]. The selection of this software is based on its efficient radar data processing capabilities and its extensive application experience, particularly in handling large-scale SAR data and monitoring land subsidence. SARscape is capable of accurately performing interferometric measurements, time series analysis, and ground deformation extraction, making it the tool of choice in this study to ensure the accuracy and reliability of data processing.
The Sentinel-1 data preprocessing steps were as follows [25]: (1) importing the SAR scenes into the standard SARscape format; (2) mosaicking SAR images acquired on the same date; and (3) cropping the data to the boundary of the study area. The subsequent SBAS-InSAR processing included the following steps: (1) pairing the input scenes using an optimal combination strategy; (2) performing interferometric processing on the selected image pairs; (3) re-flattening all interferograms using control points; (4) removing atmospheric phase artifacts and estimating deformation velocity; and (5) geocoding, which involves projecting the deformation results into a geographic coordinate system (Figure 2).
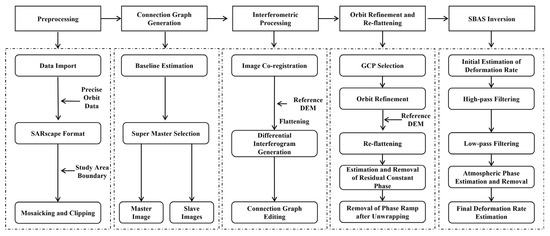
Figure 2.
SBAS-InSAR flowchart.
3.2.3. STL Model
The model employs the Locally Estimated Scatterplot Smoothing (LOESS) approach to decompose complex time-series data into three components: trend, seasonal, and residual [26]. The decomposition is expressed as follows:
where represents the original time-series data; denotes the combined seasonal-trend component; is the trend component; and corresponds to the residual component. The model includes two iterative processes: an inner loop and an outer loop [27]. In the inner loop, the seasonal and trend components are updated sequentially; the outer loop adjusts robust weights for the next iteration [27].
Assuming and represent the seasonal and trend components obtained after the kth iteration, the computation process for the (k + 1)th inner loop is as follows:
(1) Detrending: Subtract the estimated trend from the original data to obtain the detrended series [26]: .
(2) Seasonal Smoothing: Divide the detrended series by the seasonal period P and apply LOESS smoothing to each subsequence. Extend the results to create a temporary seasonal series [28]:
In the equation, ds denotes the smoothing bandwidth for the seasonal component, and ps represents the degree of the local polynomial used in the LOESS fitting.
(3) Low pass filtering: The sequence is subjected to two successive moving average (MA) filters of length n, followed by an additional MA filter of length 3. This process extracts the low-frequency component, resulting in the output sequence [29]:
(4) Seasonal component extraction: Subtract the low-frequency sequence from the temporary seasonal sequence , resulting in the updated seasonal component [29]:
(5) Trend smoothing: Locally weighted regression (LOESS) is applied directly to the deseasonalized series to obtain the updated trend component [29].
The residual component is then calculated as
where denotes the residual component, represents the original time-series data, and and correspond to the trend and seasonal components estimated by the model, respectively [29].
In the equation, B denotes:
where is the robustness weight at time t, and B is the bisquare weighting function used to adjust the weights based on the magnitude of the residuals. represents the normalized residual, where h is a scaling parameter for normalization, typically determined based on a robust estimate of the residual distribution.
3.2.4. Time-Lagged Cross-Correlation Analysis
Time-lagged cross-correlation analysis (TLCC) is a statistical method used to quantify the lag-dependent relationship between two time series [30]. The core concept involves shifting the time axis of one series and calculating correlation coefficients at different lag intervals to reveal potential causal links or response delays between the signals [30]. The Spearman Rank Order Correlation Coefficient (SROCC) is a non-parametric statistical measure used to assess the correlation between two variables [30]. It is particularly effective for analyzing time series that do not follow a normal distribution or contain outliers. The SROCC is calculated using the following formula:
In the equation, represents the Spearman rank-order correlation coefficient; di denotes the rank difference for each pair of observations—that is, the difference between the ranks of corresponding data points in the two time series; and n is the length of the time series (i.e., the sample size).
For two time series and (where x0 and y0 are the initial observations, and xN−1 and yN−1 are the final observations), the time-lagged cross-correlation coefficient at lag k, denoted as Lk(x,y), is defined as
In the equation, k denotes the lag order, representing the number of time units by which one time series is shifted relative to the other; yi+k is the observation of time series y at time i + k; and and represent the mean values of time series x and y, respectively.
3.2.5. Optical Fiber Monitoring Scheme
A borehole with a depth of 500 m and a diameter of 150 mm was constructed (Figure 3). Along the entire depth of the borehole, anchor-type fixed-point densely distributed strain-sensing optical fibers were deployed at 5 m intervals. These fibers were connected at the bottom with high-strength optical leads to form a U-shaped loop. Additionally, within 20 m of the borehole collar, low-mode strain-sensing optical fibers were installed and similarly configured into a U-shaped loop with high-strength leads. Furthermore, non-metallic reinforced dense distributed temperature-sensing optical fibers were installed within the upper 20 m of the borehole for single-ended temperature measurements. The sensing cables were guided into the borehole using a weighted guiding head, and the borehole was subsequently backfilled with specialized grouting material. All optical lines were integrated into the surface monitoring station to establish an automated monitoring system.

Figure 3.
Schematic diagram of the optical fiber sensing deployment in a 500 m deep borehole for automated monitoring.
4. Results and Discussion
4.1. Spatiotemporal Evolution of Land Subsidence
The annual average land subsidence velocity in Dangshan County from 2018 to 2024 exhibits clear spatial heterogeneity (Figure 4). A pronounced subsidence funnel is centered near the county-level administrative center, with the maximum subsidence rate exceeding 80 mm/a. The subsidence intensity gradually weakens with increasing distance from the center, forming a concentric zonal pattern. The core subsidence area is mainly distributed within a 5 km radius, where the velocity exceeds 60 mm/a. The surrounding zones show moderate to mild subsidence, typically ranging from 10 to 50 mm/a. In contrast, the peripheral areas of the county are relatively stable, with annual velocities close to zero. This pattern suggests a strong correlation between land subsidence and human activities concentrated in urbanized zones, particularly groundwater over-extraction. The spatial distribution further indicates that subsidence impacts are localized but intense, warranting targeted mitigation efforts in the most affected regions.

Figure 4.
Spatial pattern of long-term average subsidence rates in Dangshan County (2018–2024).
4.2. Temporal Variation in Annual Average Cumulative Surface Deformation
To further reveal the evolution of land subsidence in Dangshan County, the annual average cumulative subsidence series from January 2018 to December 2024 was extracted (Figure 5). Overall, a continuous subsidence trend is evident across all years, indicating the significant cumulative and long-term nature of land subsidence in the region.
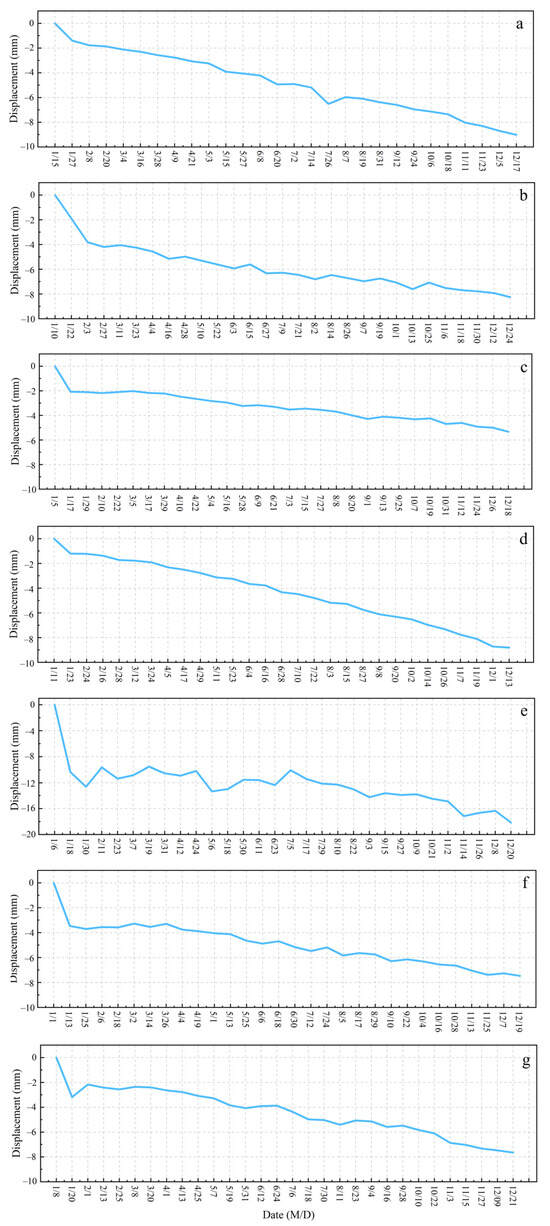
Figure 5.
Annual average cumulative subsidence in Dangshan County (2018–2024, (a–g)).
Specifically, the curves for 2018 (Figure 5a) and 2019 (Figure 5b) exhibit relatively steep slopes and high subsidence rates, marking the initial stage of subsidence development. During the period from 2020 to 2022 (Figure 5c–e), the subsidence rate gradually declined, and the curves began to level off; notably, short-term fluctuations were observed in 2021. By 2023 and 2024 (Figure 5f,g), the magnitude of subsidence further decreased, and the overall trend showed signs of stabilization, indicating that regional land subsidence has entered a preliminarily controlled phase.
In summary, the subsidence process in Dangshan County from 2018 to 2024 followed an evolutionary trend of “rapid development—gradual slowdown—stabilization,” which preliminarily reflects the positive effects of relevant mitigation measures or groundwater resource regulation.
4.3. Seasonal Characteristics of Ground Deformation in the Subsidence Funnel Area
Due to the influence of multiple factors, raw cumulative time series of ground deformation often exhibit non-periodic behavior, characterized by the superposition of trend, seasonal, and noise components. The amplitudes and phases of both the annual and semiannual cycles were calculated (Figure 6). The dominant annual amplitude within the subsidence funnel area ranges from 10 to 18 mm, with maximum values up to 22 mm observed in the Beijiao Town area and the high-speed railway development zone within the county center. In contrast, the semiannual signals are weak, with an average amplitude of only 2.3 mm. Therefore, this study focuses exclusively on analyzing the annual periodic characteristics of land deformation within the subsidence funnel zone.
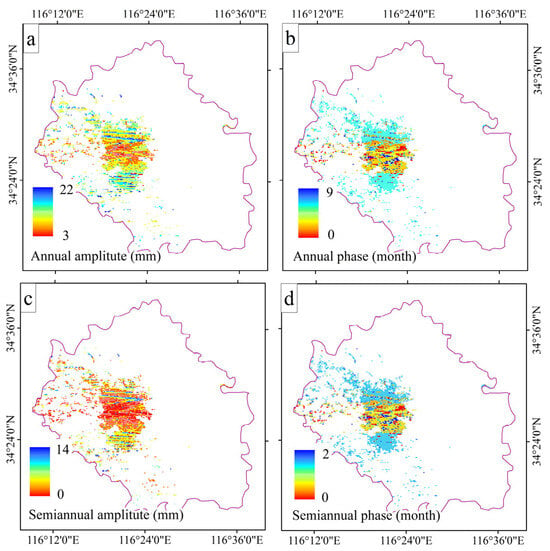
Figure 6.
Amplitude and phase of seasonal deformation cycle in subsidence funnel area (a) Annual cycle amplitude of the deformation time series; (b) Semiannual cycle amplitude of the deformation time series; (c) Annual cycle phase of the deformation time series; (d) Semiannual cycle phase of the deformation time series.
The phase of the annual cycle in the cumulative deformation time series represents the timing of the maximum annual rebound. By converting the phase into months, the timing of the maximum annual rebound can be clearly identified. As shown in Figure 6, the maximum rebound values in the subsidence funnel area occur around mid-February and mid-May. In the subsiding area of the county center, the maximum annual rebound typically occurs in mid-February. This region is primarily composed of urban residential areas. From July to September, which is the main precipitation period, surface water replenishes shallow groundwater. This process slows down surface subsidence by November, and by mid-January of the following year, the ground begins to uplift, reaching the maximum rebound value in mid-February. In contrast, the maximum annual rebound in the subsiding areas of Beijiao Town (southern part) and the high-speed rail development zone (central area) occurs in mid-May. These regions are predominantly agricultural areas. During the spring irrigation peak in March, shallow groundwater levels in agricultural areas rise due to irrigation, causing surface deformation to reach the maximum rebound in mid-May.
4.4. Time Series Analysis of Surface Deformation and Groundwater Level
JC01 is in a region with severe land subsidence, where long-term overexploitation of groundwater has contributed to high subsidence risk. Its monitoring data is representative of ground deformation in high-risk zones. In contrast, JC02 is situated in a region with relatively minor subsidence, providing a comparative dataset that reflects more stable groundwater level conditions.
Both the groundwater level and cumulative deformation time series exhibit significant variability and are non-stationary (Figure 7). Long-term monitoring data indicate that the groundwater level in the JC01 area fluctuates significantly, particularly within the shallow groundwater range of 5.0 to 50.0 m. Due to excessive groundwater extraction, the groundwater level has notably declined, leading to the drainage of moisture from the soil, a decrease in pore pressure, and subsequent soil compaction and surface subsidence. In contrast, the region near JC02 experiences relatively mild subsidence, with smaller variations in groundwater levels and more stable surface deformation rates. Groundwater replenishment in this area is relatively sufficient, and the hydrological conditions are stable, preventing severe soil compaction and subsidence.
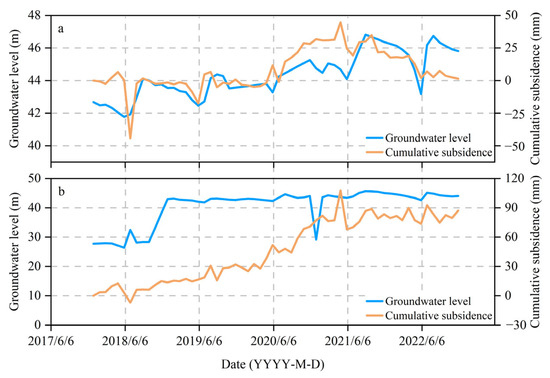
Figure 7.
Surface deformation and groundwater level variation in hydrological sites from 2018 to 2023: (a) JC01: groundwater level vs. cumulative deformation; (b) JC02: groundwater level vs. cumulative deformation.
As shown in Table 2, there is a strong correlation between the surface deformation and groundwater level fluctuation series at both JC01 and JC02 monitoring sites, with correlation coefficients exceeding 0.5. The cumulative deformation series for both stations reaches its maximum rebound around May each year. The time-lagged cross-correlation analysis reveals maximum lag times of 2 months and 3 months for JC01 and JC02, respectively. This indicates that the cyclical fluctuations in surface deformation at both sites are synchronized with groundwater level changes, exhibiting significant resonance characteristics and a clear time-lag effect.

Table 2.
Surface deformation characteristics and groundwater level lag characteristics of the site.
Further verification of the identified lag times was conducted using groundwater level and surface deformation data from 2021 to 2022 (Figure 8). At JC02, groundwater level recovery occurred during January–March and June–September of 2021, and June–July of 2022. Corresponding surface deformation rebound events were observed in April–May, September–November of 2021, and September–October of 2022, indicating an approximate 3-month response lag. At JC01, groundwater level recovery occurred during February–March and May–September of 2021, and again in June–July of 2022. The associated deformation rebound phases were observed in April–May, July–October of 2021, and August–September of 2022, suggesting a shorter lag time of about 2 months. These observations are consistent with the lag times derived from the TLCC analysis.

Figure 8.
Comparison and verification of 2021–2022 data of hydrological sites: (a) groundwater level at JC01; (b) groundwater level at JC02; (c) cumulative surface deformation at JC01; (d) cumulative surface deformation at JC02.
A comparison of the two regions reveals distinct deformation responses to groundwater dynamics. In JC01, the deformation amplitude is generally higher, and the response lag is shorter, suggesting a more direct and sensitive coupling between groundwater level decline and soil compaction. This may be attributed to more compressible soil layers, long-term depletion of groundwater, and reduced soil elasticity due to previous consolidation [31]. On the other hand, the longer response lag and lower deformation amplitude observed in JC02 reflect a more buffered hydro-mechanical system, likely supported by better aquifer recharge conditions, thicker unsaturated zones, and relatively stiffer geological formations [32]. These contrasting behaviors highlight the spatial heterogeneity of land subsidence mechanisms even within the same region, underscoring the importance of localized monitoring strategies and tailored mitigation approaches.
The causes of surface deformation include both natural and anthropogenic factors, with groundwater fluctuations being one of the most critical contributors. In addition to the deformation responses induced by groundwater level changes, the cumulative deformation sequence also contains signals associated with geological conditions, engineering activities, and traffic loads, as well as noise [33,34]. In summary, quantitatively identifying the dominant drivers of non-stationary cumulative deformation time series is significant for effective land subsidence monitoring, early warning, and advancing the understanding of subsidence mechanisms.
4.5. Investigation of the Time-Lag Relationship Between Subsurface Strain and Surface Subsidence
To investigate the response relationship between subsurface strain evolution and surface subsidence, this study conducted a time-lagged cross-correlation (TLCC) analysis between distributed optical fiber strain data (represented by the average value) from the 5–50 m depth interval and cumulative surface subsidence over the same period. The strain data were obtained from a distributed fiber-optic sensing system, covering the period from January 2021 to December 2022 (a total of 24 months). To enhance the robustness of the statistical analysis, the Spearman rank correlation coefficient was employed to account for potential nonlinearities in the data. Notably, the strain variations recorded by the fiber-optic system were most pronounced in the 200–400 m depth interval (Figure 9), where significant strain accumulation was observed across multiple years. This indicates a dynamic evolution of the stress state in the deeper subsurface, which also supports the rationale for selecting the 5–50 m interval for correlation analysis with surface deformation.
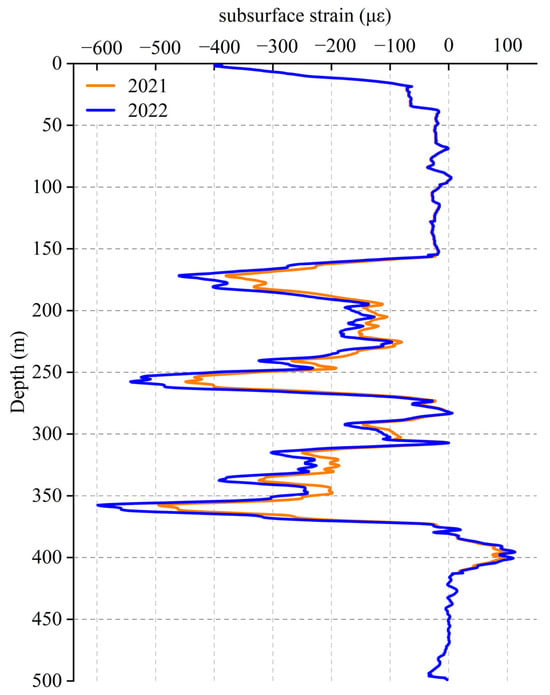
Figure 9.
Annual average subsurface strain profiles from 2021 to 2022, as measured by distributed fiber-optic strain sensing.
The TLCC results show a clear peak in correlation strength at a lag of –3 months, where the strain data lead the subsidence by three months, with a maximum Spearman correlation coefficient of ρ = 0.858 (Figure 10). This indicates a strong positive correlation and suggests that changes in the subsurface strain field can be detected approximately three months prior to observable surface deformation, highlighting the predictive and precursor nature of strain signals. This phenomenon is likely driven by groundwater-level fluctuations that alter pore pressure fields, leading to soil compaction and strain accumulation, with surface settlement subsequently occurring as a macroscopic response.
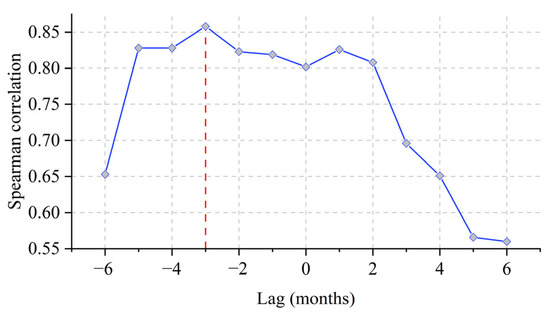
Figure 10.
Time-lagged cross-correlation analysis between optical fiber strain and cumulative subsidence (2021–2022).
Moreover, correlation coefficients remain relatively high (around 0.8) for lag times between 0 and +2 months, albeit slightly lower than the peak. This further confirms the predictive potential of subsurface strain monitoring. These findings imply that distributed fiber-optic strain sensing has significant potential for use in early warning systems and subsidence mechanism studies. In areas subject to multiple driving forces—such as groundwater extraction and soil compaction—its ability to capture fine-scale deformation with high temporal and spatial resolution offers a valuable complement to InSAR, especially in addressing the limitations of traditional techniques in detecting lagged responses.
5. Conclusions
This study integrated SBAS-InSAR technology, groundwater monitoring, and borehole-based distributed fiber-optic strain sensing to systematically investigate the spatiotemporal evolution of land subsidence in Dangshan County from 2018 to 2024, as well as its time-lagged response to groundwater level changes and subsurface strain. The main conclusions are as follows.
Land subsidence was primarily concentrated in urbanized areas, with peak deformation rates exceeding 80 mm/year. STL decomposition revealed that the subsidence process was dominated by annual cycles, with maximum amplitudes reaching 22 mm. The timing of seasonal rebound exhibited spatial differences, occurring around mid-February in urban zones and mid-May in agricultural areas, corresponding to seasonal precipitation and irrigation activities. TLCC analysis indicated a lag of 2 to 3 months between surface deformation and groundwater level fluctuations. In contrast, subsurface strain signals at depths of 5–50 m were found to precede surface subsidence by approximately 3 months, with a peak Spearman correlation coefficient of ρ = 0.858. These findings demonstrate that distributed fiber-optic sensing is capable of detecting early-warning strain signals prior to measurable subsidence. The integration of InSAR, groundwater, and geotechnical data provides a robust basis for understanding subsidence mechanisms and offers valuable support for early warning, monitoring, and disaster prevention in regions affected by land subsidence.
Author Contributions
Conceptualization, Z.Z. and Q.H.; methodology, H.L.; software, H.L. and H.S.; validation, Q.H., J.D., and L.W.; formal analysis, Q.H. and H.L.; investigation, H.L., H.S., and J.D.; resources, L.W. and H.S.; data curation, H.L. and J.D.; writing—original draft preparation, Q.H. and H.L.; writing—review and editing, Z.Z., H.L., L.W., and J.D.; visualization, H.L. and H.S.; supervision, Z.Z.; project administration, Z.Z. and L.W.; funding acquisition, Z.Z. and L.W. All authors have read and agreed to the published version of the manuscript.
Funding
This research was funded by the Strategic Research and Consulting Project of Anhui Research Institute of Engineering and Technological Development Strategy, Chinese Academy of Engineering (2023-02). National Natural Science Foundation of China (Grant no. 42071085).
Institutional Review Board Statement
Not applicable.
Informed Consent Statement
Not applicable.
Data Availability Statement
The raw data underlying the conclusions of this article will be made available by the authors upon request.
Acknowledgments
The authors gratefully acknowledge the European Space Agency (ESA) for providing free access to Sentinel-1 SAR data, the United States Geological Survey (USGS) for the SRTM DEM data, and the developers of the ENVI SARscape software used for SBAS-InSAR processing. The authors appreciate the anonymous reviewers for their valuable suggestions that helped improve the quality of this paper.
Conflicts of Interest
The authors declare no conflicts of interest.
References
- Chaussard, E.; Wdowinski, S.; Cabral-Cano, E.; Amelung, F. Land subsidence in central Mexico detected by ALOS InSAR time-series. Remote Sens. Environ. 2014, 140, 94–106. [Google Scholar] [CrossRef]
- Fiaschi, S.; Tessitore, S.; Bonì, R.; Di Martire, D.; Achilli, V.; Borgstrom, S.; Ibrahim, A.; Floris, M.; Meisina, C.; Ramondini, M.; et al. From ERS-1/2 to Sentinel-1: Two decades of subsidence monitored through A-DInSAR techniques in the Ravenna area (Italy). GISci. Remote Sens. 2017, 54, 305–328. [Google Scholar] [CrossRef]
- Yu, H.H.; Li, B.Q.; Xiao, Y.; Sun, J.Y.; Chen, C.; Jin, G.Y.; Liu, H.Y. Surface Subsidence over a Coastal City Using SBAS-InSAR with Sentinel-1A Data: A Case of Nansha District, China. Remote Sens. 2024, 16, 21. [Google Scholar] [CrossRef]
- Herrera-García, G.; Ezquerro, P.; Tomás, R.; Béjar-Pizarro, M.; López-Vinielles, J.; Rossi, M.; Mateos, R.M.; Carreón-Freyre, D.; Lambert, J.; Teatini, P.; et al. Mapping the global threat of land subsidence. Science 2021, 371, 34–36. [Google Scholar] [CrossRef]
- Zhang, Y.; Liu, Y.L.; Jin, M.Q.; Jing, Y.; Liu, Y.; Liu, Y.F.; Sun, W.; Wei, J.Q.; Chen, Y. Monitoring Land Subsidence in Wuhan City (China) using the SBAS-InSAR Method with Radarsat-2 Imagery Data. Sensors 2019, 19, 16. [Google Scholar] [CrossRef]
- Shen, S.L.; Xu, Y.S. Numerical evaluation of land subsidence induced by groundwater pumping in Shanghai. Can. Geotech. J. 2011, 48, 1378–1392. [Google Scholar] [CrossRef]
- Galloway, D.L.; Burbey, T.J. Review: Regional land subsidence accompanying groundwater extraction. Hydrogeol. J. 2011, 19, 1459–1486. [Google Scholar] [CrossRef]
- Figueroa-Miranda, S.; Tuxpan-Vargas, J.; Ramos-Leal, J.A.; Hernández-Madrigal, V.M.; Villaseñor-Reyes, C.I. Land subsidence by groundwater over-exploitation from aquifers in tectonic valleys of Central Mexico: A review. Eng. Geol. 2018, 246, 91–106. [Google Scholar] [CrossRef]
- Shi, X.-Q.; Xue, Y.-Q.; Ye, S.-J.; Wu, J.-C.; Zhang, Y.; Yu, J. Characterization of land subsidence induced by groundwater withdrawals in Su-Xi-Chang area, China. Environ. Geol. 2007, 52, 27–40. [Google Scholar] [CrossRef]
- Ouyang, L.; Zhao, Z.; Zhou, D.; Cao, J.; Qin, J.; Cao, Y.; He, Y. Study on the Relationship between Groundwater and Land Subsidence in Bangladesh Combining GRACE and InSAR. Remote Sens. 2024, 16, 3715. [Google Scholar] [CrossRef]
- Lee, M.; Lee, J.-Y.; Jang, J. Numerical modeling of groundwater system with tunnel construction in an urban area of Korea: Implications for land subsidence and mitigation measures. Environ. Earth Sci. 2024, 83, 80. [Google Scholar] [CrossRef]
- Vincent, C.; Giebel, G.; Pinson, P.; Madsen, H. Resolving Nonstationary Spectral Information in Wind Speed Time Series Using the Hilbert–Huang Transform. J. Appl. Meteorol. Climatol. 2010, 49, 253–267. [Google Scholar] [CrossRef]
- Sang, Y.-F. A review on the applications of wavelet transform in hydrology time series analysis. Atmos. Res. 2013, 122, 8–15. [Google Scholar] [CrossRef]
- Boergens, E.; Güntner, A.; Sips, M.; Schwatke, C.; Dobslaw, H. Interannual variations of terrestrial water storage in the East African Rift region. Hydrol. Earth Syst. Sci. 2024, 28, 4733–4754. [Google Scholar] [CrossRef]
- Chai, L.; Wei, L.; Cai, P.; Liu, J.; Kang, J.; Zhang, Z. Risk assessment of land subsidence based on GIS in the Yongqiao area, Suzhou City, China. Sci. Rep. 2024, 14, 11377. [Google Scholar] [CrossRef] [PubMed]
- Ma, J.; Chen, S.; Feng, S.B.; Ding, D.D. Hydrochemical characteristics, hydraulic connectivity and water quality assessment of multilayer aquifers in Western Suzhou City, Northern Anhui Province, China. Water Supply 2022, 22, 2644–2658. [Google Scholar] [CrossRef]
- Yang, Q.; Zhang, X.; Hu, J.; Gui, R.; Yang, L. Estimation of Land Deformation and Groundwater Storage Dynamics in Shijiazhuang–Baoding–Cangzhou–Hengshui Using Multi-Temporal Interferometric Synthetic Aperture Radar. Remote Sens. 2024, 16, 1724. [Google Scholar] [CrossRef]
- Li, H.J.; Zhu, L.; Dai, Z.X.; Gong, H.L.; Guo, T.; Guo, G.X.; Wang, J.B.; Teatini, P. Spatiotemporal modeling of land subsidence using a geographically weighted deep learning method based on PS-InSAR. Sci. Total Environ. 2021, 799, 13. [Google Scholar] [CrossRef]
- Liu, H.H.; Zhang, Z.; Liu, S.Y.; Xie, F.M.; Ding, J.; Li, G.L.; Su, H.R. Quantifying Spatiotemporal Changes in Supraglacial Debris Cover in Eastern Pamir from 1994 to 2024 Based on the Google Earth Engine. Remote Sens. 2025, 17, 19. [Google Scholar] [CrossRef]
- Ouyang, Y.; Feng, T.; Feng, H.; Wang, X.H.; Zhang, H.Y.; Zhou, X.X. Deformation Monitoring and Potential Risk Detection of In-Construction Dams Utilizing SBAS-InSAR Technology-A Case Study on the Datengxia Water Conservancy Hub. Water 2024, 16, 17. [Google Scholar] [CrossRef]
- Tizzani, P.; Berardino, P.; Casu, F.; Euillades, P.; Manzo, M.; Ricciardi, G.P.; Zeni, G.; Lanari, R. Surface deformation of Long Valley Caldera and Mono Basin, California, investigated with the SBAS-InSAR approach. Remote Sens. Environ. 2007, 108, 277–289. [Google Scholar] [CrossRef]
- Zhao, R.; Li, Z.W.; Feng, G.C.; Wang, Q.J.; Hu, J. Monitoring surface deformation over permafrost with an improved SBAS-InSAR algorithm: With emphasis on climatic factors modeling. Remote Sens. Environ. 2016, 184, 276–287. [Google Scholar] [CrossRef]
- Dong, S.C.; Samsonov, S.; Yin, H.W.; Ye, S.J.; Cao, Y.R. Time-series analysis of subsidence associated with rapid urbanization in Shanghai, China measured with SBAS InSAR method. Environ. Earth Sci. 2014, 72, 677–691. [Google Scholar] [CrossRef]
- Castellazzi, P.; Garfias, J.; Martel, R.; Brouard, C.; Rivera, A. InSAR to support sustainable urbanization over compacting aquifers: The case of Toluca Valley, Mexico. Int. J. Appl. Earth Obs. Geoinf. 2017, 63, 33–44. [Google Scholar] [CrossRef]
- Zhang, P.; Guo, Z.; Guo, S.; Xia, J. Land Subsidence Monitoring Method in Regions of Variable Radar Reflection Characteristics by Integrating PS-InSAR and SBAS-InSAR Techniques. Remote Sens. 2022, 14, 3265. [Google Scholar] [CrossRef]
- Ben Abbes, A.; Bounouh, O.; Farah, I.R.; de Jong, R.; Martínez, B. Comparative study of three satellite image time-series decomposition methods for vegetation change detection. Eur. J. Remote Sens. 2018, 51, 607–615. [Google Scholar] [CrossRef]
- Chen, C.; Hu, M.; Chen, Q.; Zhang, J.; Feng, T.; Cui, Z. Long-term trend forecast of chlorophyll-a concentration over eutrophic lakes based on time series decomposition and deep learning algorithm. Sci. Total Environ. 2024, 951, 175451. [Google Scholar] [CrossRef]
- Liu, X.; Zhang, Q. Combining Seasonal and Trend Decomposition Using LOESS With a Gated Recurrent Unit for Climate Time Series Forecasting. IEEE Access 2024, 12, 85275–85290. [Google Scholar] [CrossRef]
- Kwok, C.-F.; Qian, G.; Kuleshov, Y. Analyzing Error Bounds for Seasonal-Trend Decomposition of Antarctica Temperature Time Series Involving Missing Data. Atmosphere 2023, 14, 193. [Google Scholar] [CrossRef]
- Carranza, C.D.U.; van der Ploeg, M.J.; Torfs, P.J.J.F. Using lagged dependence to identify (de)coupled surface and subsurface soil moisture values. Hydrol. Earth Syst. Sci. 2018, 22, 2255–2267. [Google Scholar] [CrossRef]
- Ghobadi-Far, K.; Werth, S.; Shirzaei, M.; Bürgmann, R. Spatiotemporal Groundwater Storage Dynamics and Aquifer Mechanical Properties in the Santa Clara Valley Inferred From InSAR Deformation Over 2017–2022. Geophys. Res. Lett. 2023, 50, 10. [Google Scholar] [CrossRef]
- Ku, C.-Y.; Liu, C.-Y.; Lu, H.-C. Spatial Variability in Land Subsidence and Its Relation to Groundwater Withdrawals in the Choshui Delta. Appl. Sci. 2022, 12, 12464. [Google Scholar] [CrossRef]
- Chen, B.; Gong, H.; Chen, Y.; Li, X.; Zhou, C.; Lei, K.; Zhu, L.; Duan, L.; Zhao, X. Land subsidence and its relation with groundwater aquifers in Beijing Plain of China. Sci. Total Environ. 2020, 735, 139111. [Google Scholar] [CrossRef]
- Wang, S.; Wang, G.; Huang, M.; Song, J.; Yang, X.; Zhang, T.; Ji, W.; Zhang, S.; Wu, W.; Wei, C.; et al. Spatio-Temporal Characteristics of Land Subsidence and Driving Factors Analysis in Shenzhen. Water 2024, 16, 1200. [Google Scholar] [CrossRef]
Disclaimer/Publisher’s Note: The statements, opinions and data contained in all publications are solely those of the individual author(s) and contributor(s) and not of MDPI and/or the editor(s). MDPI and/or the editor(s) disclaim responsibility for any injury to people or property resulting from any ideas, methods, instructions or products referred to in the content. |
© 2025 by the authors. Licensee MDPI, Basel, Switzerland. This article is an open access article distributed under the terms and conditions of the Creative Commons Attribution (CC BY) license (https://creativecommons.org/licenses/by/4.0/).