Article

Multivariate Analysis and Geostatistics of the Physicochemical Quality Waters Study from the Complex Lake Togo-Lagoon of Aneho (Southern Togo)

by
Kamilou Ouro-Sama
1,*,
Hodabalo Dheoulaba Solitoke
1,
Gnon Tanouayi
1,
Narcis Barsan
2,*,
Emilian Mosnegutu
2,
Sadikou Agbere
1,
Fègbawè Badanaro
3,
Valentin Nedeff
2,
Kissao Gnandi
1,
Florin-Marian Nedeff
2,
Mirela Panainte-Lehadus
2 and
Dana Chitimus
2
1
Laboratoire de Gestion, Traitement et Valorisation des Déchets, Faculté des Sciences, Université de Lomé, Lomé BP 1515, Togo
2
Faculty of Engineering, “Vasile Alecsandri” University of Bacau, Calea Marasesti 156, 600115 Bacau, Romania
3
Laboratoire de Biochimie Appliquée à la Nutrition, Faculté des Sciences, Université de Lomé, Lomé BP 1515, Togo
*
Authors to whom correspondence should be addressed.
Appl. Sci. 2025, 15(14), 7940; https://doi.org/10.3390/app15147940
Submission received: 26 May 2025 / Revised: 11 July 2025 / Accepted: 14 July 2025 / Published: 16 July 2025

Abstract

The hydrosystem composed of Lake Togo, Lagoon of Togoville, and Lagoon of Aného is located in the coastal zone of Togo and receives important and different kinds of mining waste that cause its degradation. This study aims to evaluate the physicochemical and metallic quality of these waters and determine the possible sources of these contaminants using geostatistical, multivariate, and special analysis methods. These waters were very mineralized according to the average conductivity (15.51 mS/cm). Average contents (μg/L) in trace elements varied from 2.46 μg/L for As to 141.63 μg/L for Pb. Average levels of Cd, Pb, Cr, and Ni were significantly higher than the WHO standards. Trace elements and physicochemical parameters showed strong spatial variations with the highest values recorded downstream of the hydrosystem. The main possible source of trace element pollution was the intrusion of seawater loaded with phosphate effluent, followed by atmospheric deposition and soil leaching. This hydrosystem, therefore, deserves special attention for better planning its management.

1. Introduction

Throughout the last decades, trace elements have become one of the greatest environmental concerns all over the world because of their ubiquitous character, persistence, non-degradability, availability, bioaccumulation, and high toxicity [1,2,3,4,5,6,7,8]. Apart from natural sources, which are insignificant, trace elements’ release, distribution, and contamination of different environmental compartments are due to anthropogenic activities such as industrialization, transport, mining, urbanization, agriculture, etc., [2,4,5,9].
These anthropogenic activities are intensified due to the rapid increase in the world population, with more than 60% living in coastal regions within 60 km from the seashore, with a projection of 75% by 2050 [10,11]. This situation exerts strong pressure on wetlands, resulting in an increase in all kinds of pollution loads [11], including those caused by trace elements.
Among the environments contaminated by trace elements, aquatic ecosystems, particularly coastal ones, are more vulnerable because of their great ecological and socio-economic importance [12,13]. Coastal aquatic ecosystems and estuaries, particularly, are breeding grounds for several aquatic species such as fish, and for the development of the larval and juvenile stages of many species due to the high nutrient inputs [13,14].
The monitoring of aquatic ecosystems’ pollution by trace elements has become increasingly important in recent years and is a very important subject of global concern. Some of these trace elements (Fe, Cu, Zn, Ni, Mn, Cr, As, etc.) are essential and required for biological functions, but can be toxic when their threshold concentrations are exceeded. However, others such as Pb, Hg, Cd, Sb, etc., have no metabolic function and are toxic to living organisms even at low concentrations [8,15,16,17,18]. Thus, toxic trace elements’ contamination of the aquatic environment poses a serious ecological and public health concern [19,20,21,22]. A better study of environmental quality must necessarily use geostatistical methods. These methods are able to provide spatial models that can identify sources of contamination and pollution risk areas, enhance decision-making processes, and better guide management strategies. This spatial information is neglected by univariate and multivariate statistical methods. Thereby, it is important to always consider geostatistical techniques or combine them with multivariate analyses to better explain the behavior of environmental quality parameters. For that, significant advancement has been noticed in the environmental assessment regarding spatiotemporal variabilities [23,24]. Multivariate statistical methods such as PCA, CHA, and correlation matrix allow one to reveal the possible origins, entry routes of the parameters, and processes which affect the quality of the environment [25,26].
The spatial variability of pollutant concentrations, such as trace elements in an environment, has often been used to understand and explain their possible sources and determine the most polluted and critical areas [27,28,29]. The spatial variation can be performed using methods of geostatistics and spatial analysis such as interpolation technique, [29,30,31] as described by Isaaks and Srivastava [32]. A better study of water quality must necessarily use geostatistical methods. These methods are capable of providing spatial models that can identify sources of contamination, risk areas, and better guide management strategies [29,30,31].
For more than a half-century, the coastal zone of Togo, which is also the watershed of Lake Togo, has been the place of phosphorite mining. This activity releases a lot of different kinds of mining waste into the watershed without their treatment or appropriate management [33,34]. However, high concentrations of trace elements were detected in these phosphorites by some studies [35,36,37,38,39,40]. This main threat to the complex Lagoon of Aného–Lagoon of Togoville–Lake Togo is strengthened by the leaching of different kinds of soils, such as agricultural and urban ones. This study aims to assess the trace element (Cr, Cd, Ni, Pb, Mn, Cu, Zn, and As) levels and the physicochemical quality of the hydrosystem’s waters, and determine the possible sources of trace elements’ pollution of the hydrosystem. These trace elements are highly concentrated in the phosphorite mined in the watershed and are likely to cause serious public health concerns through resource contamination. The present study may attract the attention of decision makers for better management of that aquatic ecosystem.

2. Materials and Methods

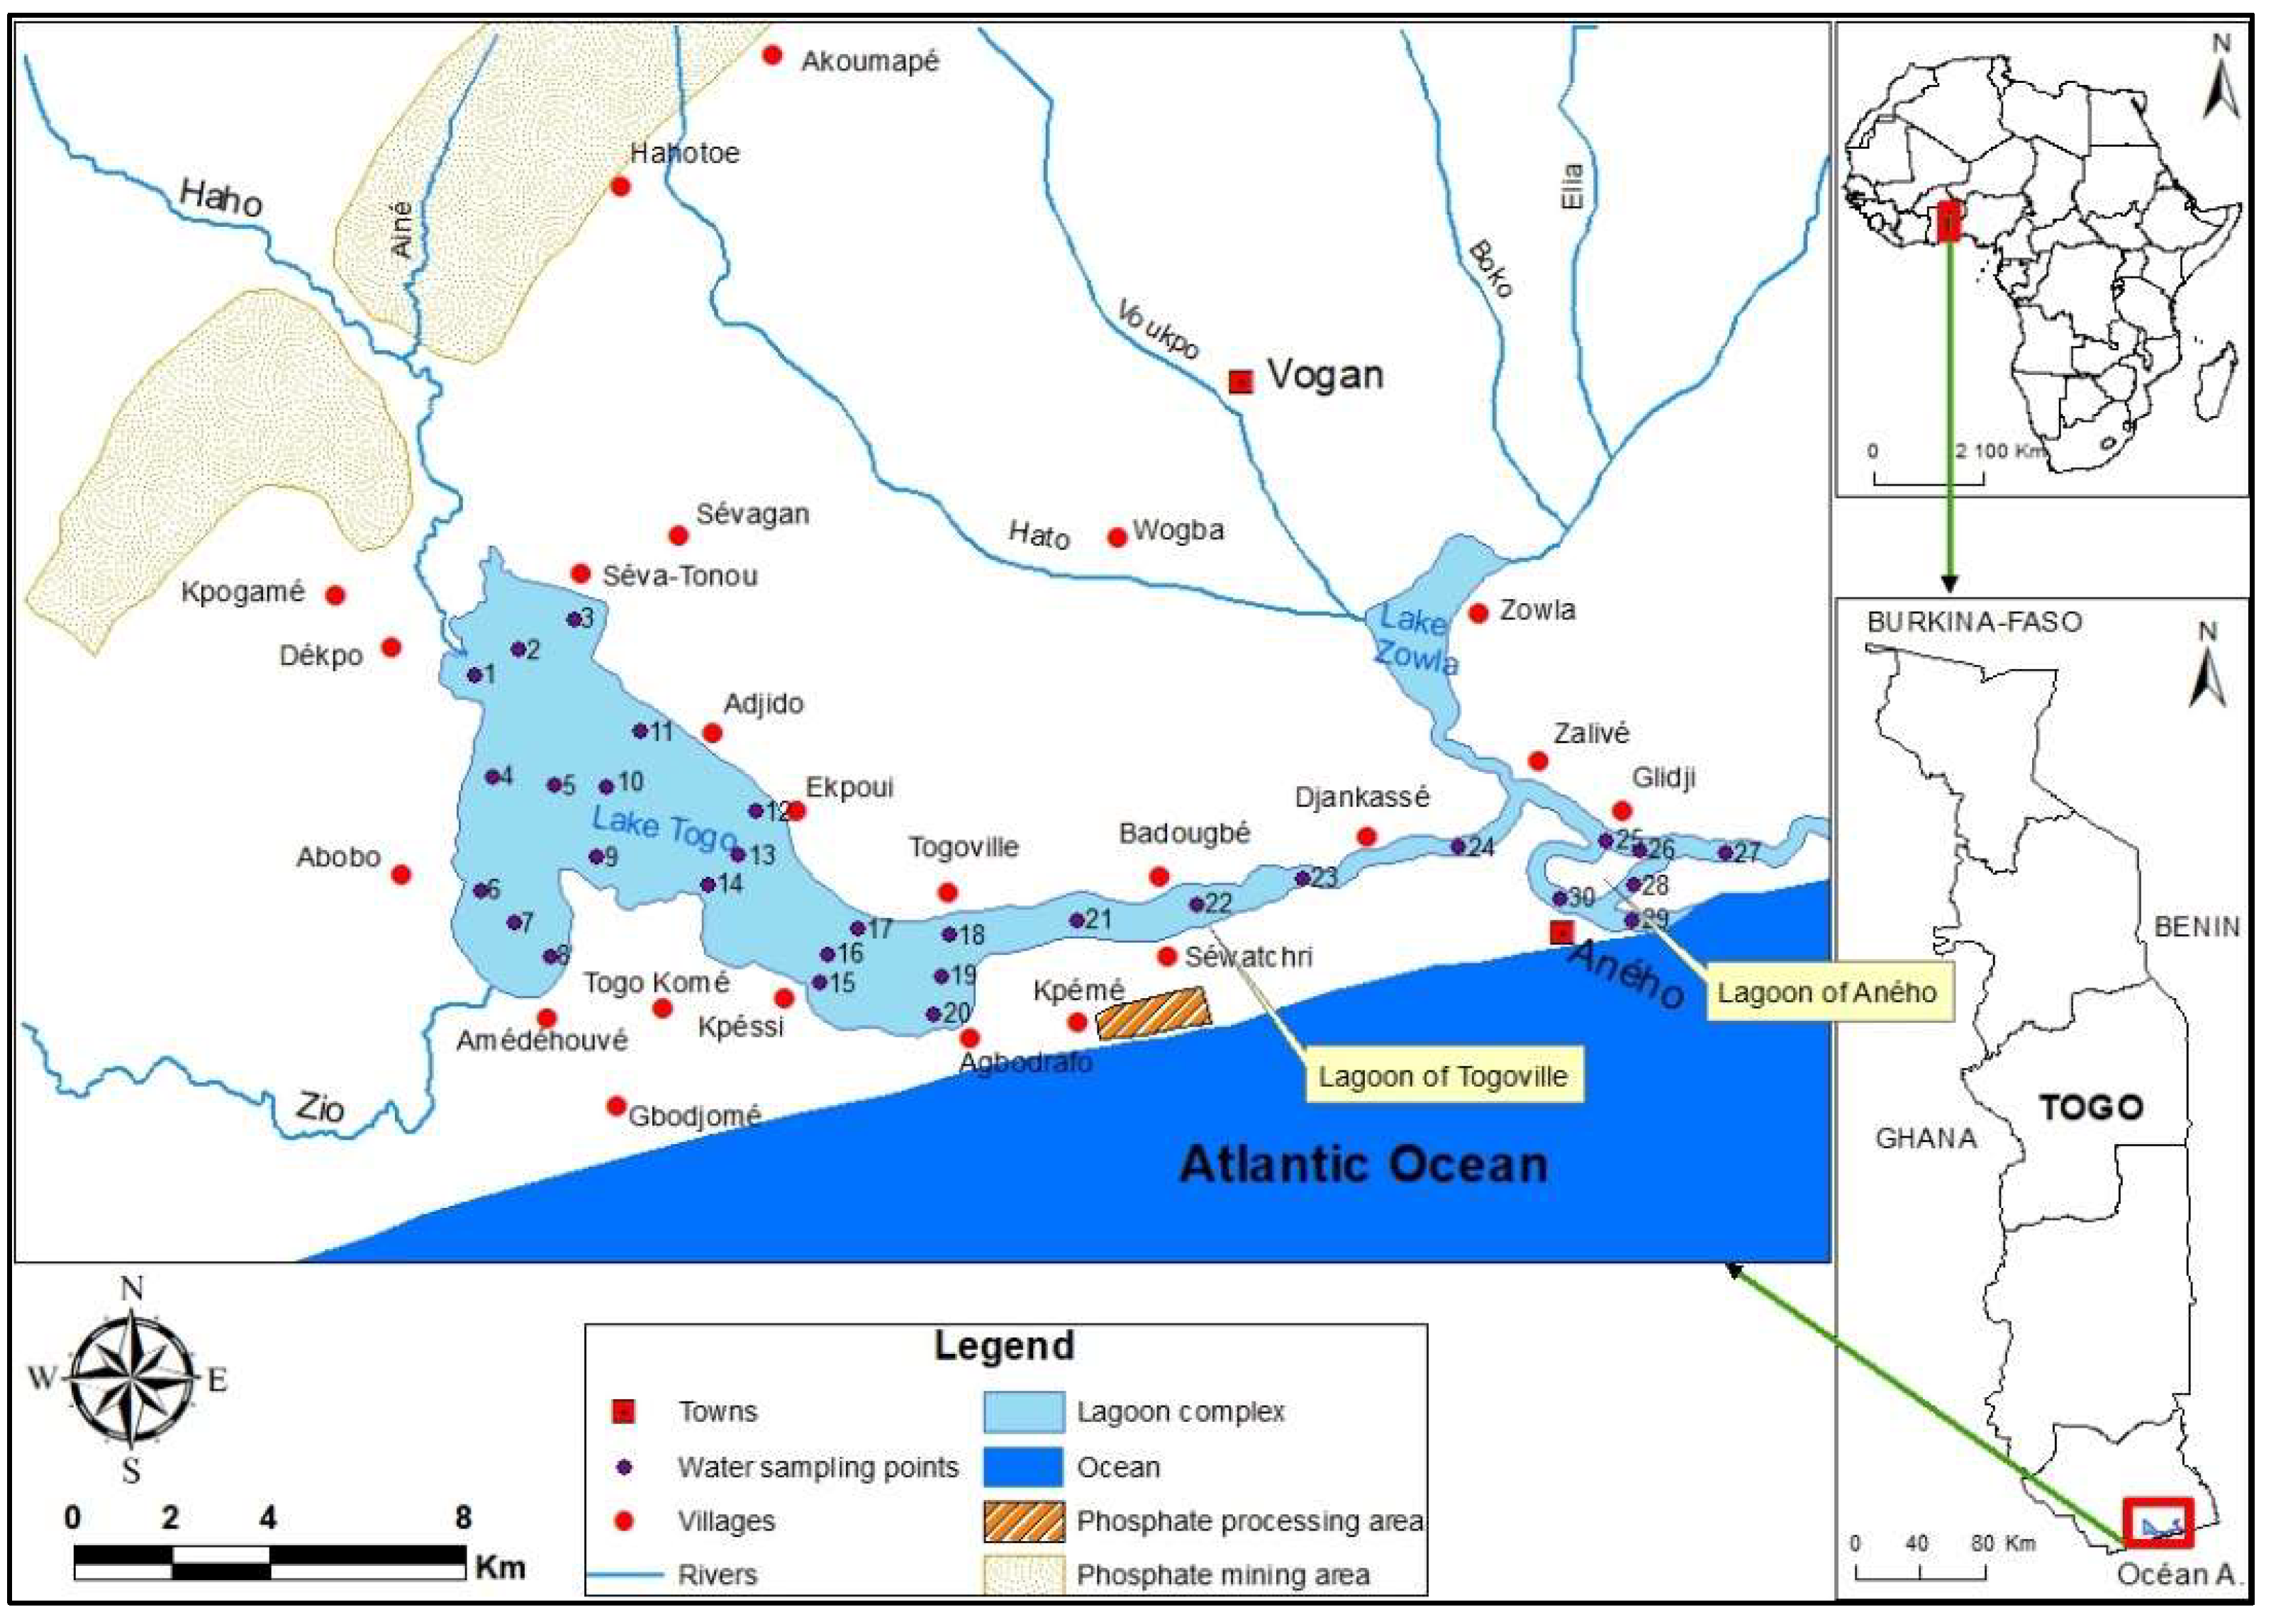
2.1. Description of the Studied Zone

The hydrosystem Lagoon of Togoville–Lagoon of Aného–Lake Togo is in the coastal zone of Togo between 6°14′38′′ to 6°17′37′′ of Northern latitudes and 1°23′33′′ to 1°37′38′′ of Eastern longitudes. The studied hydrosystem is continuously composed of the Lagoon of Togoville, Lake Togo, and the Lagoon of Aného [38]. It flows into the ocean through its mouth at Aného after receiving inputs from Haho, Zio, and Mono Rivers. The main tributaries of this lagoon system are Zio and Haho Rivers [39]. The phosphorites mining activities take place in this watershed with the rejection of various kinds of mining wastes [39,40,41,42,43,44,45]. This watershed contains the phosphorite quarries and processing plant and receives important and different kinds of mining waste through runoff, rivers, and atmospheric depositions [45,46,47,48,49,50]. The studied area presents a subequatorial or Guinean climate with two rainy and two dry seasons alternatively (Figure 1). The main economic activities of the population of the coastal zone are fishery, agriculture, and livestock farming.
The study area is a part of the Togolese sedimentary coastal basin. All of its sedimentary layers (about 600 m thick) are in fundamental discordance on a Pan-African metamorphic substratum aged 600 ± 50 Ma. These sedimentary deposits are successively those of Maastrichtian–Paleocene, Lower to Middle Eocene, Upper Oligocene, and Quaternary age. They are generally composed of sandy and marly facies with the presence of sandstones, sands, limestones, marls, conglomerates, laminated argillites with kaolinite, attapulgite, glauconite, palygorskite, and other derived rocks. The Eocene is mainly characterized by the deposit of phosphorites [51,52,53,54,55,56,57,58,59]. This phosphorite deposit constitutes an ore that is being exploited in the coastal basin. Its chemical characterization showed that it is a carbonated fluorapatite having the general formula A = C a 10 P O 4 6 x C O 3 F x O H , F 2 where x is generally close to 1 [60,61]. It contains a high concentration of different trace elements through the substitution phenomenon of Ca [35,62].

2.2. Sampling and Laboratory Analysis

A total of 60 water samples were randomly collected at 30 sampling points for two campaigns of sampling (30 samples per campaign). The first was carried out in the wet season and the second in the dry season. These samples were collected in 0.5 L sterile polyethylene bottles at 30 cm depth. The water samples for trace element analysis were preserved by acidification using nitric acid, while those for PO43− analysis were not and were preserved in a refrigerator until their analysis, which was performed within two (2) days. The acidification of the samples allows the release of trace elements in the samples and facilitates their determination (FD T90-523-3, NF EN ISO supplementary-3 [63]). After measuring pH, temperature (T°C), electrical conductivity (EC), and salinity (Sa) in situ using a multiparameter SANXIN Model SX736 (SANXIN, Shenyang, China), the samples were collected and transported to the laboratory for other analyses. The PhosVer® 3 and acid persulfate digestion method was applied for analyze PO43− analysis using a molecular absorption spectrometer HACH DR 3800 (HACH, Loveland, CO, USA) [40]. The atomic absorption spectrometer (AAS) Thermo Scientific (Waltham, MA, USA) coupled to a cold vapor and hydride generator, VP 100 Thermo Scientific was used to analyze trace elements (Cr, Cd, Ni, Pb, Mn, Cu, Zn, and As) in water samples (NF T90-112 [64], NF EN ISO 5961 [65], NF EN 1233 [66], NF EN ISO 11969 [67]).

2.3. Quality Control

The quality of the analytical method was validated by internal control. A procedural blank sample was prepared by acidifying distilled water with nitric acid to obtain a 1% acidified solution. The same reagent (nitric acid) was used to acidify the water samples. The blank allowed zeroing the device and was analyzed after each batch of 10 samples during the analysis in order to determine possible contaminations and eliminate the quantization errors. Moreover, the repeatability and accuracy of the results were checked using the average values of standard solutions and triplicate samples that were regularly analyzed (each 10-sample batch). The calculated coefficients of variation for the analyzed trace elements of the triplicates were <5% and ranged between 0.75% for Ni to 4.98% for Mn. The recovery rates of the 8 trace element concentrations in standard solutions ranged between 94. 88% for Cd and 103.15% for Ni.

2.4. Statistical Analysis and Mapping

The study of the spatial distribution of trace elements in lagoon waters was carried out using geostatistical analysis. The geostatistical method consists of describing spatial patterns (semi-variograms) and attribute value prediction (kriging). It uses the available sampling point values to estimate those of the unsampled locations to produce maps showing the trends of spatial distribution of the studied parameters in the area. Indeed, distribution prediction maps were performed using the Ordinary Kriging Interpolation (OKI) technique of the ArcGIS 10.2.2 software. The ordinary kriging is estimated by a linear combination of the observed values with weights using the following equation [41,42,43,44,45].
Z * x 0 = i = 1 n λ i Z x i
where Z* (x0) is the estimated value of Z at point x0, Z(xi) is the sampled value at the point xi, and λi is the weight placed on Z(xi).
The particularity of the OKI technique is to produce more accurate data prediction and provide checking elements of the accuracy of predictions [29,43]. For that, it is the most used method in geostatistical analysis. The most accurate spatial autocorrelation (variogram) model of each trace element is selected using cross-validation. The mean errors (ME) and root mean square error (RMSE) values were used to check the accuracy of the results of the models and test their robustness. The Nugget ( C 0 ) and Sill ( C 0 + C) ratio was calculated in order to determine the spatial dependence (SD) between sampling points or the degree of spatial variability between them. The SD is calculated using the following equation [29,42,43]:
S D   ( % ) = C 0 C 0 + C
where the nugget ( C 0 ) is the variability at zero distance; sill ( C 0 + C ) is the maximum variance between pairs of data. The spatial dependence (SD) expressed in percentage (%) is interpreted according to Cambardella et al. [68] as follows: 0–25% (high), 25–75% (medium), and 75–100% (low) spatial dependence between sampling points. The maximum separation distance between the pairs of data is assessed using the range values [29,42,43].
The interrelationships and similarities between the different variables and sampling sites studied were determined by performing multivariate analyses such as principal component analysis (PCA), Pearson correlation, and Cluster analysis (CA) using Ward’s method [44,45,46,47]. Before carrying out the principal component analysis (PCA), the adequacy of the data was assessed using the Kaiser–Meyer–Olkin (KMO) test and the sphericity test of Bartlett. The PCA was used to assess the typologies of water quality and highlight the interrelationships between physicochemical parameters and trace elements in order to deduce their possible common sources and the determinism of their distributions in the different samples. The grouping of sampling sites using PCA was carried out manually by observing the trends of raw data and the projection of sampling sites in the factorial plan. The CA method allows one to group observations or variables according to the similarities that exist between them or not. Pearson correlation analysis allowed us to highlight the links between variables. Since these multivariate analyses are highly sensitive to extreme values, all the data were normalized by calculating z-score values before carrying out the analyses according to the following equation [69,70]:
K i j = 1 + X i j X S i
where K i j is the normal value of K i j for the i t h variable of the j t h individual, X is the mean of the i t h variable, and S i the standard deviation of the i t h variable. The multivariate analyses were performed using the STATISTICA 6.1 software.

3. Results

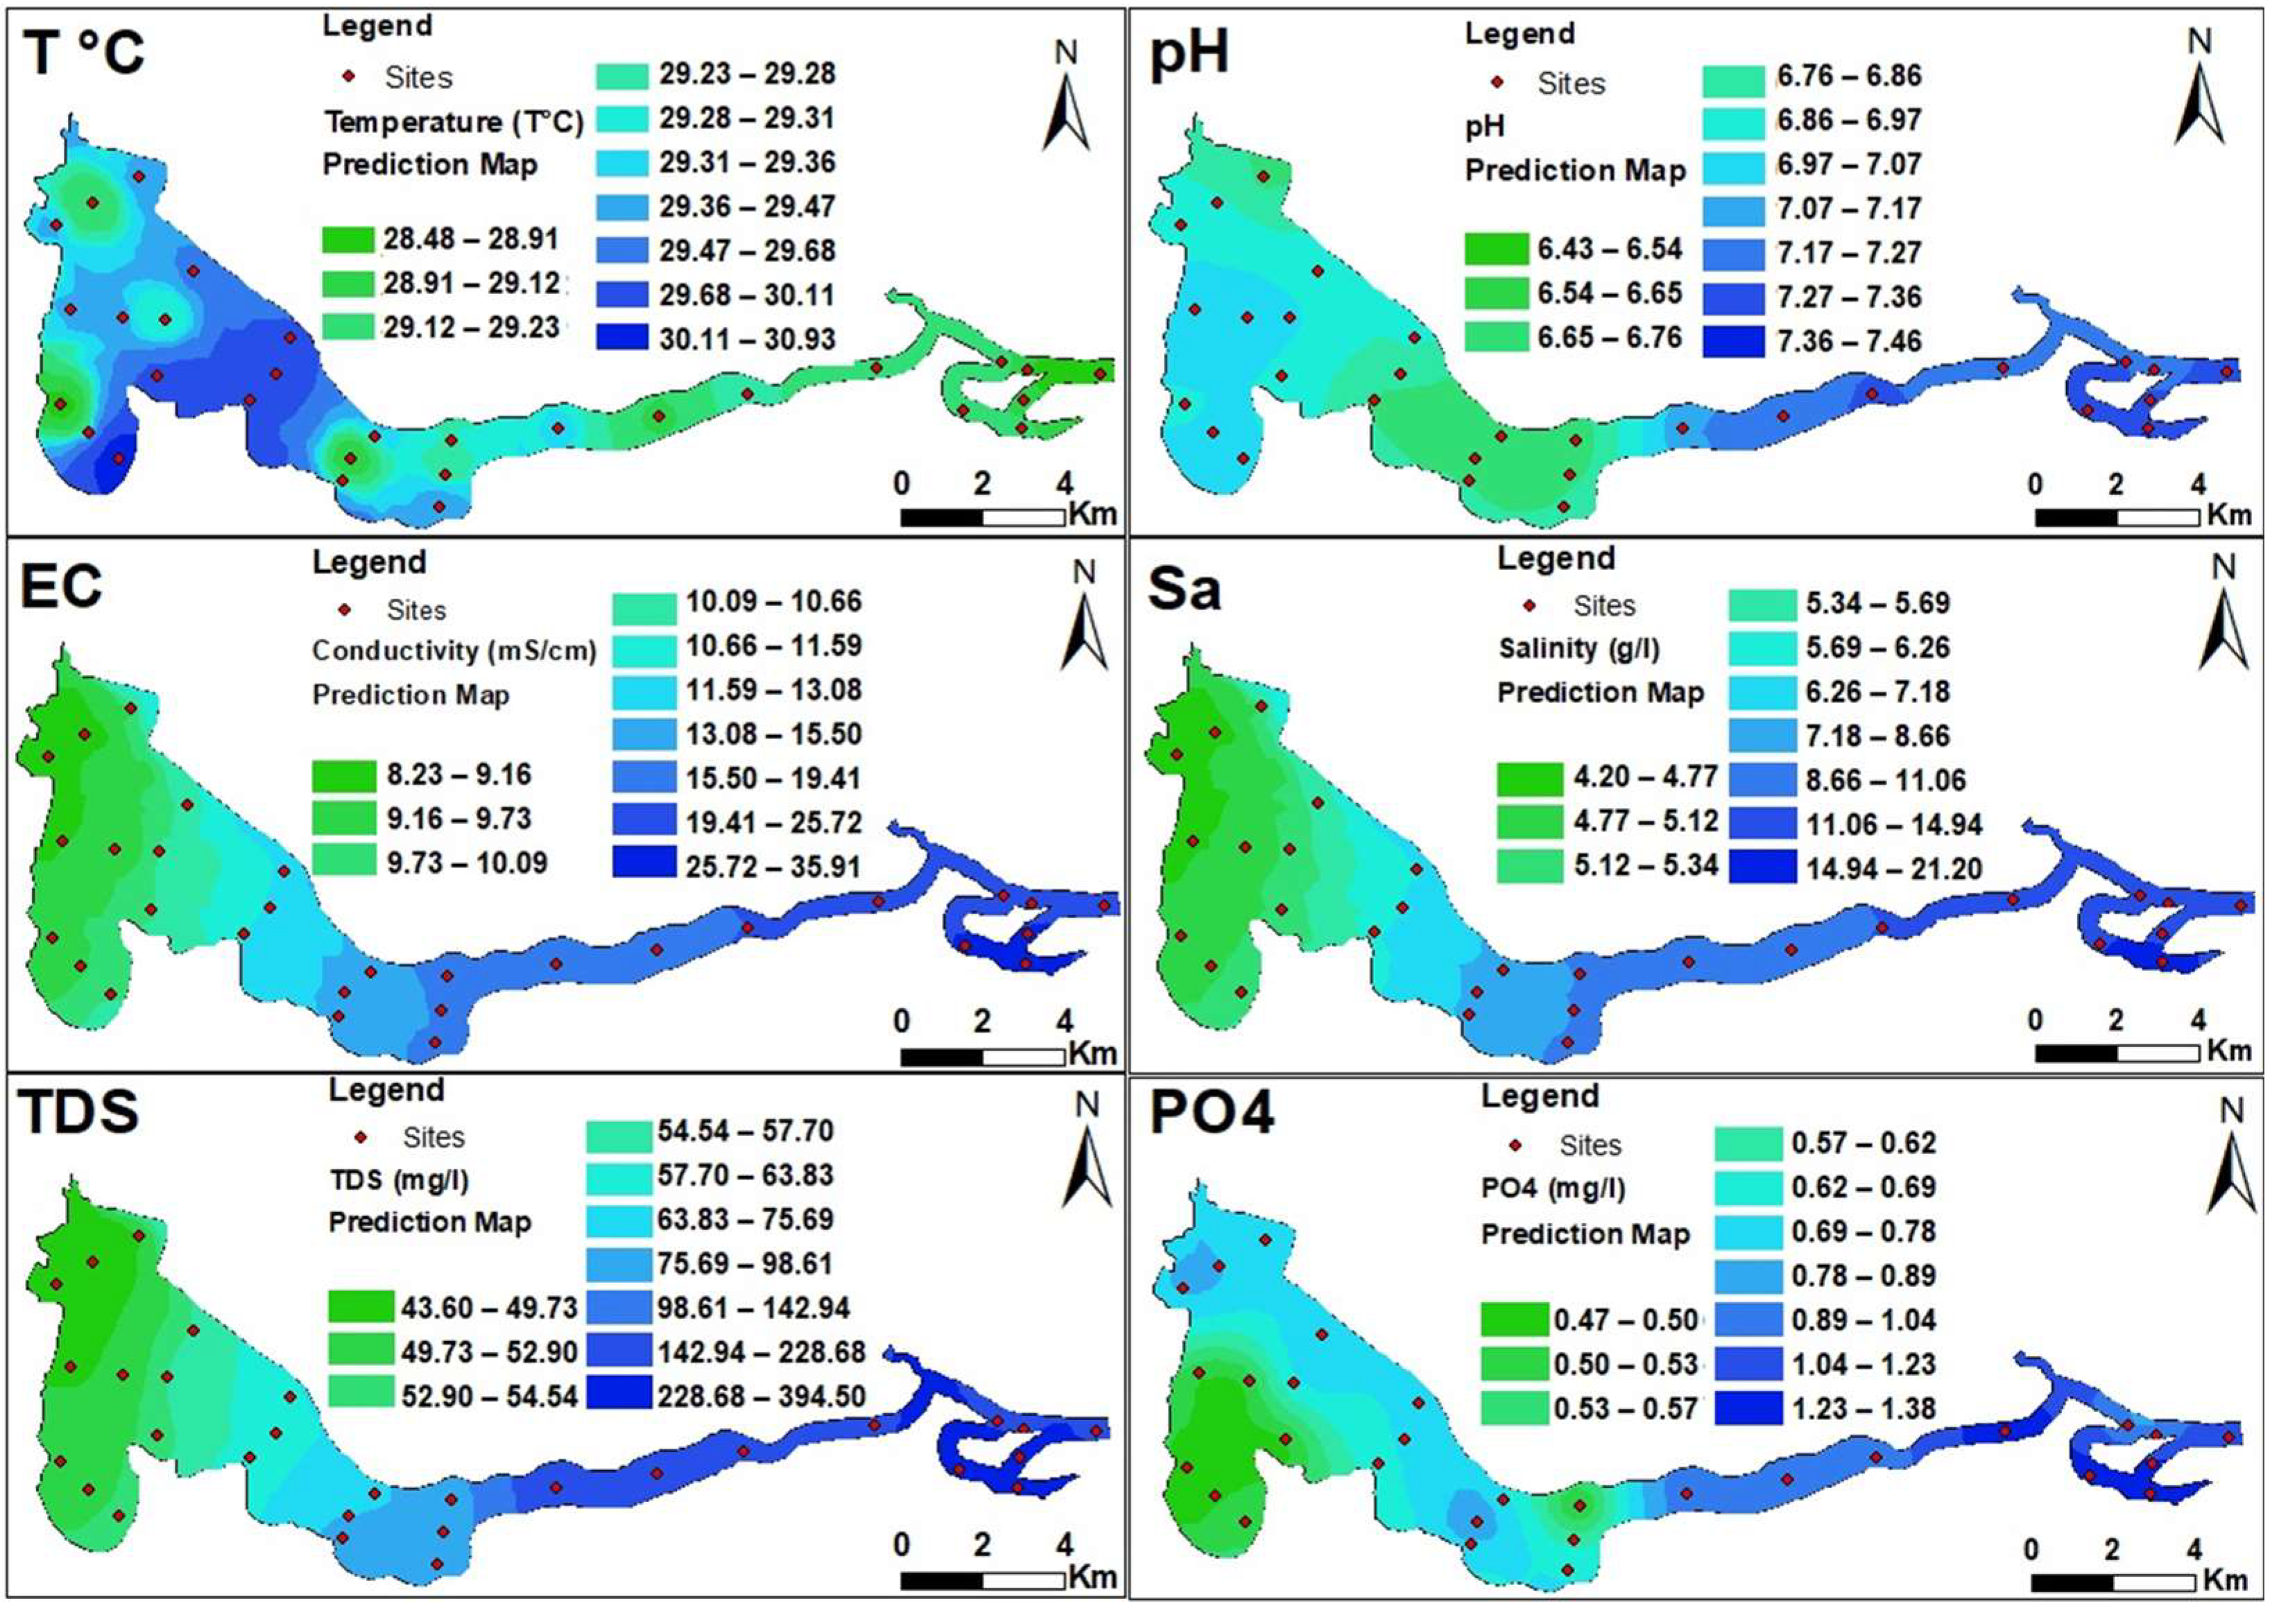
3.1. Physicochemical Parameters of Waters

Table 1 presents the values of temperature, pH, conductivity, salinity, and orthophosphate of the water. The obtained temperature (T°C) values are homogeneous all over the hydrosystem (CV = 1.64) with an average value of 29.33 °C. A total of 75% of these values are between 28.49 and 29.50 °C (3rd quartile = 29.50 °C). All these values are higher than the WHO standards for drinking water quality. The pH values also present a homogeneous distribution (CV = 4.21) with an average value of 6.99. The majority of pH values are between 6.43 and 7.22 and comply with the WHO standards. The average values of conductivity (EC), TDS, salinity (Sa), and orthophosphate (PO43−) are, respectively, 15.51 mS/cm, 127.12 mg/L, 8.52 g/L, and 0.80 mg/L. These parameters show more variation in their values in the hydrosystem. According to the third (3rd) quartile values (Table 1), it can be concluded that 75% of these parameters values vary from 8.24 to 18.80 mS/cm for EC, 43.60 to 205.39 mg/L for TDS, 4.20 to 10.49 mg/L for Sa, and 0.48 to 0.94 mg/L for PO43− All these parameter values do not comply the WHO guidelines (Table 1) for drinking water except that of pH [48,49,50]. Globally, it can be concluded that the waters from the hydrosystem are not good for human consumption according to the WHO guidelines as far as the physicochemical parameters are concerned. In aquatic ecosystems, temperature is a very important factor in the physicochemical and biochemical reactions occurring in the biotope and living organisms [40,51].
The variogram parameters recorded for physicochemical variables showed two different models describing the spatial variability (Table 2). They were Exponential (T°C, pH, and PO4) and Spherical (EC, Sa, and TDS) models that produced the most accurate data prediction based on their mean error (ME) closer to 0 and the lowest root mean square error (RMSE) values obtained [25,38]. Spatial dependence of the distribution of physicochemical parameters was observed for all the variables, with nugget–sill ratios varying from 0% (T°C) to 22.33% (pH). Indeed, high spatial dependence was recorded for all the physicochemical variables (T°C, pH, PO4, EC, Sa, and TDS) according to their nugget–sill ratios (SD = C 0 /( C 0 + C)) comprised between 0 and 25% [42,68]. There was a great similarity of spatial variability pattern between EC, TDS, and Sa, confirmed by the highest correlation coefficients (0.96–1) obtained between them.
Similar spatial distribution of pH, conductivity, salinity, total dissolved solids (TDSs), and orthophosphate (PO43−) was observed (Figure 2). This similarity is stronger between EC and Sa with regard to their nugget–sill ratios and ranges (Table 2). These values increase from upstream to downstream, with the highest values obtained in the lagoon of Aného. This trend of spatial variation can be due to the influence of seawaters. Indeed, these waters are more mineralized with higher pH values and contain phosphorite liquid waste discharged into the sea by the phosphorite processing plant at Kpémé [52]. The spatial variation in temperature values shows a slight decrease in values from upstream to downstream. The highest values in Lake Togo can be due to a shallow depth, which allows the easy traversing of solar rays associated with regular mechanical mixing. However, the slight decrease at the downstream is related to the influence of seawaters, which are often colder [39,52,53].

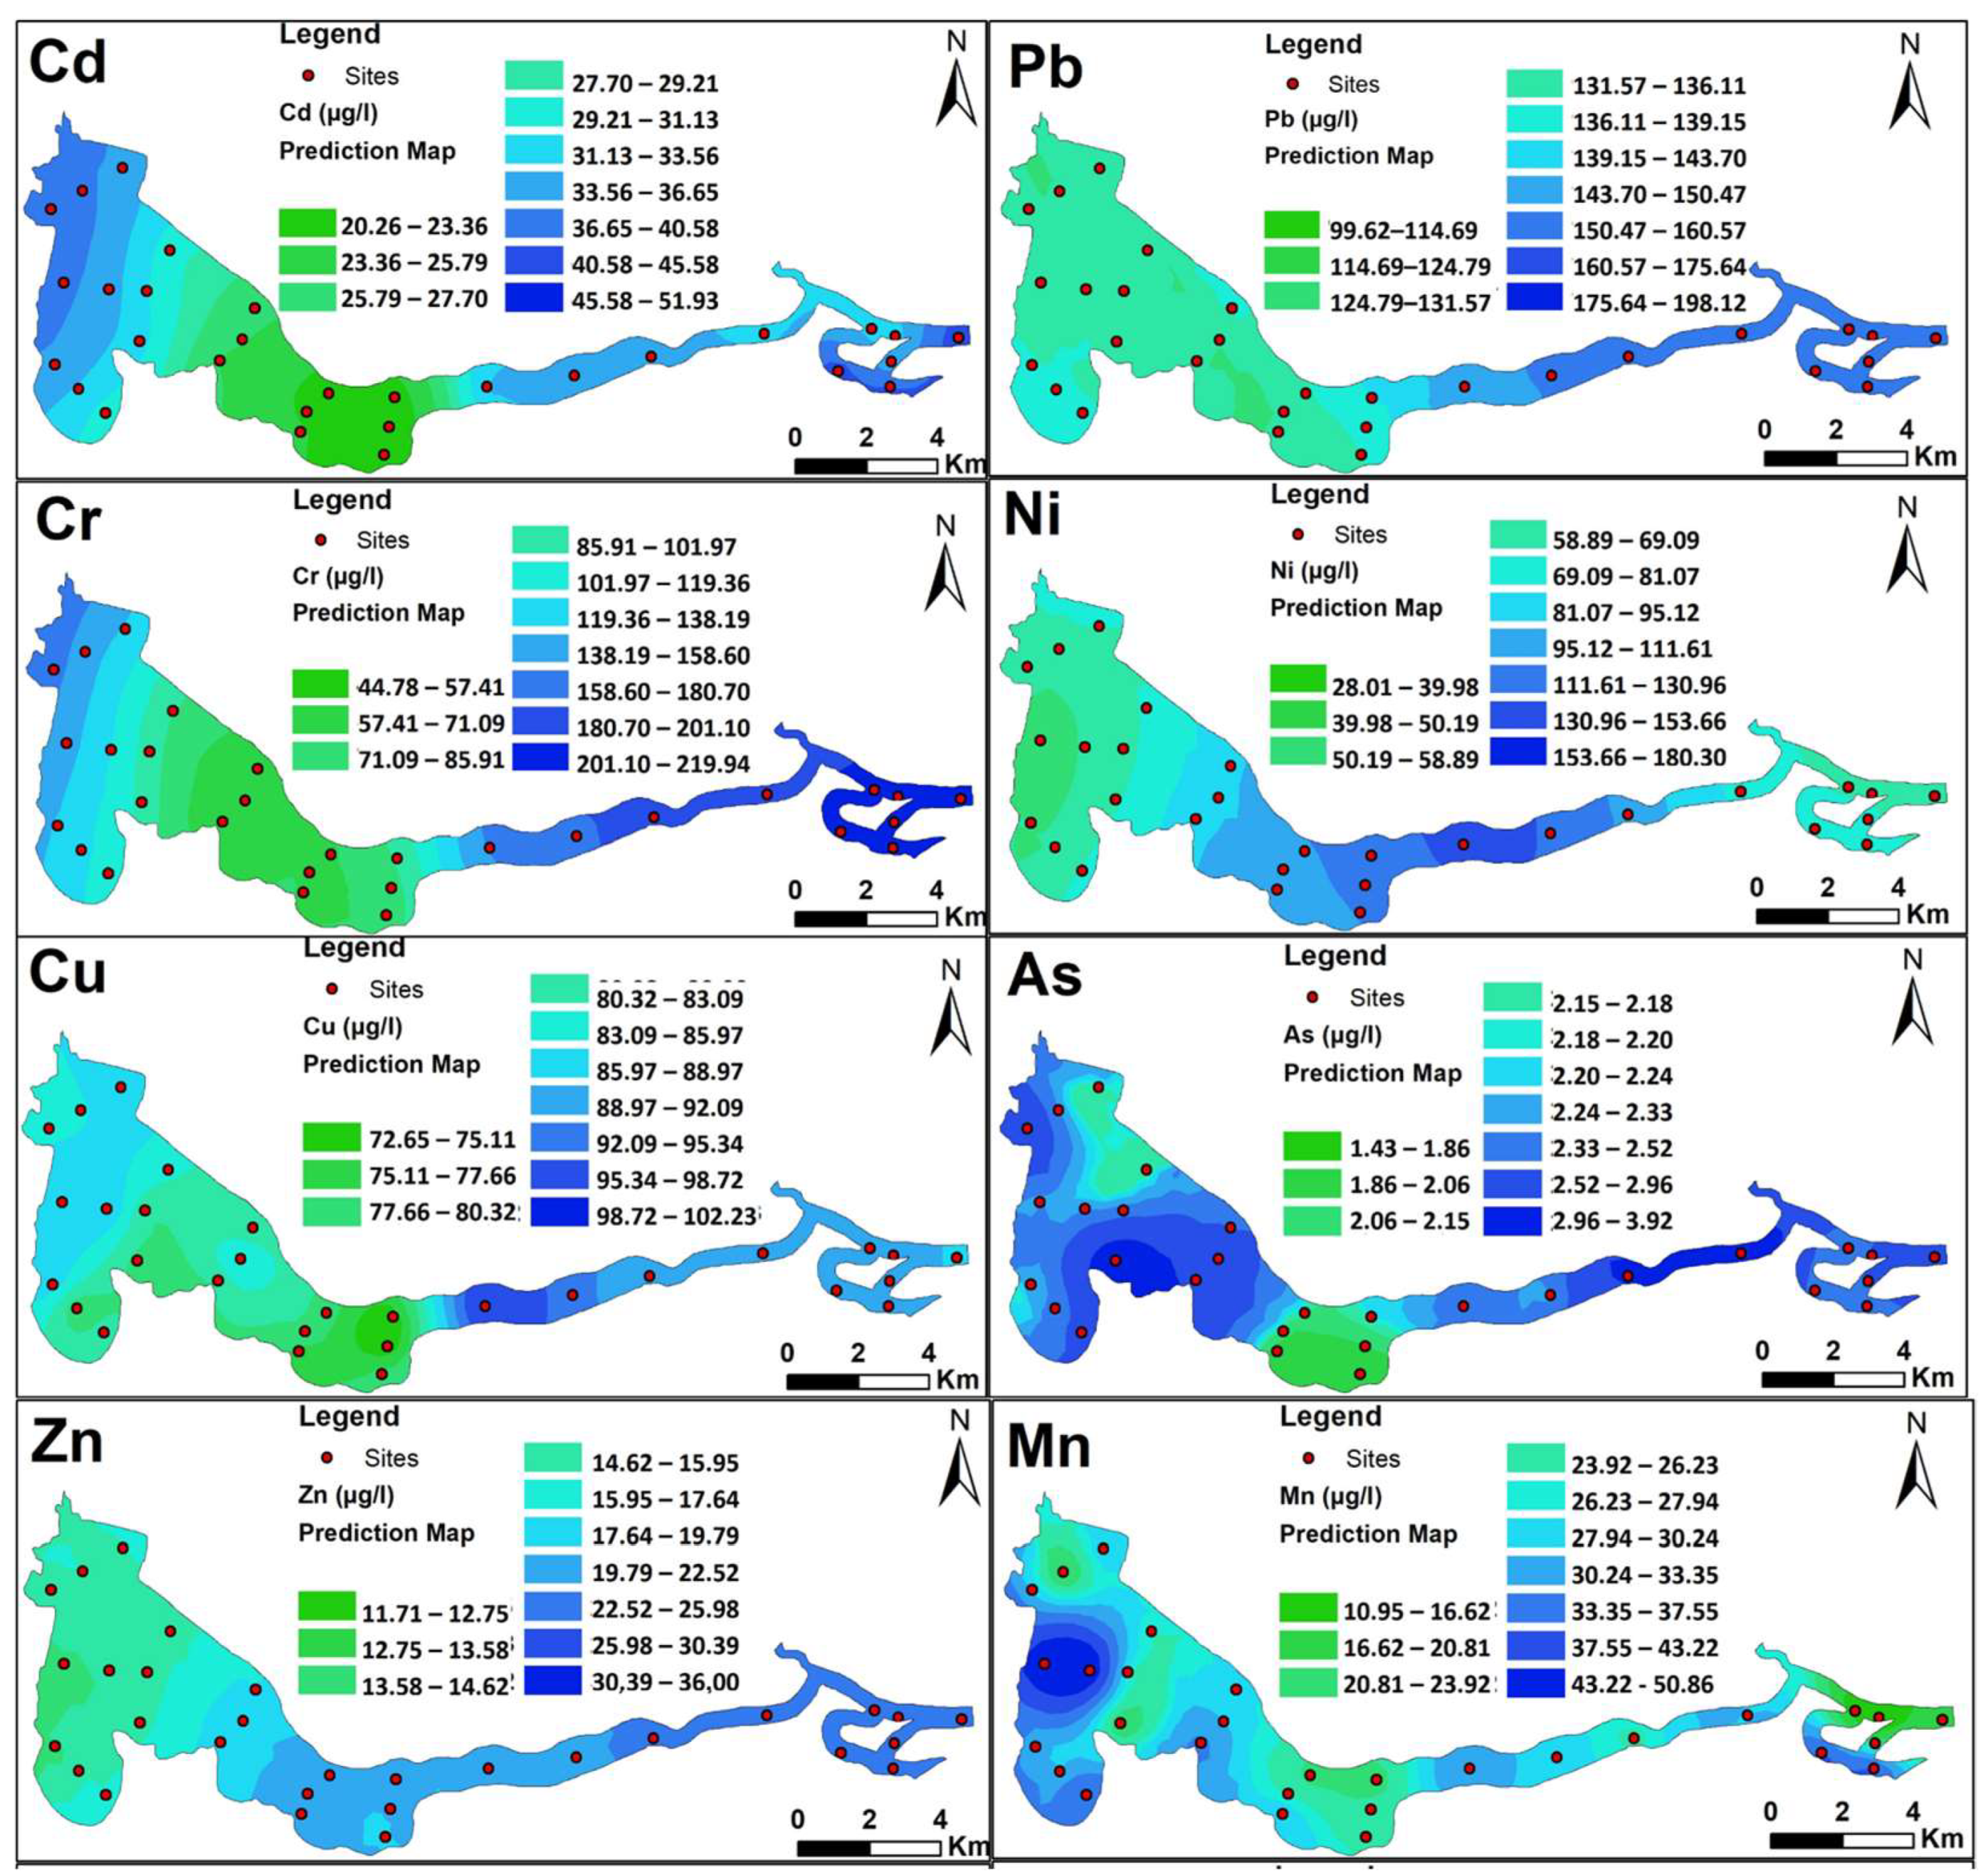
3.2. Trace Element Concentrations in Water

The average trace element concentrations obtained in the present study vary from 2.46 µg/L for As to 141.63 µg/L for Pb. Based on the third (3rd) quartile values, 75% of the trace element concentrations (in µg/L) are between 20.26 and 37.07 for Cd, 99.62–154.24 for Pb, 44.78–189.59 for Cr, 28.01–109.57 for Ni, 72.70–89.70 for Cu, 1.43–2.89 for As, 11.71–24.07 for Zn, and 10.95–31.73 for Mn (Table 3). These concentrations obtained for Ni, Pb, Cd, and Cr are higher than the WHO guidelines for drinking water (Table 3) [49,50]. It can be concluded that the waters from the hydrosystem are polluted by the trace elements Ni, Pb, Cd, and Cr and are not recommended for consumption. It should be noted that the Cr concentrations analyzed in this study are total and composed of the trivalent and hexavalent forms. Indeed, while trivalent Cr is essential for biological function at low concentrations, hexavalent Cr is very toxic at low concentrations. The ingestion of high concentrations of hexavalent Cr may cause dizziness, thirst, abdominal pain, hemorrhagic diarrhea, and in the most severe cases, coma and death. Hepatorenal syndrome, severe coagulopathy, or intravascular hemolysis may also occur. Carcinogenic effects following chronic exposure to chromium have been reported [71,72,73]. However, the low solubility of trivalent Cr in natural waters with pH between 6.5 and 8.5 could indicate a higher proportion of hexavalent Cr in these waters [74,75]. Based on Canadian guidelines for aquatic life protection which are 0.2–1.8 μg/L for Cd, 1–7 μg/L for Pb, 2–20 μg/L for Cr, and 2–4 μg/L for Cu [54], adverse effects linked to Cd, Pb, Cr, and Cu can be caused by these waters to living organisms. All the trace elements showed homogeneous variation in their concentration values, with CV varying between 7.90 for Cu and 42.66 for Cr. Positive asymmetries of trace element values were observed with Skewness values ranging from 0.11 for Cu to 0.88 for As (Table 2). Thus, the majority of the sites are in the zone of the lowest concentrations.
Four different models were used for spatial patterns analysis of trace elements based on the kriging accuracy for each variable (Table 4). Indeed, the models chosen for spatial analysis were Gaussian (Cd), Stable (Pb, Ni, and As), Exponential (Cr, Cu, and Mn), and Spherical (Zn). These models were ideal for accurate data prediction because of their mean error (ME) very close to 0 and the smallest root mean square error (RMSE) obtained (Table 4) [29,42]. Spatial variations in trace element concentrations were detected with nugget–sill ratios ranging between 0.27 and 81.90%. Indeed, high spatial dependence was recorded for Cr, Cu, and Mn (0.27–2%), whereas medium spatial dependence was observed for Cd (50.06%), Pb (46.94%), Ni (30.78%), and Zn (71.97%) [42,68]. The range values vary from 0.02 km for As and Mn to 0.24 km for Pb. Similarities in spatial dependence of the concentration variabilities were observed between Cr, Cu, and Mn.
The prediction maps (Figure 3) show a very distinct spatial distribution of trace element concentration. A similar spatial distribution was observed for Cd and Cr. Indeed, higher concentrations of these trace elements were found in the upstream (west) and downstream (east) regions of the hydrosystem. Similar spatial distribution was also observed for Pb, Cu, and Zn, with the highest concentration occupying downstream regions at the eastern part of the hydrosystem. Distinct zonal spatial variations were obtained for As and Mn. High concentrations were observed all over the hydrosystem, whereas low concentrations occupied a small area in the midstream part and the upstream in the northwestern part. The highest concentrations of Mn were obtained in the region of the upstream in the west. The highest concentrations of Cr and Cd were observed in the upstream and downstream regions. These trends of spatial variation exhibit two sources of the hydrosystem contamination by trace elements, such as the input of marine waters containing phosphorite effluents during high tides [37,55] and that of Zio and Haho Rivers after leaching different kinds of soils (agricultural, mining, and urban soils). Indeed, the extracted phosphorites contain a high concentration of trace elements [35,36].

3.3. Multivariate Analysis of Physicochemical Quality of the Waters

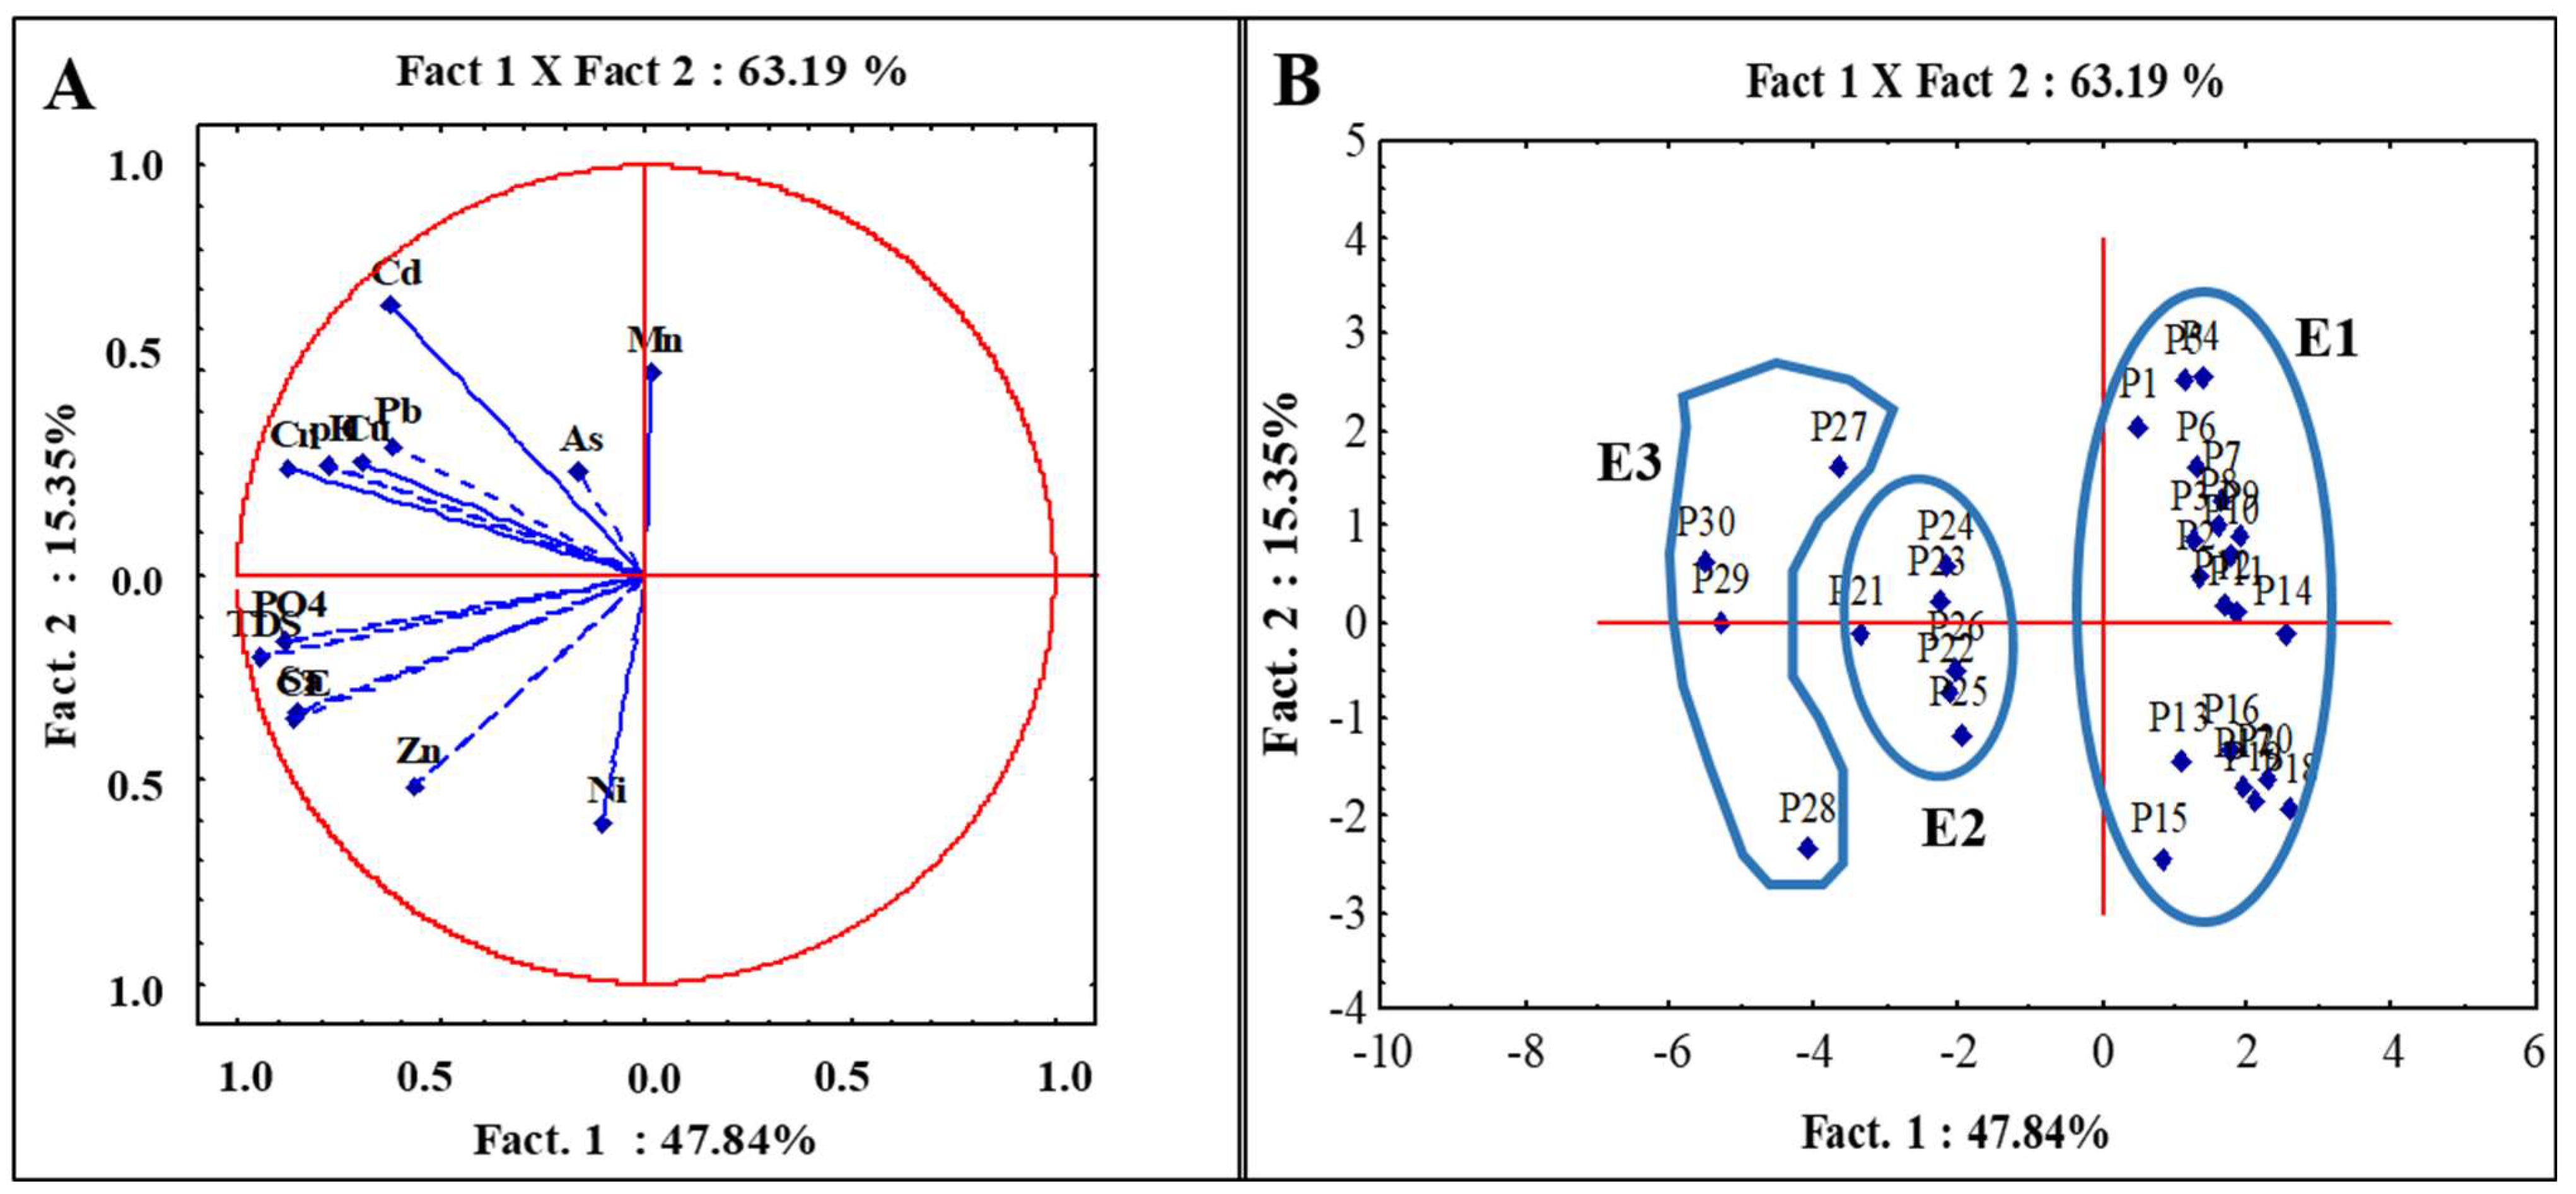
3.3.1. Correlation and Principal Component Analysis (PCA)

The Kaiser–Meyer–Olkin (KMO) value was 0.744, and the sphericity test of Bartlett was significant (p < 0.0001). These results indicate that the PCA data were moderately adequate (0.7 < KMO < 0.79) for PCA and presented a homogeneity of variance, allowing multivariate analyses). Thereby, the variables studied exhibited positive Pearson correlations (Table 5). Significant and positive correlations were obtained between the pH and TDS, EC, PO43−, and Sa, showing the influence of these parameters brought by marine waters on the pH, which was higher in the downstream (Lagoon of Aného). Positive correlations were also obtained between these parameters (TDS, EC, PO43−, and Sa) and some trace elements (Zn, Cr, Pb, Cu, and Cd). This relationship between variables could indicate the same source for them. This is confirmed by a significantly positive correlation obtained between these trace elements, such as Cd and (Pb, Cu, or Cr), Pb and (Cu or Cr), Cr and (Zn or Cu), as well as between Zn and Cu.
The Eigenvalues and variances expressed by the PCA show that in the dry season, the first three factors explain 72.62% of the total variance with F1: 47%; F2: 15.35%; and F3:9.42% (Table 6). The factorial plan (F1 × F2) explains the total information.
The projection of variables in the plan F1 × F2 (Figure 4A) shows that the axis F1 (47.84%) is negatively defined by TDS, PO4, pH, EC, Sa, Cr, Pb, Cu, and Zn, probably indicating their common sources as demonstrated by the Pearson correlation (Table 6). The main contributor to this relationship between these parameters is the intrusion of marine waters, which are loaded with the effluent dumped by the phosphorite processing plant [45,76]. The main contributors of axis F2 were Cd and Ni in the positive and negative parts, respectively. However, Cd can also be associated with the axis F1 in its negative part. The variables more correlated with axis F3 were Mn in the negative part and As in the positive part. An enrichment gradient of trace elements and physicochemical parameters from the right to the left can be deduced (Figure 4A).
The sampling sites projected in the plan F1 × F2 (Figure 4B) exhibit three (3) types of water in the hydrosystem. The first type (E1) groups sites P1–P20 located in Lake Togo. These waters are globally characterized by low mineralization and low concentrations of trace elements. However, the highest concentrations of Mn were observed in sites of the northwestern region of Lake Togo (P1–P14), whereas those of Ni were obtained in sites located in the southeastern region of Lake Togo and in the Lagoon of Togoville (P15–P20). The second type of water (E2) observed in the Lagoon of Togoville at sites P21 to P26 had moderate values of trace element concentrations and physicochemical parameters. The third type of water (E3) was observed in the Lagoon of Aného with the highest values of physicochemical parameters and trace element concentrations. Nevertheless, it can be concluded that the groups E2 and E3 are closer to each other regarding their characteristic and clearly different from the group E1. This trend showed an enrichment gradient from upstream to downstream (Figure 4A,B).

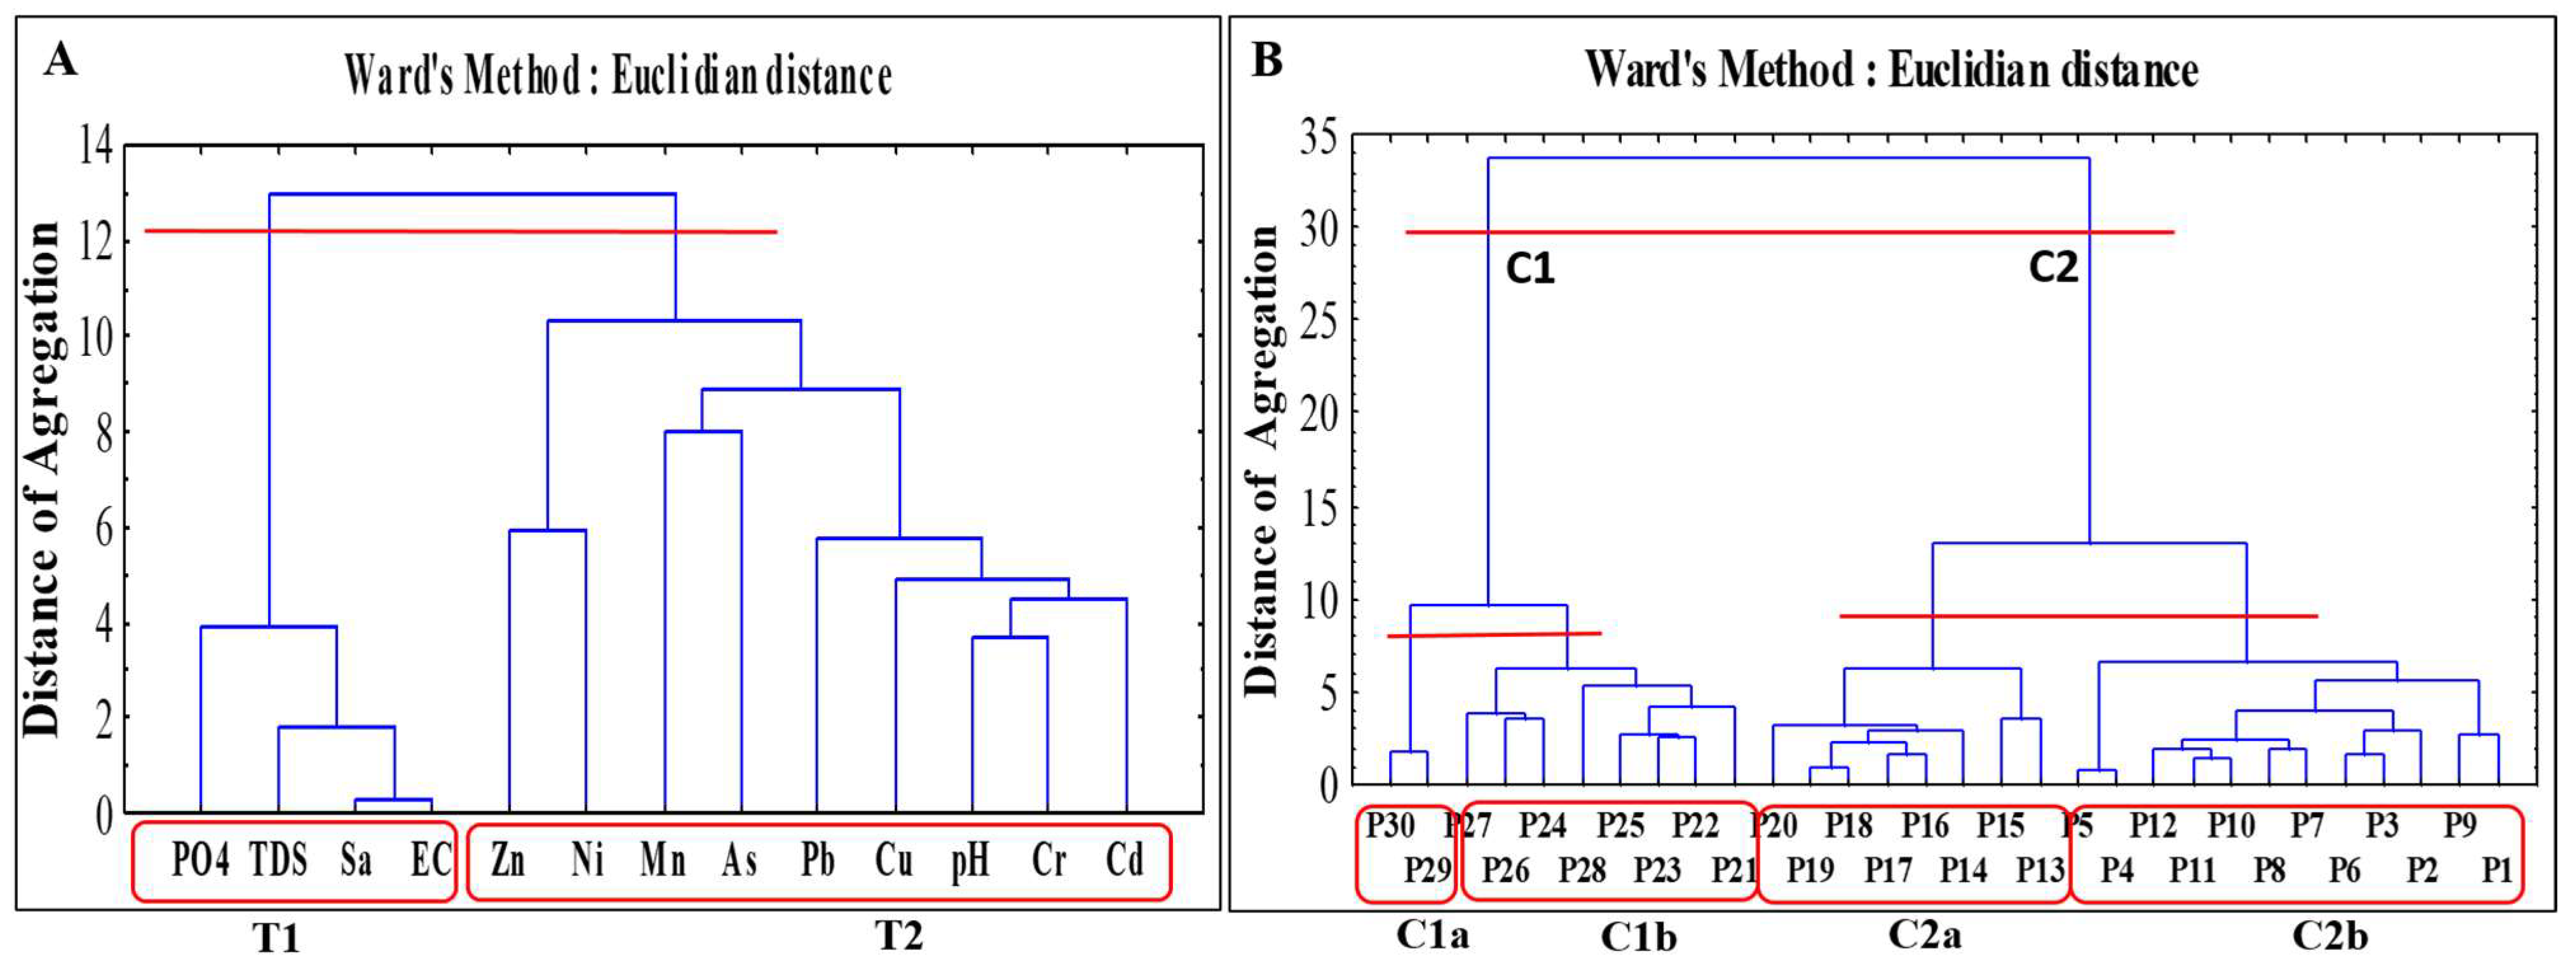
3.3.2. Cluster Analysis (CA)

The dendrogram of variables (Figure 5A) exhibits two main groups. The first (T1) showed a high degree of similarity between PO4 and TDS, EC, and Sa. This relationship between them reveals the impacts of human activities such as waste disposal into the hydrosystem, mainly enhanced by the phosphorite effluent dumping into the sea and its intrusion into the hydrosystem through the mouth at Aného. An overall link was observed between pH and trace elements (Cr, Cd, Cu, Pb, As, Mn, Ni, and Zn) in the second group (T2). This link was particularly stronger with Cr, Cd, Cu, and Pb. In the same group, high degrees of similarity were obtained between Zn and Ni as well as Mn and As. The strong relationship obtained between trace elements and pH could indicate their release from the phosphorite waste according to the environmental pH value. Low pH values may favor the dissolution and release of trace elements [35,45].
According to the dendrogram of sites (Figure 5B), two main zones were distinguished. The first main zone (C1) contains sites P21–P30 in Lagoon of Togoville and Lagoon of Aného, with the most mineralized waters and a stronger relationship between sites P29 and P30 (C1a). This higher mineralization of the waters from this lower part of the hydrosystem is due to marine intrusion [45,76]. The second zone (C2) containing sites P1–P20 (Lake-Togo) could be subdivided into two sub-zones (C2a and C2b). The waters from subzone C2b (P1–P12) globally exhibit the lowest physicochemical parameter values and concentrations of trace elements. This part is more influenced by the freshwater inflows of the Zio River [45,76]. These results confirm that of the principal component analysis (PCA).
When comparing the CA to the PCA previously explained, it appears that variables and sampling sites are clearly separated by CA. Indeed, the variables were clearly separated into two main groups. The first only concerns the physicochemical parameters, and the second is related to all the trace elements and pH, with a stronger relationship between Cd, Cr, Pb, Cu, and pH. Concerning the sampling site grouping, the same phenomenon was observed, having two main groups, each of which was subdivided into two subgroups. It can be concluded that the CA is more appropriate than PCA in terms of separating groups.

4. Conclusions

The studied hydrosystem is still influenced by the marine and continental waters containing trace elements through human activities such as mining, industrialization, agriculture, etc. In fact, trace elements had been detected in these waters with concentrations higher than the WHO guidelines for drinking water for Cr (133.02 ± 56.75 µg/L), Ni (83.28 ± 33.41 µg/L), Pb (141.63 ± 21.15 µg/L), and Cd (31.96 ± 8.37 µg/L). In addition, the waters of the hydrosystem can be a threat to aquatic life due to Cd, Pb, Cr, and Cu. All the parameters studied had a large and distinct spatial distribution all over the hydrosystem. Four semivariogram models produced the most accurate data prediction for spatial distribution due to their lowest ME (−0.02 to 0.02) and RMSE (0.64 to 1.23). Multivariate analysis presented strong interrelationships among the studied parameters, deducing two main sources, which were marine intrusion and the inputs of rivers and runoffs after different soil leaching. It is, therefore, important to implement a sustainable strategy of management to preserve the hydrosystem for public health safety concerns.

Author Contributions

Conceptualization, K.O.-S.; methodology, K.O.-S., H.D.S. and G.T.; software, K.O.-S. and S.A.; validation, N.B., E.M. and V.N.; formal analysis, F.B. and K.G.; investigation, K.O.-S.; writing—original draft preparation, K.O.-S.; writing—review and editing, K.O.-S. and N.B.; visualization, F.-M.N., D.C. and M.P.-L.; supervision, V.N. and K.G. All authors have read and agreed to the published version of the manuscript.

Funding

This research received no external funding.

Institutional Review Board Statement

Not applicable.

Informed Consent Statement

Not applicable.

Data Availability Statement

The original contributions presented in this study are included in the article. Further inquiries can be directed to the corresponding author.

Conflicts of Interest

The authors declare no conflicts of interest.

References

  1. Jacquiod, S.; Cyriaque, V.; Riber, L.; Al-Soud, W.A.; Gillan, D.C.; Wattiez, R.; Sørensen, S.J. Long-term industrial metal contamination unexpectedly shaped diversity and activity response of sediment microbiome. J. Hazard. Mater. 2018, 344, 299–307. [Google Scholar] [CrossRef] [PubMed]
  2. Liu, Q.; Wang, F.; Meng, F.; Jiang, L.; Li, G.; Zhou, R. Assessment of metal contamination in estuarine surface sediments from Dongying City, China: Use of a modified ecological risk index. Mar. Pollut. Bull. 2018, 126, 293–303. [Google Scholar] [CrossRef] [PubMed]
  3. Zhao, Y.; Xu, M.; Liu, Q.; Wang, Z.; Zhao, L.; Chen, Y. Study of heavy metal pollution, ecological risk and source apportionment in the surface water and sediments of the Jiangsu coastal region, China: A case study of the Sheyang Estuary. Mar. Pollut. Bull. 2018, 137, 601–609. [Google Scholar] [CrossRef] [PubMed]
  4. Souri, A.; Niyogi, S.; Naji, A. Distribution, source apportionment, bioavailability and ecological risks of metals in reef sediments and corals of the Persian Gulf (Iran): Khark Island, Chirouyeh, and Hendorabi Island. Mar. Pollut. Bull. 2019, 149, 110654. [Google Scholar] [CrossRef]
  5. Badassan, T.E.E.; Avumadi, A.M.D.; Ouro-Sama, K.; Gnandi, K.; Jean-Dupuy, S.J.L.; Probst, A. Geochemical composition of the Lomé Lagoon sediments, Togo: Seasonal and spatial variations of major, trace and rare earth element concentrations. Water 2020, 12, 3026. [Google Scholar] [CrossRef]
  6. Ouro-Sama, K.; Solitoke, H.D.; Tanouayi, G.; Lazar, I.M.; Bran, P.; Nadejde, M.; Badassan, T.E.-E.; Ahoudi, H.; Nyametso, A.Y.; Gnandi, K.; et al. Spatial and seasonal variation of trace elements contamination in the sediments of a tropical lagoon system: The Lake Togo-Lagoon of Aného complex (southern Togo). Environ. Earth Sci. 2021, 80, 1–22. [Google Scholar] [CrossRef]
  7. Solitoke, H.D.; Afiademanyo, K.M.; Ouro-Sama, K.; Tanouayi, G.; Badassan, T.E.-E.; Gnandi, K. Human Health Risks Associated with Trace Element Contamination of Crassostrea gasar (Dautzenberg, 1891) from Lake Zowla-Aného Lagoon Hydrosystem (Southern Togo). J. Environ. Pollut. Hum. Health 2021, 9, 71–79. [Google Scholar]
  8. French, A.D.; Ragg, N.L.C.; Ericson, J.A.; Goodwin, E.; McDougall, D.R.; Mohammadi, A.; Vignier, J. Balancing essential and non-essential metal bioavailability during hatchery rearing of Greenshell mussel (Perna canaliculus) larvae. Ecotoxicol. Environ. Saf. 2021, 216, 112194. [Google Scholar] [CrossRef] [PubMed]
  9. Hounkpè, J.B.; Kélomè, N.C.; Adèchina, R.; Lawani, R.N. Assessment of heavy metals contamination in sediments at the lake of Ahémé in southern of Benin (West Africa). J. Mater. Environ. Sci. 2017, 8, 4369–4377. [Google Scholar] [CrossRef]
  10. Le Pape, O. Essential Coastal Fish Habitats: Identifying Them, Understanding How They Work and Monitoring Their Quality to Better Manage and Sustain Exploited Marine Resources. Habilitation Thesis, University of Western Brittany, Brest, France, 2005. Available online: https://halieutique.institut-agro.fr/files/fichiers/pdf/743.pdf (accessed on 15 February 2025).
  11. Ramsar Convention, Ramsar Handbooks for the Wise Use of Wetlands, 4th ed., Handbook 12: Coastal Zone Management. Available online: https://www.ramsar.org/sites/default/files/documents/pdf/lib/hbk4-01fr.pdf (accessed on 20 February 2025).
  12. Harley, C.D.G.; Randall Hughes, A.; Hultgren, K.M.; Miner, B.G.; Sorte, C.J.B.; Thornber, C.S.; Rodriguez, L.F.; Tomanek, L.; Williams, S.L. The impacts of climate change in coastal marine systems. Ecol. Lett. 2006, 9, 228–241. [Google Scholar] [CrossRef] [PubMed]
  13. Robert, S. Coastal Urbanization: Spaces, Landscapes and Representations. Territories at the City-Sea Interface. Habilitation Thesis, University of Western Brittany, Brest, France, 2019. Available online: https://theses.hal.science/tel-02350064v1 (accessed on 15 February 2025).
  14. Gning, N. Trophic Ecology of Juveniles of Four Fish Species in the Reverse Estuary of Sine-Saloum (Senegal): Influence of Contrasting Salinity Conditions. Ph.D. Thesis, University of Montpellier II, Montpellier, France, 2008. Available online: https://horizon.documentation.ird.fr/exl-doc/pleins_textes/divers11-03/010047104.pdf (accessed on 25 February 2025).
  15. Beiras, R.; His, E. Effects of dissolved mercury on embryogenesis, survival, growth and metamorphosis of Crassostrea gigas oyster larvae. Mar. Ecol. Prog. Ser. 1994, 113, 95–103. [Google Scholar] [CrossRef]
  16. Deb, S.C.; Fukushima, T. Metals in aquatic ecosystems: Mechanisms of uptake, accumulation and release-ecotoxicological perspectives. Int. J. Environ. Stud. 1999, 56, 385–417. [Google Scholar] [CrossRef]
  17. Miquel, M.G. The Effects of Heavy Metals on the Environment and Health, Parliamentary Office for the Evaluation of Scientific and Technological Choices. Report 261, Paris, France, 2001. Available online: https://www.senat.fr/rap/l00-261/l00-261_mono.html (accessed on 15 February 2025).
  18. Mai, H.; Cachot, J.; Brune, J.; Geffard, O.; Belles, A.; Budzinski, H.; Morin, B. Embryotoxic and genotoxic effects of heavy metals and pesticides on early life stages of Pacific oyster (Crassostrea gigas). Mar. Pollut. Bull. 2012, 64, 2663–2670. [Google Scholar] [CrossRef] [PubMed]
  19. Bastami, K.D.; Afkhami, M.; Mohammadizadeh, M.; Ehsanpour, M.; Chambari, S.; Aghaei, S.; Esmaeilzadeh, M.; Neyestani, M.R.; Lagzaee, F.; Baniamam, M. Bioaccumulation and ecological risk assessment of heavy metals in the sediments and mullet Liza klunzingeri in the northern part of the Persian Gulf. Mar. Pollut. Bull. 2015, 94, 329–334. [Google Scholar] [CrossRef] [PubMed]
  20. Smita Achary, M.; Satpathy, K.K.; Panigrahi, S.; Mohanty, A.K.; Padhi, R.K.; Biswas, S.; Prabhu, R.K.; Vijayalakshmi, S.; Panigrahy, R.C. Concentration of heavy metals in the food chain components of the nearshore coastal waters of Kalpakkam, south east coast of India. Food Control 2017, 72, 232–243. [Google Scholar] [CrossRef]
  21. Ouro-Sama, K.; Afiademanyo, K.M.; Solitoke, H.D.; Tanouayi, G.; Badassan, T.E.-E.; Adje, K.; Agbere, S.; Gnandi, K. Trace elements in mollusks, crustaceans and fish commonly consumed by the catfish Chrysichthys nigrodigitatus Lacépède, 1803 from the Lake Togo-Lagoon of Aného hydrosystem (Southern Togo). J. Environ. Prot. 2021, 12, 1185–1203. [Google Scholar] [CrossRef]
  22. Ouro-Sama, K.; Afiademanyo, K.M.; Solitoke, H.D.; Tanouayi, G.; Agbere, S.; Badassan, T.E.-E.; Adje, K.; Gnandi, K. Consumption of the Silver Catfish Chrysichthys nigrodigitatus Lacépède, 1803 from the Lake Togo-Lagoon of Aného Hydrosystem (Southern Togo): Risks to Human Health. Haya Saudi J. Life Sci. 2021, 6, 284–294. [Google Scholar]
  23. Yeh, H.F.; Lee, C.H.; Hsu, K.C.; Po-Hsun, C. GIS for the assessment of the groundwater recharge potential zone. Environ. Geol. 2009, 58, 185–195. [Google Scholar] [CrossRef]
  24. Alshahrani, M.A.; Ahmad, M.; Laiq, M.; Nabi, M. Geostatistical analysis and multivariate assessment of groundwater quality. Sci. Rep. 2025, 15, 7435. [Google Scholar] [CrossRef] [PubMed]
  25. Otto, M. Multivariate methods. In Analytical Chemistry; Kellner, R., Mermet, J.M., Otto, M., Widmer, H.M., Eds.; Wiley-VCH: Weinheim, Germany, 1998. [Google Scholar]
  26. Agyemang, V.O. Application of geostatistical techniques in the assessment of groundwater contamination in the Afigya Kwabre District of Ghana. Appl. Water Sci. 2022, 12, 53. [Google Scholar] [CrossRef]
  27. Yalcin, M.G.; Battaloglu, R.; Ilhan, S. Heavy metal sources in Sultan Marsh and its neighborhood, Kayseri, Turkey. Environ. Geol. 2007, 53, 399–415. [Google Scholar] [CrossRef]
  28. Fang, F.; Wang, H.; Lin, Y. Spatial distribution, bioavailability, and health risk assessment of soil Hg in Wuhu urban area, China. Environ. Monit. Assess. 2011, 179, 255–265. [Google Scholar] [CrossRef] [PubMed]
  29. Ghanbarpour, M.R.; Goorzadi, M.; Vahabzade, G. Spatial variability of heavy metals in surficial sediments: Tajan River Watershed, Iran. Sustain. Water Qual. Ecol. 2013, 1–2, 48–58. [Google Scholar] [CrossRef]
  30. Wang, H.; Lu, S. Spatial distribution, source identification and affecting factors of heavy metals contamination in urban–suburban soils of Lishui city, China. Environ. Earth Sci. 2011, 64, 1921–1929. [Google Scholar] [CrossRef]
  31. Choe, E.; van der Meer, F.; van Ruitenbeek, F.; van der Werff, H.; de Smeth, B.; Kim, K. Mapping of heavy metal pollution in stream sediments using combined geochemistry, field spectroscopy, and hyperspectral remote sensing: A case study of the Rodalquilar mining area, SE Spain. Remote Sens. Environ. 2008, 112, 3222–3233. [Google Scholar] [CrossRef]
  32. Isaaks, E.H.; Srivastava, R.M. An Introduction to Applied Geostatistics; Oxford University Press: New York, NY, USA, 1989; 561p. [Google Scholar]
  33. Gnandi, K.; Tchangbedji, G.; Baba, G.; Kili, K.; Abbé, K.D. The impact of phosphate mine tailings on the bioaccumulation of heavy metals in marine fish and crustaceans from the coastal zone of Togo. Int. J. Mine Water Environ. 2006, 25, 56–62. [Google Scholar] [CrossRef]
  34. North-South Environement. Réduction des Rejets des Mines de Phosphates du Togo Dans le GCLME, Projet de Démonstration du Togo; Rapport final; United Nations Industrial Development Organization/North-South Environment (ONUDI/NSE): Vienna, Austria, 2007; p. 138. [Google Scholar]
  35. Gnandi, K. Cadmium et Autres Polluants Inorganiques Dans Les Sols et Sédiments de la Region Côtière du Togo: Une Etude Géochimique. Ph.D. Thesis, University d’Erlangen-Nurenberg, Erlangen, Germany, 1998; p. 165. [Google Scholar]
  36. Gnandi, K.; Tobschall, H.J. Heavy metals distribution of soils around mining sites of cadmium-rich marine sedimentary phosphorites of Kpogame and Hahotoe (Southern Togo). Environ. Geol. 2002, 41, 593–600. [Google Scholar] [CrossRef]
  37. Gnandi, K.; Rezaie, B.; Edorh, A. The geochemical characterization of mine effluents from the phosphorite processing plant of Kpémé (southern Togo). Mine Water Environ. 2009, 28, 65–73. [Google Scholar] [CrossRef]
  38. Millet, B. Study of Some Hydrological and Hydrochemical Characteristics of the Lagoon System of Lake Togo Years 1981 and 1982; ORSTOM: Marseille, France, 1983; p. 134. [Google Scholar]
  39. Millet, B. Hydrology and Hydrochemistry of a Tropical Lagoon Environment: Lake Togo. Ph.D. Thesis, Institut de Recherche pour le Développement (IRD), Paris, France, 1986. Available online: https://horizon.documentation.ird.fr/exl-doc/pleins_textes/pleins_textes_7/divers2/21095.pdf (accessed on 16 February 2025).
  40. Rodier, J.; Legube, B.; Merlet, N.; Brunet, R. Water Analysis: Natural Waters, Wastewater, Seawater, 9th ed.; Dunod: Paris, France, 2009; p. 1579. [Google Scholar]
  41. Bastami, K.D.; Bagheri, H.; Haghparast, S.; Soltani, F.; Hamzehpoor, A.; Bastami, M.D. Geochemical and geo-statistical assessment of selected heavy metals in the surface sediments of the Gorgan Bay. Iran Mar. Pollut. Bull. 2012, 64, 2877–2884. [Google Scholar] [CrossRef] [PubMed]
  42. Wang, J.; Liu, R.; Zhang, P.; Yu, W.; Shen, Z.; Feng, C. Spatial variation, environmental assessment and source identification of heavy metals in sediments of the Yangtze River Estuary. Mar. Pollut. Bull. 2014, 87, 364–373. [Google Scholar] [CrossRef] [PubMed]
  43. Wani, M.A.; Wani, J.; Bhat, M.; Kirmani, N.; Wani, Z.M.; Bhat, S.N. Mapping of soil micronutrients in kashmir agricultural landscape using ordinary kriging and indicator approach. J. Indian Soc. Remote Sens. 2013, 41, 319–329. [Google Scholar] [CrossRef]
  44. Nshimiyimana, F.-X.; Faciu, M.-E.; El Blidi, S.; El Abidi, A.; Soulaymani, A.; Fekhaoui, M.; Lazar, G. Seasonal influence and risk assessment of heavy metals contamination in groundwater, Arjaat village, Morocco. Environ. Eng. Manag. J. 2016, 15, 579–587. [Google Scholar] [CrossRef]
  45. Ouro-Sama, K.; Solitoke, H.D.; Tanouayi, G.; Badassan, T.E.-E.; Ahoudi, H.; Nyametso, A.Y.; Gnandi, K. Spatio-temporal variation of the physicochemical parameters of waters from the hydrosystem Lake Togo-Lagoon of Aného (South-East of Togo). J. Sci. Eng. Res. 2018, 5, 164–178. [Google Scholar]
  46. Jamshidi-Zanjani, A.; Saeedi, M. Metal pollution assessment and multivariate analysis in sediment of Anzali international wetland. Environ. Earth Sci. 2013, 70, 1791–1808. [Google Scholar] [CrossRef]
  47. Arain, M.B.; Ullah, I.; Niaz, A.; Shah, N.; Shah, A.; Hussain, Z.; Tariq, M.; Afridi, H.I.; Baig, J.A.; Kazi, T.G. Evaluation of water quality parameters in drinking water of district Bannu, Pakistan: Multivariate study. Sustain. Water Qual. Ecol. 2014, 3–4, 114–123. [Google Scholar] [CrossRef]
  48. Summary of Regulatory Values or Chemical Substances in Force in Water, Air and Foodstuffs in France. Available online: https://www.ineris.fr/fr/conception-cahier-charges-etudes-zones (accessed on 22 February 2025).
  49. Guidelines for Drinking-Water Quality Third Edition Incorporating the First and Second Addenda Volume 1 Recommendations. World Health Organization (WHO) Chronicle. Available online: https://iris.who.int/bitstream/handle/10665/204411/9789241547611_eng.pdf?sequence=1 (accessed on 15 February 2025).
  50. Guidelines for Drinking-Water Quality, 4th ed.; World Health Organization (WHO) Chronicle. 2011. Available online: https://iris.who.int/bitstream/handle/10665/44584/9789241548151_eng.pdf?sequence=1 (accessed on 16 February 2025).
  51. Chapman, D.; Kimstach, V. Selection of Water Quality Variables, Water Quality and Assesments-A Guide to Use of Biota, Sediments and Water in Environmental Monitoring; Chapman, D., Ed.; E and FN Spon: London, UK, 1996; pp. 56–133. [Google Scholar]
  52. Ouro-Sama, K.; Tanouayi, G.; Solitoke, H.D.; Badassan, T.E.-E.; Ahoudi, H.; Nyametso, A.Y.; Gnandi, K. Seasonal variation, quality and typology of waters’ abiotic parameters of a tropical lagoon: The hydrosystem Lake Togo-Lagoon of Aného (South-East of Togo). Int. J. Innov. Appl. Stud. 2018, 24, 656–673. [Google Scholar]
  53. Issola, Y.; Kouassi, A.M.; Dongui, B.; Biemi, J. Caractéristiques physico-chimiques d’une lagune côtière tropicale: Lagune de Fresco (Côte d’Ivoire). Afr. Sci. 2008, 4, 368–393. [Google Scholar] [CrossRef]
  54. Guidance on the Site-Specific Application of the Canadian Water Quality Guidelines: Procedures for Establishing Numerical Water Quality Objectives. Available online: https://ccme.ca/fr/res/recommandations-pour-la-qualit-des-eaux-au-canada-procdures-dtablissement-dobjectifs-numriques-de-qualit-de-leaufr.pdf (accessed on 10 February 2025).
  55. Gnandi, K. Les déchets miniers phosphatés, sources de la pollution marine au Togo. J. Rech. Sci. Univ. Lomé 2003, 7, 75–90. [Google Scholar] [CrossRef]
  56. Da Costa, P.Y.D.; Flicoteaux, R.; Affaton, P.; Seddoh, K.; Tairou, M.S.; Johnson, A.K.C. Le Continental terminal du bassin côtier du togolais: Un témoin d’altération pédogénétique sous climat tropical depuis l’oligocène supérieur. Afr. Geosci. Rev. 2006, 13, 267–288. [Google Scholar]
  57. Da Costa, P.Y.D.; Affaton, P.; Salaj, J.; Johnson, A.K.C.; Seddoh, K. Biozonation des formations sédimentaires du bassin côtier du Togo (Afrique de l’ouest). Rev. Ivoirienne Sci. Technol. 2013, 21, 45–73. [Google Scholar]
  58. Johnson, A.K.C.; Da Costa, Y.D. Le passage Paléocène-Eocène dans les bassins sédimentaires côtiers du golfe du Benin: Togo Benin et Nigeria. Rev. Ivoirienne Sci. Technol. 2008, 11, 193–205. [Google Scholar]
  59. Johnson, A.K.; Rat, P.; Lang, J. Le bassin sédimentaire à phosphate du Togo (Maastrichtien-Eocène): Stratigraphie, environnements et évolution. J. Afr. Earth Sci. 2000, 30, 153–200. [Google Scholar] [CrossRef]
  60. Gnandi, K.; Tobschall, H.J. Heavy metal release from phosphorite tailings into seawater: A simulated laboratory study. Sci. Total Environ. 1999, 236, 181–190. [Google Scholar] [CrossRef] [PubMed]
  61. Slansky, M. Géologie Des Phosphates Sédimentaire; BRGM Bureau de Recherches Géologiques et Minières: Paris, France, 1980; p. 114. [Google Scholar]
  62. Kunkel, H. Über die Cadmiumverteilung in den Phosphoritlagerstätten von Kpogamé/Hahotoé. Ph.D. Dissertation, Universtät Erlangen-Nuremberg, Erlangen, Germany, 1990. [Google Scholar]
  63. FD T90-523-3, NF EN ISO 5667-3; Water Quality—Sampling—Part 3: Preservation and Handling of Water Samples. Association Francaise de Normalisation: La Plaine Saint-Denis, France, 2013.
  64. NF T90-112; Water Quality—Determination of Eight Metallic Elements (Mn, Fe, Co, Ni, Cu, Zn, Ag, Pb) by Flame Atomic Absorption Spectrometry—Direct and After Complexing and Extraction Determination Methods. Association Francaise de Normalisation: La Plaine Saint-Denis, France, 1998.
  65. ISO 5961:1994; Water Quality—Determination of Cadmium by Atomic Absorption Spectrometry. ISO: Geneva, Switzerland, 1994.
  66. NF EN 1233; Water Quality—Determination of Chromium—Atomic Absorption Spectrometric Methods. European Standards Organizations: Brussels, Belgium, 1996.
  67. NF EN ISO 11969; Water Quality—Determination of Arsenic—Atomic Absorption Spectrometric Method (Hydride Technique). ISO: Geneva, Switzerland, 1996.
  68. Cambardella, C.A.; Moorman, T.B.; Novak, J.M.; Parkin, T.B.; Karlen, D.L.; Turco, R.F.; Konopka, A.E. Field scale variability of soil properties in Central Iowa Soil. Soil Sci. Soc. Am. J. 1994, 58, 1501–1511. [Google Scholar] [CrossRef]
  69. Garry, B. Étude des Processus D’écoulements de la Zone non Saturée Pour la Modélisation des Aquifères Karstiques: Expérimentation Hydrodynamique et Hydrochimique sur les Sites du Laboratoire Souterrain à Bas Bruit (LSBB) de Rustrel et de Fontaine de Vaucluse. Ph.D. Thesis, Université d’Avignon, Avignon, France, 2007; p. 206. [Google Scholar]
  70. Hussein, M.T. Hydrochemical evaluation of groundwater in the Blue Nile Basin, eastern Sudan, using conventional and multivariate techniques. Hydrogeol. J. 2004, 12, 144–158. [Google Scholar] [CrossRef]
  71. Barceloux, D.G. Chromium. Journal of Toxicology. Clin. Toxicol. 1999, 37, 173–194. [Google Scholar]
  72. Lauwerys, R.R. Chrome. Toxicologie Industrielle et Intoxications Professionnelles; Masson: Moulineaux, France, 1999; pp. 188–198. [Google Scholar]
  73. Mancuso, T.F. Chromium as an industrial carcinogen: Part 1. Am. J. Ind. Med. 1997, 31, 129–139. [Google Scholar] [CrossRef]
  74. Rai, D.; Saas, B.M.; Moore, D.A. Chromium(III) hydrolysis constants solubility of chromium hydroxide. Inorg. Chem. 1987, 26, 345–349. [Google Scholar] [CrossRef]
  75. Kaprara, E.; Kazakis, N.; Simeonidis, K.; Colesa, S.; Zouboulis, A.I.; Samaras, P.; Mitrakas, M. Occurrence of Cr(VI) in drinking water of Greece and relation to the geological background. J. Hazard. Mater. 2015, 281, 2–11. [Google Scholar] [CrossRef] [PubMed]
  76. Ouro-Sama, K.; Solitoke, H.D.; Tanouayi, G.; Lazar, I.M.; Bran, P.; Nadejde, M.; Ahoudi, H.; Badassan, T.E.-E.; Nyametso, A.Y.; Gnandi, K.; et al. Spatial and seasonal variation of trace elements contamination level of the waters from the hydrosystem Lake Togo-Lagoon of Aného (South of Togo). SN Appl. Sci. 2020, 2, 5. [Google Scholar] [CrossRef]
Figure 1. Location of the study area and the sampling points.
Applsci 15 07940 g001
Figure 2. Prediction maps of the spatial distribution of temperature (T°C), pH, conductivity (EC), TDS, salinity (Sa), and orthophosphate (PO43−).
Applsci 15 07940 g002
Figure 3. Prediction maps of the spatial distribution of Cd, Pb, Cr, Ni, Cu, As, Zn, and Mn.
Applsci 15 07940 g003
Figure 4. Projection of variables (A) and sites (B) in the F1 × F2 factorial plan. The blue dash line, red and blue lines from the figure represent the concentrated zone of the data.
Applsci 15 07940 g004
Figure 5. Dendrogram of variables (A) and sampling sites (B). The red line represent the limit zone and the red squares the parameters and the analised points.
Applsci 15 07940 g005
Table 1. Statistical values of the physicochemical water parameters.
Statistical ParametersPhysicochemical Parameters
T°CpHECSaPO43−
Minimum28.496.438.244.200.48
Maximum30.947.4635.9121.201.38
Average29.336.9915.518.520.80
Median29.277.0114.307.930.74
SD *0.480.297.384.410.28
CV *1.644.2147.5451.8234.63
Skewness1.16−0.271.511.570.86
Kurtosis3.26−0.711.942.25−0.17
1st quartile29.036.799.865.100.58
3rd quartile29.507.2218.8010.490.94
Standards WHO *256.5–9.50.18–10.3–0.50.5–0.9
* CV: coefficient of variation; SD: standard deviation; WHO: World Health Organization.
Table 2. Semi-variogram models and their parameters of physicochemical variables.
Physico-ChemicalSemivariogram Models and Parameters
Models Nugget   ( C 0 ) Sill   ( C 0 + C ) C 0 / ( C 0 + C ) = SD (%)Range (km)ME *RMSE *
T°CExponential0.000.2360.000.025−0.0180.45
pHSpherical0.0230.10322.330.159−0.0050.22
ECSpherical5.7475.8477.570.2420.1223.09
SaSpherical1.9927.5287.220.2420.0691.88
TDSGaussian1844.9319,449.509.480.2421.03348.07
PO4Exponential0.0040.01821.790.024−0.0090.137
* ME: mean errors; RMSE: root mean square error; SD: spatial dependence.
Table 3. Trace element concentration of waters from the hydrosystem.
Statistical ParametersTrace Elements (µg/L)
CdPbCrNiCuAsZnMn
Minimum20.2699.6244.7828.0172.701.4311.7110.95
Maximum51.93198.12219.94180.30102.203.9236.0050.86
Average31.96141.63133.0283.2885.122.4619.6328.75
Median30.15141.31132.5179.1186.672.2317.0928.63
SD *8.3721.1556.7533.416.720.586.538.87
CV *26.1914.9342.6640.117.9023.7733.2630.84
Skewness0.640.660.160.790.110.880.830.58
Kurtosis0.040.88−1.440.960.000.46−0.171.11
1st quartile26.15126.5677.1555.5179.192.0814.2623.39
3rd quartile37.07154.24189.59109.5789.702.8924.0731.73
Guidelines WHO *31050702000103000400
* CV: coefficient of variation; SD: standard deviation; WHO: World Health Organization.
Table 4. Semi-variogram models and their parameters of trace elements.
Trace ElementsSemivariogram Models and Parameters
Models Nugget   ( C 0 ) Sill   ( C 0 + C ) C 0 / ( C 0 + C ) = SD (%) Range (km)ME *RMSE *
CdGaussian33.4366.7850.060.140.0041.05
PbStable248.62529.6646.940.240.0011.17
CrExponential99.254475.172.220.22−0.0180.64
NiStable447.821454.7730.780.120.0171.07
CuExponential0.2178.500.270.17−0.021.23
AsStable0.170.2181.900.02−0.0011.06
ZnSpherical28.4639.5471.97%0.07−0.0025.78
MnExponential0.2899.630.280.020.0040.83
* ME: mean errors; RMSE: root mean square error; SD: spatial dependence.
Table 5. Pearson correlation matrix of variables.
CdPbCrNiCuAsZnMnpHECSaTDSPO4
Cd1------------
Pb0.611-----------
Cr0.710.571----------
Ni−0.270.01−0.121---------
Cu0.560.470.730.111--------
As0.160.230.23−0.070.201-------
Zn0.050.230.420.400.400.031------
Mn0.300.04−0.05−0.040.17−0.11−0.291-----
pH0.650.440.76−0.030.600.090.320.141----
EC0.320.370.620.200.37−0.010.52−0.060.561---
Sa0.330.370.610.180.36−0.030.50−0.050.551.001--
TDS0.440.480.760.170.560.090.53−0.050.690.970.961-
PO40.430.480.710.080.530.220.53−0.120.580.830.830.881
Table 6. Eigenvalues, percentage of variance explained, and coefficient of correlation between factorial axes and variables.
ParametersFactorial Axes
F1F2F3
TDS−0.95−0.20−0.10
PO4−0.89−0.160.09
Cr−0.880.260.14
EC−0.86−0.35−0.19
Sa−0.86−0.34−0.21
pH−0.790.27−0.13
Cu−0.700.280.07
Pb−0.620.320.18
Zn−0.57−0.510.18
Cd−0.630.66−0.08
Ni−0.11−0.61−0.10
Mn0.010.49−0.66
As−0.170.250.76
Eigenvalues6.222.001.23
% Total variance47.8415.359.42
% Cumulative variance47.8463.1972.62
Disclaimer/Publisher’s Note: The statements, opinions and data contained in all publications are solely those of the individual author(s) and contributor(s) and not of MDPI and/or the editor(s). MDPI and/or the editor(s) disclaim responsibility for any injury to people or property resulting from any ideas, methods, instructions or products referred to in the content.

