
In Silico Investigation of the RBC Velocity Fluctuations in Ex Vivo Capillaries


Abstract
1. Introduction
2. Physical and Mathematical Description of the Problem
2.1. Fluid Modeling
2.2. RBC Modeling
2.3. Boundary Conditions
3. Validation
4. Results and Discussion
5. Pathophysiological Relevance
6. Conclussions
Supplementary Materials
Author Contributions
Funding
Institutional Review Board Statement
Informed Consent Statement
Data Availability Statement
Acknowledgments
Conflicts of Interest
Abbreviations
| CFL | Cell-free layer |
| LBM | Lattice Boltzmann method |
| IBM | Immersed boundary method |
| FEM | Finite element method |
| BGK | Bhatnagar–Gross–Krook |
| RBC | Red blood cell |
| RDW | Red blood cell distribution width |
| CoV | Coefficient of variation |
| Capillary circularity index | |
| ANOVA | Analysis of variance |
References
- Freedlander, S.O.; Lenhart, C.H. Clinical Observations on the Capillary Circulation. Arch. Intern. Med. 1922, 29, 12–32. [Google Scholar] [CrossRef]
- Yu, D.Y.; Cringle, S.J.; Yu, P.K.; Balaratnasingam, C.; Mehnert, A.; Sarunic, M.V.; An, D.; Su, E.N. Retinal capillary perfusion: Spatial and temporal heterogeneity. Prog. Retin. Eye Res. 2019, 70, 23–54. [Google Scholar] [CrossRef]
- Vandegriff, K.D. Chapter5–The Role of Oxygen and Hemoglobin Diffusion in Oxygen Transport by Cell-free Hemoglobins. In Blood Substitutes; Winslow, R.M., Ed.; Academic Press: Oxford, UK, 2006; pp. 60–71. [Google Scholar] [CrossRef]
- Chng, K.Z.; Ng, Y.C.; Namgung, B.; Tan, J.K.S.; Park, S.; Tien, S.L.; Leo, H.L.; Kim, S. Assessment of transient changes in oxygen diffusion of single red blood cells using a microfluidic analytical platform. Commun. Biol. 2021, 4, 271. [Google Scholar] [CrossRef]
- Pries, A.; Ley, K.; Claassen, M.; Gaehtgens, P. Red cell distribution at microvascular bifurcations. Microvasc. Res. 1989, 38, 81–101. [Google Scholar] [CrossRef] [PubMed]
- Ellis, C.; Wrigley, S.; Groom, A. Heterogeneity of red blood cell perfusion in capillary networks supplied by a single arteriole in resting skeletal muscle. Circ. Res. 1994, 75, 357–368. [Google Scholar] [CrossRef]
- Lipowsky, H.H.; Usami, S.; Chien, S. In vivo measurements of “apparent viscosity” and microvessel hematocrit in the mesentery of the cat. Microvasc. Res. 1980, 19, 297–319. [Google Scholar] [CrossRef]
- Rashidi, Y.; Simionato, G.; Zhou, Q.; John, T.; Kihm, A.; Bendaoud, M.; Krüger, T.; Bernabeu, M.O.; Kaestner, L.; Laschke, M.W.; et al. Red blood cell lingering modulates hematocrit distribution in the microcirculation. Biophys. J. 2023, 122, 1526–1537. [Google Scholar] [CrossRef] [PubMed]
- Mantegazza, A.; Clavica, F.; Obrist, D. In vitro investigations of red blood cell phase separation in a complex microchannel network. Biomicrofluidics 2020, 14, 014101. [Google Scholar] [CrossRef] [PubMed]
- Kihm, A.; Quint, S.; Laschke, M.W.; Menger, M.D.; John, T.; Kaestner, L.; Wagner, C. Lingering dynamics in microvascular blood flow. Biophys. J. 2021, 120, 432–439. [Google Scholar] [CrossRef]
- Sherwood, J.M.; Holmes, D.; Kaliviotis, E.; Balabani, S. Spatial distributions of red blood cells significantly alter local haemodynamics. PLoS ONE 2014, 9, e100473. [Google Scholar] [CrossRef]
- Zhou, Q.; Fidalgo, J.; Bernabeu, M.O.; Oliveira, M.S.; Krüger, T. Emergent cell-free layer asymmetry and biased haematocrit partition in a biomimetic vascular network of successive bifurcations. Soft Matter 2021, 17, 3619–3633. [Google Scholar] [CrossRef] [PubMed]
- Schmid, F.; Reichold, J.; Weber, B.; Jenny, P. The impact of capillary dilation on the distribution of red blood cells in artificial networks. Am. J. Physiol.-Heart Circ. Physiol. 2015, 308, H733–H742. [Google Scholar] [CrossRef] [PubMed]
- Schmid, F.; Tsai, P.S.; Kleinfeld, D.; Jenny, P.; Weber, B. Depth-dependent flow and pressure characteristics in cortical microvascular networks. PLoS Comput. Biol. 2017, 13, e1005392. [Google Scholar] [CrossRef]
- Pries, A.R.; Neuhaus, D.; Gaehtgens, P. Blood viscosity in tube flow: Dependence on diameter and hematocrit. Am. J. Physiol.-Heart Circ. Physiol. 1992, 263, H1770–H1778. [Google Scholar] [CrossRef] [PubMed]
- Merill, E.W.; Cokelet, G.C.; Britten, A.; Wells, R.E., Jr. Non-Newtonian Rheology of Human Blood–effect of Fibrinogen Deduced by “Substraction”. Circ. Res. 1963, 13, 48–55. [Google Scholar] [CrossRef]
- Cross, H. Analysis of Flow in Networks of Conduits or Conductors; Bulletin No. 286; Engineering Experiment Station, University of Illinois: Champaign, IL, USA, 1936. [Google Scholar]
- Secomb, T.W. Blood Flow in the Microcirculation. Annu. Rev. Fluid Mech. 2017, 49, 443–461. [Google Scholar] [CrossRef]
- Mathew, J.; Sankar, P.; Varacallo, M. Physiology, Blood Plasma; StatPearls Publishing: Treasure Island, FL, USA, 2023. [Google Scholar]
- Steinman, J.; Koletar, M.M.; Stefanovic, B.; Sled, J.G. 3D morphological analysis of the mouse cerebral vasculature: Comparison of in vivo and ex vivo methods. PLoS ONE 2017, 12, e0186676. [Google Scholar] [CrossRef] [PubMed]
- Dholakia, K.Y.; Guevara-Torres, A.; Feng, G.; Power, D.; Schallek, J. In vivo capillary structure and blood cell flux in the normal and diabetic mouse eye. J. Vis. Exp. 2022, 63, 18. [Google Scholar] [CrossRef]
- Guevara-Torres, A.; Joseph, A.; Schallek, J. Label free measurement of retinal blood cell flux, velocity, hematocrit and capillary width in the living mouse eye. Biomed. Opt. Express 2016, 7, 4228–4249. [Google Scholar] [CrossRef]
- Ivanov, K.; Kalinina, M.; Levkovich, Y. Blood flow velocity in capillaries of brain and muscles and its physiological significance. Microvasc. Res. 1981, 22, 143–155. [Google Scholar] [CrossRef]
- Pskowski, A.; Bagchi, P.; Zahn, J.D. Investigation of red blood cell partitioning in an in vitro microvascular bifurcation. Artif. Organs 2021, 45, 1083–1096. [Google Scholar] [CrossRef] [PubMed]
- Liu, Z.L.; Clausen, J.R.; Wagner, J.L.; Butler, K.S.; Bolintineanu, D.S.; Lechman, J.B.; Rao, R.R.; Aidun, C.K. Heterogeneous partition of cellular blood-borne nanoparticles through microvascular bifurcations. Phys. Rev. E 2020, 102, 013310. [Google Scholar] [CrossRef]
- Krueger, T.; Kusumaatmaja, H.; Kuzmin, A.; Shardt, O.; Silva, G.; Viggen, E. The Lattice Boltzmann Method: Principles and Practice; Graduate Texts in Physics; Springer: Cham, Switzerland, 2016. [Google Scholar]
- Latt, J.; Malaspinas, O.; Kontaxakis, D.; Parmigiani, A.; Lagrava, D.; Brogi, F.; Belgacem, M.B.; Thorimbert, Y.; Leclaire, S.; Li, S.; et al. Palabos: Parallel Lattice Boltzmann Solver. Comput. Math. Appl. 2021, 81, 334–350. [Google Scholar] [CrossRef]
- Bhatnagar, P.L.; Gross, E.P.; Krook, M. A Model for Collision Processes in Gases. I. Small Amplitude Processes in Charged and Neutral One-Component Systems. Phys. Rev. 1954, 94, 511–525. [Google Scholar] [CrossRef]
- Guo, Z.; Zheng, C.; Shi, B. Discrete lattice effects on the forcing term in the lattice Boltzmann method. Phys. Rev. E 2002, 65, 046308. [Google Scholar] [CrossRef]
- Závodszky, G.; van Rooij, B.; Azizi, V.; Hoekstra, A. Cellular Level In-silico Modeling of Blood Rheology with An Improved Material Model for Red Blood Cells. Front. Physiol. 2017, 8, 563. [Google Scholar] [CrossRef]
- Peskin, C.S. The immersed boundary method. Acta Numer. 2002, 11, 479–517. [Google Scholar] [CrossRef]
- Mountrakis, L.; Lorenz, E.; Hoekstra, A.G. Validation of an efficient two-dimensional model for dense suspensions of red blood cells. Int. J. Mod. Phys. C 2014, 25, 1441005. [Google Scholar] [CrossRef]
- Liu, F.; Burgess, J.; Mizukami, H.; Ostafin, A. Sample preparation and imaging of erythrocyte cytoskeleton with the atomic force microscopy. Cell Biochem. Biophys. 2003, 38, 251–270. [Google Scholar] [CrossRef]
- Heinrich, V.; Ritchie, K.; Mohandas, N.; Evans, E. Elastic Thickness Compressibilty of the Red Cell Membrane. Biophys. J. 2001, 81, 1452–1463. [Google Scholar] [CrossRef]
- Yoon, Y.s.; Hong, H.; Brown, A.; Kim, D.; Kang, D.J.; Lew, V.; Cicuta, P. Flickering Analysis of Erythrocyte Mechanical Properties: Dependence on Oxygenation Level, Cell Shape, and Hydration Level. Biophys. J. 2009, 97, 1606–1615. [Google Scholar] [CrossRef]
- Mohandas, N.; Evans, E. Mechanical Properties of the Red Cell Membrane in Relation to Molecular Structure and Genetic Defects. Annu. Rev. Biophys. 1994, 23, 787–818. [Google Scholar] [CrossRef]
- Park, Y.; Best-Popescu, C.; Kuriabova, T.; Henle, M.; Feld, M.; Levine, A.; Popescu, G. Measurement of the nonlinear elasticity of red blood cell membranes. Phys. Rev. E Stat. Nonlinear Soft Matter Phys. 2011, 83, 051925. [Google Scholar] [CrossRef] [PubMed]
- Noguchi, H.; Gompper, G. Shape transitions of fluid vesicles and red blood cells in capillary flows. Proc. Natl. Acad. Sci. USA 2005, 102, 14159–14164. [Google Scholar] [CrossRef] [PubMed]
- Fedosov, D.A.; Caswell, B.; Karniadakis, G.E. A Multiscale Red Blood Cell Model with Accurate Mechanics, Rheology, and Dynamics. Biophys. J. 2010, 98, 2215–2225. [Google Scholar] [CrossRef]
- Mauer, J.; Mendez, S.; Lanotte, L.; Nicoud, F.; Abkarian, M.; Gompper, G.; Fedosov, D.A. Flow-Induced Transitions of Red Blood Cell Shapes under Shear. Phys. Rev. Lett. 2018, 121, 118103. [Google Scholar] [CrossRef] [PubMed]
- Evans, A.A.; Bhaduri, B.; Popescu, G.; Levine, A.J. Geometric localization of thermal fluctuations in red blood cells. Proc. Natl. Acad. Sci. USA 2017, 114, 2865–2870. [Google Scholar] [CrossRef]
- Reichel, F.; Mauer, J.; Nawaz, A.A.; Gompper, G.; Guck, J.; Fedosov, D.A. High-throughput microfluidic characterization of erythrocyte shape and mechanical variability. bioRxiv 2018. [Google Scholar] [CrossRef]
- McWhirter, J.L.; Noguchi, H.; Gompper, G. Ordering and arrangement of deformed red blood cells in flow through microcapillaries. New J. Phys. 2012, 14, 085026. [Google Scholar] [CrossRef]
- Matsunaga, D.; Imai, Y.; Wagner, C.; Ishikawa, T. Reorientation of a single red blood cell during sedimentation. J. Fluid Mech. 2016, 806, 102–128. [Google Scholar] [CrossRef]
- Krueger, T. Computer Simulation Study of Collective Phenomena in Dense Suspensions of Red Blood Cells Under Shear; Springer: London, UK, 2012. [Google Scholar] [CrossRef]
- Mills, J.; Qie, L.; Dao, M.; Lim, C.; Suresh, S. Nonlinear Elastic and Viscoelastic Deformation of the Human Red Blood Cell with Optical Tweezers. Mech. Chem. Biosyst. MCB 2004, 1, 169–180. [Google Scholar]
- Yao, W.; Wen, Z.; Yan, Z.; Sun, D.; Ka, W.; Xie, L.; Chien, S. Low viscosity Ektacytometry and its validation tested by flow chamber. J. Biomech. 2001, 34, 1501–1509. [Google Scholar] [CrossRef] [PubMed]
- Salehyar, S.; Zhu, Q. Effects of stiffness and volume on the transit time of an erythrocyte through a slit. Biomech. Model. Mechanobiol. 2017, 16, 921–931. [Google Scholar] [CrossRef] [PubMed]
- Ye, T.; Shi, H.; Phan-Thien, N.; Lim, C.T.; Li, Y. Relationship between transit time and mechanical properties of a cell through a stenosed microchannel. Soft Matter 2018, 14, 533–545. [Google Scholar] [CrossRef] [PubMed]
- Salehyar, S.; Zhu, Q. Deformation and internal stress in a red blood cell as it is driven through a slit by an incoming flow. Soft Matter 2016, 12, 3156–3164. [Google Scholar] [CrossRef]
- Zhu, Q.; Salehyar, S.; Cabrales, P.; Asaro, R.J. Prospects for human erythrocyte skeleton-bilayer dissociation during splenic flow. Biophys. J. 2017, 113, 900–912. [Google Scholar] [CrossRef]
- Pearson, K. Note on Regression and Inheritance in the Case of Two Parents. Proc. R. Soc. Lond. 1895, 58, 240–242. [Google Scholar] [CrossRef]
- Dasanna, A.K.; Mauer, J.; Gompper, G.; Fedosov, D.A. Importance of Viscosity Contrast for the Motion of Erythrocytes in Microcapillaries. Front. Phys. 2021, 9, 666913. [Google Scholar] [CrossRef]
- Lim, X.; Abd-Alhaseeb, M.; Ippolito, M.; Koide, M.; Senatore, A.; Plante, C.; Hariharan, A.; Weir, N.; Longden, T.; Laprade, K.; et al. Endothelial Piezo1 channel mediates mechano-feedback control of brain blood flow. Nat. Commun. 2024, 15, 8686. [Google Scholar] [CrossRef]
- Steinman, J.; Koletar, M.; Stefanovic, B.; Sled, J. Sensing mechanical forces at the blood–brain barrier in health and disease. Brain Barrier Res. Perspect. 2024, 21, e325. [Google Scholar] [CrossRef]
- McConkey, G.A.; Bogenhagen, D.F. TFIIIA binds with equal affinity to somatic and major oocyte 5S RNA genes. Genes Dev. 1988, 2, 205–214. [Google Scholar] [CrossRef] [PubMed]
- Dalkara, T.; Østergaard, L.; Heusch, G.; Attwell, D. Pericytes in the brain and heart: Functional roles and response to ischaemia and reperfusion. Cardiovasc. Res. 2024, 120, cvae147. [Google Scholar] [CrossRef] [PubMed]
- Davis, H.; Attwell, D. A tight squeeze: How do we make sense of small changes in microvascular diameter? J. Physiol. 2023, 601, 2263–2272. [Google Scholar] [CrossRef] [PubMed]
- Danielczok, J.G.; Terriac, E.; Hertz, L.; Petkova-Kirova, P.; Lautenschläger, F.; Laschke, M.W.; Kaestner, L. Red Blood Cell Passage of Small Capillaries Is Associated with Transient Ca2+-mediated Adaptations. Front. Physiol. 2017, 8, 979. [Google Scholar] [CrossRef]
- Cruz Hernández, J.C.; Bracko, O.; Kersbergen, C.J.; Muse, V.; Haft-Javaherian, M.; Berg, M.; Park, L.; Vinarcsik, L.K.; Ivasyk, I.; Rivera, D.A.; et al. Neutrophil adhesion in brain capillaries reduces cortical blood flow and impairs memory function in Alzheimer’s disease mouse models. Nat. Neurosci. 2019, 22, 413–420. [Google Scholar] [CrossRef]
- Lu, X.; Moeini, M.; Li, B.; Lu, Y.; Damseh, R.; Pouliot, P.; Thorin, É.; Lesage, F. A Pilot Study Investigating Changes in Capillary Hemodynamics and Its Modulation by Exercise in the APP-PS1 Alzheimer Mouse Model. Front. Neurosci. 2019, 13, 1261. [Google Scholar] [CrossRef]
- Forouzan, O.; Yang, X.; Sosa, J.M.; Burns, J.M.; Shevkoplyas, S.S. Spontaneous oscillations of capillary blood flow in artificial microvascular networks. Microvasc. Res. 2012, 84, 123–132. [Google Scholar] [CrossRef]
- Fu, X.; Gens, J.S.; Glazier, J.A.; Burns, S.A.; Gast, T.J. Progression of Diabetic Capillary Occlusion: A Model. PLoS Comput. Biol. 2016, 12, e1004932. [Google Scholar] [CrossRef]
- Erdener, Ş.E.; Tang, J.; Sajjadi, A.; Kılıç, K.; Kura, S.; Schaffer, C.B.; Boas, D.A. Spatio-temporal dynamics of cerebral capillary segments with stalling red blood cells. J. Cereb. Blood Flow Metab. 2019, 39, 886–900. [Google Scholar] [CrossRef]
- Erdener, Ş.E.; Dalkara, T. Small vessels are a big problem in neurodegeneration and neuroprotection. Front. Neurol. 2019, 10, 889. [Google Scholar] [CrossRef]
- Santisakultarm, T.P.; Paduano, C.Q.; Stokol, T.; Southard, T.L.; Nishimura, N.; Skoda, R.C.; Olbricht, W.L.; Schafer, A.I.; Silver, R.T.; Schaffer, C.B. Stalled cerebral capillary blood flow in mouse models of essential thrombocythemia and polycythemia vera revealed by in vivo two-photon imaging. J. Thromb. Haemost. 2014, 12, 2120–2130. [Google Scholar] [CrossRef]
- Jiang, R.; Jin, C.J.; Zhang, H.; Huang, Y.X.; Tian, J.F.; Wang, W.; Hu, M.B.; Wang, H.; Jia, B. Experimental and empirical investigations of traffic flow instability. Transp. Res. Part C Emerg. Technol. 2018, 94, 83–98. [Google Scholar] [CrossRef]
- Erdener, Ş.E.; Tang, J.; Kılıç, K.; Postnov, D.; Giblin, J.T.; Kura, S.; Chen, I.C.A.; Vayisoğlu, T.; Sakadžić, S.; Schaffer, C.B.; et al. Dynamic capillary stalls in reperfused ischemic penumbra contribute to injury: A hyperacute role for neutrophils in persistent traffic jams. J. Cereb. Blood Flow Metab. 2021, 41, 236–252. [Google Scholar] [CrossRef]
- Lim, H.K.; Bae, S.; Han, K.; Kang, B.M.; Jeong, Y.; Kim, S.G.; Suh, M. Seizure-induced neutrophil adhesion in brain capillaries leads to a decrease in postictal cerebral blood flow. iScience 2023, 26, 106655. [Google Scholar] [CrossRef] [PubMed]
- Hirunpattarasilp, C.; James, G.; Kwanthongdee, J.; Freitas, F.; Huo, J.; Sethi, H.; Kittler, J.; Owens, R.; McCoy, L.; Attwell, D. SARS-CoV-2 triggers pericyte-mediated cerebral capillary constriction. Brain 2022, 146, 727–738. [Google Scholar] [CrossRef]
- Zhang, C.; Jamshidi, M.; Delafontaine-Martel, P.; Linninger, A.A.; Lesage, F. Evaluation of cerebral microcirculation in a mouse model of systemic inflammation. Neurophotonics 2024, 11, 035003. [Google Scholar] [CrossRef]
- Fruekilde, S.K.; Bailey, C.J.; Lambertsen, K.L.; Clausen, B.H.; Carlsen, J.; Xu, N.-l.; Drasbek, K.R.; Gutiérrez-Jiménez, E. Disturbed microcirculation and hyperaemic response in a murine model of systemic inflammation. J. Cereb. Blood Flow Metab. 2022, 42, 2303–2317. [Google Scholar] [CrossRef] [PubMed]
- Angleys, H.; Østergaard, L.; Jespersen, S.N. The effects of capillary transit time heterogeneity (CTH) on brain oxygenation. J. Cereb. Blood Flow Metab. 2015, 35, 806–817. [Google Scholar] [CrossRef]
- Jespersen, S.N.; Østergaard, L. The roles of cerebral blood flow, capillary transit time heterogeneity and oxygen tension in brain oxygenation and metabolism. J. Cereb. Blood Flow Metab. 2012, 32, 264–277. [Google Scholar] [CrossRef]
- Yamamoto, S.; Amano, M.; Miura, S.; Iida, H.; Kanno, I. Deadtime correction method using random coincidence for PET. J. Nucl. Med. 1986, 27, 1925–1928. [Google Scholar]
- Østergaard, L.; Engedal, T.S.; Moreton, F.; Hansen, M.B.; Wardlaw, J.M.; Dalkara, T.; Markus, H.S.; Muir, K.W. Cerebral small vessel disease: Capillary pathways to stroke and cognitive decline. J. Cereb. Blood Flow Metab. 2016, 36, 302–325. [Google Scholar] [CrossRef]
- Nielsen, R.B.; Parbo, P.; Ismail, R.; Dalby, R.; Tietze, A.; Brændgaard, H.; Gottrup, H.; Brooks, D.J.; Østergaard, L.; Eskildsen, S.F. Impaired perfusion and capillary dysfunction in prodromal Alzheimer’s disease. Alzheimers Dement. 2020, 12, e12032. [Google Scholar] [CrossRef]
- Anzabi, M.; Angleys, H.; Aamand, R.; Ardalan, M.; Mouridsen, K.; Rasmussen, P.M.; Sørensen, J.C.H.; Plesnila, N.; Østergaard, L.; Iversen, N.K. Capillary flow disturbances after experimental subarachnoid hemorrhage. Microcirculation 2019, 26, e12588. [Google Scholar] [CrossRef] [PubMed]
- Østergaard, L.; Engedal, T.S.; Aamand, R.; Mikkelsen, R.; Iversen, N.K.; Anzabi, M.; Næss-Schmidt, E.T.; Drasbek, K.R.; Bay, V.; Blicher, J.U.; et al. Capillary transit time heterogeneity and flow–metabolism coupling after traumatic brain injury. J. Cereb. Blood Flow Metab. 2014, 34, 1585–1598. [Google Scholar] [CrossRef] [PubMed]
- Thompson, T.N.; La Celle, P.L.; Cokelet, G.R. Perturbation of red blood cell flow in small tubes by white blood cells. Pflugers Arch. 1989, 413, 372–377. [Google Scholar] [CrossRef]
- El Amki, M.; Glück, C.; Binder, N.; Middleham, W.; Wyss, M.T.; Weiss, T.; Meister, H.; Luft, A.; Weller, M.; Weber, B.; et al. Neutrophils Obstructing Brain Capillaries Are a Major Cause of No-Reflow in Ischemic Stroke. Cell Rep. 2020, 33, 108260. [Google Scholar] [CrossRef] [PubMed]
- Stavropoulos, K.; Imprialos, K.P.; Bouloukou, S.; Boutari, C.; Doumas, M. Hematocrit and Stroke: A Forgotten and Neglected Link? Semin. Thromb. Hemost. 2017, 43, 591–598. [Google Scholar] [CrossRef]
- Spiess, B.D.; Ley, C.; Body, S.C.; Siegel, L.C.; Stover, E.P.; Maddi, R.; D’Ambra, M.; Jain, U.; Liu, F.; Herskowitz, A.; et al. Hematocrit value on intensive care unit entry influences the frequency of Q-wave myocardial infarction after coronary artery bypass grafting. The Institutions of the Multicenter Study of Perioperative Ischemia (McSPI) Research Group. J. Thorac. Cardiovasc. Surg. 1998, 116, 460–467. [Google Scholar] [CrossRef]
- Li, N.; Zhou, H.; Tang, Q. Red blood cell distribution width: A novel predictive indicator for cardiovascular and cerebrovascular diseases. Dis. Markers 2017, 2017, 7089493. [Google Scholar] [CrossRef]
- Ananthaseshan, S.; Bojakowski, K.; Sacharczuk, M.; Poznański, P.; Skiba, D.; Prahl Wittberg, L.; McKenzie, J.; Szkulmowska, A.; Berg, N.; Andziak, P.; et al. Red blood cell distribution width is associated with increased interactions of blood cells with vascular wall. Sci. Rep. 2022, 12, 13676. [Google Scholar] [CrossRef]
- Fontana, V.; Spadaro, S.; Bond, O.; Cavicchi, F.Z.; Annoni, F.; Donadello, K.; Vincent, J.L.; De Backer, D.; Taccone, F.S. No relationship between red blood cell distribution width and microcirculatory alterations in septic patients. Clin. Hemorheol. Microcirc. 2017, 66, 131–141. [Google Scholar] [CrossRef] [PubMed]


| 15 | 3 | ||
| 80 | |||
| 5 | |||
| 20 |
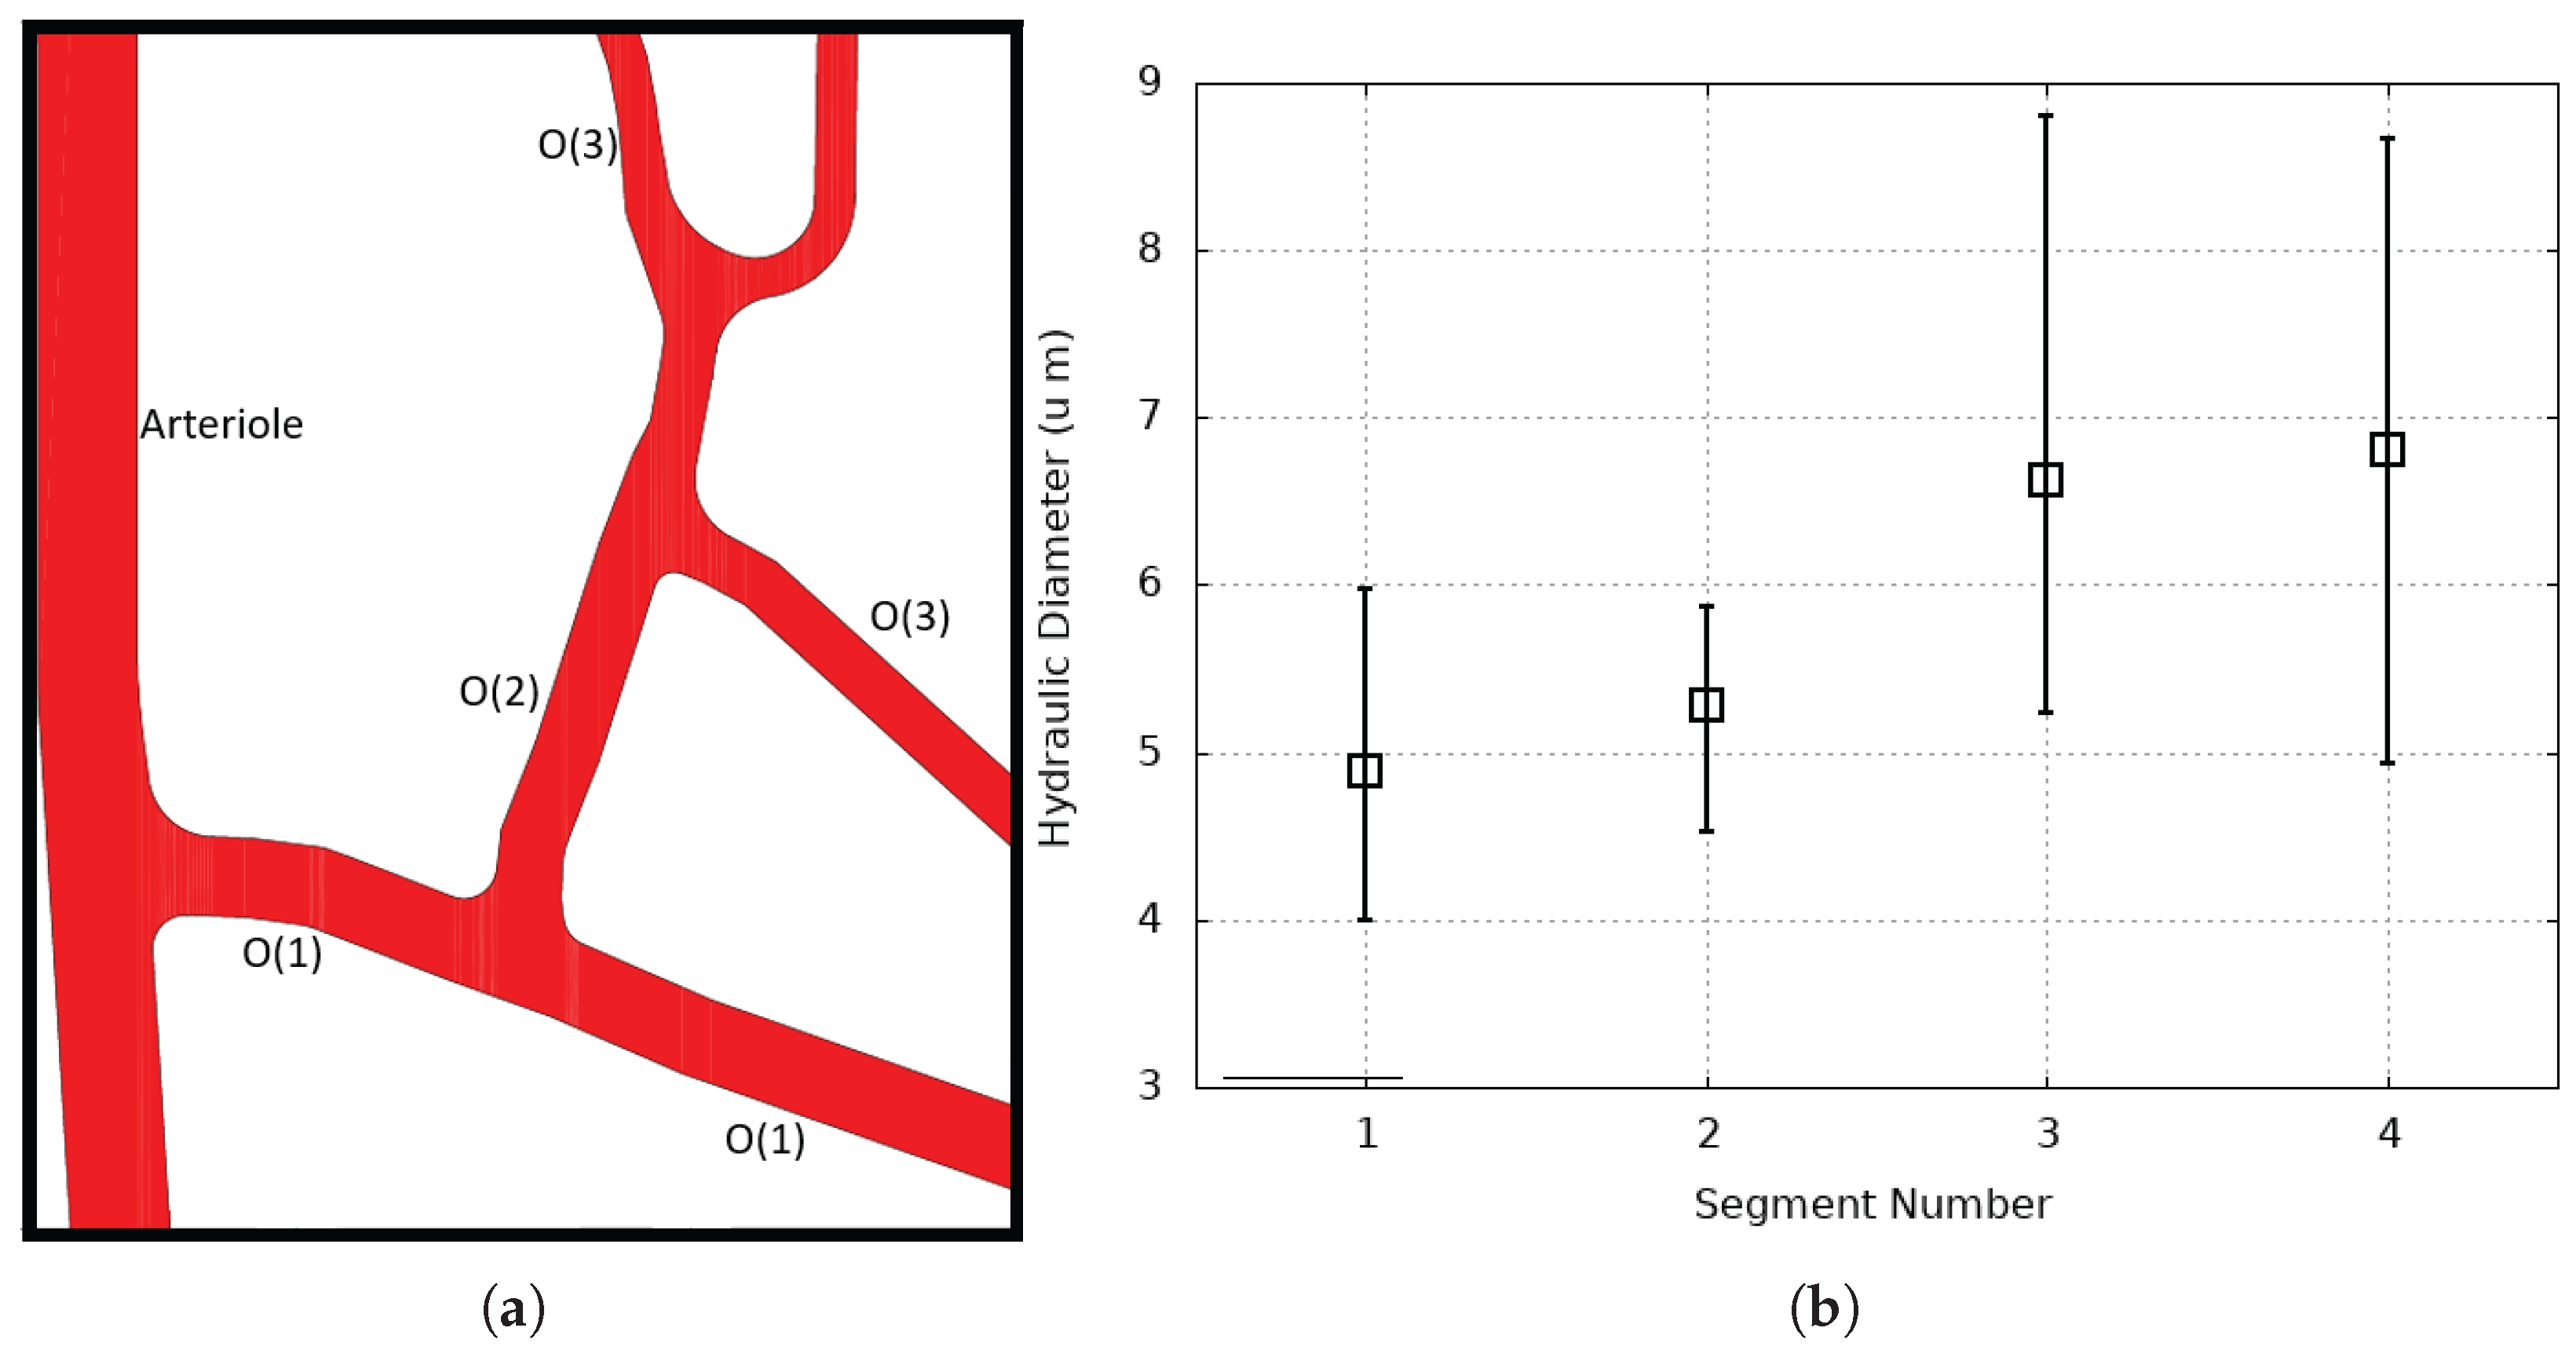
| Capillary | S1 | S2 | S3 | S4 |
|---|---|---|---|---|
| Average hydraulic diameter (μm) | 4.89 | 5.22 | 6.77 | 6.9 |
| Length (μm) | 46.9 | 48 | 55 | 49.6 |
| Average Inlet velocity (mm/s) | 0.75 | 0.86 | 1.44 | 1.5 |
| Flow rate (μm3/s) | 13,992 | 21,365 | 53,266 | 56,156 |
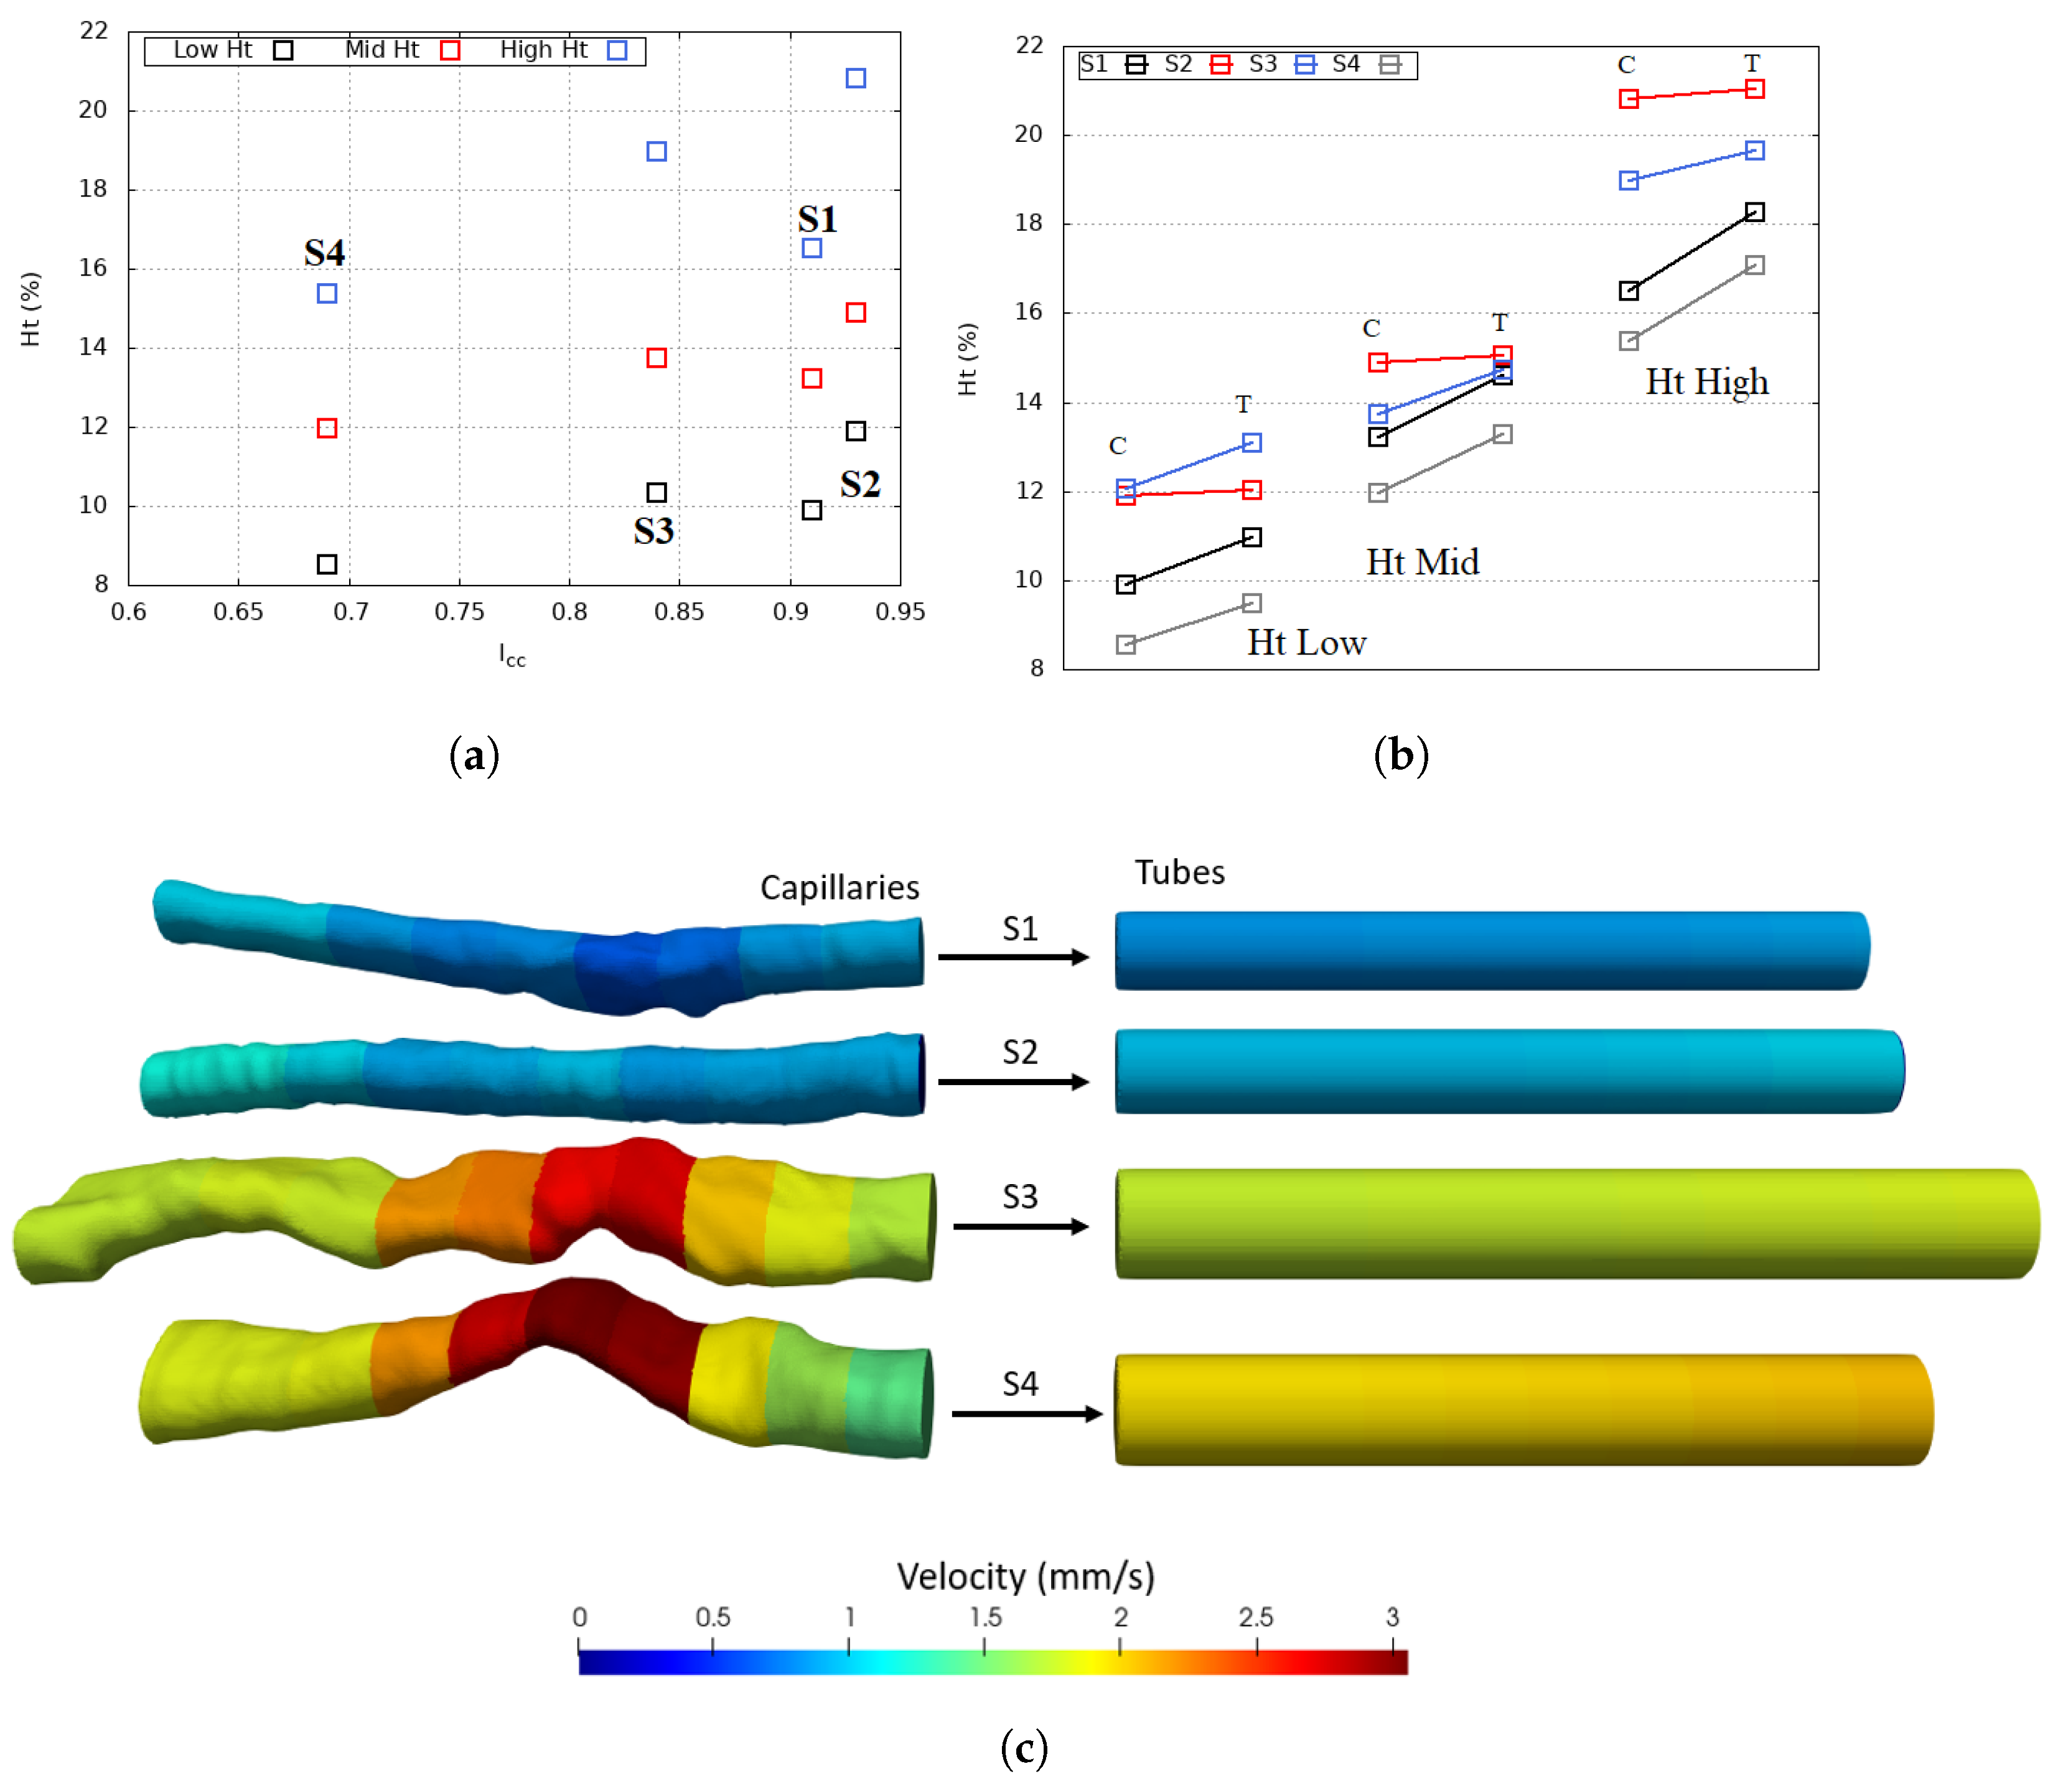
| 0.91 | 0.93 | 0.84 | 0.67 | |
| Capillary Number | 0.07 | 0.08 | 0.13 | 0.14 |
| Capillary | (%) | Ht Low | Ht Mid | Ht High |
|---|---|---|---|---|
| S4 | 69 | 55.5 | 56.88 | 57.27 |
| S3 | 84 | 33.23 | 33.38 | 36.72 |
| S2 | 93 | 24.99 | 25.15 | 26.33 |
| S1 | 91 | 18.22 | 18.41 | 18.87 |
Disclaimer/Publisher’s Note: The statements, opinions and data contained in all publications are solely those of the individual author(s) and contributor(s) and not of MDPI and/or the editor(s). MDPI and/or the editor(s) disclaim responsibility for any injury to people or property resulting from any ideas, methods, instructions or products referred to in the content. |
© 2025 by the authors. Licensee MDPI, Basel, Switzerland. This article is an open access article distributed under the terms and conditions of the Creative Commons Attribution (CC BY) license (https://creativecommons.org/licenses/by/4.0/).
Share and Cite
Çolak, E.; Ekici, Ö.; Erdener, Ş.E. In Silico Investigation of the RBC Velocity Fluctuations in Ex Vivo Capillaries. Appl. Sci. 2025, 15, 7796. https://doi.org/10.3390/app15147796
Çolak E, Ekici Ö, Erdener ŞE. In Silico Investigation of the RBC Velocity Fluctuations in Ex Vivo Capillaries. Applied Sciences. 2025; 15(14):7796. https://doi.org/10.3390/app15147796
Chicago/Turabian StyleÇolak, Eren, Özgür Ekici, and Şefik Evren Erdener. 2025. "In Silico Investigation of the RBC Velocity Fluctuations in Ex Vivo Capillaries" Applied Sciences 15, no. 14: 7796. https://doi.org/10.3390/app15147796
APA StyleÇolak, E., Ekici, Ö., & Erdener, Ş. E. (2025). In Silico Investigation of the RBC Velocity Fluctuations in Ex Vivo Capillaries. Applied Sciences, 15(14), 7796. https://doi.org/10.3390/app15147796