
Ultimate Capacity of a GFRP-Reinforced Concrete Bridge Barrier–Deck Anchorage Subjected to Transverse Loading


Abstract
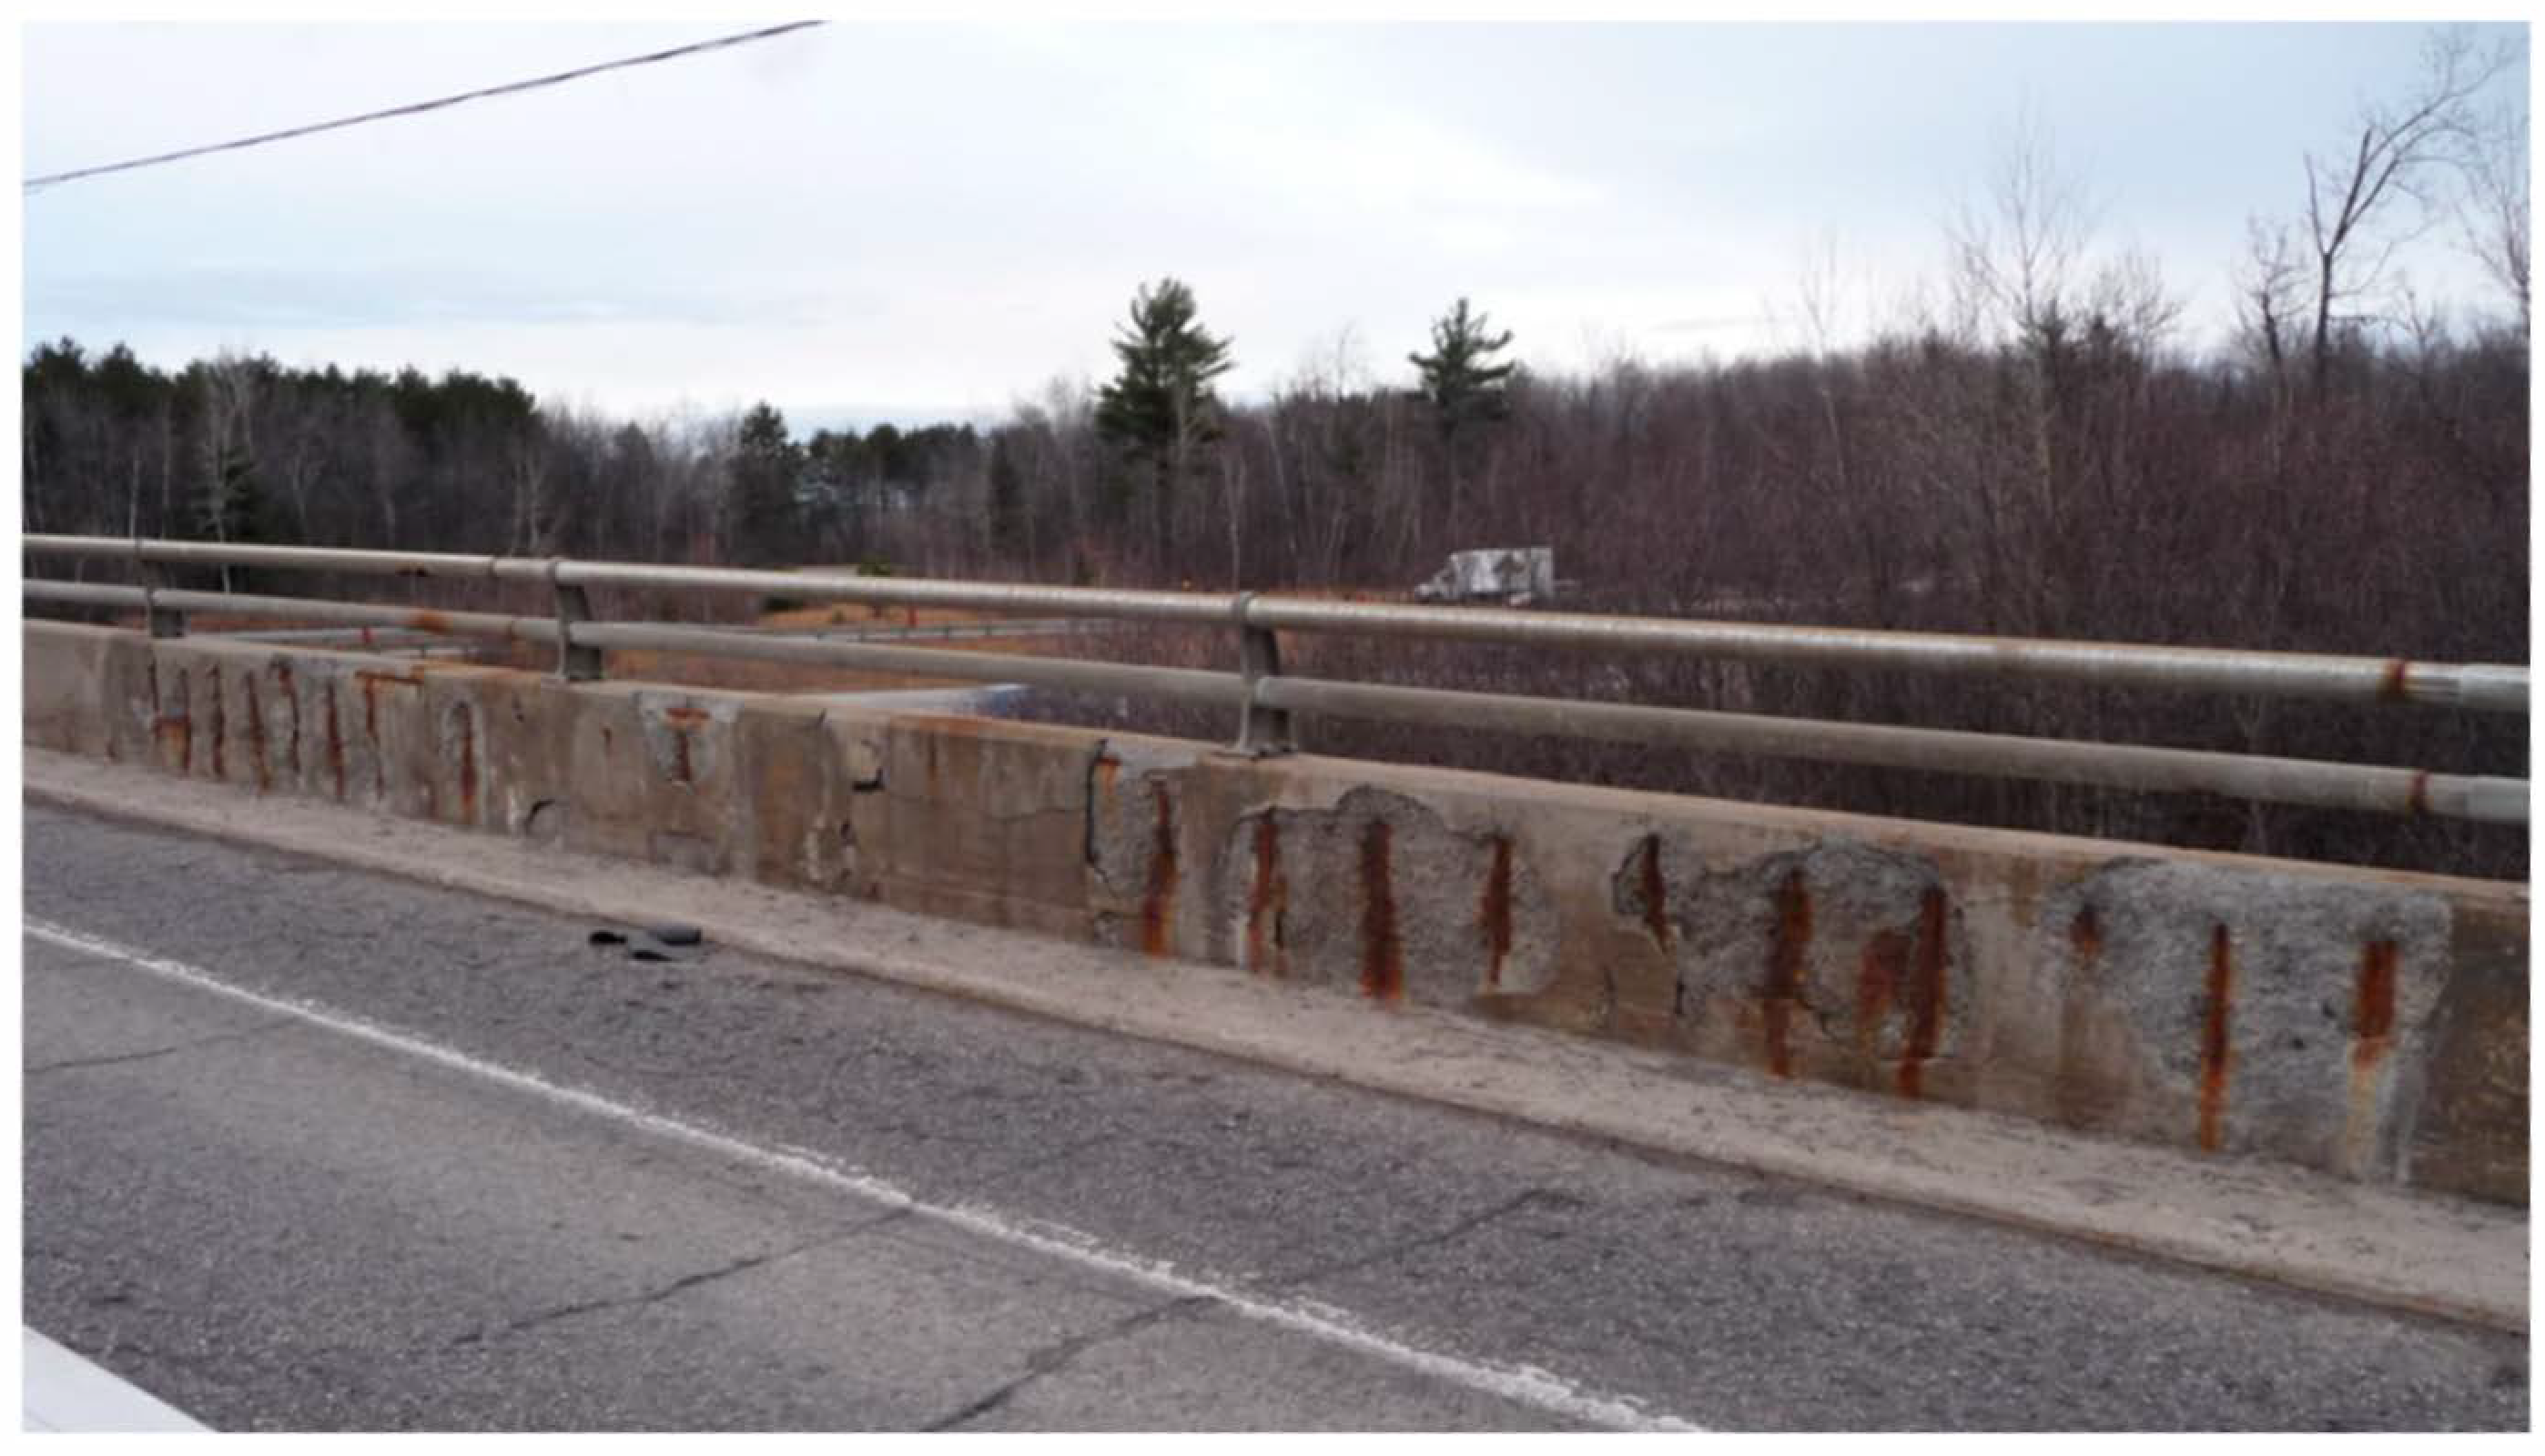
1. Introduction
2. Experimental Program
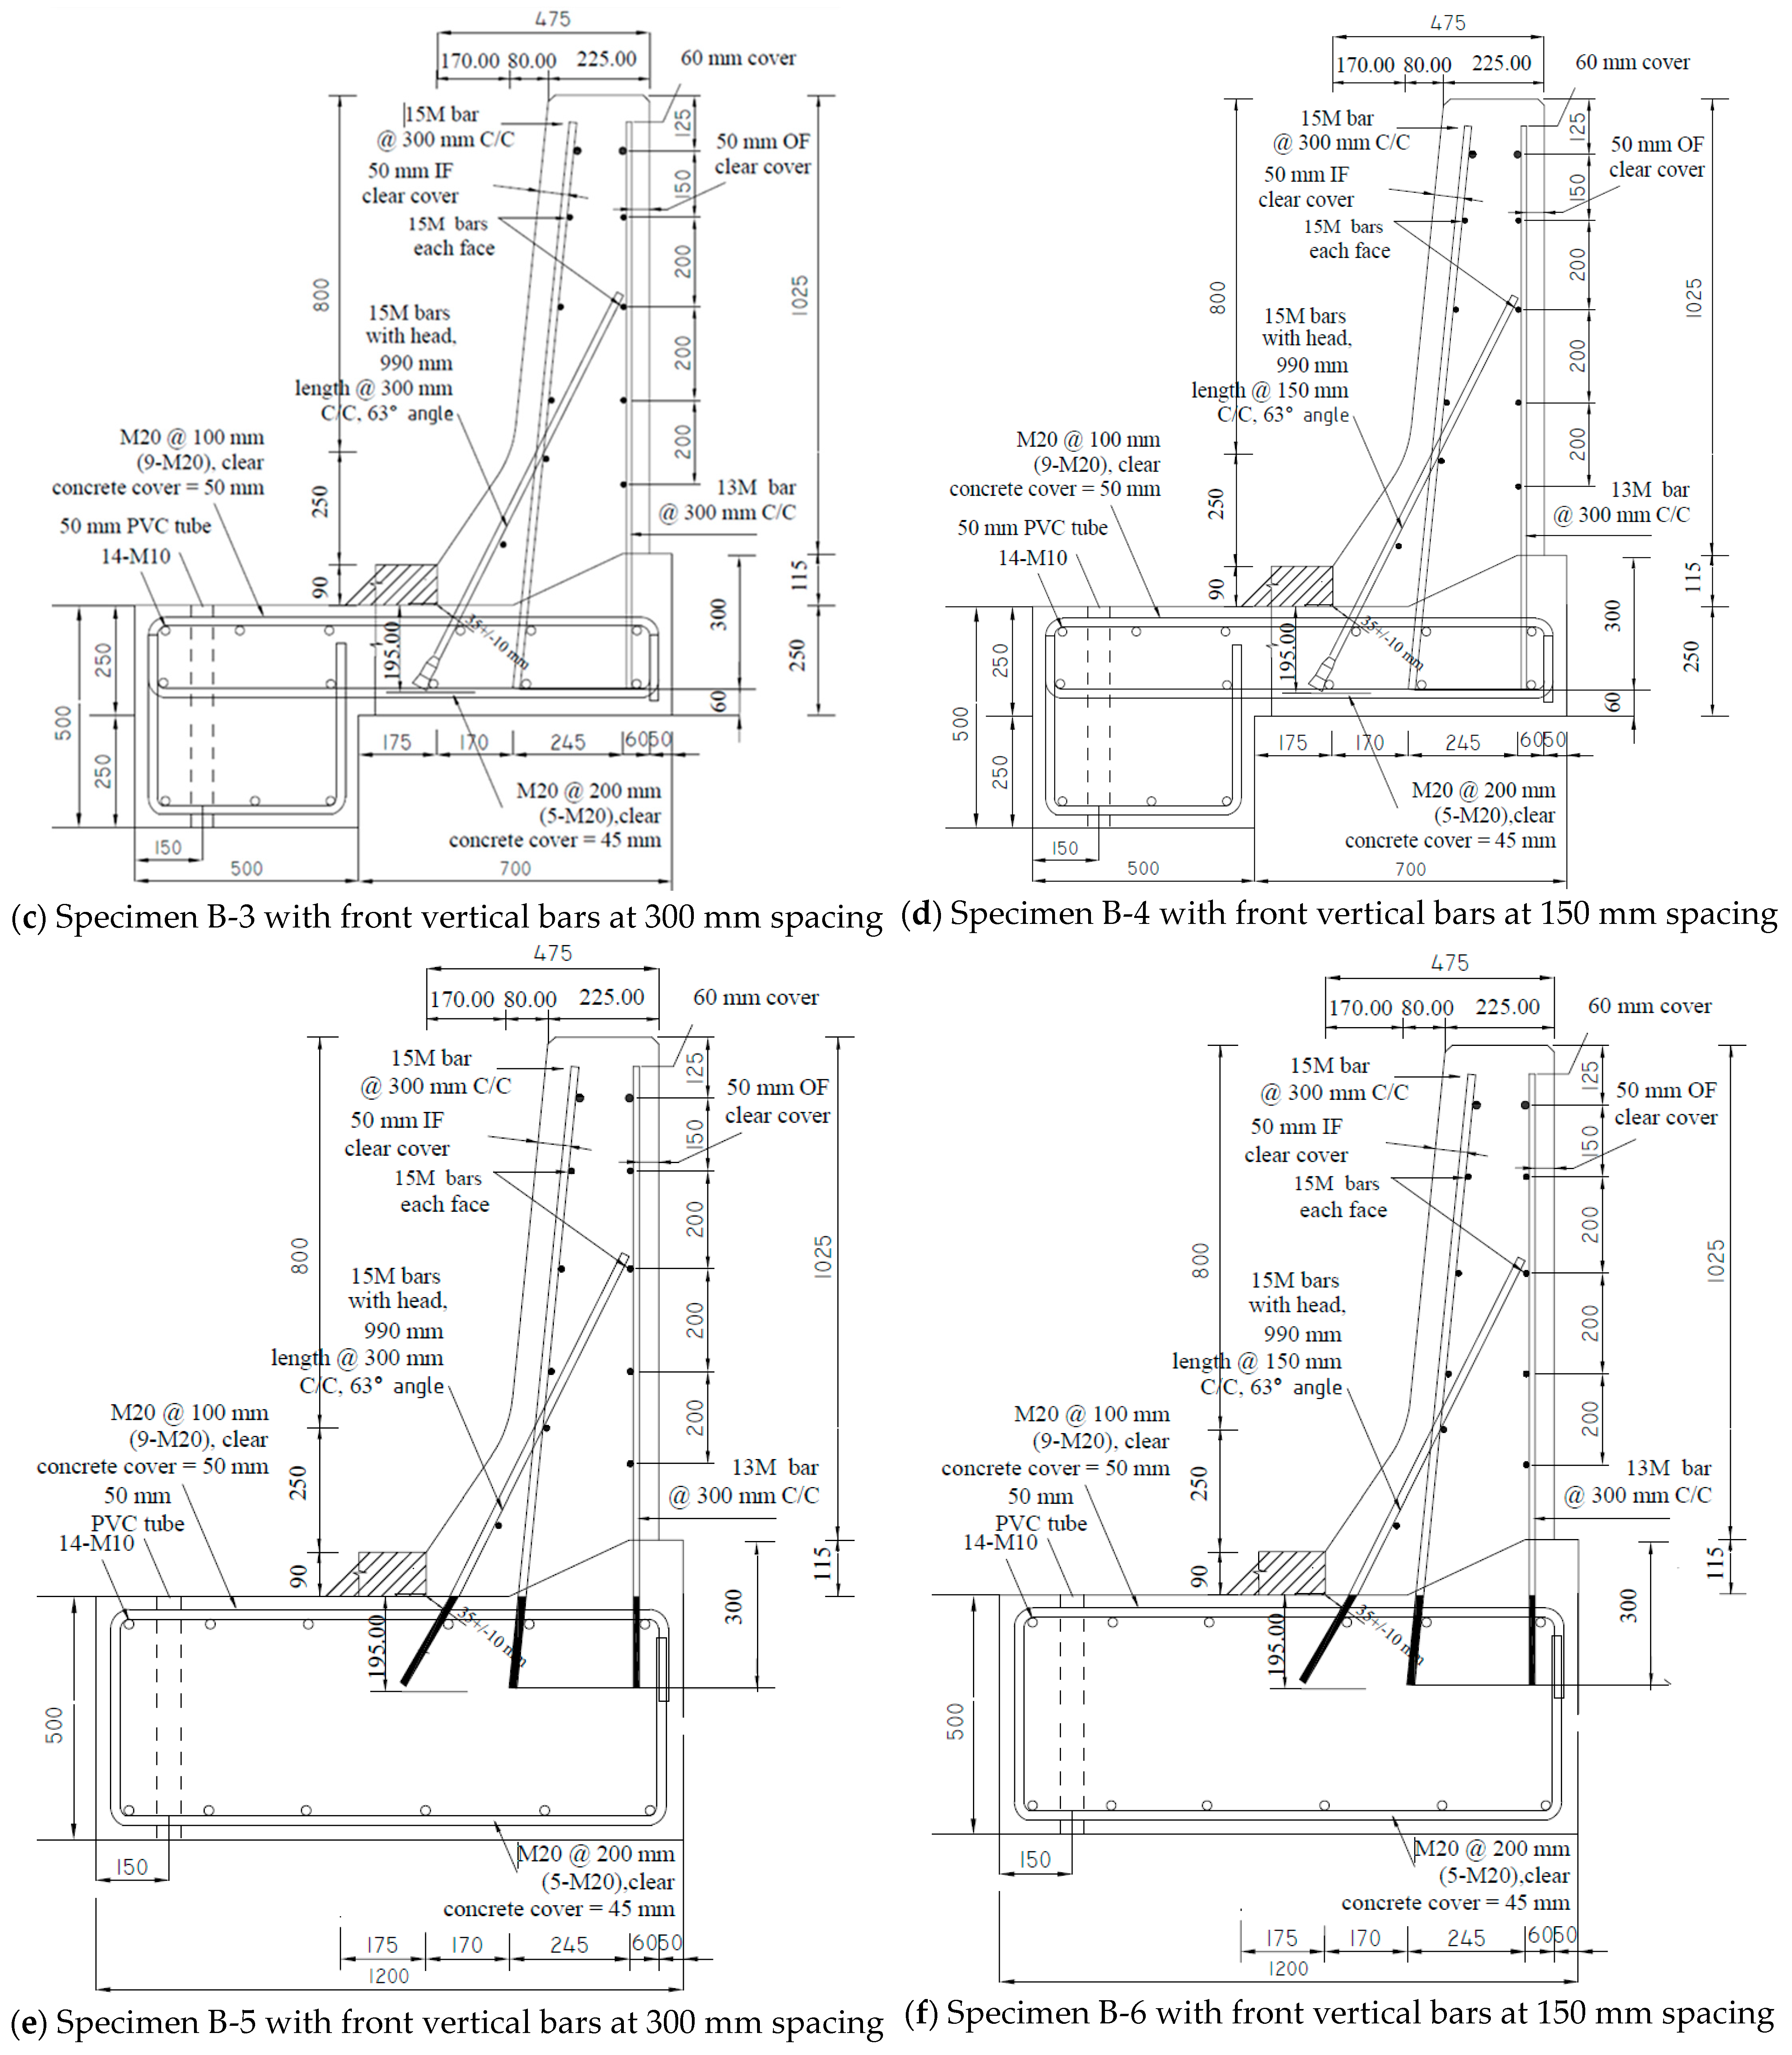
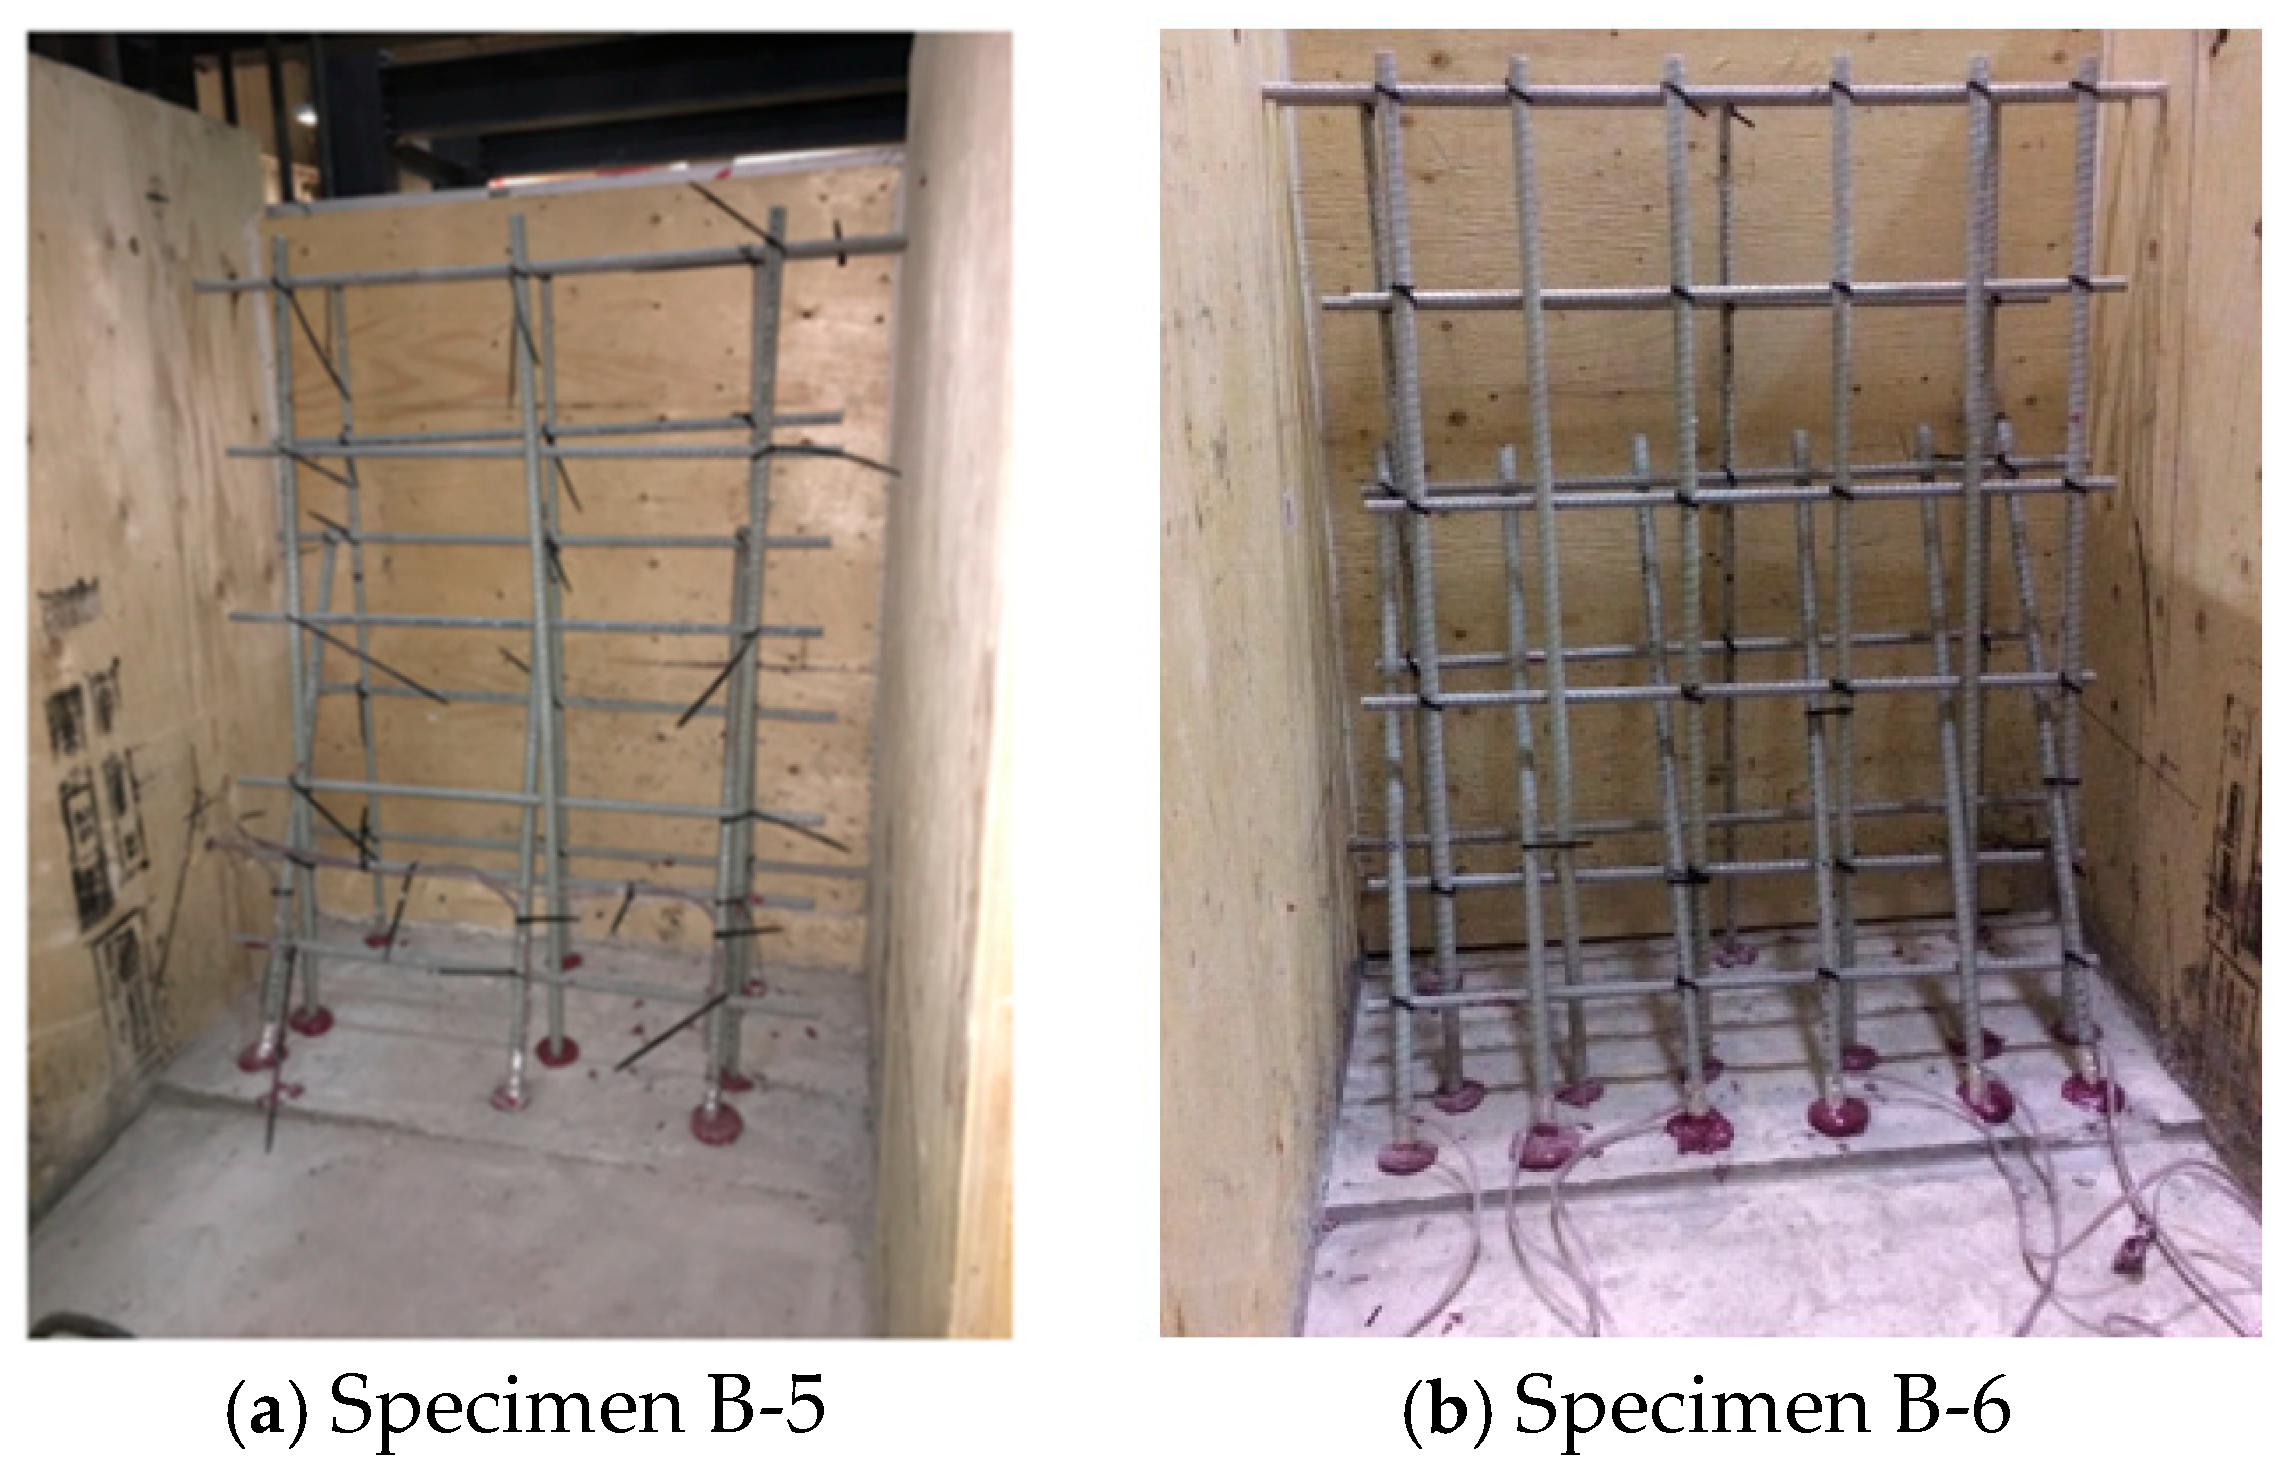
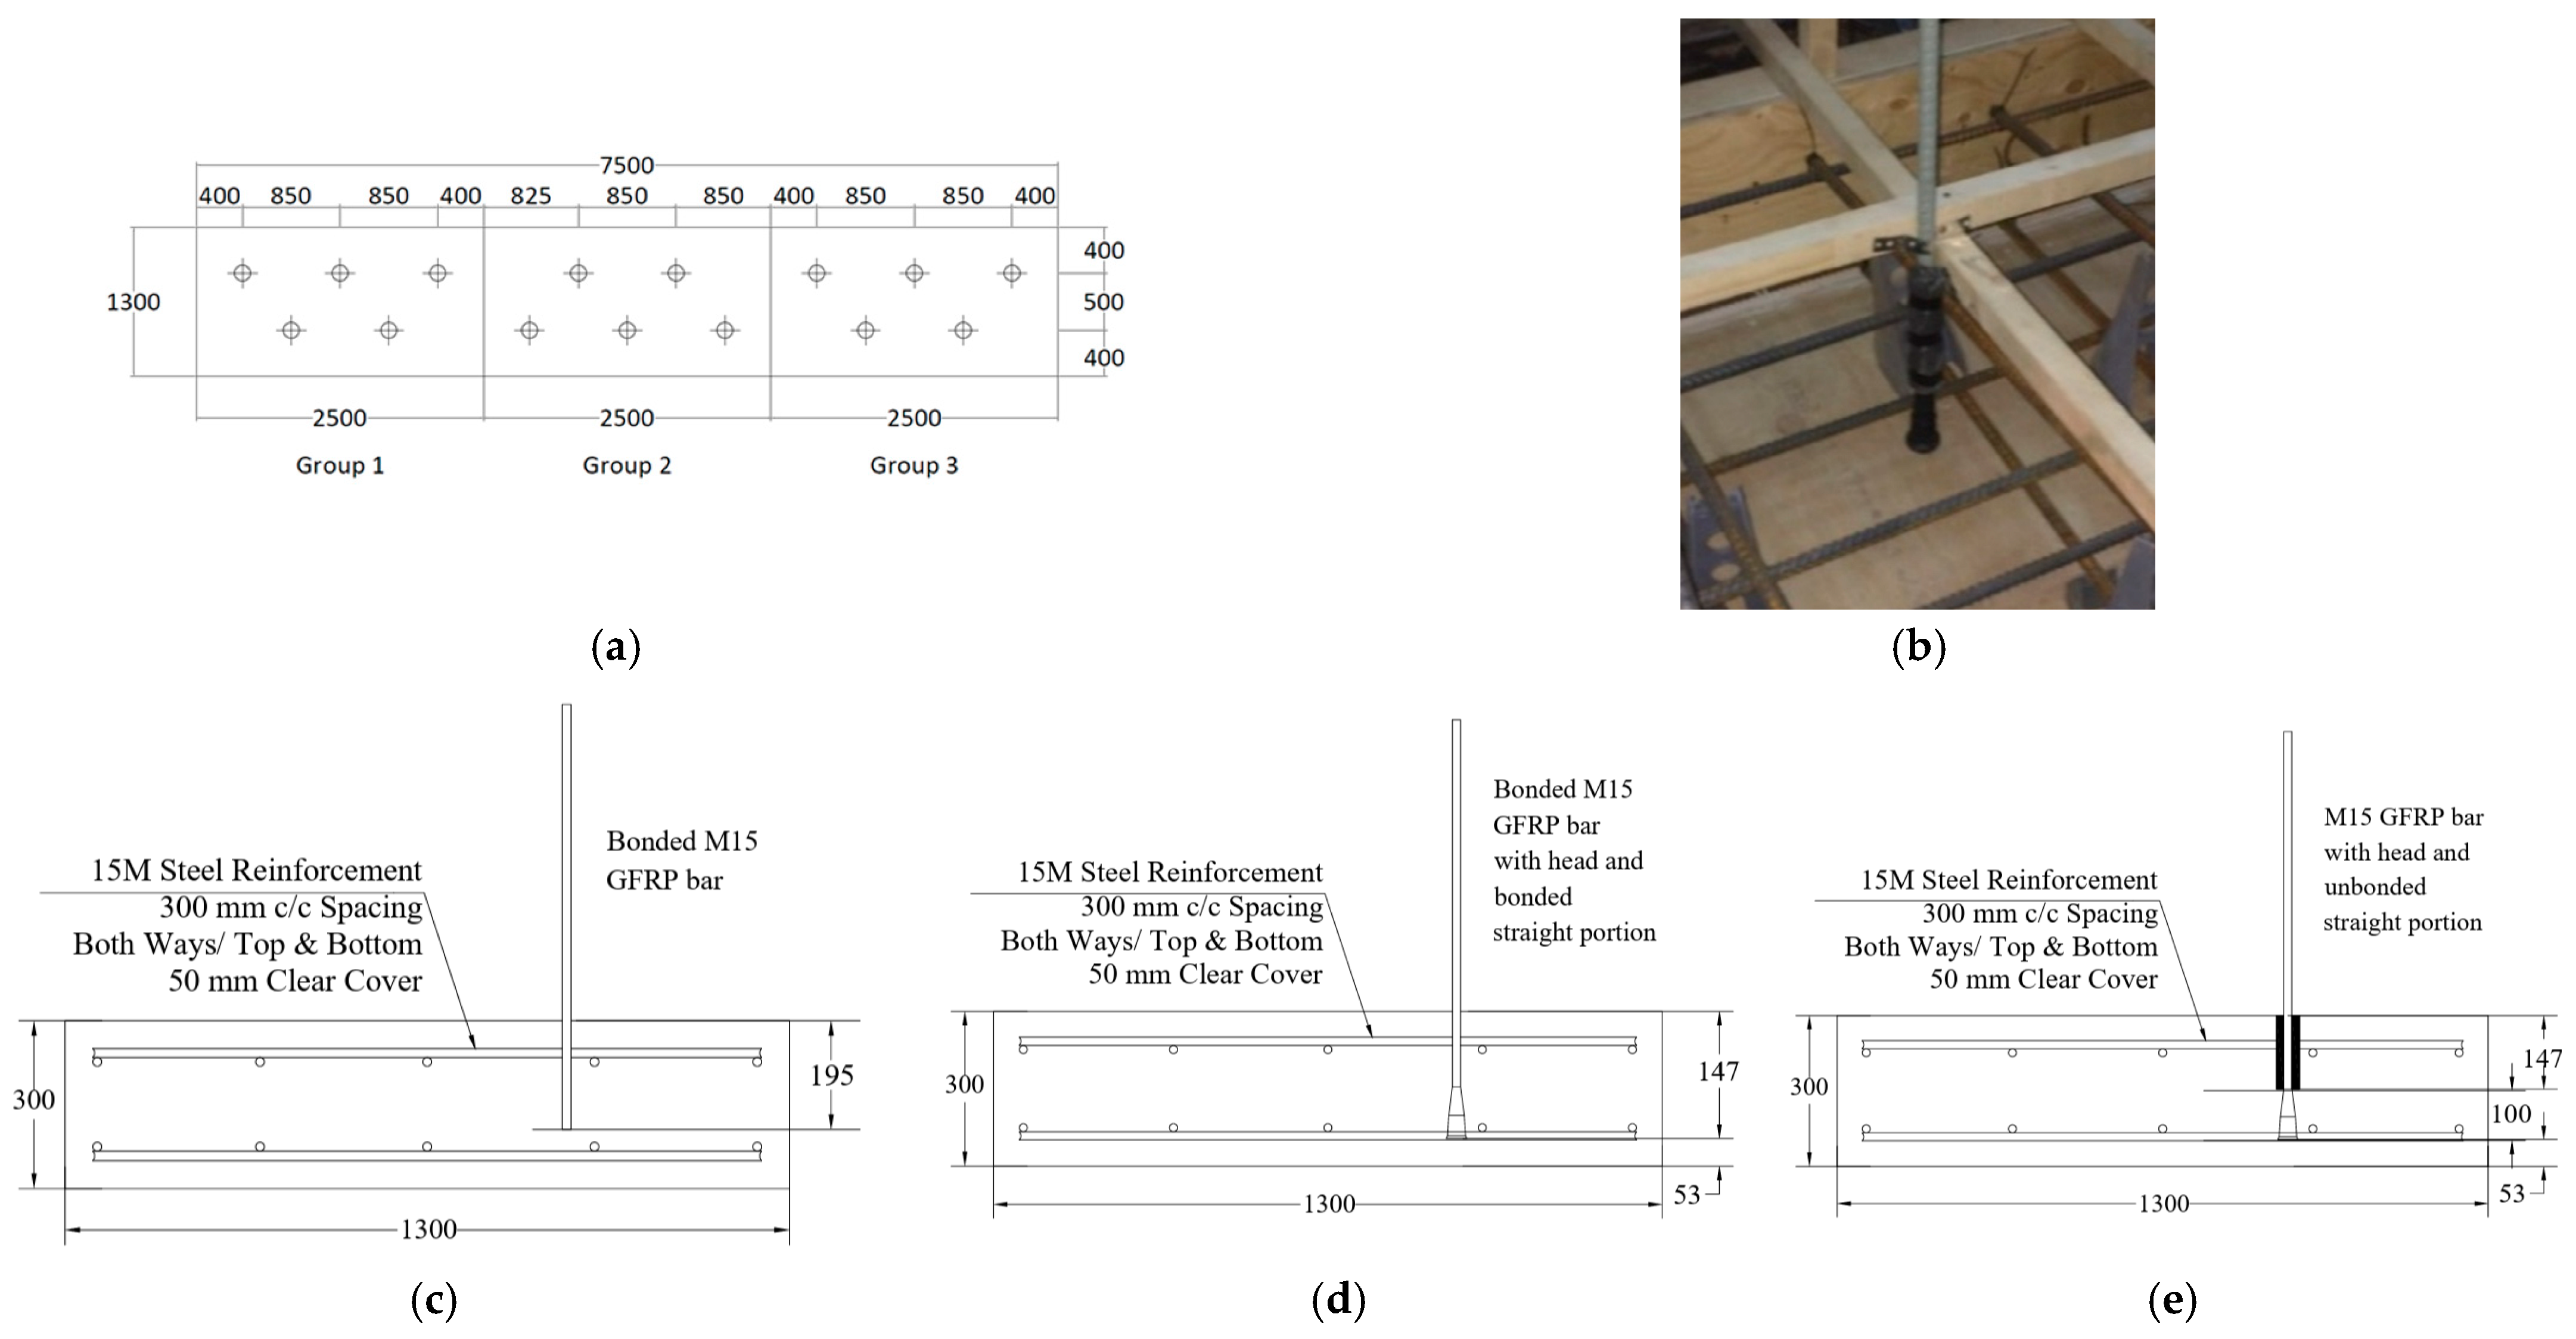
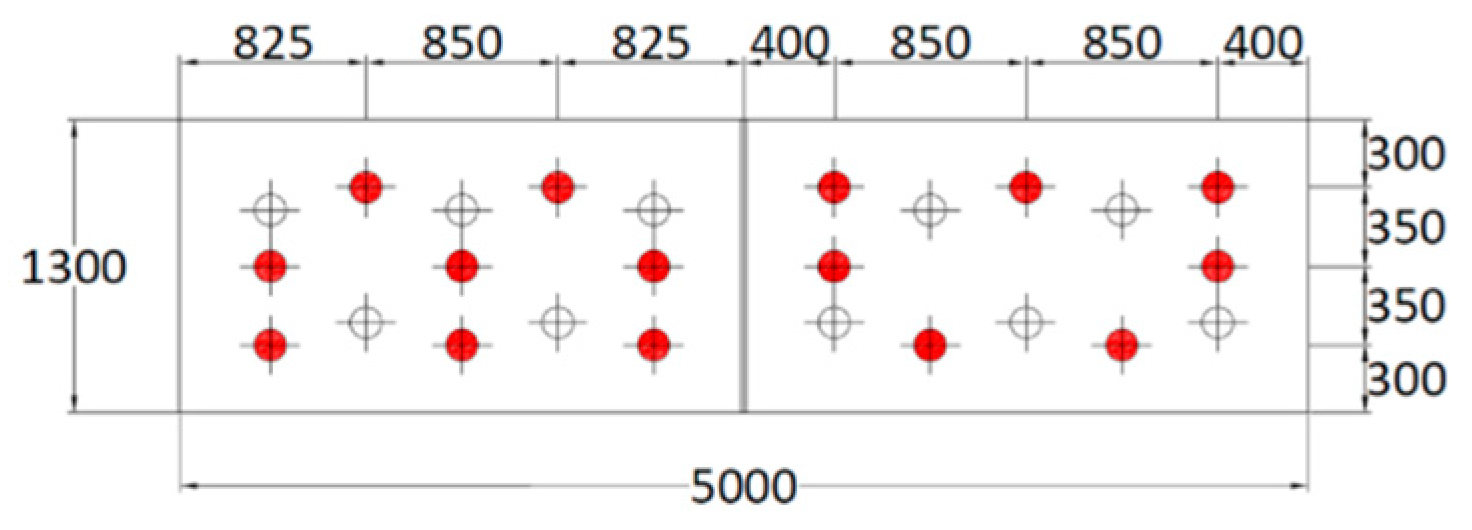
2.1. Test Specimens
2.2. Material Properties
2.2.1. Concrete
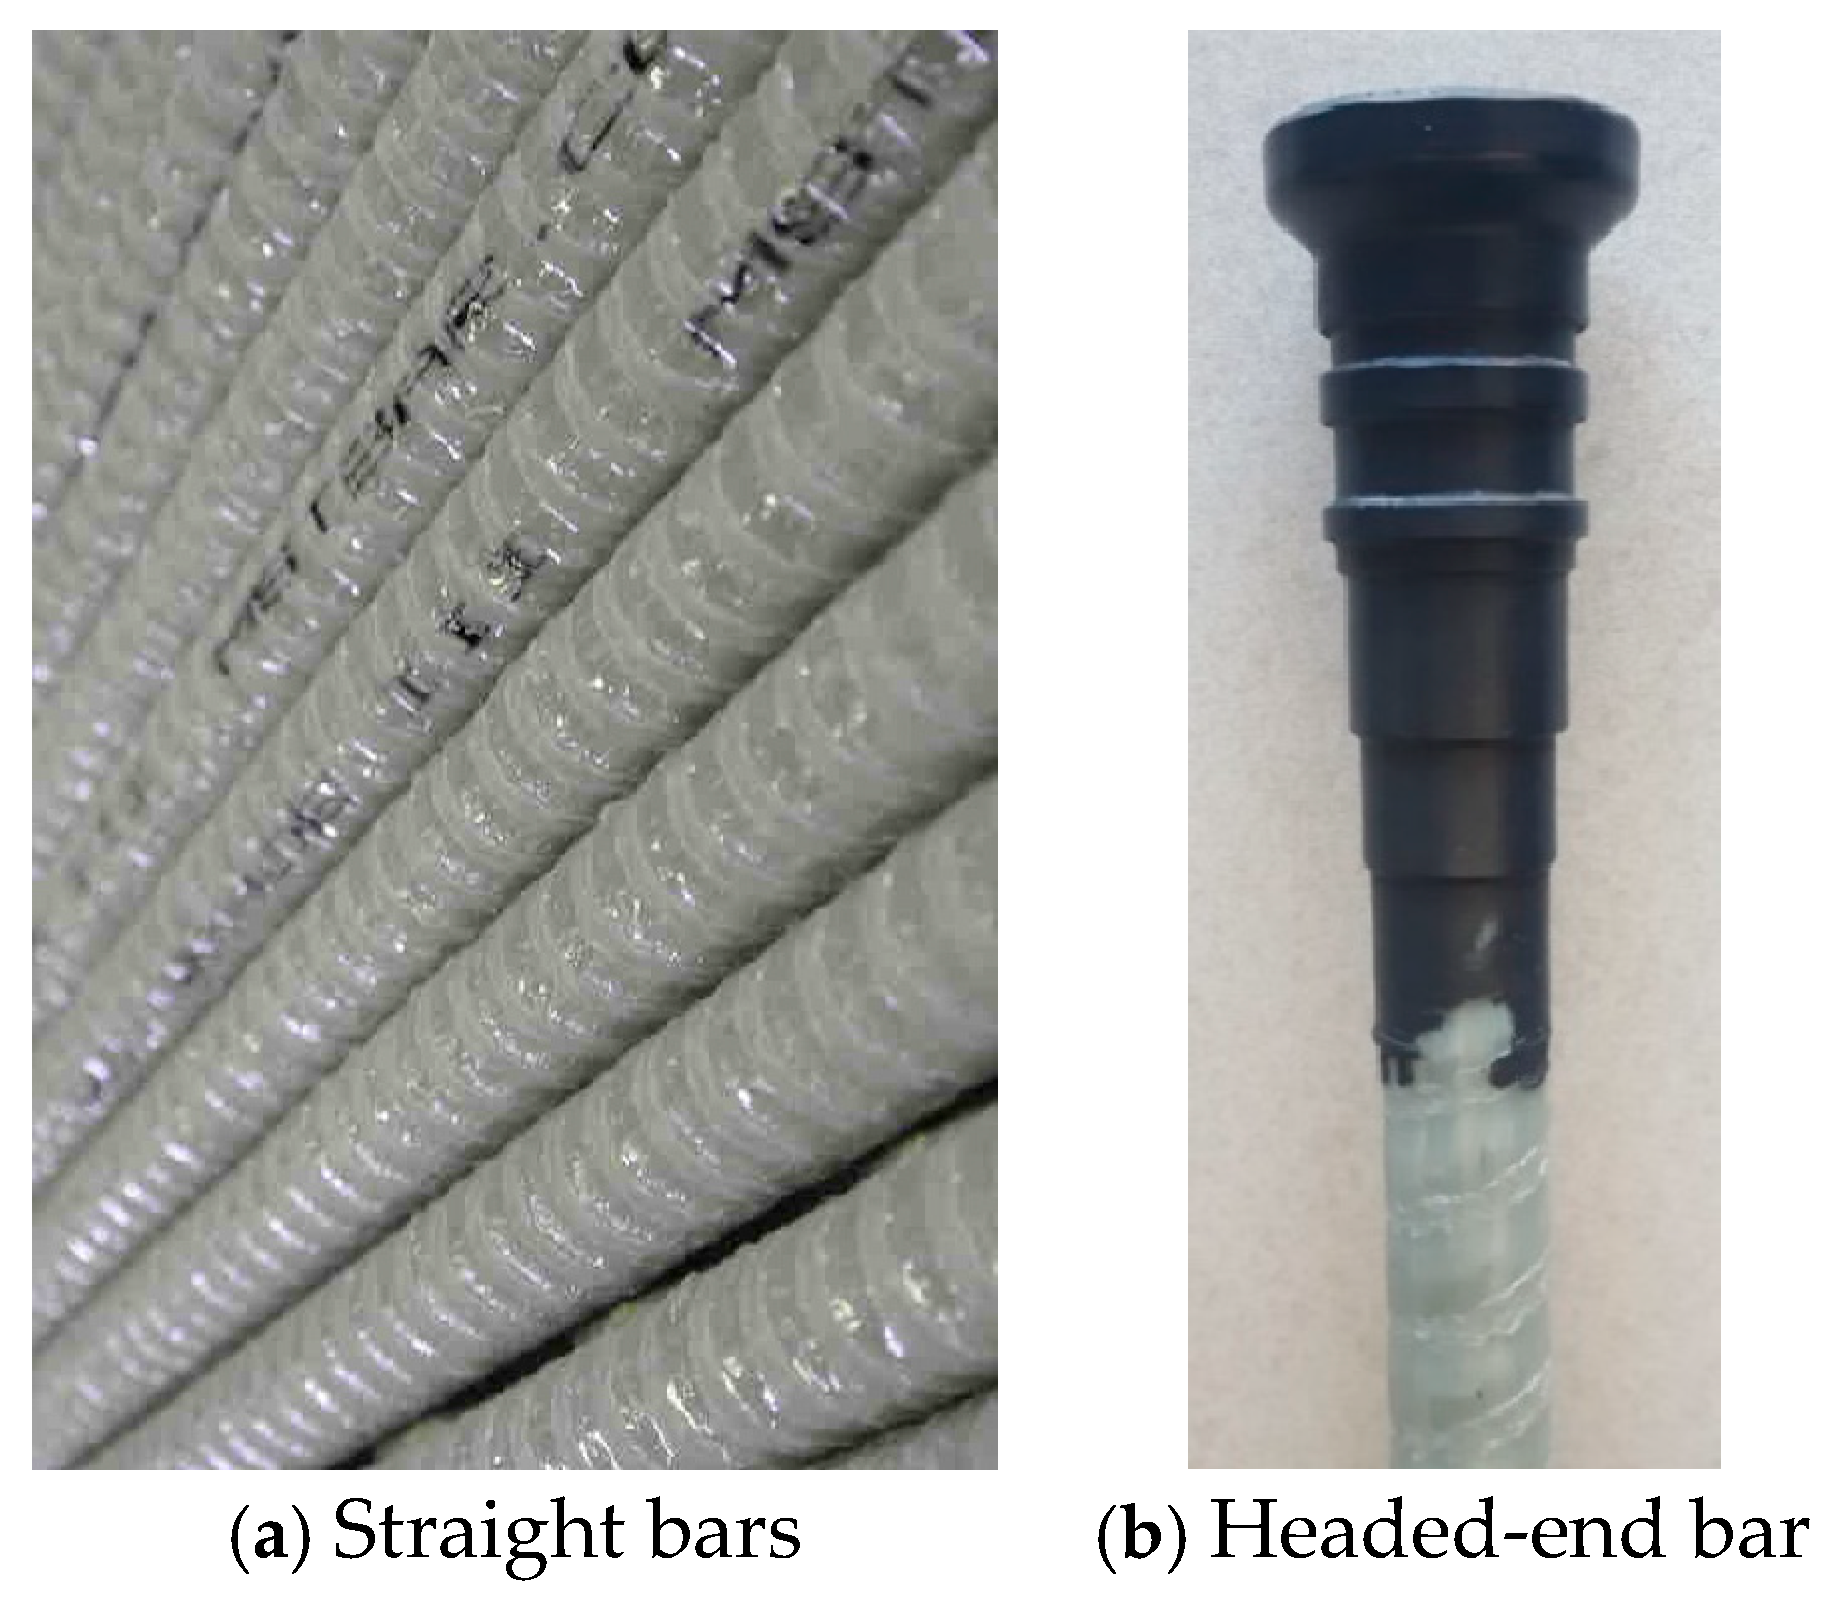
2.2.2. GFRP Bars
2.2.3. Epoxy Adhesive
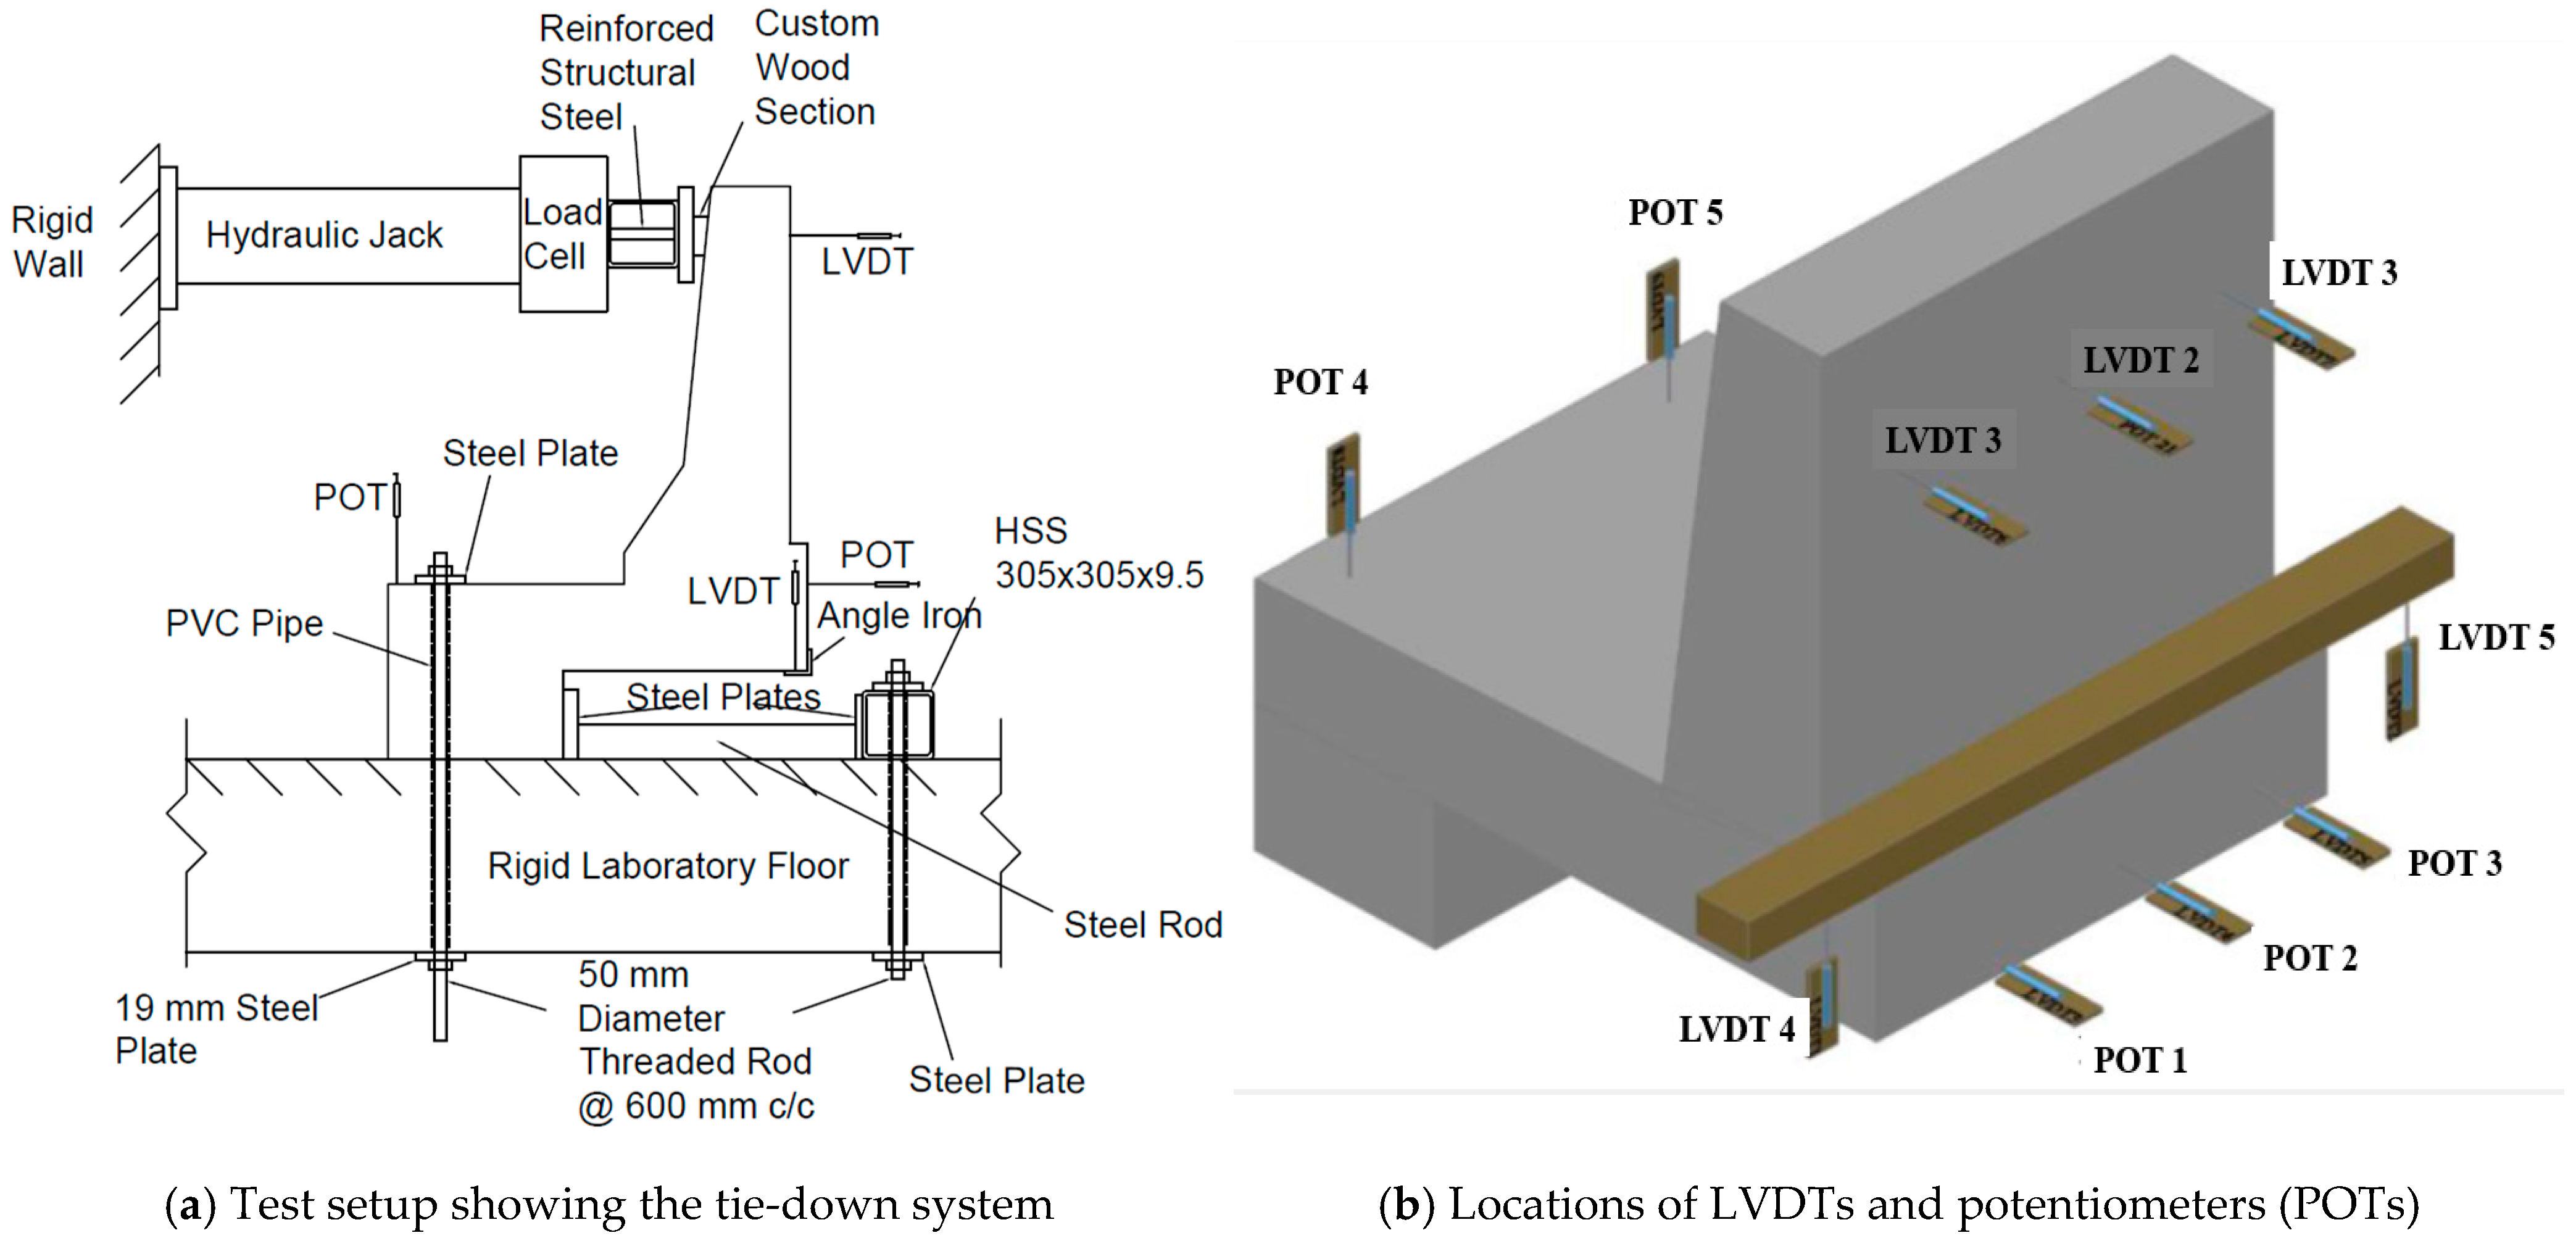
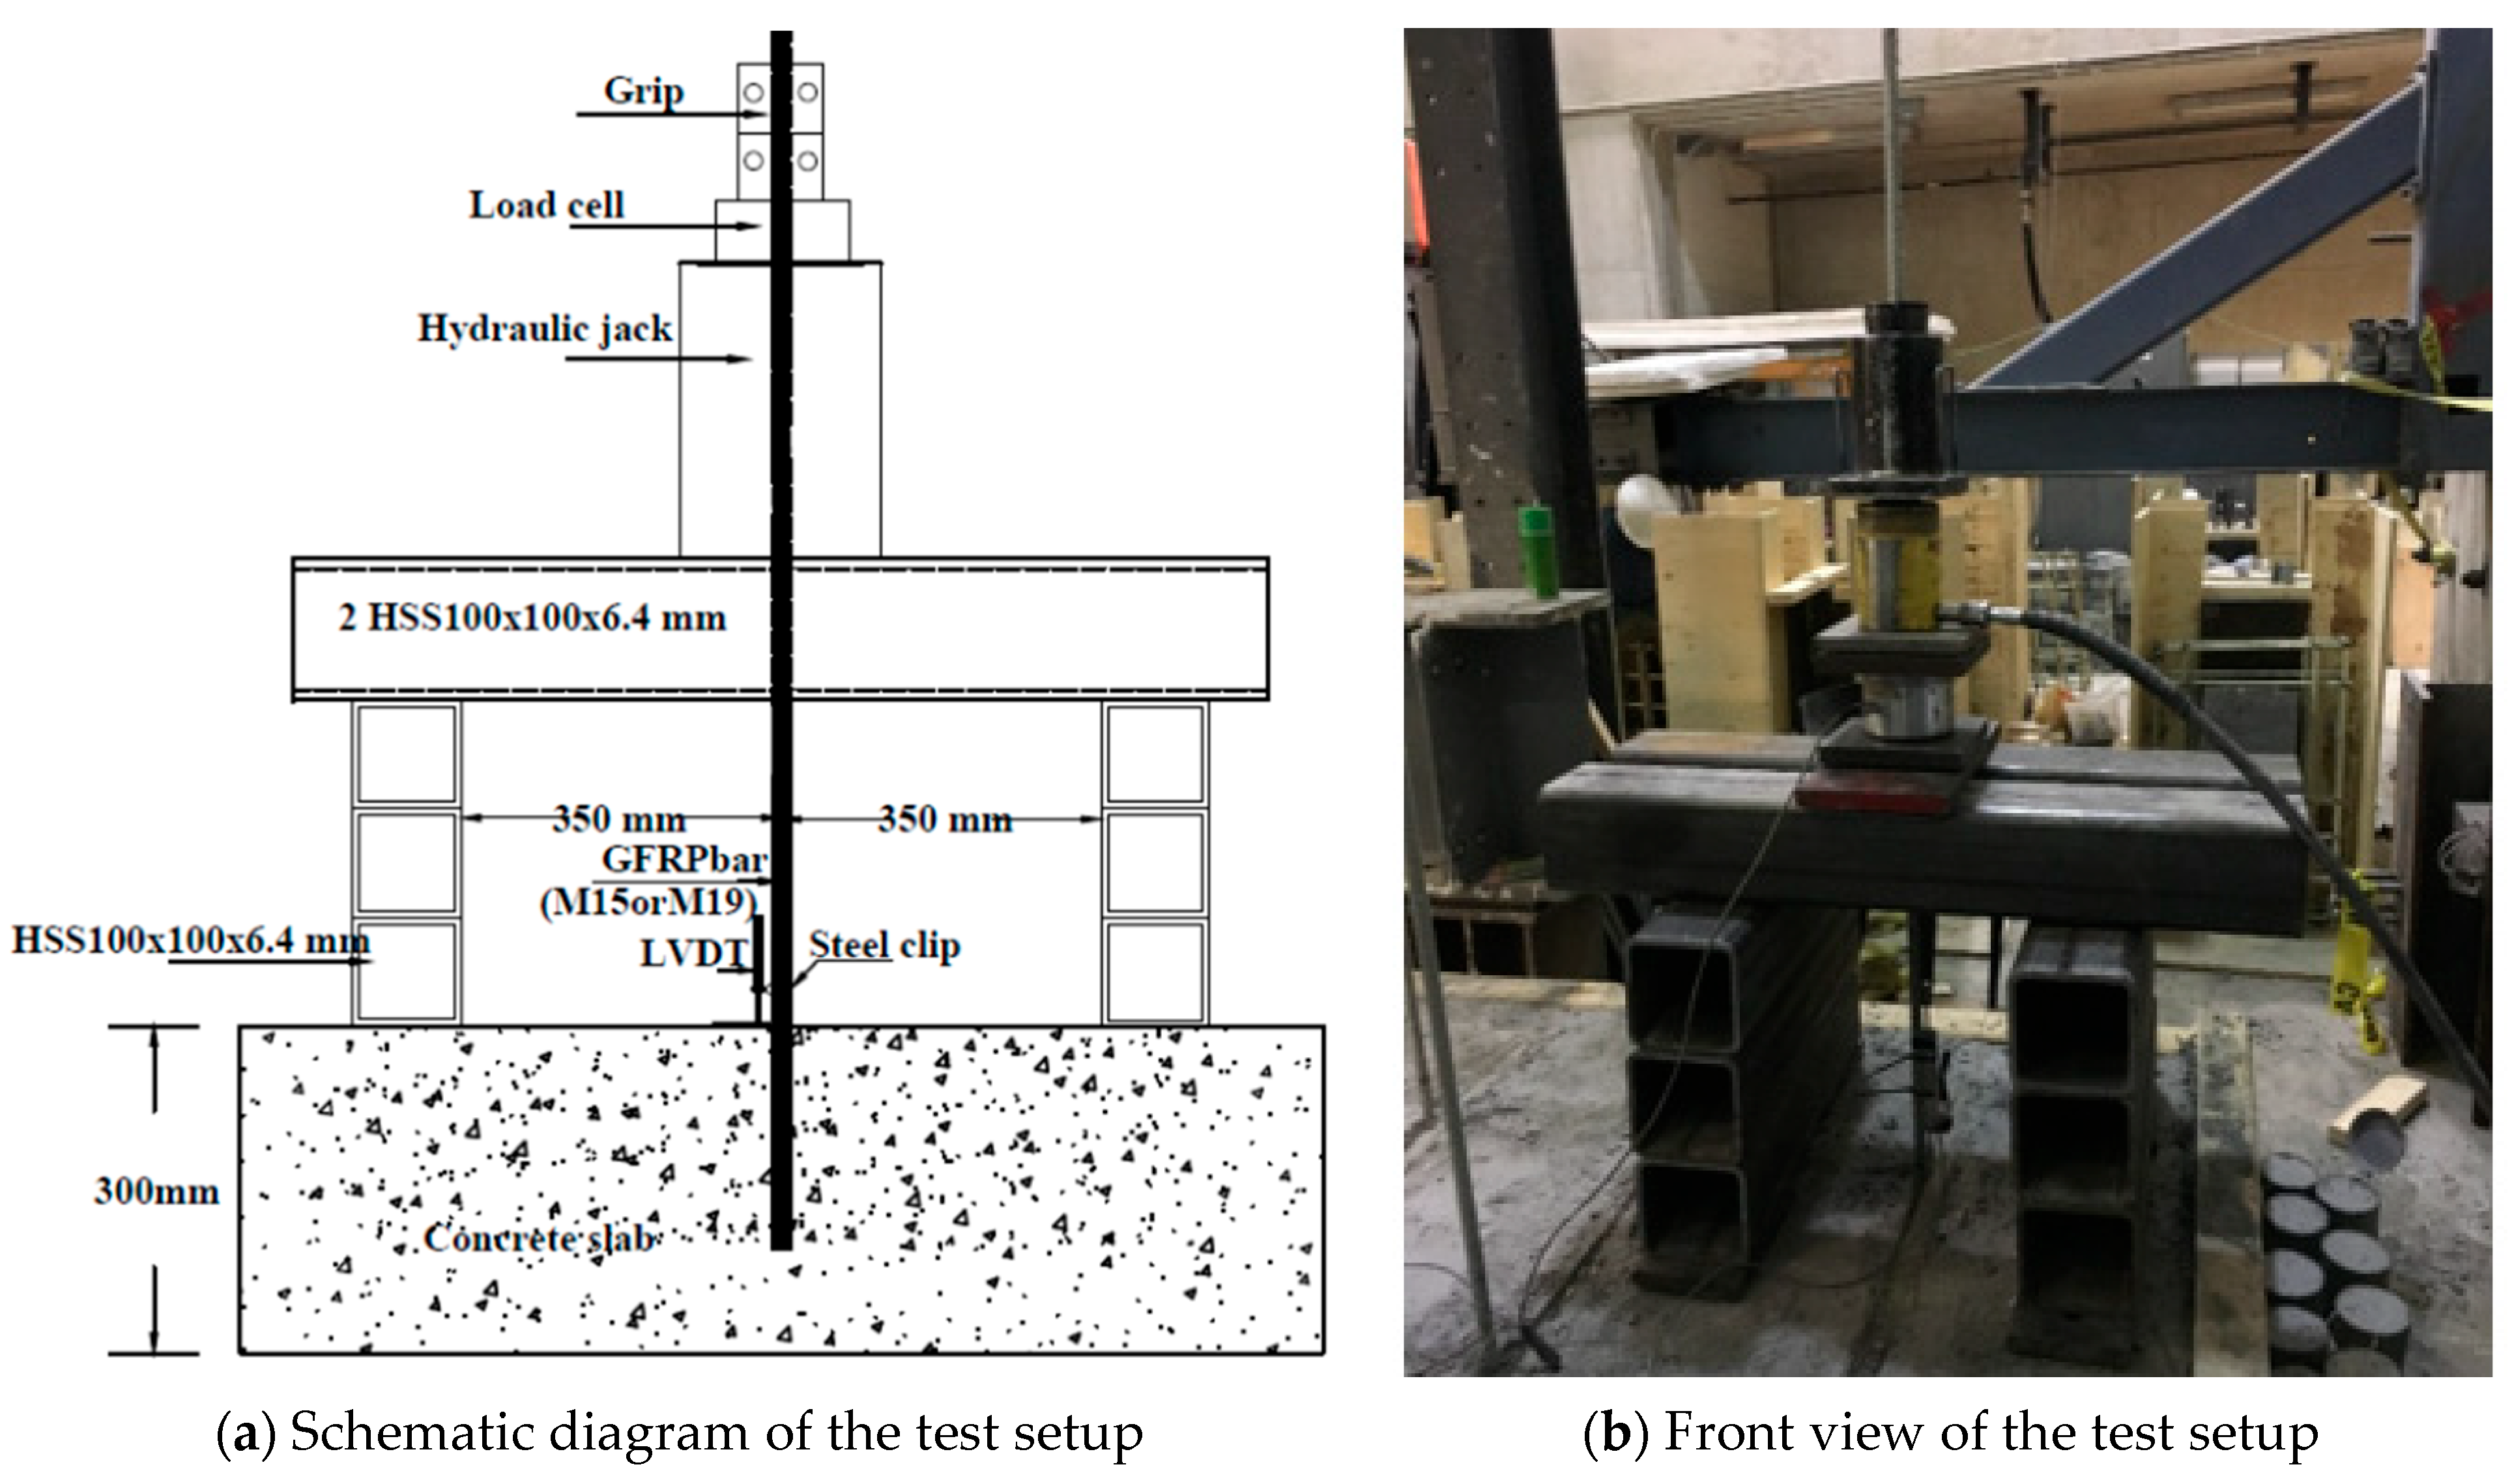
2.3. Test Setup and Instrumentation
3. Test Results and Discussion
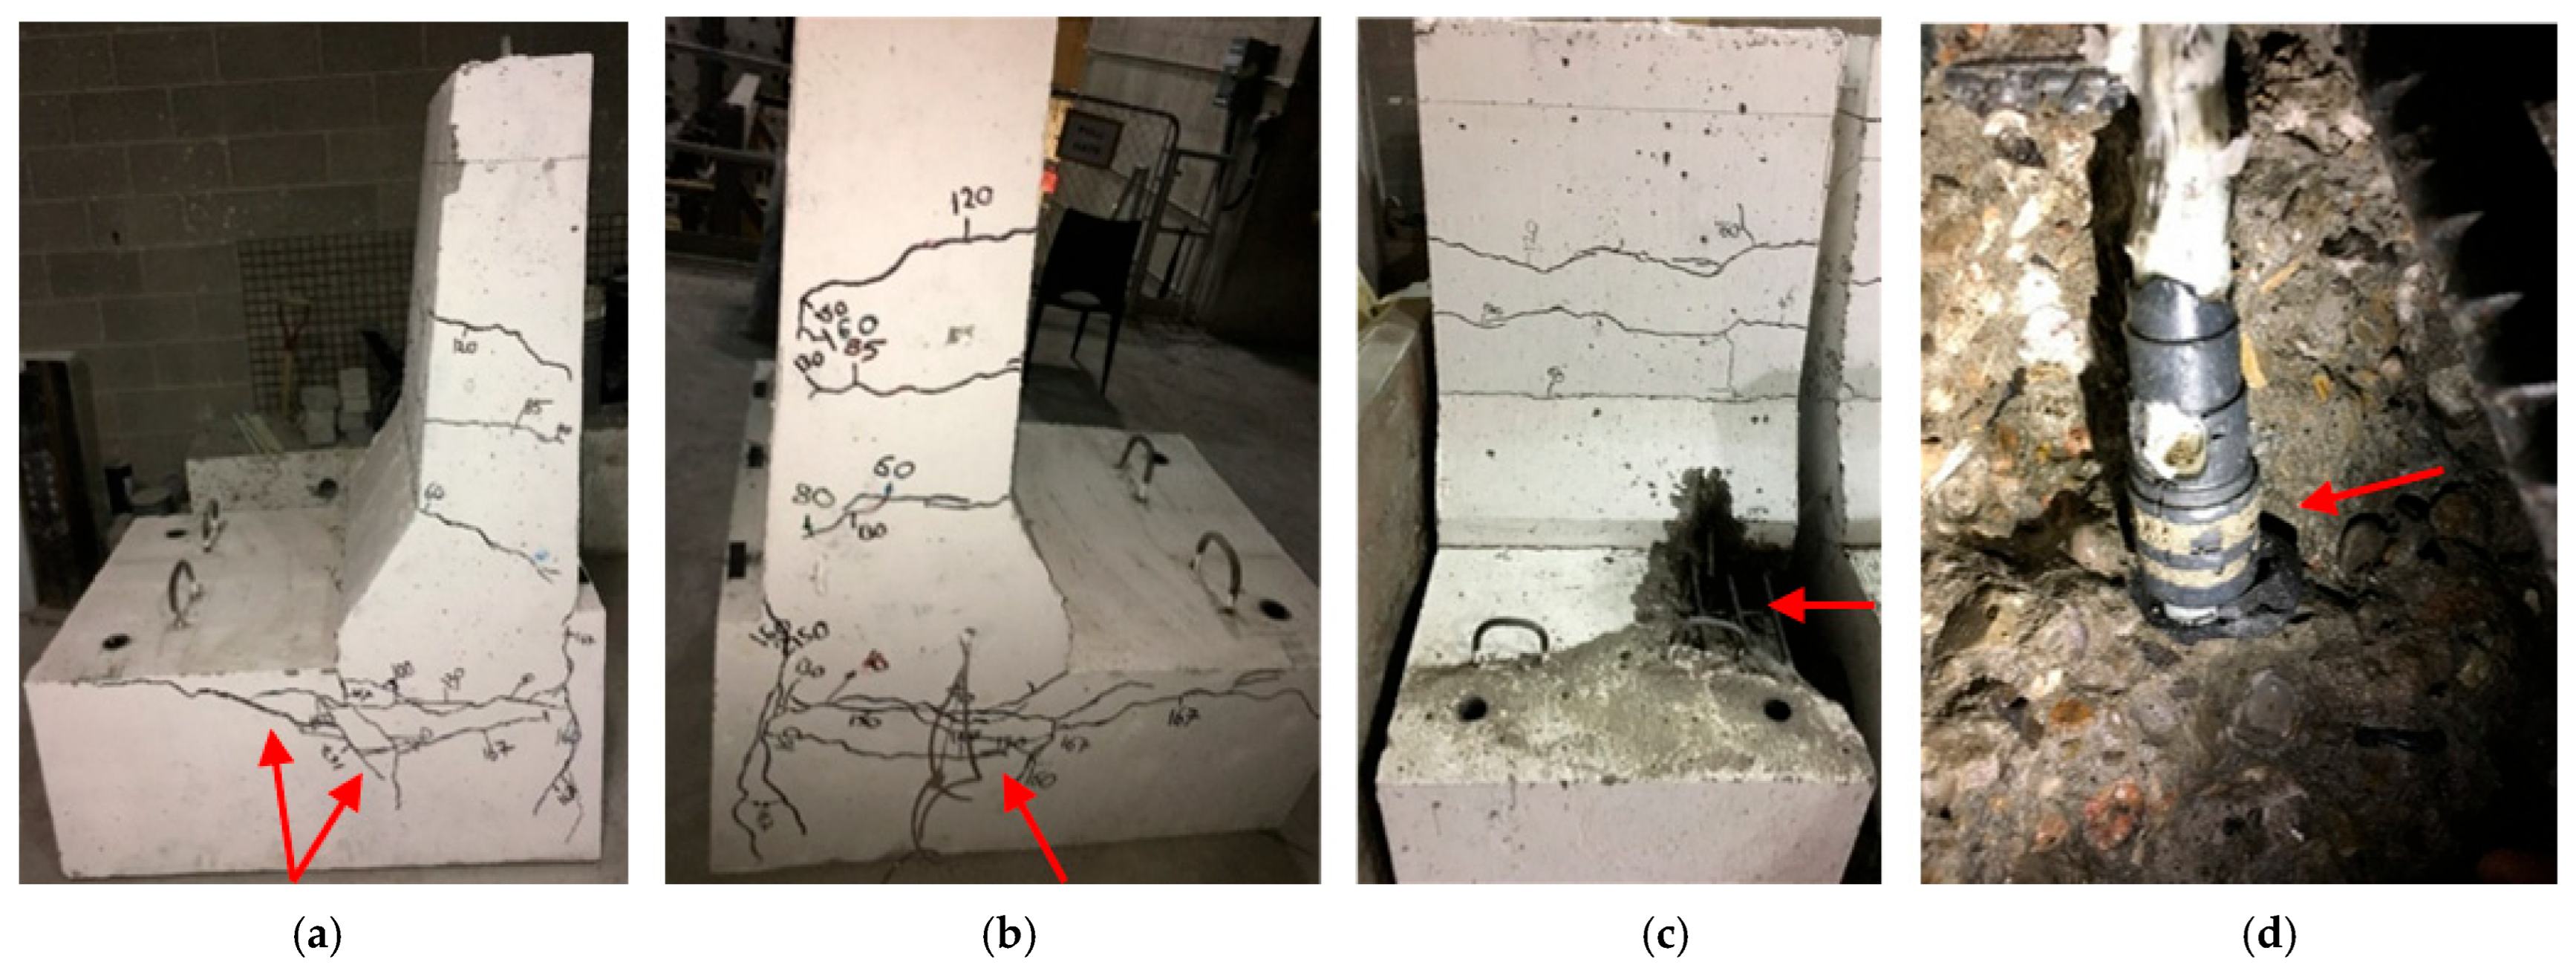
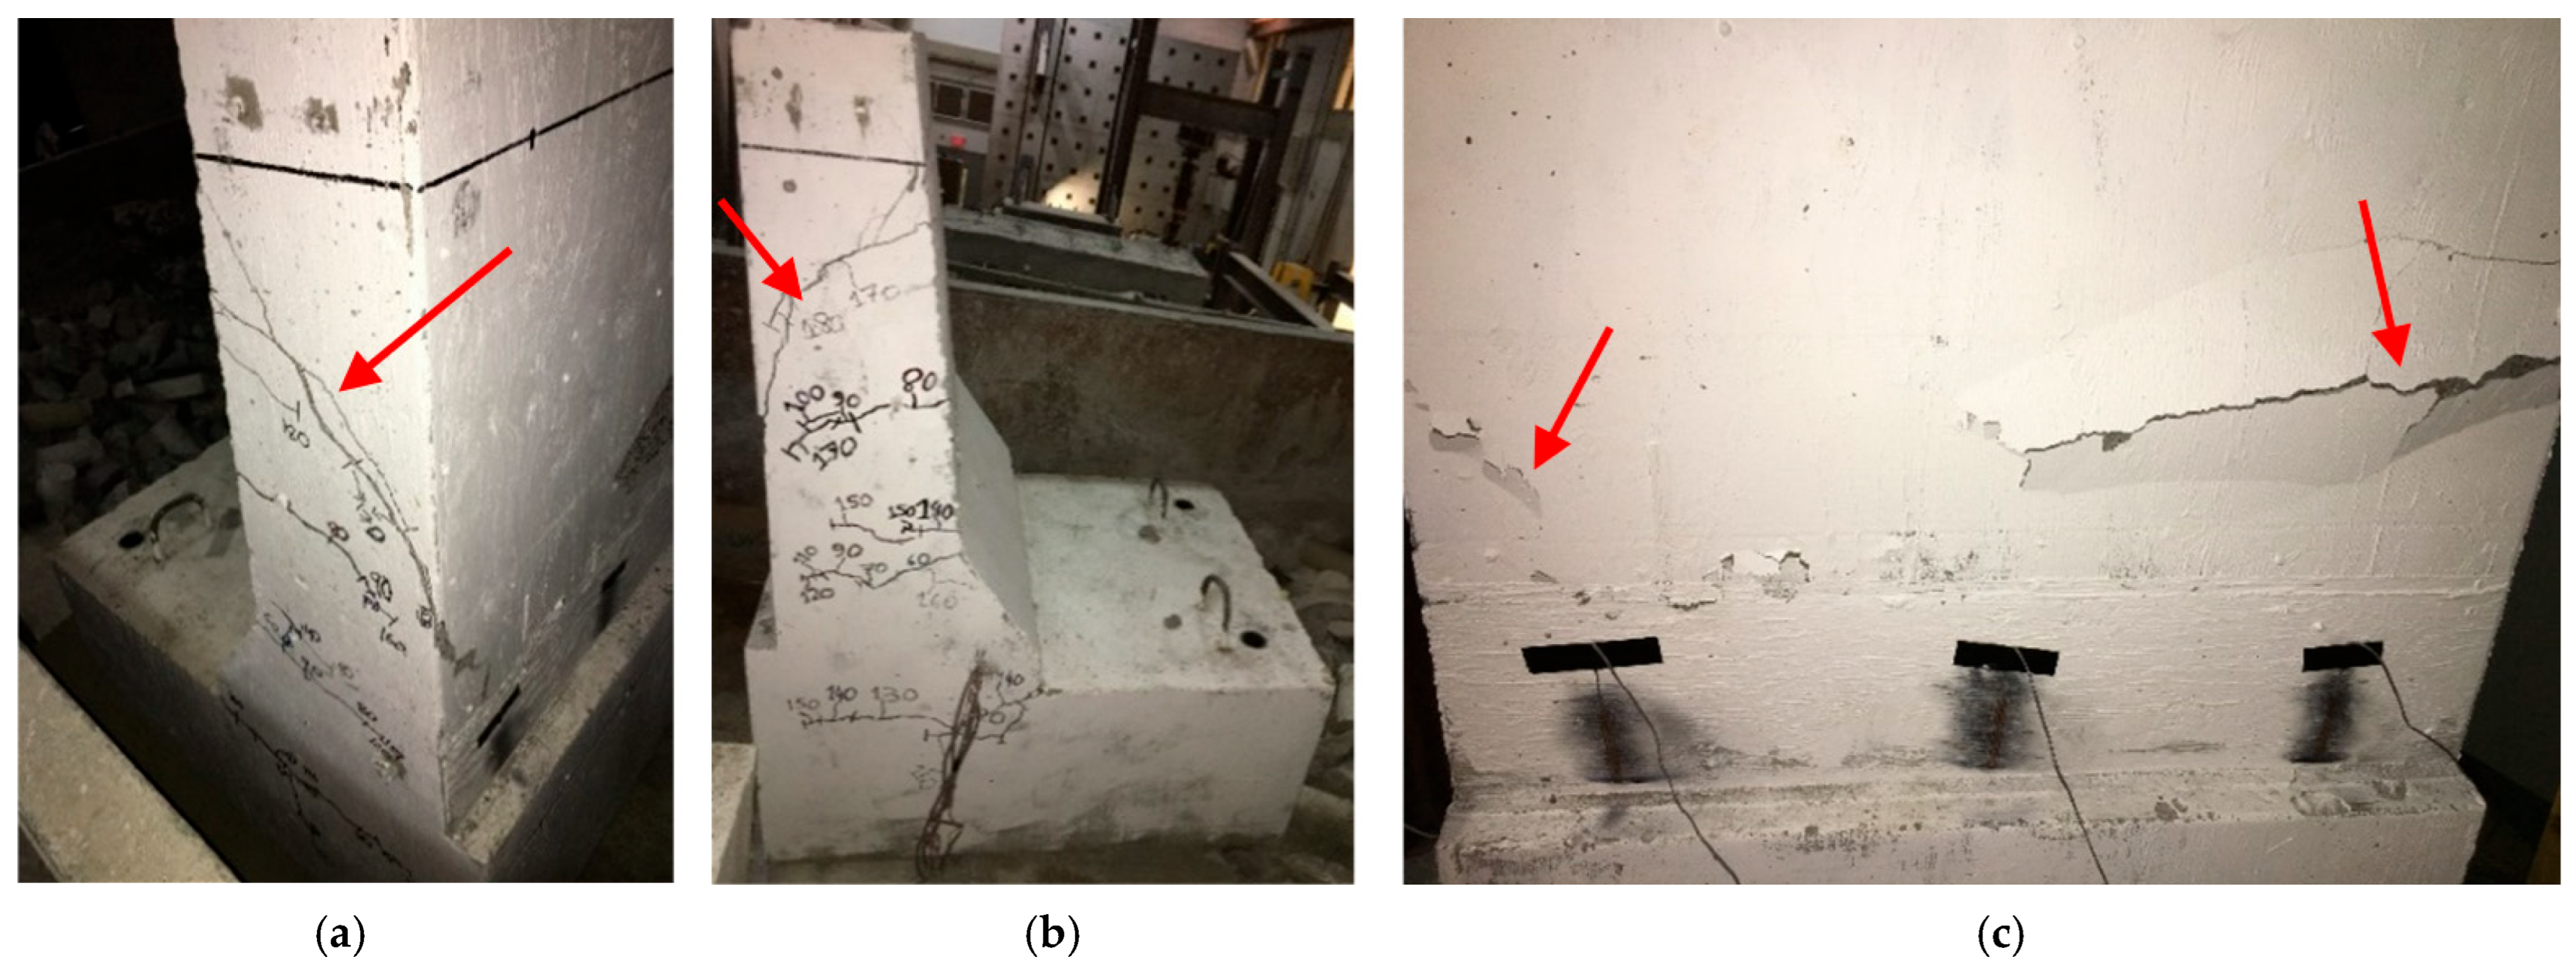
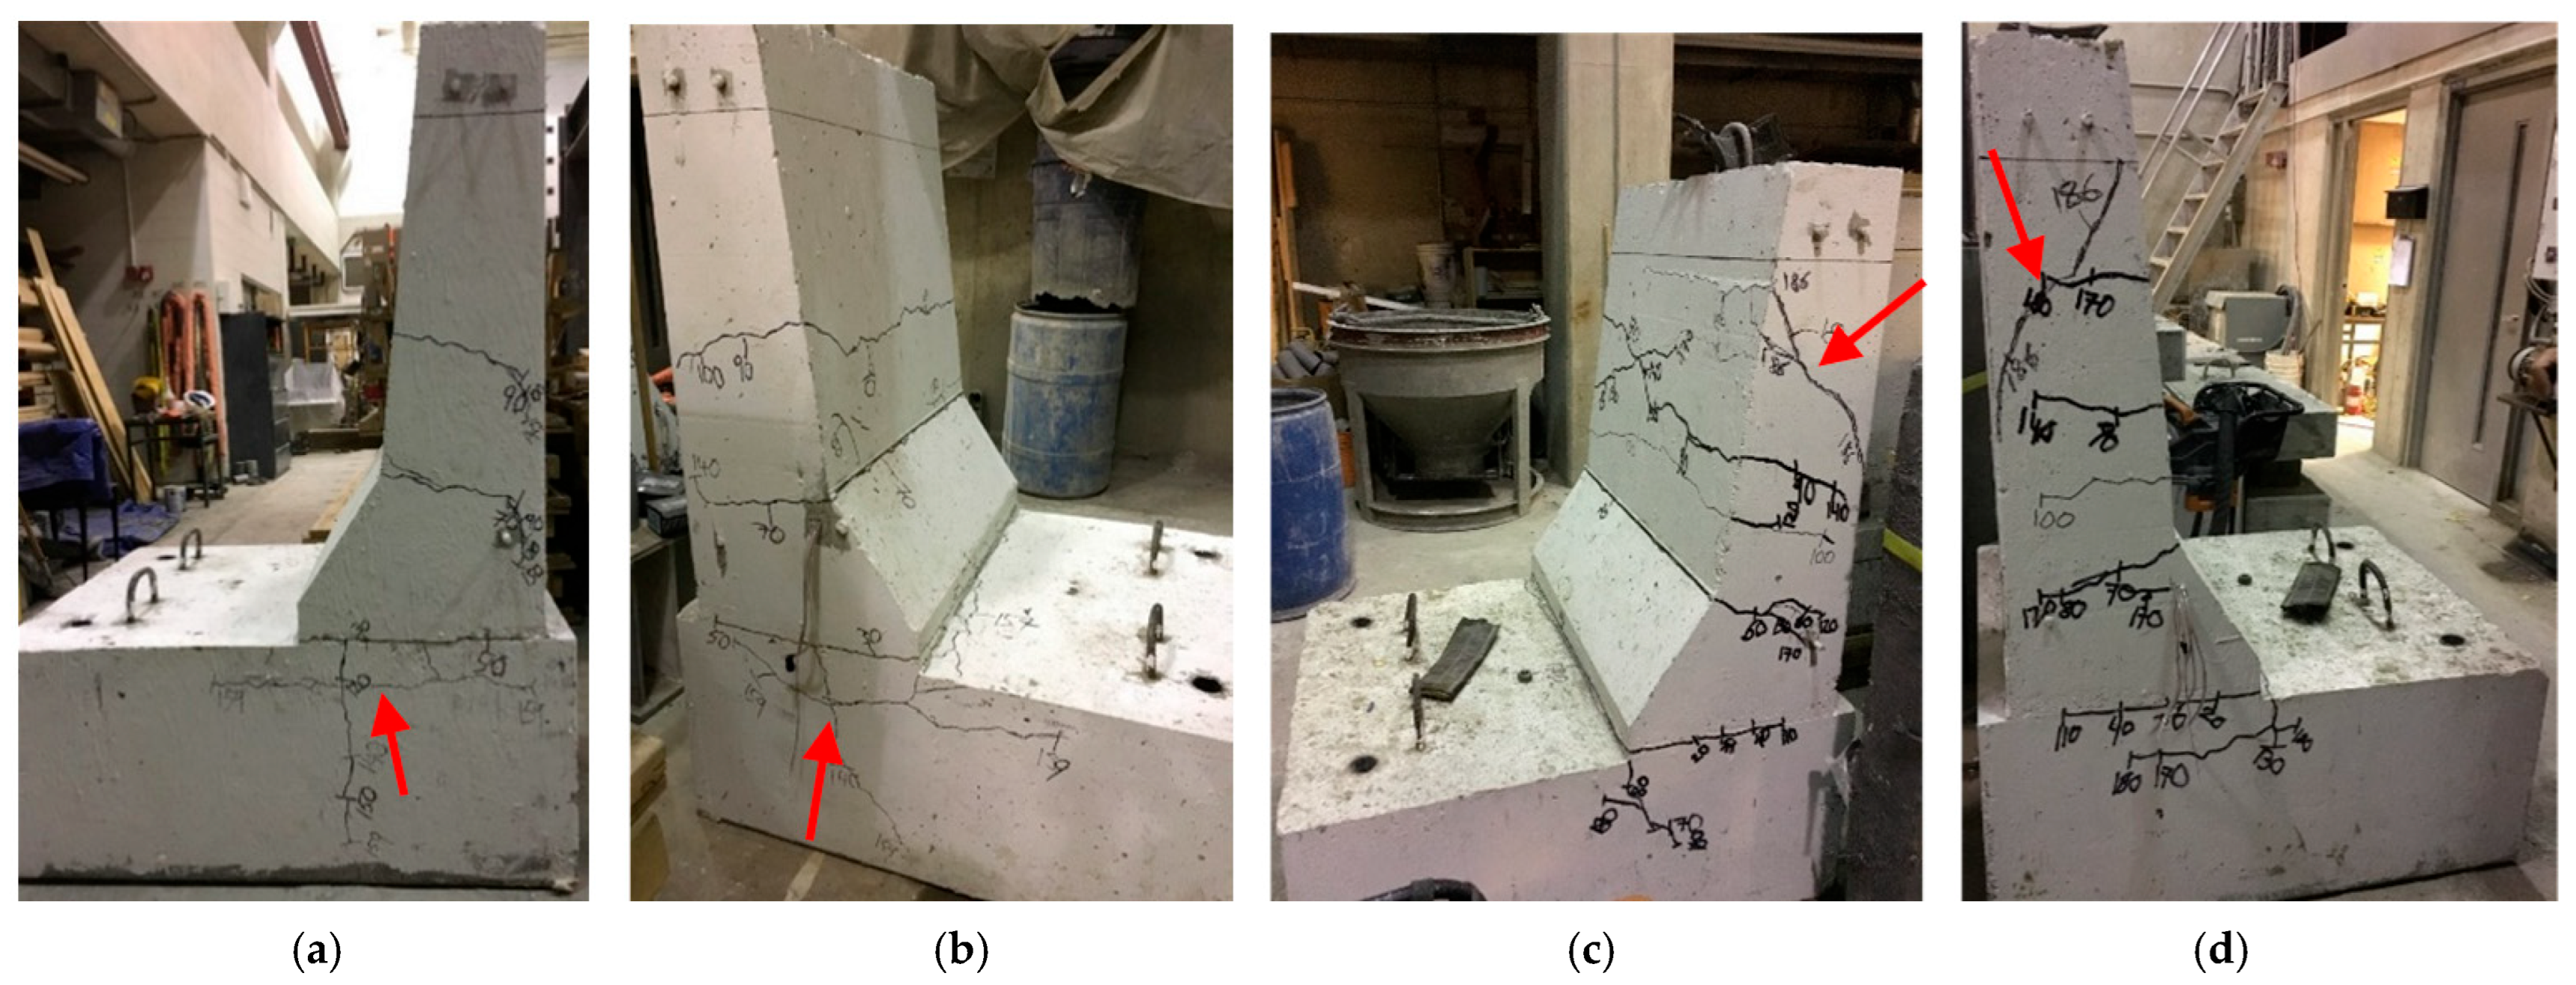
3.1. Crack Pattern and Failure Modes
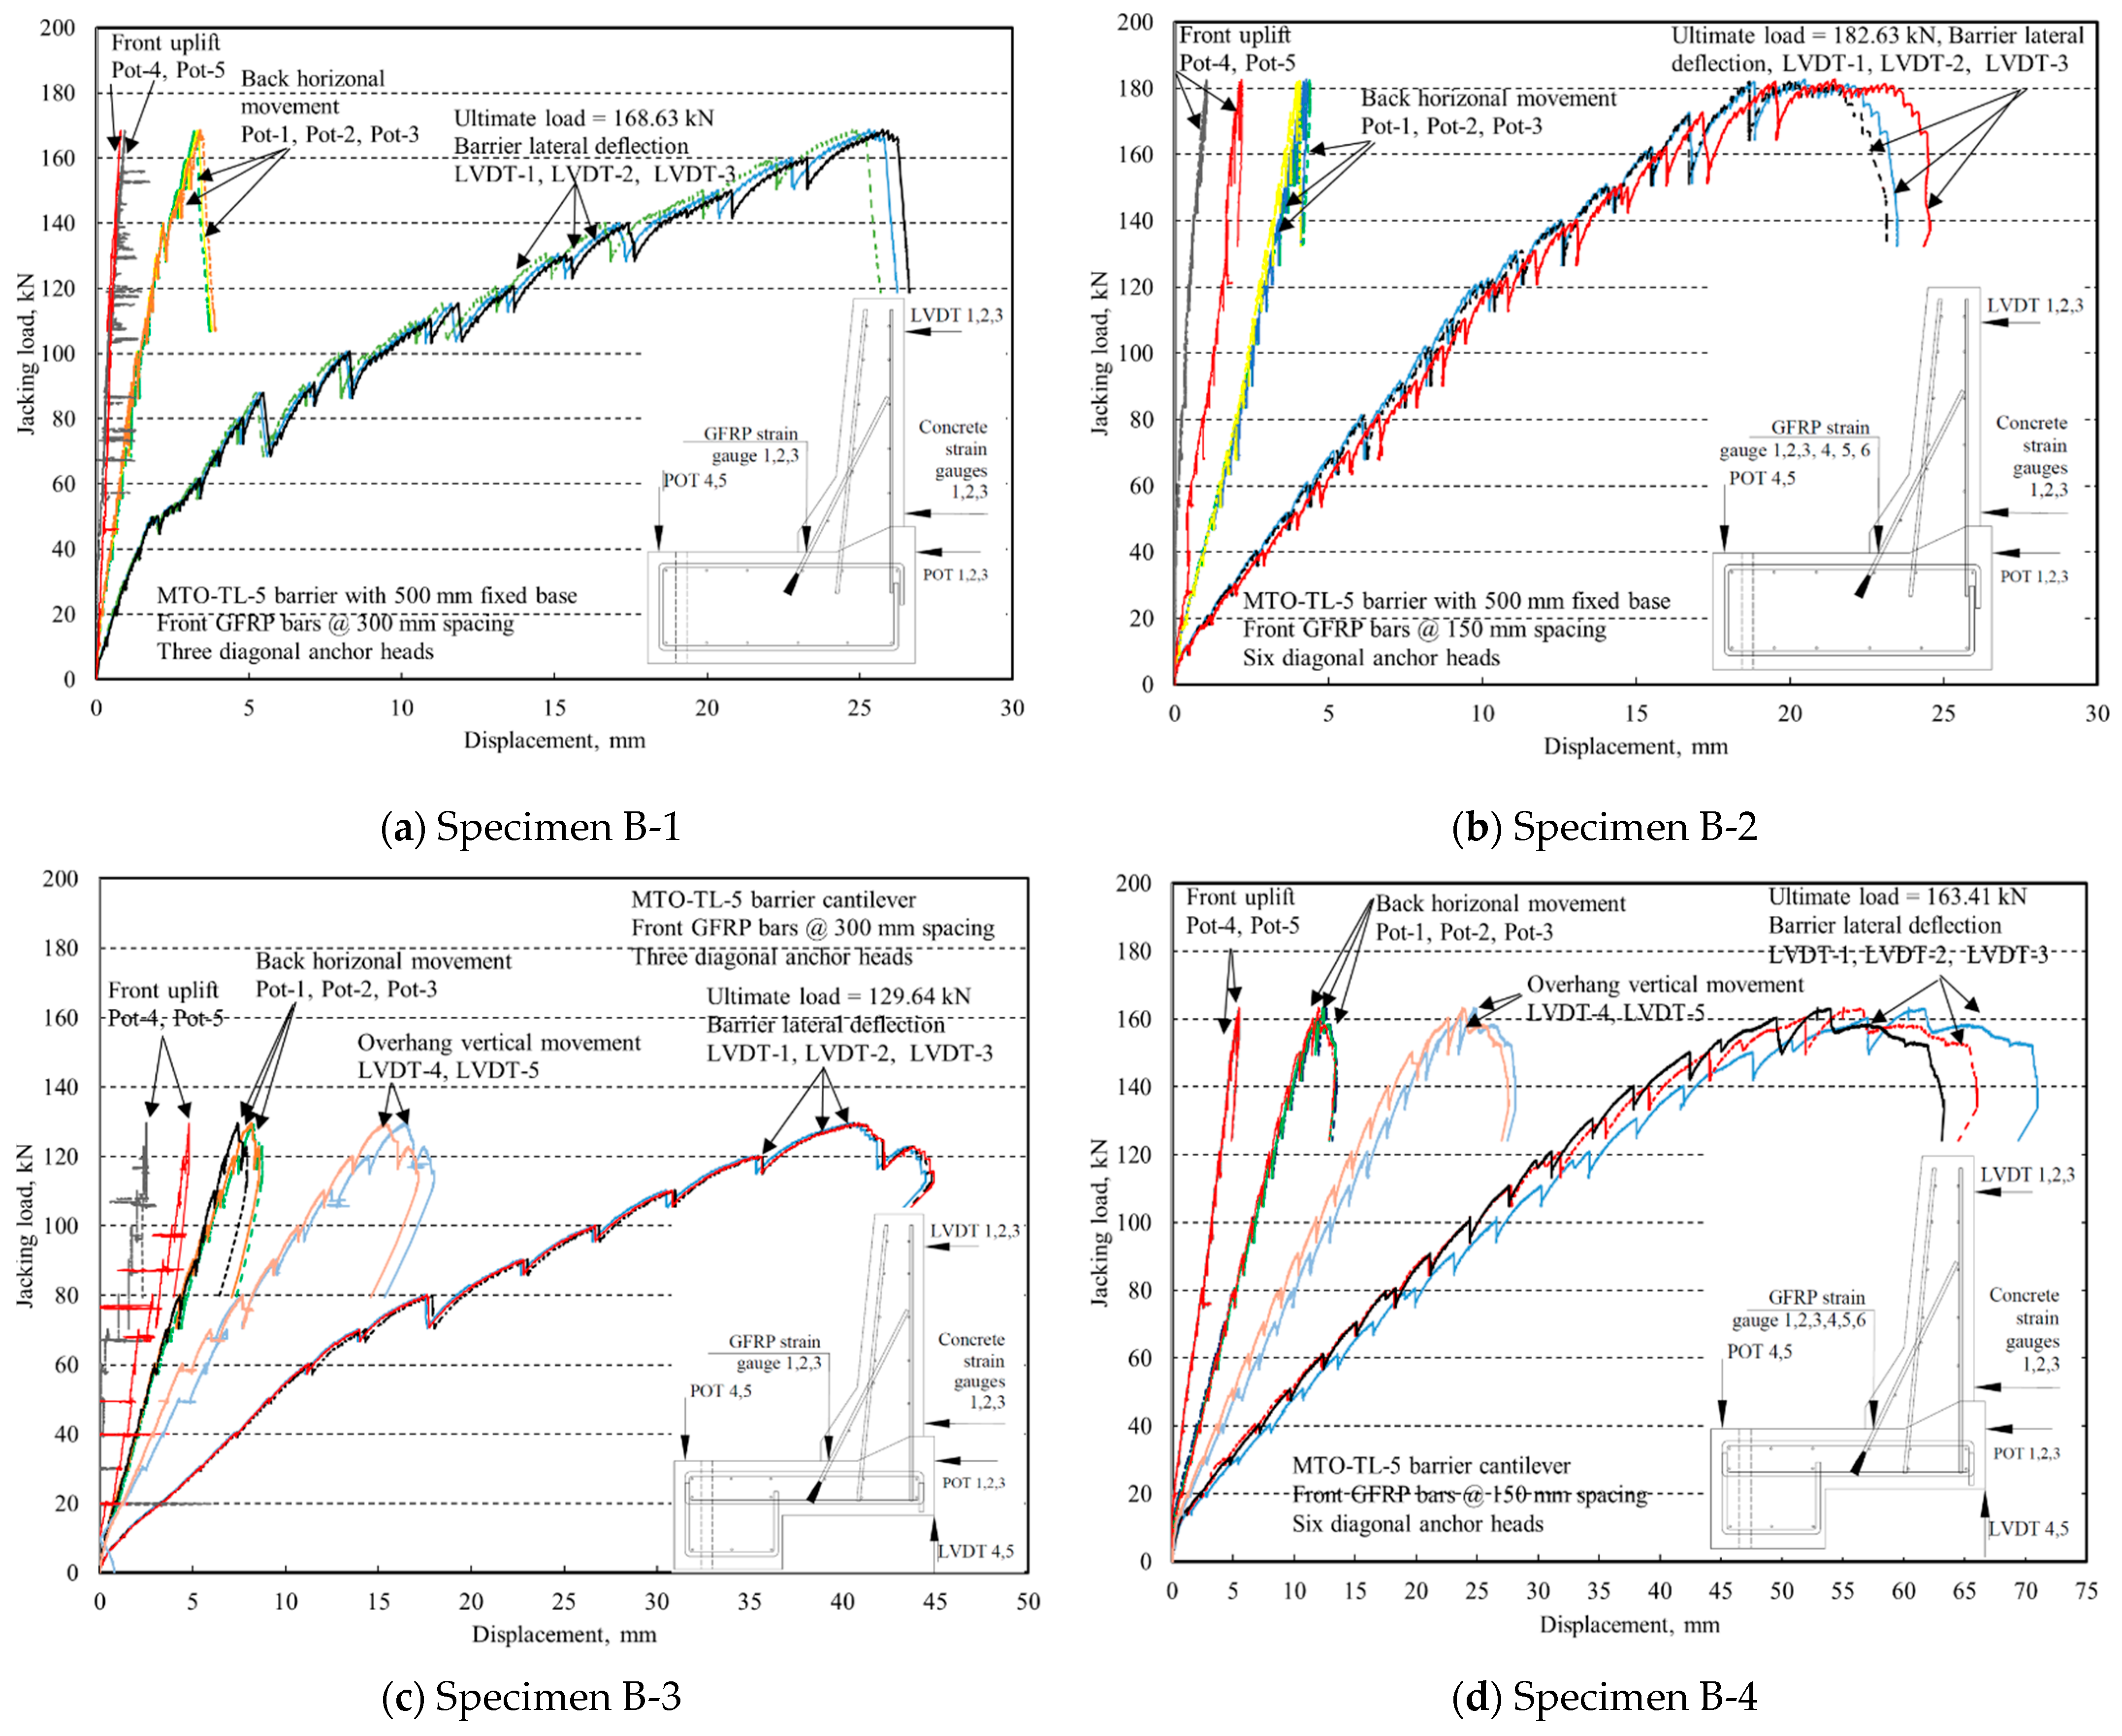
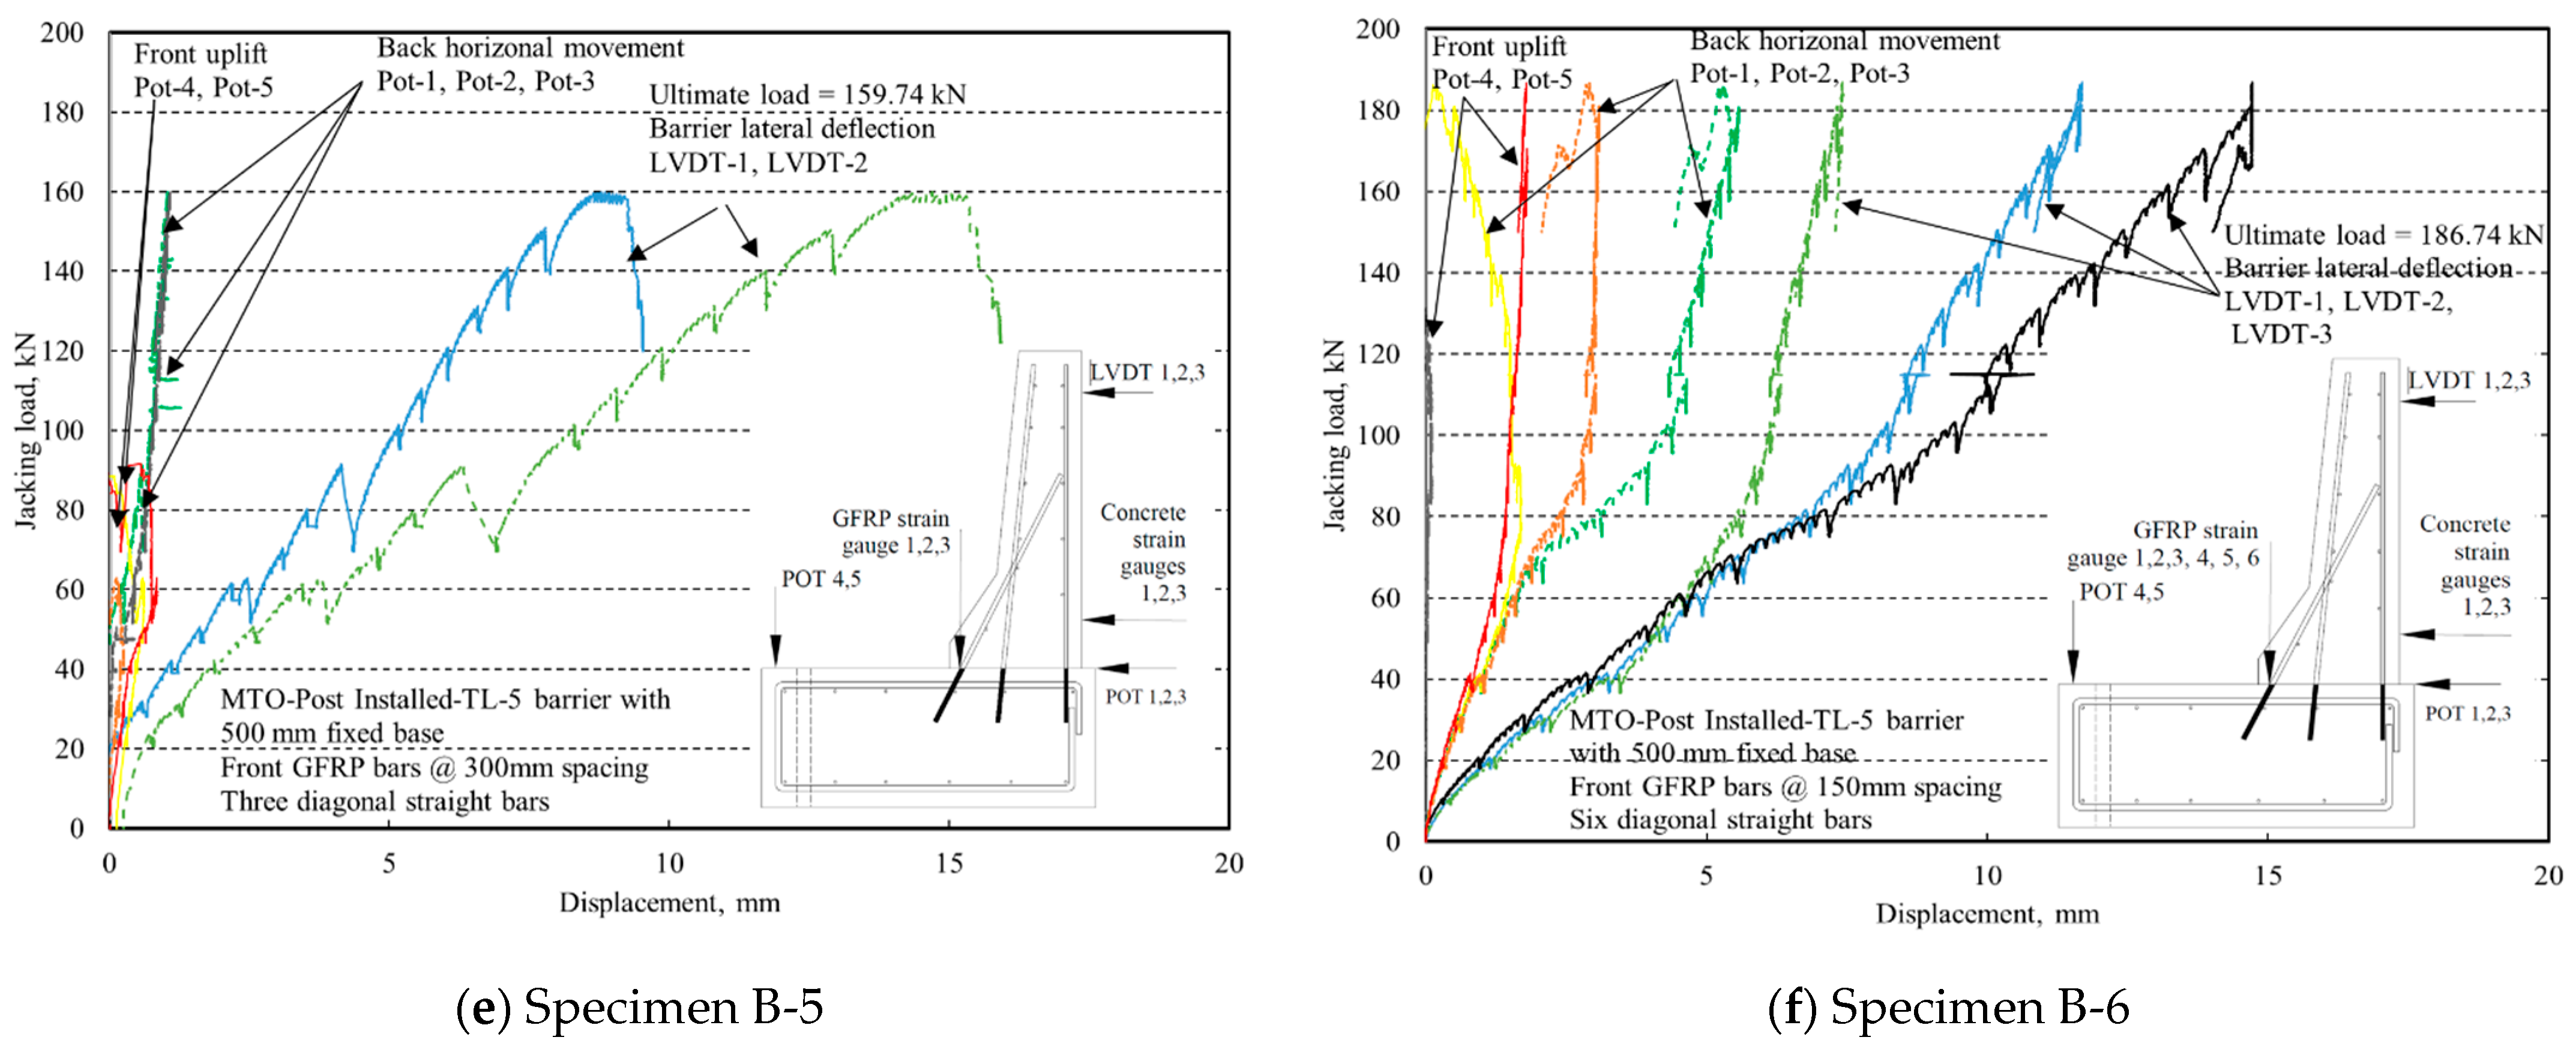
3.2. Load–Displacement Relationships
3.3. Load–GFRP Bar Tensile Strain Relationships
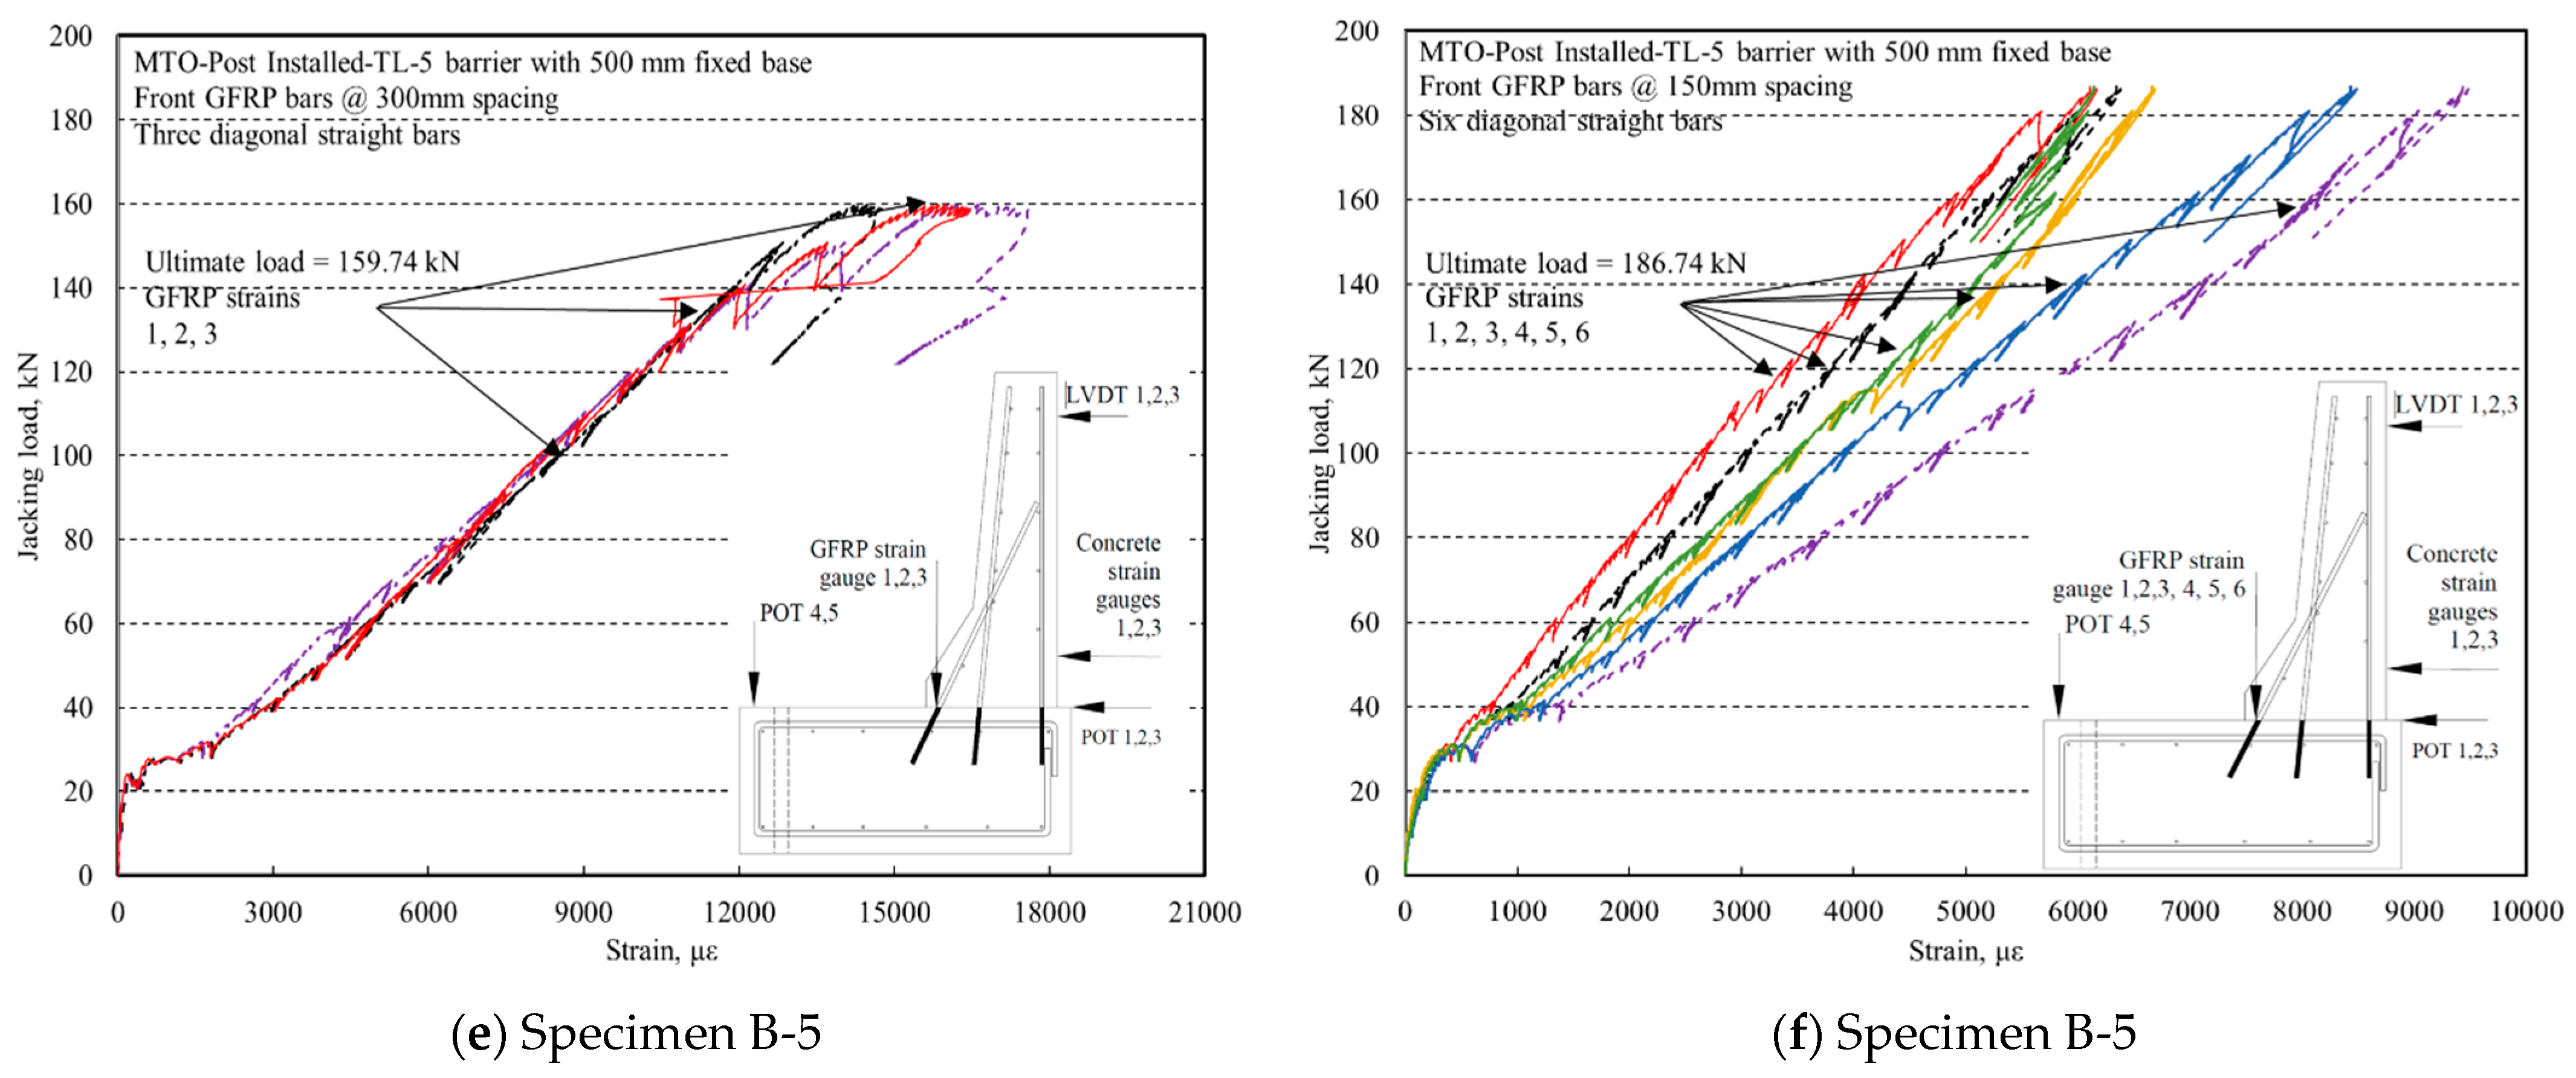
3.4. Load–Concrete Strain Relationships for All Specimens
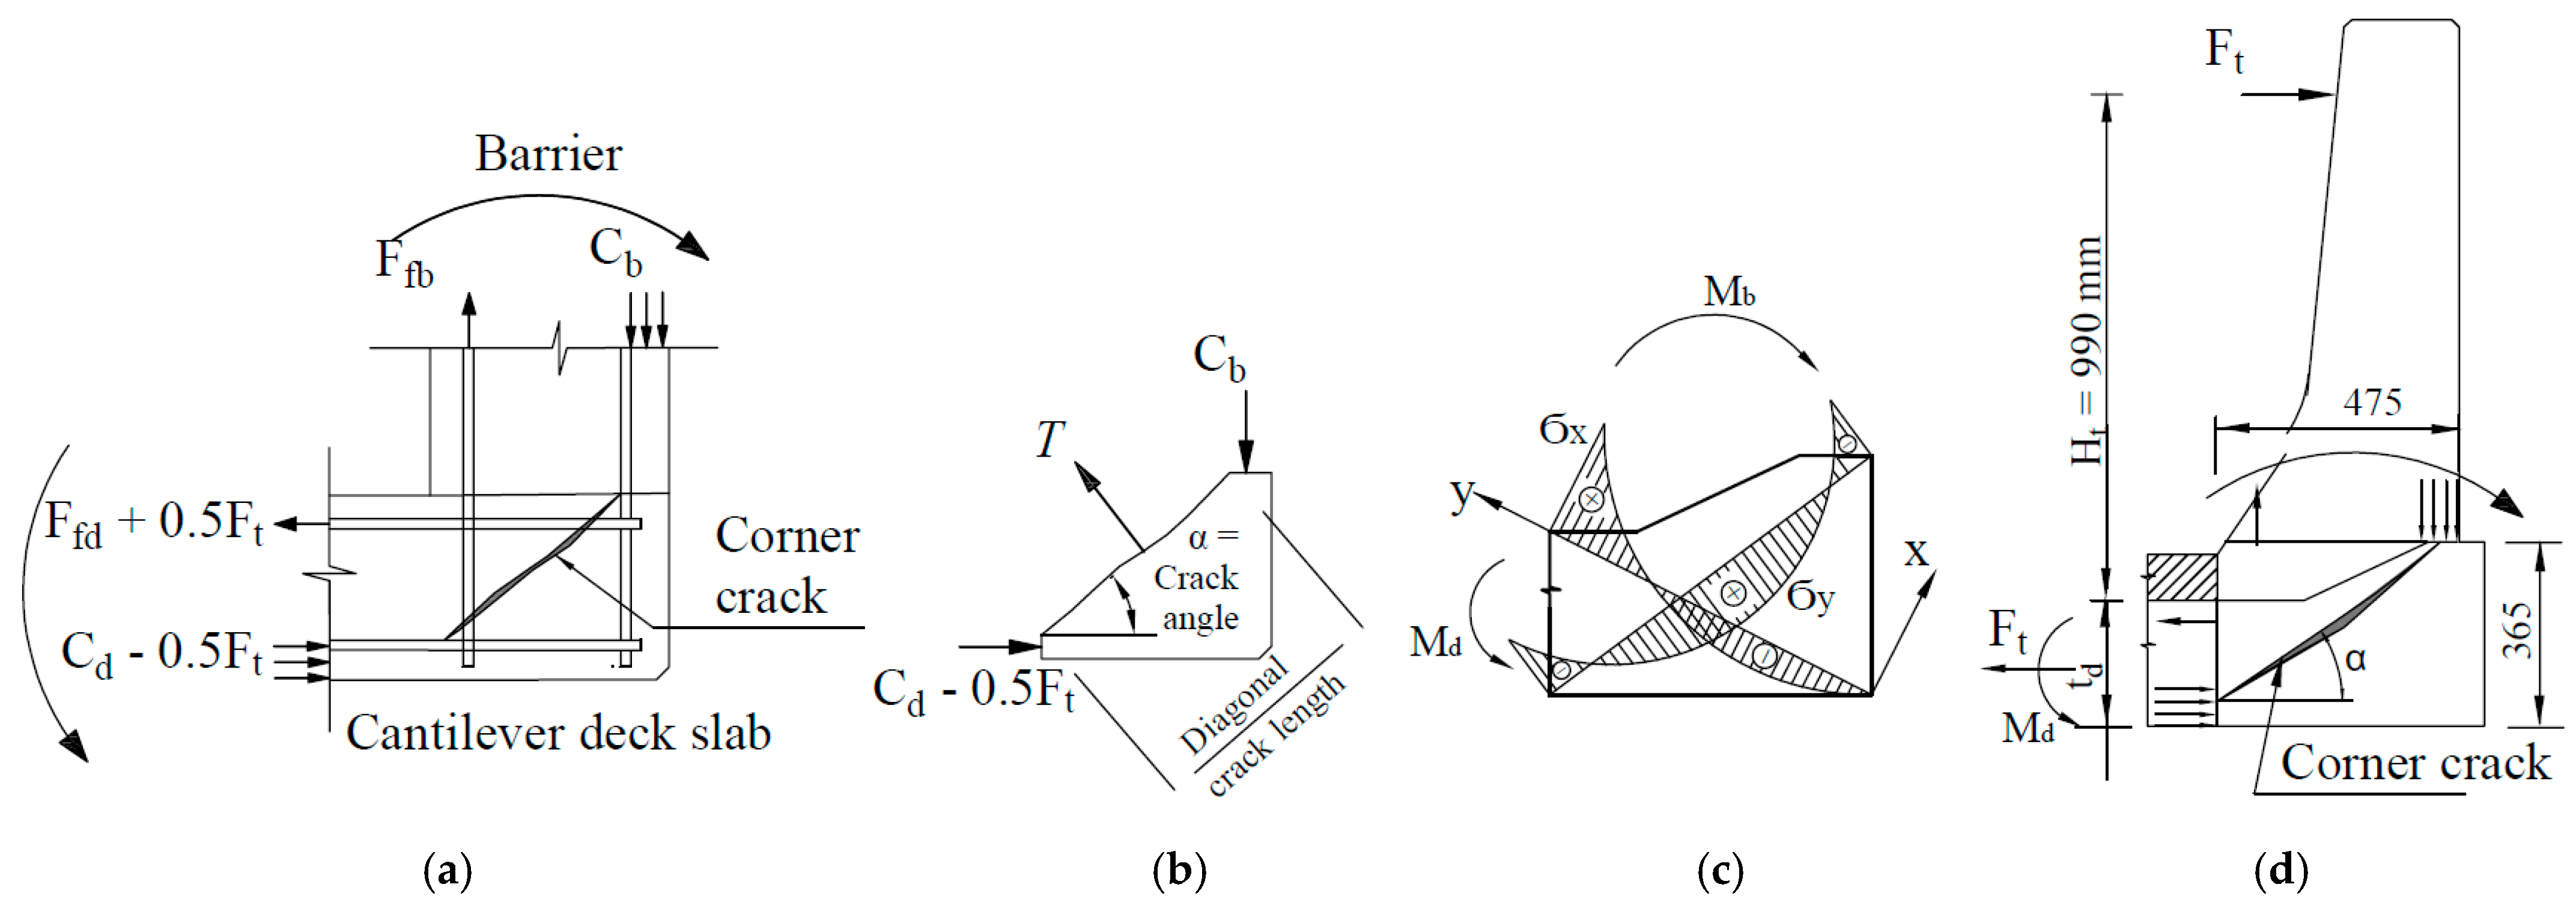
3.5. Barrier Maximum Moment Associated with the Diagonal Tension Crack in the Deck Slab Overhang
4. Moment Capacity-to-Demand Ratio at the Barrier–Deck Anchorage
5. Applicability of Static Testing to Dynamic Crash Performance
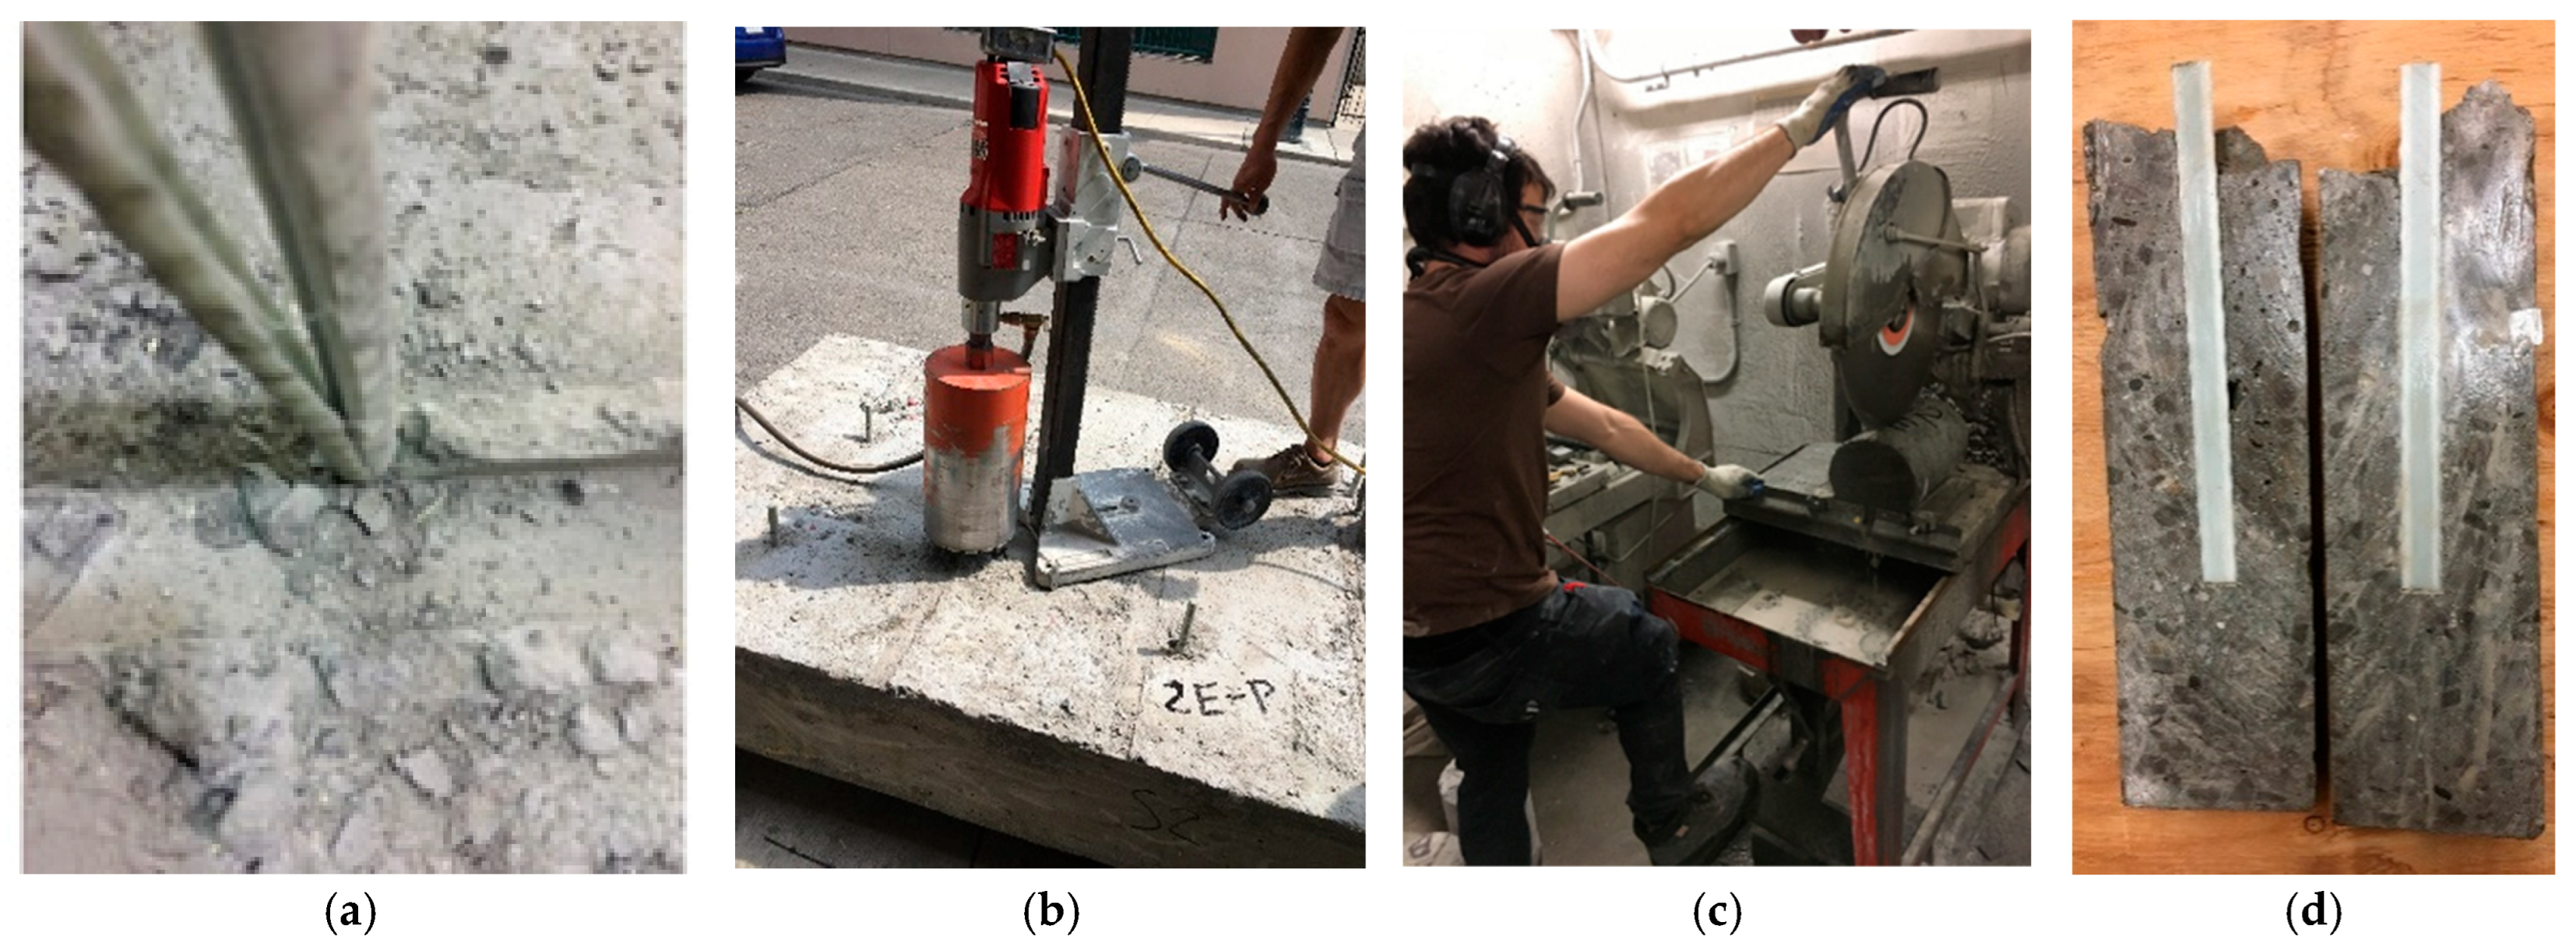
6. Pullout Strength of GFRP Bars
7. Conclusions
- Structural Adequacy: All six full-scale TL-5 barrier–deck specimens exceeded the factored design moments per CHBDC, with capacity-to-demand ratios ranging from 1.38 to 1.51. Even after applying an environmental reduction factor of 0.85, all ratios remained above 1.17, confirming the robustness of the GFRP anchorage systems.
- Embedment Length: A 195 mm embedment length was sufficient for both preinstalled and postinstalled GFRP bars, meeting or exceeding the required anchorage strength in all configurations.
- Headed-End Performance: Headed-end GFRP bars demonstrated superior pullout strength compared to straight-end bars. When combined with a bonded straight portion, the pullout capacity increased by approximately 10%, consistently surpassing the 100 kN threshold required by MTO.
- Failure Mechanisms: Observed failure modes on the tested actual-size barrier–deck specimens included concrete breakout at the deck-barrier corner or diagonal shear in the barrier wall. No GFRP bar rupture was recorded, and strain measurements confirmed that neither concrete nor GFRP bars reached their ultimate strain limits.
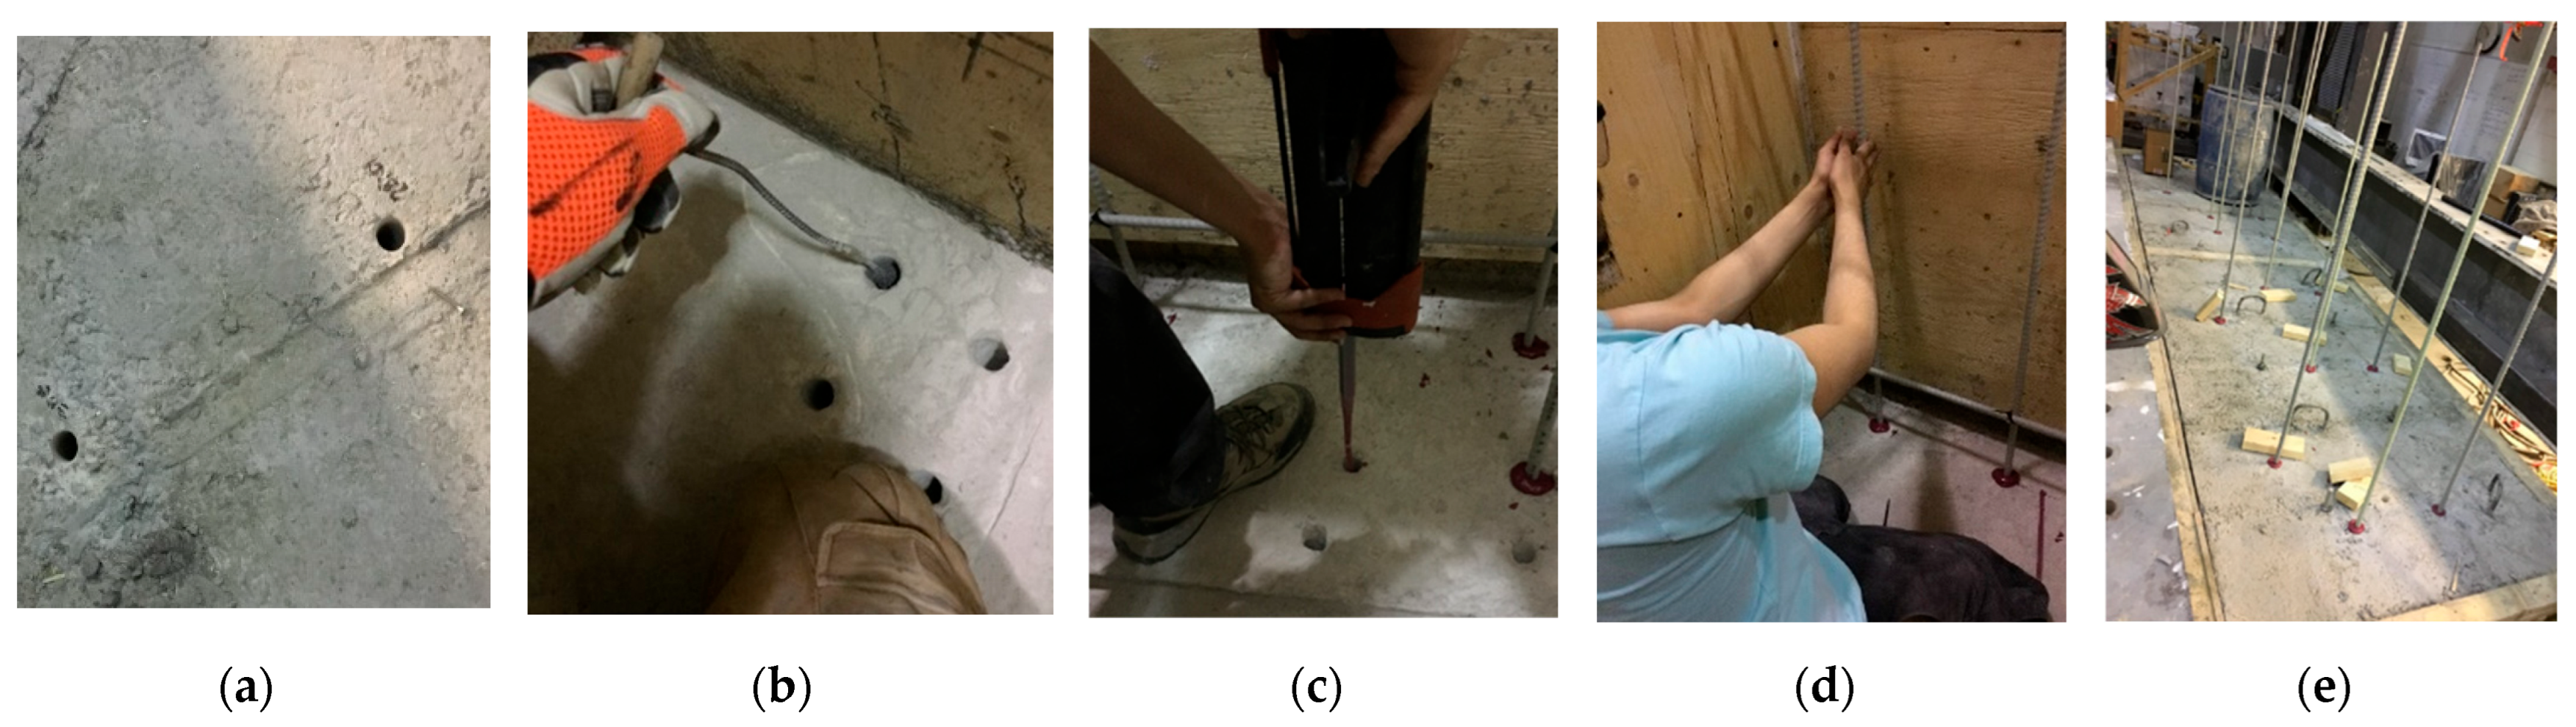
- Postinstalled Bar Viability: Postinstalled straight GFRP bars bonded with epoxy exhibited comparable performance to preinstalled headed bars, validating their use in retrofitting deteriorated barriers.
- Deck Overhang Behavior: Specimens with deck overhangs experienced diagonal tension cracking at the barrier–deck corner as the governing failure mode. The developed design equation for the resisting moment due to diagonal cracking (Equation (9)) showed strong agreement with experimental results, with moment ratios of 1.13 and 1.36, confirming its conservatism and applicability in design.
- Reinforcement Detailing: Doubling the vertical GFRP bars at the traffic face significantly enhanced load resistance, crack control, and deflection performance, particularly at barrier ends.
- Design Implications for Code and Standard Updates: The results support updating MTO-S110-92 Standard Drawing and CHBDC to recognize 195 mm embedment lengths for GFRP bars and to permit headed-end and postinstalled GFRP anchorage systems as structurally adequate and constructible alternatives to traditional bent bars.
Author Contributions
Funding
Data Availability Statement
Acknowledgments
Conflicts of Interest
References
- Manning, D. Corrosion Performance of Epoxy-Coated Reinforcing Steel: North American Experience. J. Constr. Build. Mater. 1996, 10, 349–365. [Google Scholar] [CrossRef]
- Smith, J.; Virmani, Y. Performance of Epoxy-Coated Rebars in Bridge Decks. Public. Roads 1996, 60, 2750012. [Google Scholar]
- Lai, D.; Raven, R. Performance of Epoxy Coated Reinforcement in Bridge Barriers Subjected to Direct Salt Splashing. In Proceedings of the 8th International Conference on Short and Medium Span Bridges, Niagara Falls, ON, Canada, 3–6 August 2010; Paper # 76. pp. 424–434. [Google Scholar]
- Islam, S.; Afefy, H.M.; Sennah, K.; Azimi, H. Bond characteristics of straight- and headed-end ribbed-surface GFRP bars embedded in high-strength concrete. Constr. Build. Mater. 2015, 83, 283–298. [Google Scholar] [CrossRef]
- Lu, J.; Afefy, H.M.; Azimi, H.; Sennah, K.; Sayed-Ahmed, M. Bond performance of sand-coated and ribbed-surface glass fiber reinforced polymer bars in high-performance concrete. Structures 2021, 34, 10–19. [Google Scholar] [CrossRef]
- Khederzadeh, H.; Sennah, K. Pullout Strength of Pre-installed GFRP Bars in Concrete. In Proceedings of the CSCE Annual Conference, Canadian Society for Civil Engineering, Montreal, QC, Canada, 29 May–1 June 2013; pp. 1–10. [Google Scholar]
- Ahmed, E.A.; El-Sayed, A.K.; El-Salakawy, E.; Benmokrane, B. Bend strength of FRP stirrups: Comparison and evaluation of testing methods. J. Compos. Constr. 2010, 14, 3–10. [Google Scholar] [CrossRef]
- Achillides, Z.; Pilakoutas, K. Bond Behavior of Fiber Reinforced Polymer Bars under Direct Pullout Conditions. J. Compos. Constr. 2004, 8, 173–181. [Google Scholar] [CrossRef]
- Baena, M.; Torres, L.; Turon, A.; Barris, C. Experimental Study of Bond Behavior between Concrete and FRP Bars using a Pull-out Test. Compos. Part B Eng. 2009, 40, 784–797. [Google Scholar] [CrossRef]
- Won, J.; Park, C.; Kim, H.; Lee, S.; Jang, C. Effect of Fibers on the Bonds between FRP Reinforcing Bars and High-Strength Concrete. Compos. Part B Eng. 2008, 39, 747–755. [Google Scholar] [CrossRef]
- Mazaheripour, H.; Barros, J.; Cruz, S.; Soltanzadeh, F. Analytical Bond Model for GFRP Bars to Steel Fiber Reinforced Self-Compacting Concrete. J. Compos. Constr. 2013, 17, 1–16. [Google Scholar] [CrossRef]
- Maranan, G.; Manalo, A.; Karunasena, W.; Benmokrane, B. Bond Stress-Slip Behavior: Case of GFRP Bars in Geopolymer Concrete. J. Mater. Civ. Eng. 2015, 27, 1–9. [Google Scholar] [CrossRef]
- Maranan, G.; Manalo, A.; Karunasena, W.; Benmokrane, B. Pullout Behavior of GFRP bars with Anchor in Geopolymer Concrete. J. Compos. Struct. 2015, 132, 1113–1121. [Google Scholar] [CrossRef]
- Ametrano, D. Bond Characteristics of Glass Fibre Reinforced Polymer Bars Embedded in High Strength and Ultra-High Strength Concrete. Master’s Thesis, Department of Civil Engineering, Ryerson University, Toronto, ON, Canada, 2011. [Google Scholar]
- Mak, C. Experimental and Theoretical Investigation of Glass Fibre Reinforced Polymer Tension Lap Splices in Ultra High Performance Concrete. Master’s Thesis, Department of Civil Engineering, Ryerson University, Toronto, ON, Canada, 2011. [Google Scholar]
- Yoo, D.-Y.; Kwon, K.-Y.; Park, J.-J.; Yoon, Y.-S. Local Bond-Slip Response of GFRP Rebar in Ultra-High-Performance Fiber-Reinforced Concrete. Compos. Struct. 2015, 120, 53–64. [Google Scholar] [CrossRef]
- Ahmed, M.S.; Sennah, K.; Afefy, H.M. Structural Behavior of Full-Depth Deck Panels Having Developed Closure Strips Reinforced with GFRP Bars and Filled with UHPFRC. J. Comp. Sci. 2024, 8, 468. [Google Scholar]
- Ahmed, M.S.; Sennah, K.; Afefy, H.M. Fatigue and Ultimate Strength Evaluation of GFRP-Reinforced, Laterally Restrained, Full-Depth Precast Deck Panels with Developed UHPFRC Filled Transverse Closure Strips. Appl. Sci. 2024, 14, 19. [Google Scholar]
- Firas, S.A.; Gilles, F.; Robert, L.R. Bond Between Carbon Fibre-reinforced Polymer (CFRP) Bars and Ultra-High Performance Fibre Reinforced Concrete (UHPFRC): Experimental study. Constr. Build. Mater. 2011, 25, 479–485. [Google Scholar]
- Benmokrane, B.; Mohamed, M.H.; Manalo, A.; Cousin, P. Evaluation of Physical and Durability Characteristics of New Headed Glass-Fiber-Reinforced-Polymer (GFRP) Bars. ASCE J. Compos. Constr. 2017, 21, 1–12. [Google Scholar] [CrossRef]
- Vint, L.; Sheikh, S. Investigation of Bond Properties of Alternate Anchorage Schemes for Glass Fiber-Reinforced Polymer Bars. ACI Struct. J. 2015, 112, 59–68. [Google Scholar]
- Vint, L. Investigation of Bond Properties of Glass Fibre Reinforced Polymer (GFRP) Bars in Concrete under Direct Tension. Master’s Thesis, Department of Civil Engineering, University of Toronto, Toronto, ON, Canada, 2012. [Google Scholar]
- Mohamed, H.; Zaki, M.; Benmokrane, B. Newly Developed FRP-Headed Rebars for Infrastructure Applications. In Proceedings of the 3rd International Structural Specialty Conference, Canadian Society for Civil Engineering, Edmonton, AB, Canada, 6–9 June 2012; pp. 1–9. [Google Scholar]
- Lu, J.; Afefy, H.M.; Azimi, H.; Sennah, K.; Sayed-Ahmed, M. Bond characteristics of glass fiber reinforced polymer bars in high-strength concrete. Struct. Build. 2022, 175, 748–764. [Google Scholar] [CrossRef]
- Johnson, D.; Sheikh, S. Experimental Investigation of Glass Fiber-Reinforced Polymer-Reinforced Normal-Strength Concrete Beams. ACI Struct. J. 2013, 113, 1165–1174. [Google Scholar] [CrossRef]
- Sennah, K.; Khederzadeh, H. Development of Cost-Effective PL-3 Concrete Bridge Barrier Reinforced with Sand-Coated GFRP Bars: Vehicle Crash Test. Can. J. Civ. Eng. 2014, 41, 357–367. [Google Scholar] [CrossRef]
- Sennah, K.; Hedjazi, S. Structural Qualification of a Developed GFRP-Reinforced PL-3 Concrete Bridge Barrier Using Vehicle Crash Testing. Int. J. Crashworthiness 2018, 24, 1–18. [Google Scholar]
- Sennah, K.; Tropynina, E.; Ibrahim, Z.; Hedjazi, S. Structural Qualification of a Developed GFRP-Reinforced PL-3 Concrete Bridge Barrier Using Ultimate Load Testing. Int. J. Concr. Struct. Mater. 2018, 12, 1–22. [Google Scholar] [CrossRef]
- Rostami, M.; Sennah, K.; Afefy, H.M. Ultimate capacity of barrier-deck anchorage in MTQ TL-5 barrier reinforced with headed-end, high-modulus, sand-coated GFRP bars. Can. J. Civ. Eng. 2018, 45, 263–275. [Google Scholar] [CrossRef]
- Khederzadeh, H.; Sennah, K. Development of Cost-Effective PL-3 Concrete Bridge Barrier Reinforced with Sand-Coated GFRP Bars: Static Load Tests. Can. J. Civ. Eng. 2014, 41, 368–379. [Google Scholar] [CrossRef]
- Sennah, K.; Mostafa, A. Performance of a Developed TL-5 Concrete Bridge Barrier Reinforced with GFRP Hooked Bars: Vehicle Crash Testing. ASCE J. Bridge Eng. 2018, 23, 1–20. [Google Scholar] [CrossRef]
- Rostami, M.; Sennah, M.; Mostafa, A. Experimental Study on the Transverse Load Carrying Capacity of TL-5 Bridge Barrier Reinforced with Special Profile GFRP Bars. ASCE J. Compos. Constr. 2019, 23, 1–16. [Google Scholar] [CrossRef]
- Hasaballa, M.; El-Salakawy, E. Seismic performance of beam-column joints reinforced with GFRP headed bars. In Proceedings of the 3rd Asia-Pacific Conference on FRP Is Structures (APFIS 2012), Sapporo, Japan, 2–4 February 2012. [Google Scholar]
- El-Badry, M.; Moravvej, M.; Joulani, P. Performance of a Hybrid FRP-Reinforced Bridge Truss Girder System – Experimental Assessment. In Proceedings of the 4th International Conference on Smart Monitoring, Assessment, and Rehabilitation of Civil Structures, SMAR 2017, Zurich, Switzerland, 13–15 September 2017; pp. 1–9. [Google Scholar]
- Lu, C.; Qi, Z.; Zheng, Y.; Xuan, G.; Yan, Y. Long-term tensile performance of GFRP bars in loaded concrete and aggressive solutions. J. Build. Eng. 2023, 64, 105587. [Google Scholar] [CrossRef]
- Zhu, P.; Li, Z.; Zhu, Y.; Wu, Y.; Qu, W. Prediction of the Long-Term Tensile Strength of GFRP Bars in Concrete. Buildings 2023, 13, 1035. [Google Scholar] [CrossRef]
- Hao, Z.H.; Zeng, J.J.; Chen, G.M.; Dai, J.G.; Chen, J.F. Durability of FRP-to-concrete bonded joints subjected to 110 months of accelerated laboratory and field exposure. Eng. Struct. 2024, 305, 117681. [Google Scholar] [CrossRef]
- Sun, J.-H.; Su, N.-J.; He, Z.-Q.; Jia, R.-X.; Liu, Y.; Lin, F.-K.; Ka, T.A. Durability of concrete-encapsulated GFRP bars subjected to seawater immersion. Case Stud. Constr. Mater. 2024, 20, e03249. [Google Scholar] [CrossRef]
- Nepomuceno, E.; Sena-Cruz, J.; Correia, L.; D'Antino, T. Review on the bond behavior and durability of FRP bars to concrete. Constr. Build. Mater. 2021, 287, 123042. [Google Scholar] [CrossRef]
- Zheng, Y.; Ni, M.; Lu, C.; Chu, T.; Wu, X. Bond Behavior of GFRP-Concrete Under Long-term Exposure to Aggressive Environments. J. Adv. Concr. Technol. 2020, 18, 730–742. [Google Scholar] [CrossRef]
- National Academies of Sciences, Engineering, and Medicine. MASH Railing Load Requirements for Bridge Deck Overhang. NCHRP Research Report 1078; The National Academies Press: Washington, DC, USA, 2023. [Google Scholar] [CrossRef]
- Frosch, R.J.; Morel, A.J. Guardrails for Use on Historic Bridges: Volume 2—Bridge Deck Overhang Design; Report No. FHWA/IN/JTRP-2016/34; Joint Transportation Research Program, Purdue University: West Lafayette, IN, USA, 2016; 109p. [Google Scholar]
- Arrington, D.R.; Holt, J.M.; Bligh, R.P. Concrete Roadside Barrier Anchorage Details for 5-in., Cast-in-Place Decks on Prestressed Beams. Transp. Res. Rec. 2012, 2313, 33–41. [Google Scholar] [CrossRef]
- Zhao, H.; Xie, Z.; Yang, B.; Li, L.; Wang, R.; Chen, W. Impact resistance performance of precast reinforced concrete barriers with grouted sleeve and steel angle-to-plate connections. Eng. Struct. 2024, 316, 118533. [Google Scholar] [CrossRef]
- Nguyen, Q.T.; Maki, T.; Mutsuyoshi, H.; Ishihara, Y. Experimental Study on Connection Between Precast Concrete Barrier and Existing Bridge Deck by Loop Steel Bars and Post-installed Anchor. In International Symposium of the International Federation for Structural Concrete; Lecture Notes in Civil Engineering; Springer: Cham, Switzerland, 2023; Volume 350. [Google Scholar] [CrossRef]
- Yu, X.; Huang, Y.; Yang, Y.; Chen, Y.; Luo, Y.; Jia, B. Optimal design for the connector of bridge prefabricated concrete barriers. Sci. Prog. 2021, 104, 1–19. [Google Scholar] [CrossRef]
- Alaywan, W.R. Performance and Analysis of Concrete Bridge Railing Using Conventional and Composite Reinforcement Materials; Report No. FHWA/LA.16/547; Louisiana Transportation Research Center: Rouge, LA, USA, 2018; 161p. [Google Scholar]
- Azimi, H.; Grégoire, M.; Liu, Z.; Bahous, A. A Precast Barrier Alternative Connected to Moment Slab for Accelerated Construction. In Proceedings of the 10th International Conference on Short and Medium Span Bridges, Quebec City, QC, Canada, 31 July–3 August 2018; pp. 1–9. [Google Scholar]
- Ecklund, A.; Sritharan, S. Precast Concrete Bridge Barriers for Accelerated Bridge Construction; Technical Report; Iowa State University: Ames, IA, USA, 2018; 103p. [Google Scholar]
- Patel, G.; Sennah, K.; Azimi, H.; Lam, C.; Kianoush, R. Development of Precast Concrete Barrier Wall System for Bridge Decks. J. Prestress. Concr. Inst. (PCI) 2014, 59, 83–102. [Google Scholar] [CrossRef]
- Coleman, Z.; Jacques, E.; Roberts-Wollmann, C. Effect of Beam Depth on Anchorage Strength of Hooked and Headed Bars. ACI Struct. J. 2023, 120, 197–206. [Google Scholar] [CrossRef]
- Cho, D.-Y.; Jeong, H.-S.; Choi, J.-W. A Study of the Bolt Connection System for a Concrete Barrier of a Modular Bridge. Int. J. Eng. Technol. Innov. 2018, 8, 107–117. [Google Scholar]
- Matta, F.; Nanni, A. Connection of Concrete Railing Post and Bridge Deck with Internal FRP Reinforcement. J. Bridge Eng. 2009, 14, 66–76. [Google Scholar] [CrossRef]
- Meda, A.; Rinaldi, Z.; Spagnuolo, S.; Grecco, R. Full-scale tests on bridge kerbs subjected to horizontal actions. Struct. Concr. 2021, 22, 813–826. [Google Scholar] [CrossRef]
- Cattaneo, S.; Crespi, P. Response of Connections between Concrete Corbels and Safety Barriers. Materials 2019, 12, 4103. [Google Scholar] [CrossRef]
- Ahmed, E.; Matta, F.; Benmokrane, B. Steel Post-and-Beam Barrier with GFRP-Reinforced Concrete Curb and Bridge Deck Connection. J. Bridge Eng. 2013, 18, 1189–1197. [Google Scholar] [CrossRef]
- Azimi, H.; Sennah, K.; Sayed-Ahmed, M.; Nikravan, N.; Louie, J.; Hassaan, A.; Al-Bayati, N. Bridge Deck-Guardrail Anchorage Detailing for Sustainable Construction. ASCE J. Bridge Eng. 2014, 19, 04014039. [Google Scholar] [CrossRef]
- Farghal, H.; Arvan, H.; Azizinamini, A. Use of All Lightweight Concrete in Conjunction with UHPC Connection for Prefabricated Barrier System; Technical Report No. ABC-UTC-2016-C4-FIU02; Florida International University: Miami, FL, USA, 2025; 39p. [Google Scholar]
- Khodayari AMantawy, I.M.; Azizinamini, A. Experimental and Numerical Investigation of Prefabricated Concrete Barrier Systems Using Ultra-High-Performance Concrete. Transp. Res. Rec. 2023, 2677, 624–634. [Google Scholar] [CrossRef]
- Rostami, M.; Sennah, K.; Azimi, H.; Afefy, H. Behavior and design of GFRP bar adhesive anchors under direct tension for deteriorated concrete bridge barrier replacement. Adv. Struct. Eng. 2025. [Google Scholar] [CrossRef]
- Azimi, H.; Sennah, K.; Tropynina, E.; Goremykin, S.; Lucic, S.; Lam, M. Anchorage Capacity of Concrete Bridge Barriers Reinforced with GFRP Bars with Headed Ends. ASCE J. Bridge Eng. 2014, 19, 1–15. [Google Scholar] [CrossRef]
- CAN/CSA-S6:19; Canadian Highway Bridge Design Code. Canadian Standards Association: Toronto, ON, Canada, 2019.
- Diab, A.; Sennah, K.; Rostami, M.; Dervishhasani, G.; Sayed Ahmed, M. Development of live load moment and tension force in bridge deck slab overhang due to transverse vehicle impact for CHBDC 2025. In Proceedings of the CSCE Annual Conference, Niagara Falls, ON, Canada, 5–7 June 2024. [Google Scholar]
- Omar, O. Investigation of Moment and Tension Force in Bridge Deck Slab Overhang in Slab-on-Girder Bridge Due to Traffic Loading; M.Eng. Project Report; Civil Engineering Department, Toronto Metropolitan University: Toronto, ON, Canada, 2024. [Google Scholar]
- MTO. Structural Manual; Ministry of Transportation Ontario, Transportation Infrastructure Management Division, Standards and Contracts Branch Structures Office: Ontario, ON, Canada, 2018. [Google Scholar]
- Hilti Canada Corporation. HIT-RE 500 V3 Epoxy Adhesive Anchoring System. In North American Product Technical Guide—Volume 2: Anchor Fastening Technical Guide, 17th ed.; Hilti Corporation: Tulsa, OK, USA, 2016. [Google Scholar]
- CSA-S807:18; Specification for Fibre Reinforced Polymers. Canadian Standard Association: Toronto, ON, Canada, 2018.
- B&B FRP Manufacturing Inc. MST-BAR® GIII Material Specification. B&B Manufacturing Inc. 2016. Available online: https://www.bandbfrp.com/ (accessed on 23 November 2016).
- Nilsson, I.H.E.; Losberg, A. Reinforced concrete corners and joints subjected to bending moment. J. Struct. Div. 1976, 102, 1229–1254. [Google Scholar] [CrossRef]
- CAN/CSA-A23.3:24; Design of Concrete Structures. Canadian Standards Association: Toronto, ON, Canada, 2024.
- D'Antino, T.; Pisani, M.A.; Poggi, C. Effect of the Environment on the Performance of GFRP Reinforcing Bars. Compos. Part B Eng. 2018, 141, 123–136. [Google Scholar] [CrossRef]
- AASHTO. AASHTO LRFD Bridge Design Guide Specifications for GFRP-Reinforced Concrete; American Association of State Highway and Building Officials (AASHTO): Washington, DC, USA, 2018. [Google Scholar]
- Benmokrane, B.; Brown, V.L.; Ali, A.; Mohamed, K.; Shield, C. A Reconsideration of the Environmental Reduction Factor CE for GFRP Reinforcing Bars. ASCE J. Compos. Constr. 2020, 24, 06020001. [Google Scholar] [CrossRef]
- ACI 440.1R-24; Guide for the Design and Construction of Structural Concrete Reinforced with Fiber-Reinforced Polymer (FRP) Bars. American Concrete Institute: Chicago, CA, USA, 2024.
- ASTM E488/E488M-15; Standard Test Methods for Strength of Anchors in Concrete Elements. American Society for Testing and Materials: Pennsylvania, PA, USA, 2015.


| Specimen | Average Compressive Strength (MPa) | Characteristic Value (MPa) | ||
|---|---|---|---|---|
| Deck Slab | Barrier Wall | Deck Slab | Barrier Wall | |
| B-1 | 46.65 | 37.12 | ||
| B-2 | 52.46 | 43.27 | ||
| B-3 | 46.39 | 39.40 | ||
| B-4 | 51.80 | 43.57 | ||
| B-5 | 47.59 | 47.91 | 37.91 | 40.35 |
| B-6 | 50.47 | 46.34 | 39.05 | 38.07 |
| 2-Day Cure Bond Strength (MPa) | Compressive Strength (MPa) | Compressive Modulus (MPa) | 7 Day Tensile Strength (MPa) | Elongation at Break (%) | Absorption (%) |
|---|---|---|---|---|---|
| 10.8 | 82.7 | 2600 | 49.3 | 1.1 | 0.18 |
| Criteria | Specimen | |||||
|---|---|---|---|---|---|---|
| B-1 | B-2 | B-3 | B-4 | B-5 | B-6 | |
| Experimental failure load (kN) | 169 | 183 | 130 | 163 | 160 | 187 |
| Experimental failure load per meter (kN/m) | 187 | 203 | 144 | 182 | 178 | 208 |
| Experimental resisting moment per meter (kN.m/m) | 186 | 201 | 143 | 180 | 176 | 205 |
| Developed design moment per meter (kN.m/m) | 123 * | 144 * | 103 ** | 126 ** | 123 * | 144 * |
| Capacity/demand ratio in design (experimental failure moment/ developed design moment) | 1.51 | 1.40 | 1.38 | 1.43 | 1.43 | 1.42 |
| Capacity/demand ratio using 0.85 environmental reduction factor | 1.28 | 1.19 | 1.17 | 1.22 | 1.22 | 1.21 |
| Top front displacement (mm) | 26.32 | 23.74 | 44.75 | 66.76 | 8.92 | 11.28 |
| Bottom back displacement (mm) | 3.81 | 4.27 | 8.43 | 13.42 | 0.73 | 3.46 |
| Overhang deflection (mm) | - | - | 17.57 | 27.88 | - | - |
| Front uplift (mm) | 0.39 | 1.62 | 3.66 | 5.30 | 0.97 | 0.96 |
| GFRP micro-strain | 6504 | 4765 | 5802 | 5495 | 15,848 | 7226 |
| Concrete micro-strain | −818 | −868 | −688 | −1045 | −893 | −701 |
| Observed failure mechanism | GFRP-concrete anchorage | Diagonal shear in the wall | GFRP-concrete anchorage | GFRP-concrete anchorage | Concrete breakout | Diagonal shear in the wall |
| Type of Construction | Group | Embedment Length (mm) | No. | Failure Load (kN) | Average Failure Load (kN) | Type of Failure |
|---|---|---|---|---|---|---|
| Preinstalled bars | (1): GFRP bars with straight ends | 195 | A | 150.88 | 146.76 STDEV = 2.80 COV = 0.0193 | Bar crushing at the grip |
| B | 146.02 | Bar crushing at the grip | ||||
| C | 144.67 | Bar crushing at the grip | ||||
| D | 145.48 | Bar crushing at the grip | ||||
| (2): Headed-end GFRP bar | 247 | A | 157.89 | 153.5 STDEV = 8.46 COV = 0.0551 | Bar crushing at the grip | |
| B | 161.94 | Bar crushing at the grip | ||||
| C | 151.69 | Bar crushing at the grip | ||||
| D | 142.51 | Bar crushing at the grip | ||||
| (3): Headed-end GFRP bars with unbonded straight portion | 247 | A | 137.38 | 131.04 STDEV = 7.65 COV = 0.0583 | Bar slip from head | |
| B | 122.00 | Bar slip from head | ||||
| C | 137.38 | Bar slip from head | ||||
| D | 127.40 | Bar slip from head | ||||
| Postinstalled bars | (1): GFRP bars with straight ends | 150 | A | 158.70 | 141.9 STDEV = 26.48 COV = 0.1866 | Bar crushing at the grip |
| B | 146.83 | Bar crushing at the grip | ||||
| C | 158.97 | Bar slip | ||||
| D | 103.10 | Bar slip | ||||
| (2): GFRP bars with straight ends | 195 | A | 163.56 | 151.89 STDEV = 12.40 COV = 0.0817 | Bar slip, concrete cone breakout | |
| B | 153.58 | Bar crushing at the grip | ||||
| C | 156.01 | Bar crushing at the grip | ||||
| D | 134.41 | Bar slip |
Disclaimer/Publisher’s Note: The statements, opinions and data contained in all publications are solely those of the individual author(s) and contributor(s) and not of MDPI and/or the editor(s). MDPI and/or the editor(s) disclaim responsibility for any injury to people or property resulting from any ideas, methods, instructions or products referred to in the content. |
© 2025 by the authors. Licensee MDPI, Basel, Switzerland. This article is an open access article distributed under the terms and conditions of the Creative Commons Attribution (CC BY) license (https://creativecommons.org/licenses/by/4.0/).
Share and Cite
Dervishhasani, G.; Sennah, K.; Afefy, H.M.; Diab, A. Ultimate Capacity of a GFRP-Reinforced Concrete Bridge Barrier–Deck Anchorage Subjected to Transverse Loading. Appl. Sci. 2025, 15, 7771. https://doi.org/10.3390/app15147771
Dervishhasani G, Sennah K, Afefy HM, Diab A. Ultimate Capacity of a GFRP-Reinforced Concrete Bridge Barrier–Deck Anchorage Subjected to Transverse Loading. Applied Sciences. 2025; 15(14):7771. https://doi.org/10.3390/app15147771
Chicago/Turabian StyleDervishhasani, Gledis, Khaled Sennah, Hamdy M. Afefy, and Ahmed Diab. 2025. "Ultimate Capacity of a GFRP-Reinforced Concrete Bridge Barrier–Deck Anchorage Subjected to Transverse Loading" Applied Sciences 15, no. 14: 7771. https://doi.org/10.3390/app15147771
APA StyleDervishhasani, G., Sennah, K., Afefy, H. M., & Diab, A. (2025). Ultimate Capacity of a GFRP-Reinforced Concrete Bridge Barrier–Deck Anchorage Subjected to Transverse Loading. Applied Sciences, 15(14), 7771. https://doi.org/10.3390/app15147771