Article

Reliability and Validity of the Jumpster Accelerometer-Based App Compared to the Vertec When Completing a Countermovement Jump: An Examination of Field-Accessible Tools

by
Matthew E. Holman
1,* and
Christopher R. Harnish
2
1
Department of Kinesiology, Mary Baldwin University, Staunton, VA 24401, USA
2
Department of Pediatric Cardiology, Virginia Commonwealth University, Richmond, VA 23219, USA
*
Author to whom correspondence should be addressed.
Appl. Sci. 2025, 15(14), 7768; https://doi.org/10.3390/app15147768
Submission received: 30 May 2025 / Revised: 3 July 2025 / Accepted: 9 July 2025 / Published: 10 July 2025

Abstract

The reliability and validity of the Jumpster app was assessed via a comparison to the Vertec during a countermovement jump. Using both tools simultaneously, 36 participants completed 100 total jump trials. Validity was assessed using correlation and tolerance analyses. Reliability was assessed using 95% predictive intervals (PI95) and tolerance limits (TL95) between the measures, comparing the standard error of the measure (SEM) and coefficients of variation (CVs) for each tool and by examining the intraclass correlation coefficient (ICC 2,K; upper and lower 95% CI) comparing both tools. The Jumpster app was weakly related to the Vertec (r = 0.24; p < 0.01). The tolerance analysis showed a moderately strong proportional bias of the Jumpster app to the Vertec (r = 0.45; p < 0.01). While all data fell within the calculated PI95 ± TL95, the Jumpster app SEM (14.7 cm) and CV (40.30%) exceeded the Vertec SEM (3.57 cm) and CV (7.22%), and the ICC was 0.55 [0.79, −0.08]. These results paired with an overall app failure rate of 15.97% indicate that the Jumpster app is neither reliable nor valid for measuring the countermovement jump.

1. Introduction

Muscular power is an important aspect of health, fitness, and functional ability across the lifespan. For aging adults, the inability to produce power has been linked to an increased risk of falls and reduced functional capacity independent of other factors [1,2,3,4]. Deficits in muscular power are also becoming more common among children and adolescents, resulting in the impaired execution of fundamental movement skills (e.g., jumping and running), as well as a reduction in their overall health and well-being [5,6,7]. Therefore, simple methods to assess muscular power across the lifespan are necessary.
The vertical jump (VJ) has long been used to measure lower extremity power, as well as neuromuscular fatigue, within a variety of populations [8,9,10,11,12]. While most often used to assess young, athletic populations [11], the VJ has also been shown to be a simple, safe, and effective measurement among children and adolescents [7,9,13,14] as well as for older adults [8,10,12]. The methodology for VJ testing varies minimally, but the equipment and space needed for accurate measurements can limit its use, particularly in clinical settings. The “gold standard” tools used to assess VJ height generally require either in-ground force plates [15] and/or high-speed video analysis [16], neither of which are easily accessible in all settings or cost-conservative. The Vertec Vertical Jump Trainer (Sports Imports, Hilliard, OH, USA) has been shown to be valid and reliable when compared to both “gold standard” devices [15,17]; however, it too is expensive and requires significant ceiling clearances for proper use. As such, low-cost tools requiring minimal equipment would broaden the use of VJ height as a clinically relevant measure of overall fitness and lower extremity power.
The advent of smart phones has resulted in a range of new fitness apps in the last decade, including apps designed to measure the VJ. Arguably one of the most popular and well-studied mobile apps used to assess VJ is My Jump 2 (Carlos Balsalobre-Fernández, Spain), which is part of a suite of apps included in the My Jump Lab app (Carlos Balsalobre-Fernández, Spain). In a range of studies, various versions of this app have consistently been shown to possess high validity and reliability when compared to both the Vertec and electronic timing and video systems [18,19,20,21,22,23,24,25,26]. However, the My Jump Lab app’s cost may still be a barrier to some would-be adopters. More economical options include the What’s My Vertical? app (Andreas Rauh, USA) [27,28] and the JumPo 2 app (University of Brasilia, Lptf, Brazil) [29,30], both of which have also been shown to produce valid and reliable results. Compared to the My Jump 2 app, these options cost considerably less money; however, like the My Jump 2 app these more cost-effective tools also rely on the use of a properly arranged video camera native to the device running the app. This unfortunately adds another possible barrier to their use. To our knowledge, no free VJ apps relying on built-in smart phone accelerometers have been scientifically tested, making such assessments novel. The ability to use a free app that requires no outside help or special set-up procedures could broadly increase use of the VJ test in various clinical and non-clinical sport settings.
Therefore, the purpose of this study was to assess the validity and reliability of the free Jumpster app (version 1.1; Skyhawk Media, LLC, Palmdale, CA, USA) by comparing the VJ height results obtained during a countermovement jump (CMJ) to that of the Vertec, a common field-accessible tool. Based on pilot data, we hypothesized that the Jumpster app could provide moderate validity and reliability when compared to the Vertec when using appropriately standardized methods.

2. Materials and Methods

2.1. Participants

Our target sample size was determined using data from a similarly designed study published by Yingling et al. [21]. An analysis of these data in JMP (version 17.1; SAS Institute Inc., Cary, NC, USA) yielded a calculated power of approximately 80% with a sample size of 20 participants, while a sample size of 40 participants resulted in nearly 99% power. Given these results, the study team aimed to recruit 40 participants from the University student population via social media and word of mouth between 29 February 2024 and 31 March 2024. Apparently healthy men and women between the ages of 18 and 50 years were recruited for participation. Among those, individuals reporting any known medical condition that would preclude jumping activities, such as those who sustained a lower extremity injury in the past 6 months or those with a history of neurologic or lower extremity arthritic conditions, were excluded from engaging in the study. Each participant was informed of the purposes and requirements of the study prior to providing the study team with their written informed consent. All study methodologies were reviewed and approved by the University Institutional Review Board (IRB00004838FWA00008717IORG0004078).

2.2. Jump and Testing Procedures

Following consent and prior to testing, the study team measured each participant’s height and weight and captured basic demographic information. Next, participants were instructed on how to complete a standardized CMJ technique using the Vertec (Gen 2; Sports Imports, Hilliard, OH, USA) as previously outlined by Yingling et al. [21]. Briefly, in preparation of the jump, participants were advised to both simultaneously and freely flex their lower extremities in a deep squatting position while extending the upper extremities with the intention of producing maximal VJ height. These movements were then followed by forceful lower extremity extension and shoulder flexion as participants reached maximally towards the vanes of the Vertec. Following the instruction, each participant’s baseline vertical reach was determined. And while the Jumpster app developer suggested placing the phone (iPhone SE3; iOS 16.4; Apple, Inc., Cupertino, CA, USA) with the app running into each participant’s pocket, early pilot testing indicated that variable pocket sizes and depths provided inconsistent results. These issues resulted in several failed trials often paired with the phone partially or completely ejecting from participants’ pockets during pilot testing. To hopefully improve reliability of the Jumpster app, a harness with a small canvas pouch was placed around each participant’s waist; this provided a more secure and standardized method of holding the device to reduce excess movement and eliminate the possibility of ejection during testing. Participants were then instructed to execute at least three CMJ trials with 1 min rest breaks between each jump. In instances where the Jumpster app did not record data, up to two additional trials were permitted; however, if all original three trials were unsuccessful, then participants were dismissed, and their data would be removed for analysis. Just prior to the beginning of each trial, both the app and the Vertec were reset by the study team, and basic jumping instructions were provided again. Following each trial, data from both devices was recorded by a single member of the study team. No feedback on jump height or overall jump performance was provided to participants during testing.

2.3. Data Processing and Analysis

The Vertec data were measured in inches and converted to centimeters, with VJ height calculated by subtracting the baseline reach height from the measured jump height for each trial. The Jumpster app automatically provides users with a calculated VJ height in inches, which was also converted into centimeters; no additional calculations were necessary by the study team for the Jumpster app data. An overall failure rate for the mobile app (i.e., trials where no usable data were obtained) was also calculated across all participants and trials and presented as a percentage (total failed trials over total trials).
Only device-matched trials were used for the analysis, where trials with missing data for either measurement tool were discarded entirely. Data for both measurement tools were independently assessed for normality using the Shapiro–Wilk test. Next, descriptive statistics were calculated for the participant age, height, weight, maximum Vertec jump height, and maximum Jumpster jump height. Independent samples Welch’s t-tests were also conducted for these variables to assess possible differences between men and women.
As previously outlined, several analysis tools are helpful in determining the validity and reliability of different measures or devices [31,32]. Our assessment of validity began by measuring the relationship between the measured jump heights captured with both the Vertec and the Jumpster using a correlation analysis and visually comparing the line of equality to the calculated regression line. The relative orientation of both lines provides additional insights into the validity of any significant relationship. Next, a tolerance analysis (similar to a Bland–Altman analysis) accounting for intraparticipant correlations in the model structure was conducted to assess possible measurement bias between the two tools using the SimplyAgree package (version 0.2.0) in RStudio (version 2024.04.1 + 748; Posit Software, PBC, Boston, MA, USA) [33,34]. To provide contextually-relevant absolute bounds of measurement error, we also established acceptable limits of variability based on our calculated standard error of the measure (SEM) for the Vertec data (outlined below) and overlaid these results on a Bland–Altman styled plot as another means of assessing overall tool validity [31].
Reliability was first assessed in absolute terms by calculating the 95% predictive intervals (PI95s) and tolerance limits (TL95s) between the two measures (similar to Bland–Altman limits of agreement ±95% CI) [33,34]. Additional assessments of absolute reliability were also conducted by calculating the SEM and coefficient of variation (CV) for both tools using mean square error estimations, again with the SimplyAgree package [33,35]. Finally, relative reliability was assessed by estimating the intraclass correlation coefficient and 95% confidence intervals between the Vertec and the Jumpster app, based on a 2-way random effects, mean rating, absolute agreement model (ICC 2,K) [33,35,36]. This was also calculated using the mean square error estimations in the SimplyAgree package. All data were analyzed using RStudio (α = 0.05).

3. Results

3.1. Participant Details

In total, 38 participants were recruited, all of whom were able to complete testing without difficulty. However, the Jumpster app failed across all trials for 2 participants resulting in their data being removed entirely for the analysis. Among the remaining 36 participants, an additional 13 app failures were logged resulting in individual trial data across 9 individuals also being removed for analysis. An overall app failure rate of 15.97% was catalogued. Despite multiple app failures, members of the study team only provided 3 participants with an additional fourth trial and 1 participant with 2 additional trials (a fourth and fifth trial). Even with this inconsistency, all participants successfully completed on average 2.8 trials with both tools simultaneously (at least 2 trials per individual), resulting in 100 successful matched trials for analysis. These data were normally distributed, and the analysis proceeded as planned. As outlined in Table 1, when compared to women, men were significantly taller (p < 0.01) and heavier (p < 0.01); however, both groups were similarly aged (p = 0.06). Additionally, men were able to achieve significantly greater maximum jump heights when measured using the Vertec (see Table 1; p < 0.01); no such differences were observed with the Jumpster app (p = 0.25).

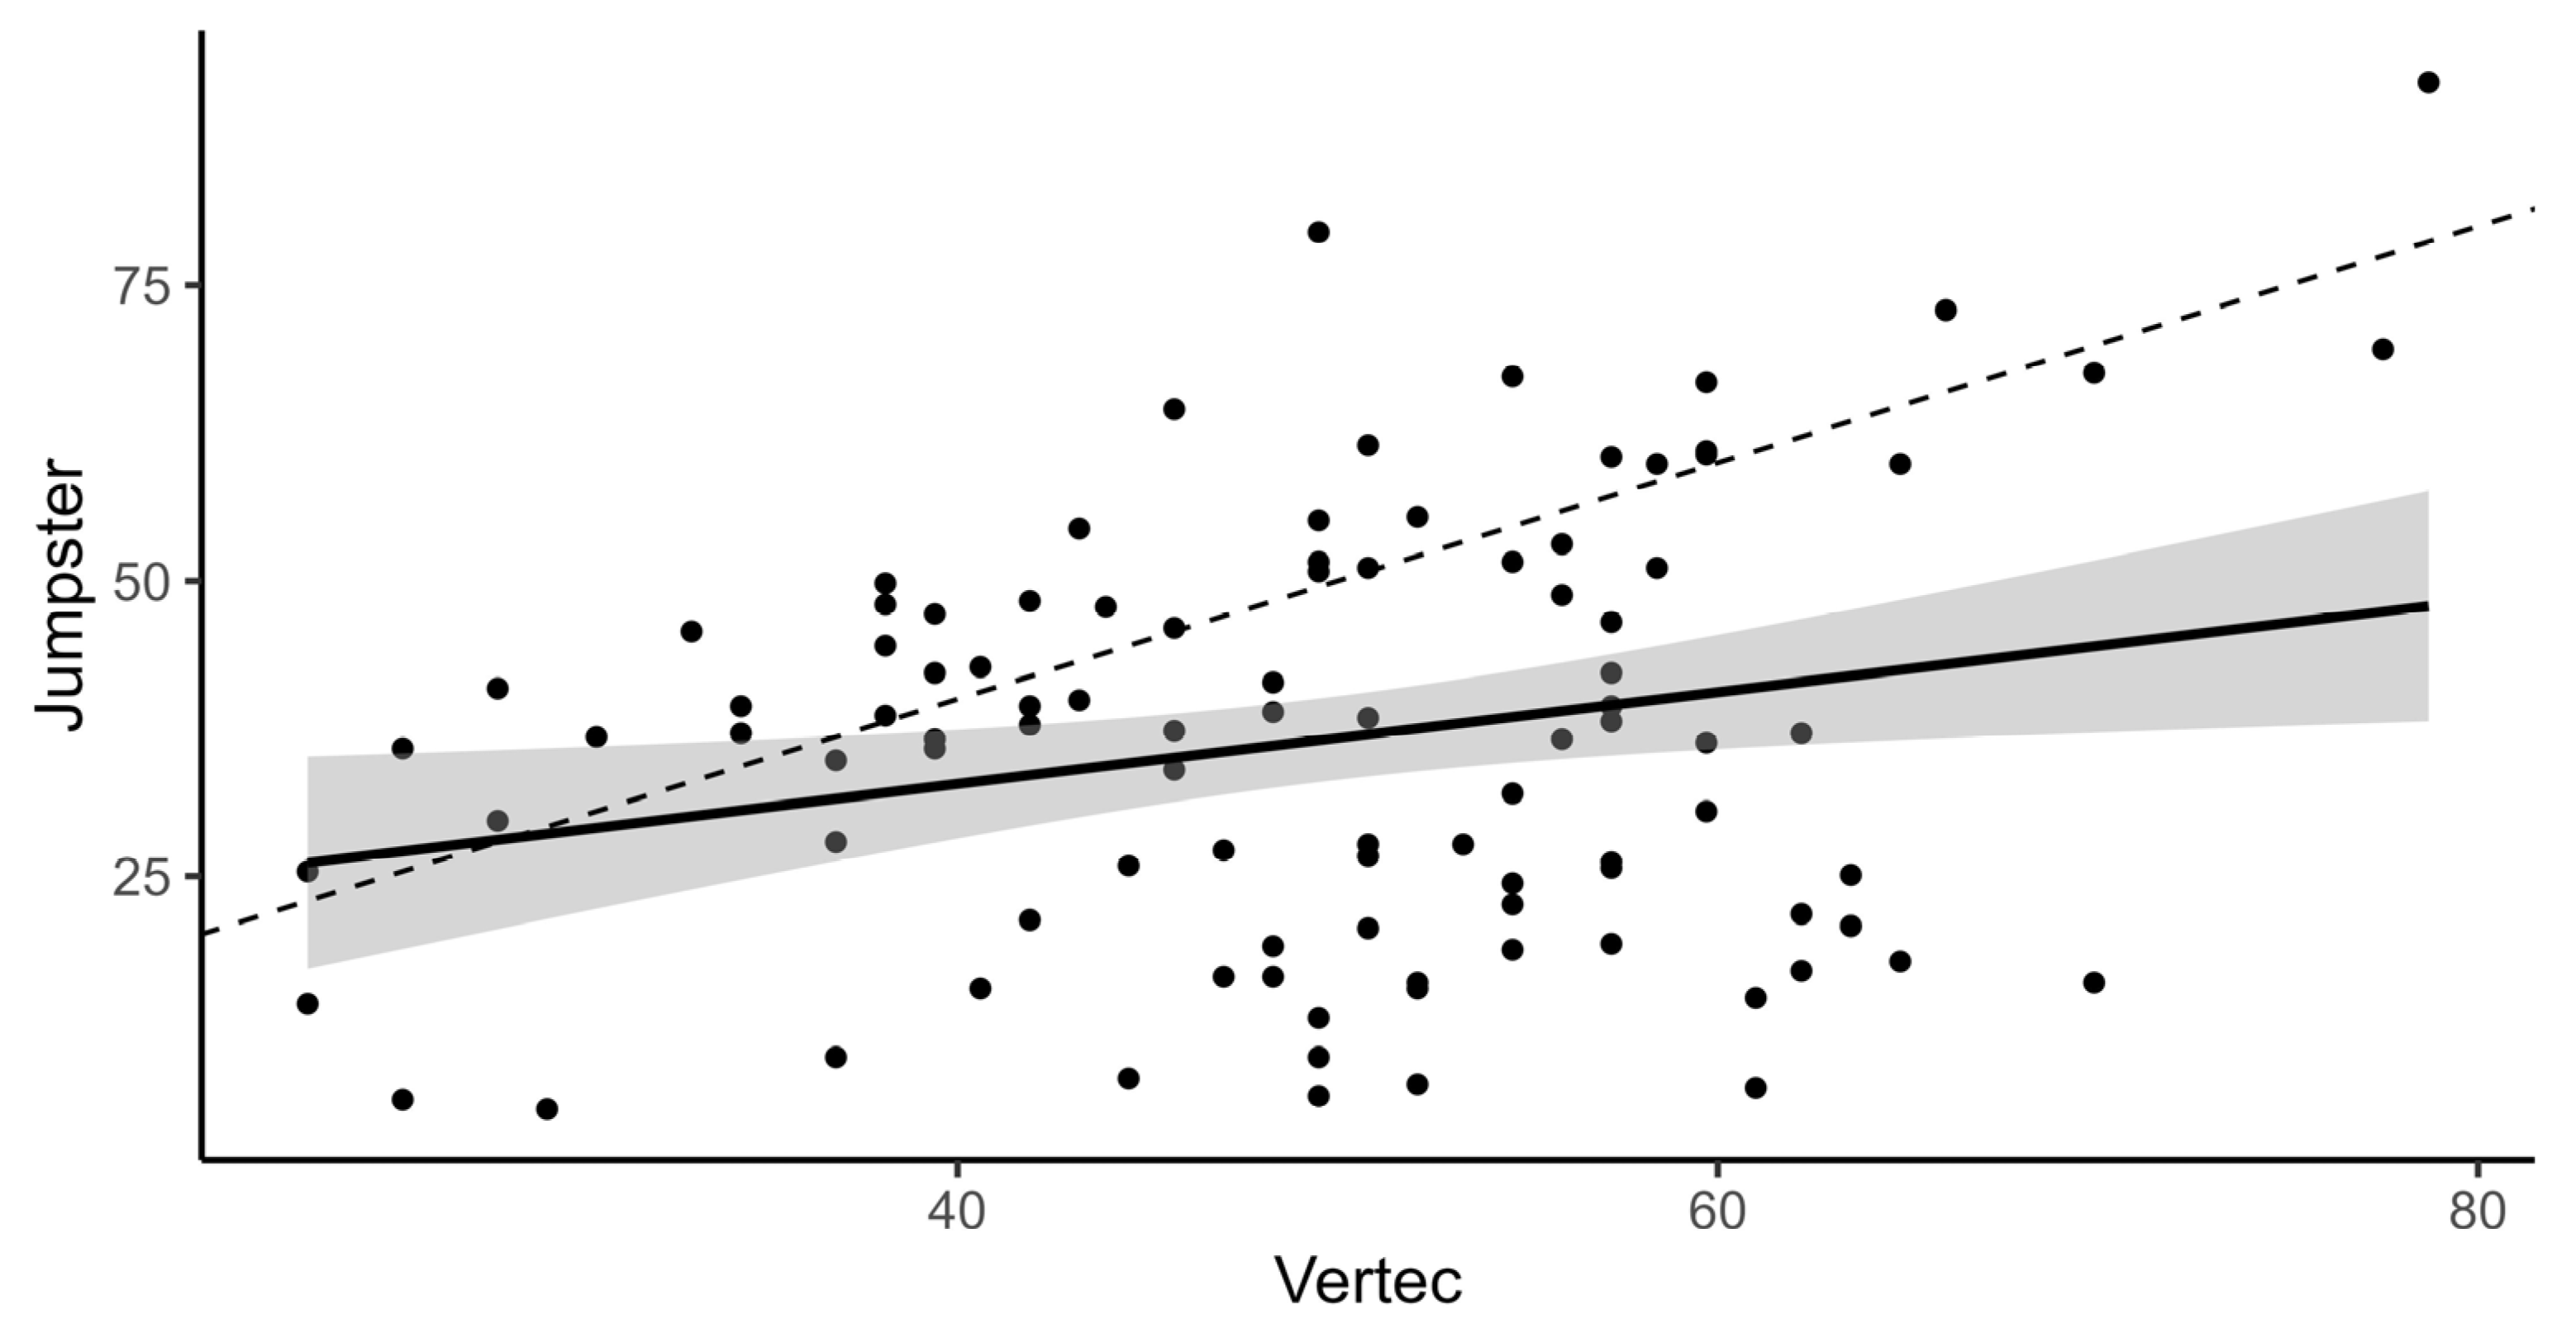
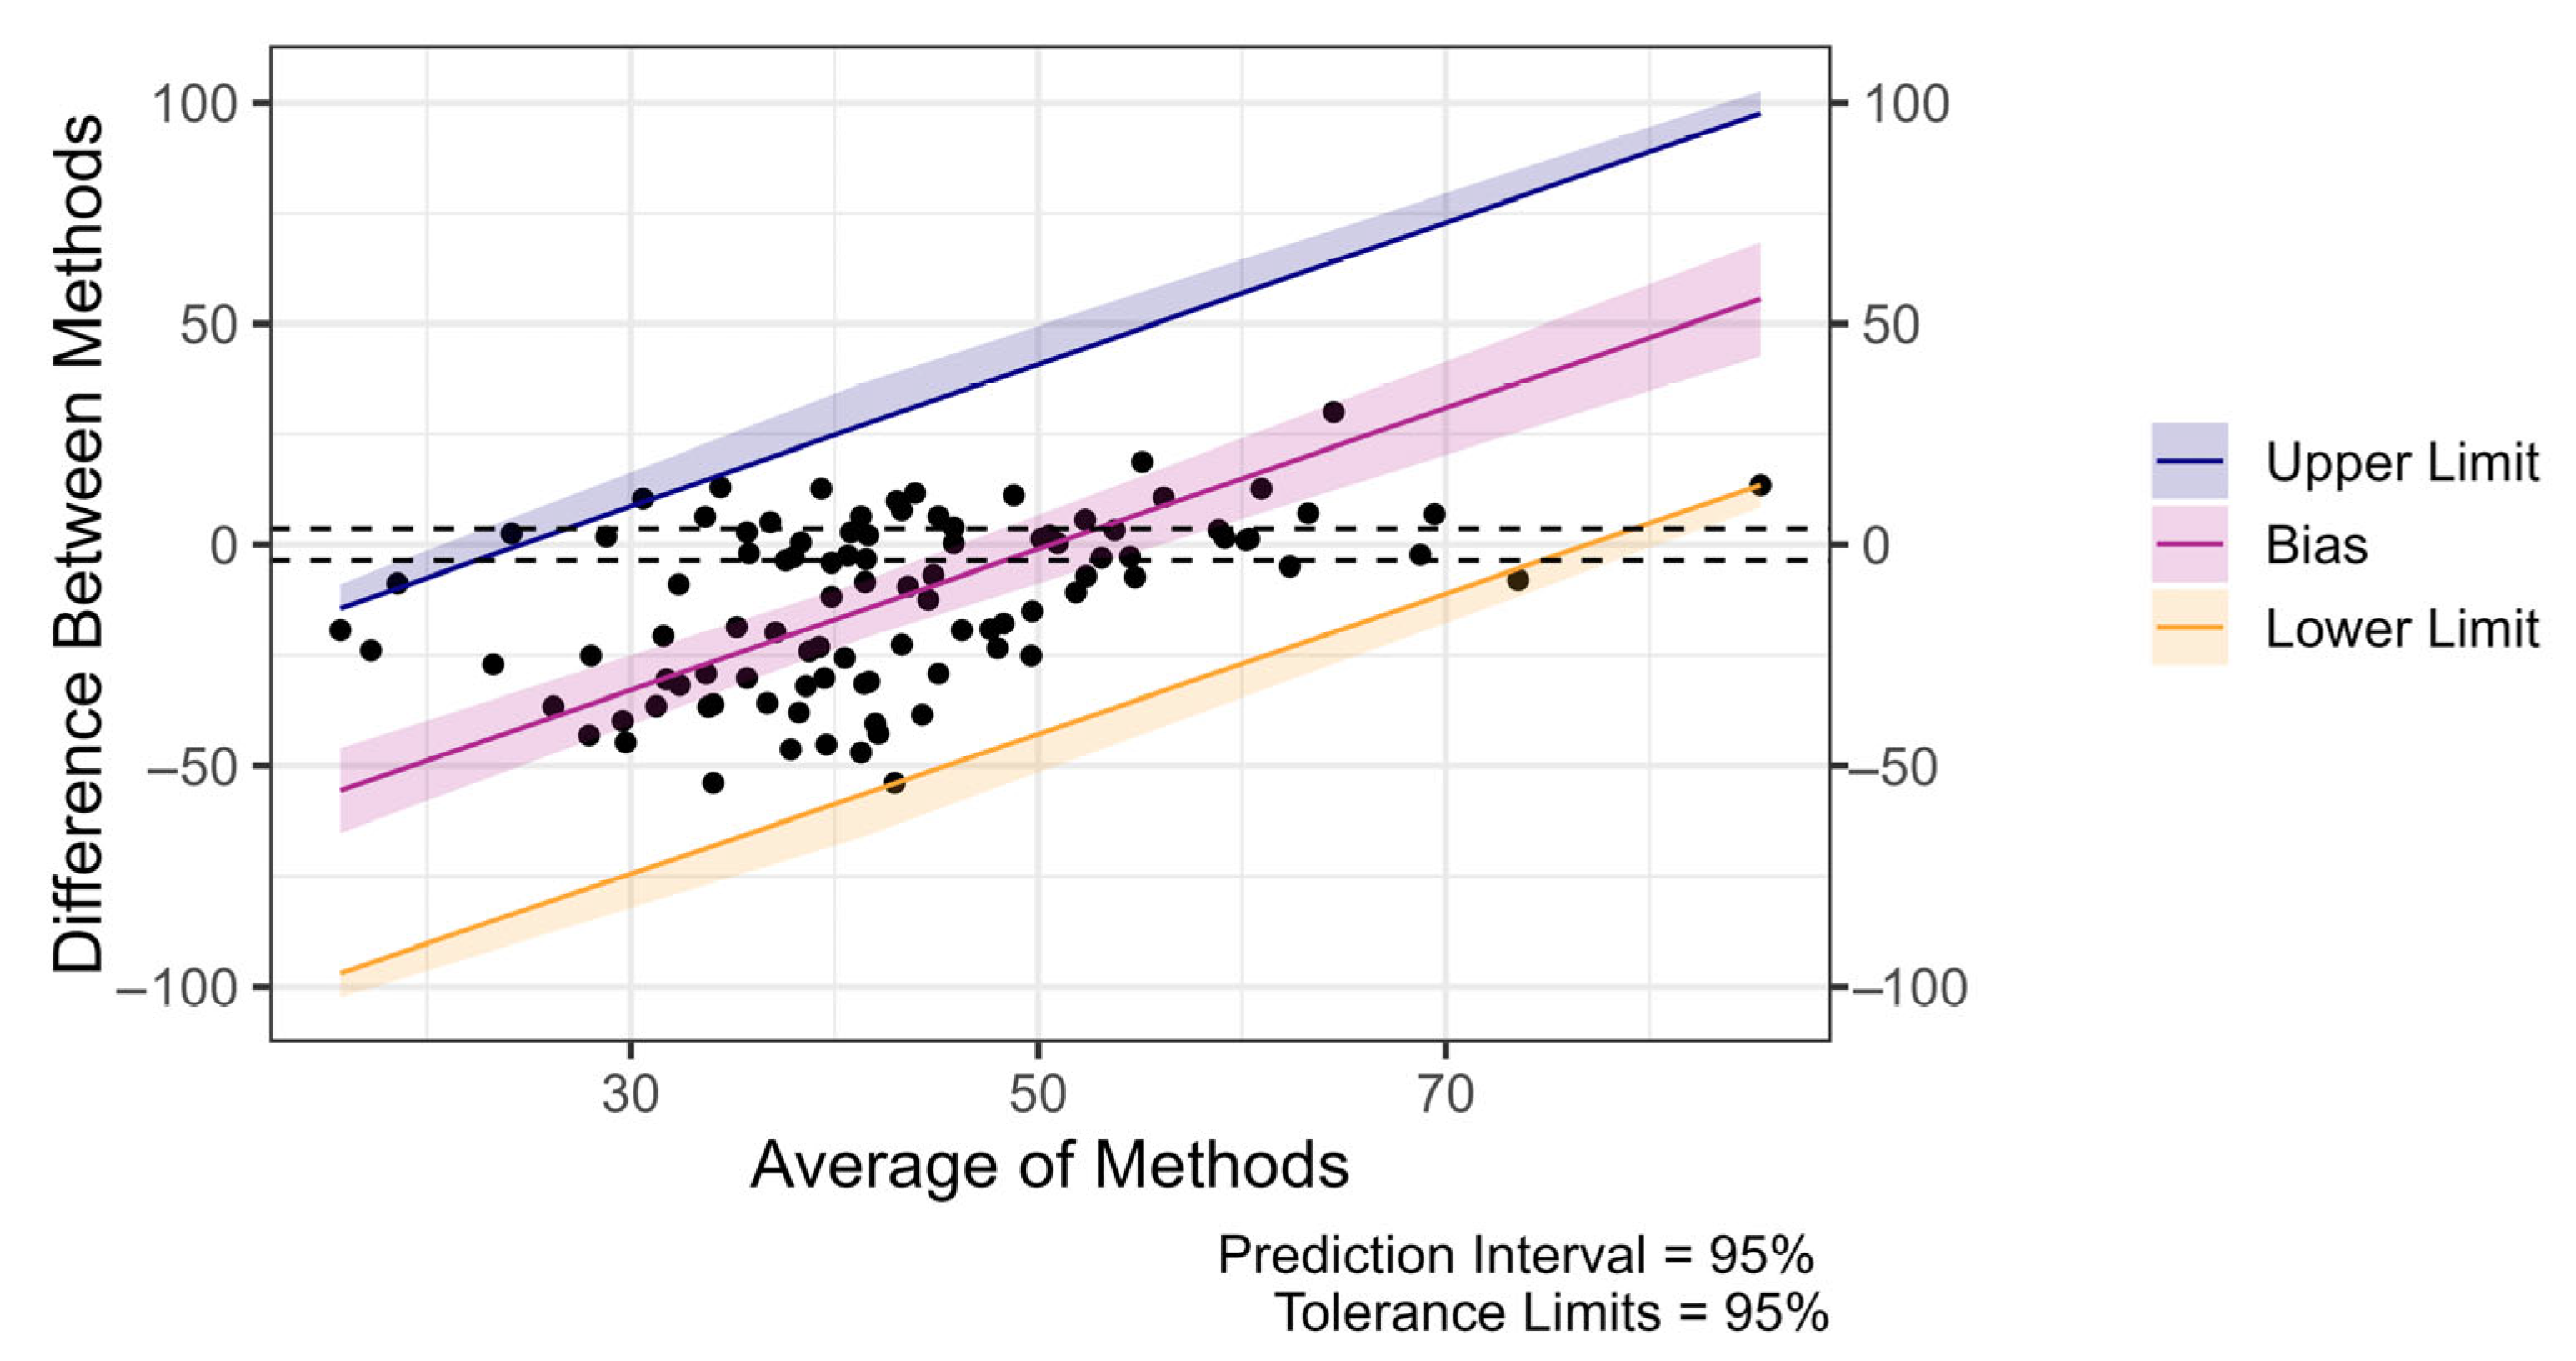
3.2. Validity Results

A significant, but weak, positive relationship was observed between the two measurement tools (r = 0.24, p = 0.01; see Figure 1). Additionally, the regression line crossed the line of equality likely indicating a proportional bias [37]. A significant, moderately strong positive relationship was observed when the data were fitted to a Bland–Altman styled plot (r = 0.45; p < 0.01; see Figure 2); the tolerance model was adjusted for this proportional bias. The resulting proportional bias had a slope [±95% CI] of 1.59 [±0.06] and intercept [±95% CI] of −80.73 [±6.94] cm. Based on the acceptable limits of variability for the Vertec (±3.57 cm), the Jumpster app generally underestimated jump height when compared to the Vertec below a height of ~ 48.0–53.0 cm and overestimated jump height beyond that range.

3.3. Reliability Results

Bland–Altman plots fell within the calculated PI95[±TL95] (upper: slope:1.61[+0.02], intercept: −39.54[+7.49] cm; lower: slope:1.58[−0.02], intercept: −21.92[−7.49] cm). However, the SEM and CV of the Vertec (SEM: 3.57 cm; CV: 7.22%) were both smaller than the Jumpster (SEM: 14.70 cm; CV: 40.30%), indicating poor reliability of the Jumpster app when compared to the Vertc. Likewise, the estimated ICC [upper and lower 95% CI] between the two devices was assessed to be 0.55 [0.79, −0.08].

4. Discussion

To our knowledge, this is the first study to examine if the Jumpster app, which relies on the built-in accelerometer of a smart phone, provides comparable results to the Vertec Vertical Jump Trainer system in assessing CMJ height. Based on prior pilot data, we hypothesized that the Jumpster app would prove to be moderately reliable and valid compared to the Vertec. Unfortunately, with an overall failure rate just over 15% and significantly greater internal and external inconsistency (when compared to itself and the Vertec respectively), our results indicate that the app is neither reliable nor valid.
When measuring jump height, one expects that different devices will provide similar (i.e., non-significantly different) results that are closely correlated to each other. In our study, the Jumpster app failed to show the significantly lower jump height for women that was measured by the Vertec. Moreover, the weak correlation between the two device measures paired with comparisons of our assessed proportional bias to the Vertec limits of variability all indicate poor validity of the Jumpster app. Absolute reliability appears similarly impaired, noting a more than 4-fold larger SEM and CV for the Jumpster app. A close inspection of these data indicates that the app underestimates on the low-end of the scale and overestimates on the high-end of the VJ height scale. Whether such data clustering is random or indicative of our specific study population is, however, beyond the scope of this work. And while the ICC value (0.55) initially indicated at least moderate relative reliability of the Jumpster app when compared to the Vertec, the wide 95% CIs (upper bound: 0.79; lower bound: −0.08) immediately undercut this interpretation providing additional evidence that the app is not reliable. These combined results lead us to discourage the use of the Jumpster app at this time to assess VJ height as it was found to be invalid and unreliable with each planned analysis utilized in this study.
While there is a continuing need in sports science to innovate simple and affordable field tools to measure performance, it is essential that such devices are adequately reliable and valid. A significant body of literature exists for movement scientists to endorse the use of various video-based VJ apps [19,20,21,22,23,24,25]. The relative “gold standard” among this class of VJ apps appears to be My Jump 2, which was developed more than a decade ago. This app relies on positioning a smart phone, iPad, or Mac computer to record live video with a native camera, allowing users to ascertain flight time, which is then used to calculate jump height [23]. In a recent meta-analysis, Gencoglu et al. [23] synthesized 21 studies consisting of 839 participants and revealed a high level of agreement between the My Jump app and criterion measures with near perfect reliability. More recent data using the What’s My Vertical? and Jumpo apps have also shown good validity and high reliability. In contrast, the Jumpster app relies on indwelling accelerometers and is advertised as an accurate and easy to use tool, allowing one to simply slip their phone in their pocket and measure their VJ. Our study was designed to test the app under more rigorous standardized conditions with a more secure harness than would be used in the field. Despite these efforts, the app failed to produce either reliable or valid results.
As noted in our methods, during pilot testing, placing the phone in a pocket could produce excess movement or involuntarily ejection of the phone, so a more uniform restraint was employed, which itself needed to be further secured after some additional pilot test failures. Even after minimizing these extra movements of the device, the app proved unsuccessful in producing any result several times during the study. The initial question of whether the accelerometers in the iPhone are valid and reliable was posed. Smart-phone-based accelerometers have been shown to be reliable and valid for assessments of walking [38], running [39], weight lifting [40], and even jumping [41] activities. In the latter study, Mateos-Angulo et al. [41] used the xSensor Pro app (Crossbow Technology, Inc., Milpitas, CA, USA; no longer available) to obtain direct acceleration data to then calculate jump time and height, comparable to the My Jump 2 app. Similarly, a study examining the bench press noted only moderate reliability and validity when measuring the lifting velocity, which was still far better than we were able to achieve when assessing VJ height during a CMJ [40]. The authors however point to possible explanations for our poor results, noting that an assessment of the accelerometer data by an app is highly dependent on both the calibration of the device and/or the algorithm used to interpret it. Thus, we surmise that the iPhone hardware likely captures the target data accurately, but the Jumpster app fails to accurately or reliably filter “noise” and/or interpret the data correctly.

Limitations and Future Directions

This study is not without its limitations. First, and as noted earlier, the Vertec is not considered a “gold standard” tool for measuring jump height (such as in-floor force plates or camera systems) and has consistently been observed to underestimate jump height when compared to these criterion measures [15,17]. However, as an alternative field-accessible tool, the Vertec can be regarded as both valid and reliable, which was further supported by our data [21]. Future studies could consider such “gold standard” comparisons; however, as our results indicate that the Jumpster app is an invalid and unreliable tool when compared to a commonly employed field tool with known standard results, such criterion measure assessments would be questionably reasonable or necessary. Another potential limitation for this study is the use of a harness and canvas pouch to support the phone rather than simply using the user’s pocket as suggested by the app designer. However, as noted earlier, the pocket proved to be a worse option in pilot testing and thus a more secure method was used. One common limitation for studies such as this is the question of learning across trials. However, recent research indicates that reliability may not be affected by short-term learning effects in similar populations [42]. Additionally, our methods were largely agnostic to within-subject differences across trials as device-matched trials were primarily compared. Another possible limitation was observable in our plots, which suggest that data clustered around both high and low jump heights may have impacted our calculated relationships and CIs. Similarly, as other researchers have noted, the effects of age, muscle mass, and training (among other factors) on jump height, the fairly uniform age, unknown anthropometrics, and unknown training status of our participants could have influenced our results [43,44,45,46]. Future studies may consider examining whether the Jumpster app could produce more reliable or valid results for individuals with specifically high or low jump heights due to various causes to address these limitations.

5. Conclusions

Compared to the Vertec VJ measurement tool, the iPhone accelerometer based Jumpster app failed to produce reliable or valid results in a cohort of young men and women completing a CMJ. The authors recommend that individuals and researchers rely on the more proven video-based analysis tools for VJ assessments if a mobile app is desired over more traditional field-accessible tools like the Vertec. More research and development is necessary for the application of accelerometer-based sports performance apps within sport or clinical settings when assessing VJ height and, by proxy, functional lower extremity muscular power. This research can also be used to assist in the design of future accelerometer-based app algorithms and methodologies that will need to agree with current “gold standard” tools (e.g., force plates, high-speed camera systems, and camera-based apps) in their assessment of VJ height prior to adoption over other field tests.

Author Contributions

Conceptualization, M.E.H. and C.R.H.; Methodology, M.E.H. and C.R.H.; Formal analysis, M.E.H. and C.R.H.; Data curation, M.E.H. and C.R.H.; Writing—original draft, M.E.H. and C.R.H.; Writing—review & editing, M.E.H. and C.R.H.; Project administration, M.E.H. and C.R.H. All authors have read and agreed to the published version of the manuscript.

Funding

This research received no external funding.

Institutional Review Board Statement

The study was conducted in accordance with the Declaration of Helsinki and approved by the Institutional Review Board of Mary Baldwin University (IRB00004838FWA00008717IORG0004078) on 27 February 2024.

Informed Consent Statement

Informed consent was obtained from all subjects involved in the study.

Data Availability Statement

The data that support the findings of this study are available in an online repository: https://osf.io/zaqgk/# (accessed on 30 September 2024).

Acknowledgments

We would like to acknowledge both John Ward and Brenna Kehoe for their help in collecting our data and compiling the literature for this research. We would also like to thank Aaron Caldwell for his correspondence and assistance with using the SimplyAgree package in R.

Conflicts of Interest

The authors declare no conflicts of interest.

Abbreviations

The following abbreviations are used in this manuscript:
VJVertical jump
CMJCountermovement jump
SEMStandard error of the measure
PI9595% predictive intervals
TL9595% tolerance limits
CVCoefficient of variation
ICC 2,KIntraclass correlation coefficient
CIConfidence interval

References

  1. Trombetti, A.; Reid, K.F.; Hars, M.; Herrmann, F.R.; Pasha, E.; Phillips, E.M.; Fielding, R.A. Age-associated declines in muscle mass, strength, power, and physical performance: Impact on fear of falling and quality of life. Osteoporos. Int. 2016, 27, 463–471. [Google Scholar] [CrossRef]
  2. Alcazar, J.; Aagaard, P.; Haddock, B.; Kamper, R.S.; Hansen, S.K.; Prescott, E.; Alegre, L.M.; Frandsen, U.; Suetta, C. Age- and sex-specific changes in lower-limb muscle power throughout the lifespan. J. Gerontol. Ser. A 2020, 75, 1369–1378. [Google Scholar] [CrossRef]
  3. Shur, N.F.; Creedon, L.; Skirrow, S.; Atherton, P.J.; MacDonald, I.A.; Lund, J.; Greenhaff, P.L. Age-related changes in muscle architecture and metabolism in humans: The likely contribution of physical inactivity to age-related functional decline. Ageing Res. Rev. 2021, 68, 101344. [Google Scholar] [CrossRef]
  4. Runge, M.; Rittweger, J.; Russo, C.R.; Schiessl, H.; Felsenberg, D. Is muscle power output a key factor in the age-related decline in physical performance? A comparison of muscle cross section, chair-rising test and jumping power. Clin. Physiol. Funct. Imaging 2004, 24, 335–340. [Google Scholar] [CrossRef]
  5. Faigenbaum, A.D.; MacDonald, J.P. Dynapenia: It’s not just for grown-ups anymore. Acta Paediatr. 2017, 106, 696–697. [Google Scholar] [CrossRef]
  6. Faigenbaum, A.D.; Ratamess, N.A.; Kang, J.; Bush, J.A.; Rebullido, T.R. May the force be with youth: Foundational strength for lifelong development. Curr. Sports Med. Rep. 2023, 22, 414–422. [Google Scholar] [CrossRef]
  7. Katartzi, E.; Gantiraga, E.; Komsis, G. The relationship between specific strength components of lovver limbs and vertical jumping ability in school-aged children. J. Hum. Mov. Stud 2005, 48, 227–243. [Google Scholar]
  8. Argaud, S.; Pairot De Fontenay, B.; Blache, Y.; Monteil, K. Explosive movement in the older men: Analysis and comparative study of vertical jump. Aging Clin. Exp. Res. 2017, 29, 985–992. [Google Scholar] [CrossRef]
  9. Baptista, F.; Zymbal, V.; Janz, K.F. Predictive validity of handgrip strength, vertical jump power, and plank time in the identification of pediatric sarcopenia. Meas. Phys. Educ. Exerc. Sci. 2022, 26, 361–370. [Google Scholar] [CrossRef]
  10. Santos, C.A.F.; Amirato, G.R.; Jacinto, A.F.; Pedrosa, A.V.; Caldo-Silva, A.; Sampaio, A.R.; Pimenta, N.; Santos, J.M.B.; Pochini, A.; Bachi, A.L.L. Vertical jump tests: A safe instrument to improve the accuracy of the functional capacity assessment in robust older women. Healthcare 2022, 10, 323. [Google Scholar] [CrossRef]
  11. Pupo, J.D.; Ache-Dias, J.; Kons, R.L.; Detanico, D. Are vertical jump height and power output correlated to physical performance in different sports? An allometric approach. Hum. Mov. 2020, 22, 60–67. [Google Scholar] [CrossRef]
  12. Forte, R.; Macaluso, A. Relationship between performance-based and laboratory tests for lower-limb muscle strength and power assessment in healthy older women. J. Sports Sci. 2008, 26, 1431–1436. [Google Scholar] [CrossRef] [PubMed]
  13. Temfemo, A.; Hugues, J.; Chardon, K.; Mandengue, S.-H.; Ahmaidi, S. Relationship between vertical jumping performance and anthropometric characteristics during growth in boys and girls. Eur. J. Pediatr. 2009, 168, 457–464. [Google Scholar] [CrossRef] [PubMed]
  14. Stojanović, D.; Savić, Z.; Vidaković, H.M.; Stojanović, T.; Momčilović, Z.; Stojanović, T. Relationship between body composition and vertical jump performance among adolescents. Acta Medica Median. 2020, 59, 64–70. [Google Scholar] [CrossRef]
  15. Buckthorpe, M.; Morris, J.; Folland, J.P. Validity of vertical jump measurement devices. J. Sports Sci. 2012, 30, 63–69. [Google Scholar] [CrossRef]
  16. Dias, J.A.; Pupo, J.D.; Reis, D.C.; Borges, L.; Santos, S.G.; Moro, A.R.; Borges, N.G. Validity of two methods for estimation of vertical jump height. J. Strength Cond. Res. 2011, 25, 2034–2039. [Google Scholar] [CrossRef]
  17. Leard, J.S.; Cirillo, M.A.; Katsnelson, E.; Kimiatek, D.A.; Miller, T.W.; Trebincevic, K.; Garbalosa, J.C. Validity of two alternative systems for measuring vertical jump height. J. Strength Cond. Res. 2007, 21, 1296–1299. [Google Scholar]
  18. Bogataj, Š.; Pajek, M.; Hadžić, V.; Andrašić, S.; Padulo, J.; Trajković, N. Validity, reliability, and usefulness of My Jump 2 app for measuring vertical jump in primary school children. Int. J. Environ. Res. Public Health 2020, 17, 3708. [Google Scholar] [CrossRef]
  19. Gallardo-Fuentes, F.; Gallardo-Fuentes, J.; Ramírez-Campillo, R.; Balsalobre-Fernández, C.; Martínez, C.; Caniuqueo, A.; Cañas, R.; Banzer, W.; Loturco, I.; Nakamura, F.Y.; et al. Intersession and intrasession reliability and validity of the My Jump App for measuring different jump actions in trained male and female athletes. J. Strength Cond. Res. 2016, 30, 2049–2056. [Google Scholar] [CrossRef]
  20. Stanton, R.; Kean, C.O.; Scanlan, A.T. My Jump for vertical jump assessment. Br. J. Sports Med. 2015, 49, 1157–1158. [Google Scholar] [CrossRef]
  21. Yingling, V.R.; Castro, D.A.; Duong, J.T.; Malpartida, F.J.; Usher, J.R.; O, J. The reliability of vertical jump tests between the Vertec and My Jump phone application. PeerJ 2018, 6, e4669. [Google Scholar] [CrossRef] [PubMed]
  22. Cruvinel-Cabral, R.M.; Oliveira-Silva, I.; Medeiros, A.R.; Claudino, J.G.; Jiménez-Reyes, P.; Boullosa, D.A. The validity and reliability of the “My Jump App” for measuring jump height of the elderly. PeerJ 2018, 6, e5804. [Google Scholar] [CrossRef] [PubMed]
  23. Gençoğlu, C.; Ulupınar, S.; Özbay, S.; Turan, M.; Savaş, B.Ç.; Asan, S.; İnce, İ. Validity and reliability of “My Jump App” to assess vertical jump performance: A meta-analytic review. Sci. Rep. 2023, 13, 20137. [Google Scholar] [CrossRef] [PubMed]
  24. Oliveira-Silva, I.; Cruvinel-Cabral, R.M.; Medeiros, A.R.; Boullosa, D.A. Validity of My Jump App to measure vertical jump height of the elderly: 2484 Board #8 June 11. Med. Sci. Sports Exerc. 2018, 50, 615. [Google Scholar] [CrossRef]
  25. Bogataj, Š.; Pajek, M.; Andrašić, S.; Trajković, N. Concurrent validity and reliability of My Jump 2 App for measuring vertical jump height in recreationally active adults. Appl. Sci. 2020, 10, 3805. [Google Scholar] [CrossRef]
  26. Oh, D.-S.; Choi, Y.-H.; Shim, Y.-J.; Park, S.-H.; Lee, M.-M. Concurrent validity, inter-, and intrarater reliabilities of smart device based application for measuring vertical jump performance. Balt. J. Health Phys. Act. 2020, 12, 4. [Google Scholar] [CrossRef]
  27. Montalvo, S.; Gonzalez, M.P.; Dietze-Hermosa, M.S.; Eggleston, J.D.; Dorgo, S. Common vertical jump and reactive strength index measuring devices: A validity and reliability analysis. J. Strength Cond. Res. 2021, 35, 1234–1243. [Google Scholar] [CrossRef]
  28. Dow, M. Concurrent Validity and Reliability of Mobile Applications in Measuring Vertical Jump Performance. Bachelor’s Thesis, Point Loma Nazarene University, San Diego, CA, USA, 2019. [Google Scholar]
  29. Vieira, A.; Ribeiro, G.L.; Macedo, V.; De Araújo Rocha Junior, V.; Baptista, R.D.S.; Gonçalves, C.; Cunha, R.; Tufano, J. Evidence of validity and reliability of Jumpo 2 and MyJump 2 for estimating vertical jump variables. PeerJ 2023, 11, e14558. [Google Scholar] [CrossRef]
  30. Vieira, A.; Blazevich, A.J.; DA Costa, A.S.; Tufano, J.J.; Bottaro, M. Validity and test-retest reliability of the Jumpo app for jump performance measurement. Int. J. Exerc. Sci. 2021, 14, 677–686. [Google Scholar]
  31. Giavarina, D. Understanding Bland Altman analysis. Biochem. Medica 2015, 25, 141–151. [Google Scholar] [CrossRef]
  32. Van Stralen, K.J.; Dekker, F.W.; Zoccali, C.; Jager, K.J. Measuring agreement, more complicated than it seems. Nephron Clin. Pract. 2012, 120, c162–c167. [Google Scholar] [CrossRef] [PubMed]
  33. Caldwell, A.R. SimplyAgree: An R package and Jamovi module for simplifying agreement and reliability analyses. J. Open Source Softw. 2022, 7, 4148. [Google Scholar] [CrossRef]
  34. Francq, B.G.; Berger, M.; Boachie, C. To tolerate or to agree: A tutorial on tolerance intervals in method comparison studies with BivRegBLS R package. Stat. Med. 2020, 39, 4334–4349. [Google Scholar] [CrossRef]
  35. Weir, J.P. Quantifying test-retest reliability using the intraclass correlation coefficient and the SEM. J. Strength Cond. Res. 2005, 19, 231. [Google Scholar] [CrossRef] [PubMed]
  36. Koo, T.K.; Li, M.Y. A guideline of selecting and reporting intraclass correlation coefficients for reliability research. J. Chiropr. Med. 2016, 15, 155–163. [Google Scholar] [CrossRef]
  37. Coskun, A. bias in laboratory medicine: The dark side of the moon. Ann. Lab. Med. 2024, 44, 6–20. [Google Scholar] [CrossRef]
  38. Strongman, C.; Cavallerio, F.; Timmis, M.A.; Morrison, A. A scoping review of the validity and reliability of smartphone accelerometers when collecting kinematic gait data. Sensors 2023, 23, 8615. [Google Scholar] [CrossRef]
  39. Balsalobre-Fernández, C.; Agopyan, H.; Morin, J.-B. The validity and reliability of an iPhone app for measuring running mechanics. J. Appl. Biomech. 2017, 33, 222–226. [Google Scholar] [CrossRef]
  40. Peláez Barrajón, J.; San Juan, A.F. Validity and reliability of a smartphone accelerometer for measuring lift velocity in bench-press exercises. Sustainability 2020, 12, 2312. [Google Scholar] [CrossRef]
  41. Mateos-Angulo, A.; Galán-Mercant, A.; Cuesta-Vargas, A.I. Kinematic mobile drop jump analysis at different heights based on a smartphone inertial sensor. J. Hum. Kinet. 2020, 73, 57–65. [Google Scholar] [CrossRef]
  42. Cabarkapa, D.V.; Cabarkapa, D.; Aleksic, J.; Ranisavljev, I.; Fry, A.C. Does the short-term learning effect impact vertical jump performance assessment on a portable force plate system? Front. Sports Act. Living 2024, 6, 1441022. [Google Scholar] [CrossRef] [PubMed]
  43. Bchini, S.; Hammami, N.; Selmi, T.; Zalleg, D.; Bouassida, A. Influence of muscle volume on jumping performance in healthy male and female youth and young adults. BMC Sports Sci. Med. Rehabil. 2023, 15, 26. [Google Scholar] [CrossRef] [PubMed]
  44. Alvero-Cruz, J.R.; Brikis, M.; Chilibeck, P.; Frings-Meuthen, P.; Vico Guzmán, J.F.; Mittag, U.; Michely, S.; Mulder, E.; Tanaka, H.; Tank, J.; et al. Age-related decline in vertical jumping performance in masters track and field athletes: Concomitant influence of body composition. Front. Physiol. 2021, 12, 643649. [Google Scholar] [CrossRef] [PubMed]
  45. Sisneros, K.; Maurya, P.; Johnson, E.; Ford, B.; Palmer, T.Y. Age-related differences in vertical jump height and handgrip strength measurements. Acta Bioeng. Biomech. 2023, 25, 19–26. [Google Scholar] [CrossRef]
  46. Fernández-Peña, E.; Formiglio, E.; Gervasi, M.; Benelli, P.; Bertuccioli, A.; Russo, G.; Giustino, V.; Patti, A. The impact of track and field training on dynapenia: Gender differences in age-related decline of vertical jump performance among older adults. Front. Aging 2024, 5, 1504789. [Google Scholar] [CrossRef]
Figure 1. Regression line (solid), calculated 95% CI of the regression line (grey), and the line of equality (dashed) overlaid on a scatterplot of all matched trials (black dots).
Applsci 15 07768 g001
Figure 2. Bland–Altman styled plot with proportional bias ±95% CI (red), both upper (blue) and lower (yellow) 95% predictive intervals and tolerance limits, and estimated limits of variability for the Vertec (dashed lines) depicted. X-axis: average of jump heights using both the Jumpster and the Vertec; y-axis: difference in jump heights between both tools (Jumpster-Vertec); black dots: scatterplot of all matched trial data.
Applsci 15 07768 g002
Table 1. Summary data for all subjects.
All
Participants
MenWomenMen vs. Women
n362214
Age (years) 22.7 ± 6.424.0 ± 7.920.6 ± 1.0p = 0.06
Height (cm)172.7 ± 9.2178.1 ± 6.0164.3 ± 6.7p < 0.01
Weight (kg)81.4 ± 18.890.9 ± 16.366.4 ± 11.4p < 0.01
Max Vertec Jump Height (cm)51.5 ± 11.356.7 ± 9.143.4 ± 9.8p < 0.01
Max Jumpster Jump Height (cm)47.0 ± 16.549.3 ± 19.443.5 ± 10.0p = 0.25
Disclaimer/Publisher’s Note: The statements, opinions and data contained in all publications are solely those of the individual author(s) and contributor(s) and not of MDPI and/or the editor(s). MDPI and/or the editor(s) disclaim responsibility for any injury to people or property resulting from any ideas, methods, instructions or products referred to in the content.

